Abstract
To improve the accuracy of insulation state online monitoring for capacitive dry-type current transformers (CTs) and to address the limitations of traditional methods relying on potential transformer (PT) voltage signals and reference devices, a virtual voltage-based online monitoring method is proposed. First, the leakage current is collected through a core-type current transformer on the end-screen grounding line. Combined with group measurement data from surge arresters and dry-type CTs on the same busbar, phase constraints are established, and a least mean square (LMS) algorithm is utilized to iteratively train the virtual voltage reference phase. Subsequently, the resistive current and dielectric loss factor (tan δ) are calculated based on the virtual voltage reference phase to achieve online insulation state monitoring. Simulation results demonstrate that the proposed method can accurately obtain the virtual voltage reference phase and effectively identify the degradation trend of dry-type CTs. Field applications validate the feasibility of the method, with monitoring data fluctuations (±20 μA for the resistive current and ±0.002 for the dielectric loss) meeting engineering requirements. This method eliminates the need for PT signals and reference devices, thus providing a novel approach for the online insulation monitoring of dry-type CTs.
1. Introduction
As the core sensing device of power systems, the insulation state of dry-type current transformers (abbreviated as dry-type CTs) directly affects the reliability of relay protection operation and the accuracy [1,2,3,4,5] of energy metering. Although the Q/GDW1168–2013 regulation clearly stipulates that the dielectric loss factor (tan δ) of 110 kV or above should be tested regularly in dry-type CTs, the traditional offline testing method has significant drawbacks: Firstly, periodic power outage tests lead to [6] reduced power supply reliability, and statistics show that the economic loss caused by each planned power outage can reach hundreds of thousands of yuan. Secondly, it is difficult to capture sudden insulation deterioration in a three-year cycle. In the past five years, 82% of the 37 CT insulation breakdown incidents recorded in China occurred during the intervals of routine tests. More importantly, disassembly testing can cause damage to the terminal screen structure, which, in turn, increases the risk [7,8,9] of subsequent operation.
The insulation degradation mechanisms of dry-type CTs involve complex electro-thermal coupling effects. Studies have demonstrated that partial discharge-induced carbonization paths accelerate dielectric loss [10,11,12,13], while moisture ingress (a major cause of field failures) follows Fickian diffusion models with temperature-dependent coefficients. These processes exhibit nonlinear deterioration trajectories, making periodic offline tests inadequate for capturing incipient faults. Additionally, thermal stress from load fluctuations induces cumulative microcracking in epoxy composites [14,15], further justifying the need for continuous monitoring supported by intelligent data processing frameworks [16].
In recent years, various online insulation monitoring methods have been developed, primarily falling into two categories: direct measurement methods based on voltage–current phase comparison [17] and relative methods utilizing reference devices or baseline conditions [18,19,20]. Direct methods often employ PT signals to calculate the dielectric loss via a phase angle analysis. Although conceptually straightforward, they suffer from a poor anti-interference ability, dependence on high-precision sensors, and instability due to environmental drift. Conversely, relative methods bypass the use of PT signals by comparing monitored equipment with a presumed “healthy” reference device. However, field investigations have shown that reference device reliability is hard to guarantee due to internal aging or exposure to similar operational stress, which may lead to systemic misjudgments.
These limitations highlight the urgent need for a new approach that can eliminate the dependence on both PT signals and reference devices while still ensuring accurate and stable insulation state estimation. In this context, the present study proposes a virtual voltage-based online monitoring method that leverages synchronous group measurements and phase constraint modeling. This approach aims to address the existing shortcomings and offer a technically feasible and engineering-friendly solution for dry-type CT insulation assessment. In a 500 kV substation accident in 2019, simultaneous moisture exposure of the entire CT section caused the reference to fail.
In response to these technical bottlenecks, this paper proposes an online insulation monitoring method for dry-type CTs based on virtual voltage. The scientific novelty of this work lies in the elimination of both PT voltage signals and reference equipment through the use of a synchronous group measurement strategy and a phase constraint model. Furthermore, a new adaptive optimization approach based on the least mean square (LMS) algorithm is introduced to refine the virtual voltage phase, enabling accurate resistive current and dielectric loss computation. These innovations not only address key engineering limitations in current practices but also open a new direction for the scalable and non-intrusive monitoring of capacitive electrical equipment. Field validation demonstrates the feasibility and stability of this method under real-world substation conditions.
In comparison with existing online insulation monitoring methods, the proposed virtual voltage method offers several practical advantages. Traditional approaches, such as the relative dielectric loss method, typically require a reference device in stable condition, which may introduce uncertainty or additional maintenance burden. Other methods relying on the direct measurement of tan δ often depend on PT (potential transformer) voltage signals, which limits their applicability in systems without PT access. Additionally, AI-based fault recognition frameworks generally require labeled datasets or fixed models. In contrast, our approach does not require external references or PT signals, and, instead, it uses an LMS-based adaptive algorithm to dynamically estimate the virtual voltage phase. This makes the system more suitable for real-time insulation assessment and scalable deployment in digital substations.
2. Materials and Methods
2.1. The Overall Idea of the Online Monitoring Method
The proposed online monitoring method for dry-type CT insulation is based on the structural and electrical similarity between in-phase arresters and dry-type CTs located on the line side of a substation in Shaoguan, Guangdong, China. Since these devices are connected to the same busbar, the fundamental voltage phase of each device is assumed to be the same within each phase. Moreover, the voltage phases across the three phases follow the 120° ± 0.5° separation rule. It should be noted that the proposed method relies on the assumption that devices connected to the same busbar exhibit highly similar fundamental phase characteristics, which is generally valid under balanced and steady-state conditions. However, deviations may occur in practical situations due to unbalanced loads, transient switching operations, or incipient faults. In such cases, the accuracy of the phase constraint model could be affected. Therefore, the current method is recommended for use under normal system operating conditions. In future work, adaptive correction mechanisms and fault mode filtering strategies may be developed to extend the applicability of this approach to more complex operating scenarios. Based on these conditions, our method performs a synchronous group measurement of full current waveforms from all three-phase arresters and CTs. First, the factory or power-off dielectric loss data of the monitored dry-type CTs is used as a reference. Then, using the group current data, a set of phase constraint equations is constructed to preliminarily estimate the virtual voltage phase. This is followed by an adaptive iterative optimization using the LMS algorithm to refine the virtual voltage phase so that the calculated resistive current matches the reference. Finally, using the optimal virtual voltage phase, the dielectric loss and resistive current of each device are computed in real time. Figure 1 provides a detailed schematic of this process, illustrating how the group measurement, phase modeling, LMS iteration, and parameter extraction are linked in a closed-loop workflow.
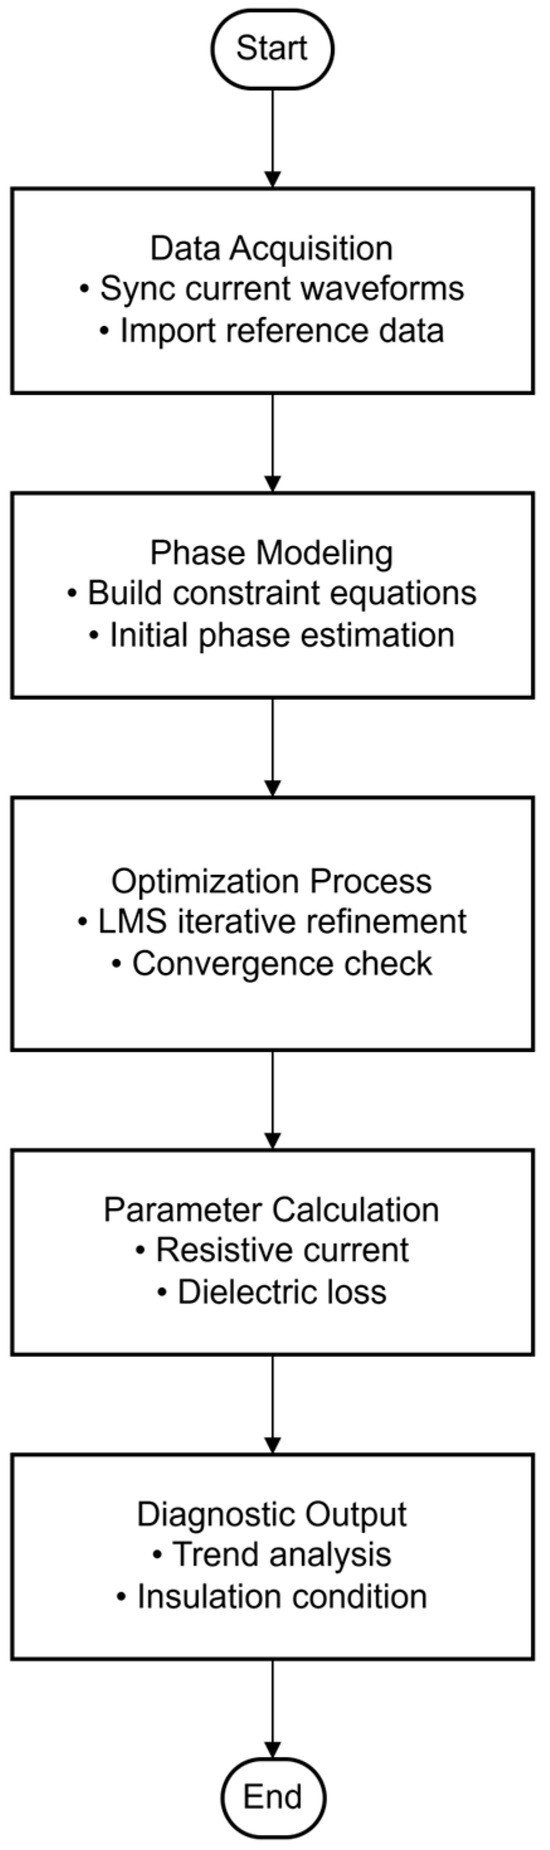
Figure 1.
Overall flowchart of online monitoring method.
2.2. Virtual Voltage Solution
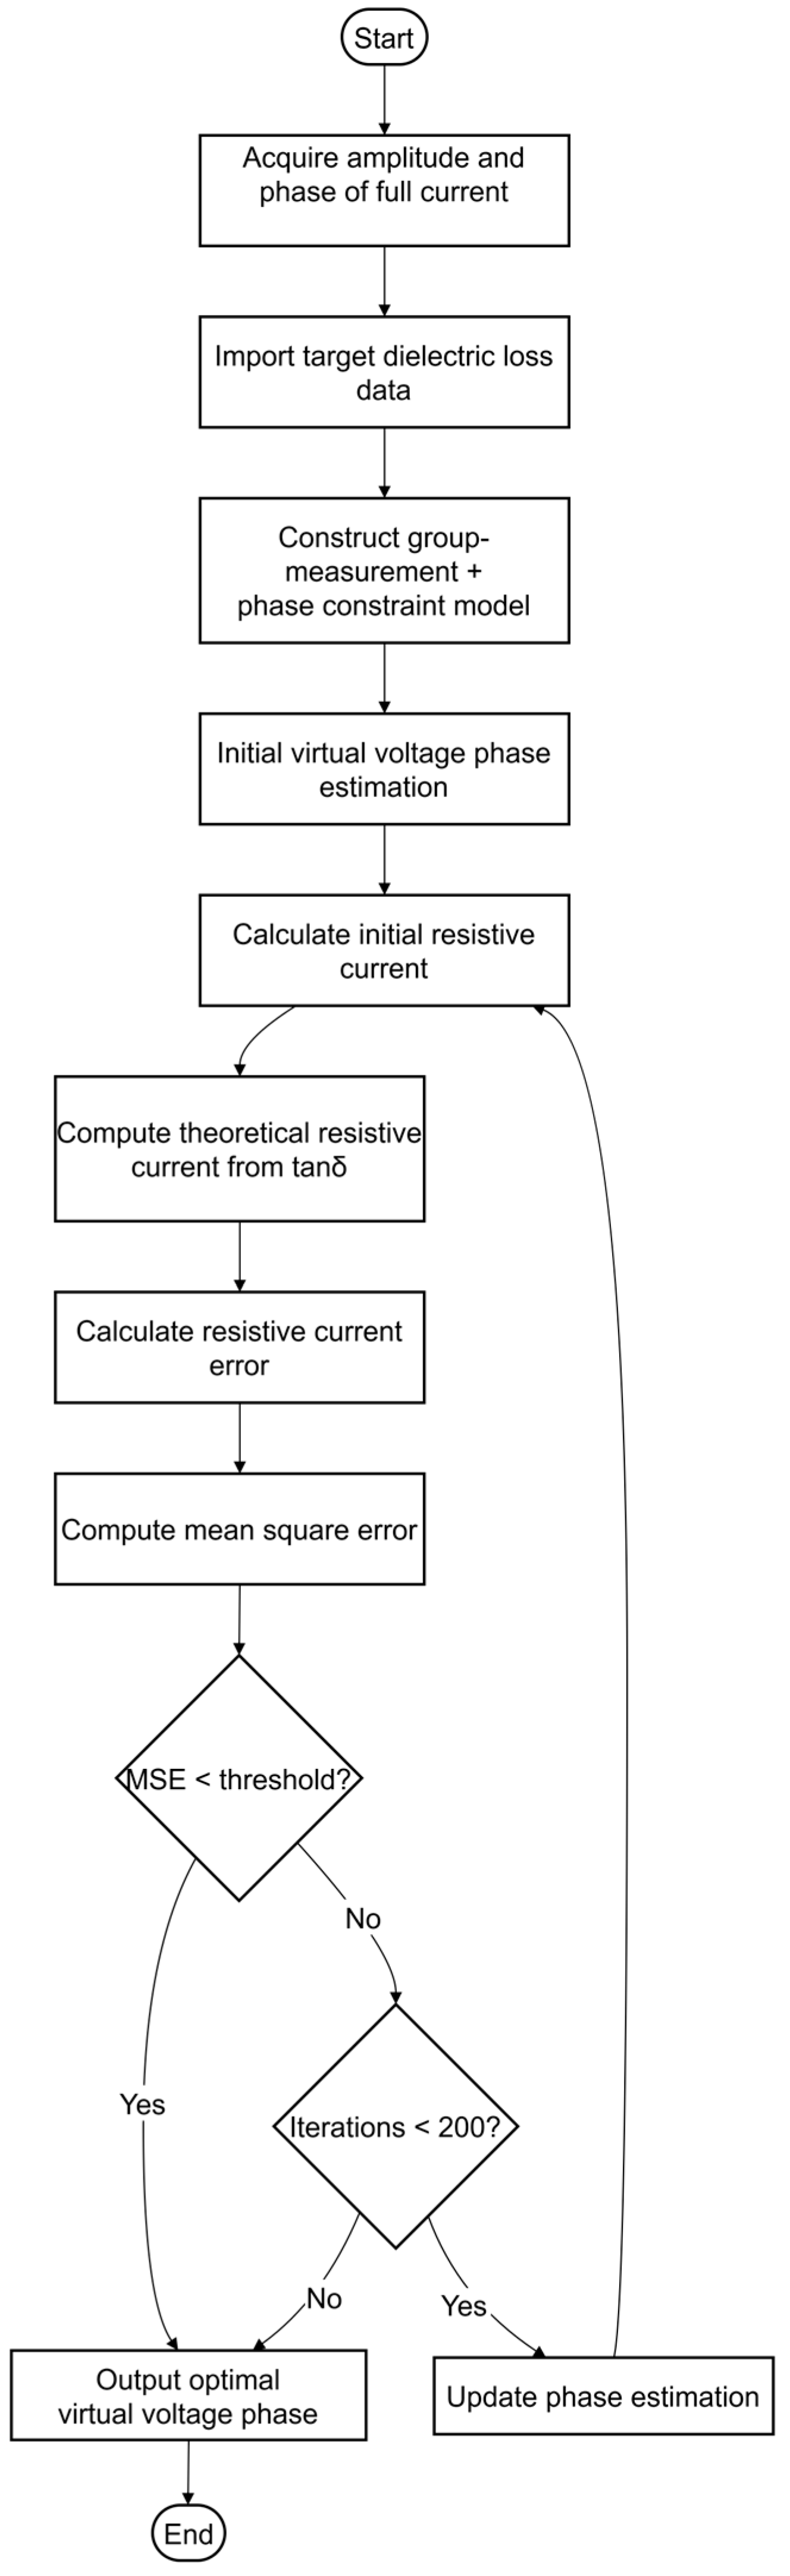
Based on feasible and effective prerequisite conditions, using the fundamental amplitude and phase values of the three-phase arrester and dry-type CT full current obtained through synchronous group measurement, as well as employing the dielectric loss , factory data, or power-off test data of the monitored equipment as the target quantities, first, the “group measurement–phase constraint” theoretical model is adopted to construct a phase constraint equation set, and the virtual voltage reference phase is preliminarily solved; then, the least mean square algorithm (LMS) is used for iterative training to obtain the optimal virtual voltage reference phase , as shown in Figure 2.

Figure 2.
Flowchart of virtual voltage search.
2.2.1. Phase Constraint Relationship Modeling
The modeling of the phase constraint relationship and the preliminary solution of the virtual voltage reference phase involve the following 3 steps:
Step 1: Through measurements using arresters and dry-type CT groups, obtain the amplitudes and phases of the fundamental wave of the full current of the three-phase arresters, as well as the amplitudes and phases of the fundamental wave of the full current of the three-phase dry-type CTs. Here, M represents the arresters, C represents the dry-type CTs, and phases. No further elaboration is provided below.
Step 2: Call upon the dielectric loss , factory data, or power-off test data of the monitored equipment, and, based on the complementary relationship between the dielectric loss angle and the phase of the fundamental wave current and the virtual voltage phase , calculate .
Step 3: Utilizing the measured quantities from step 1, assign initial values to the phase difference between the fundamental current of the measurement and the virtual voltage. Adopt the “group measurement–phase constraint” theoretical model to construct the phase constraint equation set (1), and preliminarily solve the virtual voltage reference phase .
where:
- , Measured quantities (the fundamental current phase of the arrester/dry-type CT for phase P).
- ,: Initial estimates (converted from the dielectric loss angle / via 90° − δ).
- ,: Intermediate quantities (the initial virtual voltage phase estimates derived from the arrester/dry-type CT).
- : Target quantity (the common virtual voltage reference phase for phase P, solved via phase constraints).
2.2.2. LMS Iterative Algorithm
The optimal virtual voltage reference phase is obtained through iterative training using the LMS algorithm, and the process is divided into the following 4 steps:
Step 1: By using the amplitudes of the fundamental wave of the three-phase arrester and the dry-type CT full current, as well as the phase difference between the fundamental current of the measured quantity and the virtual voltage, the resistive current of the measured quantity can be calculated.
where:
- ,: Measured quantities (the fundamental current amplitudes of the arrester (M) and dry-type CT (C) for phase P).
- ,: Intermediate quantities (the initial resistive currents derived from the measured amplitudes and initial phase differences).
Step 2: By using the phase difference between the fundamental current phase and the virtual voltage phase calculated based on the dielectric loss angle of the monitored equipment, the resistive current of the target quantity is calculated.
where:
- , : Target quantities (the theoretical phase differences derived directly from the dielectric loss angles /).
- , : Target quantities (the theoretical resistive currents calculated using /).
Step 3: By using the resistive current of the measured quantity and the resistive current of the target quantity, the resistive current error between the measured quantity and the target quantity is calculated.
where:
- , : Intermediate quantities (the deviations between the initial and theoretical resistive currents for phase P).
Step 4: The mean square error of the resistive current of the lightning arrester and the dry-type CT is calculated.
where, is the average value of , and is the average value of .
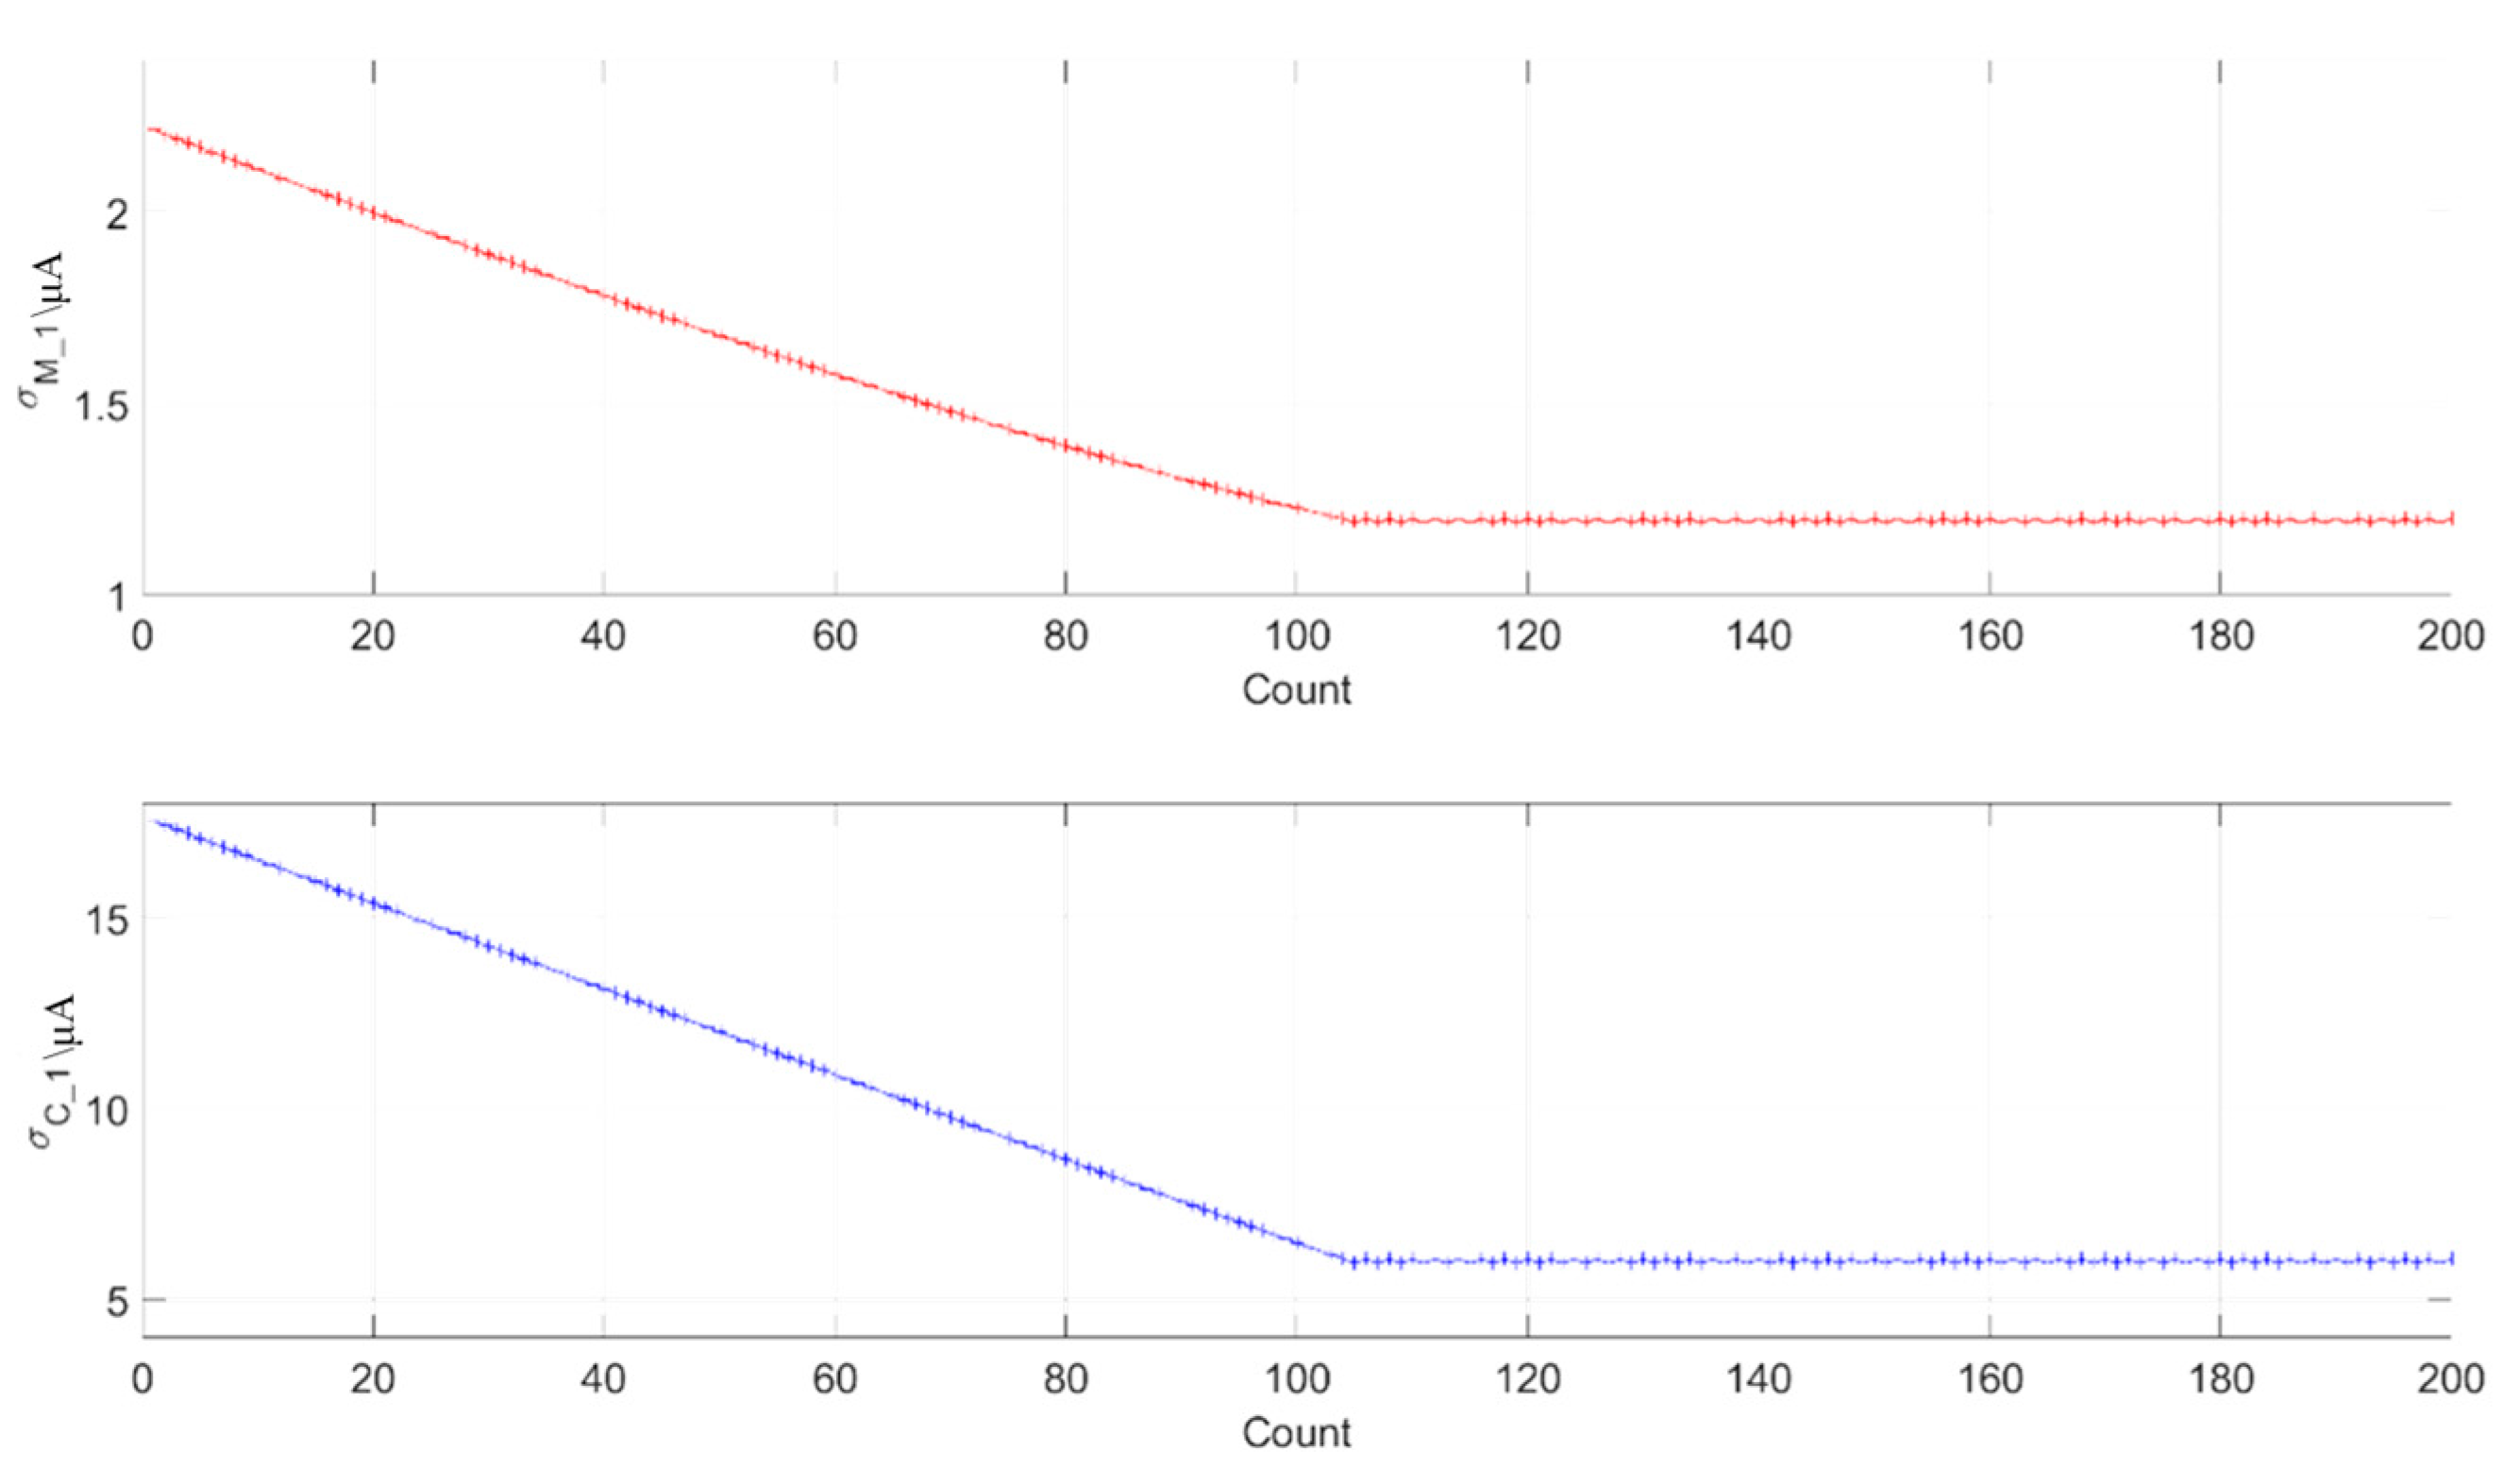
It is determined whether the mean square error meets the threshold and requirements for the resistive current error of the arrester and the dry-type CT. The threshold values of σ_MT1 = 5 μA and σ_CT1 = 15 μA are determined based on long-term field monitoring data collected from more than 50 in-service dry-type CTs and arresters under normal operating conditions. These values reflect the typical amplitude range of resistive current fluctuations observed in stable insulation states. Specifically, for arresters, the resistive current variations rarely exceed ±5 μA; for dry-type CTs, the fluctuation range remains within ±15 μA. These thresholds serve as convergence criteria in the LMS iteration to distinguish meaningful deviations from inherent system noise. While suitable for the voltage class and equipment type discussed in this paper, these parameters can be adapted in future applications depending on the equipment insulation class, service environment, and measurement precision. If they do not meet the requirements, then the phase difference between the fundamental current of the measured quantity and the virtual voltage can be adjusted through iterative training until the mean square error threshold and requirements are met. If convergence is not met after 200 iterations (a conservative limit chosen based on a convergence analysis of over 95% of field cases), then the calculation can be stopped, and the optimal solution for the virtual voltage reference phase can be obtained. This upper limit prevents excessive computation under noisy or unstable conditions and ensures that the LMS optimization remains efficient and practical in embedded hardware implementations. If not converged, the current optimal solution is output as . The optimal virtual voltage reference phase is denoted as .
2.3. Calculation of Insulation Online Monitoring Parameters
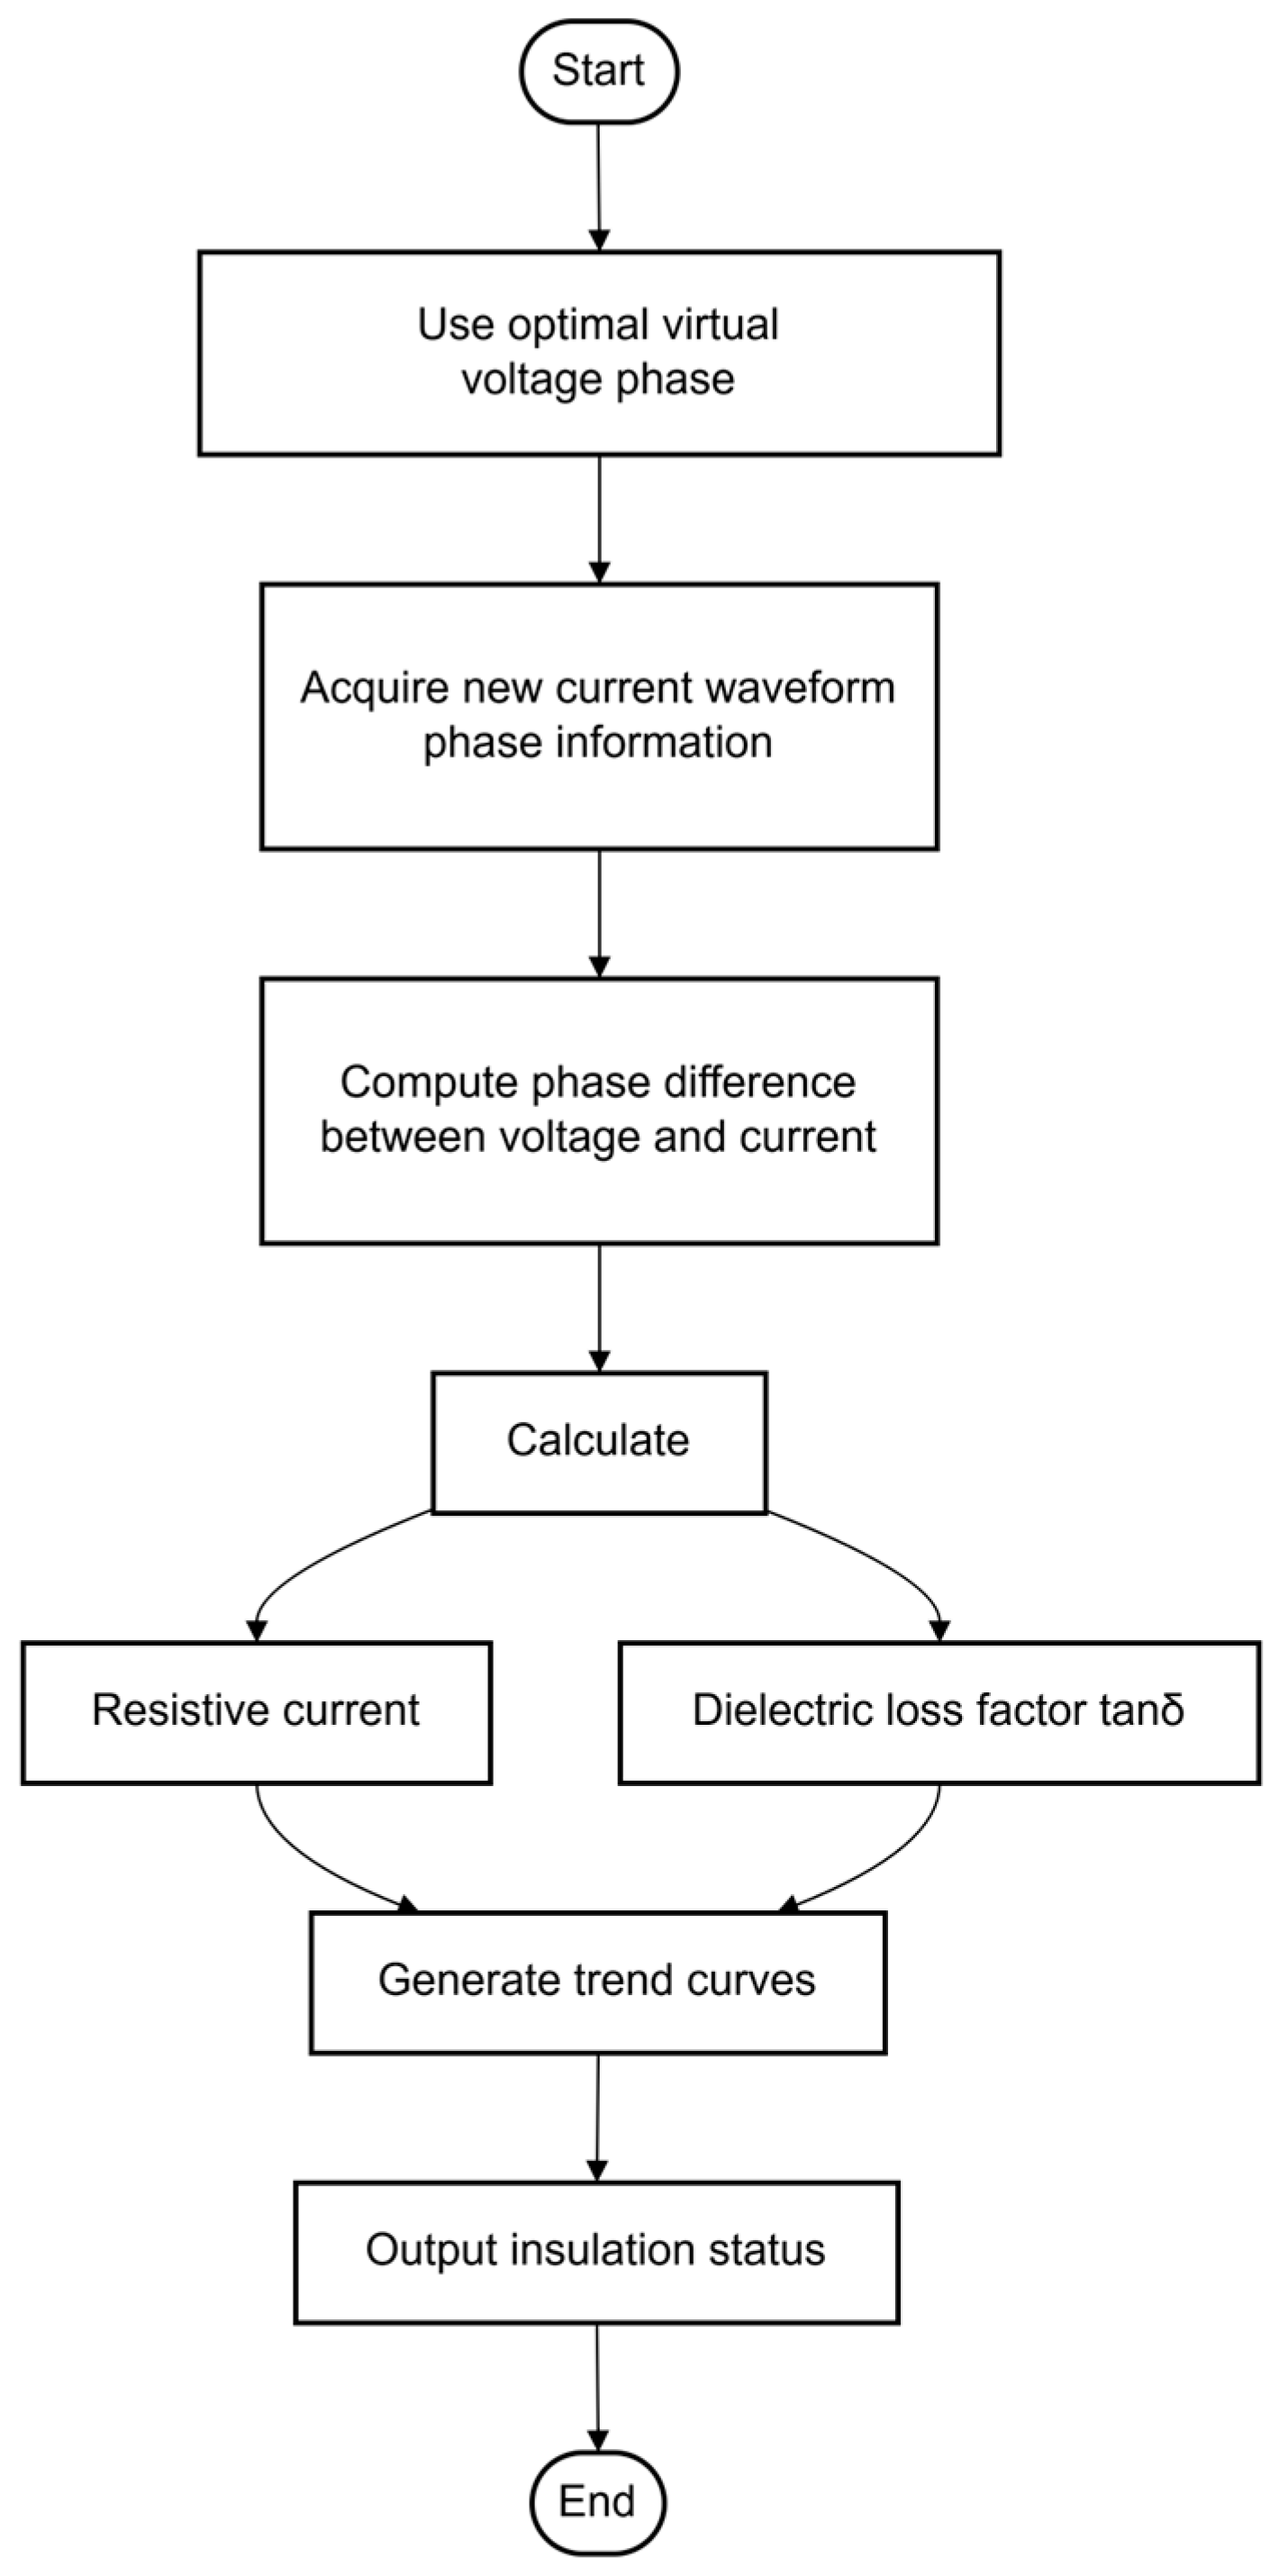
Using the optimal virtual voltage reference phase obtained in stage 1, the phase difference sequence between the full current fundamental component and the voltage fundamental component of the full current fundamental component sequence obtained from the subsequent group measurement is calculated. The resistive current and dielectric loss sequences of the arrester and dry-type CT are output, and trend curves are generated, thereby reflecting the changes in the insulation status of the arrester and dry-type CT. The calculation process of the online insulation monitoring parameters is shown in Figure 3, and it is divided into the following 3 steps:

Figure 3.
Flowchart of calculation of resistive current and dielectric loss based on virtual voltage phase.
- (1)
- The optimal three-phase virtual voltage reference phase is obtained in the first stage of the operation.
- (2)
- Utilizing the optimal three-phase virtual voltage reference phase and the phase information , of the full current fundamental wave of the three-phase arrester and dry-type CT obtained from subsequent group measurements, the phase difference sequence , between the full current fundamental wave and the voltage fundamental wave is calculated in real time.
- (3)
- By using the amplitudes , of the fundamental wave of the three-phase arrester and dry-type CT full current obtained through group measurement, as well as the phase difference sequences of the fundamental wave of the full current and voltage for the measured quantities calculated in real time, the sequences of the resistive current and dielectric loss of the three-phase arrester and dry-type CT are output.
3. Results
3.1. Verification of the Accuracy of Online Monitoring Methods
To verify the accuracy of the proposed online monitoring method, a dataset was collected from a 220 kV substation in southern China, comprising three-phase full current amplitude and phase measurements from line-side surge arresters and dry-type current transformers (CTs) on the same busbar. Group synchronous measurements were performed using custom-developed current monitoring terminals (as described in Section 4.1), with data acquisition triggered automatically at regular intervals under steady-state load conditions. Table 1 presents the amplitude (in μA) and phase angle (in degrees) of the fundamental components of the measured currents. In addition, the reference dielectric loss values were obtained from factory acceptance test reports or from periodic offline tests conducted under power-off conditions. All monitored devices were of the same model, rated at a 220 kV insulation level, and they were installed in the same interval to ensure phase coherence and measurement comparability. This dataset provided a reliable foundation for phase constraint modeling and LMS-based optimization in the subsequent analysis.

Table 1.
Full current fundamental wave amplitude and phase of three-phase surge arresters and dry-type CTs.
Using the dielectric loss data, the fundamental phase differences of 85° and 89° between the full current and voltage of the three-phase arrester and dry-type CT were calculated. By adopting the “group measurement–phase constraint” theoretical model, a phase constraint equation system was constructed, and the three-phase virtual voltage reference phases were preliminarily solved as 163.63°, 43.33°, and 283.28°.
Further utilizing the LMS algorithm, the phase difference and between the fundamental current of the measured quantity and the virtual voltage was adjusted, and the mean square error and of the three-phase resistive current errors of the lightning arrester and dry-type CT was calculated. Considering that the online monitoring data allows for a certain fluctuation, based on engineering experience, the mean square error thresholds of = 5 μA and = 5 μA were set, and, after 200 iterations of training, the convergence of the mean square error was obtained, as shown in Figure 4. After the iterative training was completed, the optimal virtual voltage reference phase corresponding to the phase difference and between the fundamental current of the measured quantity and the virtual voltage was obtained, as shown in Table 2.
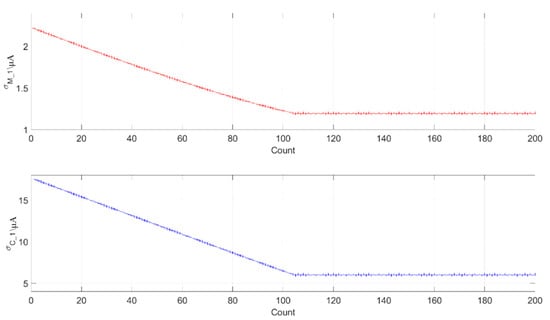
Figure 4.
Mean square error convergence curves of surge arresters and dry-type CTs.
Table 2.
The optimal solution of the virtual voltage reference phase.
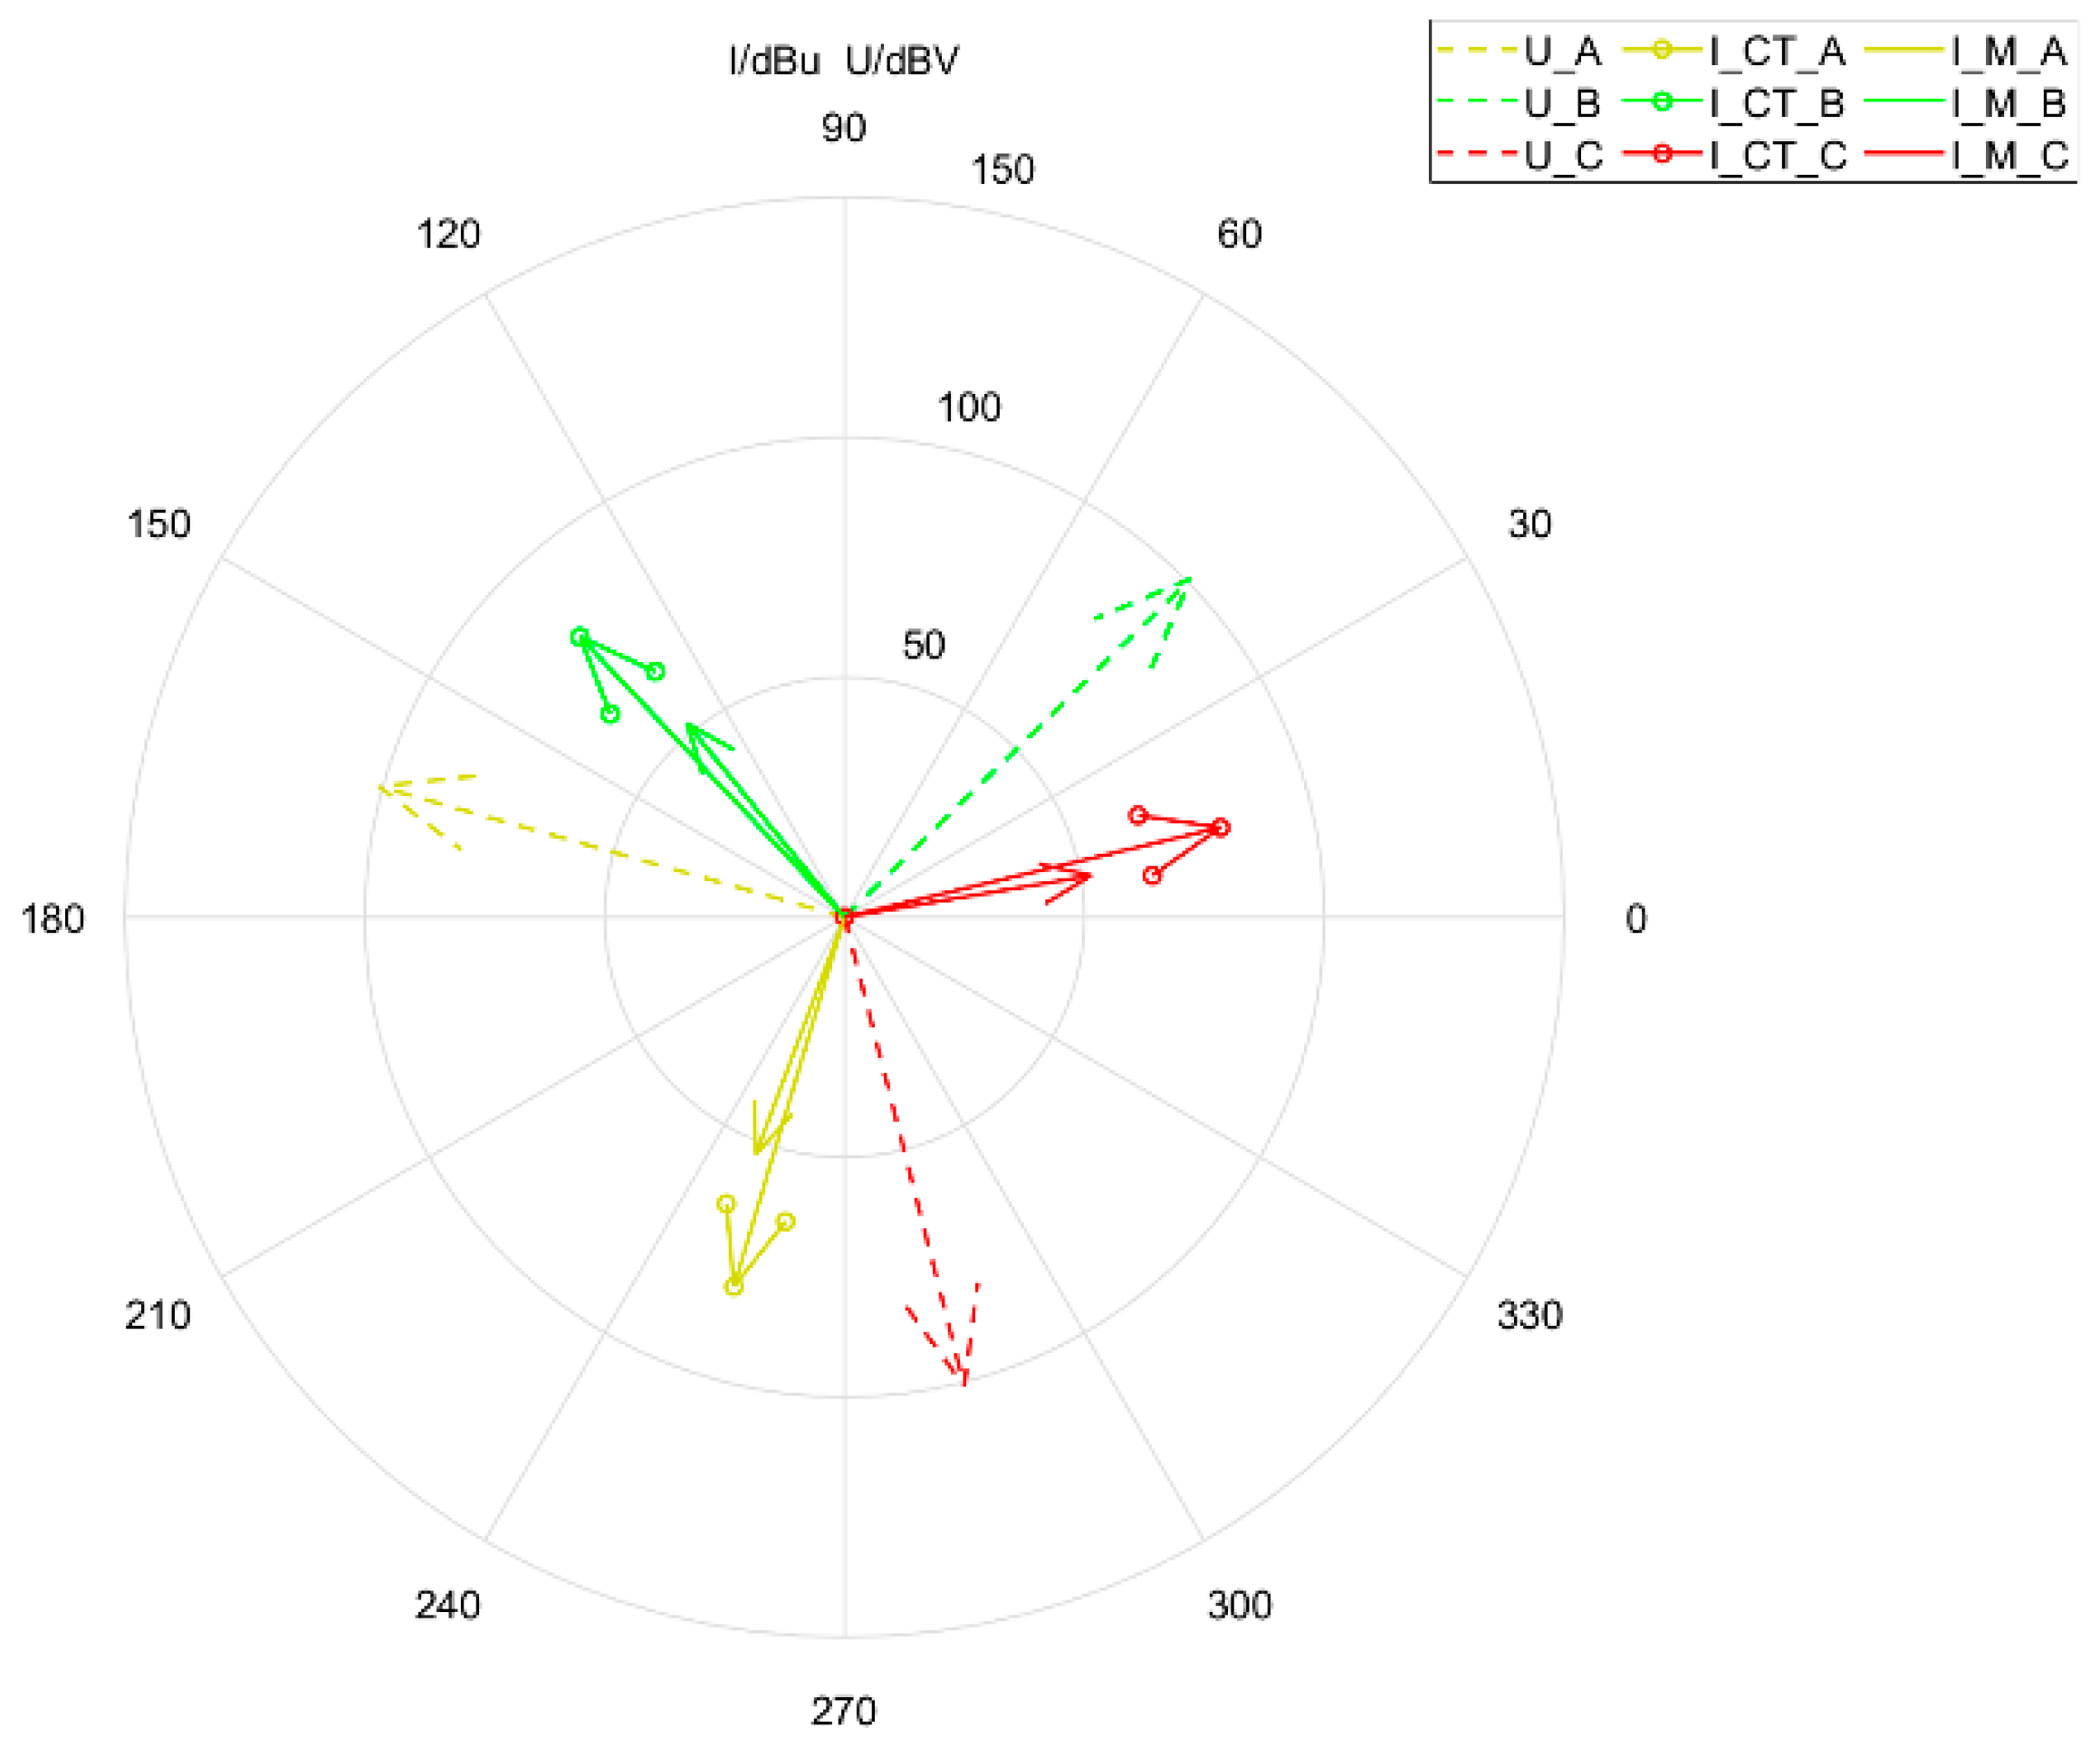
Based on the calculated optimal virtual voltage reference phase and the measured fundamental amplitudes and phases of the three-phase surge arresters and dry-type CT currents, the voltage–current phasor diagram shown in Figure 5 was obtained. In the figure, it can be seen that the optimal three-phase virtual voltage reference phase obtained is consistent with the virtual voltage reference phases of the same-phase surge arresters and dry-type CTs. The phase difference between the voltage fundamental phases among the three phases is 120° ± 0.5°, and it is approximately 85°and 89°different from the current fundamental phases of the surge arresters and dry-type CTs, respectively.
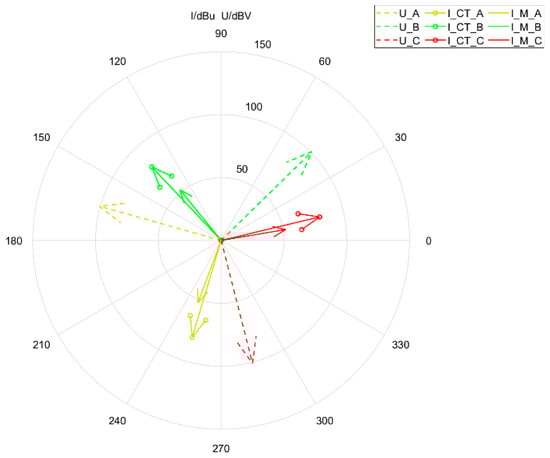
Figure 5.
Voltage and current phasor diagram.
Based on the phase difference and between the full current fundamental wave and the voltage fundamental wave corresponding to the optimal virtual voltage reference phase, the resistive current and dielectric loss of the measured quantity are calculated, as shown in Table 3.
Table 3.
Key parameter comparison of resistive current and dielectric loss.
By comparing the monitoring data obtained based on the virtual voltage with the factory data, the following was found:
The maximum absolute error of the resistive current of the lightning arrester on this line is 2.254 μA; the maximum absolute error of the resistive current of the dry-type CT is 14.548 μA.
The maximum absolute error of the lightning arrester on this line is 0.005; the maximum absolute error of the dry-type CT is 0.001.
Based on the above error analysis, the consistency between the measured data of the resistive current and dielectric loss and the factory data was verified, indicating the accuracy of the proposed online monitoring method in finding the virtual voltage phase.
3.2. Verification of Equipment Deterioration Identification Effectiveness
For the ideal situation where all three lightning arrester phases and the dry-type CT function normally, Section 2.1 presents the entire process for finding the optimal virtual voltage reference phase. To verify whether the virtual voltage can detect lightning arrester or dry-type CT deterioration after some operational time, a simulation is conducted using six devices experiencing gradual individual insulation deterioration over time. Specifically, the table below shows the simulation results of insulation deterioration development in a phase A CT, where its resistive current and dielectric loss gradually increase. By using the optimal virtual voltage reference phase, the resistive current and dielectric loss are calculated in real time to observe their changing trends.
In Table 4 and Table 5, the following can be seen: when using the optimal virtual voltage phase, the calculated resistive current and dielectric loss fluctuations of phases A, B, and C for the lightning arresters do not exceed 2.14%, while the resistive current and dielectric loss fluctuations of the phase B and C CTs do not exceed 4.35%; however, the resistive current and dielectric loss fluctuations of the phase A CT reach 124%.
Table 4.
Resistive current calculation based on virtual voltage phase.
Table 5.
Dielectric loss calculation based on virtual voltage phase.
The analysis results show that using the optimal virtual voltage reference phase accurately identifies phase A CT (CT_A) deterioration while detecting phase B and C CTs (CT_B and CT_C) and three-phase arresters (M_A, M_B, and M_C) as normal. Similarly, the sought virtual voltage reference phase can also detect single-phase arrester deterioration after a certain operational time. Moreover, for cases involving two-phase or multi-phase deterioration in similar equipment, the next plan uses different equipment-type virtual voltage reference phases on the same bus to calculate the resistive current and dielectric loss. For example, when two-phase arresters deteriorate (or when dry-type CTs degrade), using the corresponding virtual voltage reference phase—found using the base wave data of three coherent CTs (or the three-phase base wave data of arresters)—expands the virtual voltage method’s application scope.
4. Discussion
4.1. Design of Online Monitoring System
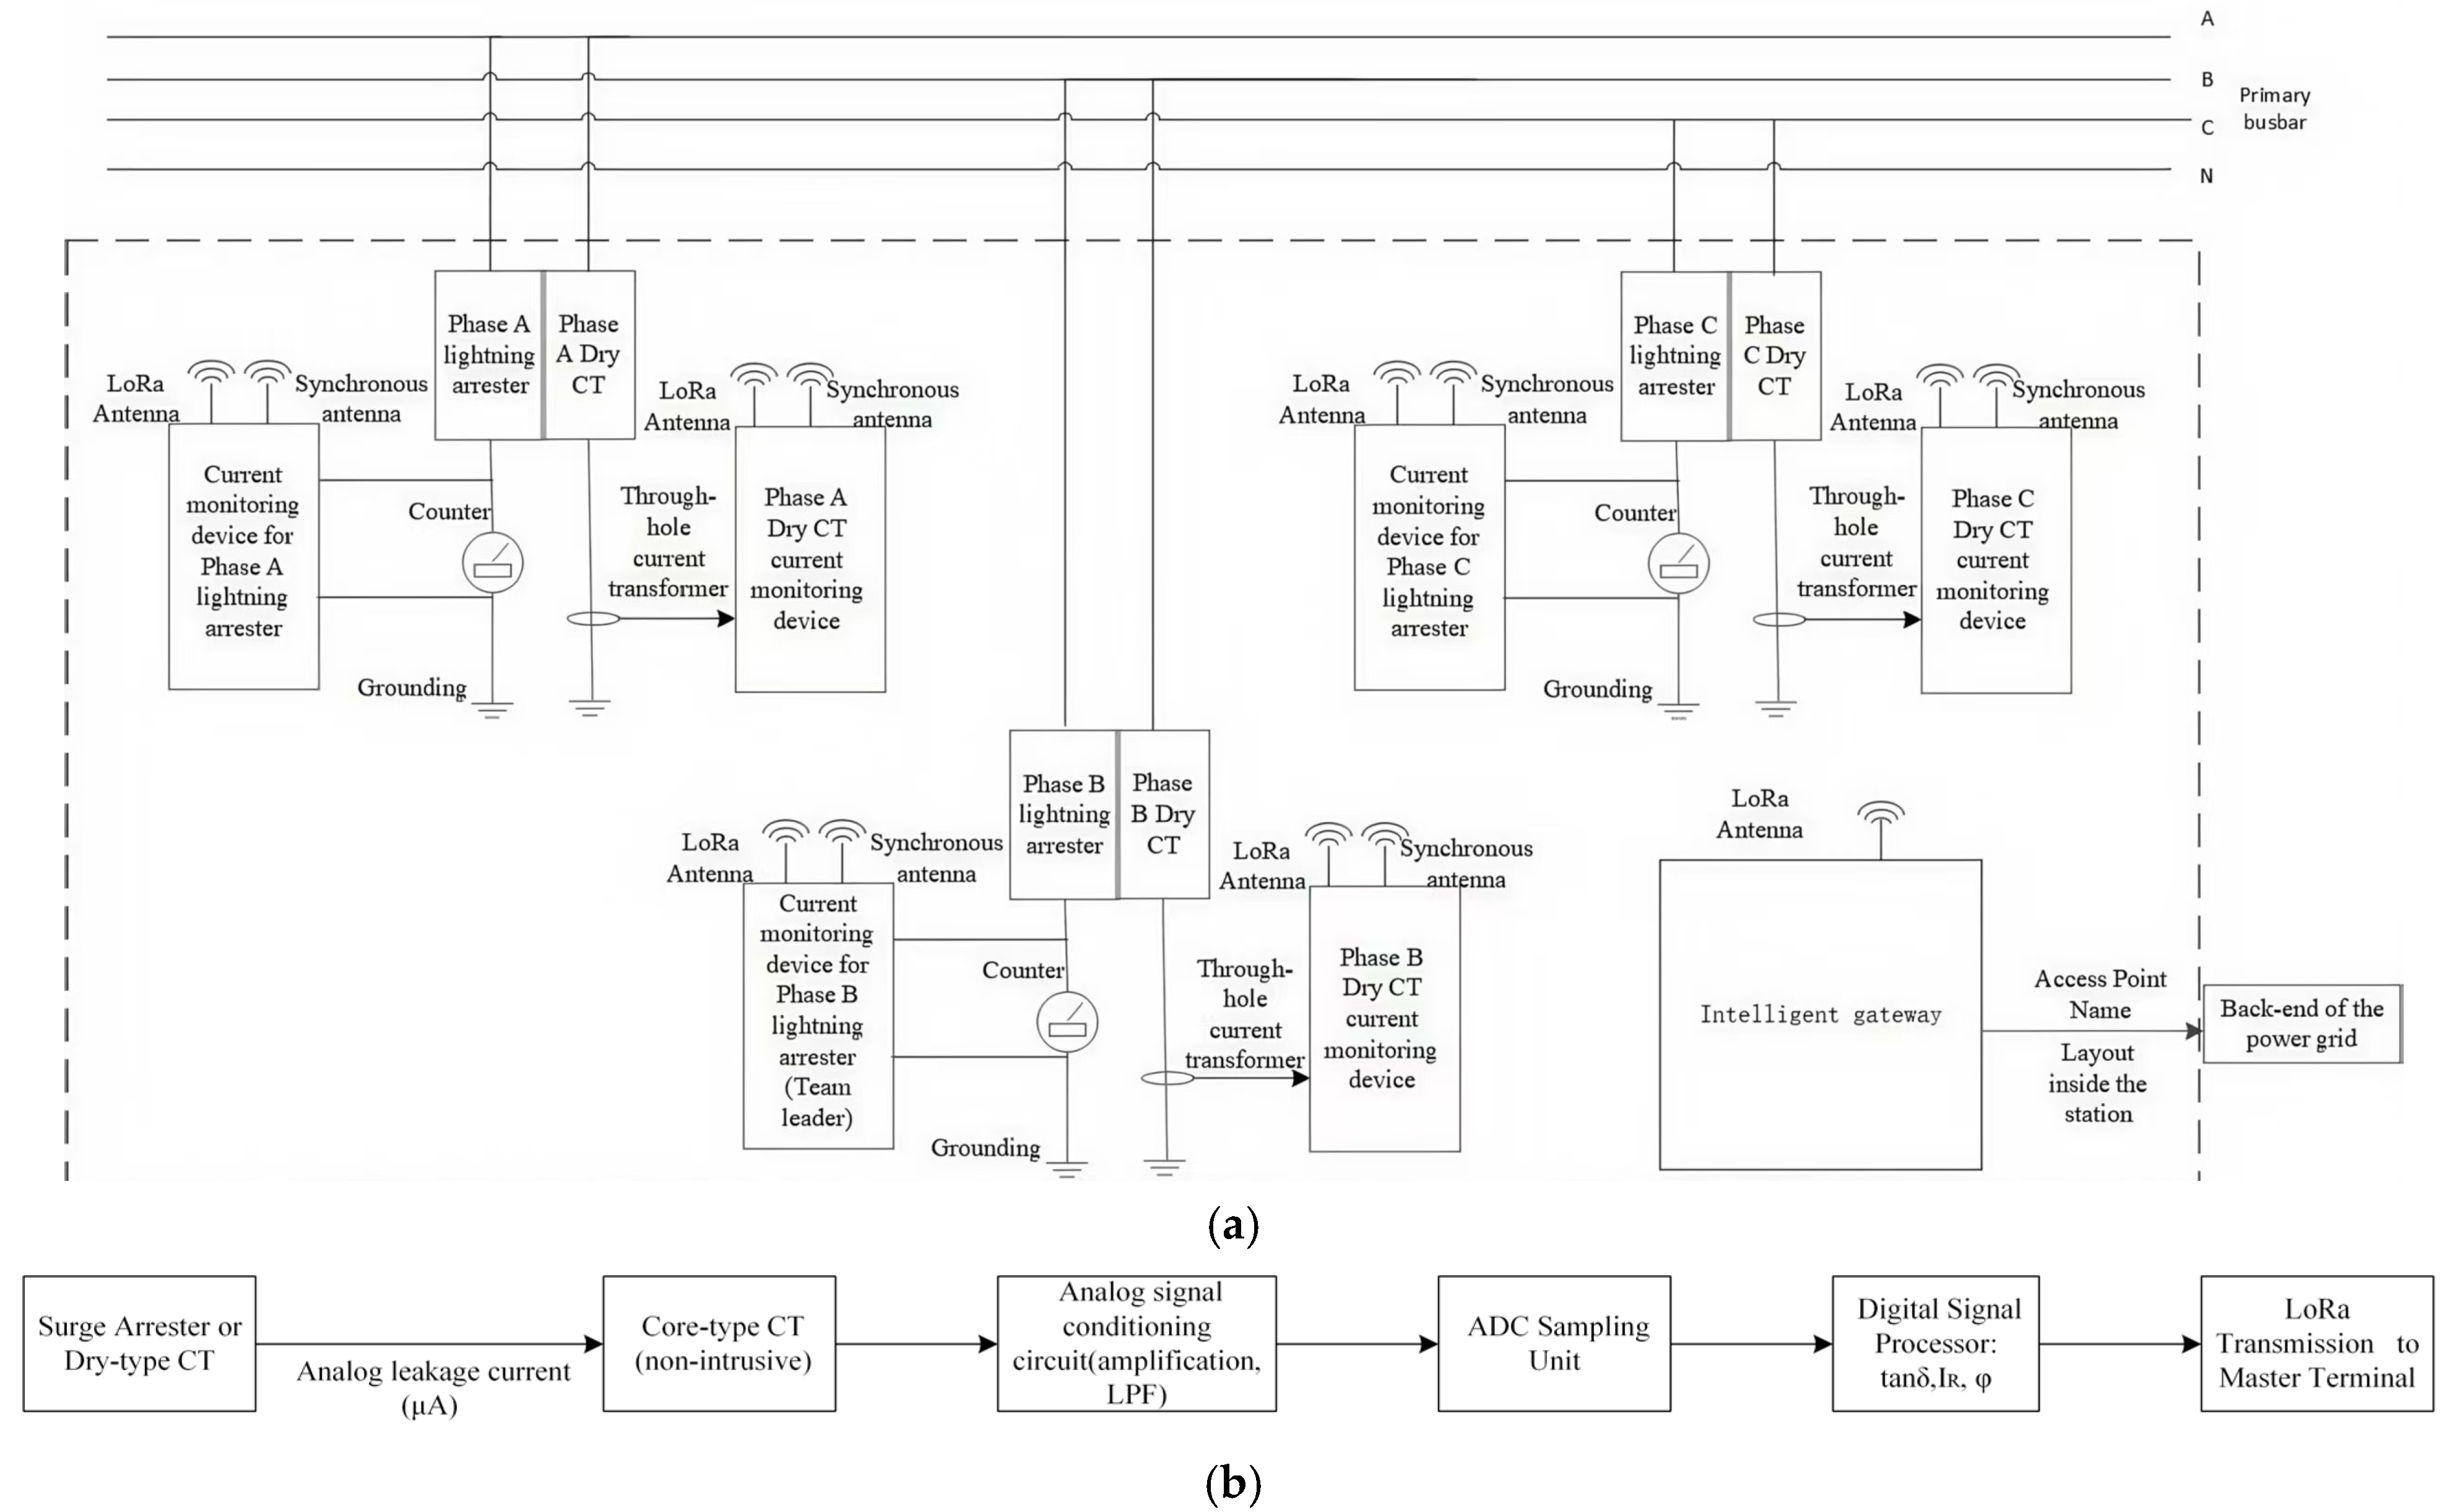
To achieve the group measurement proposed in the online monitoring method, a lightning arrester and a dry-type CT resistive current monitoring terminal are developed. The lightning arrester resistive current monitoring terminal is directly connected in parallel between the two ends of the mechanical lightning strike counter, and the grounding wire of the dry-type CT secondary terminal passes through the core-type current transformer inside the resistive current monitoring terminal.
The design of the online monitoring system is shown in Figure 6. The current monitoring terminal of phase B arresters is taken as the leader. The current collection time interval is set to automatically wake up and trigger the other five terminals to conduct synchronous measurements. The monitoring terminal is powered reliably through a combination of a 12 V/5 W photovoltaic panel and an 8.4 V/6 Ah lithium battery. When there is no measurement task, it enters a sleep state to reduce system power consumption.
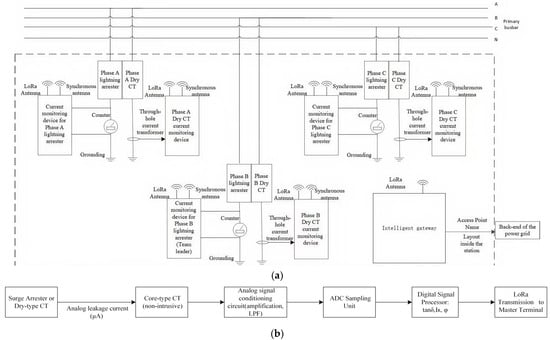
Figure 6.
Schematic design of online monitoring system: (a) architecture of the online insulation monitoring terminal; (b) signal acquisition and processing flow for insulation monitoring.
The data collected by the monitoring terminal is uniformly transmitted back to the team leader via LoRa wireless communication, and then the team leader uploads the data uniformly to the intelligent gateway [21]. The intelligent gateway centrally manages and analyzes the data reported by the monitoring terminal, or it forwards the collected data according to the preset forwarding rules through the APN private network to the power grid back-end, thereby achieving the online monitoring of the insulation status of lightning arresters and dry-type CTs.
4.2. Initial Application of the Online Monitoring System
From July 2024 to February 2025, after installation and commissioning in a certain 220 kV substation of the Shaoguan Bureau, the on-site application of the lightning arrester and dry-type CT online monitoring system was carried out. The online monitoring situation is shown in Figure 7 and Figure 8.
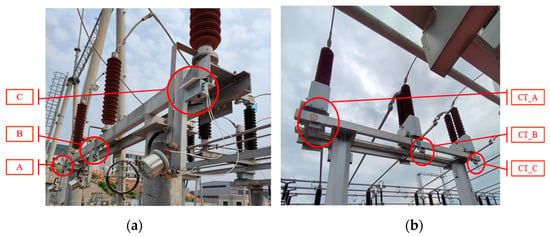
Figure 7.
Installation of online monitoring terminals in a certain substation in Shaoguan Power Supply Bureau: (a) lightning arrester current monitoring terminal; (b) dry-type CT current monitoring terminal.
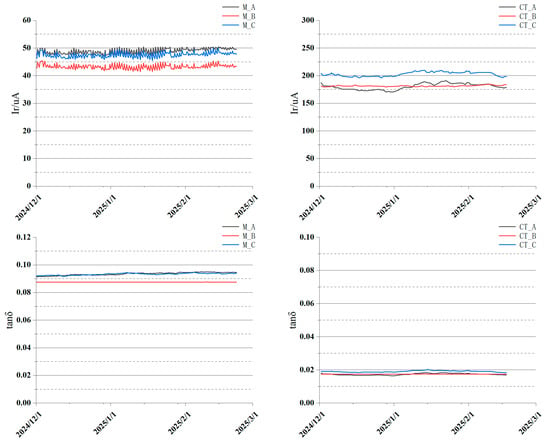
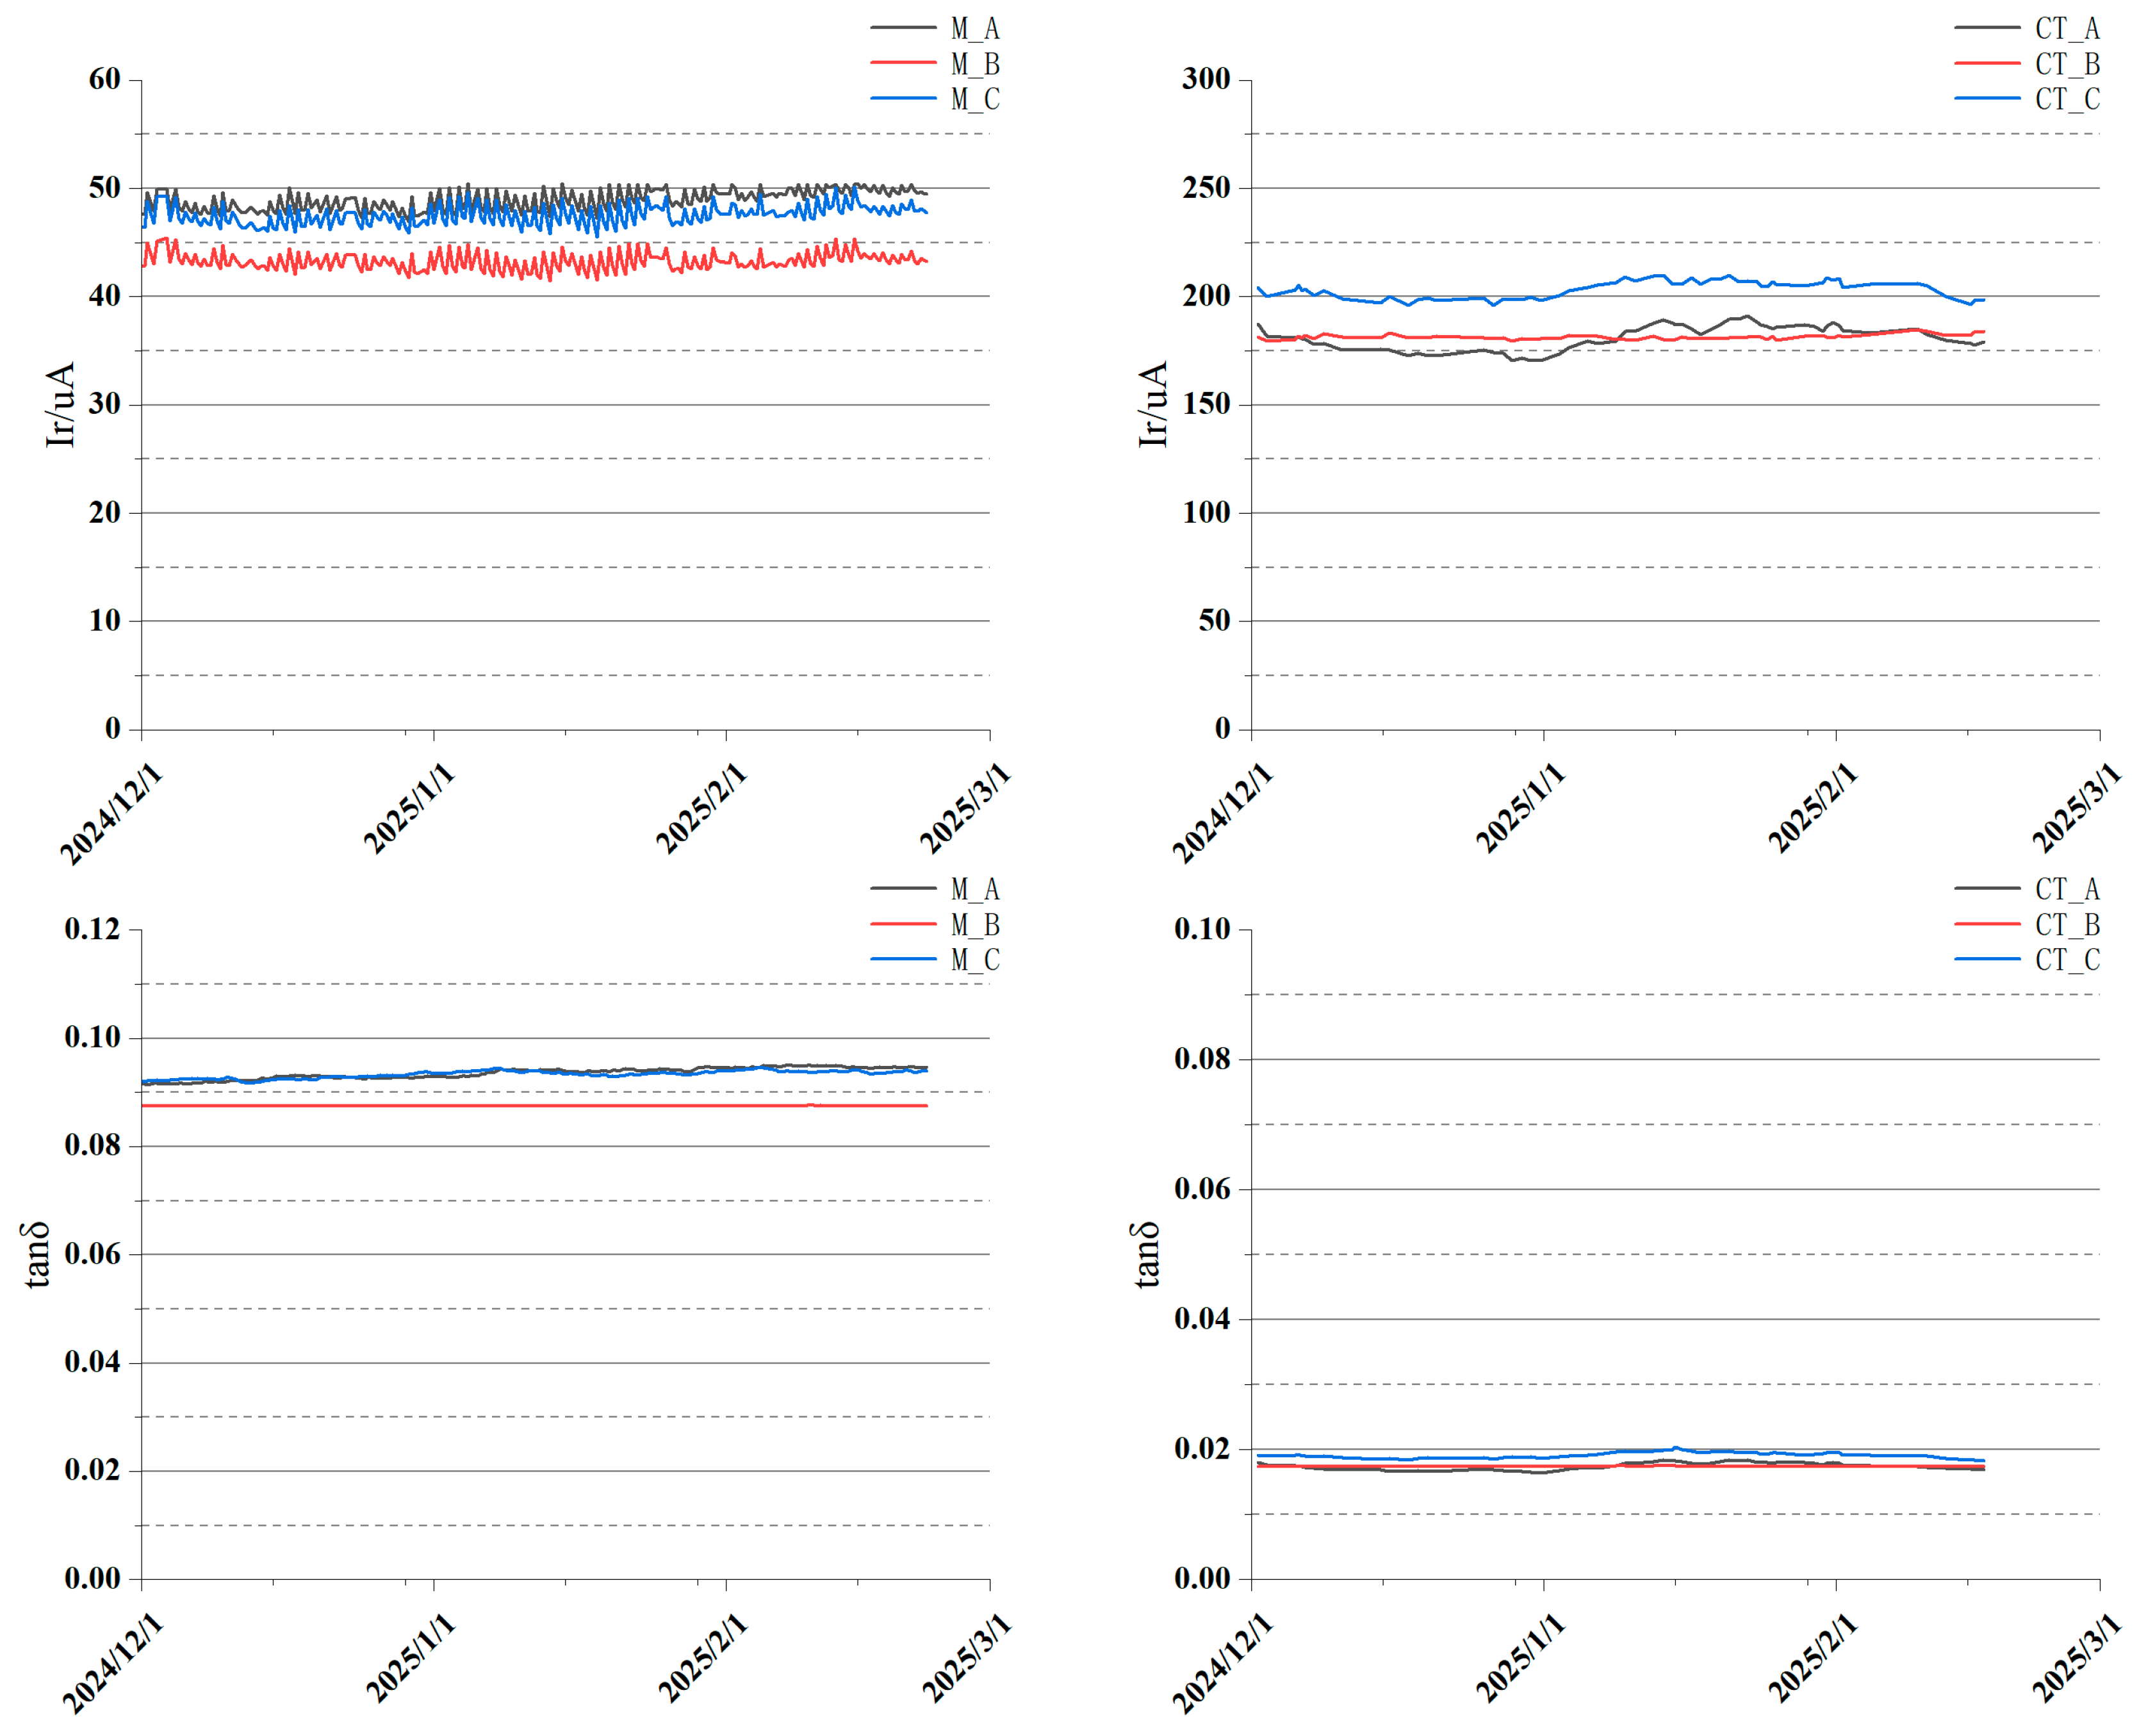
Figure 8.
Online monitoring data of lightning arrester and dry-type CTs in a certain substation in Shaoguan Power Supply Bureau (2024.12–2025.2).
Based on the monitoring data of lightning arresters and dry-type CTs in a certain substation over the past three months, the following can be observed:
- (1)
- The insulation monitoring system based on the virtual voltage method can achieve the online monitoring of the resistive current and dielectric loss data of three-phase arresters and dry-type CTs.
- (2)
- The resistive current of phase A, B, and C lightning arresters is approximately 40–50 μA, with a fluctuation range of ±5 μA; the dielectric loss value is around 0.09, with a fluctuation range of ±0.004. The curve changes smoothly, and no deterioration phenomenon is observed.
- (3)
- The resistive current of phases A, B, and C in the three-phase CT is approximately 170~210 μA, with a fluctuation range of about ±20 μA; the dielectric loss value is around 0.018, with a fluctuation range of ±0.002. The curve changes smoothly, and no deterioration phenomenon is observed.
The data analysis demonstrates that the proposed online monitoring system based on the virtual voltage method can effectively track variations in the resistive current and dielectric loss of dry-type current transformers. Beyond technical feasibility, the system showed clear engineering value during field deployment at a 110 kV substation in Shaoguan. In a three-month monitoring cycle (December 2024–February 2025), a 124% rise in the resistive current was detected in one CT phase, while the other two phases remained within normal ranges. This prompted the operator to postpone scheduled insulation inspections for the stable phases and prioritize targeted offline testing only for the deteriorated unit. As a result, unnecessary maintenance was avoided, and substation labor scheduling was optimized.
Compared with conventional methods requiring voltage transformers and manual reference selection, this system eliminates the dependence on external voltage sources and subjective judgment. It also supports real-time, multi-point group monitoring and trend analysis without interrupting equipment operation, thereby offering a cost-effective and scalable solution for the condition-based maintenance of high-voltage capacitive equipment.
Although the field validation in this study was conducted at a single 220 kV substation, the proposed virtual voltage method has potential scalability across other voltage levels (e.g., 110 kV and 500 kV) and substation configurations. The core algorithm is not dependent on specific device models, and the phase constraint modeling principle is equally applicable to systems with varying busbar topologies, provided that synchronous current measurement is feasible. The LMS-based adaptation mechanism also allows the method to tolerate moderate load variations and signal noise. In future work, we aim to collaborate with multiple grid companies to evaluate the method under different network conditions, including nonlinear and fluctuating loads, to further assess its generalizability.
5. Conclusions
This paper proposes an online insulation monitoring method for dry-type current transformers based on virtual voltage. By applying synchronous group measurements and phase constraint modeling, the proposed method successfully eliminates the need for PT voltage signals and reference equipment. Through iterative LMS optimization, the virtual voltage reference phase is refined, enabling an accurate estimation of key insulation parameters. Numerical validation results show that the maximum absolute error of the resistive current is 2.254 μA for surge arresters and 14.548 μA for dry-type CTs, while the dielectric loss error is controlled within ±0.005 and ±0.001, respectively. In deterioration identification scenarios, the method achieves 124% fluctuation detection for abnormal CT phases, with other devices remaining stable, demonstrating its high sensitivity and selectivity. This study contributes a practical and scalable approach to online insulation monitoring in high-voltage substations.
In subsequent research, we will focus on multi-agent systems (MASs) for the collaborative monitoring of multiple devices [22], as well as the integration of multi-agent deep reinforcement learning (MADRL) algorithms to dynamically decouple patrolling tasks [23]. This integration is expected to enhance the intelligence level of the monitoring system, improve fault classification accuracy by 14.36–17% (validated in 3D object detection [24]), and optimize early-warning capabilities through latency-aware perception frameworks (e.g., SyncNet’s 15.6% delay robustness gain [25]).
Author Contributions
Conceptualization, Y.P., J.Z., C.D. and R.Z.; methodology, J.Z. and Z.L.; software, Y.P., J.Z. and L.Y.; validation, X.H., C.D. and L.Y.; resources, X.H. and C.D.; data curation, Z.L. and R.Z.; investigation, X.H.; project administration, Z.L.; writing—original draft preparation, R.Z.; writing—review and editing, L.Y.; supervision, Y.P. All authors have read and agreed to the published version of the manuscript.
Funding
This research was funded by Guangdong Power Grid Limited Liability Company Science and Technology Program, grant number GDKIXM20230693. And The APC was funded by Guangdong Power Grid Limited Liability Company Science and Technology Program.
Data Availability Statement
The original contributions presented in this study are included in the article. Further inquiries can be directed to the corresponding author.
Acknowledgments
The research work of this thesis was funded and supported by the project “110 kV dry CT non-stop state assessment research” (Project No.: GDKJXM20230693), which provided a solid guarantee for the smooth progress of the research, and we would like to express our heartfelt thanks to the funding program. All individuals included in this section have consented to the acknowledgment.
Conflicts of Interest
Authors Junjie Zhang and Yu Peng were employed by the company Shaoguan Power Supply Bureau, Guangdong Power Grid Co., Ltd. Authors Xiaohui Hu, Zhipeng Li and Li Yan were employed by the company Wuhan Kangda Electric Co., Ltd. The remaining authors declare that the research was conducted in the absence of any commercial or financial relationships that could be construed as a potential conflict of interest.
References
- Wang, N. Research on the Influence of Environmental Factors and Data Processing Analysis Method for Online Monitoring of 110kV Capacitor-Type Equipment tanδ; Xiamen Institute of Technology: Xiamen, China, 2015. [Google Scholar]
- Tao, J.; Fu, Z.; Xia, X.; Xiong, L.; Fang, S. Research on Fault Localization Technology of Overhead Transmission Line. Hubei Electr. Power 2020, 44, 48–52. [Google Scholar]
- Qian, J. Research and Application of Online Monitoring System for Substation Capacitive Equipment; Jiangsu University: Zhenjiang, China, 2021. [Google Scholar]
- Li, Q.; Jiang, Y.; Zhao, X.; Zhang, S.; Chen, Z.; Wang, L.; Wang, Y. Simulation Analysis of Thermal Collapse of Gapless Metal Oxide Surge Arresters Induced by Continuous Lightning Strikes. Electr. Porcelain Surge Arrester. 2022, 5, 73–78. [Google Scholar]
- Cheng, D.; Huang, X.; Zhu, Y.; Li, X.; Guo, J.; Zhang, H. Design and Application of Online Monitoring System for Substation Capacitive Type Equipment. Guangdong Electr. Power 2016, 29, 55–61. [Google Scholar]
- Q/GDW1168-2013; Test Specification for Condition Maintenance of Power Transmission and Transformation Equipment. Purpose-Led Publishing: Bristol, UK, 2013.
- Chen, H. Preventive Test Methods and Diagnostic Techniques for Power Equipment; China Water Resources and Hydropower Press: Beijing, China, 2009. [Google Scholar]
- Chen, T.-X. Electrical Testing; China Electric Power Press: Beijing, China, 1998. [Google Scholar]
- Cui, M. Online Monitoring of Capacitive Type Equipment in Intelligent Substation; Zhengzhou University: Zhengzhou, China, 2017. [Google Scholar]
- Wang, Z.P.; Ye, L.; Liu, Y.K. Electro-thermal damage of carbon fiber/epoxy composite laminate. J. Reinf. Plast. Compos. 2018, 37, 147–157. [Google Scholar] [CrossRef]
- Kudo, N.; Fujita, R.; Oya, Y.; Sakai, T.; Nagano, H.; Koyanagi, J. Identification of invisible fatigue damage of thermosetting epoxy resin by non-destructive thermal measurement using entropy generation. Adv. Compos. Mater. 2023, 33, 233–249. [Google Scholar] [CrossRef]
- Tomas, A.; Frémont, H.; Malbert, N.; Neffati, M.; Lambert, B. Moisture absorption and desorption in epoxy mould compounds: Characterization of Fickian and non-Fickian behaviours in complex packages. Microelectron. Reliab. 2023, 149, 115088. [Google Scholar] [CrossRef]
- Anicode, S.V.K.; Madenci, E. Three-dimensional moisture diffusion simulation with time dependent saturated concentration in ANSYS through native thermal and spring elements. Microelectron. Reliab. 2021, 123, 114167. [Google Scholar] [CrossRef]
- Gu, J.; Bai, Y.; Zhao, Z.Q.; Zhang, C. Temperature and strain rate sensitivity of modulus and yield strength of epoxy resin under compressive loads. Polymer 2024, 297, 126744. [Google Scholar] [CrossRef]
- Vaggar, G.B.; Kamate, S.C.; Nadaf, S.L.; Badyankal, P.V. Study on thermal conductivity and thermogravimetric analysis of glass fibre epoxy resin composites modified with silicon carbide and copper nanoparticles. In Advances in Manufacturing Technology and Management; Singari, R.M., Jain, P.K., Kumar, H., Eds.; Lecture Notes in Mechanical Engineering; Springer: Singapore, 2023; pp. 49–59. [Google Scholar]
- Ito, Y.; Minakuchi, S.; Mizutani, T.; Takeda, N. Cure monitoring of carbon-epoxy composites by optical fiber-based distributed strain-temperature sensing system. Adv. Compos. Mater. 2012, 21, 237–249. [Google Scholar] [CrossRef]
- Deng, J. Research on Online Monitoring of Dielectric Loss Value of 220kV Dry Current Transformer in Traction Substation of High-Speed Railroad. Power Syst. Prot. Control 2016, 44, 125–129. [Google Scholar]
- Xu, W.; Zhang, S.; Wang, Y. Application of In-Phase Comparative Method for Strip Test in the Field. Guangdong Electr. Power 2008, 21, 29–34. [Google Scholar]
- Liu, G.; Zhang, X. Dielectric Loss In-Phase Comparison Method for Strip Testing of Capacitive Devices. Electr. Supply 2011, 28, 69–73. [Google Scholar]
- Liu, C. Research on Online Monitoring Technology of Substation Capacitive Equipment Based on Relative Dielectric Loss. Electrotechnology 2021, 14, 132–133. [Google Scholar]
- Zhao, X.; Zhu, H. Research on Safety Control Technology of the Whole Process of Maintenance Operation Based on IoT Perception. Hubei Electr. Power 2023, 47, 126–132. [Google Scholar]
- Liu, Z.; Yan, W.; Zhang, S. Research on cooperative output regulation problem of multi-agent systems with time-varying delay under dynamic topology. J. Northwestern Polytech. Univ. 2019, 37, 479–487. [Google Scholar] [CrossRef]
- Liu, W.; Cheng, X.; Li, H.Y. Optimized architecture for cooperative multi-agent reinforcement learning. Comput. Syst. Appl. 2024, 33, 79–89. [Google Scholar]
- Zhang, J.; Fang, Y.; Li, C.; Zhu, W. Formation tracking via iterative learning control for multi-agent systems with diverse communication time-delays. Math. Probl. Eng. 2019, 2019, 8164297. [Google Scholar] [CrossRef]
- Lei, Z.; Ren, S.; Hu, Y.; Zhang, W.; Chen, S. Latency-aware collaborative perception. In Computer Vision—ECCV 2022; Avidan, S., Brostow, G., Cissé, M., Farinella, G.M., Hassner, T., Eds.; Lecture Notes in Computer Science; Springer: Cham, Switzerland, 2022; Volume 13692, pp. 658–675. [Google Scholar]


Disclaimer/Publisher’s Note: The statements, opinions and data contained in all publications are solely those of the individual author(s) and contributor(s) and not of MDPI and/or the editor(s). MDPI and/or the editor(s) disclaim responsibility for any injury to people or property resulting from any ideas, methods, instructions or products referred to in the content. |
© 2025 by the authors. Licensee MDPI, Basel, Switzerland. This article is an open access article distributed under the terms and conditions of the Creative Commons Attribution (CC BY) license (https://creativecommons.org/licenses/by/4.0/).