Abstract
Concentrating photovoltaic-thermal (CPVT) collectors use reflective surfaces to focus sunlight onto a smaller receiver area, increasing thermal energy output while maintaining annual energy efficiency. Ray-tracing simulations are employed in this study using Tonatiuh to optimise the characteristics of the Double MaReCo (DM) collector, which is an improved version of the commercially available Solarus Power Collector (PC). Focused on enhancing electrical performance, the photovoltaic (PV) cell configurations are varied on the bottom side of the receiver, while the top-side PV cells remain constant. The study also analyses the influence of diodes and transparent gables on the annual solar irradiance received by the PV cells. From the analysis, it is observed that the specific annual irradiance received by the PV cells in the DM collector with transparent gables is nearly 64% more compared to that of the PC counterpart. It is also observed that the transparency of gables becomes significant only when the whole area of the receiver is covered by PV cells. With the goal of improving performance while lowering the cost and complexity of the DM collector, the study investigates various collector design characteristics that may shed more light on optimising the current model.
1. Introduction
Transitions in science and technology often follow society’s main priorities, which influence how problems are seen and how solutions are developed. Prioritising economic growth over sustainability, the long-standing energy paradigm that was intensively driven by fossil fuels, focused on high-carbon energy generation. The industrial and technological advancements of the 19th and 20th centuries influenced this paradigm, which ultimately led to severe resource depletion and environmental damage [1]. Nevertheless, the validity of this concept was called into question as anomalies like resource constraints, climate change, and rising greenhouse gas emissions became more noticeable. In response to these anomalies, research on renewable energy gathered momentum, indicating the start of a paradigm shift toward efficiency and sustainability. This change has mostly focused on renewable energy generation, by technologies such as solar thermal (ST) and photovoltaic (PV)—not forgetting to mention other sources like wind and hydro power generation—which provide clean and renewable energy. However, although solar thermal systems capture heat for a variety of uses and standalone photovoltaic systems effectively convert sunlight into electricity, both have drawbacks. PV systems suffer from efficiency losses due to excess heat, while ST systems lack electricity generation capabilities [2]. These limitations led researchers to develop hybrid photovoltaic-thermal (PVT) systems that combine the strengths of both PV and ST technologies to maximise energy efficiency.
In PVT systems, the simultaneous cooling of the PV module enhances the electrical conversion efficiency of the system [3]. Furthermore, these systems also generate considerably higher specific energy yield (kWh/m2), resulting in high de-carbonisation potential, due to their combined heat and power generation capability [2]. Owing to these advantages, a great deal of research has focused on the techno-economic aspects of PVT technology, thereby providing it the potential to emerge as one of the cornerstones for sustainable energy generation [4,5,6]. Nevertheless, this cutting-edge research has assisted in taking PVT research from the laboratory to the market, and now we have several companies offering PVT collectors for residential and industrial applications as well. However, most of the commercially available PVT collectors today are flat-plate collectors, particularly focused on the low-temperature sector (below 80 °C) [7].
Reports suggest two important reasons for this scenario. On one side, the decrease in PV cell yield with increase in operational temperature [8]; and on the other, PVT collectors cannot have the absorption area fully covered with a selective surface, which leads to poor thermal performance at higher temperatures. These drawbacks can be effectively mitigated by introducing concentration in PVT collectors. Concentrating photovoltaic-thermal (CPVT) collectors use concentrating reflective surfaces to concentrate a large area of insolation onto a small area to generate higher thermal energy output [3]. Moreover, concentration enables these solar collectors to minimise the receiver area while preserving the annual energy output [9]. Minimising the receiver area helps to increase annual energy yield by reducing heat loss while also lowering material costs for selective surfaces and solar cells. However, in stationary concentrating collectors, a smaller receiver area can result in higher incidence angle modifier (IAM) and reflection losses [9].
One of the fundamental characteristics of any concentrating collector is the concentration ratio (), defined based on the aperture area () and the receiver area () as in Equation (1), reproduced from Duffie and Beckman [10].
Based on the concentration, CPVT systems can be classified as low-, medium-, or high-concentration ratio collectors. These systems can remain stationary or be combined with tracking mechanisms to increase efficiency [11]. By combining electrical and thermal functions into a single system, CPVT technology effectively optimises solar resource utilisation while reducing the amount of space required for solar energy generation [12].
To date, there have been several investigations on CPVT collectors. Yang et al. [13] performed experiments using a CPVT with a theoretical concentration ratio of 8, and observed an overall efficiency of about 57–60%, for the various cases considered. The authors created and deployed a CPVT prototype with a two-dimensional solar tracking system to improve solar energy collection. The results indicated that the CPVT system attained high thermoelectric efficiency, up to 60%, with an average of 57.3%, demonstrating its efficiency in optimal weather. In a study by Saini et al. [14], comprehensive numerical simulations were performed to assess the thermal and electrical energy output of CPVT solar collectors on an hourly basis throughout the year. By taking into account all potential meteorological scenarios specific to the region of New Delhi (India), the study aimed to optimise both the number of solar collectors and the mass flow rate within the system in order to enhance its efficiency. Sharaf and Orhan [15] performed a thermodynamic analysis of densely packed concentrating collectors. Using an algorithm to couple the optical simulation output with thermodynamic models, the authors carried out an energy, exergy, and economic analysis of the considered CPVTs.
In a broader study by Youssef et al. [16], a two-dimensional numerical model was created to assess the energy and economic performances of a CPVT system under two distinct weather conditions: Tunisia and Chambéry. The study focused on the dependence of thermal and electrical output on factors like the operating temperature, wind speed, and fluid inlet temperature for both climates. In another study based on the weather conditions, Alves et al. [17] conducted an in-depth examination of the impact of various climate zones on the efficiency of a CPVT collector by assessing its energy performance across two distinct locales: Sweden and Portugal. The researchers constructed an extensive three-dimensional finite element multiphysics model to explore the performance dynamics of a CPVT system, integrating a thermal-fluid coupling approach. This study evaluated how different flow rates of the coolant fluid affect the CPVT system’s efficiency, revealing that increased fluid flow rates significantly enhance the cooling process, thereby boosting photovoltaic power output as well as thermal energy capture.
Cabral and Karlsson [18] conducted a comprehensive evaluation of the electrical and thermal performance of four symmetric CPVT collectors, each equipped with a vertically oriented bifacial receiver, for applications in low-latitude regions. Using ray-tracing simulations, the findings from this study demonstrated that the CPVT configurations were superior in delivering enhanced electrical and thermal output over the course of a year. In a recent study, Cabral et al. [19] performed experimental studies on a CPVT with a wedge PVT receiver. By developing a full-size collector, the authors examined the thermal and electrical characteristics and concluded that the model, by virtue of its design, could reduce the peak electrical power at normal incidence. This could reduce the thermal stresses on PV cells at high intensity irradiance to improve the performance and lifespan of PV cells. These studies widely acknowledge the advantages of CPVT collectors; however, CPVT systems face several challenges, particularly those related to partial shading due to non-uniform illumination and cost. Previous studies by Decker and Jahn [20] and Bunthof et al. [21] have identified partial shading as a significant factor in reducing the energy output of photovoltaic arrays. To address this, bypass diodes are commonly used, allowing the system to operate at a reduced capacity. These diodes redirect electrical current through an alternate path, allowing for continued energy production with only a minor reduction in overall power output [22]. However, the integration of diodes with the PV array increases the system’s complexity.
An example of a typical CPVT collector available in the market, named the Solarus Power Collector (PC), is presented to the left of Figure 1. The design philosophy for this collector is based on the Maximum Reflector Concentration (MaReCo), first introduced by Adsten et al. [23]. This is an asymmetric, non-tracking type of collector designed to perform effectively in higher altitudes. Several studies have already been carried out to investigate the performance of this collector model. Recently, Gomes [24] analysed the structural integrity and efficiency of new receiver designs in CPVT collectors under high stagnation temperatures. The study examined changes in cell size, silicone encapsulant, soldering method, strain relief, and cell spacing. Prototypes using transparent, more elastic silicone with strain relief had notably fewer microcracks and reduced power loss. It was also observed that none of the receivers lost more than 30% of their initial power; however, larger cells and pre-existing microcracks were especially susceptible to thermal stresses. In another study, Nasseriyan et al. [25] conducted a combined experimental and numerical investigation on the Solarus PC. This research assessed the thermal and electrical performance of the CPVT optimised for domestic hot water use. The study found that tilt angle, heat transfer fluid (HTF), insulation, and receiver design had significant impacts on performance, with tilt angle most strongly influencing thermal output. More specifically, HTF recirculation boosted electrical yield by 25%, while insulation enhanced thermal yield by up to 3%. These reports underscore the significance of Solarus PC for various applications; however, with the steady decrease in PV cost and solar thermal technology gaining a competitive edge these days, particularly in low-latitude applications, it is pertinent that suitable changes are made to the PC design to make it cost-effective with performance enhancement to compete in the future market. Thus, performance improvement and cost reduction are vital tasks to maintain the market readiness of this CPVT.
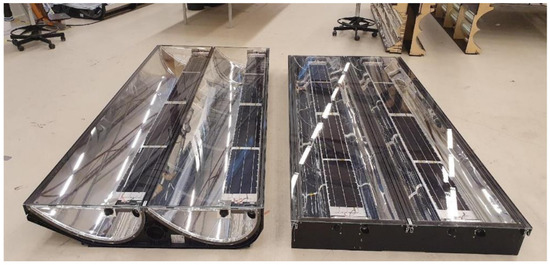
Figure 1.
Solarus Power Collector (left) and Double MaReCo Collector (right) kept side-by-side.
Considering these aspects, a novel reflector design, known as the Double MaReCo (DM), was introduced by Cabral [26]. Maintaining the non-tracking behaviour, this DM model, depicted in Figure 1, aims to streamline the earlier Solarus PC model by removing superfluous components, leading to cost reduction. It features a redesigned symmetric reflector geometry for consistent power output throughout the year, alongside a more compact and cost-efficient build. As shown in Figure 2, the DM collector consists of four troughs and two identical hybrid PVT receivers. The receivers are primarily constructed from aluminium, a material chosen for its excellent thermal conductivity and mechanical stability. The core of the receiver measures 2310 mm in length, 165 mm in width, and has a thickness of 14.5 mm. The size also accommodates sufficient surface area for mounting PV cells and facilitates efficient thermal exchange without compromising the compactness of the overall system. A full description of the DM collector is also given by Cabral [26]. Unlike the PC model’s transparent gables, the new DM design considers using opaque gables as integral parts of the collector box, potentially offering greater robustness, water resistance, and reduced manufacturing costs. However, opaque gables admit less light than transparent ones, potentially diminishing collector output. This reduced light access, particularly affecting electrical output due to series connections, may undermine the benefits of the opaque gables.
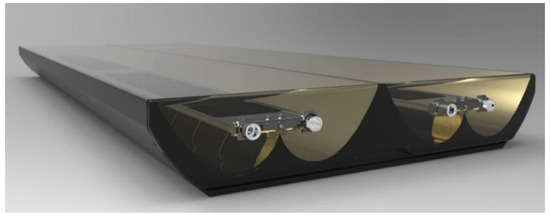
Figure 2.
CAD rendering of Double MaReCo collector with transparent gables [27].
Despite being a recently proposed geometric configuration, the electrical performance of the DM collector has not yet been thoroughly investigated. Existing research has largely concentrated on the thermal and optical characteristics of similar systems, leaving a significant gap in understanding how specific geometric features, particularly the transparency of the gables and non-uniform solar illumination, influence electrical output. Recognising this limitation, the present study aims to explore and analyse these overlooked aspects and proposes strategies to enhance the performance of the collector. The value of the method lies in its ability to assess and compare these designs with accuracy and consistency, helping users identify the most promising solutions for further development. Through this investigation, the study seeks to advance the design framework of the DM collector and enhance its overall electrical efficiency, with a detailed focus on the following key aspects:
- The number of PV cells in the array: Identifying an appropriate number of photovoltaic cells within the receiver is crucial to maximising overall efficiency. While it may seem intuitive that increasing the number of cells would lead to a higher electrical output, practical limitations must be considered. In a string configuration, the cell with the lowest efficiency acts as a performance bottleneck, reducing the output of the entire array. Moreover, as the number of cells increases, those positioned near the edges of the receiver may experience reduced concentrated irradiance at certain solar angles. This can lead to a decline in their efficiency and, consequently, limit the overall efficiency of the system. To address this, a series of simulations have been conducted in this study using the ray-tracing software Tonatiuh v2.2.4 to compare alternative configurations and assess which number of cells yields the highest performance while mitigating losses due to non-uniform irradiance distribution.
- The opacity of the gables: The second design aspect examined in this study is the impact of opaque gables in contrast to transparent gables at the ends of the collector, as illustrated in Figure 2. The choice of gable material affects the distribution of concentrated sunlight and, consequently, the electrical performance of the system. Ray-tracing simulations have been performed to compare the performance outputs of models equipped with both transparent and opaque gables. The results of these simulations provide insight into how light transmission and reflection at the gables influence the uniformity and intensity of irradiance received by the photovoltaic cells.
- Implementation of diodes: The final aspect under evaluation is the implementation of a bypass diode system. In traditional photovoltaic configurations, shading of a single cell can significantly reduce the performance of the entire string due to the series connection of cells. By integrating bypass diodes, the cells are effectively divided into separate strings, preventing under-performing or shaded cells from limiting the performance of the rest of the array. However, while a diode system offers the advantage of mitigating shading losses, it also introduces additional system complexity, while increasing the production cost and consuming the limited receiver space. This study examines whether the benefits of enhanced performance outweigh these drawbacks by analysing different diode configurations and their impact on overall system efficiency.
Numerical ray-tracing models are widely used to optimise solar ray collection, leading to increased energy yield. Among the various methods available, Monte Carlo Ray-Tracing (MCRT) is a reliable and adaptable computational method for simulating the properties of concentrating solar collectors [28]. In this study, the authors have used Tonatiuh, a simulation tool that employs the MCRT method to perform optical simulations on concentrating collectors and endorsed by several researchers [29,30]. The structure of the presentation of the paper in the rest of the sections is as follows: Section 2 describes the methodology followed for the simulations; Section 3 presents a detailed analysis of the simulation results obtained; and finally, Section 4 summarises the findings of this study.
2. Methodology
In this section, the setup for the simulations is described, including the geometrical and optical properties of the collectors and the PV cells. The assumptions and the parameters under which the simulations run are also detailed. Moreover, the design points, such as the gable’s opacity and the multiple configurations of the cells and diodes for the PV array on the receiver, are explained in detail.
2.1. Simulation Setup
Tonatiuh is an open-source ray-tracing simulation software that uses Monte Carlo simulations to calculate the total incident radiation that shines onto a specified surface at a specific moment. By implementing a couple of loops on the simulation’s script, it is possible to calculate the annual incidence on the receiver and, consequently, the energy production [29].
As previously stated, the simulations will initially use the DM PVT solar collector for these analyses, but they will then continue to simulate the geometry of the PC to compare it. The elements of the simulated collectors are the aluminium compound parabolic reflectors, the protective glass cover, the side plastic gables, and the receiver. The optical properties of these components, presented in Table 1, were set to be identical for both the DM and PC, allowing the comparative analysis to isolate the effects of the geometry and the PV-cell/diode configurations. The dimension of the standard PV cells on the receiver is 156 mm by 156 mm, while the whole collector area for specific production calculations is 0.81 m2. As mentioned, a script is developed to run the simulation iteratively while saving the results of each step as a binary file (.dat), to be post-processed in MATLAB afterwards.

Table 1.
Optical properties of the DM and the PC’s components.
To generate the rays, a light source that emulates the sun’s shape is used, and the software calculates their intersection with the collector’s surfaces. It is set as a pillbox distribution, where the intensity of the rays is constant at 1000 W/m2 at every point of the sun disk. The collector is simulated at a 60° latitude angle, with a 30° tilt, as shown in Figure 3. Weather factors, such as cloudiness or dust, are not considered, as they are not required in order to ascertain the relative performance of different designs. Consequently, partial shading due to environmental factors is omitted from the analysis. Each simulation step consists of 10,000 solar rays sent in the direction of the collector. A total of 8760 simulations are run to cover the entire year, one per hour in the day. The analysis was carried out by categorising the hourly results into two moments: Morning, from sunrise to solar noon, and Evening, from solar noon to sunset.
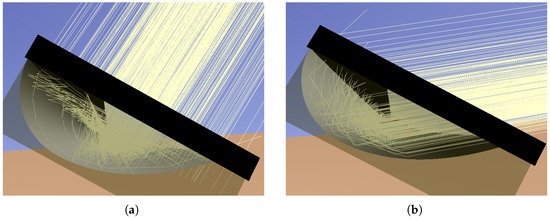
Figure 3.
Incident solar rays on PC in Tonatiuh simulation, on 2 June (a) and 21 December (b), at solar noon. [27].
2.2. Number of Cells on the Receiver
The PVT receiver considered for the ray-tracing simulations in this study is illustrated in Figure 4. For this study, the number of cells in the receiver is varied between 9 and 14 for the bottom side, while the top always maintains 14 cells, as it does not suffer from shadowing. Consequently, each array distribution positions the initial and final cells at a different distance from the gables, as seen in Figure 5. This has the result that, under some incidence angles, the output of the whole array is determined by the cell on the ends of the receiver as they would have the worst performance if the array is connected without a diode (cell number 1 gives the output during the morning and cell number 14 gives the output in the afternoon). Once the position of the edge cells is determined, the total annual incidence on the cell is calculated by considering the total daily production of the cell with the lowest output in each substring, as exemplified in Table 2.
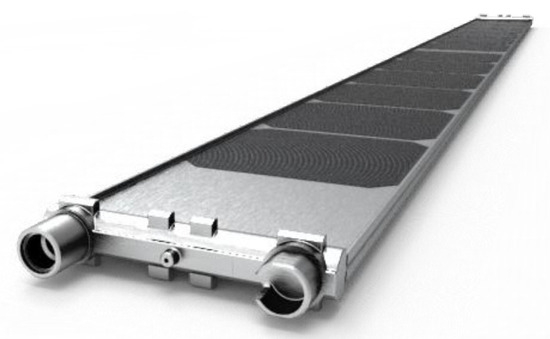
Figure 4.
PVT receiver used for ray-tracing simulations.
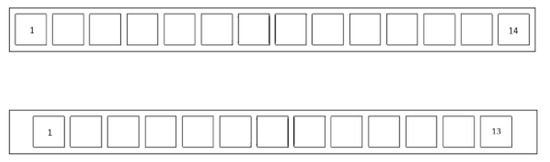
Figure 5.
Receiver PV cell numbering system used for even numbers of cells (top) and odd numbers of cells (bottom). The gap between the last cell and the edge increases as cells are removed from the configuration.
Table 2.
Example of output calculation for substring. The total production of the bottlenecking cell is set as the production of the rest of the cells in the substring.
2.3. Effect of Gable Opacity on Efficiency
To evaluate the effect of the gable’s opacity on the collector’s performance, these are set in the simulation to be either transparent or opaque by changing their transmittance property from the default 91% to 0%, respectively.
2.4. Optimal Number of Diodes
Lastly, the next part of the study evaluates the impact of the number of diodes in the system. For an array of 14 cells, the number of diodes implemented is varied between 1 and 5. Depending on the number of diodes used, the number of cells in each substring would also change. For example, when one diode is used, all 14 cells are in one string, and for two diodes, there are 7 cells in each string. However, for 3 diodes, the strings no longer have an equal number of cells. The first string could have 4 cells, while the second and third have 5 cells each. This configuration is denoted with the notation 4-5-5. This is further elucidated in Figure 6, which shows the possible diode configuration for the receiver with 14 PV cells, while Table 3 lists all the possible substring configurations depending on the number of cells in the array. The number of cells in each substring is kept equal whenever possible. When this is not possible, it has been opted to place the strings with the least number of cells near the edge of the receiver. This is done to reduce the impact of shading on the array’s performance, but at the same time, diodes increase manufacturing complexity and the system cost. Since the irradiance in one substring is defined by the cell that receives the least, the objective is to identify if the use of more diodes in the array represents a significant increase in the total incident radiation perceived. It is important to remark that, throughout this paper, the term "perceived radiation" must be understood as the incident radiation received by the collector that could be usefully converted into electricity by the non-bypassed PV cells in the array.
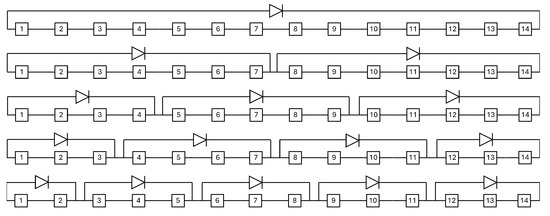
Figure 6.
Diode configurations for the 14-cell array, varying from 1 to 5 diodes in the string.
Table 3.
Diode string configurations for different numbers of cells in the array.
2.5. Performance Comparison Between Power Collector and Double MaReCo
Finally, after selecting the best-performing configurations from the previous analyses, a comparative analysis of the annual specific received radiation metrics is conducted to evaluate the potential enhancement in performance offered by the new optical concentrator implemented in the DM system relative to the traditional PC.
3. Results and Discussion
This section summarises the main results of the simulations. First, a comparison between the solar incidence on the top and bottom cells for different numbers of cells in the array is presented. The difference between the use of opaque and transparent gables is also studied. Lastly, the impact of a varying number of diodes, jointly with the effect of the previous design points, is showcased.
3.1. Effect of Cell Number and Gable Opacity
After varying the number of cells in the bottom array, the lowest irradiance is perceived by the 14-cell array in both the transparent and opaque gable scenarios, as can be seen in Figure 7. This is occasioned by the partial shading and the reflectance angle of the incident radiation at the first and last hours of the day. For the collector with transparent gables, the 14-cell array perceived 29.4% less incident radiation than the 9-cell array, while for the opaque gable collector, the reduction in perception reached 50.0%.
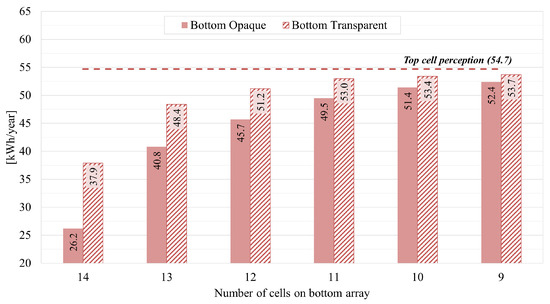
Figure 7.
Solar irradiance received on edge cell.
Moreover, independently of the number of cells on the array, the energy perception on the edge cell was lower for the opaque gables. The difference is small for the 9-cell array, with only a 2.4% lower perceived irradiance for the opaque gable collector, but the gap significantly widens when analysing the 14-cell, presenting a 30.9% lower perception in comparison with the transparent gable collector. However, despite the concentration of incident radiation achieved by the collector in the bottom arrays, no case presented a larger perception than the cell on the edge of the top array.
Furthermore, Figure 8 shows the worst-performing cells in each cell layout as both the number of cells and the number of diodes are varied. It is clear that, during the morning, the east-most cells within each sub-array are the ones that perform poorly, and that it is the other way around during the evening, with the west-most cells performing the worst. This is mainly related to the collector’s south-facing alignment and the incidence angle from which the rays hit the collector. Under the pseudo-balanced diode configurations studied in this paper, this could represent a significant loss in output as larger substrings on the edge of the received end up being limited by the edge cells. Consequently, future work must focus on evaluating the output difference between different diode arrays for the same number of cells, such as 1-2-8-2-1 or 1-3-6-3-1 for 14-cell arrays, as they were not within the scope of this study and have the potential to achieve better performance.
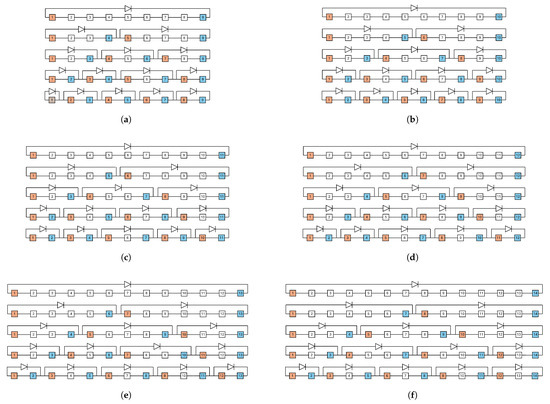
Figure 8.
Different diode configurations showcasing the least-incidence-receptive cell during the Morning (blue) and Evening (orange) moments, for the cell arrays with (a) 9, (b) 10, (c) 11, (d) 12, (e) 13, and (f) 14 cells.
3.2. Effect of Number of Diodes
The results of the multiparametric simulation are presented in detail in Table 4. As stated before, the top production is constant across all the simulations, at 766 kWh/yr for the 14-cell array. On the other side, when analysing the effect of the diodes on the bottom array, it presented more variation in the perceived radiation across the simulations. Using as a reference the 5-diode configuration for each set of simulations with the same number of cells on the array, the largest difference in the irradiance perceived is presented in the 14-cell, 1-diode, opaque gable configuration, referred to from now on with the notation O-14/1 configuration, with a reduction of 44.7%. Its transparent counterpart, configuration T-14/1, presented the second largest difference with a reduction of 23.9% from the reference value. Nevertheless, only 13 out of 48 configurations presented a reduction in perceived radiation greater than 3%, with all the 9- and 10-cell configurations being practically unresponsive to the number of diodes used, as can be seen in Figure 9.
Table 4.
Perceived solar radiation on collector using a 14-cell array on top of the receiver while varying the number of cells and diodes on the bottom.
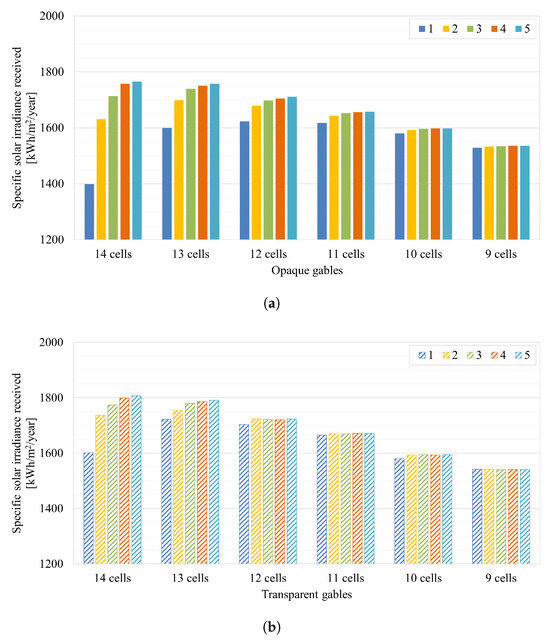
Figure 9.
Specific incident solar radiation perceived by the collector for different numbers of cells and diodes on the bottom receiver, using (a) opaque and (b) transparent gables.
Another important takeaway is that, as incorporating diodes inside the receiver is a complex process, it is best to use the maximum number possible to improve the output, but it is important to keep in mind that if one does include diodes in the design, then it is not very relevant to the final collector cost whether there are 2 or 5 diodes per string. In contrast with the large reductions presented by the 1-diode configurations, no 4-diode configuration presented a reduction in perceived radiation greater than 1.0%. This shows that, even if there is an increase in performance by the use of diodes, there is a limit to the improvement. In other words, any pseudo-evenly spaced configurations with more than 5 diodes will not yield significant benefits for the studied number of cells in the array. However, as mentioned previously, configurations with non-uniformly spaced diodes. such as 1-3-6-3-1, could represent an important improvement in performance.
3.3. Opaque vs. Transparent Gables
As expected, it can be observed that the collectors using transparent gables perceive more radiation than those using opaques for all configurations with 11-cell arrays or larger, as 10- and 9-cell arrays present virtually the same results. The largest performance difference, accounting for both top and bottom receivers, is again present in the 14-cell arrays, with the O-14/5 configuration perceiving only 87% of the radiation that its transparent-gable counterpart does. Other notable differences come from the O-14/4, O-13/5, and O-13/5 configurations, with performance ratios of 94%, 93%, and 95%, respectively. For the rest of the cases, the performance ratio is no lower than 97%.
Despite these differences, the reduction in performance due to the opaque gables is not as significant as the one from the absence of diodes or, most importantly, the number of cells in the array. For example, all but the O-14/1 configurations using 10 or more cells, independent of the gable opacity or the number of diodes, perceived more radiation than the ones using 9 cells. This demonstrates that even though edge-shading has a higher impact in arrays with fewer diodes but more cells, a larger number of cells will favour the collector’s performance when using at least two substrings, or even only one for the transparent gable cases. Moreover, despite this being a simulation work, an additional but crucial consideration resulting from the discussion of this study is that the use of transparent gables could become a safety hazard when deployed, as the concentrated rays could bounce out of the collector and focus on a nearby structure, generating a potential risk for fires and injuries. This heavily favours opaque gables, especially as the loss in perceived radiation is not as significant as the number of collectors.
3.4. Comparison of Double MaReCo with Power Collector
Lastly, when comparing the new proposed DM design against the existing PC, the results presented in Table 5 showcase the better performance achieved by the novel collector in terms of specific annual radiation perceived. The four best-performing configurations from the previous analyses, T-14/5, T-14/4, T-13/5, and T-13/4, were selected for the comparison. The performance of the DM is 56% better for the case of the 14-cell array and 64% for both 13-cell array comparisons. No additional PC configurations were simulated, as the initial results already showed a consistent and significant performance gap in favour of the DM collector. The comparison thus focused on highlighting this difference rather than conducting a broader parametric sweep for the PC. Nevertheless, while this could represent a theoretical improvement in the electrical production of the collector, it is important to keep in mind how this couples with the thermal performance of the system, as a hybrid collector is the focus of the study. Moreover, manufacturability and production costs could play another significant part in the decision to implement the proposed configurations or not.
Table 5.
Comparison of the perceived radiation between the DM and the PC per specific collector area.
4. Conclusions
Ray-tracing simulations were performed on the concentrating photovoltaic-thermal (CPVT) Double MaReCo (DM) collector, an improved version of the Solarus Power Collector (PC), to evaluate the effect of three different design characteristics on the electrical performance. The design characteristics studied were the number of photovoltaic cells on the bottom side of the receiver, the number of diodes used in the cell array, and the transparency of the gables used on either side of the collector. To do so, the open-source Monte Carlo ray-tracing software Tonatiuh was used to calculate the perceived solar irradiance on the cells, while the post-processing was handled with MATLAB R2024b.
It was found that if a single diode was used in the bottom array, the perceived radiation by the 14-cell array was considerably lower than the 9-cell array with both the transparent and the opaque gable cases, with reductions of 29.4% and 50.0%, respectively, also demonstrating the significant impact of the opaque or transparent gables, as the latter perceived 30.9% less radiation than the former. Nevertheless, when reducing the number of cells under the same number of diodes, this difference was reduced to only 2.4%.
Furthermore, the use of diodes improved the performance notably, as the O-14/1 and T-14/1 configurations perceived 44.7% and 23.9% less radiation than their 5-diode counterparts, these two being the first and second largest differences from the whole set. However, only 13 out of the 48 configurations presented a difference greater than 3% with the 5-diode cases, and even the 9- and 10-cell configurations were practically unaffected by the number of diodes used.
It was also noticed that, for bottom arrays of 11 or more cells, using opaque gables resulted in a performance reduction with the O-14/5 configuration perceiving only 87% of what the transparent case did with the same number of cells and diodes. Still, only four opaque configurations perceived less than 97% of what the transparent ones did. Hence, the performance loss caused by the opaque gables is less significant compared to the impact of missing diodes or, more critically, the number of cells in the array.
Lastly, when compared to the Power Collector, the DM had a 54% and 64% better performance for the 14- and 13-cell bottom arrays, respectively, demonstrating the improvements achieved by the updated collector design.
This study shows that the design methodology studied in this paper can be successfully applied to assess the electrical performance of a concentrating solar collector. Nevertheless, the method is replicable for other concentrating solar collectors, as the optimisation methodology for the PV cell distribution works independently from the collector’s geometry.
Acknowledging the importance of PV cell and diode configurations on the electrical performance of CPVT systems, it is proposed that future research evaluate the performance differences between various diode array configurations for 14-cell arrays, such as 1-2-8-2-1 and 1-3-6-3-1, which were beyond the scope of this study. Special attention may also be given to non-uniformly spaced diodes, such as 1-3-6-3-1, as they can potentially enhance efficiency. These investigations could provide valuable insights for optimising the placement of diodes in photovoltaic systems, which is still an evolving and challenging research area.
Author Contributions
Conceptualisation, J.G., G.P.; methodology, J.G., G.P., J.P.S.; software, J.G.; formal analysis, J.P.S.; investigation, J.G., G.P.; resources, J.P.S., D.M.; data curation, J.P.S., D.M.; writing—original draft preparation, J.P.S., D.M.; writing—review and editing, J.P.S., D.M., I.P.A.-P.; visualisation, J.P.S.; supervision, I.P.A.-P.; funding acquisition, J.G. All authors have read and agreed to the published version of the manuscript.
Funding
This work has been developed under the framework of the PVT4EU project, granted by the Clean Energy Transition Partnership Programme (project ID. CETP-2022-00403). The work is supported by national funds through Sweden: Swedish Energy Agency (P2023-00884); Denmark: Innovation Fund Denmark (3112-00010B); and Portugal: FCT- Fundação para a Ciência e a Tecnologia, I.P. (CETP/0004/2022). This work is also developed within the framework of the SPECTRUM project. This project has been funded by the European Union under grant agreement No. 101172891. The views and opinions expressed are, however, those of the author(s) only and do not necessarily reflect those of the European Union or CINEA. Neither the European Union nor CINEA can be held responsible for them. The study was also supported by the Swedish Energy Agency under the RESILIENT project (grant number 2021-036454) and was partly supported with funding from the European Union’s Horizon 2020 Research and Innovation program under the RES4BUILD project (grant agreement No. 814865).
Data Availability Statement
The data presented in this study are available on request from the corresponding author due to IPR related to the collectors.
Conflicts of Interest
Author João Gomes, George Pius and Iván P. Acosta-Pazmiño were employed by the company MG Sustainable Engineering AB. The remaining authors declare that the research was conducted in the absence of any commercial or financial relationships that could be construed as a potential conflict of interest. The funders had no role in the design of the study; in the collection, analyses, or interpretation of data; in the writing of the manuscript; or in the decision to publish the results.
Abbreviations
The following abbreviations are used in this manuscript:
| CPVT | Concentrating Photovoltaic-Thermal |
| DM | Double MaReCo |
| IAM | Incidence Angle Modifier |
| MaReCo | Maximum Reflector Concentration |
| MCRT | Monte Carlo Ray-Tracing |
| PC | Power Collector |
| PV | Photovoltaic |
| PVT | Photovoltaic-Thermal |
| ST | Solar Thermal |
References
- Bohm, D.; Kuhn, T.S. The structure of scientific revolutions. Philos. Q. 1964, 14, 377. [Google Scholar] [CrossRef]
- Ramos, A.; Chatzopoulou, M.A.; Guarracino, I.; Freeman, J.; Markides, C.N. Hybrid photovoltaic-thermal solar systems for combined heating, cooling and power provision in the urban environment. Energy Convers. Manag. 2017, 150, 838–850. [Google Scholar] [CrossRef]
- Shadmehri, M.; Narei, H.; Ghasempour, R.; Shafii, M.B. Numerical simulation of a concentrating photovoltaic-thermal solar system combined with thermoelectric modules by coupling Finite Volume and Monte Carlo Ray-Tracing methods. Energy Convers. Manag. 2018, 172, 343–356. [Google Scholar] [CrossRef]
- Herrando, M.; Ramos, A. Photovoltaic-Thermal (PV-T) Systems for Combined Cooling, Heating and Power in Buildings: A Review. Energies 2022, 15, 3021. [Google Scholar] [CrossRef]
- Herrando, M.; Wang, K.; Huang, G.; Otanicar, T.; Mousa, O.B.; Agathokleous, R.A.; Ding, Y.; Kalogirou, S.; Ekins-Daukes, N.; Taylor, R.A.; et al. A review of solar hybrid photovoltaic-thermal (PV-T) collectors and systems. Prog. Energy Combust. Sci. 2023, 97, 101072. [Google Scholar] [CrossRef]
- Murali, D.; Acosta-Pazmiño, I.P.; Loris, A.; García, A.C.; Benni, S.; Tinti, F.; Gomes, J. Experimental assessment of a solar photovoltaic-thermal system in a livestock farm in Italy. Sol. Energy Adv. 2024, 4, 100051. [Google Scholar] [CrossRef]
- Miljkovic, N.; Wang, E.N. Modeling and optimization of hybrid solar thermoelectric systems with thermosyphons. Sol. Energy 2011, 85, 2843–2855. [Google Scholar] [CrossRef]
- Su, D.; Jia, Y.; Alva, G.; Liu, L.; Fang, G. Comparative analyses on dynamic performances of photovoltaic–thermal solar collectors integrated with phase change materials. Energy Convers. Manag. 2017, 131, 79–89. [Google Scholar] [CrossRef]
- Cabral, D.; Gomes, J.; Karlsson, B. Performance evaluation of non-uniform illumination on a transverse bifacial PVT receiver in combination with a CPC geometry. Sol. Energy 2019, 194, 696–708. [Google Scholar] [CrossRef]
- Duffie, J.A.; Beckman, W.A.; Blair, N. Solar Engineering of Thermal Processes, Photovoltaics and Wind; John Wiley & Sons: Hoboken, NJ, USA, 2020. [Google Scholar]
- Sharaf, O.Z.; Orhan, M.F. Concentrated photovoltaic thermal (CPVT) solar collector systems: Part II – Implemented systems, performance assessment, and future directions. Renew. Sustain. Energy Rev. 2015, 50, 1566–1633. [Google Scholar] [CrossRef]
- Lämmle, M.; Kroyer, T.; Fortuin, S.; Wiese, M.; Hermann, M. Development and modelling of highly-efficient PVT collectors with low-emissivity coatings. Sol. Energy 2016, 130, 161–173. [Google Scholar] [CrossRef]
- Yang, F.; Wang, H.; Zhang, X.; Tian, W.; Hua, Y.; Dong, T. Design and experimental study of a cost-effective low concentrating photovoltaic/thermal system. Sol. Energy 2017, 160, 289–296. [Google Scholar] [CrossRef]
- Saini, V.; Tripathi, R.; Tiwari, G.; Al-Helal, I. Electrical and thermal energy assessment of series connected N partially covered photovoltaic thermal (PVT)-compound parabolic concentrator (CPC) collector for different solar cell materials. Appl. Therm. Eng. 2017, 128, 1611–1623. [Google Scholar] [CrossRef]
- Sharaf, O.Z.; Orhan, M.F. Comparative thermodynamic analysis of densely-packed concentrated photovoltaic thermal (CPVT) solar collectors in thermally in-series and in-parallel receiver configurations. Renew. Energy 2018, 126, 296–321. [Google Scholar] [CrossRef]
- Youssef, W.B.; Maatallah, T.; Menezo, C.; Nasrallah, S.B. Modeling and optimization of a solar system based on concentrating photovoltaic/thermal collector. Sol. Energy 2018, 170, 301–313. [Google Scholar] [CrossRef]
- Alves, P.; Fernandes, J.F.; Torres, J.P.N.; Branco, P.C.; Fernandes, C.; Gomes, J. From Sweden to Portugal: The effect of very distinct climate zones on energy efficiency of a concentrating photovoltaic/thermal system (CPV/T). Sol. Energy 2019, 188, 96–110. [Google Scholar] [CrossRef]
- Cabral, D.; Karlsson, B.O. Electrical and thermal performance evaluation of symmetric truncated C-PVT trough solar collectors with vertical bifacial receivers. Sol. Energy 2018, 174, 683–690. [Google Scholar] [CrossRef]
- Cabral, D.; Gomes, J.; Hayati, A.; Karlsson, B. Experimental investigation of a CPVT collector coupled with a wedge PVT receiver. Sol. Energy 2021, 215, 335–345. [Google Scholar] [CrossRef]
- Decker, B.; Jahn, U. Performance of 170 grid connected PV plants in Northern Germany—Analysis of yields and optimization potentials. Sol. Energy 1997, 59, 127–133. [Google Scholar] [CrossRef]
- Bunthof, L.; Kreuwel, F.; Kaldenhoven, A.; Kin, S.; Corbeek, W.; Bauhuis, G.; Vlieg, E.; Schermer, J. Impact of shading on a flat CPV system for façade integration. Sol. Energy 2016, 140, 162–170. [Google Scholar] [CrossRef]
- Woyte, A.; Nijs, J.; Belmans, R. Partial shadowing of photovoltaic arrays with different system configurations: Literature review and field test results. Sol. Energy 2003, 74, 217–233. [Google Scholar] [CrossRef]
- Adsten, M.; Helgesson, A.; Karlsson, B. Evaluation of CPC-collector designs for stand-alone, roof- or wall installation. Sol. Energy 2005, 79, 638–647. [Google Scholar] [CrossRef]
- Gomes, J. Assessment of the Impact of Stagnation Temperatures in Receiver Prototypes of C-PVT Collectors. Energies 2019, 12, 2967. [Google Scholar] [CrossRef]
- Nasseriyan, P.; Afzali Gorouh, H.; Gomes, J.; Cabral, D.; Salmanzadeh, M.; Lehmann, T.; Hayati, A. Numerical and Experimental Study of an Asymmetric CPC-PVT Solar Collector. Energies 2020, 13, 1669. [Google Scholar] [CrossRef]
- Cabral, D. Development and performance comparison of a modified glazed CPC hybrid solar collector coupled with a bifacial PVT receiver. Appl. Energy 2022, 325, 119653. [Google Scholar] [CrossRef]
- Gomes, J. Development of Concentrating Photovoltaic-Thermal Solar Collectors. Ph.D. Thesis, Gävle University, Gävle, Sweden, 2021. [Google Scholar]
- Cheng, Z.; He, Y.; Cui, F.; Xu, R.; Tao, Y. Numerical simulation of a parabolic trough solar collector with nonuniform solar flux conditions by coupling FVM and MCRT method. Sol. Energy 2012, 86, 1770–1784. [Google Scholar] [CrossRef]
- Jafrancesco, D.; Cardoso, J.P.; Mutuberria, A.; Leonardi, E.; Les, I.; Sansoni, P.; Francini, F.; Fontani, D. Optical simulation of a central receiver system: Comparison of different software tools. Renew. Sustain. Energy Rev. 2018, 94, 792–803. [Google Scholar] [CrossRef]
- Wang, Y.; Potter, D.; Asselineau, C.A.; Corsi, C.; Wagner, M.; Caliot, C.; Piaud, B.; Blanco, M.; Kim, J.S.; Pye, J. Verification of optical modelling of sunshape and surface slope error for concentrating solar power systems. Sol. Energy 2020, 195, 461–474. [Google Scholar] [CrossRef]


Disclaimer/Publisher’s Note: The statements, opinions and data contained in all publications are solely those of the individual author(s) and contributor(s) and not of MDPI and/or the editor(s). MDPI and/or the editor(s) disclaim responsibility for any injury to people or property resulting from any ideas, methods, instructions or products referred to in the content. |
© 2025 by the authors. Licensee MDPI, Basel, Switzerland. This article is an open access article distributed under the terms and conditions of the Creative Commons Attribution (CC BY) license (https://creativecommons.org/licenses/by/4.0/).