1. Introduction
Due to rising global concern about climate change, carbon emission reduction has a broad consensus in the international community [
1,
2,
3]. In the energy field, the traditional power system faces many challenges, such as high carbon emissions, low energy utilization efficiency, and difficulties in the use of new energy sources. Virtual power plant has emerged as an innovative energy management model, which integrates distributed energy resources, energy storage systems, and controllable loads, etc., and is able to achieve flexible regulation and optimal operation of the power system. At the same time, green certificates play an important role in promoting the development and trading of renewable energy as a tool for protecting emerging renewable energy’s environmental rights and interests. The gradual improvement of the carbon emissions trading market also gives the carbon emission reduction index a clear economic value [
4]. However, in the current virtual power plant model, the operation process, electricity, carbon, and green certificate-related transactions are often in a decentralized state, and lack an effective synergistic mechanism and a credible trading platform [
5,
6]. Blockchain technology, with its decentralization, non-tampering, traceability, and other characteristics, provides new ideas and ways to solve the above problems [
7]. Constructing a virtual power plant electricity/carbon/green certificate blockchain cross-chain trading platform can achieve the organic integration and efficient interoperability of different types of transactions, improve the transparency and credibility of transactions, and reduce transaction costs and risks. This not only helps to promote the sustainable development of the virtual power plant, but also further promotes the transformation and upgrading of the energy and power industry in the direction of low-carbon and green, which is of great research significance and application value in the process of realizing the global carbon emission reduction target and building a clean and low-carbon energy system.
In recent years, scholars have conducted extensive research on cross-chain trading of power energy. Reference [
8] proposes a cross-chain trading model for traditional electricity/carbon trading, leveraging blockchain technology to achieve cost reduction, efficiency improvement, and energy conservation. Experimental results validate its effectiveness. Aiming at the low consumption rate of renewable energy and high financial subsidy pressure, reference [
9] develops an optimal model for integrated energy systems with green certificate cross-chain trading, which reduces costs, promotes consumption, and enhances efficiency. To address the inefficiency of single-blockchain processing in energy transactions, reference [
10] presents a peer-to-peer energy trading model based on cross-chain technology, significantly improving security, efficiency, and scalability.
Although blockchain technology has been effectively applied to privacy protection in single energy market transactions, its application in joint markets remains insufficient, failing to fully exploit its privacy protection advantages. To tackle the inefficiency of single-blockchain processing, reference [
11] constructs an optimal model for integrated energy systems with green certificate cross-chain trading, effectively reducing system costs and enhancing renewable energy consumption efficiency. Reference [
12] proposes a peer-to-peer energy trading model based on cross-chain technology, remarkably improving transaction security, efficiency, and system scalability. In the context of electricity/carbon/green certificate joint market trading, current studies mainly rely on penalty mechanisms [
13,
14], accounting methods [
15,
16], and robust optimization [
17]. Compared with single trading markets, these approaches reduce carbon emissions by 5% and increase new energy consumption by approximately 6%. However, existing research still has notable limitations.
On one hand, the application of blockchain cross-chain technology in energy trading is mostly confined to single scenarios of electricity, carbon, or green certificates. For example, reference [
18] only focuses on the blockchain application in carbon trading, lacking multi-market integration. On the other hand, traditional joint trading frameworks for electricity/carbon/green certificates lack blockchain technology support, making it difficult to ensure information transparency and immutability. For instance, centralized storage of transaction data in traditional models [
19] poses a risk of tampering, failing to meet the security and transparency requirements of modern energy trading [
20,
21,
22]. At the same time [
23], research and analysis are currently being conducted at home and abroad on credit certificates, green certificate trading, and trading contracts [
24,
25,
26]. Additionally, existing studies have not formed a complete solution for electricity/carbon/green certificate cross-chain trading, hindering efficient interconnection and collaborative optimization among multi-markets.
To this end, this paper proposes to consider the blockchain cross-chain trading strategy of the electricity/carbon/green certificate virtual power plant. The following contributions were made to this end.
- (1)
This study applies blockchain cross-chain technology to the multi-market joint trading of electricity, carbon, and green certificates in virtual power plants (VPPs), constructing a relay chain-centric multi-chain collaborative trading platform. The proposed framework ensures the immutability and privacy protection of transaction data through cross-chain gateways and smart contracts, addressing issues such as information silos and trust deficits inherent in traditional decentralized trading mechanisms. This innovation significantly enhances transaction transparency and security, offering a robust solution for integrated energy market operations.
- (2)
To address the uncertainty of renewable energy generation and load demand, this paper proposes a scenario generation and reduction method integrating Latin Hypercube Sampling (LHS) and K-means clustering. By generating diverse scenarios through stratified sampling and extracting representative scenarios via clustering, this method reduces computational complexity while improving prediction accuracy, providing robust data support for multi-energy complementary optimization in VPPs.
- (3)
This study innovatively introduces a quota system to establish a VPP optimization model coupling electricity, carbon, and green certificate markets. Experimental results demonstrate that the model achieves an 8.5% reduction in carbon emissions and an 8.59% increase in renewable energy utilization through the synergy of carbon trading revenue and green certificate incentives. It also realizes a Pareto improvement between environmental and economic benefits, providing theoretical and practical guidance for VPP participation in low-carbon power systems.
2. Blockchain Cross-Chain Transaction Model
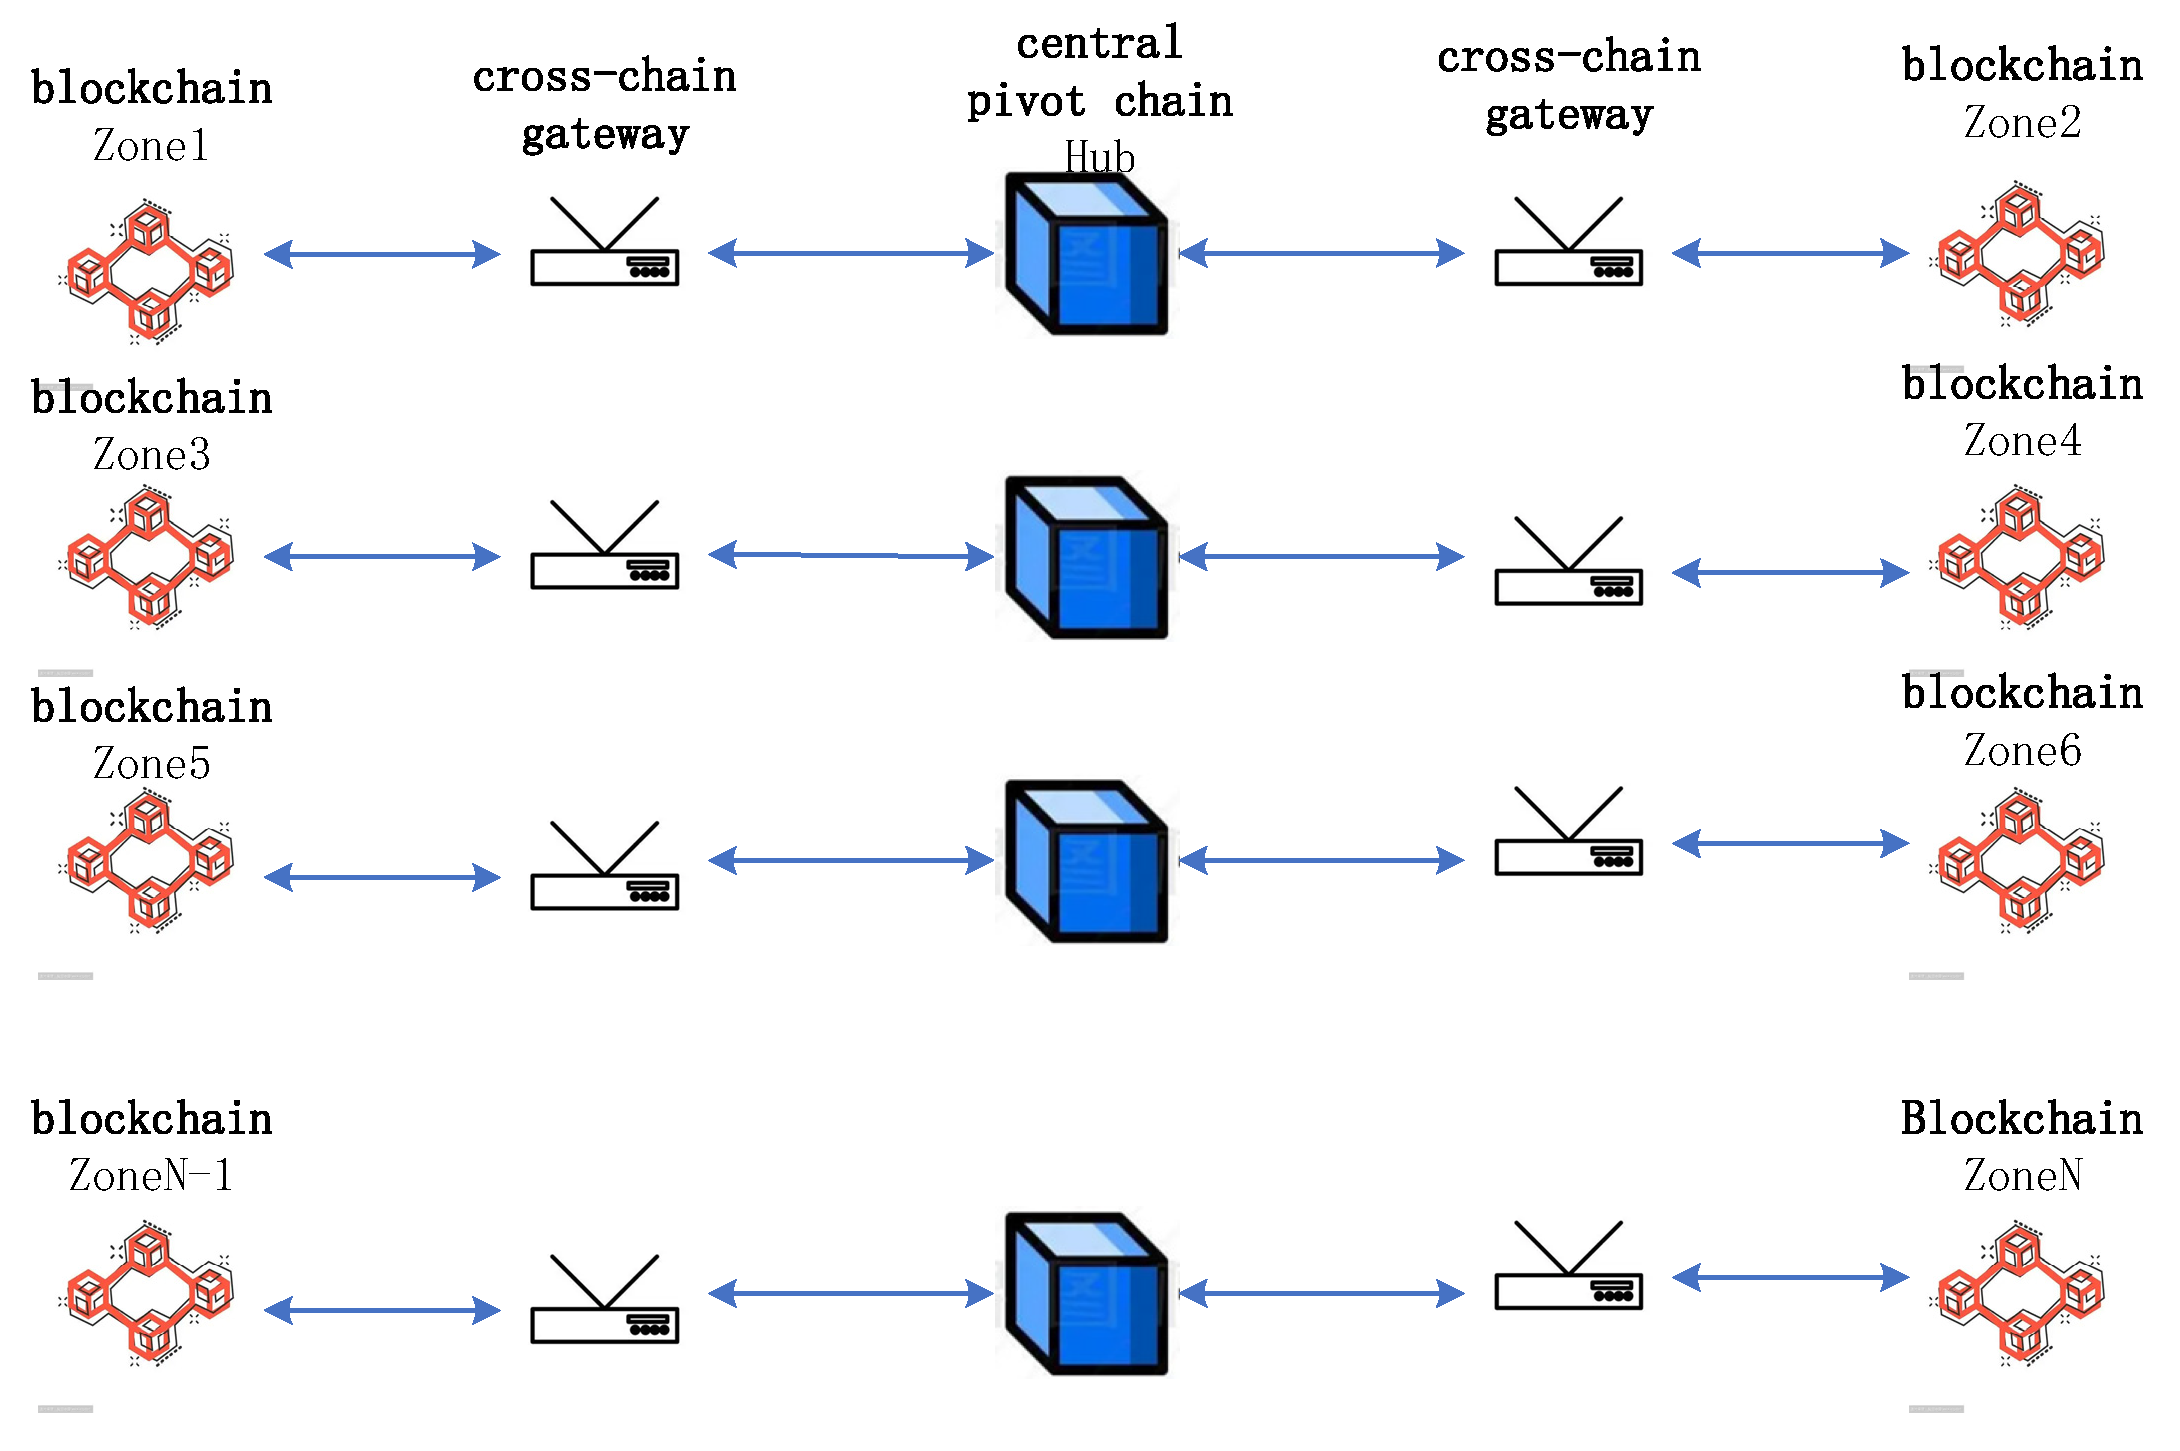
For blockchain, cross-chain transaction refers to achieving cross-chain information circulation in transferring asset information of one blockchain to another blockchain, and for the cross-chain transaction mechanism, the present invention analyses with a relay chain mechanism. The principle is shown in
Figure 1. First, the virtual power plant transmits transaction information to the central hub chain through the blockchain, where the cross-chain gateway ensures the security of information transmission to prevent data from being tampered with or attacked. Interactions between blockchains are carried out through the central hub chain.
In a cross-chain transaction of the relay chain, it mainly connects different blockchains through the central hub chain and cross-chain gateway to achieve a cross-chain transaction. In the process of cross-chain transactions, all information and transfers need to be carried out from the relay chain, which allows the relay chain to record all cross-chain transaction information and ensure the security of cross-chain transactions.
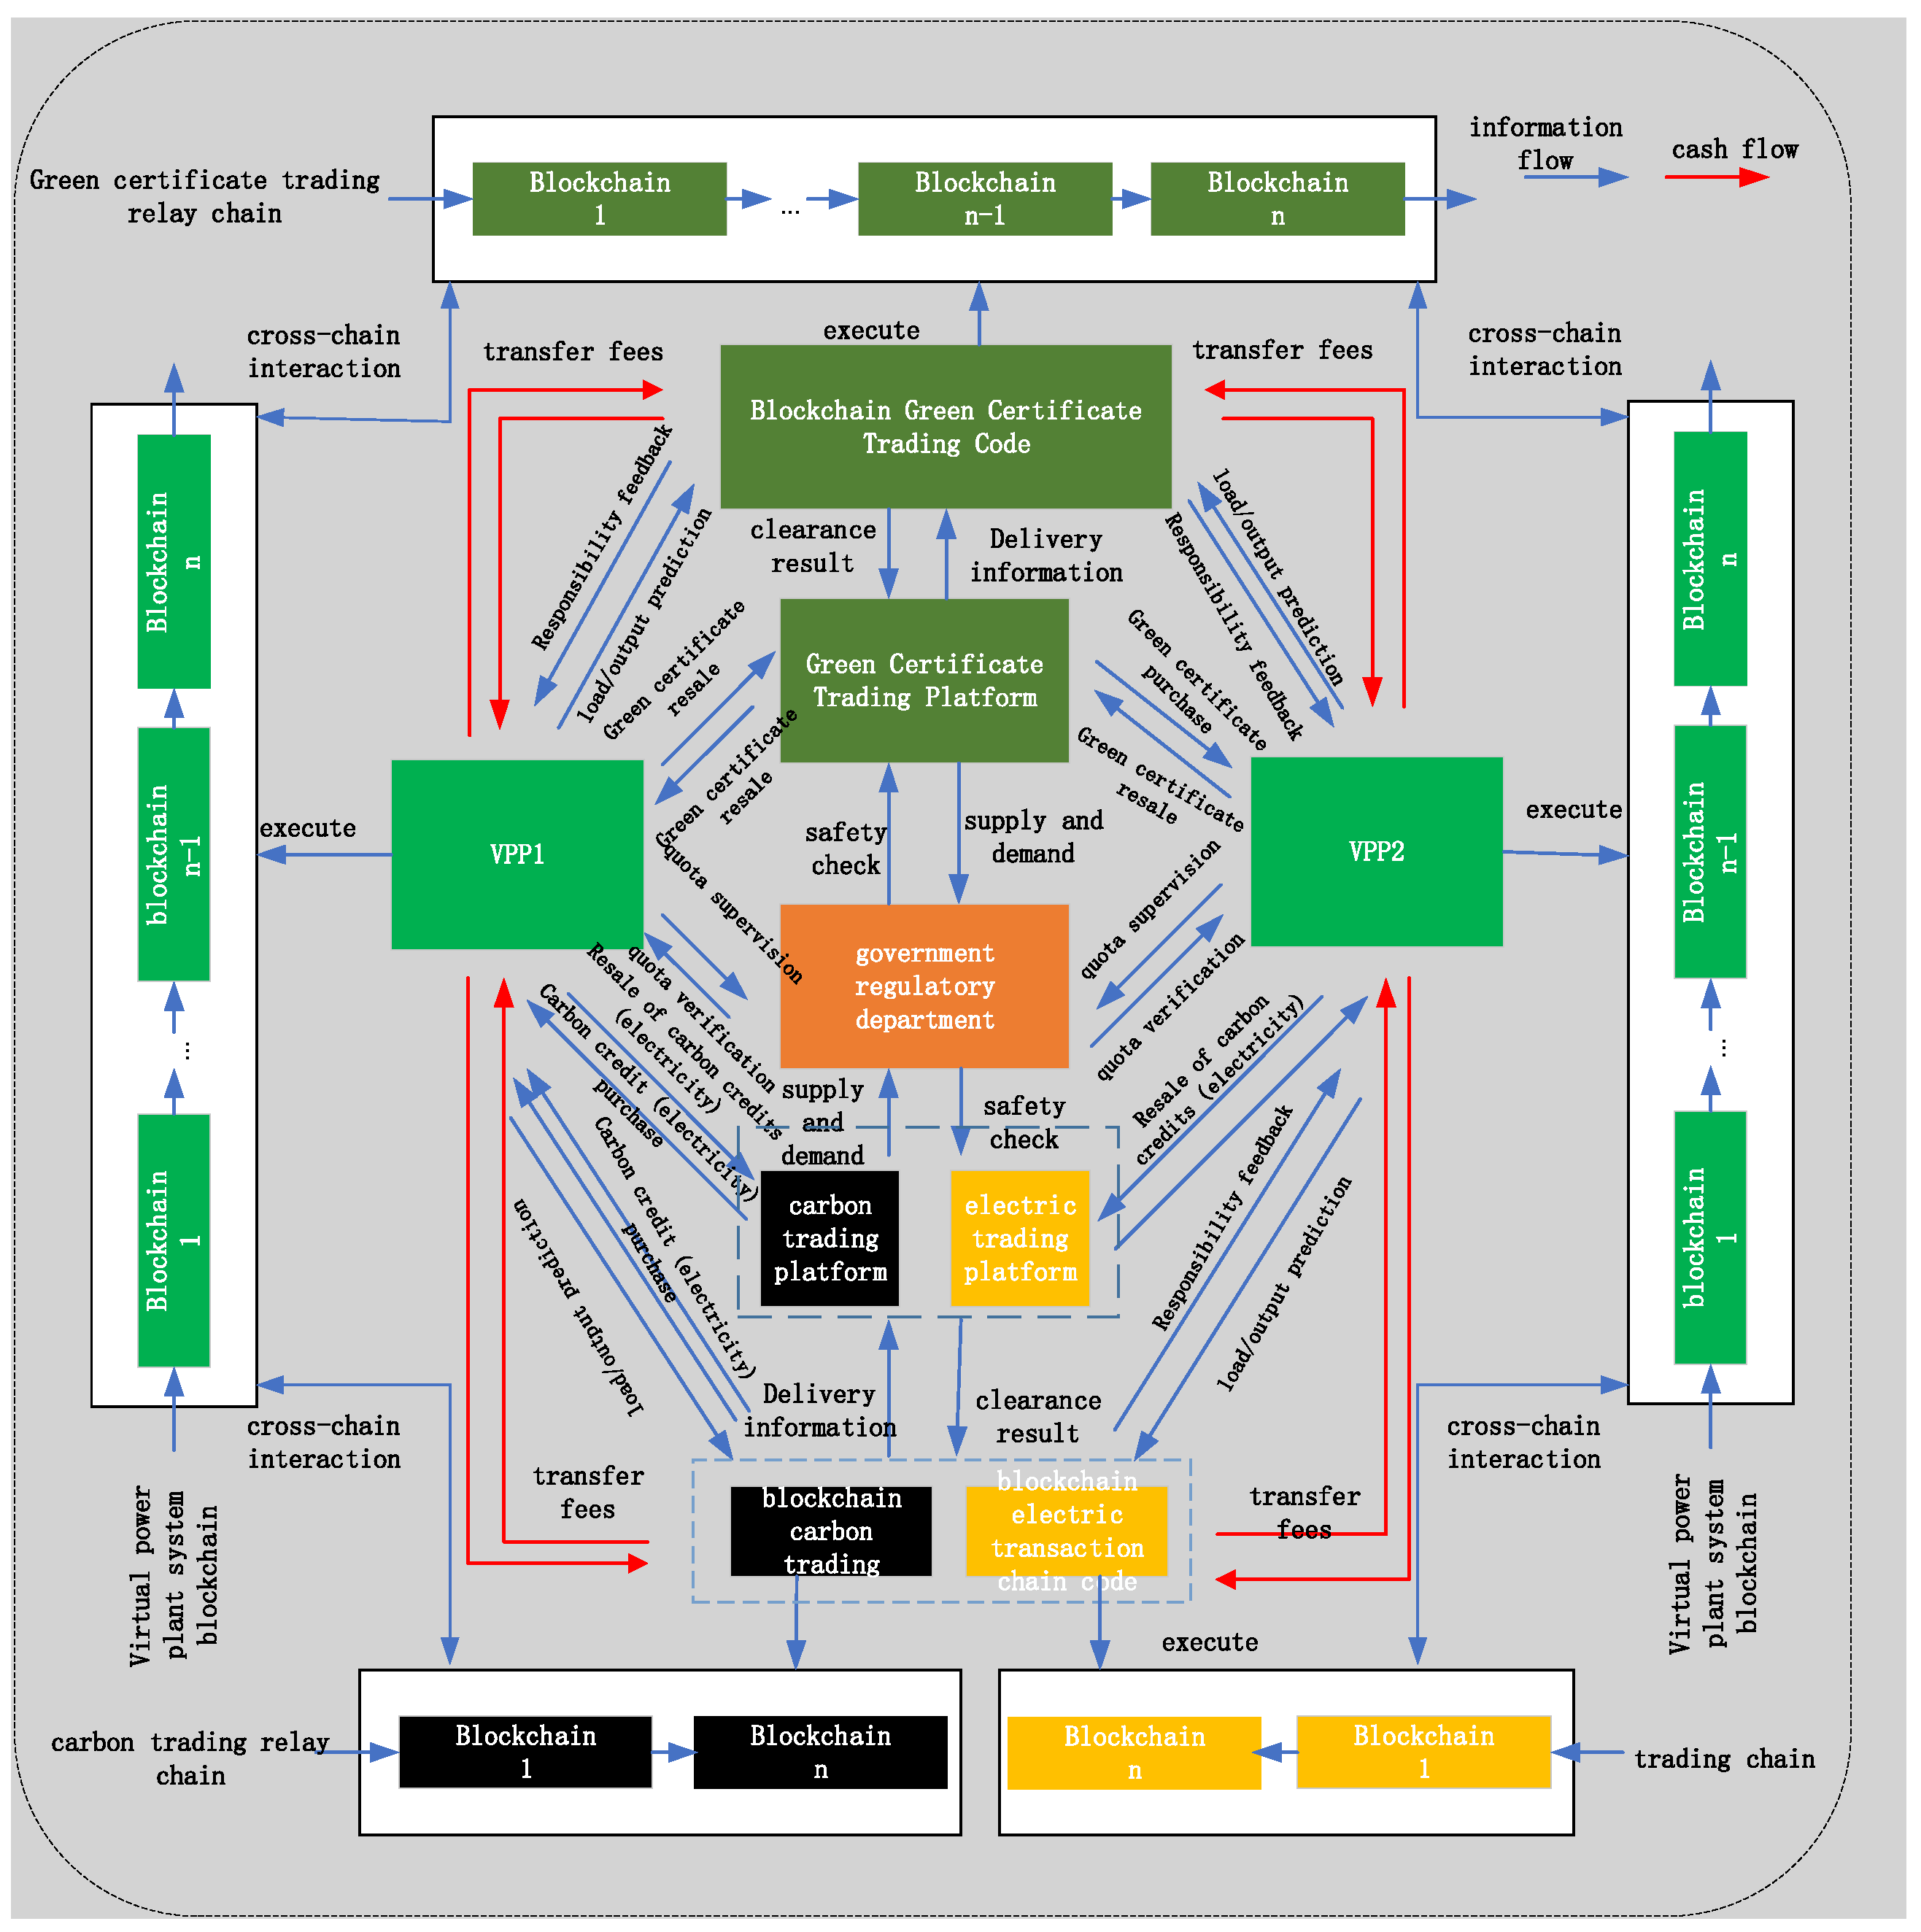
The electricity/carbon/green certificate virtual power plant cross-chain trading framework of the present invention is shown in
Figure 2 and implemented on the Z-ledger platform. In the green certificate trading and carbon trading process, the virtual power plant trading platform contains distributed new energy and various types of distributed resources, and each virtual power plant (VPP) stores its respective transaction information in its own blockchain. When VPP transactions occur, the process is as follows. First, the VPP platform provides wind/solar power generation and load forecasting information to the blockchain codes of green certificate trading, carbon trading, and electricity trading. The blockchain trading platforms then provide quota feedback based on this information, which is subject to review and verification by government regulatory authorities. Second, the VPP platform transmits transaction information to the green certificate trading platform, carbon trading platform, and electricity trading platform, while storing the transaction information in the main blockchain of the VPP. Finally, when transactions between VPPs are concluded, cross-chain trading is implemented via relay chains. Cross-chain transactions between VPPs can be achieved through the transaction platform using carbon trading relay chains and green certificate trading relay chains.
In the process of trading value, the carbon trading platform, green certificate trading platform, and electricity trading platform will show the supply and demand information on the blockchain, the green certificate and carbon trading, and trading electricity information in their respective relay chain to form a new chain code, whose information mainly contains the supply and demand information, and when the virtual power plant is traded from each platform to promote the transaction of the smart contract.
3. VPP Model for Cross-Chain Trading of Electricity/Carbon/Green Certificates
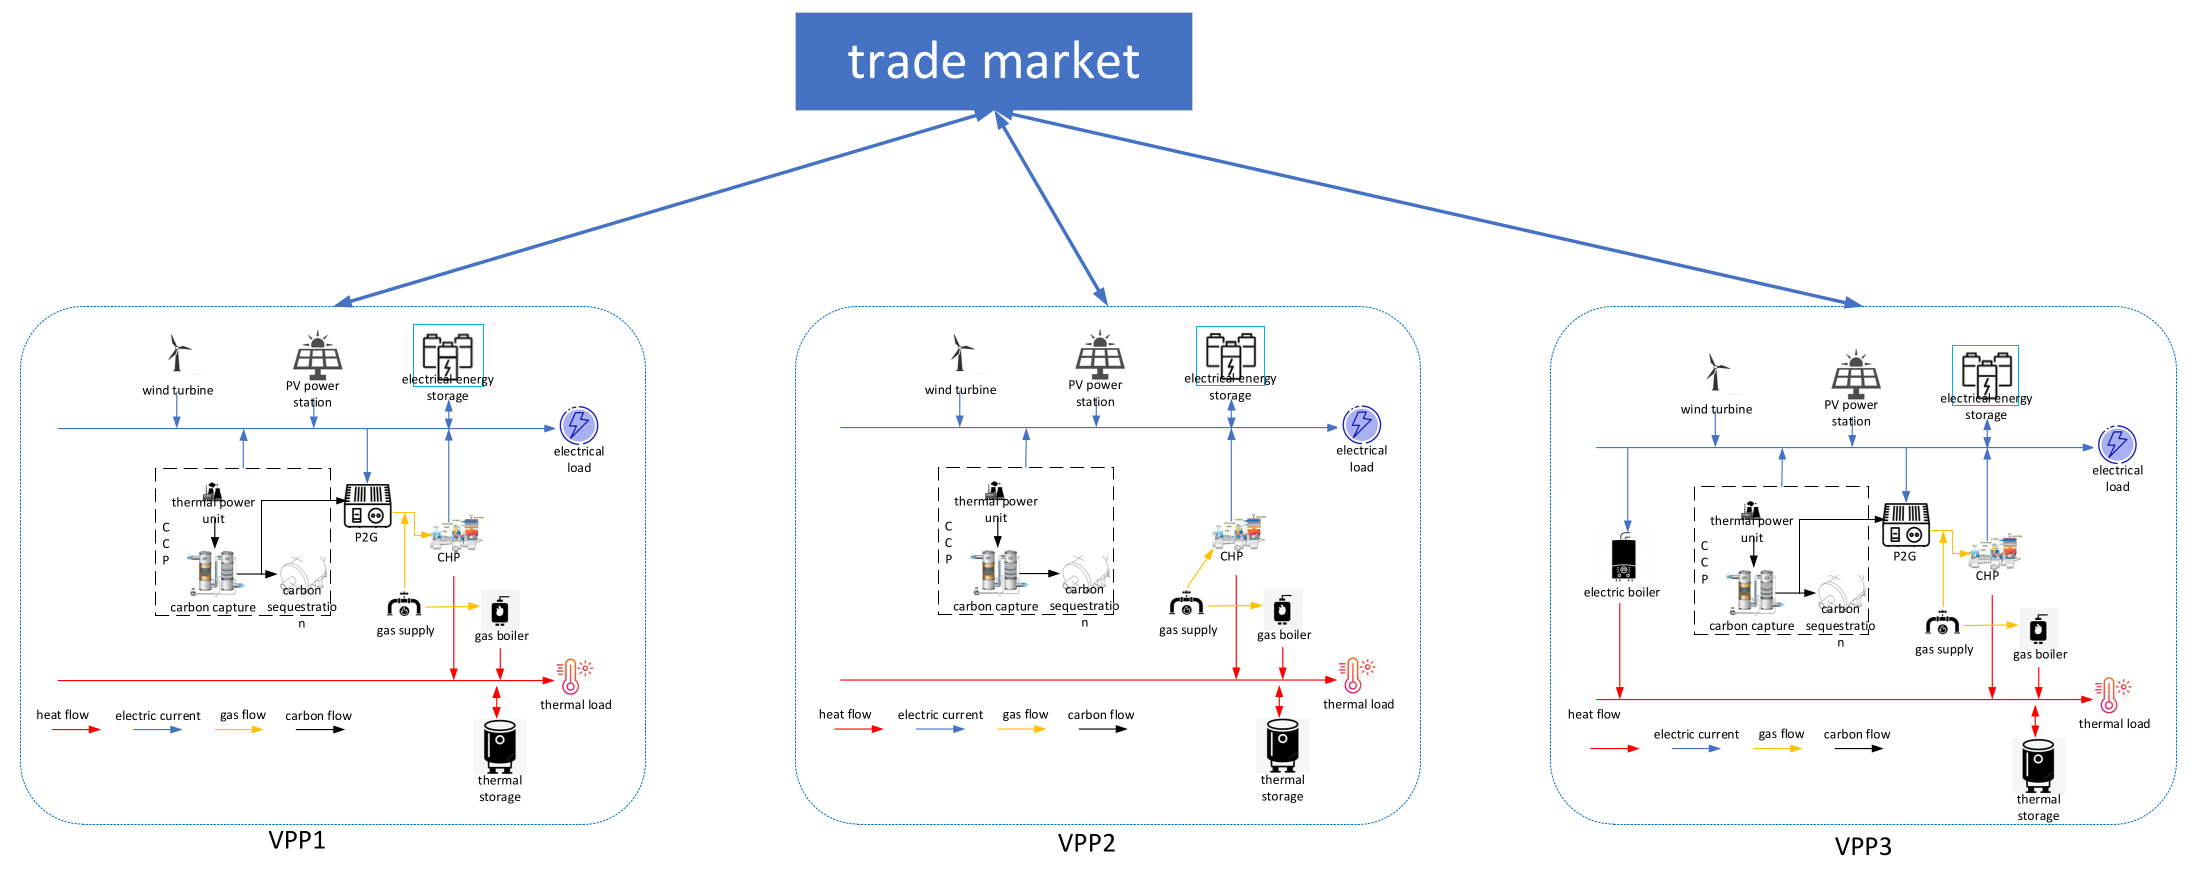
The virtual power plant model of the present invention mainly consists of a carbon capture power plant, a combined heat and power unit (CHP), a new energy generation unit, electric storage, and other devices. Through the carbon capture system, carbon dioxide emissions can be reduced more effectively within the virtual power plant. The structure diagram is shown below. The interaction between virtual power plants is shown in
Figure 3.
3.1. New Energy Output and Load Forecasting for Virtual Power Plants
This invention adopts the Latin Hypercube Sampling (LHS) method for scenario generation to address the uncertainty of new energy output and load forecasting. Compared with the Monte Carlo method, LHS can cause the generated scenarios to have a stratified distribution, and the data distribution is more extensive. The K-means method based on the particle swarm algorithm is then applied to reduce the scenarios to obtain the predicted values.
3.1.1. Based on LHS Scene Generation
As a method based on the principle of stratified sampling, LHS has the characteristic of spreading the sampling points evenly in the sampling space. It implements a random sampling operation for the wind power generation data and load data in different time periods of a day, firstly, assuming that the random variables of
,
,
are input, where
,
are the forecast data of wind power generation and load in
T time periods of a day; at the same time,
,
,
are set as the inputs of any of the random variables, which results in the corresponding cumulative probability distributions as follows:
where
,
and
denote the cumulative probability distribution function of WTG generation, PV generation, and electric load, respectively, and
,
and
denote the historical load data of WTG generation, PV generation, and electric load, respectively.
The cumulative probability distribution function in the [0,1] interval is divided into N equally spaced non-overlapping spaces; N in this paper is taken as 1000 for analysis and the inverse function is obtained as:
Finally, a scenario set of scenic outputs and loads can be derived.
3.1.2. K-Means-Based Clustering Scenario Reduction
Given that the number of scenes generated by Latin Hypercube Sampling (LHS) is quite large, in order to reduce the complexity of the model computation and improve the accuracy of the computation, this paper adopts the K-means clustering method to perform the scene reduction work, which has the significant features of lower complexity and fewer input parameters. Firstly, a specific scene set is set, and the target scene tree is set to , the specific steps are as follows:
First of all, select number of scenes as cluster centers, set the set of cluster centers as and as the sth initial scene cluster center.
Determine the number of remaining scenes according to the set of cluster centers , and calculate the distance of the remaining scenes to the cluster centers , is the remaining scene data, is the cluster center data.
According to the scene arrives at the cluster center clustering distance will be the remaining cluster center classified with the nearest cluster center, and again clustering to get the set of , where is the set of similar scenes.
Update the cluster center, assuming that there are scenes in the scene clustering , calculate the sum of the distances between each scene and the other scenes as for the other scene data, for the cluster center data, and select for the scene as the new cluster center.
Repeat steps 2, 3 until the cluster centers and cluster centers no longer change and scene cuts stop.
3.2. Virtual Power Plant Internal Model
3.2.1. CHP Unit Modeling
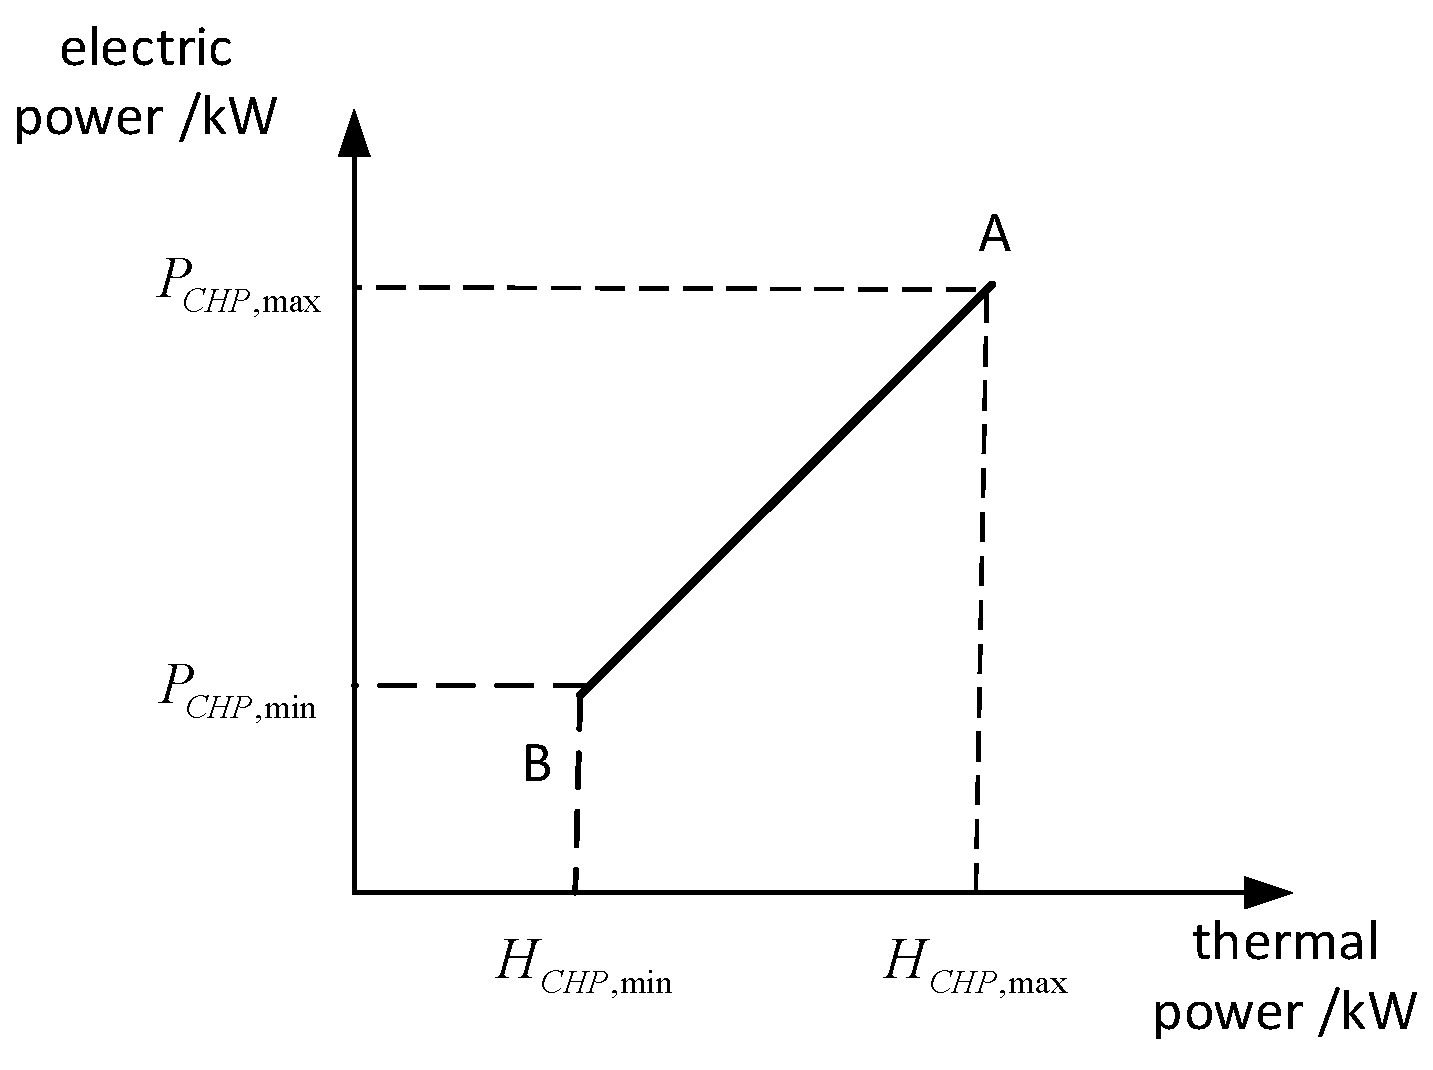
In this paper, the common back-pressure cogeneration unit is mainly selected as the simulation operation object, and its model is shown in
Figure 4 and Equation (7).
The mathematical expression for a gas turbine is as follows:
where
and
are the electrical and thermal outputs of the CHP unit of virtual power plant
l at time
t, respectively;
and
are the electrical and thermal efficiencies of the CHP unit of virtual power plant
l, respectively;
is the natural gas consumed by the CHP unit of virtual power plant
l at time
t;
and
are the minimum and maximum values of the CHP electrical power of virtual power plant
l, respectively;
and
are the lower and upper bounds on the thermal power generated by CHP in virtual power plant
l, respectively;
and
are the upper and lower bounds on the creep of the CHP thermal power of virtual power plant
l, respectively.
and
are the upper and lower limits of
CHP unit electric power creep for virtual power plant
l; and are the upper and lower limits of CHP thermal power creep for virtual power plant
l, respectively.
3.2.2. Storage Model
where
is the storage capacity of the storage device of the n storage in the virtual power plant
l storage device at time
t;
is the loss rate of the virtual power plant
l storage energy itself;
are the charging and discharging efficiency of the virtual power plant
l storage energy, respectively;
are the charging and discharging power of the virtual power plant
l storage energy, respectively;
are the charging and discharging of the virtual power plant
l storage energy device with the value of the state variable of {0,1}, respectively;
are the upper and lower bounds of the capacity of the virtual power plant
l storage energy, respectively,
are the upper and lower limits of the energy storage capacity of virtual power plant l; are the upper and lower limits of the charging and discharging power of virtual power plant
l, respectively.
3.2.3. New Energy Unit Output Constraints
where
is the actual power output value of virtual power plant
l wind turbine at time
t;
is the predicted power output value of virtual power plant
l wind turbine at time
t;
is the actual power output value of virtual power plant
l photovoltaic power plant at time
t;
is the predicted power output value of virtual power plant
l photovoltaic power plant at time
t.
3.2.4. Thermal Power Unit Output Constraints
where
is the electrical output of virtual power plant
l thermal unit at moment
t;
and
are the upper and lower limits of the output of virtual power plant
l thermal unit, respectively;
and
are the upper and lower limits of the climbing output of virtual power plant
l thermal unit, respectively.
3.2.5. Interaction Constraints with Electricity and Gas Networks
where
and
are the electric power purchased and sold by virtual power plant
l in the electric energy trading platform at time
t;
and
are the upper limit of the electric power purchased and sold by virtual power plant
l in the electric energy trading platform;
and
are the state variables for the interactive power of the virtual power plant in the electric energy trading platform with the values of {0,1}, respectively.
is the natural gas purchased by virtual power plant
l from the gas grid at time
t;
is the upper limit of natural gas purchased by virtual power plant
l from the gas grid.
3.2.6. Gas Boilers
The gas boiler provides thermal power to the VPP with the following mathematical expression:
where
is the thermal power output of the gas boiler at the time of
;
is the natural gas power input to the gas boiler at the time of
;
is the thermal power conversion efficiency of the gas boiler;
are the upper and lower limits of the thermal power output of the gas boiler;
are the upper and lower limits of the natural gas creep input to the gas boiler, respectively.
3.2.7. Carbon Capture Power Plants-Electricity to Gas
Carbon Capture Device
Carbon capture device power consumption consists of fixed power consumption and operational power consumption, which is modelled as shown below.
where
is the energy consumption per unit of carbon dioxide captured;
is the amount of carbon dioxide captured by the carbon capture device in the virtual power plant
l at time
t;
is the power consumption of the carbon capture device in the virtual power plant
l at time
t;
is the fixed energy consumption of the carbon capture device; and
is the total power consumption of the carbon capture device in the virtual power plant
l at time
t.
Thermal Power Unit
In this invention, the thermal power plant plays a dual role: it is a major contributor to carbon emissions, and it is also the energy source that drives the carbon capture system. The power generated by the unit is split into two streams: one for the advanced carbon capture unit (ACCU), which captures and processes carbon dioxide to reduce environmental impacts; and the other for the other modules of the virtual power plant.
where
is the exhaustive power output of the thermal unit of virtual power plant
l at time
t.
P2G Devices
Power-to-gas (P2G) plants are a key part of carbon dioxide processing, efficiently converting carbon dioxide into methane, a gas turbine feedstock for power generation. The methanation reaction, in which the volume of carbon dioxide consumed versus methane produced is 1:1, requires the addition of equilibrium constraints, as shown in the equation below:
where
is the energy consumption of the P2G unit of virtual power plant
l in generating methane gas at time
t,
is the P2G conversion efficiency of virtual power plant
l;
is the power of virtual power plant
l in generating methane at time
t,
is the amount of carbon dioxide consumed by methanation of virtual power plant
l at time
t,
is the density of carbon dioxide,
is the calorific value per unit of methane,
is the calorific value per unit of electricity converted, and
is the amount of carbon dioxide sequestration in virtual power plant
l at time
t of the virtual power plant.
The virtual power plant’s power in the present invention is mainly supplied by CHP cogeneration units, carbon capture power plants, and new energy outlets, while the CHP units supply thermal energy.
where
is the electrical load of virtual power plant
l.
where
is the heat load of virtual power plant
l.
3.3. Carbon Trading
Carbon trading is mainly through the carbon trading platform to exchange carbon quotas to obtain the corresponding profit; the present invention works through blockchain technology to achieve virtual power plant cross-chain trading, not only to ensure the interaction between the virtual power plants, but also to improve the security of the transaction.
The main sources of carbon emissions in virtual power plants are mainly generated by conventional thermal power units and gas turbines, which produce carbon dioxide in the process of power generation, and the invention applies the government baseline method for carbon allowance allocation.
where
is the carbon emission allowance of the virtual power plant
l at the time of t,
is the carbon emission allowance obtained by the CHP unit for electricity supply,
is the carbon emission allowance obtained by the CHP unit for heat supply,
is the carbon emission allowance obtained by the coal-fired unit of the carbon capture plant for electricity supply, and
is the carbon emission allowance obtained by the unit of the gas boiler for heat supply.
Actual carbon emissions from virtual power plants can be expressed as:
where
is the actual carbon emissions of virtual power plant
l at the time of
t,
is the actual carbon emissions of CHP unit of electricity generation,
is the actual carbon emissions of CHP unit of heat generation,
is the actual carbon emissions of carbon capture power plant of virtual power plant
l,
is the carbon emissions of purchasing unit of electricity from the grid, and
is the carbon emissions of a gas boiler unit of heat supply.
Then the virtual power plant carbon trading cost can be expressed as:
where
is the carbon trading cost of virtual power plant
l, and
is the carbon trading price.
Carbon trading prices are mainly determined by supply and demand in the trading market and can be expressed as follows:
where
and
denote the coefficient of variation of carbon trading tariffs, respectively.
3.4. Green Certificate Trading Model
In order to encourage new energy generation, governments have proposed the new energy quota methodology, which favors new energy consumption on the one hand and new energy generation on the other. For the concept, the idea of green certificate trading was proposed. It is assumed that when a new energy-generating unit produces one unit of electricity, it can obtain one unit of green certificate.
The number of green certificates that can be sold for new energy output units
for:
where
is the green certificate quota factor.
The number of green certificates to be purchased for a conventional generator set can be expressed as:
As the green certificate trading price is affected by the green certificate trading price, the trend of the green certificate price change is represented through a linear representation.
where
and
denote the coefficient of variation of the price of green certificates, and
is the market price of green certificates.
3.5. Electricity Market
As with the carbon and green certificate trading markets, electricity market prices are subject to market changes and show a linear trend. This is shown below.
where
and
denote the coefficient of variation of the electricity transaction price, and
denotes the electricity transaction price.
(1) Objective function
The present invention aims to minimize the operating costs of the virtual power plant, which comprises carbon trading costs, green certificate trading costs, electricity trading costs, and internal operation and maintenance costs of the virtual power plant.
where
is the maintenance cost of electric energy storage in virtual power plant
l;
is the maintenance cost of a new energy unit in virtual power plant
l;
is the cost of purchased natural gas in virtual power plant
l;
is the fuel cost of a thermal power unit in virtual power plant
l.
- (1)
Green certificate transaction costs:
- (2)
Energy storage maintenance costs:
where
is the maintenance cost factor for virtual power plant
l electric energy storage.
- (3)
Fuel costs for thermal power units:
where
,
,
are fuel cost coefficients for thermal power units.
- (4)
Gas purchase costs:
where
is the price of natural gas.
- (5)
Maintenance costs of new energy units:
where
and
are the maintenance cost coefficients of the PV and WT units of the virtual power plant
l, respectively.
- (6)
Electricity transaction costs:
4. Example Analysis
In order to verify the validity of the model developed in this paper, the VPP system in the paper includes a wind turbine, a PV plant, a CHP unit, a carbon capture power plant, a gas boiler, and an electric-to-gas conversion unit, and it also includes thermal and electric energy storage devices. The data for each equipment is shown in
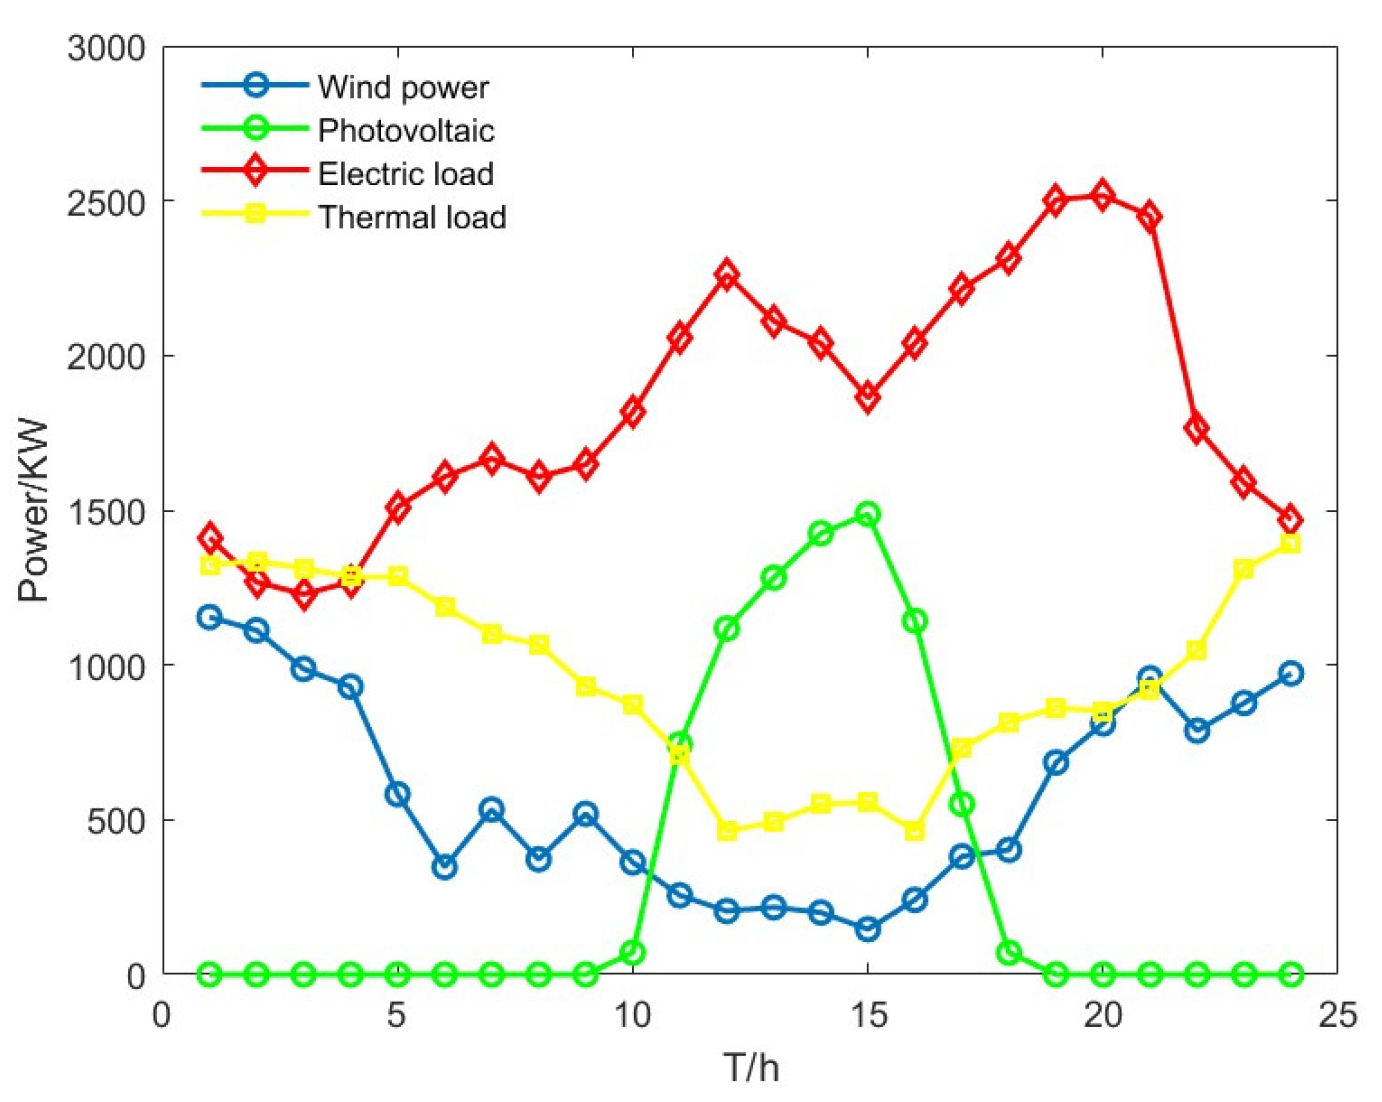
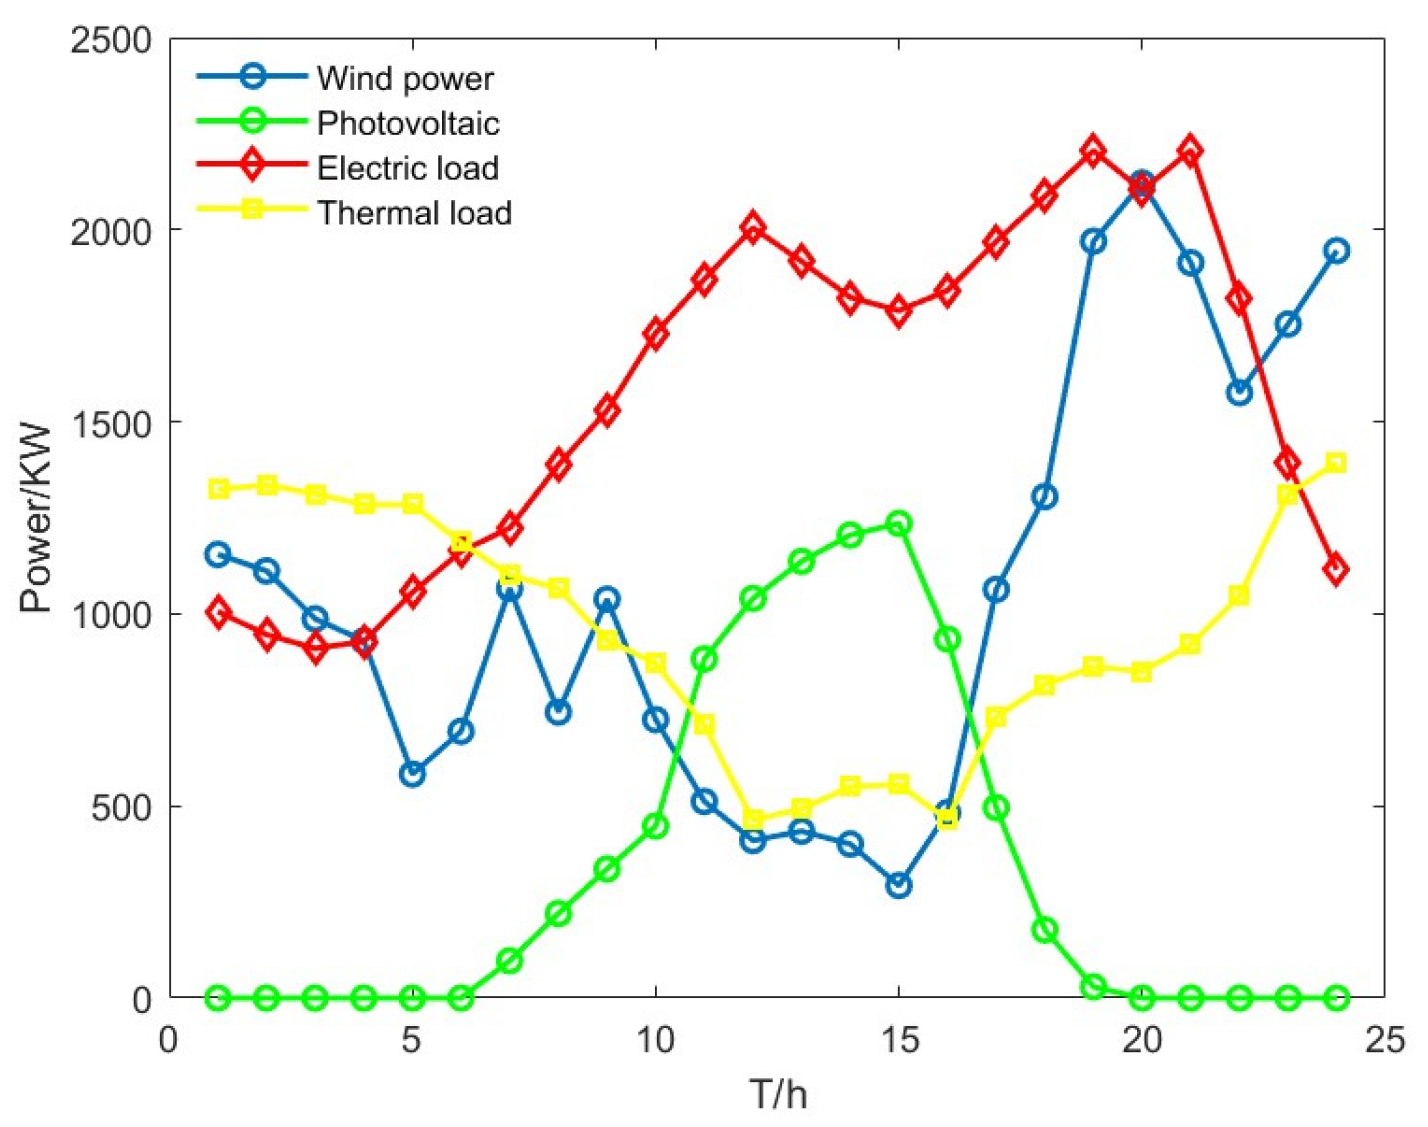
Table 1. In this paper, three virtual power plants are selected for analysis, the parameters of each model in these virtual power plants are consistent, virtual power plant 2 is less than virtual power plant 1 than an electric to gas device, virtual power plant 3 is more than virtual power plant 1 than an electric boiler, its wind and light output and load data are shown in
Appendix B. where
Table 2 shows the time-of-day electricity prices for interaction with the main grid and
Table 3 shows the time-of-day gas prices for interaction with the gas grid. The energy meanings of the letters in the formulas are shown in the table in
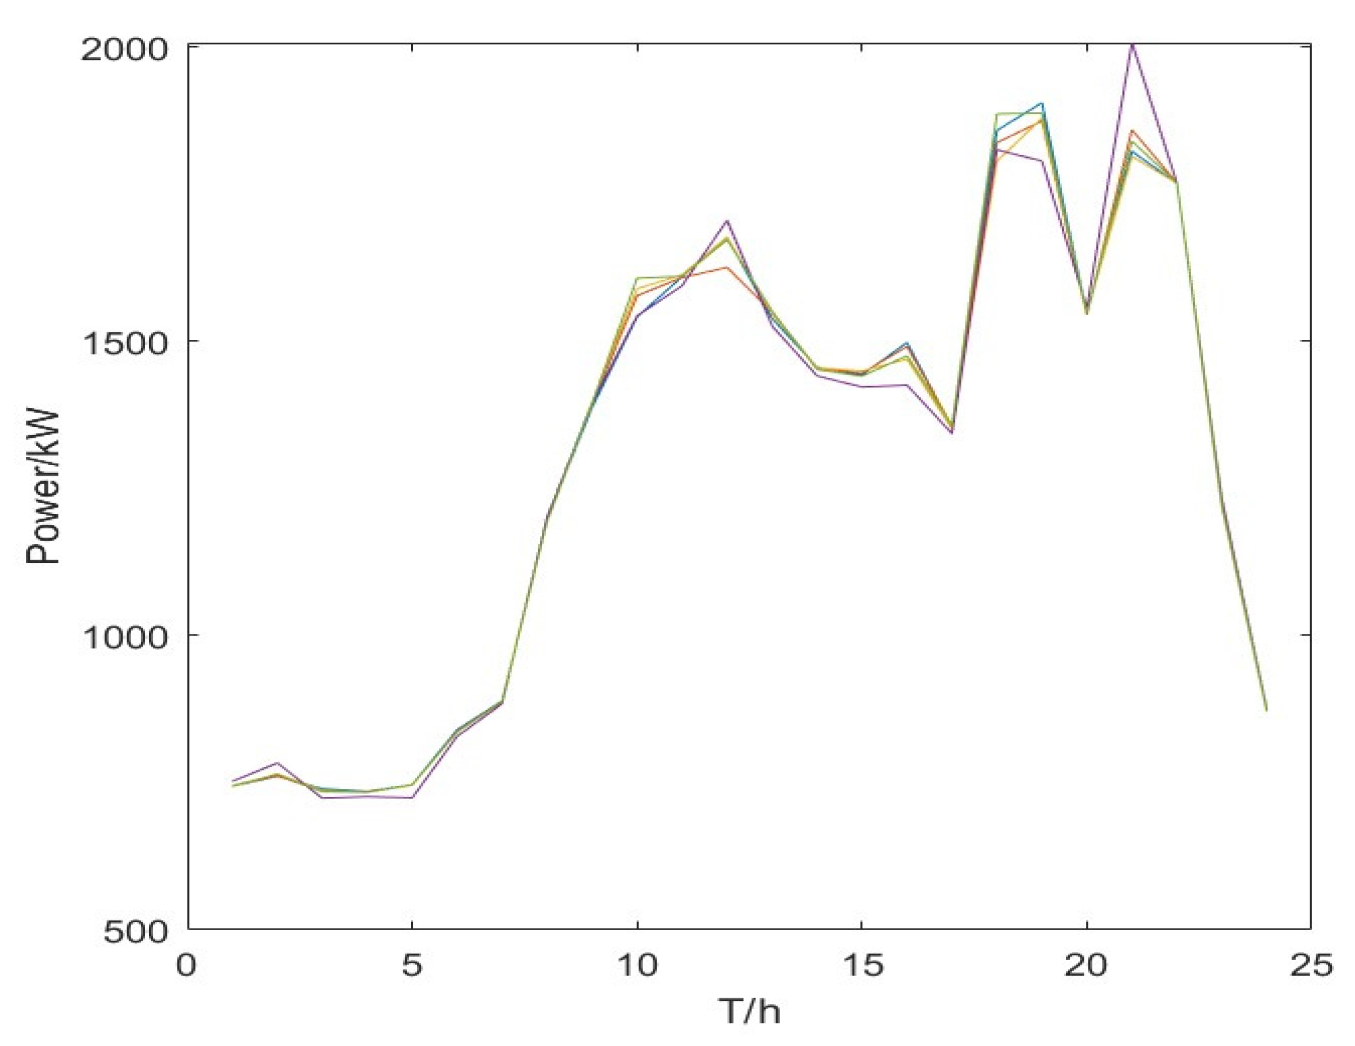
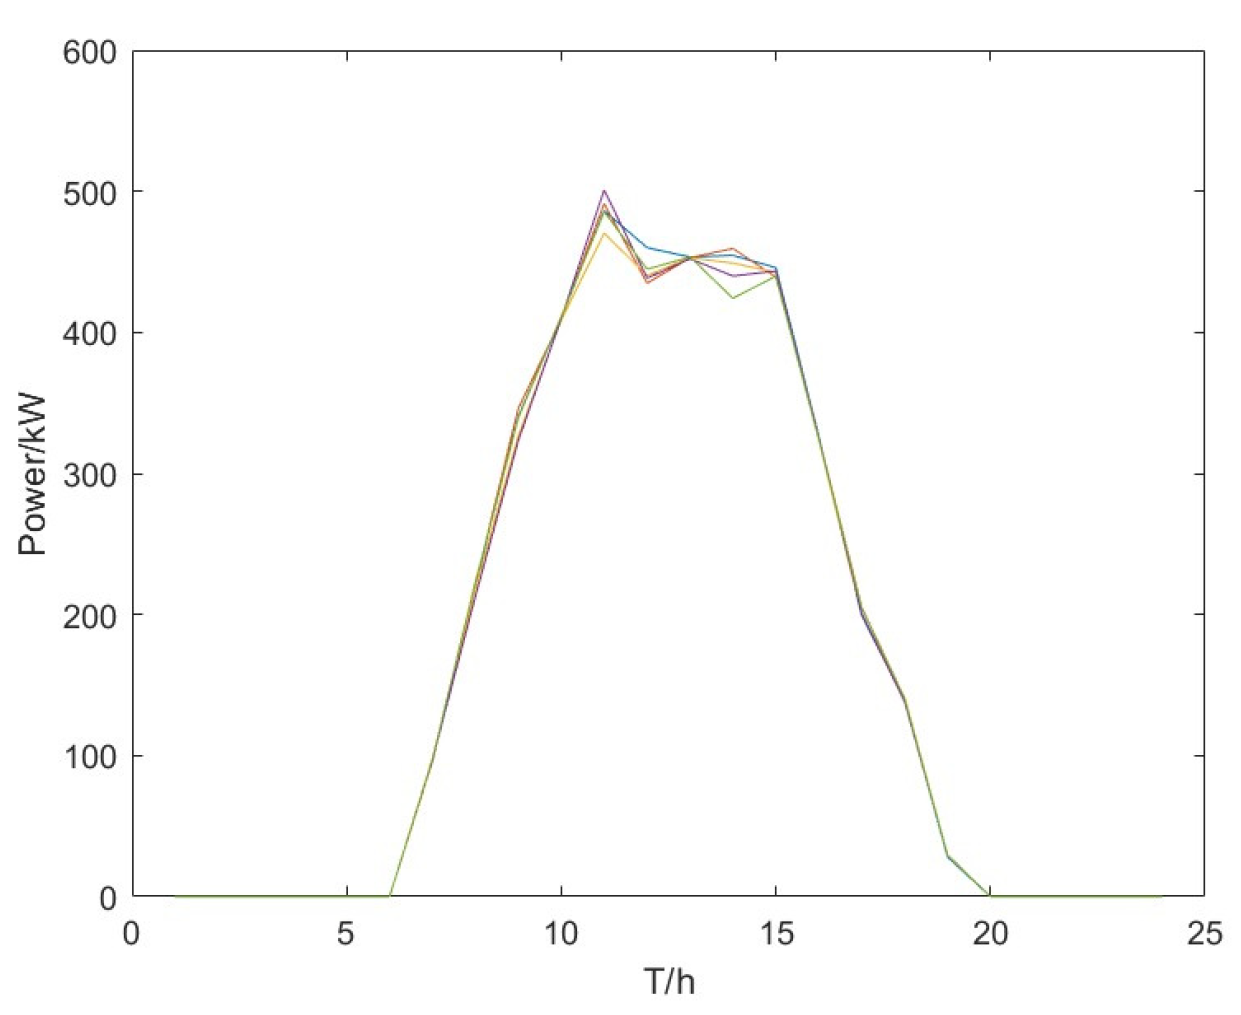
Appendix A. The new energy output and load data of Virtual Power Plant 2 and Virtual Power Plant 3 are shown in
Figure A1 and
Figure A2 of
Appendix B.
4.1. New Energy Output and Load Forecast
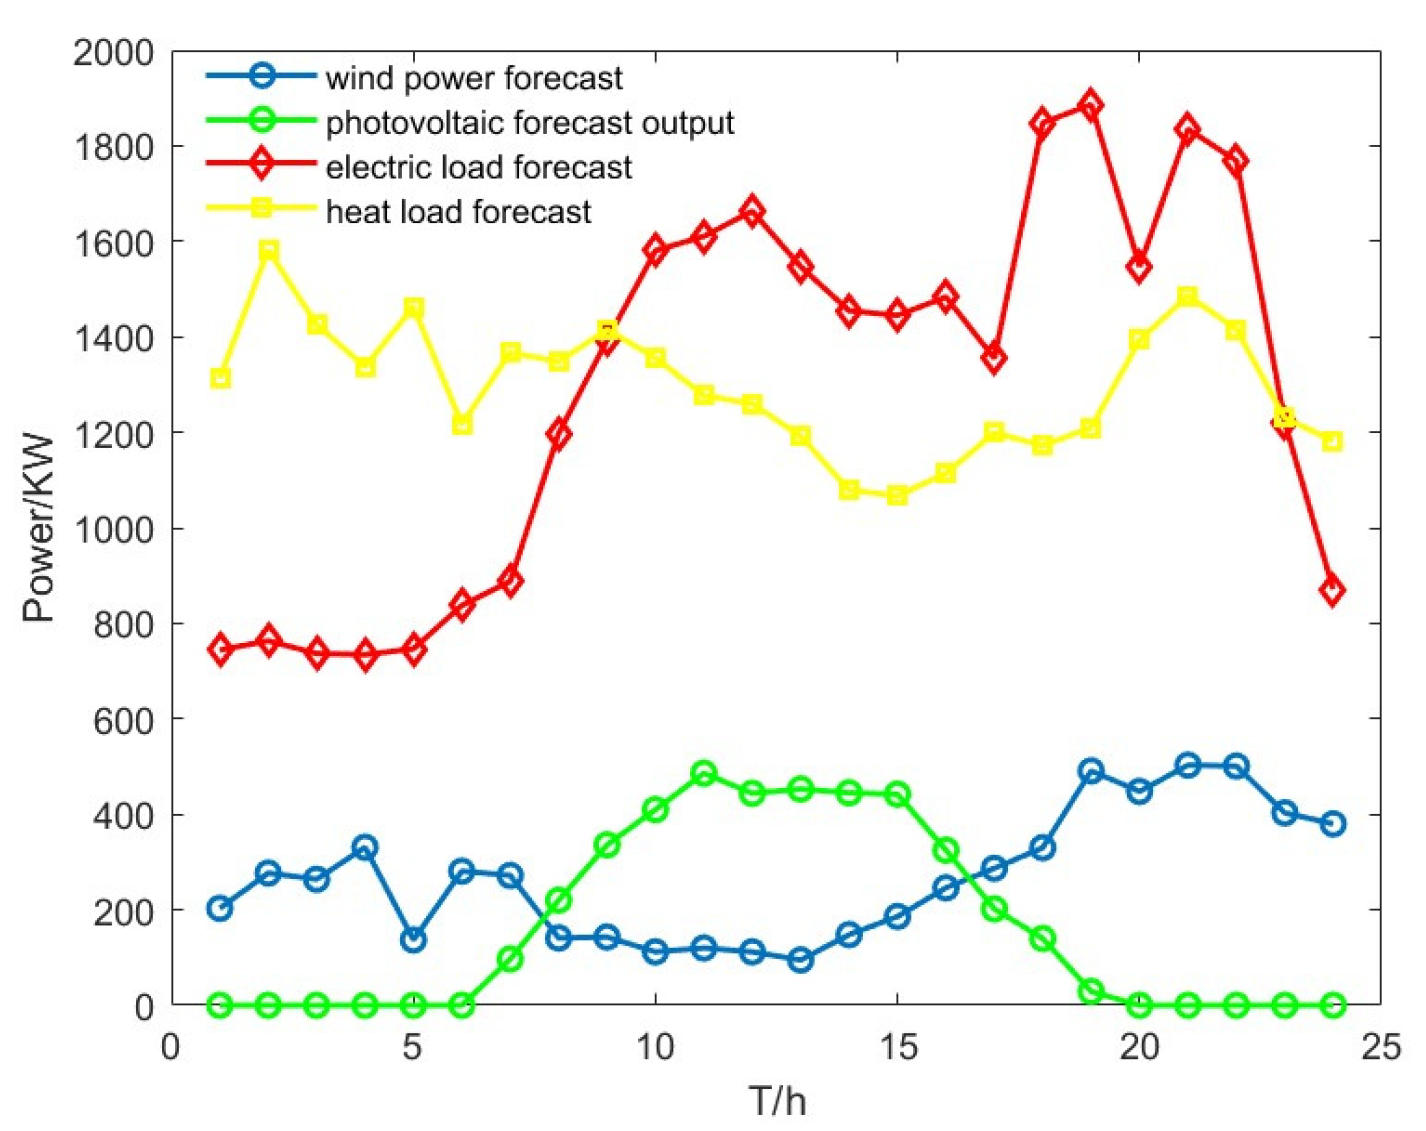
This article has taken the example of virtual power plant 1, based on the new energy output data is less, first of all, we use super Latin cube sampling to generate 500 scenarios for new energy output and load, and then we use K-means clustering to obtain 5 typical scenarios to predict and analyze the new energy output according to the proportion of the typical scenarios. The prediction results are shown in
Figure 5,
Figure 6 and
Figure 7. The percentages of the five categories of wind power and load scenarios are shown in
Table 4.
The weighted summation of the above scenarios yields the new energy forecast and load forecast map of this paper, as shown in
Figure 8 [
27,
28].
4.2. Comparative Analysis of Uncertainty Methods
For comparison, in this paper, virtual power plant 1 is analyzed for new energy output and load uncertainty analysis. This paper verifies the validity of the model by setting up three scenarios. Scenario 1 is generated by the Monte Carlo method for the scenario and clustered by K-means, Scenario 2 is a robust model for uncertainty analysis, and Scenario 3 is the analytical model of this paper. This result is shown in
Table 5.
This study evaluates the operational performance of a virtual power plant under three scenarios. Scenario 1 (Monte Carlo + K-means clustering) yields a total cost of 17,186.45, 1.54 tons of carbon emissions, and 97.24% renewable energy utilization. Scenario 2 (robust model) exhibits the highest total cost (17,864.78) but achieves the lowest carbon emissions (1.41 tons) and the highest renewable energy utilization (98.86%). Scenario 3 (proposed model) demonstrates the lowest total cost (16,953.49), with carbon emissions (1.43 tons) and renewable energy utilization (98.75%) close to Scenario 2. The results indicate that Scenario 3 reduces total costs by 4.9% (compared to Scenario 2) and carbon emissions by 7.1% (compared to Scenario 1), while improving renewable energy utilization by 1.51% over Scenario 1, thereby validating the superiority of the proposed model in balancing economic and environmental objectives.
4.3. Comparative Analysis of Operating Results
In order to fully analyze this paper’s electric carbon and green certificate trading model, this paper sets up four scenarios to be analyzed. Scenario 1 is the virtual power plant operation model without considering carbon trading and green certificate trading. Scenario 2 is the virtual power plant operation model considering only carbon trading. Scenario 3 is a virtual power plant operation and trading model that only considers green certificate trading. Scenario 4 is the green certificate trading model proposed in this paper, which contains carbon and green certificate trading. The results of the trading scenarios for each of the different types of markets are shown in
Table 6.
Scenario 2 compared with Scenario 1: After introducing the carbon market mechanism, by adjusting the unit mix and power allocation, the carbon emission intensity is reduced to 1.51 tons per 10,000 CNY, which is 8.5% lower than Scenario 1, and the new energy consumption rate is increased to 93.45%. However, the cost of carbon trading reaches RMB 1875.46, which increases the total cost to RMB 14,576.47. Scenario 3 compared with Scenario 1: When implementing green certificate trading alone, the virtual power plant obtains green certificate income by increasing the proportion of new energy generation, and the rate of new energy consumption is further increased to 96.23%, but the carbon intensity is still 1.54 tons/10,000 CNY. Although the revenue of 104.7214 million CNY from green certificate trading partially offsets the cost, the total cost is still as high as 150.7418 million CNY. Scenario 4 of the model proposed in this paper, through the synergistic optimisation of carbon trading and green certificate trading, achieves the remarkable effect of “double reduction and one increase”. The carbon emission intensity is reduced to 1.43 tons/10,000 CNY compared with Scenario 1, the rate of new energy consumption breaks through 98% to reach 98.75%, and at the same time, 1838.25 CNY of revenue is gained through carbon trading. Although the income from electricity trading decreases (38.218 million CNY), the total cost is controlled at 169.5349 million CNY by the comprehensive income, which achieves the Pareto improvement of environmental and economic benefits. Through the design of multi-market coupling, the model in this paper has significant advantages in environmental benefits and new energy consumption, which provides theoretical support and practical reference for virtual power plants to participate in a low-carbon power system.
4.4. Analysis of Operational Results
4.4.1. Operational Impact of Quota Factors
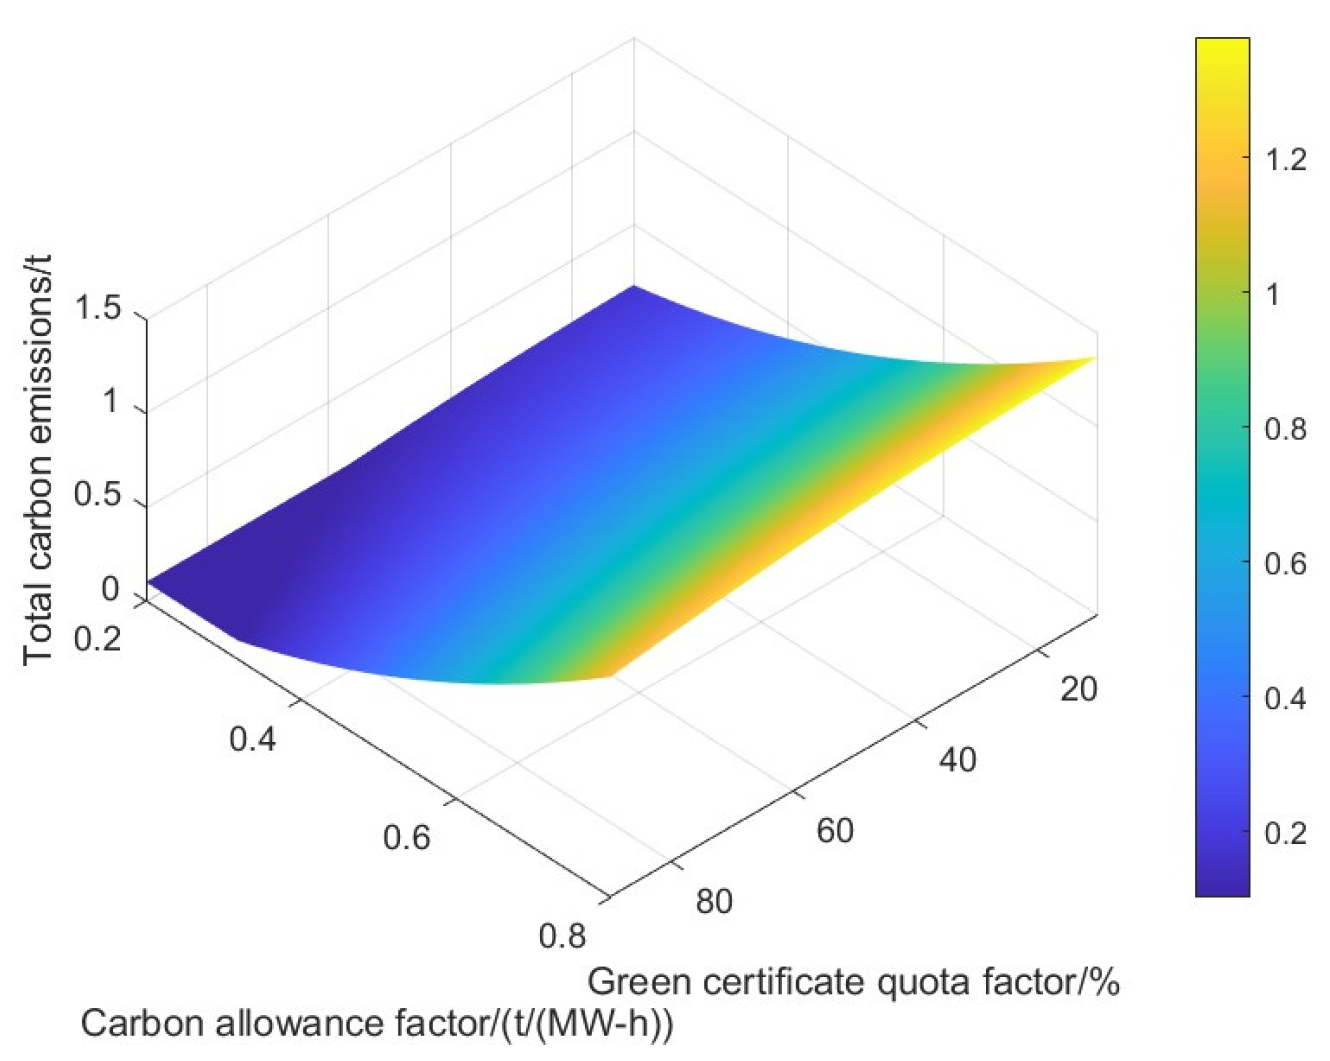
In this subsection, in order to explore the influence of carbon quota coefficient and green certificate quota coefficient on the operation results, the carbon quota coefficient is taken as 0.1~0.8, with a step size of 0.1; the green certificate quota coefficient is taken as 10 percent~90 percent, with a step size of 5 percent, which results in the changes in carbon emissions under different quota coefficients, as shown in
Figure 8.
From
Figure 9, it can be seen that when the carbon quota coefficient decreases when high-emission units of coal-fired units need to buy more carbon allowances, in order to reduce the operating costs of generating units can only be reduced through the reduction of power generation to reduce the cost, and therefore the ensuing overall decline in carbon emissions. When the green certificate quota coefficient increases, the new energy consumption rate increases and carbon emissions decrease.
4.4.2. Analysis of System Operation Results
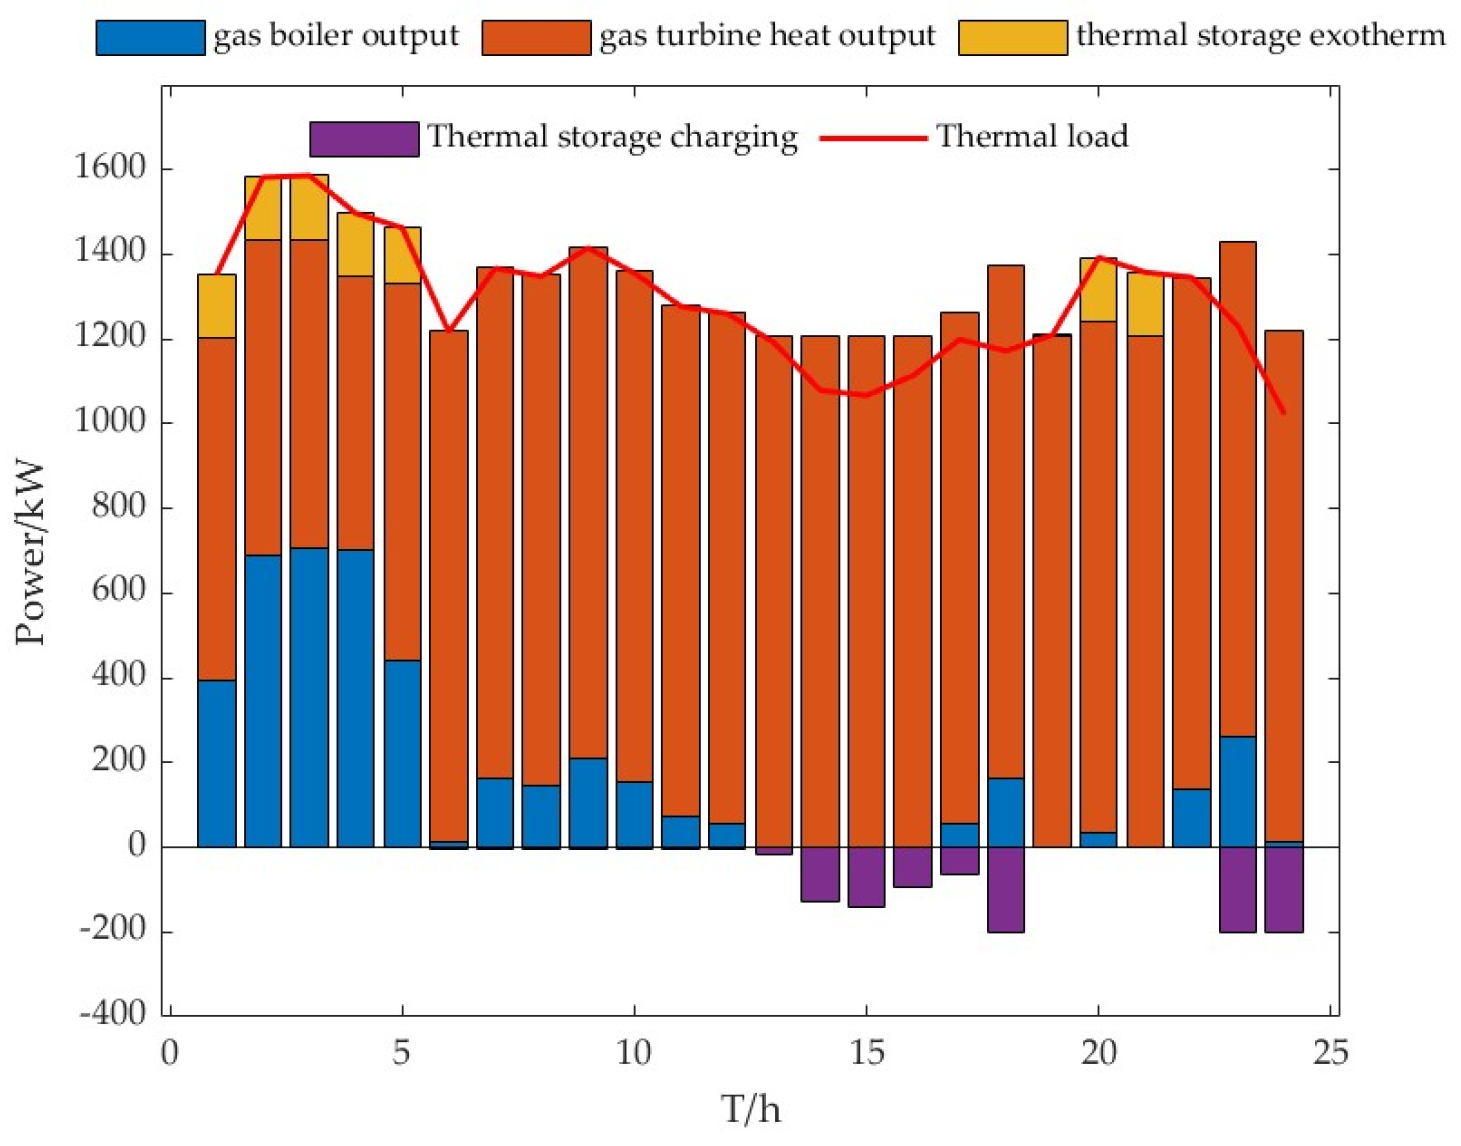
In this paper, the carbon quota coefficient is taken as 0.25, and the green certificate quota coefficient is 80%. The analysis of its operation results is shown in
Figure 10. In the 0–5 time period of grid operation, the electricity price is low and the wind turbine generates a large amount of electricity, so the energy storage is charged at this moment, and at this time, the thermal power demand is more gas turbine to provide thermal power, thermal energy storage is discharged, the gas boiler and gas turbine to provide thermal power demand, and in the peak time 6–12 h the system will be sold to gain revenue from the electricity, and at the same time, the electric storage is discharged at this time, and at this time, the thermal storage is discharged. During the peak hours of 6–12, the system sells the power for profit, and the storage is discharged during this time, while the thermal power demand of the virtual plant decreases during this time, and the storage is recharged. During the usual hours 13–16, the electric storage is charged to cope with the arrival of the next peak hour, and during the evening peak hours 17–22, the electric storage is discharged to support the power, while the thermal demand is constantly having more thermal storage for heat discharge. The power and heat power balance operation diagram is shown in
Figure 10 and
Figure 11.
4.5. Interaction Analysis Between Different Virtual Power Plants
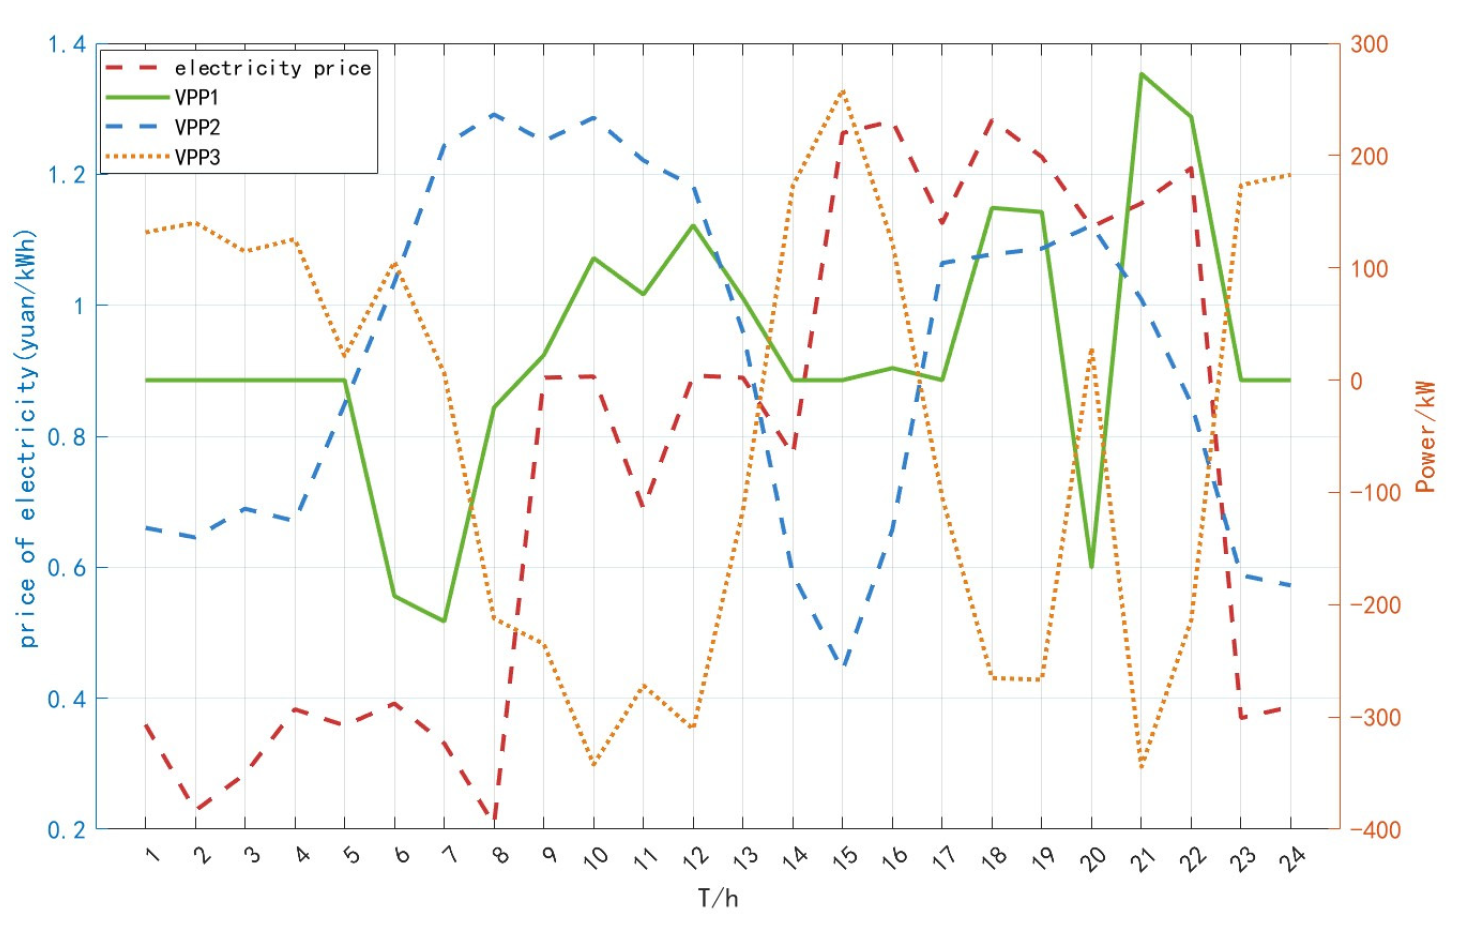
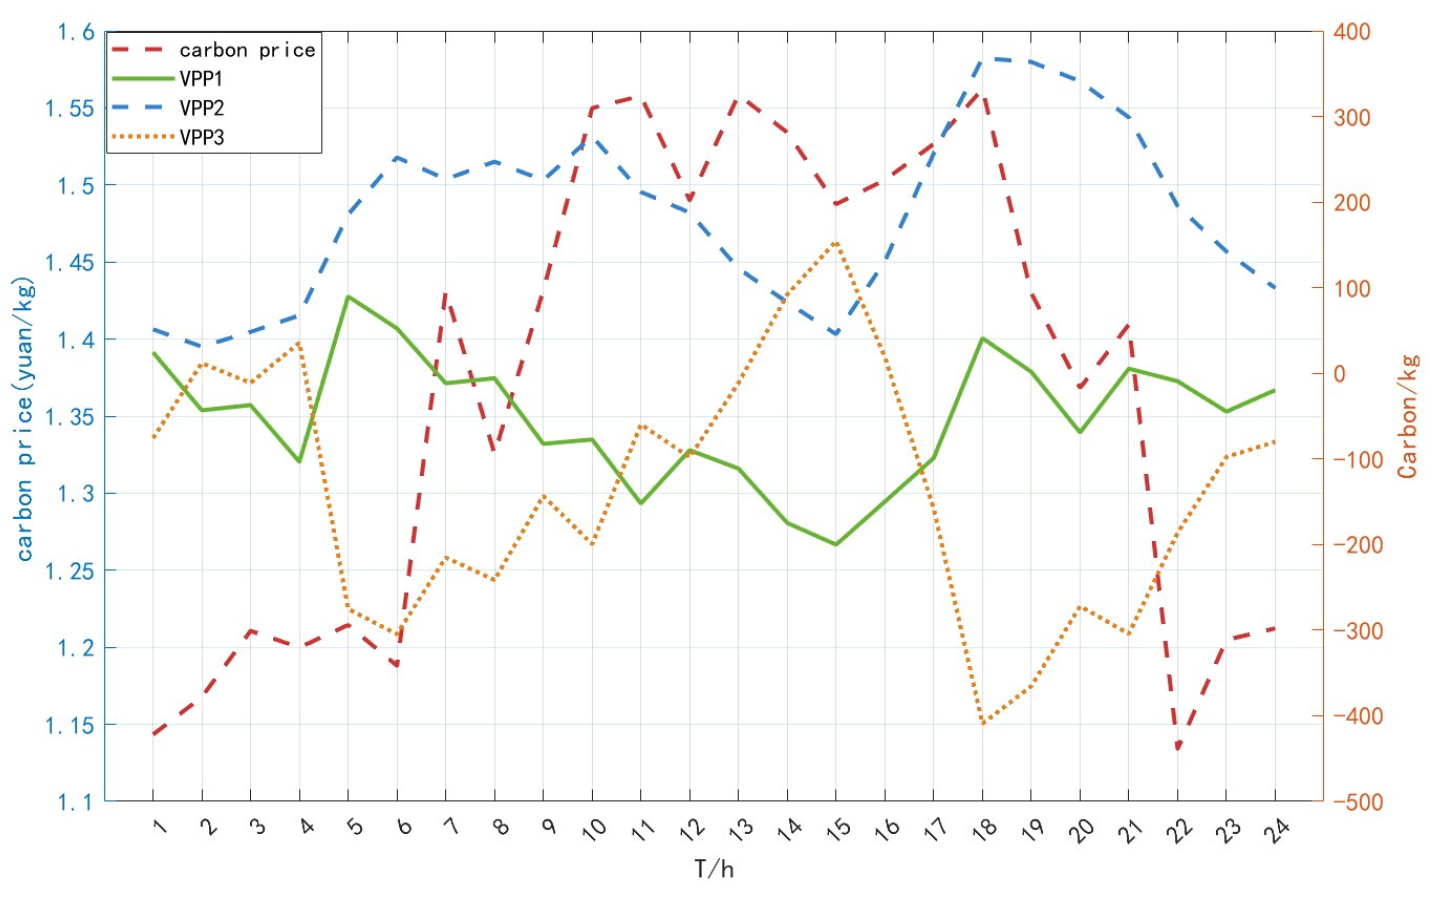
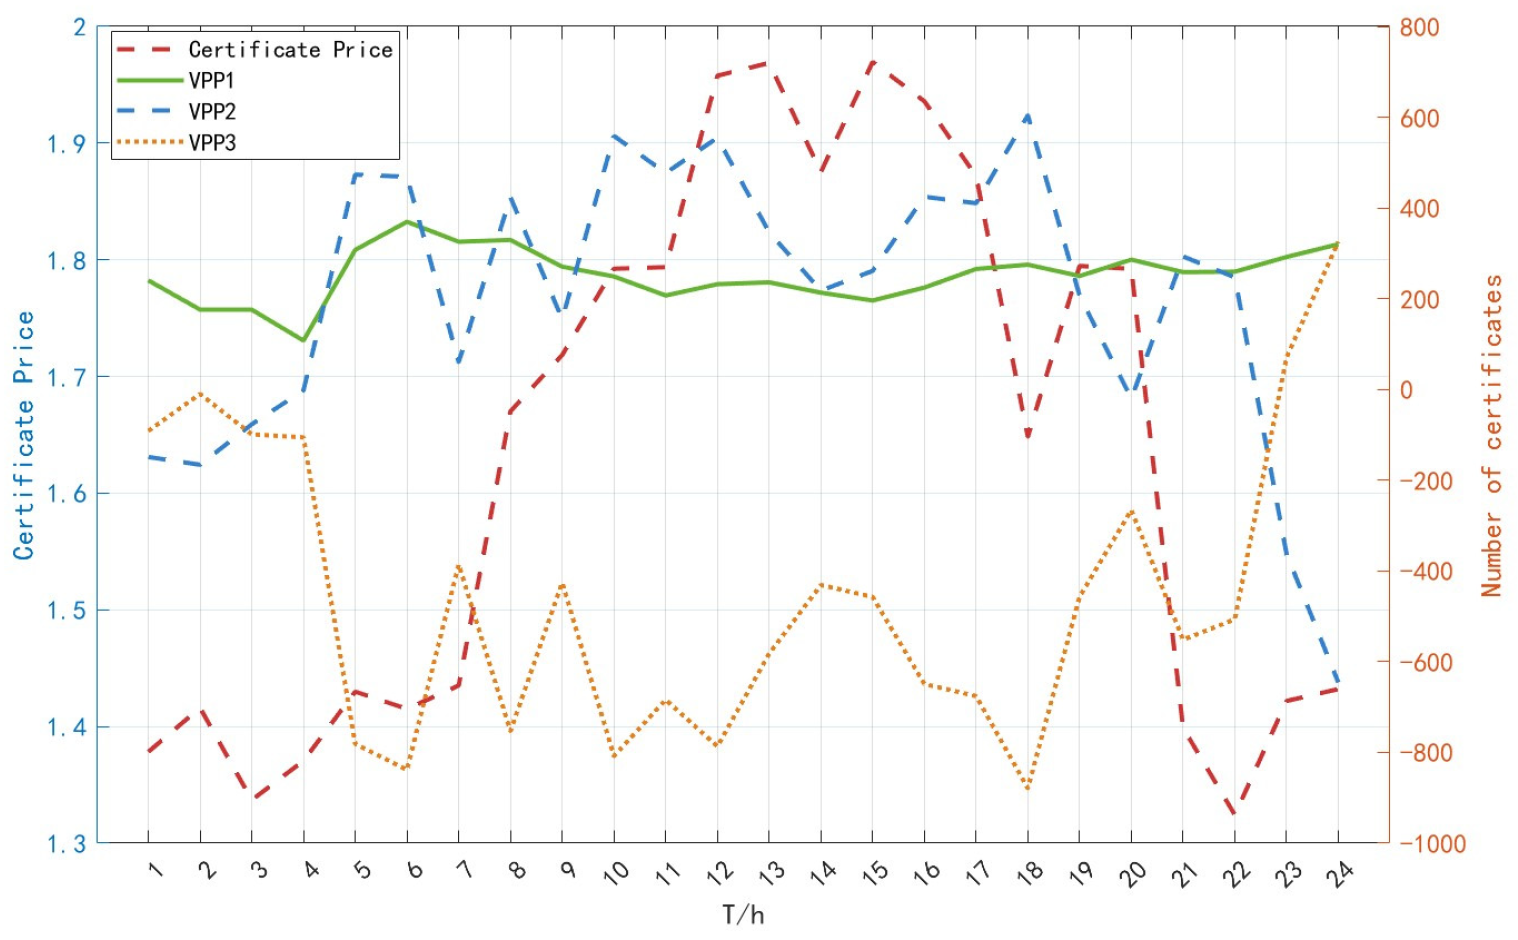
In order to fully analyze the interaction between different virtual power plants through the blockchain, this paper introduces three virtual power plants for analysis, and the electricity/carbon/green certificate interaction is shown in
Figure 12,
Figure 13 and
Figure 14.
As shown in
Figure 12, virtual power plant 1 and virtual power plant 2, due to the new energy output compared to virtual power plant 3, is less when the peak hours of new energy output and traditional output can not provide sufficient support, so in the peak hours more enery is purchased, and virtual power plant 3 sells power to gain revenue.
As shown in
Figure 13, the carbon price increases with the arrival of peak electricity consumption, while carbon allowances are mainly rationed for conventional units to generate electricity, although the virtual power plant 1 and virtual power plant 2, due to the new energy output, is less compared to virtual power plant 3, but when the gas turbine pollution uses less units to generate electricity, it rewards a portion of the carbon allowances, so compared to virtual power plant 3, its carbon sale quantity is more.
As shown in
Figure 14, the price of green certificates is positively correlated with electricity consumption. To increase new energy consumption, virtual power plant 1 and virtual power plant 2, due to the new energy output being less compared to virtual power plant 3 and virtual power plant 1’s new energy output is much smaller than the traditional unit output, so virtual power plant 1 mainly buys from the green certificate market, while virtual power plant 3’s new energy installed capacity is large, which is mainly based on the sale of green certificates.
