1. Introduction
Emissions from reciprocating engines, used in any kind of propulsion or operation, are one of the main components of the air pollution problem. The continuous increase in the number of existing and operational engines is a worrying fact despite the efforts that have been made from time to time to reduce the emission of pollutants from engines. At the beginning of the 20th century, the problem of pollutant emission was not so much of a concern because of the few cars that existed at that time. However, as technology developed, so did the number of engines in use, causing the problem to take on alarming proportions. In addition, today’s rising fuel prices necessitate the use of alternative fuels, which come from renewable sources, that should be used instead of conventional fuels. Therefore, it is now essential to develop technologies that enable the use of alternative fuels, ex. biofuels, in both newly designed and existing piston ICE engines, without requiring any major structural modification in the design of the engine [
1,
2,
3]. Biofuels derived from agricultural products, which are naturally oxygenated, can help reduce dependence on fossil fuel imports and typically produce lower exhaust emissions. Among these, alcohol-based fuels, such as ethanol, might have better outcomes, if used as full replacements for conventional gasoline or diesel in reciprocating internal combustion engines [
4,
5].
The main pollutants produced by an internal combustion engine are the following: unburnt hydrocarbons (HCs), carbon monoxide (CO), carbon dioxide (CO
2), and nitrogen oxides (NOx) [
6,
7,
8,
9]. In addition, many countries, particularly in Europe, are implementing stricter legislative frameworks regarding emissions from all kinds of internal combustion engines, with the aim of increasing the quality of life for their citizens.
Unburnt hydrocarbons (HCs) are contained in the exhaust gases extracted from the combustion chamber at a rate of 1–1.5% of the fuel. About 40% of the aforementioned amount is due to the unburned components of the gasoline, while the remaining 60% owes its origin to the incomplete reactions of the fuel components. The main causes leading to the emission of unburned hydrocarbons from engines are the following: nonstoichiometric combustion; valve overlapping; carbon settlements on the walls of the combustion chambers; the presence of lubricating oil on the walls of the combustion chamber [
6,
7,
8,
9].
Carbon monoxide (CO) is an odorless, colorless, and poisonous gas produced by an internal combustion engine when it is operated with a rich air–fuel mixture, such as during acceleration and ignition. Due to the insufficient amount of oxygen, the carbon that is a component of the fuel does not fully react and turn into CO
2. The CO proportion in a spark ignition engine is in the order of 0.2–5%. It is worth noting that CO is further burned with oxygen to CO
2, providing additional thermal energy to the engine [
6,
7,
8,
9].
An internal combustion engine can produce exhaust gases with very high NOx content, based on the Zeldovich mechanism, the largest percentage of which is nitrogen oxide (NO). The release of NOx into the atmosphere is the main cause of the formation of photochemical fog, one of the most important environmental problems of the present day [
6,
7,
8,
9,
10].
Under normal conditions, carbon dioxide (CO
2) is not a harmful pollutant for the atmosphere. Nevertheless, it is the main cause of the greenhouse effect. Since carbon dioxide is the main combustion product of all hydrocarbons, the ever-increasing use of internal combustion engines leads to an exponentially increasing concentration of carbon dioxide in the atmosphere. The only way to reduce CO
2 production significantly is to reduce the consumption of hydrocarbon fuels (use of different fuels—i.e., ethanol-supplemented fuels—or the use of engines with increased thermal efficiency) [
6,
7,
8,
9].
The impact of alcohol-based fuels on the performance and emissions of internal combustion engines has been extensively studied. Much of the theoretical and experimental research has focused on ethanol [
11,
12,
13,
14,
15,
16,
17,
18,
19], while other investigations have explored the use of butanol as a primary fuel or as a blending component with gasoline. Ethanol is biodegradable, less harmful to ground water, and has a higher octane rating than gasoline, which contributes to reduced emissions [
15,
16,
17,
18,
19,
20,
21]. Numerous studies have investigated the supplementation of gasoline with ethanol in spark-ignited engines, either as a blend with gasoline or as neat fuel. A comprehensive review of the effects of ethanol/gasoline mixtures on engine performance and emissions characteristics can be found in [
11,
12,
13,
14,
15,
16,
17,
18,
19]. Despite the existing literature on the use of ethanol in reciprocating SI engines, further research is needed to expand our knowledge—particularly regarding how minor adjustments in spark timing may influence the performance characteristics and pollutant emission levels of existing light-duty gasoline engines, running under biofuels, such as ethanol-supplemented fuels, instead of gasoline. To optimize engine performance and emissions in spark ignition engines solely by experimental means can be very expensive and time-consuming. A mathematical model could provide a fast and inexpensive way for describing details of the complicated mixing, combustion, and pollutant formation processes. The need for accurate predictions of the emitted pollutants has forced researchers to develop multi-zone phenomenological and also multi-dimensional models, which are useful solutions for examining problems characterized by the need for detailed spatial information and complex interactions of many phenomena simultaneously, but are limited by computer size and cost of operation. Thus, for the present study, a commercial simulating software (i.e., GT-POWER) was chosen, where the effect of changes in engine design and operation are fairly well approximated by phenomenological modeling of the various mechanisms involved. This software also has the advantages of relative simplicity and reasonable computational time.
Therefore, the main objective of this work is to investigate—on a theoretical basis (by using the advanced simulating software (i.e., GT-POWER))—the effect of the gradual replacement of gasoline by ethanol in the fuel mixture in combination with the change in the spark timing, on the main performance characteristics and emissions of the ROTAX 912s aircraft engine operating at various engine operating points (i.e., combination of engine speed and percentage of throttle opening). This study utilized a single-zone phenomenological combustion model to simulate the closed portion of the operating cycle in a conventional 4-stroke SI engine. According to this assumption, after combustion begins, a single-zone phenomenological model is used for the remainder of the engine’s closed cycle. The entire combustion chamber is treated as a homogeneous zone, where the air–fuel mixture and combustion products are assumed to have uniform properties. In this model, there is no distinction between unburned and burned gases, and the process is simplified by assuming that the flame front is instantaneously spread throughout the chamber. Additionally, there is no heat exchange between different zones, as the combustion is represented as a single, unified region [
6,
7,
8,
9,
10]. The theoretical results of the specific work concern basic performance characteristics such as the cylinder pressure and the heat release traces, the brake power and the mean torque, and the specific fuel consumption, as well as the brake specific concentration of CO
2, CO, and NO emissions. The theoretical results that have been conducted through the present work are in reference to engine operation under three different spark timing modes (i.e., 22, 26, and 30 degCA BTDC) for three different volume ratios of gasoline–ethanol fuel modes (i.e., G-E: 100-0; G-E: 70-30; and G-E: 50-50).
The theoretical results have been validated against experimental values, which were obtained at various engine operating points (i.e., various combinations of loads and engine speeds) from the technical manuals of the engine [
22,
23,
24]. The experimental data correspond to engine operation under conventional fuel conditions (i.e., G-E: 100-0) with a normal ignition advance of 26 degCA BTDC. Moreover, model predictions are contrasted with additional experimental results obtained from the international literature to ensure that the model predicts with reasonable accuracy the effect of these engine parameters on engine performance characteristics and NO and CO emissions. From the comparison between the experimental and the calculated results, it is revealed that the model captures, more in a qualitative rather than in quantitative manner, the influence of the examined engine parameters (i.e., spark advance and ethanol concentration in gasoline–ethanol fuel mixture) on engine performance and exhaust emissions. Hence, the developed model can be used to examine the effect of each one of the examined engine parameters on engine performance and pollutant emissions.
By examining the theoretical results, important information is derived revealing the applicability of each one of the examined techniques on an existing SI aircraft engine operating at various combinations of engine speed and percentage of throttle opening. Each one of the proposed strategies is evaluated concerning the effect of the two parameters (i.e., spark timing and volume ratio of gasoline–ethanol fuel blend) on the maximum cylinder pressure, total brake specific fuel consumption, and formation of the pollutant emissions (i.e., NO and CO), by comparing the related values to the corresponding ones obtained at normal spark advance timing (i.e., 26 degCA BTDC) under normal fuel operating conditions (i.e., G-E: 100-0). Moreover, a comparative assessment has been conducted, by using the simulation results, concerning the relative impact that each one of the examined strategies has on engine performance characteristics and emitted pollutants.
Consequently, the information derived from the present work is extremely valuable if one wishes to decide on the proper combination of the examined strategies to improve the behavior of an existing reciprocating, naturally aspirated, aircraft SI engine operated under various combinations of throttle opening percentages and engine speeds.
2. Description of the Simulation Software and Engine Model Design
2.1. Brief Description of the Test Engine
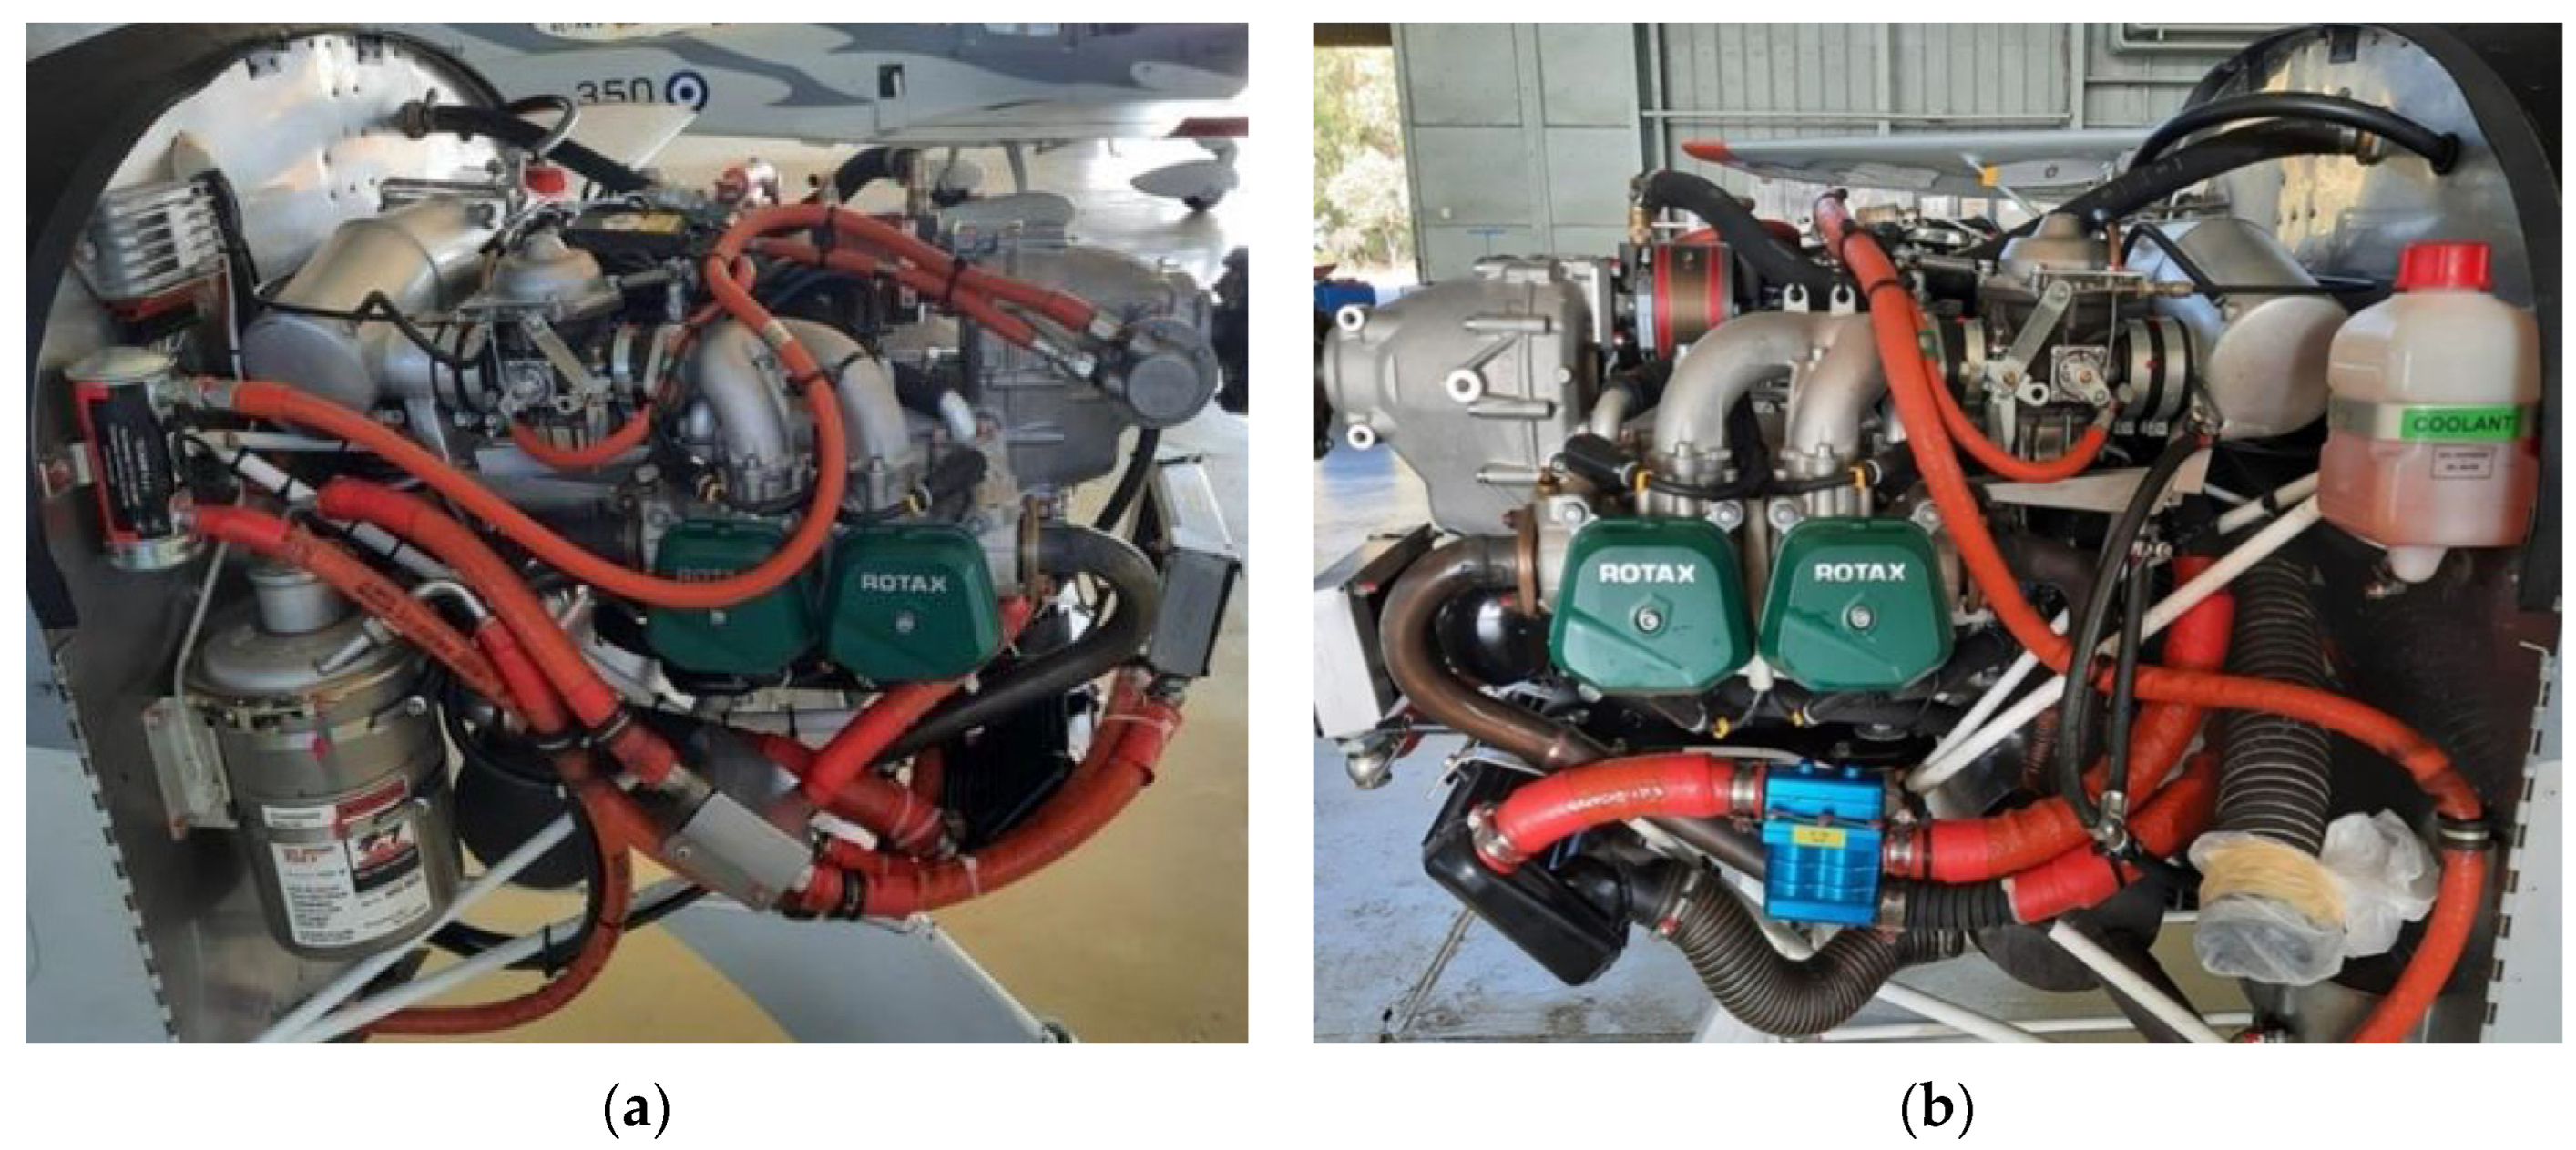
As mentioned in previous section, the main aim of this study is to investigate, from a theoretical perspective (i.e., by using a commercial simulating software (GT-POWER version 2022, Gamma Technologies, LLC, 700 Oakmont Lane, Suite 300 Westmont, IL 60559)), the effect of spark timing on the performance and emission characteristics of an existing, light-duty, naturally aspirated, spark-ignited aircraft engine (ROTAX 912s, BRP-Rotax GmbH & Co KG, Gunskirchen, Austria) operating at four different engine operating points, by using ethanol-supplemented fuel instead of conventional aviation gasoline (AVGAS 100LL). The Rotax 912s is a naturally aspirated, spark-ignited, 4-stroke, 4-cylinder opposed piston engine (180° angle arrangement) (
Figure 1). It has a maximum power output of 100 hp/73.5 kw at 5800 rpm and a maximum torque output of 128 Nm at 5100 rpm. Moreover, it has four air-cooled cylinders in a boxer system and liquid-cooled cylinder heads. It is also equipped with a dry sump forced lubricating system with the so-called dry oil pan, automatic adjustment by hydraulic valve tappet, engine suspension frame, and overload clutch. The fuel mixture is given by two independent carburetors of constant vacuum, preceded by two independent air boxes. The ignition is a dual system with four coils and two electronic modules.
Table 1 presents the main geometrical and operational data related to the simulated engine, where NA means naturally aspirated, CA means crank angle, BTDC means before top dead center, ABDC means after bottom dead center, and ATDC means after top dead center [
25].
2.2. One-Dimensional Simulation Model Engine Set-Up
In this study, the one-dimensional simulation model of the light-duty SI Rotax 912s engine was built by using the commercial GT-Power. The layout of the one-dimensional simulation model was strictly based on the real light-duty SI Rotax 912s engine, which is accommodated in the Tecnam P2002JF training aircraft (Costruzioni Aeronautiche TECNAM S.P.A., Via Maiorise, 81043 Capua, Italy) of the Hellenic Air Force. The designed simulation model is capable of modeling the combustion and the formation of emission pollutants for a spark ignited engine.
The specific model consists of several individual elements, called modules of the engine, each one of which simulates the operation of the corresponding part of the engine. These critical modules are the air inlet manifold, airbox, throttles, intake/exhaust valves, cylinders, pistons, crankshaft, exhaust manifold, etc. The main modules of the engine are connected together with various pipes so the final model of the engine can be created. The aforementioned engine has a carburetor. However, since the way to feed the carburetor mixture is not in the software’s library, we will simulate the carburetor with a fuel injector–manifold pair. According to the philosophy of the module that simulates fuel injection, the injection rate depends on the engine operating speed. The model uses the fuel type “Indolene”, whose characteristics closely approximate those of the aviation gasoline (AVGAS 100LL). The main characteristics of “Indolene” are presented in
Table 2. As far as the simulation of the movement of the intake and exhaust valves is concerned, the model uses the valve lift profile presented in
Figure 2. To define the type of heat transfer in the cylinder, the WoschniGT model was used as a standard model for most industrial applications.
As has already been mentioned, a single-zone phenomenological model was adopted herein. In this model, it is assumed that the entire combustion chamber is treated as a single homogeneous zone. Inside each cylinder a turbulent combustion of a homogeneous air–fuel mixture occurs, which is initiated by a spark igniter. Various critical engine parameters are taken into account. These include the temperature of the unburnt zone, the mean cylinder pressure, and the total air–fuel excess ratio. The spark ignition timing, the position of the spark plug, and the fuel properties are also taken into account. The geometry and the expansion velocity of the turbulent flame front, the interaction of the flame with the cylinder walls, and the geometrical characteristics of the piston, valves, and cylinder head are also considered [
26,
27,
28].
The laminar flame speed is determined by the following formula:
where the f(x
res) is given by the formula
In Equation (1), (xres) represents the residual mass fraction in the unburned zone, (Tu) is the temperature of the unburnt zone, (P) is the mean cylinder pressure, (φ) is the equivalence ratio of the unburnt zone, (Bm) is the maximum value of the laminar flame speed, (Bf) is the roll-off value of the laminar flame speed, (a, b) are constants, and Tref/Pref are equal to 298 K and 101,325 Pa, respectively. In Equation (2), (CDE) represents the dilution effect multiplier, which is modified during the calibration procedure.
According to the main philosophy of the combustion sub-model used herein, the unburned air–fuel mixture is entrained into the flame front through the external flame area. The entrainment rate is determined through the Equation (3),
where (ρ
u) is the density of the unburned zone, (A
e) is the external surface area of the flame front, (S
L) is the laminar flame speed, and (S
T) is the turbulent flame speed. The last parameter (i.e., S
T) is calculated through the following formula:
where (u’) is the turbulent intensity, (R
f) is the flame radius, and (Li) is the integral length scale. In Equation (4) the parameters (CTFS) and (CFKG) represent the turbulent flame speed and the flame kernel growth multipliers, respectively, which are modified during the calibration procedure.
The burn rate of the air–fuel mixture is determined through Equation (5),
where (M
e) and (M
b) represent the entrained and the burnt masses of air–fuel mixture, and (τ) is a time constant, which is calculated by the following formula:
In Equation (6) the parameter (Ret) represents the turbulent Reynolds number, while (CTLS) represents the Taylor length scale multiplier, which is modified during the calibration procedure.
Regarding the simulation of mechanical losses, in the present model, the Chen–Flynn model was adopted [
29], according to which the friction mean effective pressure (FMEP) is calculated by the following equation:
where (P
cyl,max) is the maximum cylinder pressure, and (c
e) is the mean piston speed, while (C, PF, MPSF, and MPSSF) are constants that are modified during the calibration procedure.
This is an empirically derived model which states that the total engine friction is a function of peak cylinder pressure, mean piston speed, and mean piston speed squared. There are recommended values in the Reference Manual that are suitable for approximating the friction of a typical engine.
2.3. Validation of the One-Dimensional Model
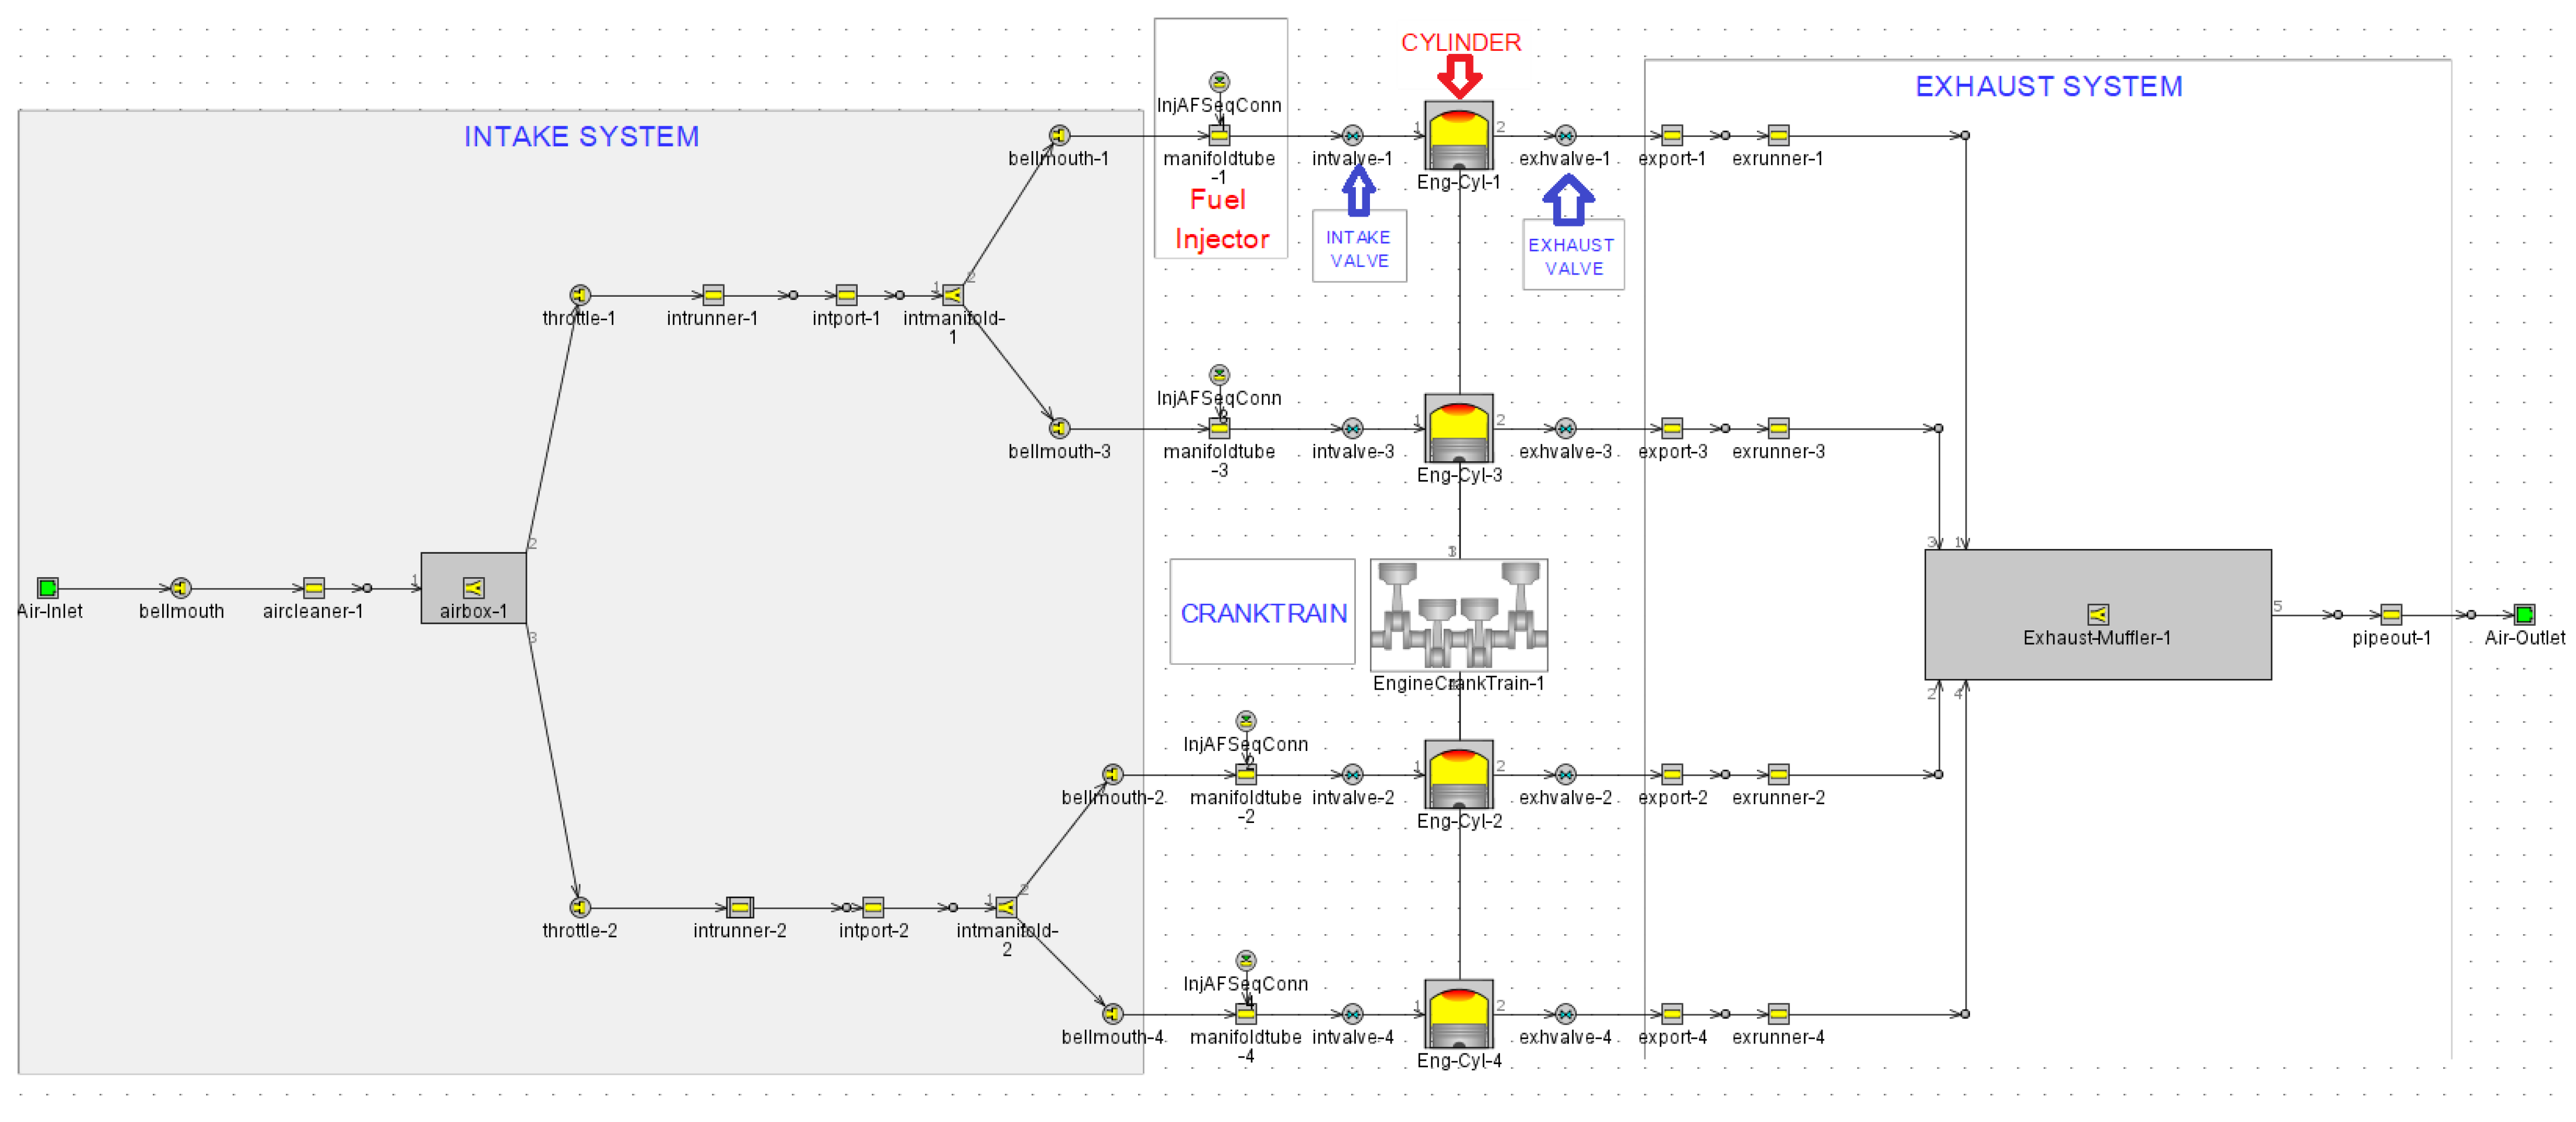
As mentioned, the model used in this study was a commercial simulating software (i.e., GT-POWER), which simulates the operating cycle of the ROTAX-912s aircraft engine (see
Figure 3). As previously mentioned, the main geometrical and operational data of the simulated engine are presented in
Table 1. Moreover, the experimental data obtained from [
1,
2,
3] were used solely for calibrating the model and assessing its predictive accuracy. All these experimental data are summarized in
Table 3, where (N) denotes the engine speed, (MAP) is the intake manifold absolute pressure, (P
e) is the brake power, (M
σ) is the brake mean torque, (V
fuel) is the volumetric fuel flow rate, (λ
a) is the air–fuel excess ratio, (η
v) is the volumetric efficiency, and (BSFC) is the brake-specific fuel consumption. According to
Table 3, the experimental results used in the present contribution correspond to engine operation at four different engine operating points (i.e., EOP: 1, 2, 3, and 4), at normal spark advance (i.e., NSA = 26 degCA BTDC) under normal fuel operating mode (i.e., NFO = AVGAS 100LL).
At this point it should be mentioned that, in calculating the experimental values of the brake-specific fuel consumption and the mass flow rate of fuel consumption, the value of the density of the aviation gasoline (AVGAS 100LL) was taken as ρ
AVGAS100LL = 720 (kg/m
3). Moreover, taking into account the operating manual of the specific type of aircraft engine in combination with the data from the aircraft flight manual, it was determined the value of (λ
a) corresponding to each of the engine operating points presented in
Table 3. Thus, at each engine operating point, the (ηv) is estimated through the formula
where (η
trap) denotes the trap efficiency (for the specific engine η
trap = 95%), (AFR
st,AVGAS100LL) is the stoichiometric air–fuel ratio (AFR
st,AVGAS100LL = 14.7 (kg/kg), (
) is the volumetric air flow rate of the engine, and (ρ
a) corresponds to the air density estimated at P
a = 1.013 bar and T
a = 288 K. In
Figure 4 is given the variation of the engine volumetric efficiency and the volumetric fuel flow rate with the engine operating point corresponding to engine operation at normal spark advance and normal fuel operating modes. According to
Figure 4 it is shown that the change in the engine operating point from 4300 rpm and 55% throttle opening to 5500 rpm and 100% throttle opening is accompanied by an increase in fuel consumption with a simultaneous slight decrease in the volumetric efficiency, a fact that results in a slight decrease in the total air–fuel excess ratio.
For each engine operating point (EOP) examined herein, the comparison between experimental and calculated values of brake power output (P
e), brake torque (Μ
σ), and brake-specific fuel consumption (BSFC), at normal SA (i.e., NSA = 26 degCA BTDC) and normal FO mode (i.e., NFO = AVGAS 100LL), is given in
Figure 5,
Figure 6, and
Figure 7, respectively.
By observing
Figure 5 and
Figure 6, it is shown that the proposed model closely matches the experimental data, demonstrating its capability to accurately predict brake power output and torque (i.e., the break mean effective pressure) of the ROTAX 912s test engine, operating either at partially or at fully loaded conditions as well. Moreover, by observing
Figure 7, it is shown that for all engine operating points examined, the proposed model predicts with relatively good accuracy the experimental brake-specific fuel consumptions. According to [
1,
3], the experimental BSFC is calculated based on the measured (P
e) and the measured (V
fuel).
Consequently, a comparison between the experimental and theoretical results reveals that, despite minor discrepancies between the measured and calculated absolute values, the simulation model manages to predict with satisfactory accuracy the trend of engine performance characteristics with the change in engine operating point from 4300 rpm and 55% throttle opening to 5500 rpm and 100% throttle opening. Hence, the proposed model can be utilized to conduct a parametric study on the impact of spark timing on the performance and emission characteristics of the ROTAX 912s aircraft engine, operating either under pure gasoline or under gasoline–ethanol fuel mixture operating modes, at partial or at full engine operating conditions, respectively.
3. Test Cases Examined
As aforementioned, an effort was made in the present work to predict the relative impact of spark advance (SA) in combination with the partial replacement of the conventional fuel (AVGAS 100LL) by a gasoline–ethanol fuel mixture in various (G-E: vGasoline-vEthanol) concentrations (fuel operating point—FOP) on the performance and pollutant emissions of the ROTAX 912s aircraft engine, operating either at full (i.e., 5500 rpm and 100% throttle opening) or at partial (i.e., 4800 rpm and 65% throttle opening) engine operating points (EOPs), respectively.
Thus, at two different engine EOPs (i.e., 5500 rpm and 100% throttle opening and 4800 rpm and 65% throttle opening, the following fuel operating points (FOPs) (i.e., gasoline–ethanol (G-E) fuel mixtures) were initially examined:
G-E: 100%-0%: Gasoline–ethanol mixture consists of 100% v/v gasoline and 0% v/v ethanol;
G-E: 70%-30%: Gasoline–ethanol mixture consists of 70% v/v gasoline and 30% v/v ethanol;
G-E: 50%-50%: Gasoline–ethanol mixture consists of 50% v/v gasoline and 50% v/v ethanol.
In each of the above fuel mixture test cases and for each engine loading condition examined, the stoichiometric air–fuel ratio (AFR
st,G-E) is obtained through the formula
where AFR
st,Gsoline = AFR
st,Indolene = 14,578 (kg stoich. air/kg fuel), and AFR
st,Ethanol = 9.2 (kg stoich. air/kg fuel). For this type of engine, the adjustment of the engine operating point is controlled primarily by throttling the supply of the air–fuel mixture mass sucked in by the engine cylinder. This means that for each engine operating point, the use of a different type of fuel affects neither the inducted air mass flow rate (
) nor the quality of the mixture (i.e., the air–fuel equivalence ratio (λ
α)). Thus, for each one of both engine loading conditions examined herein (i.e., 5500 rpm and 100% throttle opening and 4800 rpm and 65% throttle opening), the values of the air–fuel equivalence ratio (λ
α) are equal to the corresponding values (i.e., λ
α,5500rpm&100%TO = 1.07, and λ
α,4800rpm&65%TO = 1.406), obtained from
Table 3.
Based on the above assumptions, for each of the three (3) considered fuel mixture cases (G-E: 100%-0%; G-E: 70%-30%; and G-E: 50%-50%) and for each engine operating conditions, the gasoline–ethanol mixture fuel consumption (
) is estimated through the following formula:
Moreover, for each one of the three different fuel operating modes (G-E: 100%-0%; G-E: 70%-30%; and G-E: 50%-50%), the effect of SA on performance characteristics and pollutant emissions was examined. Thus, at the two different EOPs, corresponding to 5500 rpm and 100% throttle opening and 4800 rpm and 65% throttle opening, for each one of the three FOPs, the SA timing was changed as follows: SA = 26 − 4 = 22 deg CA BTDC, and SA = 26 + 4 = 30 deg CA BTDC.
4. Results and Discussion
This paragraph presents the theoretical results that have emerged from the application of the commercial simulating software (i.e., GT-POWER) to the operating cycle of the ROTAX-912s aircraft engine. The impact of the spark timing (SA) and the volume concentration of gasoline and ethanol in the fuel mixture (FOP) on the fundamental performance characteristics and pollutant emissions of the ROTAX-912s aircraft engine are investigated for the two EOPs corresponding to 5500 rpm and 100% throttle opening and 4800 rpm and 65% throttle opening. Moreover, before analyzing the results, it is important to clarify the terminology used (G-E: 100-0), (G-E: 70-30), and (G-E: 50-50) represent the gasoline–ethanol mixture volume concentration operating modes (FOPs), respectively.
4.1. Cylinder Pressure and Rate of Heat Release
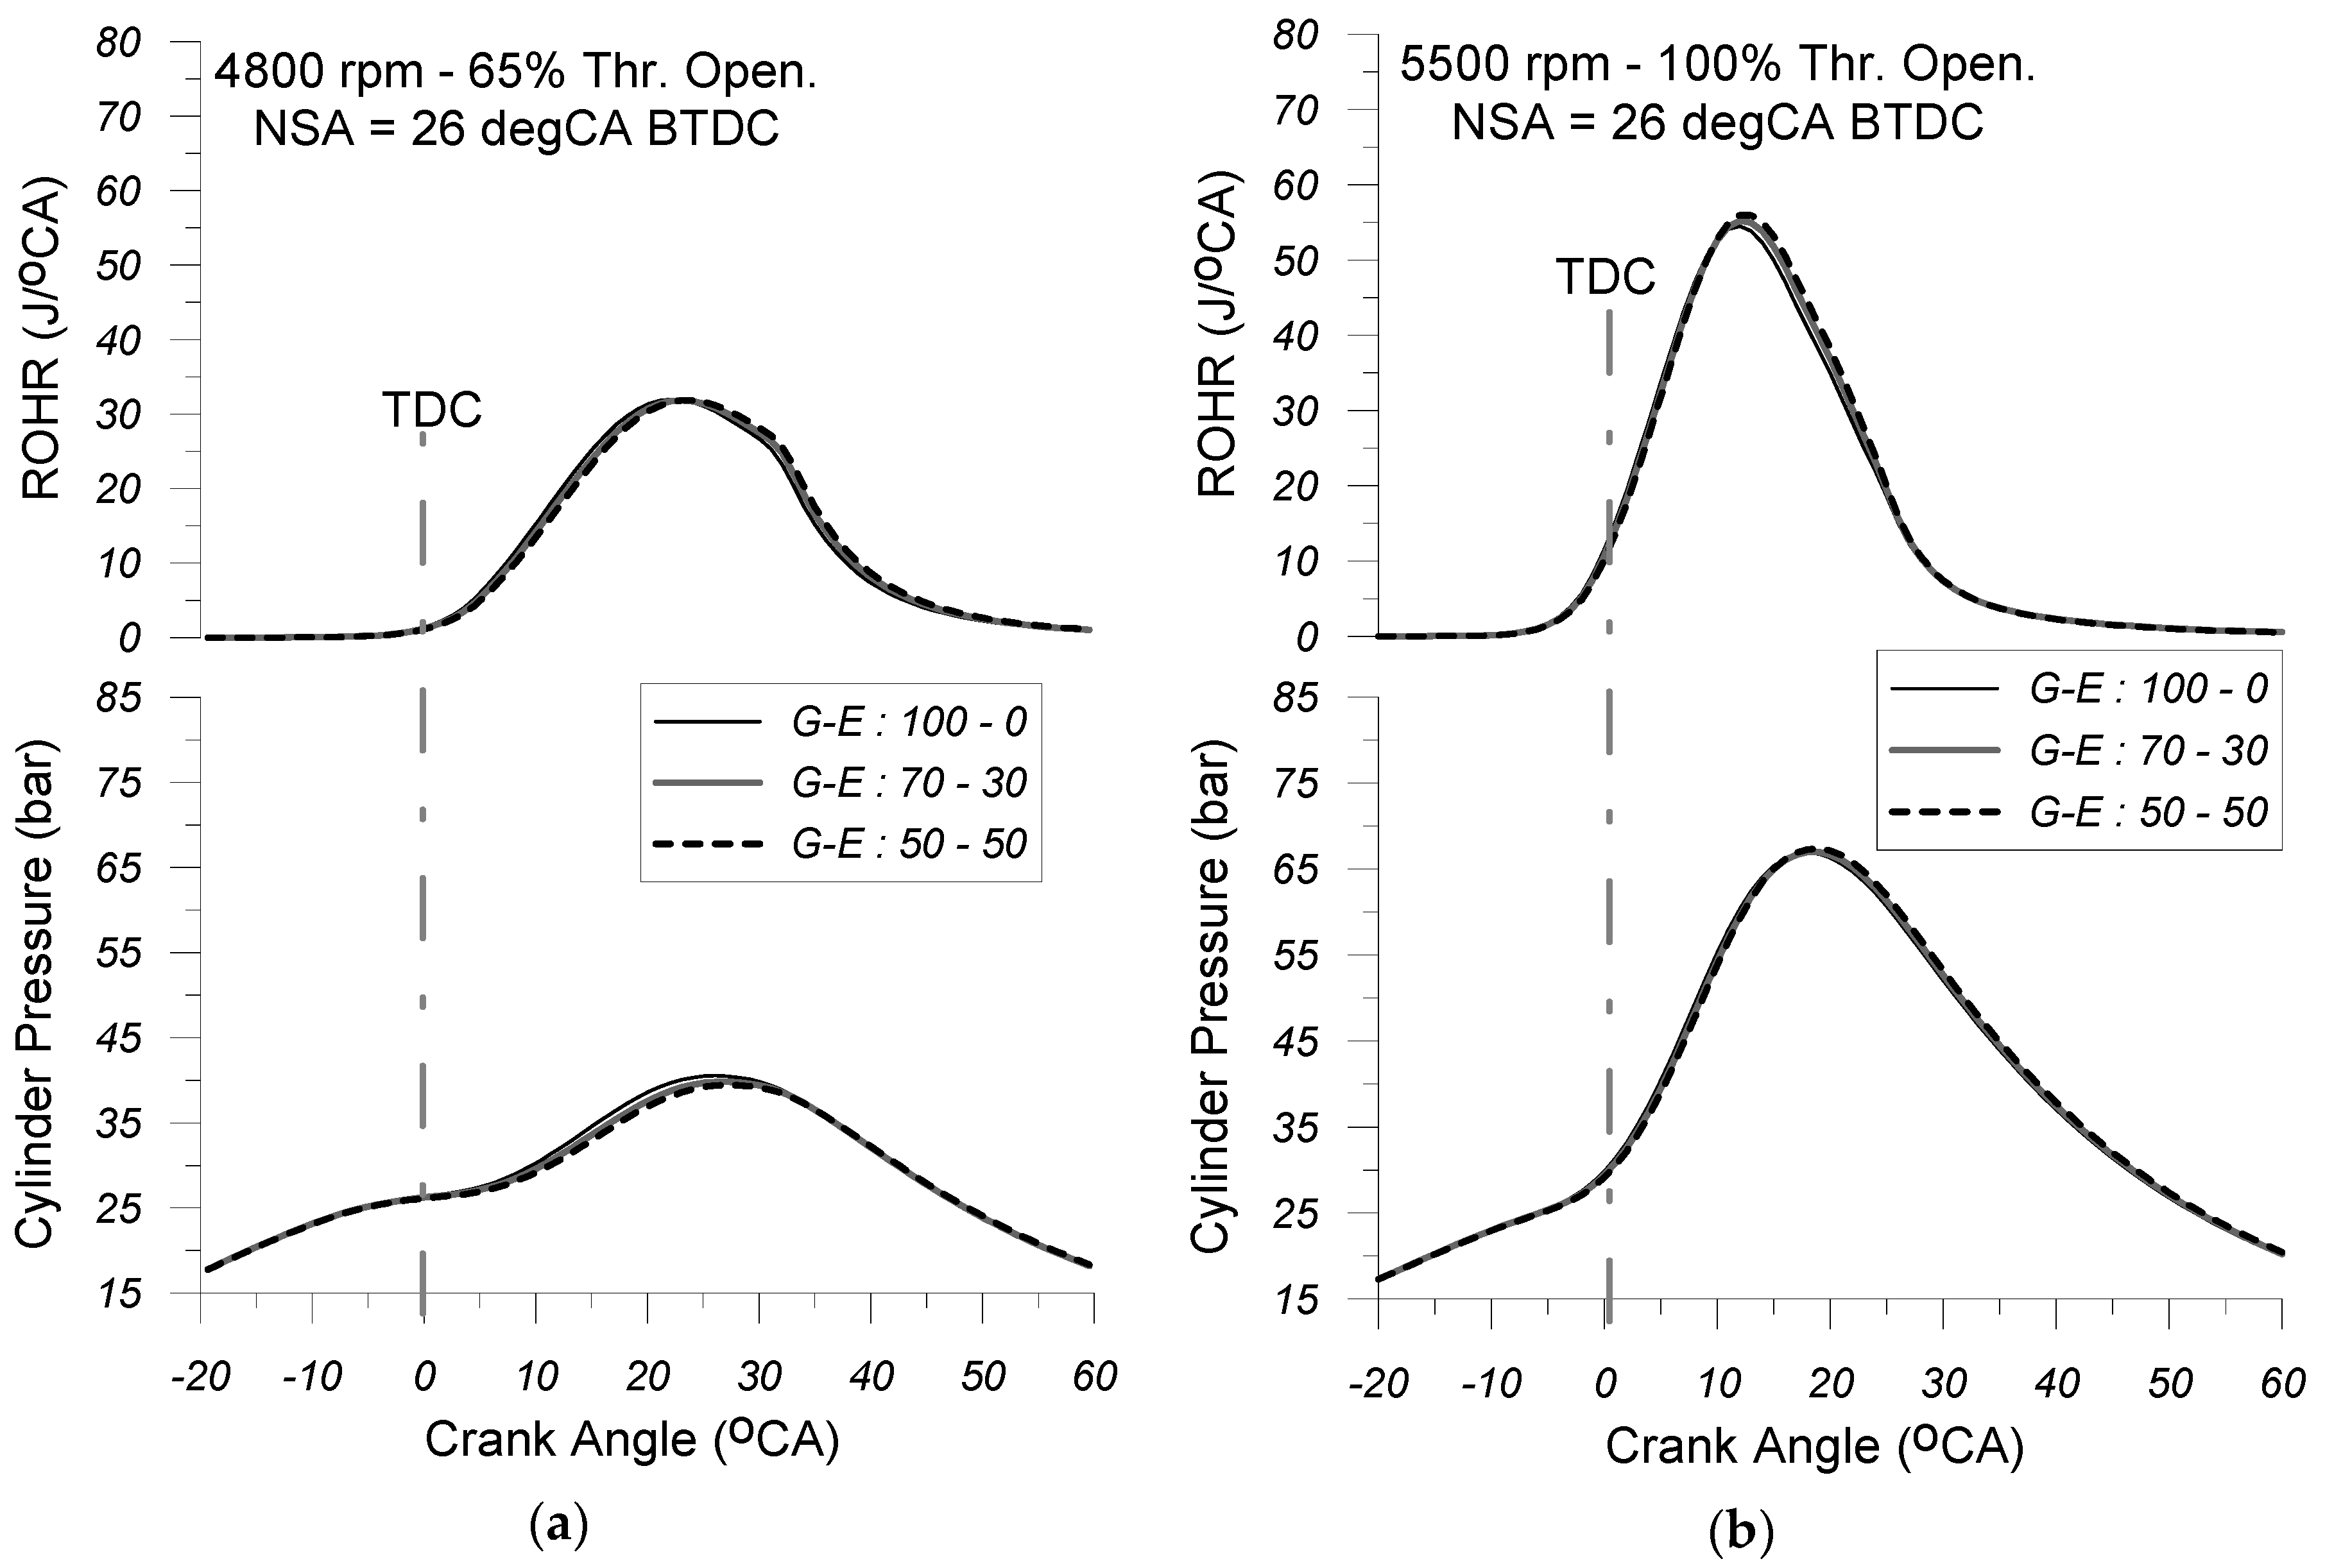
Figure 8a,b depict the anticipated cylinder pressure and rate of heat release (ROHR) traces for the three FOPs examined herein (i.e., G-E: 100-0; G-E: 70-30; and G-E: 50-50), corresponding to the 5500 rpm and 100% throttle opening and 4800 rpm and 65% throttle opening engine operating points, under NSA = 26 deg CA BTDC.
An analysis of these figures reveals that, for each of the three fuel operating modes examined, engine load influences the peak cylinder pressure without significantly altering the shape of the cylinder pressure and heat release rate curves. Specifically, it is revealed that for each one of the fuel operating modes, the simultaneous increase in engine speed and throttle opening, while maintaining constant spark timing, leads to a more pronounced rise in cylinder pressure—particularly during the early stages of the combustion process. This results in higher peak cylinder pressures and increased maximum burning zone temperatures. It is important to note that, in this type of engine, load adjustment is achieved by throttling the mass flow rate of the incoming air–fuel mixture, ensuring that the fuel equivalence ratio remains nearly constant across different loading conditions. Consequently, for each of the three fuel operating modes examined, an increase in engine load corresponds to a simultaneous rise in both the aspirated air mass flow rate and the fuel consumption. This explains the greater heat release observed during combustion, which in turn contributes to the increase in maximum cylinder pressure.
Regarding the effect of fuel type on the cylinder pressure diagram, it is revealed that at the same EOP under constant SA, the cylinder pressure observed during the compression stroke under both the G-E: 70-30 and G-E: 50-50 FOPs slightly diverges from the respective values observed under the neat-gasoline (G-E: 100-0) fueling mode. This phenomenon can be attributed to the higher heat of vaporization of the gasoline–alcohol mixture compared to that of neat gasoline, which leads to a reduction in the cylinder charge temperature at the time of inlet valve closure. Moreover, the increased heat of vaporization enhances the specific heat capacity of the alcohol–air mixture, which further contributes—albeit slightly—to the reduction in cylinder charge temperature. However, once combustion begins, it is observed that, under certain engine loading conditions, increasing the volume concentration of ethanol in the gasoline–ethanol blend has a positive effect on the rate of cylinder pressure rise. This effect is particularly noticeable during the early stages of the combustion process, where the pressure rise becomes more pronounced. This justifies the fact that both the maximum cylinder pressure and the maximum combustion temperature observed are slightly higher compared to the corresponding values observed in the pure gasoline mode (G-E: 100-0).
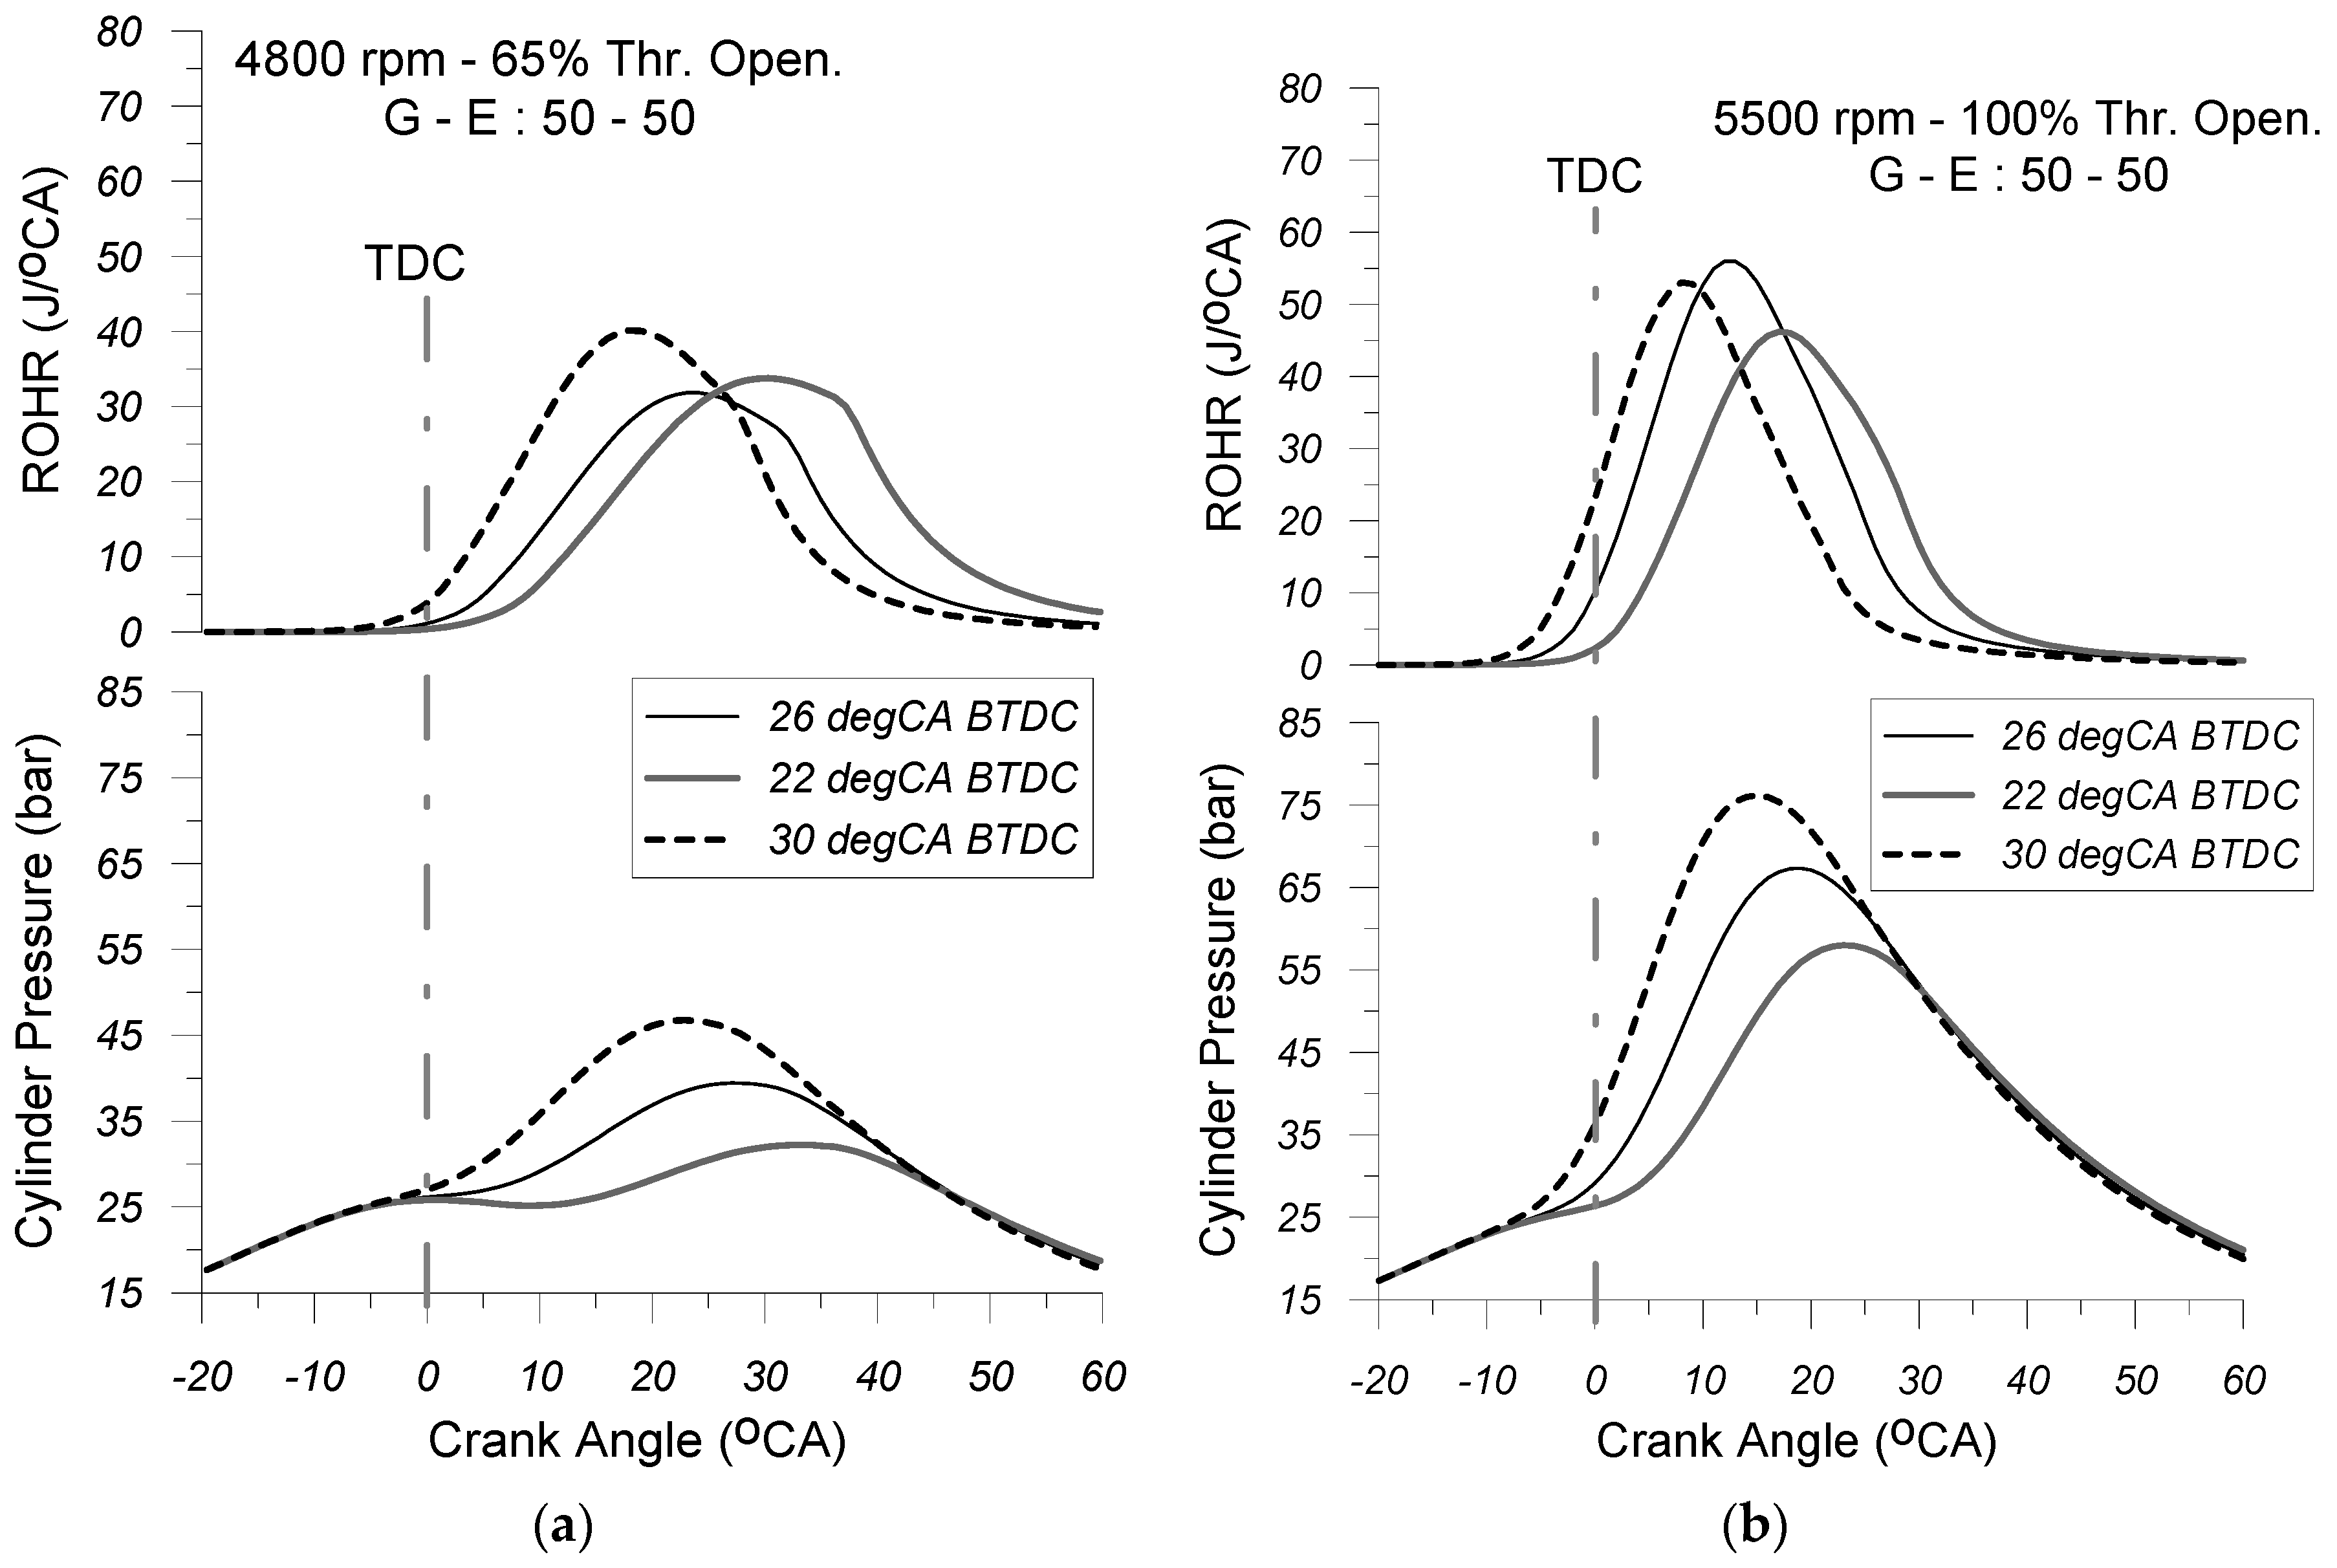
Figure 9,
Figure 10 and
Figure 11 depict the predicted cylinder pressure and heat release traces, for various spark advance timings (i.e., SA = 22, 26, and 30 deg CA BTDC), corresponding to the 5500 rpm and 100% throttle opening and 4800 rpm and 65% throttle opening EOPs, under the G-E:100-0 (
Figure 9a,b), G-E:70-30 (
Figure 10a,b), and G-E:50-50 (
Figure 11a,b) FOPs, respectively.
Examining these figures, it is revealed that ignition timing influences both the cylinder pressure profile and the heat release rate. Specifically, advancing the spark timing relative to the top dead center (TDC) position appears to intensify the rate of cylinder pressure rise, particularly during the early stages of the combustion process.
This is attributed to the fact that, during this phase, the combined effect of the increased energy release rate and the rising cylinder charge temperature leads to a more pronounced increase in cylinder pressure. Furthermore, variations in spark timing do not appear to significantly affect the overall shape of the combustion rate curve. Increasing the spark timing relative to NSA leads to an earlier onset of the combustion process, while at the same time, the rate of heat release observed during the initial stages of combustion appears to increase. This occurs because advancing the spark timing increases the amount of fuel burned before the top dead center (TDC), which positively influences both the initiation and rapid propagation of the flame front. Furthermore, by examining
Figure 9,
Figure 10 and
Figure 11, it is observed that advancing the ignition timing relative to the TDC position results in an increase in the maximum cylinder pressure. This increase is less pronounced at partial load but becomes significantly more intense at full load. This is mainly due to the fact that, with the transition from the “partial” (i.e., 4800 rpm and 65% thr. open.) engine operating point to the high one (i.e., 5500 rpm and 100% thr. open.), the air–fuel equivalence ratio (λ
α) decreases tending towards stoichiometry, while the speed of propagation of the flame front increases since the increase in engine speed affects positively the turbulence intensity observed inside the cylinder. The aforementioned change in both parameters (λ
α and flame speed) results in an enhancement of the heat release rate observed especially during the first stages of combustion.
4.2. Brake Power and Mean Torque
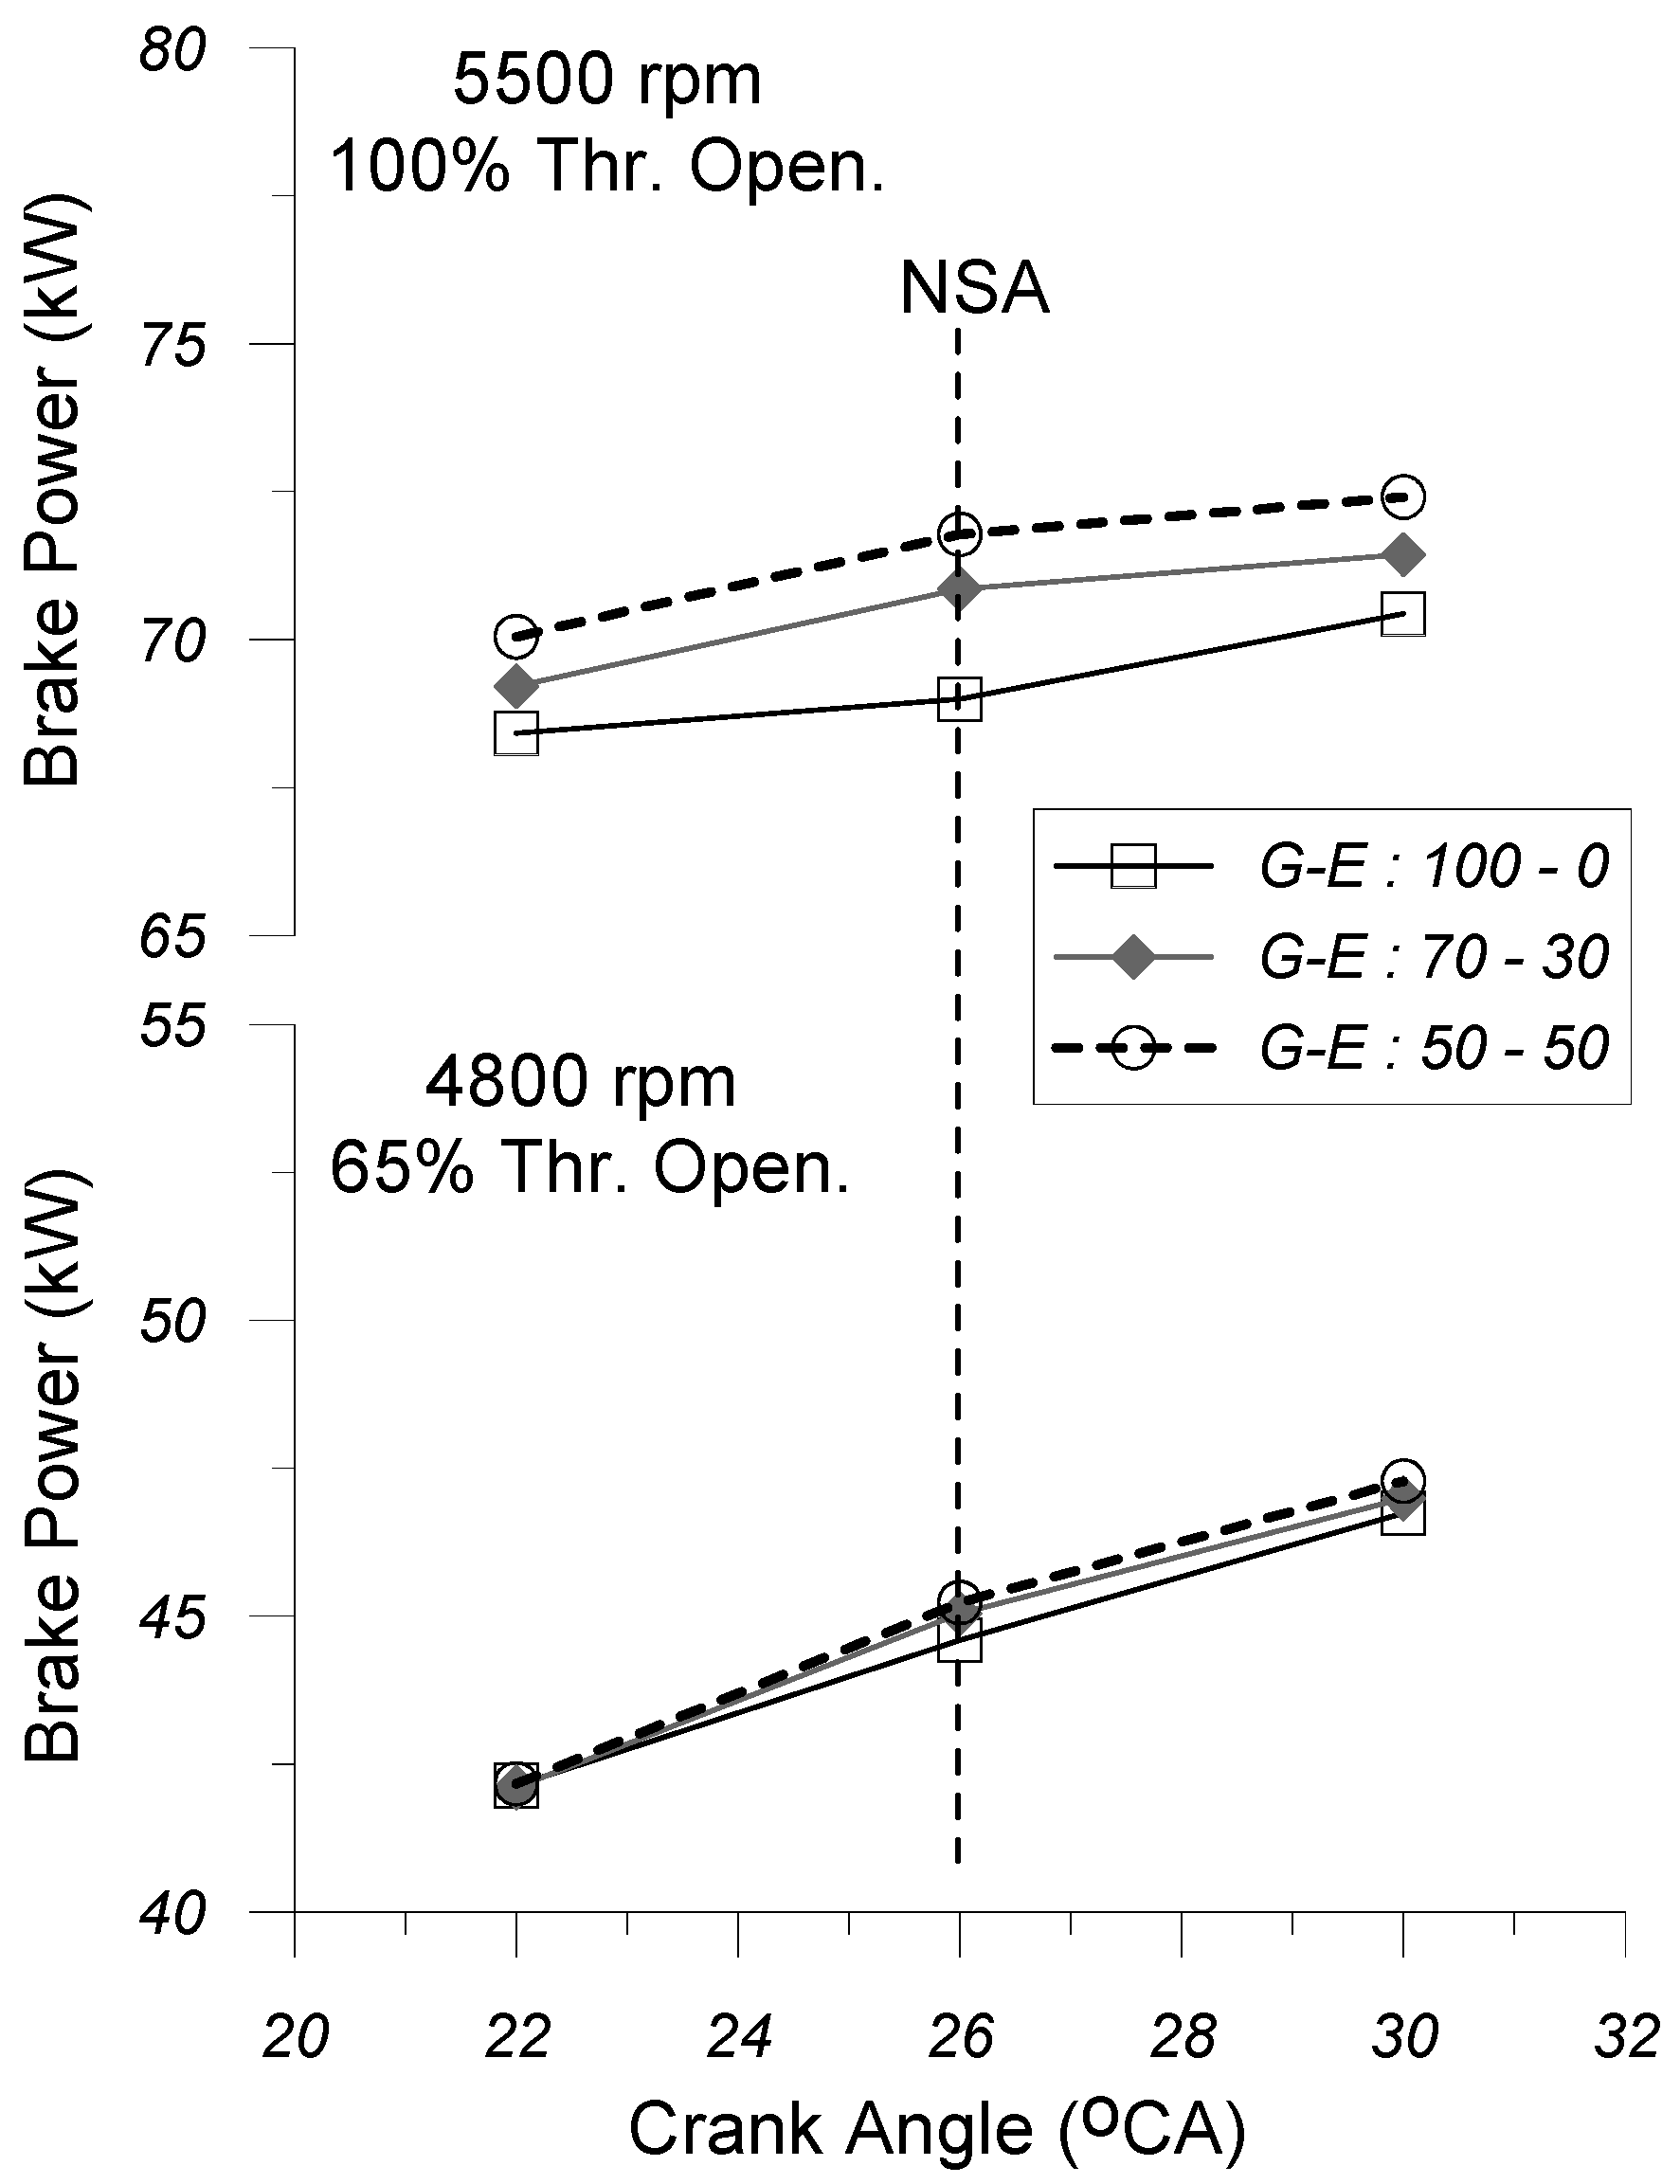
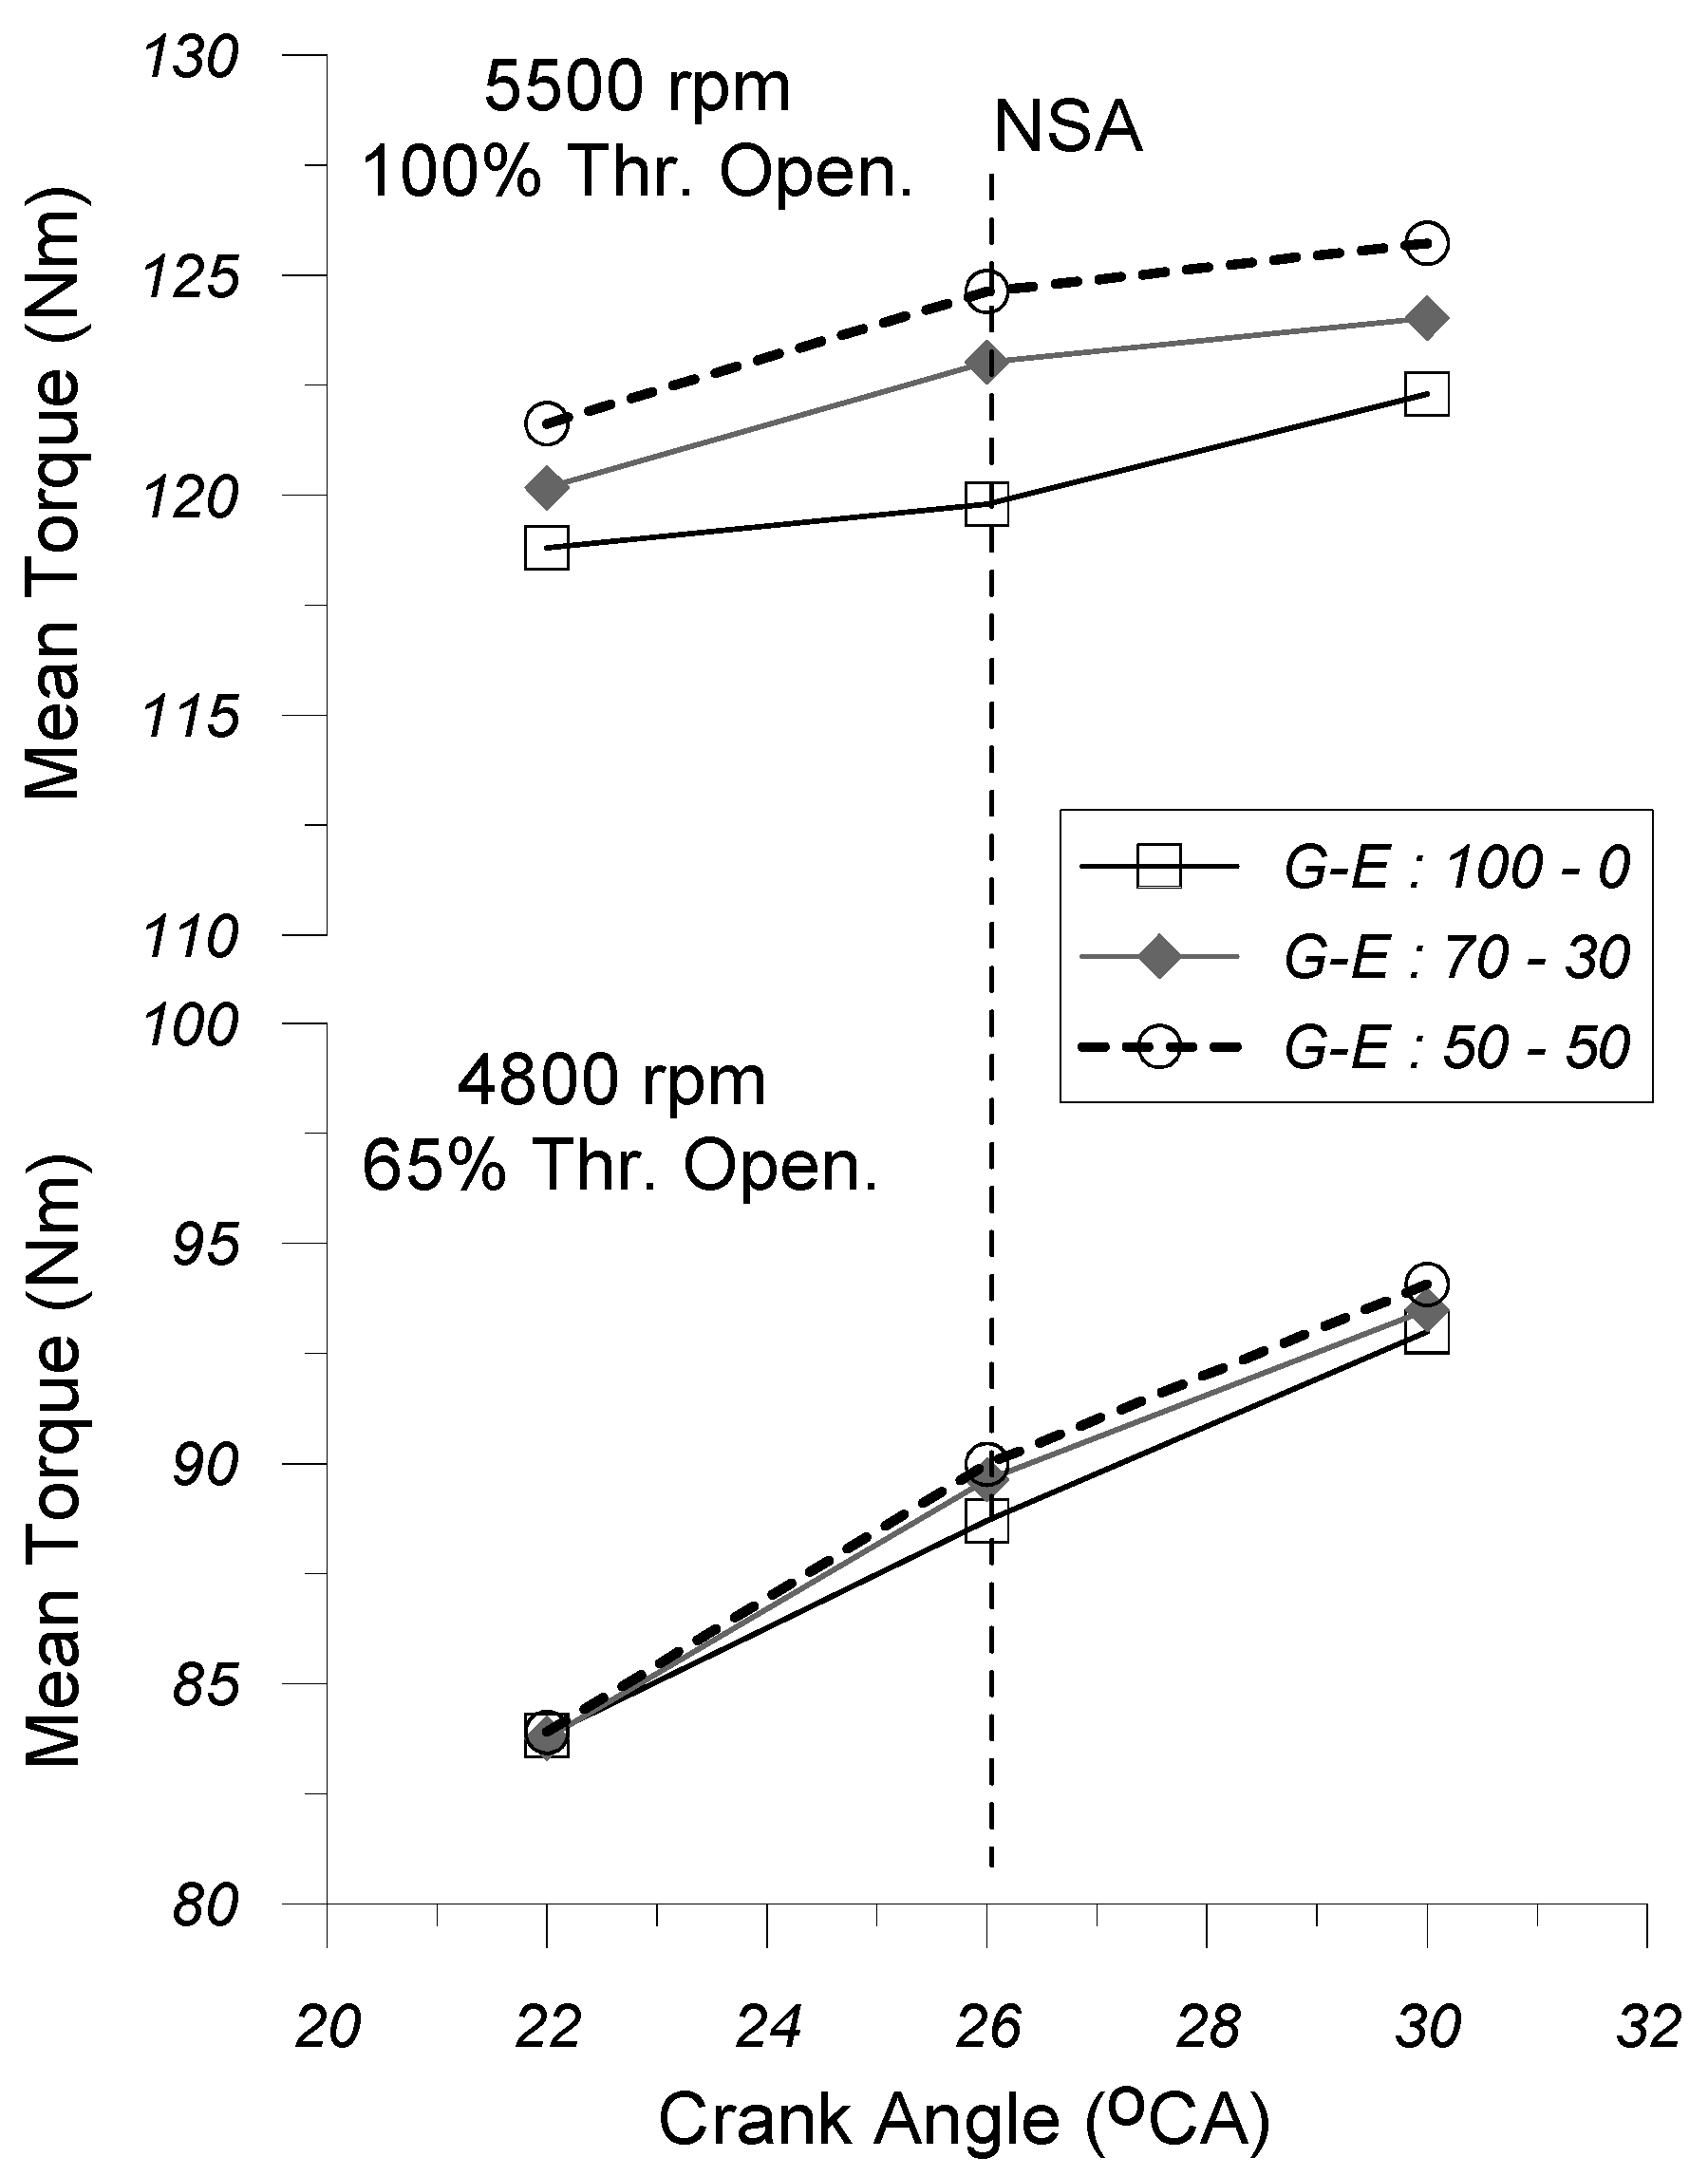
In
Figure 12 and
Figure 13, the variation in the brake power output (
Figure 12) and the mean torque (
Figure 13) with spark timing (SA) is given under the G-E:100-0, G-E:70-30, and G-E:50-50 fuel operating modes at the two engine operating points (i.e., 4800 rpm and 65% thr. open. and 5500 rpm and 100% thr. open.), respectively.
By examining
Figure 12 and
Figure 13, it seems that, for the same EOP (i.e., engine speed and % throttle opening) and the same SA timing, the increase in the volume percentage of ethanol in the gasoline–ethanol fuel blend seems to affect positively (increase) both the brake power output and the mean torque, as well. This result appears to be more noticeable under the “partial” EOP (i.e., 4800 rpm and 65% thr. open.).
The increase in the ethanol concentration in the gasoline–ethanol mixture leads to a reduction in the stoichiometric air–fuel ratio and also of the net calorific value of the gasoline–ethanol fuel blend. This is due to the fact that both the stoichiometric air–fuel ratio and the lower heating value of ethanol are lower as compared to the respective values of gasoline. Moreover, increasing the percentage of ethanol in the gasoline–ethanol mixture enhances the engine volumetric efficiency, because it contributes to reducing the temperature of the cylinder charge at the inlet valve closure timing. The aforementioned reduction in temperature is due to the fact that, with the increase in the ethanol percentage in the fuel mixture, the latent heat of vaporization of the fuel blend decreases, since the latent heat of vaporization of ethanol is considerable higher than that of gasoline. Finally, it should be noted here that the increase in the ethanol concentration in the gasoline–ethanol mixture leads to an increase in the rate of heat released during the combustion phase, because the increased percentage of ethanol in the fuel blend contributes to increasing the speed of propagation of the flame front inside the cylinder, since—among other factors—the stoichiometric laminar flame speed of ethanol is considerable higher than that of gasoline. Taking into account all the aforementioned observations, the increase in the ethanol concentration in the gasoline–ethanol mixture leads to a simultaneous increase in both engine volumetric efficiency and the heat release rate, observed especially during the early stages of combustion, which positively affects (increases) the break mean effective pressure (bmep) of the cylinder gas, which ultimately leads to an increase in both brake torque and brake power output.
As far as the effect of spark timing on the brake power output and the brake torque is concerned, it seems that for the same EOP, by keeping constant the percentage of ethanol in the gasoline–ethanol fuel blend, the advance of ignition timing leads to a higher torque and brake power output. This effect seems to become more evident at “partial” engine operating point (i.e., 4800 rpm and 65% thr. open.). This may be due to the fact that by advancing the ignition timing relative to the TDC position causes combustion to initiate earlier, resulting in an increased amount of fuel burned before TDC. This, in turn, positively enhances the flame propagation speed, thereby accelerating the overall combustion rate, which contributes to the increase in the break mean effective pressure (bmep) of the cylinder gas, which ultimately leads to an increase in both brake torque and brake power output.
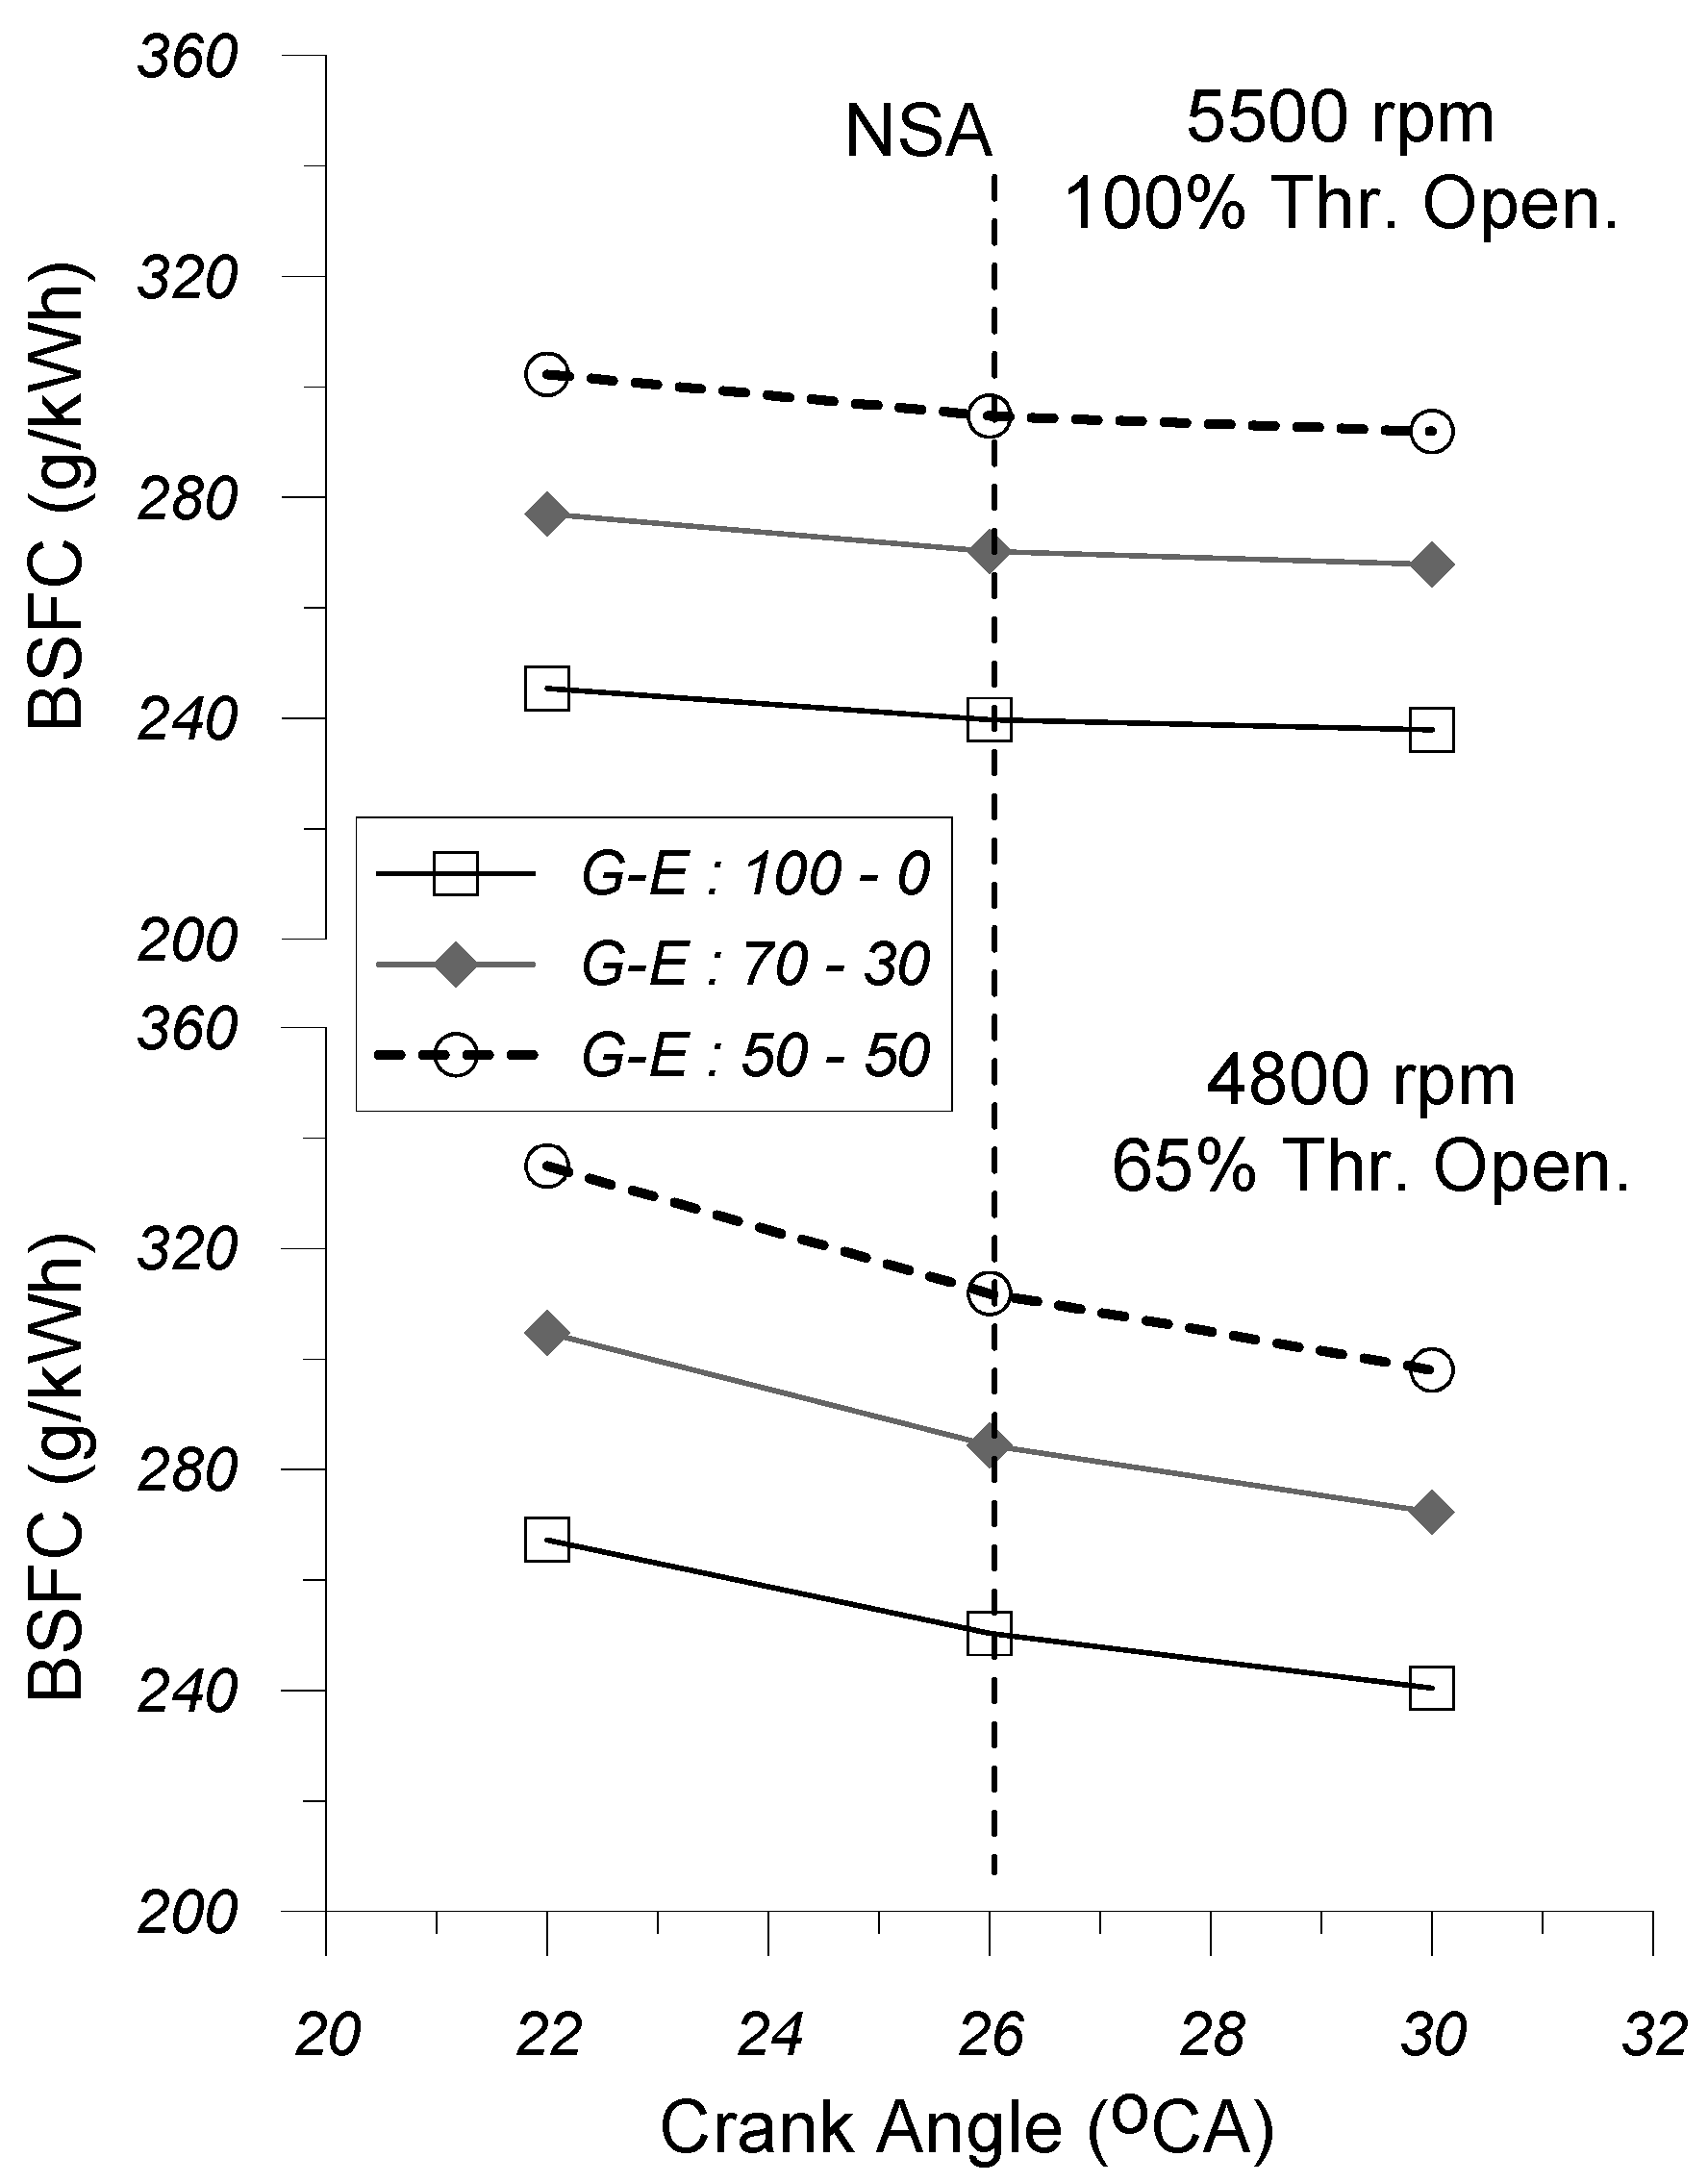
4.3. Brake-Specific Fuel Consumption
Figure 14 illustrates the variation in the brake-specific fuel consumption (BSFC) with spark timing (SA), under the G-E:100-0, G-E:70-30, and G-E:50-50 fuel operating modes, at “partial” (i.e., 4800 rpm and 65% thr. open.) and “high” (i.e., 5500 rpm and 100% thr. open.) engine operating points. It must be stated here that, for each test case examined herein, the calculated brake-specific fuel consumption is proportional to the mass flow rate of the gasoline–ethanol mixture and inversely proportional to the calculated brake power output.
By observing this figure, it is revealed that for the same engine operating point (combination of engine speed and % throttle opening) and the same ignition advance, the gradual replacement of gasoline with ethanol leads to an increase in the BSFC, thus leading to a reduction in the brake thermal efficiency. Regardless of the slight enlargement in the (Pe) recorded by increasing the volume concentration of ethanol in the gasoline–ethanol mixture, the observed deterioration in the calculated BSFC is primarily due to the significantly reduced lower heating value (LHV) of ethanol compared to that of gasoline. Therefore, for the constant (λα) at the same EOP and SA timing, the engine operation for the G-E:70-30 and G-E:50-50 fuel operating modes should be accompanied by higher amounts of fuel consumption, as compared to the respective amounts recorded for the G-E:100-0 FOP, hence justifying the enlargement observed in the estimated BSFC.
Regarding the effect of SA on the BSFC, it seems that, for the same EOP and the same gasoline–ethanol ratio, the increase in the spark advance leads to a decrease in the calculated brake-specific fuel consumption. Considering that changes in ignition timing do not affect the amount of fuel consumed, this effect can be primarily attributed to the increase in brake power output observed in the specific test cases. This impact appears to be more noticeable under partial engine operating conditions.
As far as the effect of engine operating point (combination of engine speed and % throttle opening) on BSFC is concerned, it is observed that, for the same spark timing and gasoline–ethanol mixture ratio examined herein, the estimated BSFC seems to be slightly lower at “high” EOP (i.e., 5500 rpm and 100% thr. open.). This fact is mainly due to the increment of the brake power output in combination with the increment of the rate of heat released. The increased combustion rate is mainly due to the fact that with the transition from the “partial” (i.e., 4800 rpm and 65% thr. open.) engine operating point to the high one (i.e., 5500 rpm and 100% thr. open.), the air–fuel equivalence ratio (λα) decreases, tending towards stoichiometry, while the speed of propagation of the flame front increases since the increase in engine speed affects positively the turbulence intensity observed inside the cylinder.
4.4. Brake-Specific NO Concentration
Figure 15 illustrates the change in the brake-specific NO concentration (BSNO) with SA, under the G-E:100-0, G-E:70-30, and G-E:50-50 fuel operating modes, at “partial” (i.e., 4800 rpm and 65% thr. open.) and “high” (i.e., 5500 rpm and 100% thr. open.) engine operating points. According to the international bibliography, the NO formation mechanism is predominantly controlled by the cylinder charge temperature and the local oxygen excess ratio.
As far as the effect of engine operating point (combination of engine speed and % throttle opening) on BSNO is concerned, it is observed that, for the same spark timing and gasoline–ethanol mixture ratio examined herein, the simultaneous increase in engine speed and the (%) of the throttle opening results in a considerable reduction in the calculated specific NO concentrations. The specific decrease is mainly due to the fact that, with the transition from the “partial” (i.e., 4800 rpm and 65% thr. open.) engine operating point to the high one (i.e., 5500 rpm and 100% thr. open.), the brake power output increases while the local oxygen excess ratio inside the burning zone decreases since the air–fuel equivalence ratio (λα) also decreases tending towards stoichiometry. The reduction in the local oxygen excess ratio combined with the increase in the temperature of the burning zone leads to a reduction in NO concentration in the exhaust gas at the exhaust valve opening timing.
Concerning the effect of spark timing on the BSNO, it seems that, for the same EOP and the same FOP, the increase in the spark advance leads to a decrease in the calculated brake-specific NO concentrations. This impact appears to be more noticeable under the partial EOP. Considering that the change in SA timing does not affect the local oxygen excess ratio inside the burning zone, this effect may be ascribed to the increase in the calculated (Pe), despite the fact that the advance of the ignition timing causes an earlier start of combustion relative to the TDC position, which enhances the NO formation mechanism since the charge temperatures inside the combustion chamber increase.
Regarding the effect of the ethanol concentration in the gasoline–ethanol fuel mixture on the brake-specific NO concentration, it seems that for the same engine operating point (combination of engine speed and % throttle opening) and the same ignition advance, the gradual replacement of gasoline with ethanol leads to decrease in the calculated BSNO. This effect seems to be more evident for the “high” EOP. The BSNO concentration is analogous to the concentration of the nitric monoxide formed and is inversely analogous to the estimated (Pe). Considering the theoretical results, it is remarked that the increase in the concentration of ethanol in the gasoline–ethanol blend leads to an increase in the calculated brake power output. Furthermore, it is revealed that the engine operation, either under the G-E:70-30 or G-E:50-50 fuel operating modes, may result in a slightly higher maximum burning zone temperature compared to that observed under the conventional fuel operating mode (i.e., G-E:100-0). But, at the same time, during the expansion phase after the TDC position, the rate of decrease in the burning zone temperature appears more pronounced. As a result, the burning zone temperature under the conventional (G-E: 100-0) fuel operating mode becomes slightly higher compared to the values observed with the G-E: 70-30 and G-E: 50-50 fuel mixtures. By considering the aforementioned observations, along with the fact that the NO formation rate is influenced by the combustion temperature, it is understandable that the theoretical estimated NO formed under both FOPs, i.e., G-E:70-30 and G-E:50-50, is lower as compared to the respective values estimated under the conventional (G-E:100-0) operating mode.
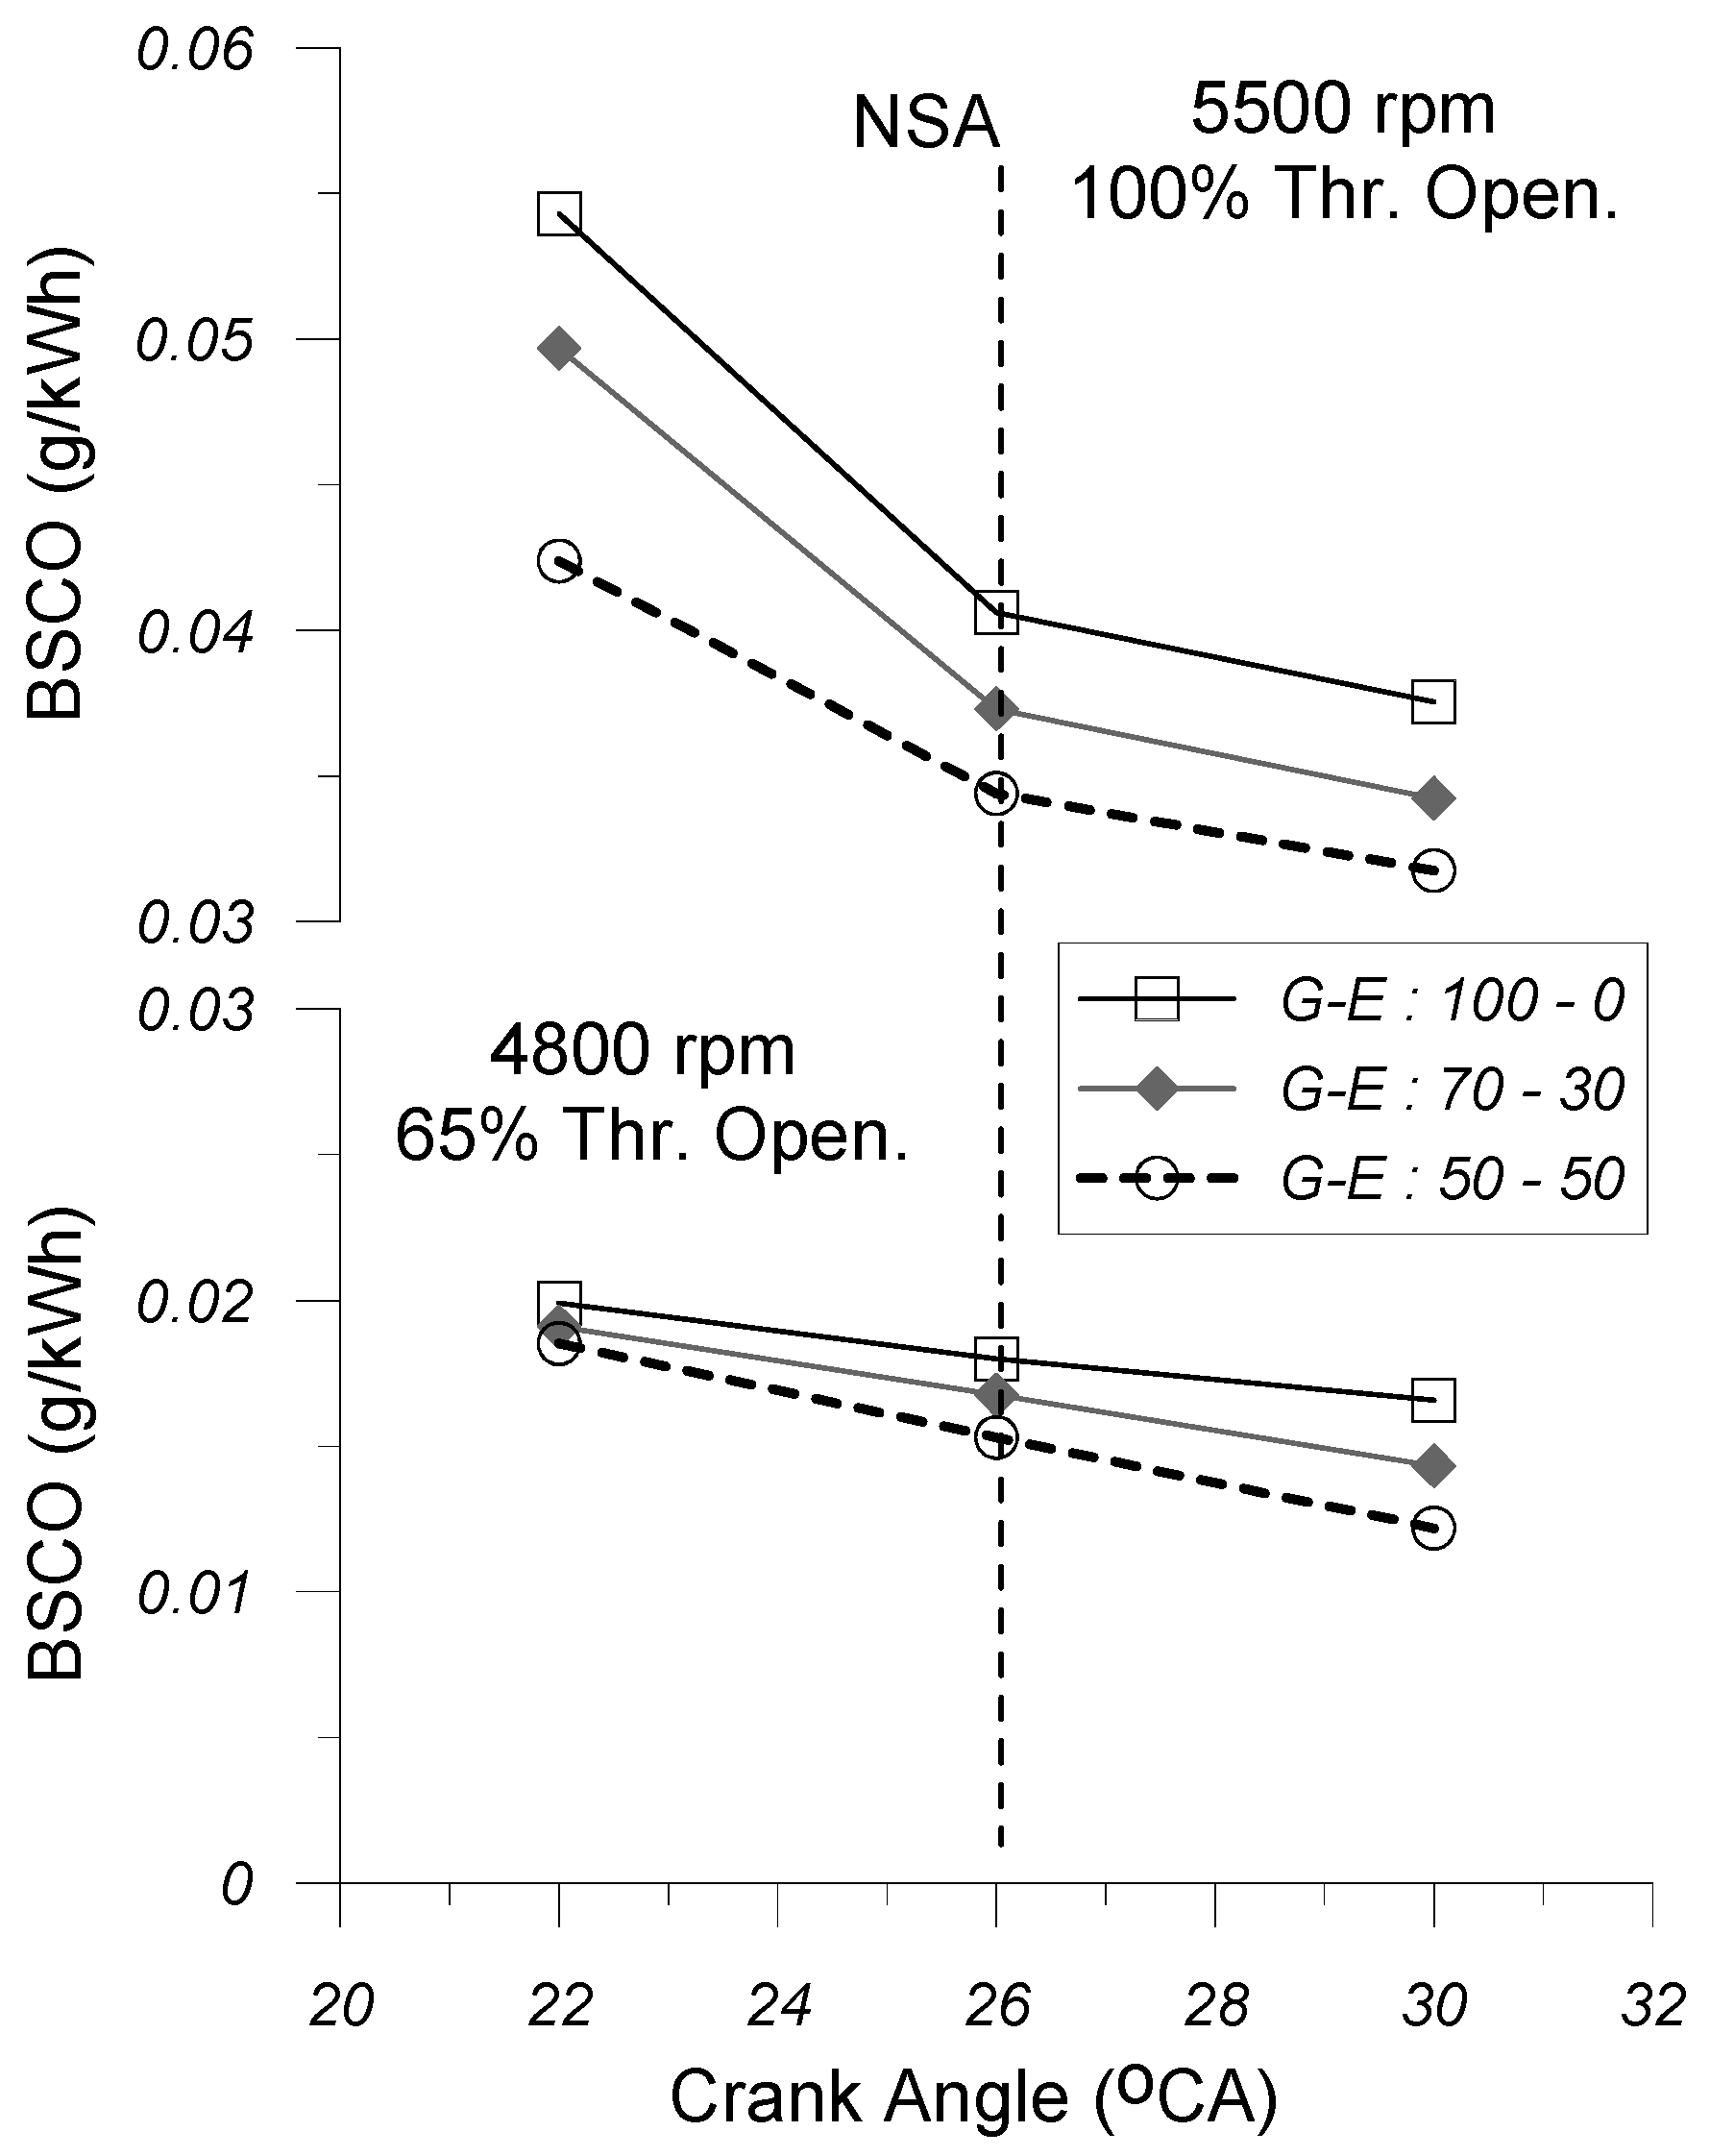
4.5. Brake-Specific CO Concentration
Figure 16 illustrates the alteration of the brake-specific CO concentration (BSCO) with spark timing (SA), under the G-E:100-0, G-E:70-30, and G-E:50-50 fuel operating modes, for the “partial” (i.e., 4800 rpm 65% thr. open.) and “high” (i.e., 5500 rpm and 100% thr. open.) engine operating points. According to the international bibliography, the CO formation rate depends on the relative air–fuel ratio, the unburned gaseous fuel availability, and the cylinder charge temperature. The latter two parameters control the rate of fuel decomposition and oxidation.
As far as the effect of the engine operating point (combination of engine speed and % throttle opening) on BSCO is concerned, it is observed that, for the same spark timing and gasoline–ethanol mixture ratio examined herein, the simultaneous increase in the engine speed and the (%) of the throttle opening leads to a slight increase in the theoretically estimated BSCO. The specific increase is mainly due to the fact that the transition from the “partial” (i.e., 4800 rpm and 65% thr. open.) engine operating point to the “high” one (i.e., 5500 rpm and 100% thr. open.) leads to a slight increase in the calculated (Pe), which is accompanied by an increase in the burning zone temperature, a factor that affects positively the formation mechanism of the CO. At the same time, the aforementioned transition results in the lower values of the local oxygen excess ratio observed inside the burning zone, since the air–fuel equivalence ratio (λα) decreases tending towards stoichiometry. The reduction in the local oxygen excess ratio combined with the increased combustion temperature leads to an increase in the CO concentration in the exhaust gas at the time the exhaust valve opens.
As far as the effect of SA timing on the BSCO is concerned, it is observed that for the same EOP and the same FOP, the increase in the spark advance leads to a decrease in the calculated brake-specific CO concentrations. This effect seems to become more obvious for the “high” EOP conditions. Taking into consideration the fact that the change in SA does not have an effect on the local oxygen excess ratio inside the burning zone, the specific effect may be primarily attributed to the increase in the calculated (Pe), despite the fact that the advance of the ignition timing causes an earlier start of combustion relative to the TDC position, which enhances the CO formation mechanism since the charge temperatures inside the combustion chamber increase.
Regarding the effect of the ethanol concentration in the gasoline–ethanol fuel mixture on the brake-specific CO concentration, it seems that for the same EOP and the same ignition advance, the gradual replacement of gasoline with ethanol leads to a decrease in the calculated BSCO. This effect appears to become more pronounced at higher engine operating conditions. By examining the model results, it is observed that, with the increase in the concentration of ethanol in the gasoline–ethanol blend there is an increase in the calculated brake power output. Furthermore, it seems that the engine operation, either under the G-E:70-30 or G-E:50-50 FOP modes, could result in a slightly higher maximum combustion temperature, as compared to the one observed under the conventional FOP (i.e., G-E:100-0). But, at the same time, the reduction rate for the combustion temperature noticed after the TDC position appears to be more noticeable during the expansion phase, where the in-cylinder combustion temperature observed under the conventional (G-E:100-0) mode becomes slightly higher in contrast to the respective values noticed under the G-E:70-30 and G-E:50-50 FOP modes. Taking into account all the above-mentioned remarks and also the fact that CO formation rate is contingent on the alteration of the combustion temperature, it is understandable that the theoretically estimated CO formed under both FOPs, i.e., G-E:70-30 and G-E:50-50, is lower than the respective concentration calculated under the normal fuel operating mode (G-E:100-0).
5. Conclusions
The main scope of the present work was to investigate, on a theoretical basis, the effects of variable spark timing and ethanol-supplemented fuel use on the performance and emission characteristics of a naturally aspirated, four-stroke, spark-ignited aircraft piston engine (i.e., ROTAX 912s). For this reason, the advanced simulating GT-POWER software was used.
A good coincidence of the main important performance characteristics was noted between the calculated and measured values, which correspond to the same EOP (i.e., 5500 rpm and 100% thr. open., 5000 rpm and 75% thr. open., 4800 rpm and 65% thr. open., and 4300 rpm and 55% thr. open.) and NSA under the NFO operating mode (i.e., G-E:100-0). A close agreement is observed between the computed and measured values of brake power output and brake mean torque across all test cases examined. A satisfactory agreement between calculated and experimental BSFC values was also observed.
Acknowledging the predictive ability of the model, this was used to examine the effects of the ethanol concentration in the gasoline–ethanol blend and the spark timing, for “partial” and “high” EOPs, on the cylinder pressure and heat release rate traces, brake power output, brake mean torque, BSFC, BSNO, and BSCO specific concentrations. Based on the evaluation of the theoretical results, the conclusions can be summarized as follows:
For each one of the three gasoline–ethanol ratios examined (G-E:100-0, G-E:70-30, and G-E:50-50), the simultaneous increase in engine speed and (%) of throttle opening by keeping constant the spark timing results in a decrease in the brake-specific fuel consumption and the specific NO concentrations. But, at the same time, it leads to a sensible increase in the maximum cylinder pressure. However, the aforementioned increase seems to affect negatively (slight increase) the brake-specific CO concentrations.
Moreover, for each one of the three gasoline–ethanol ratios examined herein (G-E:100-0, G-E:70-30, and G-E:50-50) and for the same EOP, the increase in spark timing relative to NSA = 26 degCA BTDC should lead to an increment in the brake efficiency (reduction in the BSFC) that seems to be more evident for the “partial” engine operating point. Specifically, at 4800 rpm and 65% throttle opening, the percentage reduction in the BSFC ranges between 3% and 5%, while at full engine loading conditions the reduction achieved is around 1%. Simultaneously, advancing the spark timing increases the maximum cylinder pressure, but this does not appear to negatively impact the engine’s structural durability, since the differences observed in the maximum cylinder pressures are so small that they could be considered negligible. Regarding the effect of SA on BSNO and BSCO specific concentrations, it is remarked that advancing the SA influences positively (decrease in specific NO and CO concentrations) the environmental behavior of the engine. At 4800 rpm and 65% throttle opening, the percentage reductions achieved in the specific NO and CO emissions are around 12% and 15%, respectively. On the other hand, at 5500 rpm and 100% throttle opening, the percentage reductions in the specific NO and CO emissions are about 3% and 6%, respectively.
Finally, as far as the effect of the gasoline–ethanol ratio on performance characteristics of the engine, it is noticed that for both of the EOPs examined, the engine operation at a constant SA either under the G-E:70-30 or G-E:50-50 FOP modes could lead to an increase in the BSFC, as compared to the respective value estimated under the conventional NFO mode. Specifically, at 4800 rpm and 65% throttle opening, the percentage increase in the BSFC ranges between 25% (at NSA = 26 degCA BTDC) and 34% (at SA = 30 deg CA BTDC), while for full engine loading conditions the respective increase observed for both spark advance timings is around 22%. At the same time, it does not appear to significantly affect the maximum cylinder pressure. Regarding the impact of the gasoline–ethanol ratio on the engine’s environmental behavior, it is shown that the gradual replacement of gasoline with ethanol has a positive effect, leading to a notable reduction in the specific concentrations of both NO and CO emissions. Specifically, at 4800 rpm and 65% throttle opening, the percentage reductions observed for the specific NO and CO emissions are around 5% (for all spark advance timings examined herein) and about 18% (for all spark advance timings examined herein), respectively. At 5500 rpm and 100% throttle opening and for all spark advance timings examined herein, the percentage reductions in the specific NO and CO emissions are about 9% and 14%, respectively.
The outcomes of this preparatory research are encouraging and motivate us to undertake a more comprehensive parametric study. Such research is currently in progress, and the initial results of this will be shared in the near future. While it is difficult to generalize the results of this preliminary investigation, we believe they are significant. Using ethanol as a supplementary fuel to gasoline, combined with increased SA timing in a light-duty SI aircraft engine, appears to be a promising approach to enhance engine efficiency and simultaneously improve its environmental behavior. This effect is particularly noticeable under partial-load conditions.


