Article

Effect of Humidity on the Energy and CO2 Separation Characteristics of Membranes in Direct Air Capture Technology

Department of Power Engineering and Turbomachinery, Faculty of Energy and Environmental Engineering, Silesian University of Technology, 44-100 Gliwice, Poland
*
Authors to whom correspondence should be addressed.
Energies 2025, 18(13), 3422; https://doi.org/10.3390/en18133422
Submission received: 22 May 2025 / Revised: 24 June 2025 / Accepted: 27 June 2025 / Published: 29 June 2025
(This article belongs to the Section B: Energy and Environment)

Abstract

Membrane-based direct air capture of CO2 (m-DAC) is a promising solution for atmospheric decarbonization. Despite growing interest, the impact of relative air humidity on the performance of m-DAC systems is often neglected in the literature. This study presents detailed parametric analyses that take into account humidity variability and several hypothetical scenarios regarding membrane selectivity toward water vapor. Specifically, cases were considered where the permeance of H2O relative to CO2 was assumed to be 0.5, 2, and 5 times higher, which allowed for a systematic assessment of the impact of relative humidity on process performance. The calculations were carried out both for membranes with assumed separation parameters and for the PolyActiveTM membrane, enabling a realistic evaluation of the influence of atmospheric conditions on the process. The results show that an increase in humidity in the analyzed range from 0 to 80% can lead to a rise in the energy intensity of the process by up to approximately 34%, and an increase in total power demand by around 29%. As humidity increases, key process parameters such as CO2 purity in the permeate and recovery rate decrease. The water vapor content in the permeate in a single-stage membrane separation process can reach up to 60%. It is recommended to use gas drying systems and to develop membranes with low H2O permeance in order to reduce the energy cost of the process. The potential location of m-DAC systems should preferably be in regions with low air humidity. The study highlights the necessity of considering local climate conditions and the need for further research on membrane selectivity.

Graphical Abstract

1. Introduction

Despite intensive efforts toward energy transition, global carbon dioxide emissions remain at a high level, significantly hindering the achievement of climate goals set out in the Paris Agreement [1]. The strategy based on the development of renewable energy sources (RES) and the electrification of sectors such as transport and heating [2,3,4], although essential, has proven insufficient to achieve the required scale of emission reductions. In 2023, total CO2 emissions from the energy sector rose to a record level of 37.2 Gt [5], confirming that in addition to decarbonizing various sectors of the economy, the implementation of CO2 sequestration technologies is necessary [1,6,7,8,9].
Carbon capture technologies, including both carbon capture and storage (CCS) and carbon capture and utilization (CCU), are playing an increasingly important role in climate neutrality strategies. Particular attention is being given to direct air capture (DAC), which—unlike conventional solutions focused on point sources of emissions—enables the removal of carbon dioxide already present in the atmosphere [10]. The growing commitment of global corporations such as Microsoft, Siemens, Aramco, and Amazon to achieving carbon neutrality, along with the rapid development of the carbon credit market, confirms the increasing importance of this technology in global climate strategies [11,12,13,14,15,16,17].
According to the International Energy Agency (IEA), by the end of 2024, 27 DAC facilities had been commissioned, with approximately 130 more in the planning or development stage [6].

1.1. Importance of DAC Installation Site Selection

Although the DAC process is theoretically independent of the location of emission sources, the literature consistently emphasizes the significant impact of local conditions on the energy intensity and cost of CO2 capture [17,18,19,20,21,22,23,24]. Key criteria for site selection include the following:
  • Climatic conditions—primarily temperature and humidity of the air;
  • Access to low-emission electricity and/or heat sources;
  • Existing infrastructure enabling CO2 transport, storage, or utilization;
  • Local and regional legal and political conditions, including subsidies and other forms of financial support.
From the perspective of process efficiency, climatic conditions play a particularly important role, especially depending on the applied technology. Variations in local weather parameters can lead to up to a threefold change in CO2 capture performance [18].
In the case of liquid-based technologies (L-DAC), the literature indicates a preference for regions with consistently high air humidity [18,19]. For example, An et al. [19] showed that for the calcium-looping-based process developed, among others, by carbon engineering [25], the highest capture rates (≥75%) are achieved in warm and humid climates (t > 17 °C, relative humidity ≈ 90%). At the same time, a decrease in temperature can increase the levelized cost of capture (LCOC) from 240 to 409 USD t/CO2.
Also in the case of technologies based on solid sorbents (S-DAC), climatic conditions significantly affect process performance. The study in [21] demonstrated that for installations using the amine-based sorbent Lewatit® VP OC 1065, consistently high temperatures can reduce the unit cost of capture by up to ≈ 40% compared to cool and humid locations. An additional advantage of tropical or hot and dry climates is the low seasonal variability of environmental parameters, which supports stable plant operation.
It is worth noting, however, that some analyses also highlight the potential of cold and dry regions, although without accounting for capital costs [26]. At the same time, attention is drawn to the lack of accurate CO2/H2O adsorption isotherm models for high humidity conditions and the limited availability of data on mass transport at very low temperatures. This may pose a barrier to accurate modeling and optimal siting of DAC processes.
Importantly, according to available analyses, as much as 25% of the Earth’s land surface may be unsuitable for the effective deployment of DAC technologies due to unfavorable environmental conditions [21].

1.2. Membrane Separation and the Impact of Local Climatic Conditions

The dynamic development of polymeric and composite membranes with high selectivity and CO2 permeability has led to increasing consideration of membrane separation in m-DAC systems [27,28,29,30,31,32,33]. By 2028, the first demonstration unit for this atmospheric CO2 capture technology is planned to be commissioned [34]. However, existing analyses presented in the scientific literature have focused almost exclusively on numerical simulations based on dry air and constant membrane selectivity toward air components [28,32,33,35]. As a result, the literature lacks assessments of the impact of local climatic conditions, which—as shown for L-DAC and S-DAC—can significantly affect the capture process efficiency.
In membrane separation systems, a key aspect influencing process performance may be the presence of moisture in the feed gas, as polymer membranes exhibit water vapor permeance several times higher than that for CO2 [29,36]. Additionally, as indicated in several studies, the presence of water vapor may lead to pore blockage in the membrane, thereby limiting its separation capacity, as well as to degradation of the membrane material due to swelling [37,38,39].
This phenomenon is particularly important for membrane technologies where the primary driving force is the difference in partial pressures across the membrane. In contrast, in humidity-driven systems, such as the “moisture-driven CO2 pump,” the humidity gradient is used as the driving force for CO2 transport [40]. In these systems, the presence of moisture is not an obstacle but a key element enabling effective CO2 transport through the membrane.
A review of the available literature revealed only one study that considered the presence of water vapor in the feed gas for conventional membrane separation processes. Castel et al. [29] noted the impact of water vapor in the feed stream on the composition of the permeate gas; however, they did not perform a comprehensive assessment of how varying air humidity affects the overall separation efficiency. Therefore, the lack of comprehensive data on the performance characteristics of m-DAC processes under variable humidity conditions remains a critical research gap.
In this article, to the best of the authors’ knowledge, a comprehensive parametric analysis of the impact of varying relative humidity of air on the performance characteristics of m-DAC systems is presented for the first time. This aspect has so far been largely overlooked in the literature concerning m-DAC systems. To address the lack of detailed data available in the literature, the conducted calculations incorporate different assumptions regarding water vapor selectivity for highly permeable membranes. The analyses were also performed based on the actual separation capabilities of the PolyActiveTM membrane. Thanks to the well-documented parameters of this membrane, it was possible to accurately assess the influence of changes in atmospheric air relative humidity on the performance characteristics of m-DAC systems.

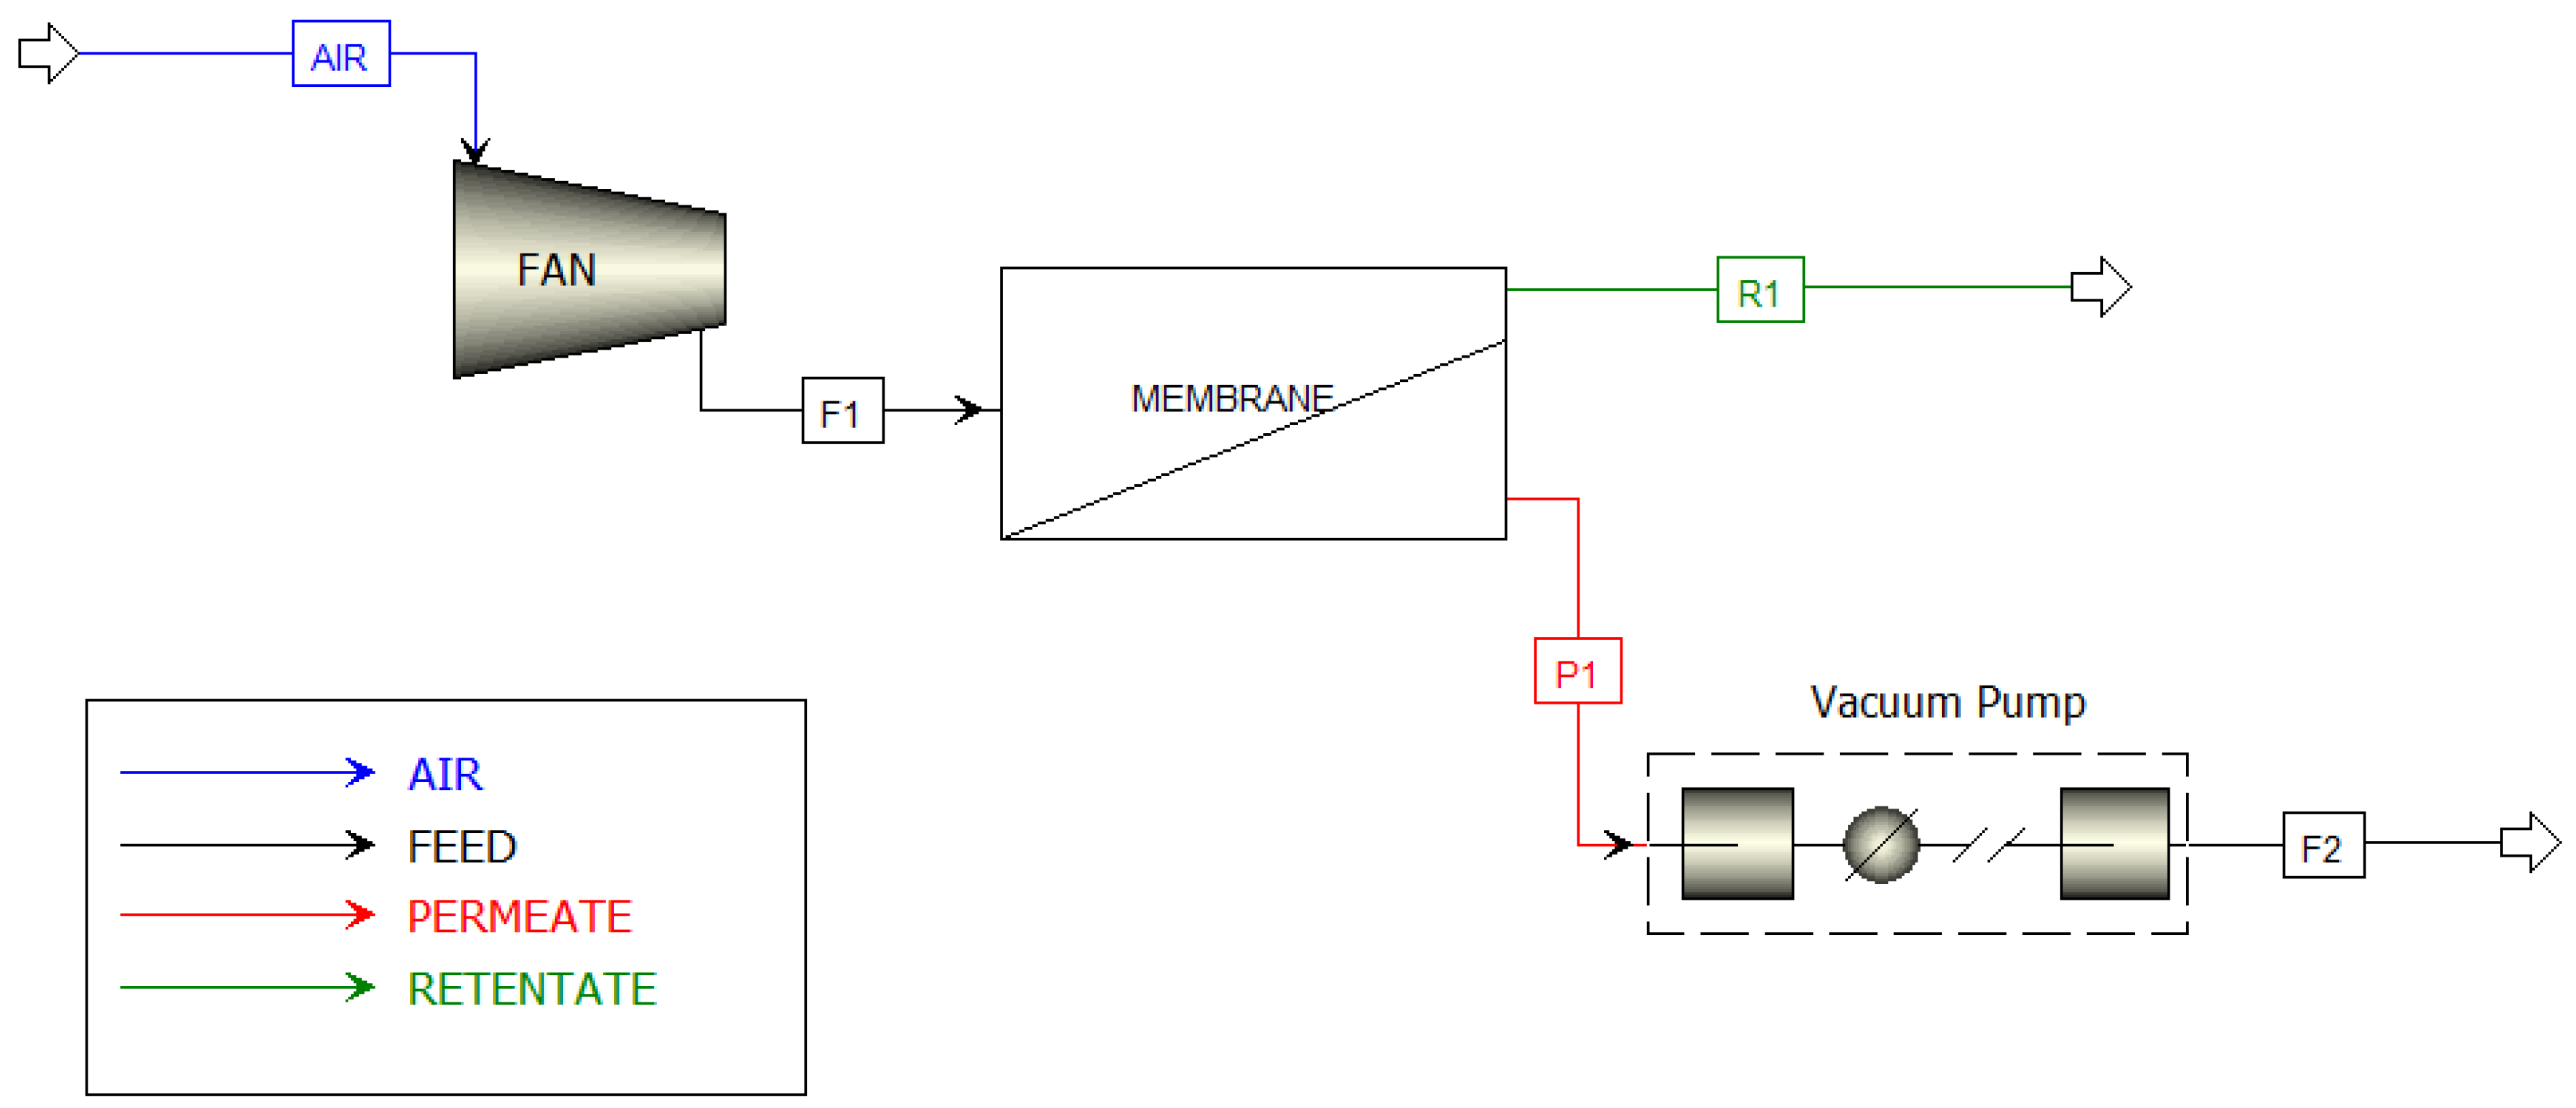
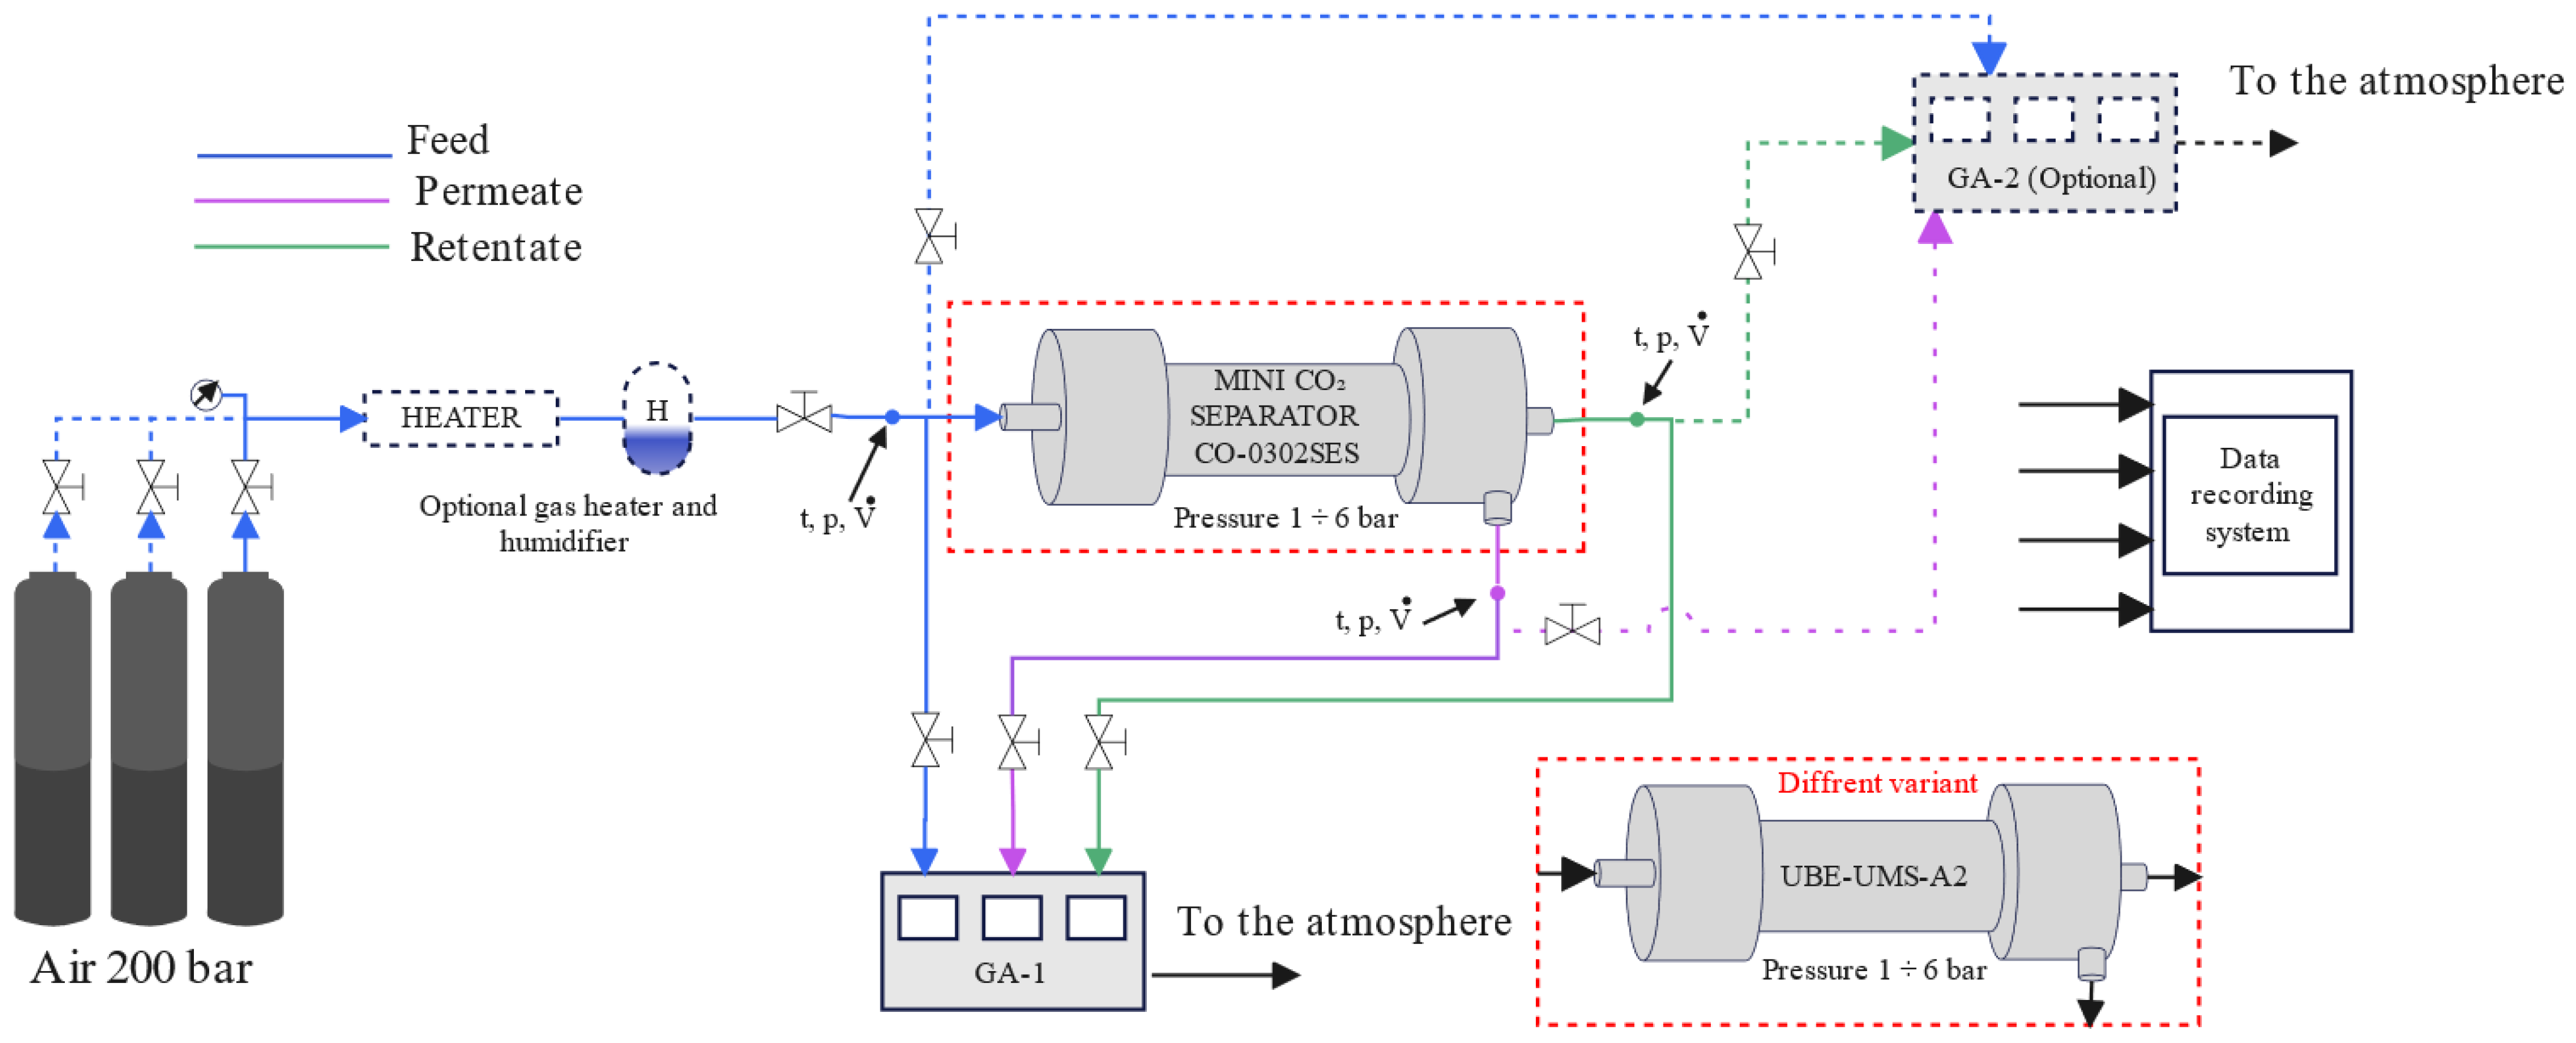
2. Materials and Methods

The modeling of the direct air capture process using membrane separation technology was carried out in Aspen Plus V.14, employing a model imported from Aspen Custom Modeler V.14. Detailed calculation assumptions, including the molar composition of air at 0% relative humidity (RH), are presented in Table 1. The applied mathematical model is based on the following assumptions:
  • The membrane module is built with cross-flow capillaries;
  • The process is carried out under isothermal conditions;
  • The values of gas permeance coefficients are constant throughout the operating range;
  • Atmospheric air is treated as a semi-ideal gas.
An important computational assumption is the maintenance of a constant pre-industrial CO2 concentration in the retentate stream at 300 ppm. This is achieved by selecting an appropriate membrane module surface area.
From a technical perspective, membrane gas separation is realized by creating a pressure difference across the membrane. This can be accomplished in three ways: by reducing the permeate side pressure (e.g., using a vacuum pump), increasing the feed side pressure (e.g., by compressing the gas), or employing a hybrid system that simultaneously compresses the feed and reduces the permeate pressure. However, results from the literature indicate that for membrane separation processes applied to direct air capture of CO2, the preferred configuration involves the use of a vacuum pump on the permeate side [28,29,32]. Such a solution is characterized by significantly lower energy demand compared to systems compressing the entire feed stream, which contains low CO2 concentration.
Consequently, in this work, a system configuration employing a vacuum pump on the permeate side and a booster fan on the feed side was analyzed. The booster fan’s role is to generate a slight overpressure on the feed side (atmospheric air) to facilitate its delivery to the membrane module. The process is driven by vacuum pumps modeled using compressor blocks to estimate the required energy. A schematic of the system modeled in Aspen Plus is shown in Figure 1.
The flux of a gas component permeating through the membrane J i can be determined according to Fick’s law [41,42]. According to this law, the flux J i depends on the membrane surface area A , the permeation coefficient P i specific to the gas component, and the partial pressure difference of that component across the membrane. Therefore, membrane separation may have limited efficiency for gases present at low concentrations when membranes with low permeance are used.
d J i = P i p F e e d Z i p P e r m Y i d A
where:
p F e e d —feed pressure;
p P e r m —permeate pressure;
Z —share of the gaseous component in the feed stream;
Y —share of the gaseous component in the permeate stream;
i —gaseous component—e.g., CO2.
Membrane selectivity is a key parameter, characterizing its ability to preferentially allow the passage of selected gas components while limiting the transport of others. It is defined as the ratio of the permeability or permeance of selected gas components, for example, for CO2 and N2 as presented in Equation (2). The permeance of individual gas components is typically expressed in gas permeance units (GPU, 1   G P U = 7.5 · 10 12 m 3 S T P ( m 2 · s · P a ) ) or in m 3 S T P ( m 2 · h · b a r ) . The literature shows considerable variation in the units used to express membrane permeance, which has been highlighted in works such as [30,31]. Therefore, in this article, permeance values are presented both in GPU and m 3 S T P ( m 2 · h · b a r ) units to facilitate comparisons and improve clarity for future researchers.
α C O 2 / N 2 = P C O 2 P N 2 = L C O 2 L N 2
The energy intensity of separating a selected gas component is one of the key parameters defining the efficiency of the process. It is also a fundamental criterion for comparing different CO2 capture technologies, largely determining the direction of their future development. In the case of membrane separation, the energy intensity of the process can be defined as the ratio of the power consumption of auxiliary equipment—such as compressors, fans, or vacuum pumps (depending on the analyzed configuration)—to the mass flow rate of the captured CO2 stream ( m ˙ P e r m C O 2 ). This relationship is described by Equation (3). The calculation methodology adopted does not take into account the heat flux that should be dissipated from the system for the purposes of compressing or drying the gas.
E s e p = N e l m ˙ P e r m C O 2 ,   k W h / k g C O 2
N e l = N e l , V P + N e l , W
N e l , V P —vacuum pump power requirement, kW;
N e l , W —fan power requirement, kW.
As indicated in work [32], the recovery ratio—although it plays an important role in CCS system analyses—has limited applicability in the context of m-DAC processes. This is due to the diffuse nature of CO2 in the atmosphere and the fact that a low recovery ratio does not lead to direct environmental contamination. Nevertheless, applying this indicator in analyses that account for variations in air relative humidity can be useful for assessing the impact of this parameter on the separation efficiency of the system. The recovery ratio is defined as the ratio of the amount of CO2 captured in the permeate stream to the total amount of CO2 supplied to the system, as described by the following expression:
R = m ˙ P e r m ( Y C O 2 ) m ˙ F e e d ( Z C O 2 ) · 100 %
where:
m ˙ P e r m —permeate mass flow, kg/h;
m ˙ F e e d —feed mass flow, kg/h.
The analysis of the impact of air relative humidity on system performance characteristics was carried out over a wide range, from 0% to 80% RH. To determine the composition of air at varying humidity levels, the following methodology was applied:
Specific humidity is the ratio of water vapor mass to dry air mass and is expressed by the following formula:
x w = 0.622 · R H · p s a t ( T ) p a t m R H · p s a t ( T )
where:
R H —relative humidity;
p s a t ( T ) —saturation vapor pressure at temperature T;
0.622—ratio of the molar mass of water vapor (18.015 kg/kmol) to that of dry air (28.965 kg/kmol).
The mass of water vapor contained in the air for every 1 kg of dry air is expressed by the following formula:
m H 2 O = x w ·   m a i r , d r y
where:
m a i r , d r y —mass of 1 kmol of dry air, in kg.
The mass of 1 kmol of dry air is calculated from the molar proportions of its components and the molar masses of the individual gases:
m a i r , d r y = i ( y i · M i ) · n
m i = y i · M i
where:
y i —molar fraction of component i in dry air;
M i —molar mass of component i;
m i —mass of component i;
n—number of mole, n = 1 kmol.
The total mass of humid air can, therefore, be determined using the following equation:
m a i r , h = m a i r . d r y + m H 2 O
where:
m a i r . d r y —mass of dry air;
m H 2 O —mass of water vapor.
The mass percentages of the various components of dry air in humid air are determined by the following formula:
w i = m i m a i r , h · 100 %

3. Results and Discussion

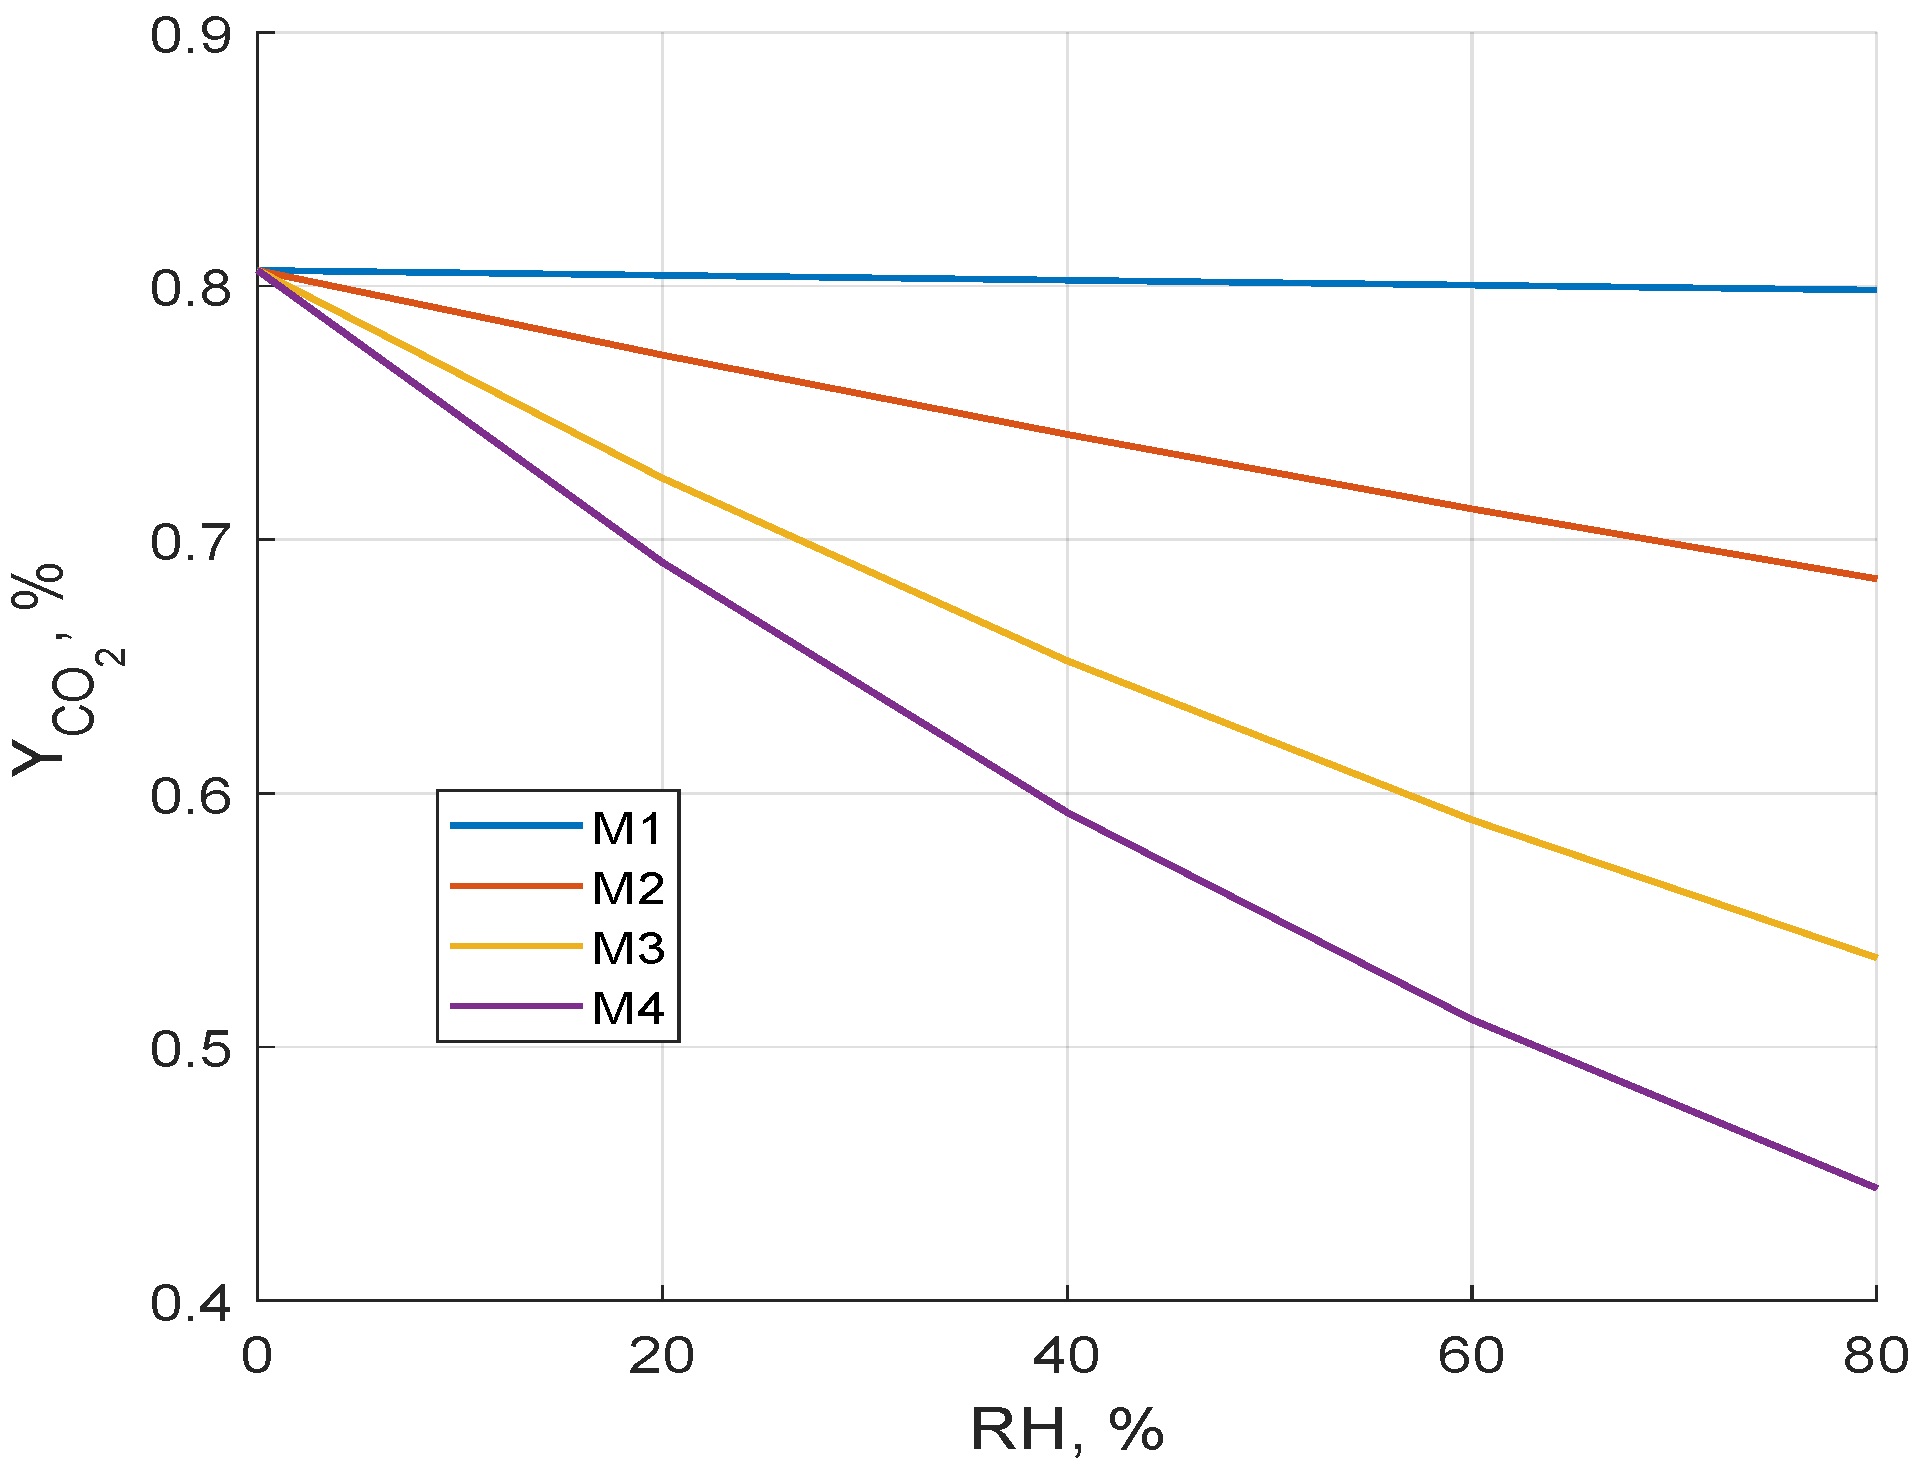
3.1. Membrane Selectivity and the Influence of Relative Humidity on CO2 Capture Efficiency

Membranes designed for direct CO2 capture from atmospheric air should exhibit high permeance toward the separated gas. Fujikawa et al. defined a minimum CO2 permeance value above 10,000 GPU as a requirement for achieving realistic membrane module sizes [28]. The separation process efficiency should also guarantee a selectivity greater than 30 with respect to other gas components, and the process should ensure a CO2 concentration of approximately 300 ppm in the retentate stream released into the atmosphere. Several experimentally obtained membranes meeting this specified CO2 permeance criterion are reported in the literature [28,43,44,45,46]. However, authors rarely provide selectivity parameters relative to other atmospheric air components such as O2, N2, or H2O. This represents a significant challenge when assessing the actual separation capabilities of the reported materials concerning atmospheric composition. This issue is particularly critical considering the presence of water vapor, as Castel et al. indicate that polymer membranes exhibit very high permeance, usually several times higher for H2O compared to CO2 [29].
This problem is illustrated in Figure 2, which presents results from an analysis of the impact of varying relative humidity of air on the permeate purity under different assumptions regarding membrane separation properties—consistent with the data presented in Table 2. In this study, four types of membranes (M1–M4) were considered to evaluate the impact of membrane selectivity on the efficiency of the direct air capture of CO2.
  • Membrane M1 represents a commonly used assumption in the literature of constant selectivity of the membrane toward CO2 relative to other air components. Its separation parameters correspond to the minimal limiting values reported by Fujikawa et al. [28].
The separation properties of membranes M2–M4 were assumed considering that the literature often does not report selectivity relative to other gases present in air, and that water vapor exhibits significantly higher permeance than CO2. Using Equation (2), the following scenarios were adopted for membranes M2–M4:
  • Membrane M2 corresponds to a scenario where the permeance of water vapor (H2O) is 0.5 times the permeance of CO2.
  • Membrane M3 assumes that the permeance of H2O is twice as high as that of CO2.
  • Membrane M4 considers the case where the permeance of H2O is five times higher than that of CO2.
These assumptions enable the evaluation of the influence of humidity and the relative permeance of water vapor on the CO2 separation efficiency across a wide range of membrane parameters. The calculations were performed by inputting the specified membrane selectivity values presented in Table 2 into the mathematical model described by Equation (1).
It is also worth noting that oxygen permeance is generally higher than nitrogen permeance, which further complicates the separation process [29,47,48]. However, due to the dominant share of nitrogen in air composition and the focus on analyzing the impact of relative humidity, this aspect was omitted at the current stage. Thus, membrane selectivity relative to nitrogen and oxygen was assumed to be constant. Atmospheric air also contains small amounts of argon, which is a chemically inert gas. For this reason, membrane selectivity relative to Ar was also maintained at a constant level. Calculations were performed for a single-stage membrane separation process with relative humidity varying from 0% (dry air) to 80%.
According to the results of the conducted analyses, assuming a constant selectivity value α C O 2 / x in simulation calculations may lead to significant errors in assessing the effectiveness of the CO2 separation process in the case of humid air. A constant selectivity can only be justified in analyses based on dry air, as an increase in relative humidity significantly affects the actual separation capability of the membrane with respect to CO2.
Even in the optimistic scenario where the water vapor permeance for membrane M2 is twice as low than the CO2 permeance (which implies a significant limitation of H2O permeance compared to typical values in the literature), a noticeable influence of air humidity on the purity of the obtained permeate is observed. For RH = 80%, the permeate purity decreases from 0.8% to 0.7% compared to membrane M1.
For extreme cases among the analyzed membrane variants, characterized by different selectivity levels toward H2O, permeate purity may drop from 0.80% down to as low as 0.35%. Although this difference may seem small at first glance, in the context of membrane CO2 capture from air, the first separation stage plays a crucial role. It primarily determines the overall process effectiveness, influencing both the energy requirements of subsequent stages and the overall process efficiency [32].
The impact of varying relative humidity of air on the energy intensity of the CO2 capture process for different assumed hypothetical membrane separation properties is presented in Figure 3. An increase in relative humidity leads to a clear rise in the energy demand of the process for membranes with low selectivity toward H2O. For dry air, analyses indicate an energy intensity of approximately 12.7 kWh/kg CO2. For membrane M1, for which constant selectivity toward all components of the gas mixture was assumed, changes in relative humidity do not significantly affect the energy intensity of the process. A different situation occurs for membranes characterized by higher water vapor permeance relative to CO2—for example, membrane M4, where five times higher H2O permeance compared to CO2 was assumed, shows an increase in energy intensity up to 16.5 kWh/kg CO2 for RH = 80%.
The observed increase in energy intensity with rising relative humidity, especially for membranes with higher H2O permeability, can be explained based on the adopted mathematical model describing gas transport through the membrane (Equation (1)), as well as the changes in the concentration of individual gas components with increasing humidity. This effect arises from the much higher permeability of H2O compared to CO2 for the analyzed membranes M3 and M4, causing an increase in humidity to lead to a clear rise in the share of water vapor in the permeate stream.
According to Equation (1), the flux of a given component through the membrane depends directly on the partial pressure difference and the permeation coefficient. For the analyzed hypothetical membranes, both the higher H2O concentration in the feed gas (under conditions of elevated humidity) and the much higher permeability coefficient of water vapor indicate its dominant permeation through the membrane. As a consequence, when the energy intensity of the process is related to the amount of CO2 separated, the increased H2O flux in the permeate, resulting from the higher permeability and greater water vapor content in the feed gas, leads to a significant increase in the total flow of separated gas of lower purity (Figure 2), which must be handled by the vacuum pump. This increases the energy demand and, consequently, the energy intensity of the process.
It is worth emphasizing that even membrane M2, which has approximately two times lower permeability of H2O compared to CO2, shows noticeable sensitivity to the actual humidity of ambient air in terms of process energy intensity. This results directly from the much higher concentration of water vapor in humid air compared to the concentration of CO2.

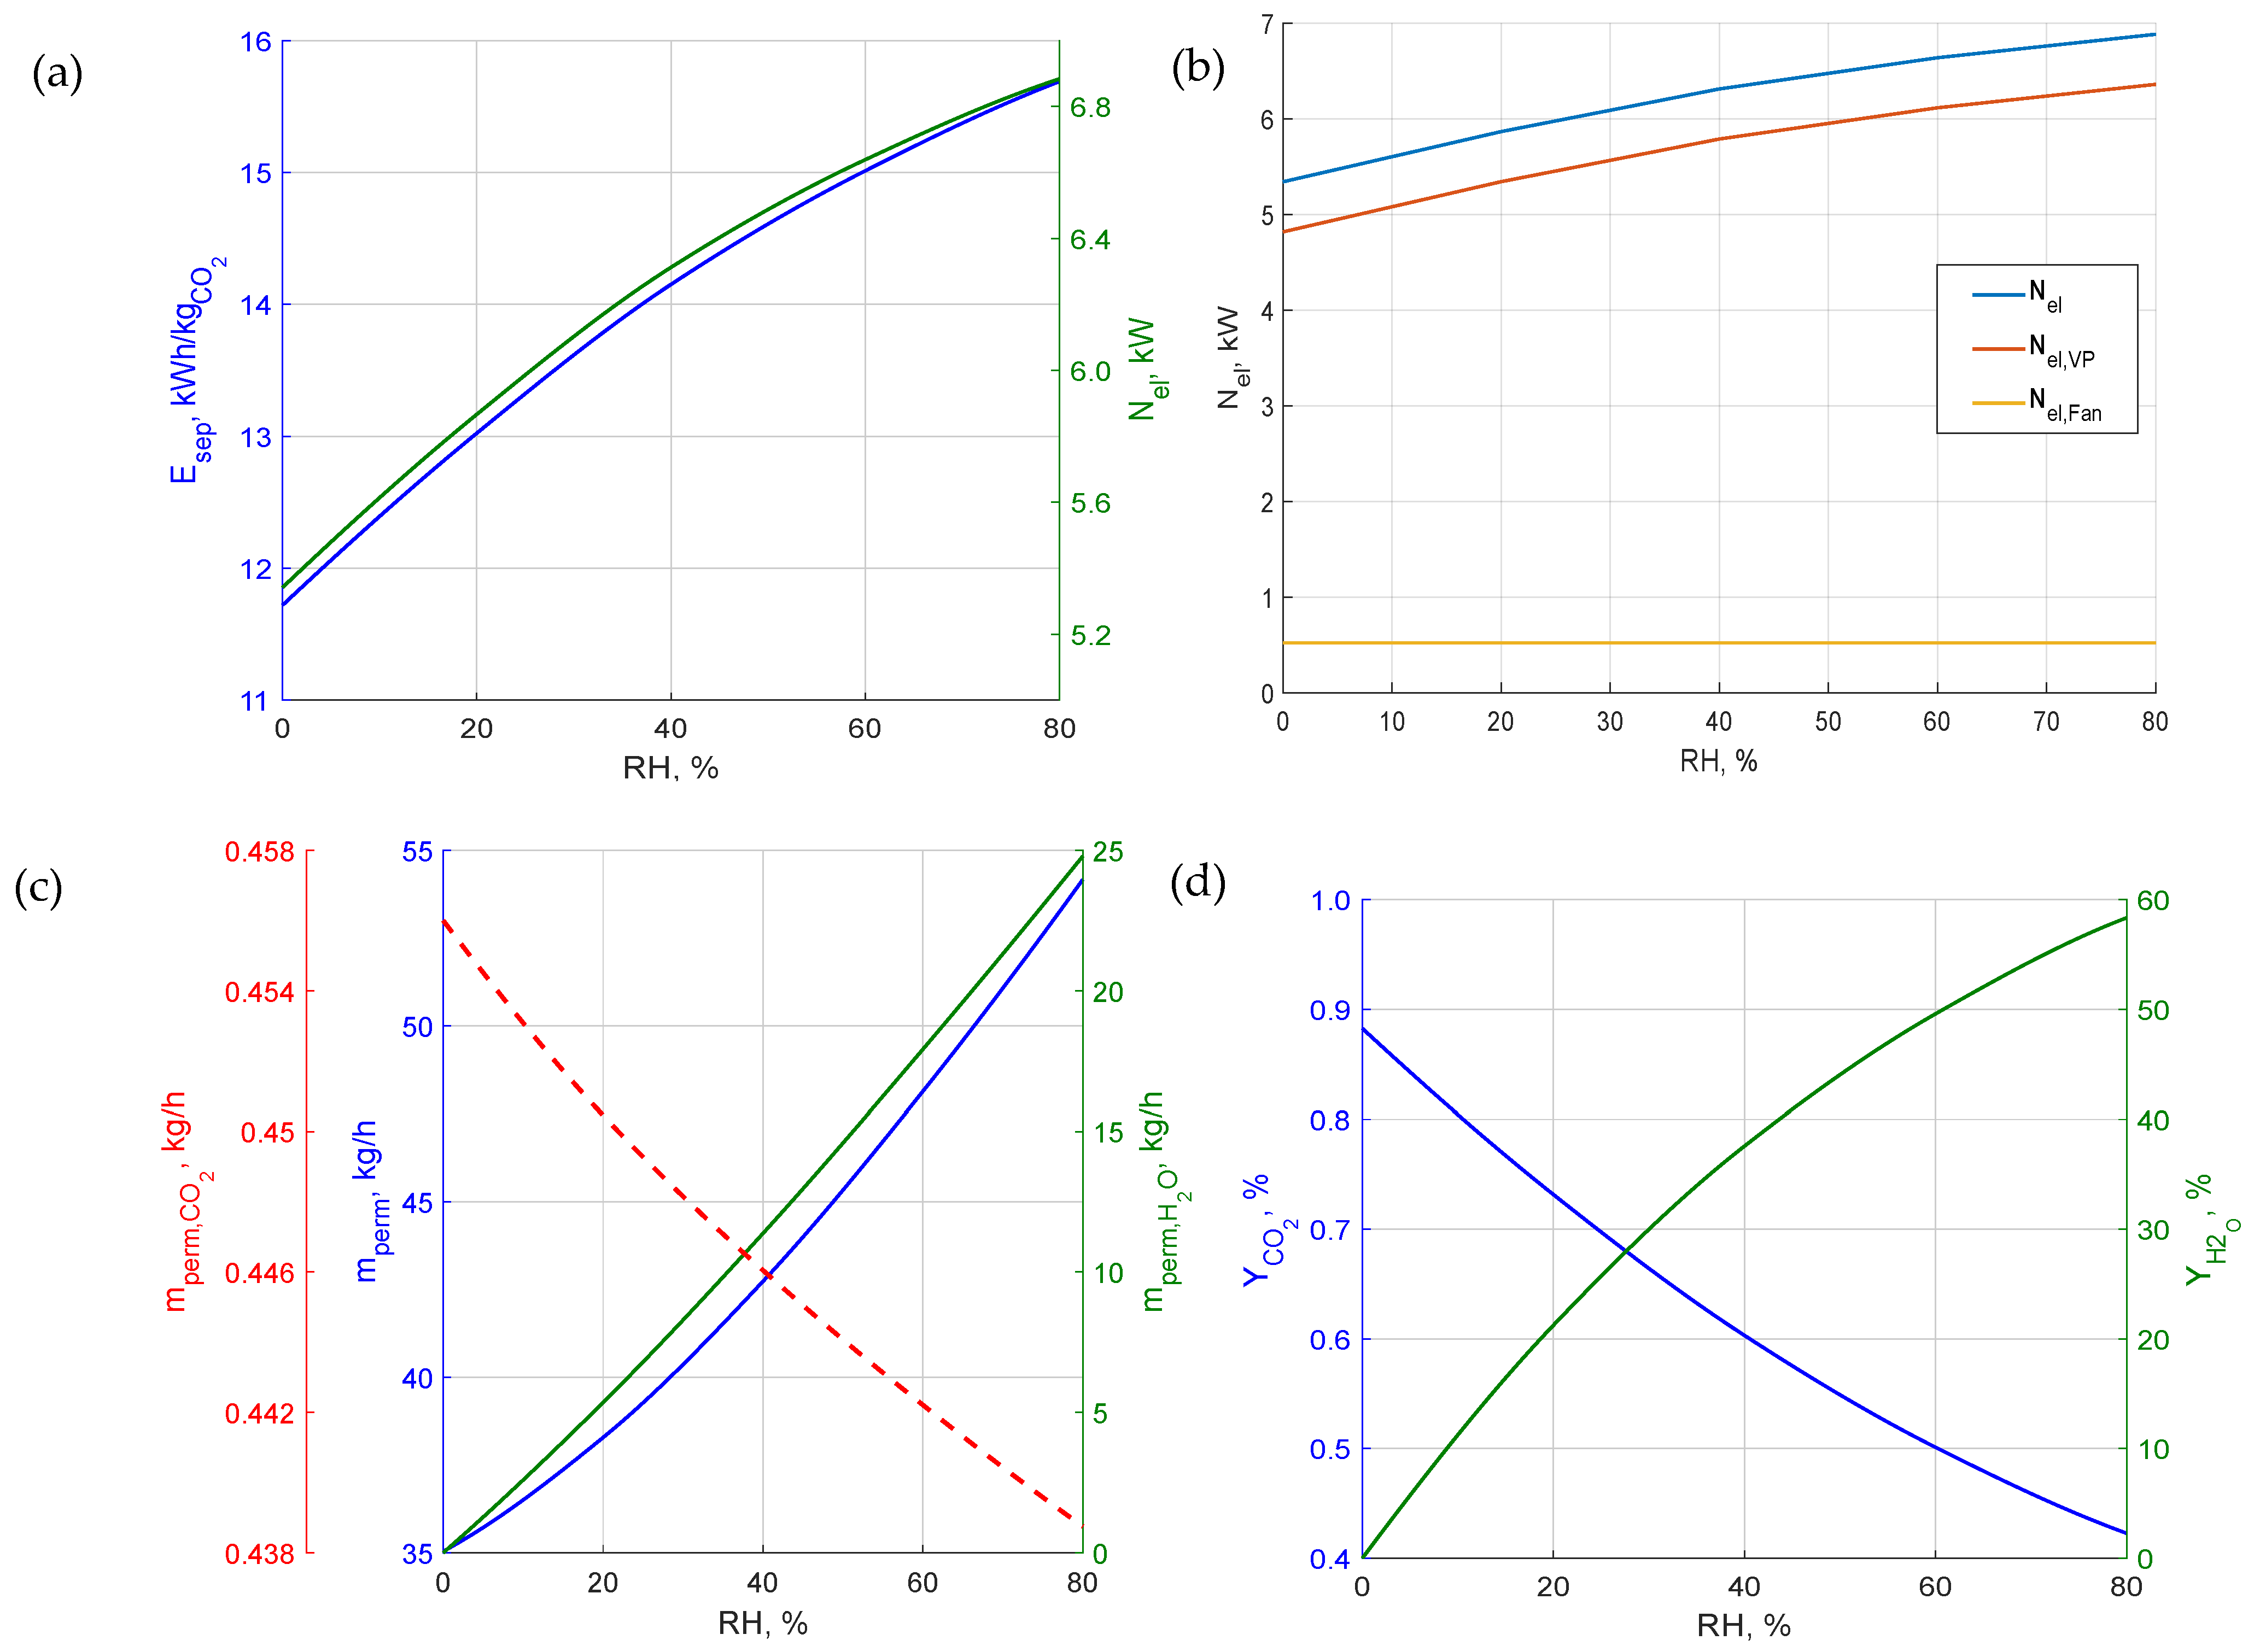
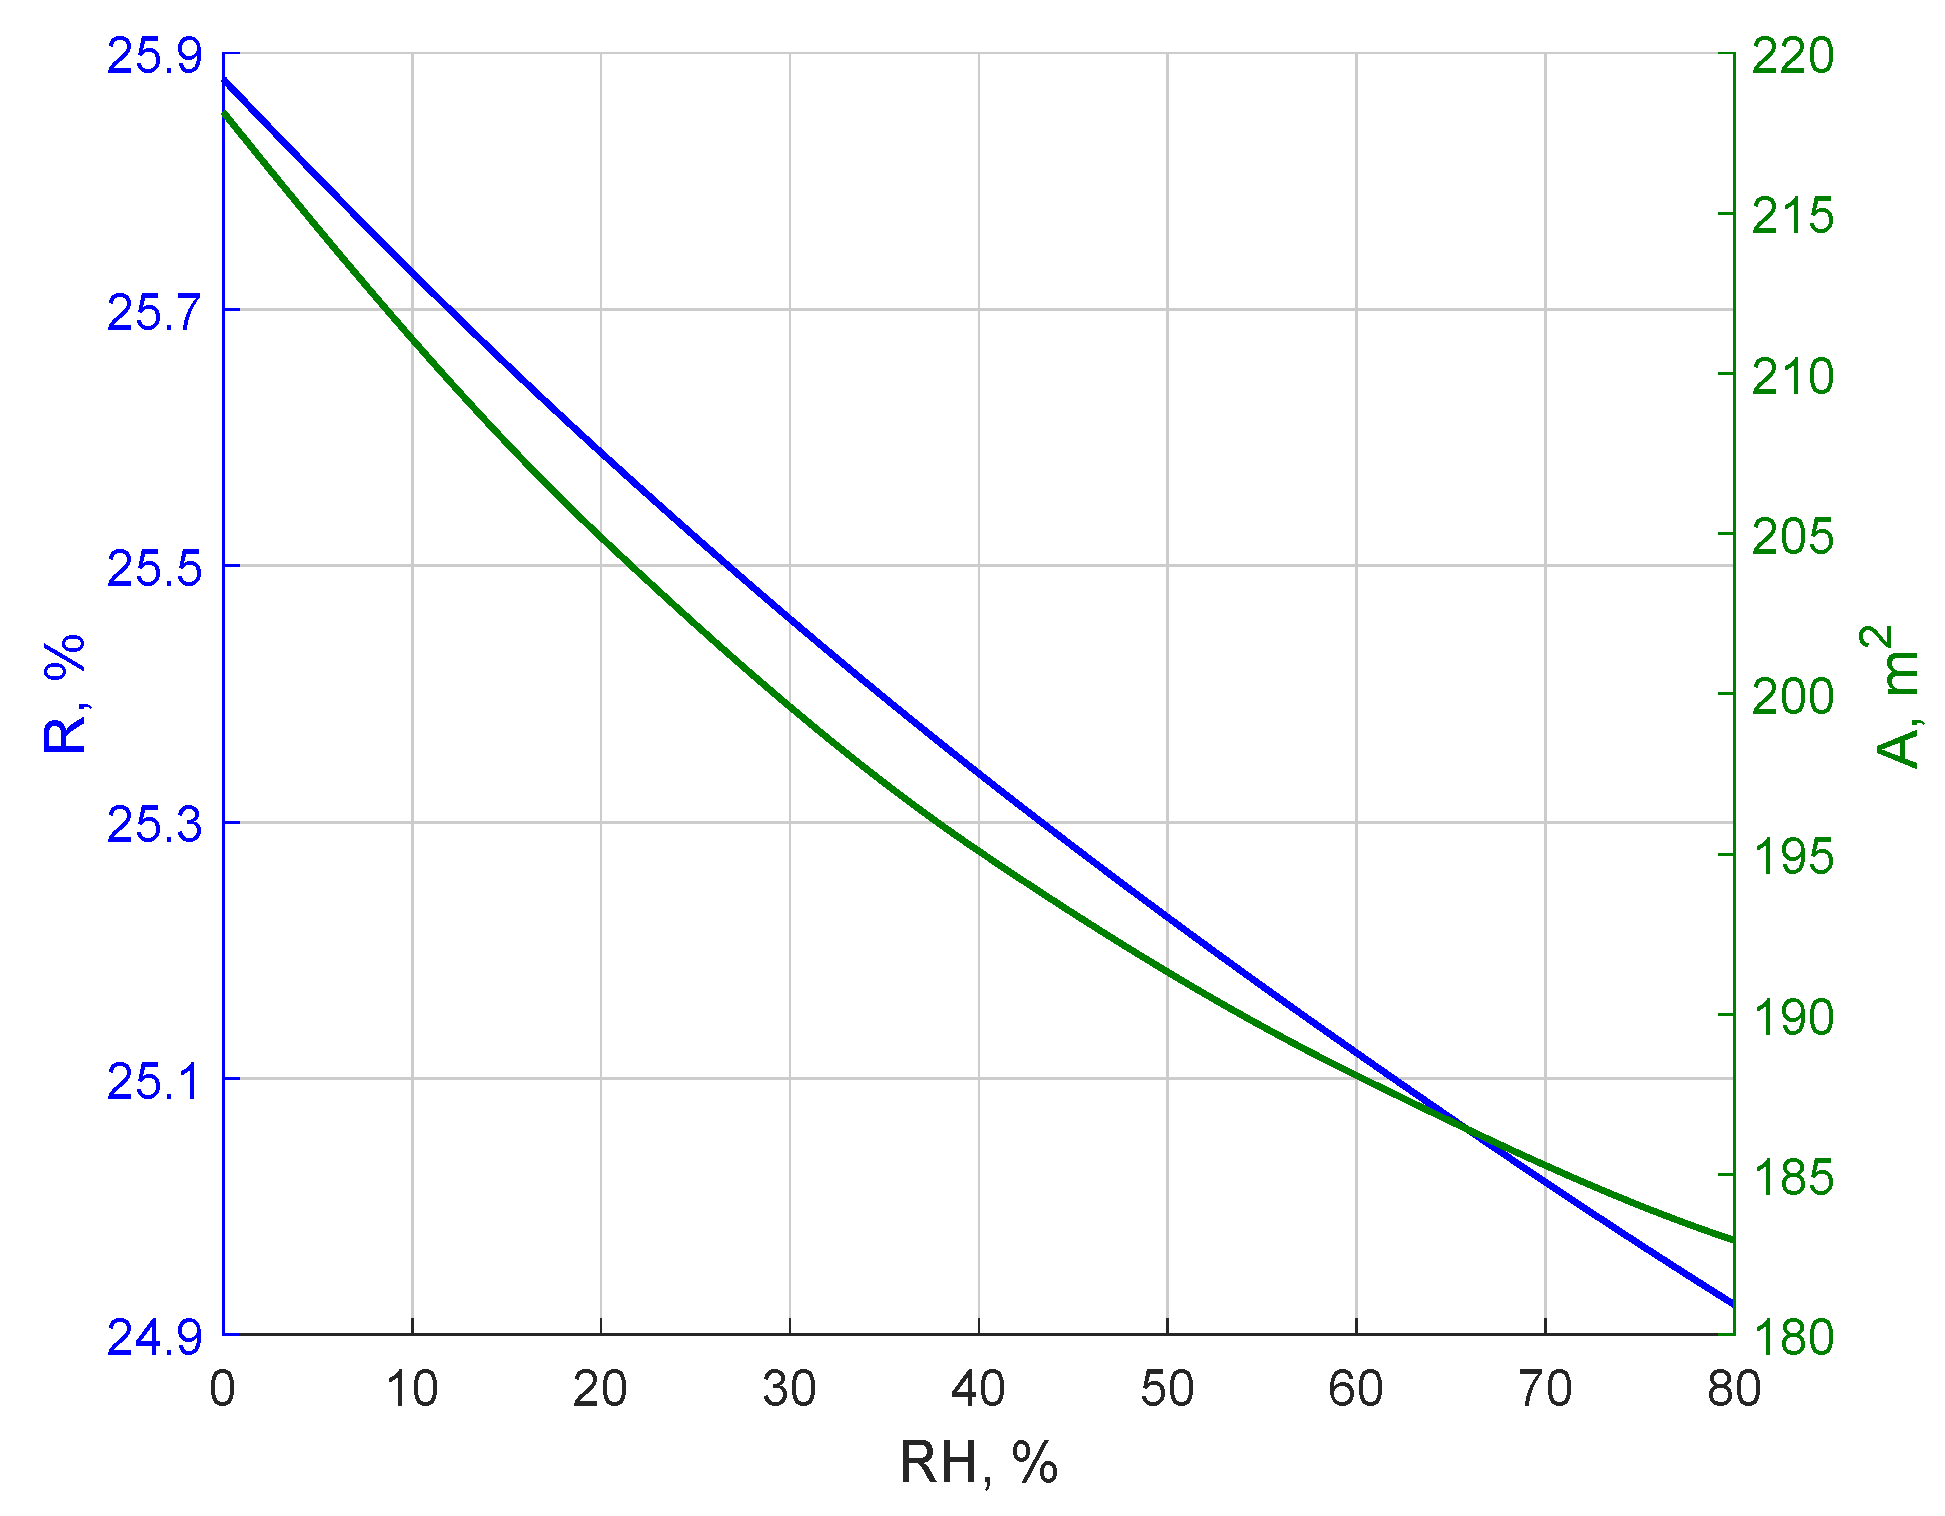
3.2. Analyses for the PolyActiveTM Membrane

Although the presented analyses allow for determining the impact of changes in atmospheric air relative humidity on the performance characteristics of the m-DAC system, the membrane separation properties were assumed purely hypothetically due to the lack of precise data regarding selectivity toward other gases in the literature.
Therefore, additional analyses were carried out based on the separation properties of a multilayer thin-film composite membrane with an active separation layer made of PolyActiveTM. This membrane has been tested within pilot-scale CCS installations [47,48]. Although PolyActiveTM does not meet the CO2 permeance criteria established by Fujikawa et al. [28], its well-documented separation properties toward individual gases allow for a reliable assessment of the impact of air humidity variation in m-DAC systems on their performance characteristics, assuming that newly developed membranes have a similar selectivity coefficient α C O 2 / H 2 O . Castel et al. also applied a similar methodology in their work to demonstrate the impact of moisture presence on the retentate composition; however, their analysis was conducted on a very limited scale and did not account for variability in relative humidity of air [29]. The separation parameters of the PolyActiveTM membrane are presented in Table 3 [48]. No information was found regarding argon permeance; instead, as in previous analyses, the selectivity toward argon was assumed to be equal to the selectivity toward nitrogen.
The conducted analysis assessed the impact of changes in atmospheric air relative humidity in the range from 0% to 80% on the performance characteristics of a single-stage membrane separation process. To enable a multi-criteria evaluation of the effect of relative humidity on the performance of the m-DAC system, selected process parameters are presented in the form of a radar chart (Figure 4). The presented data have been normalized with respect to the maximum and minimum values for each analyzed indicator, allowing for direct comparison of the impact of humidity on all key aspects of the process in a single graphical form. The use of normalized values enables direct comparison of parameters with different units and scales, thus providing an unambiguous identification of the optimal operating conditions of the system.
The analyzed parameters include energy intensity of separation, CO2 purity in the permeate stream, CO2 recovery rate, mass flow of captured CO2, and required membrane surface area. The results clearly indicate that an increase in relative humidity from 0% to 80% leads to a systematic deterioration of all process parameters except for the required membrane surface area, which is smallest at the highest humidity. The best results in terms of energy intensity, purity, and the separated CO2 flow were obtained for RH = 0%, indicating a significant negative impact of water vapor presence on the efficiency of CO2 separation.
Detailed results are presented in Figure 5. The curve showing the energy intensity of the CO2 capture process and the power demand as a function of the relative humidity of the atmospheric air is shown in Figure 5a. Across the entire analyzed RH range (0–80%), the energy intensity of the CO2 capture process increases from approximately 11.72 kWh/kg CO2 to 15.69 kWh/kg CO2, which represents an increase of about 34%. Simultaneously, the total power demand of the system increases from about 5.34 kW to 6.88 kW, i.e., by approximately 29%. According to the data presented in Table 3, the membrane exhibits about ten times higher permeance for water vapor compared to CO2, which significantly affects the efficiency of the gas mixture separation and leads to increased energy requirements—especially at high vacuum levels on the permeate side.
As shown in Figure 5b, the vacuum pump demonstrates the greatest sensitivity to changes in RH regarding power demand. In contrast, the power consumption of the feed fan remains relatively constant throughout the analyzed range, which is due to the fact that the increase in relative humidity of the air does not significantly affect its composition before entering the membrane module, and the supplied air flow is constant. Only on the permeate side, for membranes favoring water vapor permeation, the increased H2O content can notably influence the energy characteristics of the system.
A high RH value under conditions where a membrane favoring water vapor permeance is used results in a significant increase in the total gas flux passing through the membrane. This, in turn, leads to an increase in power demand and energy intensity per unit of separated CO2. This correlation is well illustrated by the analyses presented in Figure 5c,d, where a clear increase in the water vapor share in the permeate stream and a simultaneous decrease in CO2 content in this stream can be observed as RH increases. Depending on the analyzed level of relative humidity, the permeate may contain from 0 up to even 60% (volume) of water vapor, while the CO2 content remains relatively low, ranging from about 0.9% down to 0.4%.
However, it should be noted that the constant CO2 content in the permeate stream results directly from the calculation assumption, according to which the maximum CO2 concentration in the retentate stream was set at 300 ppm—following the approach proposed by Fujikawa et al. [28].
A high content of water vapor in the permeate stream poses a significant challenge for the implementation of multi-stage membrane separation processes. Directing the permeate stream, which has not been previously dried, carries the risk of damaging membranes in subsequent stages of the process. The presence of water vapor can lead to pore blockage in the membrane, thereby limiting its separation capacity, as well as to degradation of the membrane material due to swelling [37,38,39]. Additionally, the significantly higher permeance of H2O compared to other components of the gas mixture prevents achieving a high-purity CO2 stream, which is crucial in applications such as geological storage or further chemical conversion of CO2. For this reason, the system requires appropriate drying of the permeate stream before directing it to the subsequent separation stages or pre-drying of the feed air before it enters the membrane.
Such a solution was applied by Li et al. [49], who in their experimental work studied the m-DAC process integrated with methanation (m-DAC-M). Although the authors did not analyze in detail the impact of relative humidity and water vapor permeance, being aware of the high permeance of H2O, they used an ice trap to remove excess moisture from the permeate, which enabled obtaining a CO2 stream of higher purity, suitable for further chemical conversion.
Assuming complete condensation of water vapor in the permeate, an increase in water vapor concentration in the feed stream may translate into an increase in permeate purity (after condensation) due to the dilution of CO2 [36]. Based on this assumption, the parameter Y C O 2 , reflecting the CO2 share in the dry permeate, was determined and is presented in Table 4.
An increase in the humidity of the air also translates into a decrease in the CO2 recovery rate. This relationship, along with the required membrane area for different levels of relative humidity, is shown in Figure 6. Although this parameter does not play a key role in m-DAC systems—unlike in L-DAC units, where sorbent regeneration is carried out using natural gas and flue gases are recirculated to achieve negative emissions—it nevertheless provides important information about the efficiency of the process. In the conducted analyses, the maximum CO2 recovery rate did not exceed 26% across the entire range of examined relative humidity values. Moreover, the increase in humidity did not cause a significant decline in this indicator.
The only identified positive effect of increased relative humidity is a reduction in the required membrane surface area. Given the high permeance of the membrane to water vapor and the assumption of a constant concentration of CO2 in the retentate (300 ppm), permeate flow decreases with increasing RH. This results from the high membrane permeance to H2O and low selectivity towards other gas components, leading to their low concentration in the permeate stream. Consequently, the retentate flow increases, and along with it, the amount of CO2 that must be supplied to the system to maintain the set concentration. This phenomenon is also well illustrated by the recovery rate characteristics.
Under the assumed calculation conditions, the reduction in membrane area was relatively small—ranging from 273 m2 to 183 m2 for the extreme RH values. However, it should be emphasized that the analyses were conducted for a relatively low feed flow. For larger flow rates, a scale effect should be expected and increasing membrane area requirements may have significant economic implications for the overall process.

4. Opportunities for Dehumidification with DAC Technologies

Due to the relatively high energy demand associated with DAC, the integration of an additional air-drying step may further increase the overall process energy intensity. Consequently, one of the key strategies discussed in the literature is the identification of optimal siting conditions for DAC systems. Depending on the technology employed, either humid or dry climates may be preferable. Several air-drying methods are known, including cooling the air below its dew point or applying adsorption-based dehumidification. Among these, adsorption techniques are considered the most promising for integration with DAC systems. For example, the National Aeronautics and Space Administration (NASA) has developed a system that couples air dehumidification with CO2 capture using separate solid sorbents [50]. This technology is being investigated for potential use in long-duration space missions, such as crewed missions to Mars, where maintaining optimal air composition is essential. To reduce the energy consumption of the air-drying process and increase overall system efficiency, rotating adsorption modules are being developed [51]. These devices operate continuously by alternating between adsorption and desorption zones. By utilizing the low-grade heat from the exhaust air stream for sorbent regeneration, the system can significantly reduce the need for an external heat source.
For m-DAC processes, their integration with air-conditioning systems is being considered. These systems aim to maintain optimal carbon dioxide concentrations in enclosed spaces [28]. Elevated CO2 concentrations, which can significantly exceed 1000 ppm in densely populated environments such as sports arenas or office spaces, can significantly increase the efficiency of membrane CO2 separation [28,52]. This is important because increased CO2 levels can negatively affect user comfort, as well as cognitive performance, concentration and overall quality of work [53]. The integration of m-DAC systems with heating, ventilation, and air conditioning (HVAC) units also allows for humidity control, which can improve the performance of the membrane process when operating in humid conditions. In addition, the use of m-DAC technology is being considered as part of hybrid systems in which membranes are used as a purification unit. Depending on the initial separation technology used, this configuration makes it possible to optimize membrane operating conditions, for example by increasing the concentration of CO2 in the feed stream. This can help mitigate the negative effects of water vapor on the overall separation efficiency.

5. Perspective

In future studies, experimental analyses of direct carbon dioxide capture from air using membrane separation technology are planned. Conducting experimental studies will primarily allow for verification of currently used numerical models.
A schematic of the planned laboratory stand is shown in Figure 7. Experiments are planned to be carried out under positive pressure conditions on the feed stream side, which greatly simplifies the implementation of the process on a laboratory scale compared to processes carried out under high vacuum conditions. Atmospheric air will be supplied to the system from a compressed air cylinder, which will allow a high level of cleanliness to be maintained, as an industrial or pilot plant would most likely be equipped with filters to remove particulate contaminants. In addition, the use of air from a cylinder allows for flexible regulation of its composition in terms of carbon dioxide concentration (which can be much higher indoors than outdoors, for example). The laboratory stand is also equipped with an optional gas heater and humidifier, allowing analyses to be carried out reflecting various atmospheric conditions. Importantly, the planned laboratory experiments will also enable the evaluation of long-term degradation of membrane separation properties under humid gas conditions, which is essential for assessing the durability and operational stability of membranes in realistic DAC environments.
Experimental measurements are planned to use commercially available membranes dedicated to CO2 separation, such as UBE-UMS-A2 and MINI CO2 SEPARATOR CO-0320SES [54]. This selection of membranes will ensure the possibility of conducting experiments over a wide range of operating parameters under safe operating conditions while simultaneously verifying the applied numerical models.
Moreover, future simulation studies will analyze the impact of real atmospheric conditions for selected locations, such as air humidity and temperature, on the efficiency of the CO2 capture system. The goal is to determine the optimal installation locations in terms of process efficiency.

6. Conclusions

The conducted analyses of the impact of relative air humidity on the performance characteristics of a single-stage membrane separation system used for direct air capture of CO2 allowed for the formulation of the following conclusions:
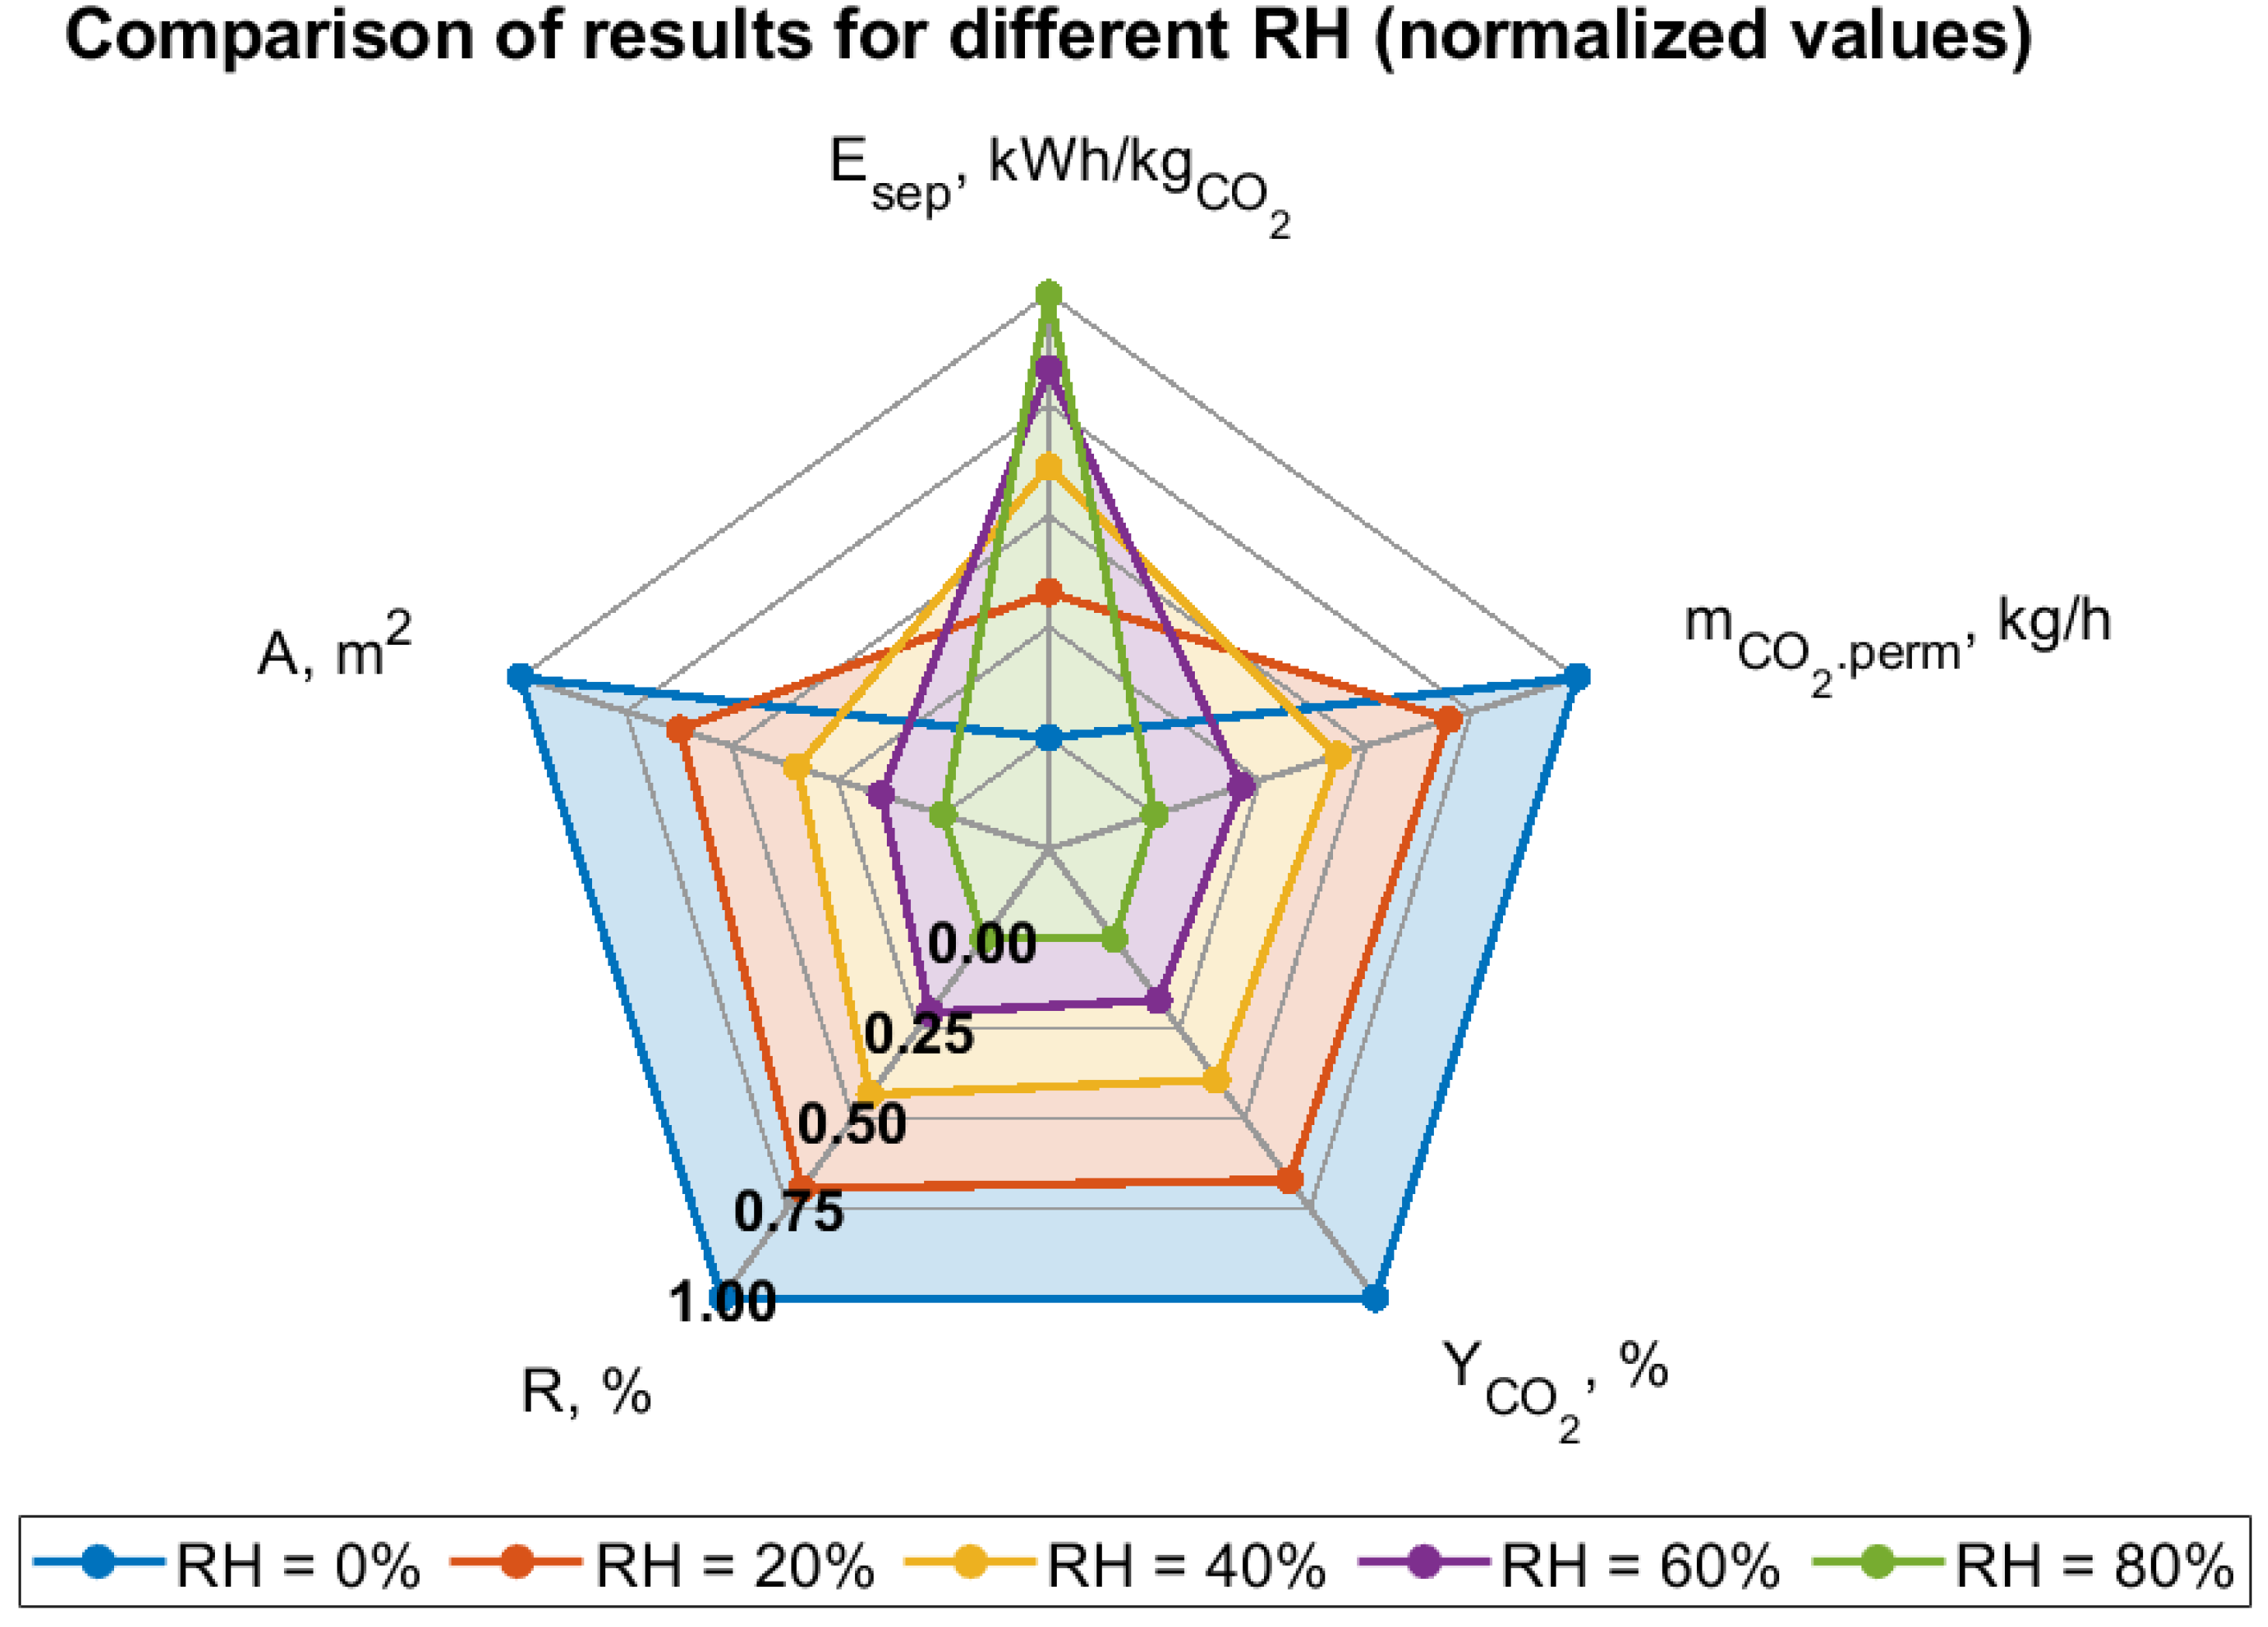
  • An increase in relative air humidity leads to the deterioration of all key system performance parameters, such as CO2 purity in the permeate, recovery rate, captured CO2 mass flow, process energy intensity, and electrical power demand. Therefore, the location of m-DAC installations should consider regions with the lowest possible average annual relative humidity. The sensitivity of m-DAC technology to humidity may be significantly higher compared to alternative sorption-based CO2 capture methods, due to the possibility of rapid membrane degradation. However, this aspect requires long-term experimental studies for a full evaluation.
  • Analyses performed for different assumptions regarding selectivity toward water vapor show that even a twofold lower permeance of H2O relative to CO2 can significantly increase the process’s energy intensity and reduce product purity. Consequently, separation parameters related to water vapor should be considered as important as those related to CO2.
  • The effect of relative humidity on the energy performance of the process is a significant barrier that needs to be overcome, such as through the development of membranes with high separation properties, to ensure that m-DAC technology is competitive with other alternative CO2 capture methods. High energy intensity, limited separation efficiency at low CO2 concentrations, and high sensitivity to gas moisture indicate the need to consider m-DAC systems as purification units in hybrid configurations. Purification can be used in processes where CO2 content is in the range of 10–14%, which corresponds to flue gas from coal-fired power plants. Such processes have already been successfully demonstrated using membranes outside the laboratory scale in pilot studies.
  • To mitigate the negative impact of moisture, it is recommended to use air drying systems before introducing air into the membrane separation system or to apply permeate dehydration before further processing in subsequent stages. However, air drying systems can significantly increase both capital and operational expenditures, which may pose a substantial barrier to the implementation of stand-alone m-DAC units. Newly developed membranes dedicated to CO2 separation should additionally exhibit the lowest possible water vapor permeance—close to that of nitrogen—to reduce undesirable moisture transport effects.
  • Existing data from the literature on newly developed membranes with very high CO2 permeance (above 10,000 GPU) are often incomplete and do not include key information regarding selectivity toward H2O and O2. The lack of such data significantly limits their practical use in m-DAC applications and complicates energy and environmental analyses for other researchers. Moreover, conducting a reliable economic assessment is currently not feasible because thorough analyses require supplementing knowledge about membrane selectivity to estimate the actual separation capabilities of membranes under varying operating conditions, as well as estimating production costs—tasks that primarily rest with the membrane developers. The lack of data prevents a clear assessment of the competitiveness of m-DAC technology compared to other CO2 capture methods under varying humidity conditions.

Author Contributions

Conceptualization, K.N., G.W. and J.K.; methodology, K.N., G.W. and J.K.; software, K.N. and O.B.; validation, K.N. and G.W.; formal analysis, K.N.; investigation, K.N.; data curation, K.N. and O.B.; writing—original draft preparation, K.N. and G.W.; writing—review and editing, K.N., G.W. and O.B.; visualization, K.N. and O.B.; supervision, J.K.; funding acquisition, K.N. All authors have read and agreed to the published version of the manuscript.

Funding

The publication was co-financed by the European Union within the framework of FSD-10.25 Development of higher education aimed at the needs of the green economy European Funds for Silesia 2021–2027: “Modern methods for monitoring the level and isotopic composition of atmospheric CO2”. (Project No. FESL.10.25-IZ.01-06C9/23-00) implemented at the Silesian University of Technology (2024–2026).

Data Availability Statement

All data is contained within the article.

Acknowledgments

Research work funded by the statutory research of the Silesian University of Technology.

Conflicts of Interest

The authors declare no conflicts of interest.

Abbreviations

The following abbreviations are used in this manuscript:
DACDirect Air Capture
m-DACMembrane-based Direct Air Capture
RESRenewable Energy Sources
CCUCarbon Capture and Utilization
CCSCarbon Capture and Storage
IEAInternational Energy Agency
L-DACLiquid-based Direct Air Capture
S-DACSolid-based Direct Air Capture
LCOCLevelized Cost of Capture
RHRelative Humidity
GPUGas Permeation Unit
m-DAC-MMembrane-based Direct Air Capture and a Methanation process
HVACHeating, Ventilation, Air Conditioning
NASANational Aeronautics and Space Administration

References

  1. Sanz-Pérez, E.S.; Murdock, C.R.; Didas, S.A.; Jones, C.W. Direct Capture of CO2 from Ambient Air. Chem. Rev. 2016, 116, 11840–11876. [Google Scholar] [CrossRef] [PubMed]
  2. Zhang, M.; Millar, M.A.; Yu, Z.; Yu, J. An Assessment of the Impacts of Heat Electrification on the Electric Grid in the UK. Energy Rep. 2022, 8, 14934–14946. [Google Scholar] [CrossRef]
  3. Tamor, M.A.; Stechel, E.B. Electrification of Transportation Means a Lot More than a Lot More Electric Vehicles. iScience 2022, 25, 104376. [Google Scholar] [CrossRef] [PubMed]
  4. Boa Morte, I.B.; Araújo, O.d.Q.F.; Morgado, C.R.V.; de Medeiros, J.L. Electrification and Decarbonization: A Critical Review of Interconnected Sectors, Policies, and Sustainable Development Goals. Energy Storage Sav. 2023, 2, 615–630. [Google Scholar] [CrossRef]
  5. IEA. CO2 Emissions in 2023, IEA, Paris. 2024. Available online: https://www.iea.org/reports/co2-emissions-in-2023 (accessed on 21 March 2024).
  6. IEA—Direct Air Capture—Energy System. Available online: https://www.iea.org/energy-system/carbon-capture-utilisation-and-storage/direct-air-capture (accessed on 25 March 2024).
  7. Bui, M.; Fajardy, M.; Mac Dowell, N. Bio-Energy with CCS (BECCS) Performance Evaluation: Efficiency Enhancement and Emissions Reduction. Appl. Energy 2017, 195, 289–302. [Google Scholar] [CrossRef]
  8. Greig, C.; Uden, S. The Value of CCUS in Transitions to Net-Zero Emissions. Electr. J. 2021, 34, 107004. [Google Scholar] [CrossRef]
  9. Popielak, P.; Majchrzak-Kucęba, I.; Wawrzyńczak, D. Climate Change Mitigation with CCUS—A Case Study with Benchmarking for Selected Countries in Adapting the European Union’s Green Deal. Int. J. Greenh. Gas Control 2024, 132, 104057. [Google Scholar] [CrossRef]
  10. Bouaboula, H.; Chaouki, J.; Belmabkhout, Y.; Zaabout, A. Comparative Review of Direct Air Capture Technologies: From Technical, Commercial, Economic, and Environmental Aspects. Chem. Eng. J. 2024, 484, 149411. [Google Scholar] [CrossRef]
  11. Joppa, L.; Luers, A.; Willmott, E.; Friedmann, S.J.; Hamburg, S.P.; Broze, R. Microsoft’s Million-Tonne CO2-Removal Purchase—Lessons for Net Zero. Nature 2021, 597, 629–632. [Google Scholar] [CrossRef]
  12. Microsoft Inks Another Deal to Capture and Store Its Carbon Emissions Underground—The Verge. Available online: https://www.theverge.com/2023/3/22/23651587/microsoft-climate-tech-startup-carboncapture-wyoming (accessed on 25 March 2024).
  13. Heirloom Opens First, U.S. Direct Air Capture Plant—The New York Times. Available online: https://www.nytimes.com/2023/11/09/climate/direct-air-capture-carbon.html (accessed on 25 March 2024).
  14. World’s First Large-Scale Direct Air Capture Plant to Use Siemens Energy Equipment. Available online: https://www.siemens-energy.com/global/en/home/press-releases/worlds-first-large-scale-direct-air-capture-plant-use-siemens-energy-equipment.html (accessed on 21 December 2024).
  15. Amazon Supports World’s Largest Deployment of DAC Tech. Available online: https://www.aboutamazon.com/news/sustainability/amazon-direct-air-capture-investment-fights-climate-change (accessed on 21 December 2024).
  16. Aramco, Siemens Energy Launch Direct Air Capture Project. Available online: https://www.cnbc.com/2023/10/09/aramco-siemens-energy-launch-direct-air-capture-project-.html (accessed on 21 December 2024).
  17. Kotowicz, J.; Niesporek, K.; Baszczeńska, O. Advancements and Challenges in Direct Air Capture Technologies: Energy Intensity, Novel Methods, Economics, and Location Strategies. Energies 2025, 18, 496. [Google Scholar] [CrossRef]
  18. Brooks, B.G.J.; Geissler, C.H.; An, K.; McCoy, S.T.; Middleton, R.S.; Ogland-Hand, J.D. The Performance of Solvent-Based Direct Air Capture across Geospatial and Temporal Climate Regimes. Front. Clim. 2024, 6, 1394728. [Google Scholar] [CrossRef]
  19. An, K.; Farooqui, A.; McCoy, S.T. The Impact of Climate on Solvent-Based Direct Air Capture Systems. Appl. Energy 2022, 325, 119895. [Google Scholar] [CrossRef]
  20. Cai, X.; Coletti, M.A.; Sholl, D.S.; Allen-Dumas, M.R. Assessing Impacts of Atmospheric Conditions on Efficiency and Siting of Large-Scale Direct Air Capture Facilities. JACS Au 2024, 4, 1883–1891. [Google Scholar] [CrossRef] [PubMed]
  21. Schellevis, H.M.; de la Combé, J.D.; Brilman, D.W.F. Optimizing Direct Air Capture under Varying Weather Conditions. Energy Adv. 2024, 3, 1678–1687. [Google Scholar] [CrossRef]
  22. Leonzio, G.; Fennell, P.S.; Shah, N. Modelling and Analysis of Direct Air Capture Systems in Different Locations. Chem. Eng. Trans. 2022, 96, 1–6. [Google Scholar] [CrossRef]
  23. Krull, L.F.; Baum, C.M.; Sovacool, B.K. A Geographic Analysis and Techno-Economic Assessment of Renewable Heat Sources for Low-Temperature Direct Air Capture in Europe. Energy Convers. Manag. 2025, 323, 119186. [Google Scholar] [CrossRef]
  24. Boerst, J.; Pena Cabra, I.; Sharma, S.; Zaremsky, C.; Iyengar, A.K.S. Strategic Siting of Direct Air Capture Facilities in the United States. Energies 2024, 17, 3755. [Google Scholar] [CrossRef]
  25. Keith, D.W.; Holmes, G.; St. Angelo, D.; Heidel, K. A Process for Capturing CO2 from the Atmosphere. Joule 2018, 2, 1573–1594. [Google Scholar] [CrossRef]
  26. Sendi, M.; Bui, M.; Mac Dowell, N.; Fennell, P. Geospatial Analysis of Regional Climate Impacts to Accelerate Cost-Efficient Direct Air Capture Deployment. One Earth 2022, 5, 1153–1164. [Google Scholar] [CrossRef]
  27. Fujikawa, S.; Selyanchyn, R. Direct Air Capture by Membranes. MRS Bull. 2022, 47, 416–423. [Google Scholar] [CrossRef]
  28. Fujikawa, S.; Selyanchyn, R.; Kunitake, T. A New Strategy for Membrane-Based Direct Air Capture. Polym. J. 2020, 53, 111–119. [Google Scholar] [CrossRef]
  29. Castel, C.; Bounaceur, R.; Favre, E. Membrane Processes for Direct Carbon Dioxide Capture From Air: Possibilities and Limitations. Front. Chem. Eng. 2021, 3, 668867. [Google Scholar] [CrossRef]
  30. Ignatusha, P.; Lin, H.; Kapuscinsky, N.; Scoles, L.; Ma, W.; Patarachao, B.; Du, N. Membrane Separation Technology in Direct Air Capture. Membranes 2024, 14, 30. [Google Scholar] [CrossRef] [PubMed]
  31. Castro-Muñoz, R.; Zamidi Ahmad, M.; Malankowska, M.; Coronas, J. A New Relevant Membrane Application: CO2 Direct Air Capture (DAC). Chem. Eng. J. 2022, 446, 137047. [Google Scholar] [CrossRef]
  32. Niesporek, K.; Kotowicz, J.; Baszczeńska, O.; Maj, I. Performance Characteristics and Optimization of a Single-Stage Direct Air Capture Membrane System in Terms of Process Energy Intensity. Energies 2024, 17, 2046. [Google Scholar] [CrossRef]
  33. Gama, V.; Dantas, B.; Sanyal, O.; Lima, F.V. Process Operability Analysis of Membrane-Based Direct Air Capture for Low-Purity CO2 Production. ACS Eng. Au 2024, 4, 394–404. [Google Scholar] [CrossRef]
  34. Installation of M-DAC® Technology in Tokyo to Capture and Utilize Carbon Dioxide from the Atmosphere| News Room|Sojitz Corporation. Available online: https://www.sojitz.com/en/news/article/topics-20241017.html (accessed on 21 May 2025).
  35. Tsuji, T.; Sorai, M.; Shiga, M.; Fujikawa, S.; Kunitake, T. Geological Storage of CO2–N2–O2 Mixtures Produced by Membrane-Based Direct Air Capture (DAC). Greenh. Gases Sci. Technol. 2021, 11, 610–618. [Google Scholar] [CrossRef]
  36. Miroshnichenko, D.; Shalygin, M.; Bazhenov, S. Simulation of the Membrane Process of CO2 Capture from Flue Gas via Commercial Membranes While Accounting for the Presence of Water Vapor. Membranes 2023, 13, 692. [Google Scholar] [CrossRef]
  37. Remiorz, L.; Wiciak, G.; Grzywnowicz, K. Novel Concept of Supporting the Membrane Separation of CO2 in Power Plants by Thermoacoustic Dehumidification. Energy 2019, 189, 116191. [Google Scholar] [CrossRef]
  38. Lasseuguette, E.; Ferrari, M.C.; Brandani, S. Humidity Impact on the Gas Permeability of PIM-1 Membrane for Post-Combustion Application. Energy Procedia 2014, 63, 194–201. [Google Scholar] [CrossRef]
  39. Wiciak, G. The Influence of the Moisture Content in Gaseous CO2/N2 Mixture on Selected Parameters of CO2 Separation in a Capillary Polymeric Membrane. Desalination Water Treat. 2018, 128, 314–323. [Google Scholar] [CrossRef]
  40. Wade, J.L.; Lopez Marques, H.; Wang, W.; Flory, J.; Freeman, B. Moisture-Driven CO2 Pump for Direct Air Capture. J. Membr. Sci. 2023, 685, 121954. [Google Scholar] [CrossRef]
  41. Kotowicz, J.; Chmielniak, T.; Janusz-Szymańska, K. The Influence of Membrane CO2 Separation on the Efficiency of a Coal-Fired Power Plant. Energy 2010, 35, 841–850. [Google Scholar] [CrossRef]
  42. Kotowicz, J.; Janusz-Szymańska, K.; Wiciak, G. Technologie Membranowe Wychwytu Dwutlenku Węgla Ze Spalin Dla Nadkrytycznego Bloku Węglowego; Wydawnictwo Politechniki Śląskiej: Gliwice, Poland, 2015; ISBN 978-83-7880-270-9. [Google Scholar]
  43. Fujikawa, S.; Ariyoshi, M.; Selyanchyn, R.; Kunitake, T. Ultra-Fast, Selective CO2 Permeation by Free-Standing Siloxane Nanomembranes. Chem. Lett. 2019, 48, 1351–1354. [Google Scholar] [CrossRef]
  44. Yoo, M.J.; Kim, K.H.; Lee, J.H.; Kim, T.W.; Chung, C.W.; Cho, Y.H.; Park, H.B. Ultrathin Gutter Layer for High-Performance Thin-Film Composite Membranes for CO2 Separation. J. Membr. Sci. 2018, 566, 336–345. [Google Scholar] [CrossRef]
  45. Dong, S.; Wang, Z.; Sheng, M.; Qiao, Z.; Wang, J. Scaling up of Defect-Free Flat Membrane with Ultra-High Gas Permeance Used for Intermediate Layer of Multi-Layer Composite Membrane and Oxygen Enrichment. Sep. Purif. Technol. 2020, 239, 116580. [Google Scholar] [CrossRef]
  46. Ying, Y.; Yang, Z.; Shi, D.; Peh, S.B.; Wang, Y.; Yu, X.; Yang, H.; Chai, K.; Zhao, D. Ultrathin Covalent Organic Framework Film as Membrane Gutter Layer for High-Permeance CO2 Capture. J. Membr. Sci. 2021, 632, 119384. [Google Scholar] [CrossRef]
  47. Pohlmann, J.; Bram, M.; Wilkner, K.; Brinkmann, T. Pilot Scale Separation of CO2 from Power Plant Flue Gases by Membrane Technology. Int. J. Greenh. Gas Control 2016, 53, 56–64. [Google Scholar] [CrossRef]
  48. Brinkmann, T.; Lillepärg, J.; Notzke, H.; Pohlmann, J.; Shishatskiy, S.; Wind, J.; Wolff, T. Development of CO2 Selective Poly(Ethylene Oxide)-Based Membranes: From Laboratory to Pilot Plant Scale. Engineering 2017, 3, 485–493. [Google Scholar] [CrossRef]
  49. Li, L.; Miyazaki, S.; Wu, Z.; Toyao, T.; Selyanchyn, R.; Maeno, Z.; Fujikawa, S.; Shimizu, K. Continuous Direct Air Capture and Methanation Using Combined System of Membrane-Based CO2 Capture and Ni-Ca Based Dual Functional Materials. Appl. Catal. B 2023, 339, 123151. [Google Scholar] [CrossRef]
  50. Knox, J.C.; Watson, D.W.; Giesy, T.J.; Cmarik, G.E.; Miller, L.A. Investigation of Desiccants and CO2 Sorbents for Exploration Systems 2016–2017. In Proceedings of the 47th International Conference on Environmental Systems (ICES-2017-188), Charleston, SC, USA, 16–20 July 2017. [Google Scholar]
  51. Behnke, K.; Weber, S. Air Drying Device of a DAC System, DAC System and Method for Operating the Same 2023. Available online: https://patents.google.com/patent/DE102023119768A1/en (accessed on 23 June 2025).
  52. Ranjan, M.; Herzog, H.J. Feasibility of Air Capture. Energy Procedia 2011, 4, 2869–2876. [Google Scholar] [CrossRef]
  53. What Are Safe Levels of CO and CO2 in Rooms? | Kane International Limited. Available online: https://www.kane.co.uk/knowledge-centre/what-are-safe-levels-of-co-and-co2-in-rooms (accessed on 23 June 2025).
  54. Mini CO2 Separator CO-0302SES. Available online: https://ube.es/mini-co2-separator-co-0302ses-optimized-performance-and-technical-specifications-for-co2-removal/ (accessed on 15 May 2025).
Figure 1. Diagram of the analyzed system of the single-stage membrane separation process in the Aspen Plus V.14 software environment.
Energies 18 03422 g001
Figure 2. Effect of change in relative humidity on permeate purity for different assumed membrane separation capacities (Table 2).
Energies 18 03422 g002
Figure 3. Effect of change in relative humidity on energy intensity of carbon dioxide capture for different assumed membrane separation capacities (Table 2).
Energies 18 03422 g003
Figure 4. Radar normalized graph comparing the effect of relative humidity on key characteristics of the single-stage membrane separation process. PolyActiveTM membrane.
Energies 18 03422 g004
Figure 5. Effect of change in relative humidity on the performance characteristics of a single-stage membrane separation system. PolyActiveTM membrane. (a) Energy intensity and electric power consumption, (b) electric power demand structure, (c) total permeate stream, permeate carbon dioxide stream and H2O stream. (d) Permeate purity (CO2 share) and H2O share in permeate stream. The colors of the lines in subgraph (a,c,d) correspond to the color of the respective Y-axes on each graph.
Energies 18 03422 g005
Figure 6. Recovery rate and required membrane area for different relative air humidity. PolyActiveTM membrane. Blue line—Recovery rate (R), Green line—Membrane surface area (A).
Energies 18 03422 g006
Figure 7. The schematic of laboratory stand for direct carbon dioxide capture from air by membrane separation method. H—humidifier, GA—gas analyzer, t—temperature, p—pressure, V ˙ —volume stream.
Energies 18 03422 g007
Table 1. Computational assumptions for modelling direct carbon dioxide capture from air in a membrane separation system.
ParameterSymbolValueUnit
Atmospheric air composition - %
(RH = 0%):
- N278.08
- O220.95
- Ar0.93
- CO20.04
Atmospheric pressure p a t m 1.013bar
Air temperature t a i r 20°C
Isentropic efficiency of auxiliary equipment (pumps, compressors, fans) η i s 90%
Mechanical efficiency of auxiliary equipment η m 99%
CO2 concentration in the retentate X C O 2 300ppm
Table 2. Assumed membrane selectivities.
Membrane Selectivity   α C O 2 / x
N2, Ar, O2H2O
M1 30
M2302.0
M3300.5
M4300.2
Permeance of CO2 LCO2 = 27 m 3 S T P ( m 2 · h · b a r )
This value expressed in GPU LCO2 = 10,000 GPU
Table 3. Separation properties of PolyActiveTM membrane [48].
MembraneSelectivity
N2, Ar O2H2O
PolyActiveTM45.916.80.10
Permeance of CO2 LCO2 = 4 m 3 S T P ( m 2 · h · b a r ) or This value expressed in GPU LCO2 = 1481 GPU
Table 4. Share of CO2 in permeate assuming complete condensation of water vapor.
ParameterValueUnits
R H 020406080%
Y C O 2 1.301.371.421.461.49%
Disclaimer/Publisher’s Note: The statements, opinions and data contained in all publications are solely those of the individual author(s) and contributor(s) and not of MDPI and/or the editor(s). MDPI and/or the editor(s) disclaim responsibility for any injury to people or property resulting from any ideas, methods, instructions or products referred to in the content.

