Abstract
Enhancing solar photovoltaic (PV) power generation is fundamental to achieving energy sustainability goals. However, elevated module temperatures can diminish photoelectric conversion efficiency and output power, impacting the safe and efficient operation of PV modules. Therefore, understanding module temperature distribution is crucial for predicting power generation performance and optimizing cleaning schedules in PV power plants. To investigate the combined effects of multiple factors on the temperature distribution and output power of dusty PV modules, a heat transfer model was developed. Validation against experimental data and comparisons with the NOCT model demonstrated the validity and advantages of the proposed model in accurately predicting PV module behavior. This validated model was then employed to simulate and analyze the influence of various parameters on the temperature of dusty modules and to evaluate the module output power, providing insights into sustainable PV energy generation. Results indicate that the attenuation of PV glass transmittance due to dust accumulation constitutes the primary determinant of the lower temperature observed in dusty modules compared to clean modules. This highlights a significant factor impacting long-term performance and resource utilization efficiency. Dusty module temperature exhibits a positive correlation with irradiance and ambient temperature, while displaying a negative correlation with wind speed and dust accumulation. Notably, alignment of wind direction and module orientation enhances module heat dissipation, representing a passive cooling strategy that promotes efficient and sustainable operation. At an ambient temperature of 25 °C and a wind speed of 3 m/s, the dusty module exhibits a temperature reduction of approximately 11.0% compared to the clean module. Furthermore, increasing the irradiance from 200 W/m2 to 800 W/m2 results in an increase in output power attenuation from 51.4 W to 192.6 W (approximately 30.4% attenuation rate) for a PV module with a dust accumulation of 25 g/m2. This underscores the imperative for effective dust mitigation strategies to ensure long-term viability, economic sustainability, and optimized energy yields from solar energy investments.
1. Introduction
Solar photovoltaic (PV) power generation is a critical technology for efficiently harnessing renewable energy resources and plays a pivotal role in supporting China’s energy transition and achieving its dual-carbon goals. A significant impediment to ensuring the long-term sustainability and efficiency of PV power generation is the deposition of airborne particles on module surfaces [1]. This accumulation attenuates the transmittance of the PV glass cover, affecting module operating temperature and, consequently, photoelectric conversion efficiency, ultimately leading to reduced PV power generation and diminished long-term energy yield [2,3,4]. Existing investigations have demonstrated an inverse relationship between PV module temperature and output power, with output power decreasing by approximately 0.3% per 1 °C increase in module temperature [5]. This underscores the importance of minimizing thermal losses to maximize energy harvesting. Therefore, characterizing the temperature distribution patterns of dusty PV modules under atmospheric conditions is of considerable importance for accurate power forecasting. This enables the development of optimized cleaning strategies for power stations, thereby maximizing long-term, sustainable energy production from PV installations.
Studies on PV module temperature have attracted considerable research interest both domestically and internationally [6,7,8,9]. Wang et al. [10] experimentally investigated and analyzed the influence of various factors on PV module temperature under low-temperature environments. Their findings demonstrated that irradiance exerts the most significant influence on module temperature, followed by ambient temperature; they also reported a 0.02 kW·h increase in PV power generation for every 1 °C increase in module temperature. To explore the influence of different sand dust particles on the temperature of PV modules, Zhao et al. [11] conducted experimental research. They observed that the temperature of dusty PV modules is lower than that of clean modules, and that module temperature initially decreases and then increases with increasing particle size; however, the study did not consider the influence of wind speed on module temperature. Guan et al. [12] conducted outdoor experiments to study the effect of dust accumulation on module temperature, finding that the PV module temperature decreased by approximately 4.3 °C when the dust accumulation reached 12.6 g/m2. Furthermore, Ceylan et al. [13] experimentally studied the influence of wind speed, irradiance, and ambient temperature on the back surface temperature of clean PV panels. Their findings indicated that, under winter conditions, PV panel temperatures do not reach levels requiring active cooling and that the impact of ambient temperature on heat transfer from the PV panel backplane is less pronounced than that of wind speed and irradiance. Kaplani et al. [14] examined the impact of various factors on PV module temperature, analyzed convective and radiative heat transfer processes at the module surface, and proposed a mathematical model incorporating irradiance, wind speed, wind direction, and module tilt angle to predict PV module temperature. However, this simulation, developed for a dual-axis tracking PV system, is not applicable to other PV system installation configurations. Li et al. [15] developed numerical and machine learning models to determine the temperature of both land-based and water-based PV modules. A comparative analysis revealed superior temperature prediction accuracy for land-based PV modules. Moreover, Siddiqui et al. [16] established a PV module heat transfer model, highlighting that the photoelectric conversion efficiency of PV modules is positively correlated with irradiance but negatively correlated with module temperature. The study, however, did not consider the influence of factors such as ambient temperature and tilt angle on module temperature and photoelectric conversion efficiency.
A comprehensive understanding of PV module temperature distribution is critical for ensuring their safe operation, maximizing energy output, and promoting the long-term sustainability of solar energy installations [17,18,19]. However, existing research on PV module temperature remains insufficient, hindering efforts to optimize the efficiency and reliability of this crucial renewable energy technology. While experimental studies provide valuable insights [20,21], numerical simulation approaches that utilize heat transfer models to determine PV module temperature offer a distinct advantage for sustainable PV development but necessitate further development. Numerical simulation methods enable the investigation of coupled flow and temperature fields to analyze temperature distribution patterns on module surfaces. These methods are particularly effective at capturing the nuanced impact of individual factors on module temperature and facilitate the optimization of module design and operation for enhanced energy yield.
Furthermore, solar PV modules are exposed to the atmosphere, and their temperature is influenced by numerous factors, including irradiance, ambient temperature, dust accumulation, wind speed, and wind direction. Existing research has mainly concentrated on the impact of irradiance [22,23] and ambient temperature [24,25], with less emphasis on other variables such as dust accumulation, wind speed, and wind direction. A research gap exists in the application of numerical methods to develop comprehensive heat transfer models that incorporate all five of the aforementioned factors for predicting module temperature.
To enhance sustainable solar energy production, this study primarily employs numerical simulation to develop a heat transfer model for dusty PV modules. This model captures the combined effects of multiple factors on module temperature distribution, enabling a more realistic assessment of real-world performance and long-term energy yield. By quantifying the influence of these factors on output power via simulation, this research provides a theoretical basis for optimized cleaning strategies, maximizing energy production, and promoting a more sustainable solar energy sector.
The main contributions of this study, all aimed at enhancing the sustainable operation of PV systems, are summarized below:
- (1)
- Development of a novel heat transfer model for solar PV modules, incorporating key factors such as irradiance, wind speed, wind direction, dust accumulation, and ambient temperature to accurately predict PV module temperature and enable optimized performance under real-world conditions. Model advantages were validated through comparisons with experimental results and the NOCT model.
- (2)
- Thorough investigation, using numerical simulations, of the effects of dust accumulation, irradiance, wind speed, and wind direction on PV module temperature, providing valuable insights for mitigating performance degradation and maximizing energy yield.
- (3)
- Quantitative evaluation of the influence of dust accumulation, irradiance, and wind speed on the output power of dusty PV modules, enabling data-driven strategies for optimizing cleaning schedules and ensuring long-term sustainable energy production.
2. Conjugate Heat Transfer Mathematical Model
To accurately model PV module temperature distribution, a crucial step in optimizing their sustainable performance, this study primarily utilizes the conjugate heat transfer module in COMSOL Multiphysics software (version 6.1), specifically leveraging the coupling of the fluid flow module and the heat transfer module, to conduct numerical simulations. This methodology enables the identification of key factors affecting module performance and facilitates the maximization of energy production.
2.1. Fluid Flow Module
Solar PV modules are installed at an inclination in practical operation. The presence of the module tilt angle induces streamline curvature as airflow passes over the module. Furthermore, turbulent fluctuations exhibit non-uniformity. Therefore, a time-averaged method is employed to model the fluid flow, and the k-ε model is selected to simulate the external flow patterns around the module [26]. Given the relatively small variations in air velocity and pressure around the module, the air is approximated as an incompressible viscous fluid. The governing equations for the fluid flow are as follows [27]:
where ρa and pa represent the air density and pressure, respectively; u is the fluid velocity; I is the main stress tensor; F is the volume force; k and ε are the turbulent kinetic energy and turbulent dissipation rate, respectively; and Cμ, σk, σε, Cε1, and Cε2 are all turbulence model parameters, with values of 0.09, 1, 1.3, 1.44, and 1.92, respectively.
2.2. Temperature Field Module
The temperature distribution on the tilted PV module surfaces is not uniform. Therefore, this study utilizes the heat transfer module in COMSOL Multiphysics software to simulate the temperature distribution. Given the relatively thin dust layer on the PV module surfaces and its limited scattering effect, the thermal conductivity of the dust layer is neglected in the simulation. Equations (7)–(11) describe the thermal equilibrium equation for the module [28].
where Qsun, Qconv, Qcond, and Qrad represent the heat flux received by the solar PV modules from the atmosphere environment, the convective heat transfer flux with the surrounding environment, the heat flux conducted from the surface to the interior, and the radiative heat transfer flux between the module surface and the surrounding environment, respectively; n symbolize the normal vector pointing towards the environment; QPV is solar irradiance on the PV module surface, W/m2; cp is specific heat capacity of the fluid, J/(kg·K); TPV is module temperature, °C; Ta is ambient temperature, °C; k′ is thermal conductivity of the PV module, W/(m·K); εPV is emissivity of the PV module surface; σ is Stefan-Boltzmann constant, 5.68 × 10⁻⁸ W/(m2·K4).
3. Heat Transfer Numerical Model Validation
This section aims to establish a heat transfer model for dusty PV modules and validate it with experimental results and the NOCT model [29], with the goal of laying the foundation for numerical simulations of PV module temperature and the assessment of output power.
3.1. PV Module Temperature Measurement Experiment
3.1.1. Experimental Platform and Instruments
The experimental platform was constructed on the flat rooftop (approximately 3 m above ground) of the wind turbine hall at the university [30], located in Baoding City (115° E, 38° N), a city in northern China. The experimental setup comprised a south-facing PV array consisting of three polycrystalline silicon PV modules. A separation of approximately 0.4 m was maintained between the PV modules and the rooftop surface. The PV module model was YL250P-29b, with overall dimensions (including frame, length × width × thickness) and effective surface dimensions (excluding frame, length × width) of 1650 mm × 990 mm × 40 mm and 1575 mm × 950 mm, respectively. Detailed technical specifications for the solar PV modules are presented in Table 1.

Table 1.
Technical specifications of solar PV modules.
As shown in Table 2, the following instruments were used to monitor the experimental conditions and measure the temperature of dusty PV modules.
Table 2.
Experimental instrument and its parameters.
3.1.2. Experimental Procedure
To investigate the effect of dust accumulation on PV module temperature, we artificially applied controlled amounts of dust to the PV panel surfaces before conducting the experiment. The dust particles originated from the Baoding region of China, and their characteristics are detailed in Table 3. The target dust masses were determined by quantifying the natural dust accumulation on the PV module surfaces, collected from the experimental platform under dry weather conditions. The collected dust was dried and weighed, revealing an average mass of approximately 1.9 g per module. Artificial dust applications were then performed, with dust masses ranging from 1 to 8 times this baseline value (1.9 g to 24.7 g), resulting in dust accumulation amounts of 1.3 g/m2 to 16.5 g/m2 relative to the effective surface area of each PV module.
Table 3.
Parameters of dust particles used in this experiment.
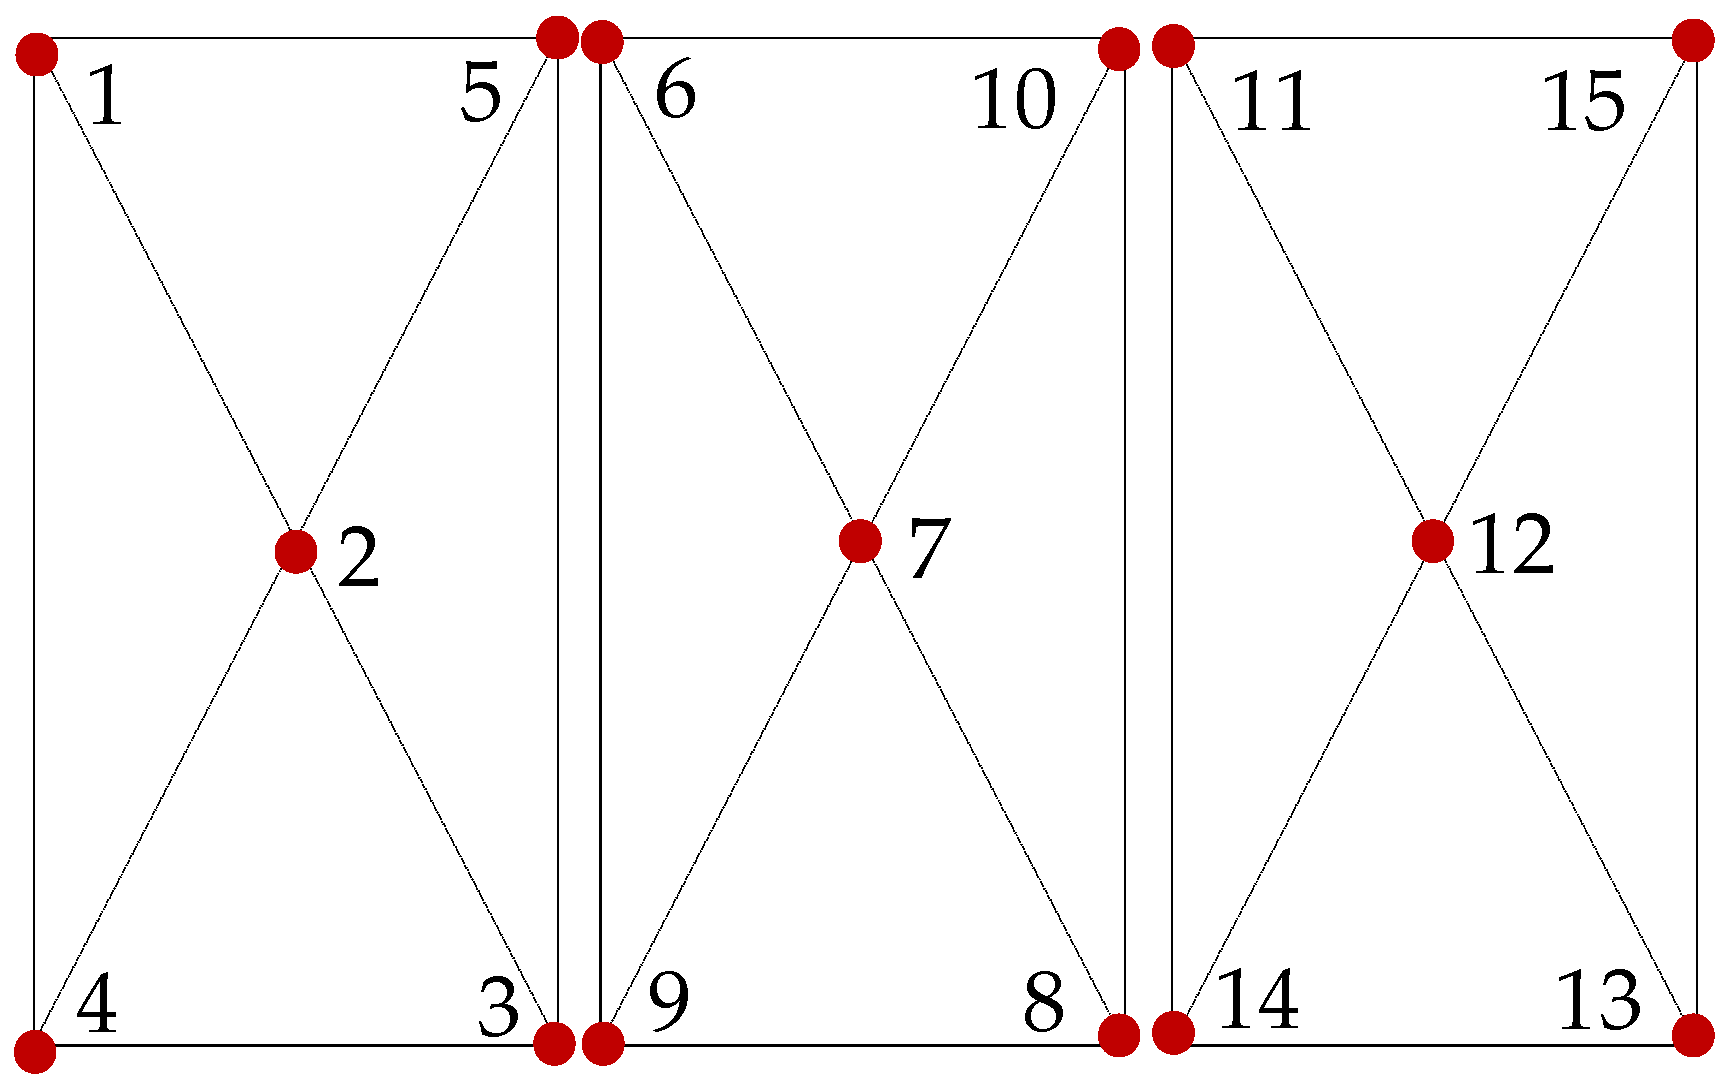
Following previous PV module temperature research [11,12,14,31], which predominantly used module backplane temperature as a representative measure, this study also employs back surface temperature to represent module temperature. To accurately measure the module temperature, three thermocouples (as specified in Table 1) were uniformly distributed along the diagonals of each module’s back surfaces, as illustrated in Figure 1 (points 1 to 15). The average of the temperature readings from these five points was defined as the back surface temperature of each module, and the overall PV module temperature was determined by averaging the 15 back surface temperature readings across all modules.
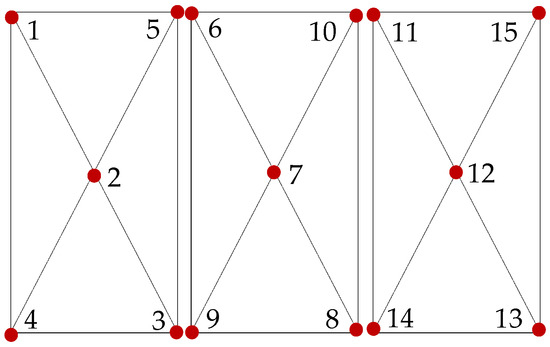
Figure 1.
Arrangement of temperature points on PV modules.
Before each experiment commenced, the surfaces of PV modules were cleaned, and dust was applied based on the dust application masses calculated above. During each experiment (12:00 to 13:00), the following parameters were measured and recorded using the instruments listed in Table 1: irradiance, ambient temperature, humidity, wind speed, wind direction, and the temperature at each measurement point on the PV modules.
3.2. Numerical Simulation of Heat Transfer Under Experimental Conditions
3.2.1. Establishment of the Conjugate Heat Transfer Model
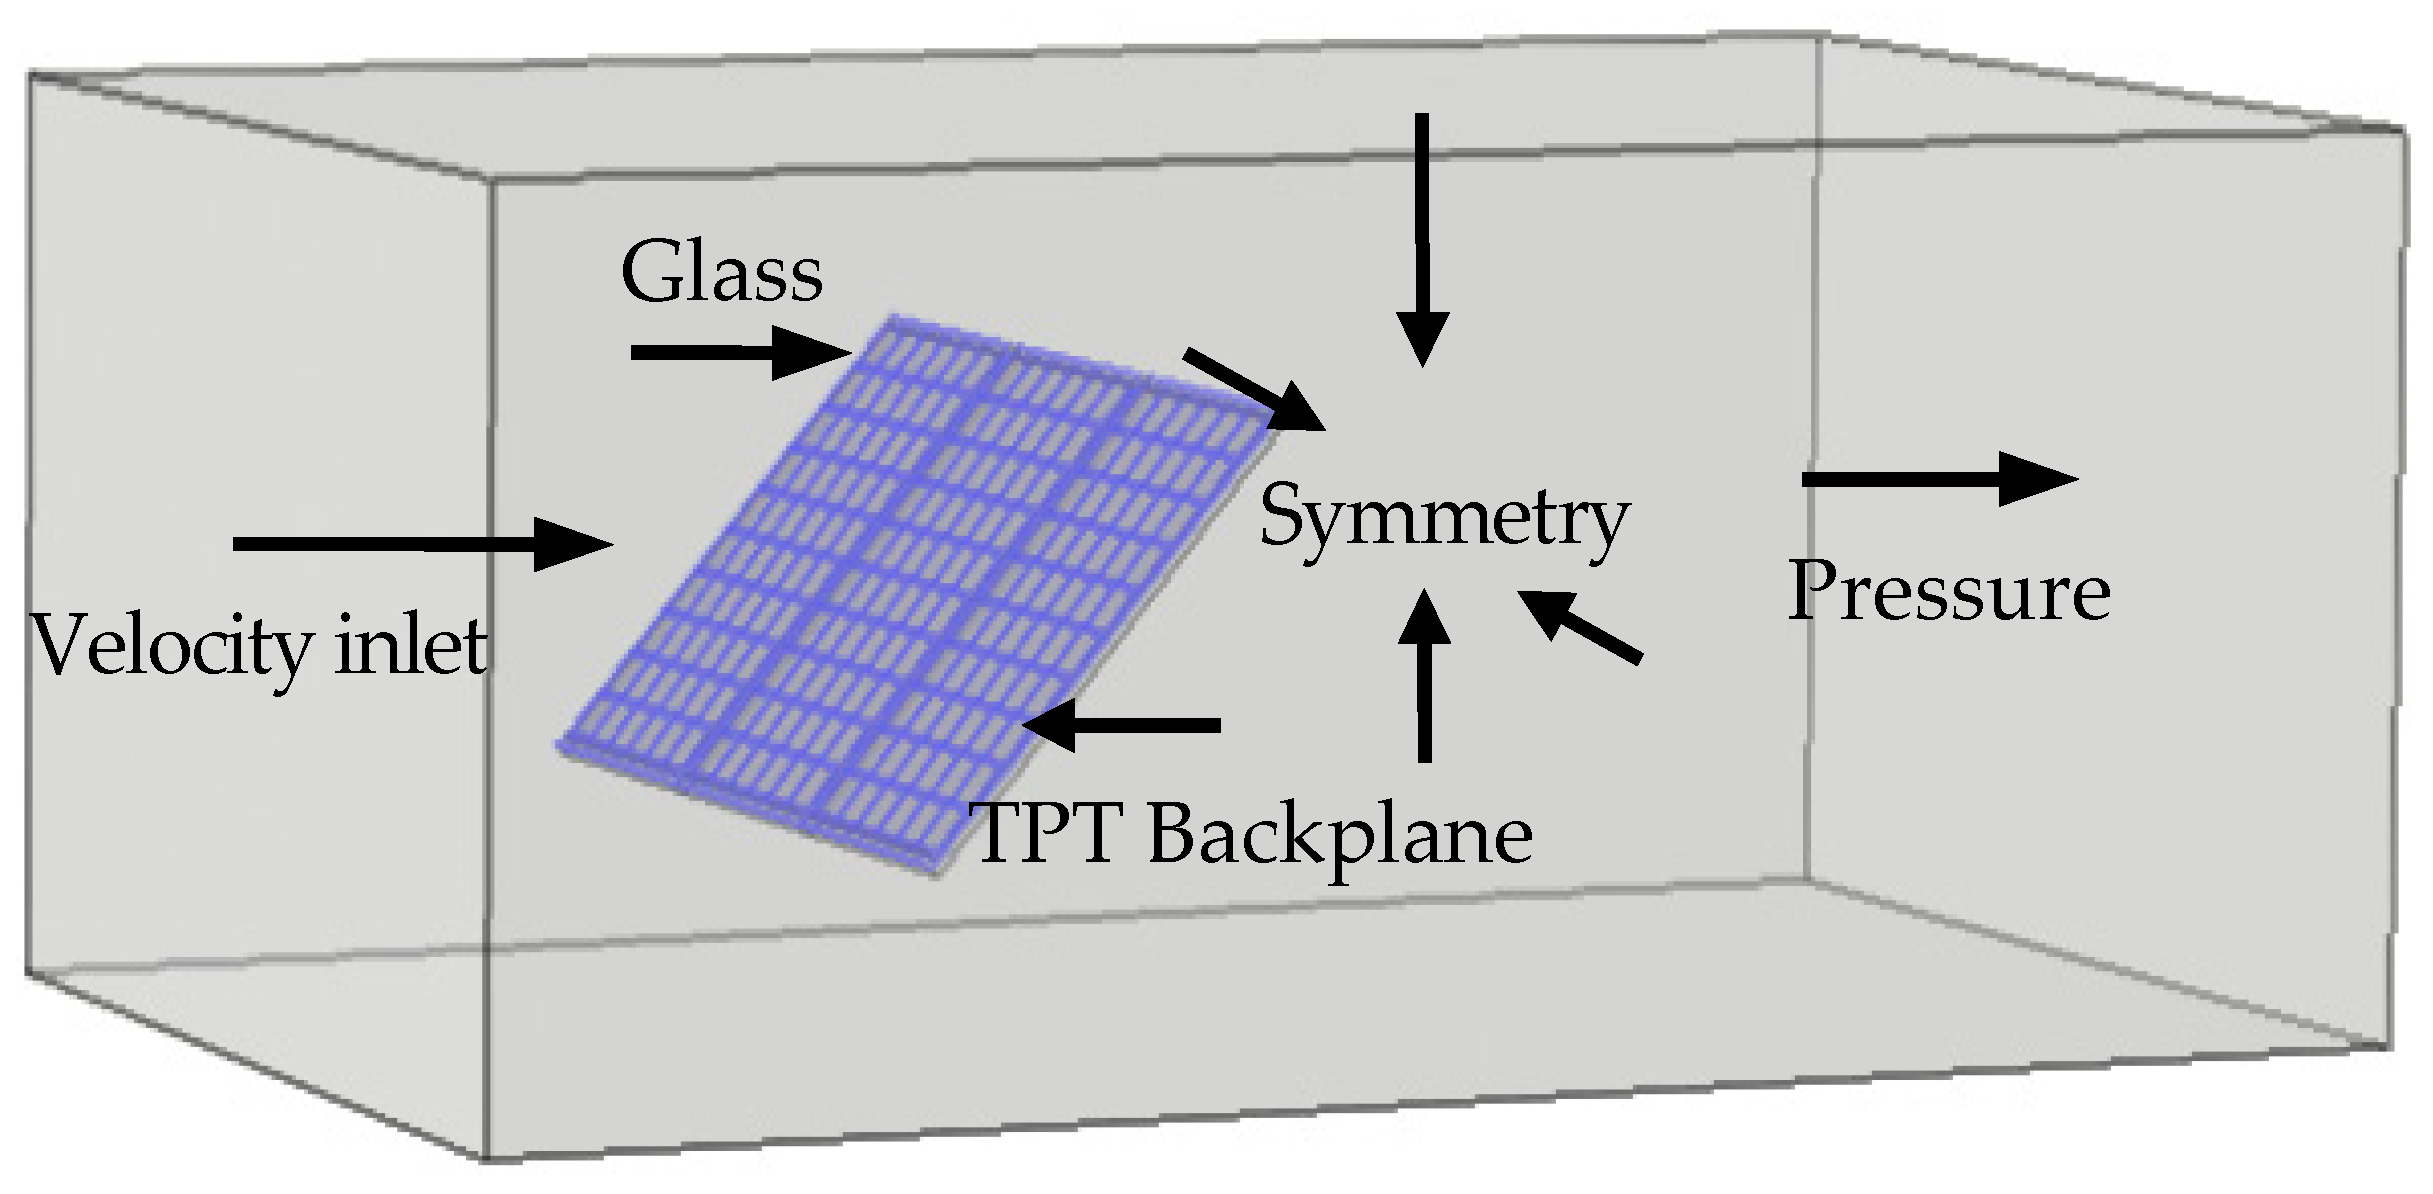
Based on the PV module used in the experiment, a geometrically identical PV array model was built using COMSOL Multiphysics software, as shown in Figure 2. To reduce the computational complexity, the module supporting structure, which has a negligible influence on the simulated module temperature results, was omitted from the model. A computational domain, defined as a cuboid of dimensions 6500 mm × 4000 mm × 2500 mm, was then established. Through grid independence analysis, the optimal mesh size was determined to achieve a grid count of approximately 1.35 million elements for the PV module heat transfer model, balancing computational efficiency and solution accuracy.
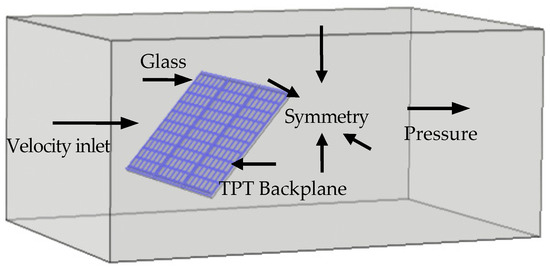
Figure 2.
Heat transfer model of solar PV modules.
3.2.2. Simulation Parameter Settings
For the established PV module heat transfer model, the flow field employed a velocity inlet and a pressure outlet, with symmetry boundary conditions applied to all other wall surfaces. Utilizing the COMSOL Multiphysics software library, the module’s front surface, backplane, photovoltaic cells, and frame were defined as glass, TPT, polycrystalline silicon, and aluminum alloy, respectively, according to the material properties of the experimental PV module. The parameter values of these materials are shown in Table 4 [30,32]. Additionally, the flow field calculation domain was set to air, and its parameters such as velocity, humidity, temperature, density, and viscosity specified according to the experimental measurements in Section 3.1.2.
Table 4.
Physical properties parameter values of different materials.
Because the rooftop surface is in direct contact with the PV mounting structure, heat can be transferred to the structure through thermal conduction. Given the limited impact of the mounting structure temperature on PV module temperature, the influence of the rooftop temperature is presumed to be comparatively small. Consequently, rooftop surface temperature is excluded from the developed PV module heat transfer model. Furthermore, the front surface and backplane of the PV module exchange heat with the surrounding air through convection. This process is governed by Newton’s Law of Cooling (Equation (12)). The convective heat transfer coefficient is then determined using characteristic number correlations (Equation (13)).
where h represents the convective heat transfer coefficient, W/(m2·°C); Re is the Reynolds number; Pr is the Prandtl number; w is the wind speed, m/s; L is the length of the PV module, m; and C1, C2, m, and n are coefficients determined experimentally [33].
Beyond convective heat transfer, PV modules also engage in radiative heat transfer with the external environment. Consequently, for the simulation, both the front and back surfaces of the PV modules were modeled as gray bodies, with the ambient temperature assigned as space temperature. In addition to the material properties, the optical characteristic parameters of each PV module component were defined according to the values presented in Table 5 [34].
Table 5.
Optical parameter setting.
To account for the influence of dust accumulation, the PV glass transmittance was calculated for each experimental dust accumulation condition (detailed in Section 3.1.2) using Equation (14) [12]. This equation mathematically describes the correlation between the dust accumulation amount and PV transmittance.
where τ and τ0 are the transmittances of the dusty and clean modules, respectively; ρd is the dust accumulation amount.
3.3. Verification of Heat Transfer Simulation Model
To facilitate data extraction, virtual temperature probes were strategically placed at each experimental temperature measurement point within the COMSOL Multiphysics software, utilizing the software’s built-in ‘Probe’ feature. Following simulation completion, these probes enabled direct retrieval of temperature data at each point, including the overall module temperature.
The validity of the heat transfer simulation model was then evaluated by comparing these simulated temperatures with corresponding experimental measurements. Moreover, to demonstrate the advantages of the comprehensive heat transfer model developed in this study, it was compared to the NOCT model, a commonly used method for PV module temperature prediction [29]. The results of these comparisons are presented in Figure 3.
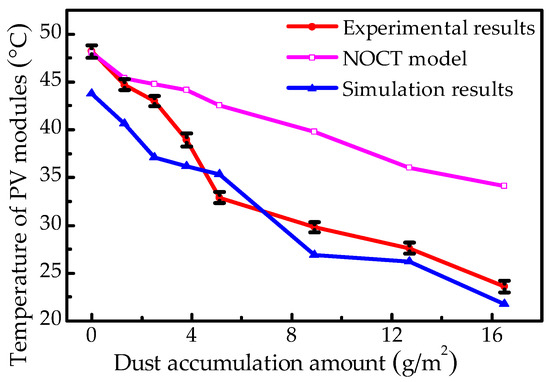
Figure 3.
Comparison of module temperature simulation results with experimental results and NOCT predictions.
Figure 3 demonstrates a consistent trend among simulated module temperature results, experimental results, and NOCT predictions as dust accumulation increases. The three datasets for module temperature at each dust accumulation amount are of the same order of magnitude. The maximum relative uncertainty in the experimental results was found to be 3.1% for PV module temperature. The average relative error between the simulated and experimental temperatures is approximately 8.4%, compared to 19.6% between NOCT predictions and experimental results. These findings further validate the accuracy and advantages of the PV module heat transfer model developed in this study.
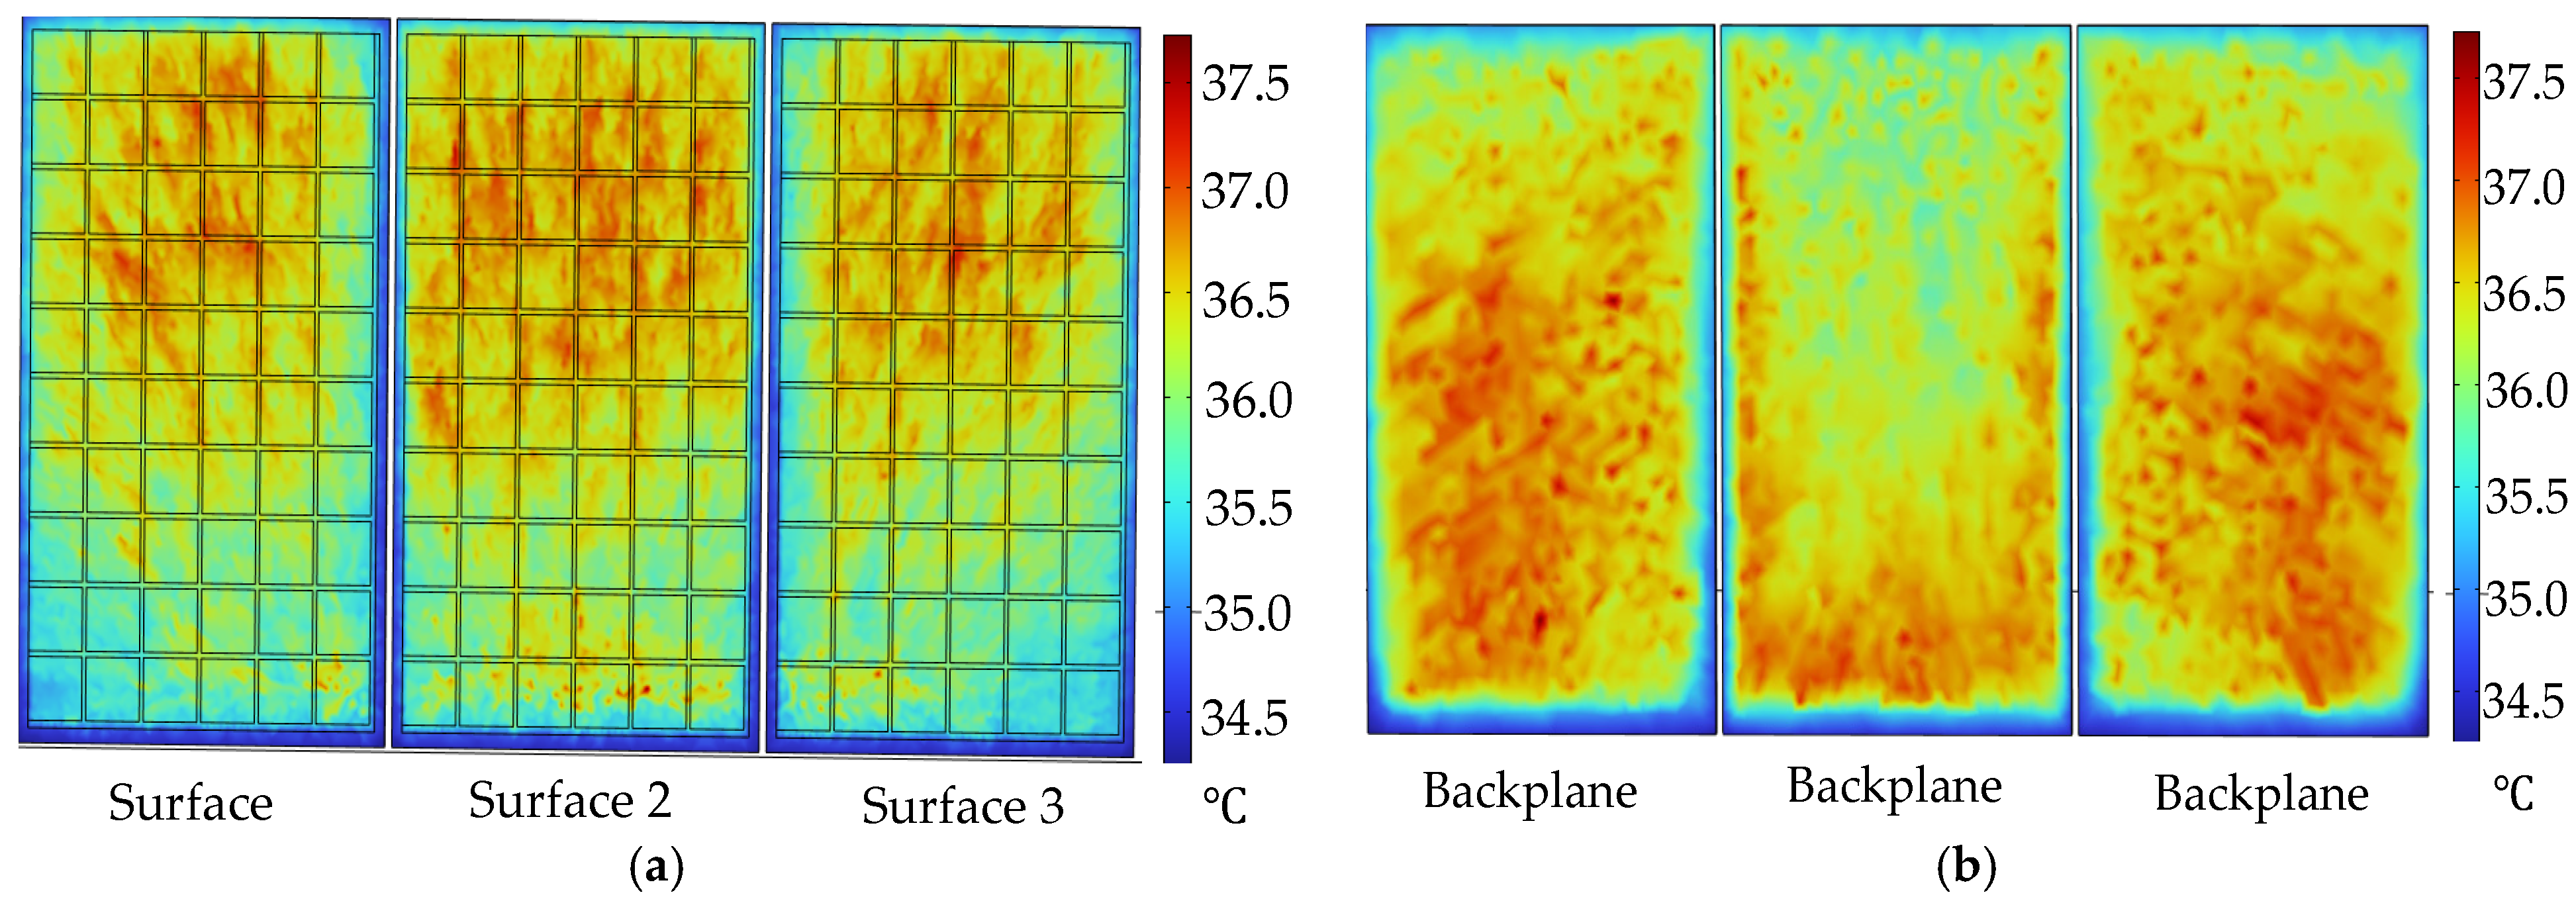
For a dust accumulation amount of 5.1 g/m2 (depicted in Figure 3), Figure 4 presents the simulated module temperature distributions on the front surfaces and backplanes of PV modules. The simulation reveals a temperature gradient: the front surface temperature is higher at the top of the module, while the backplane temperature is higher at the bottom. Notably, the backplane exhibits a slightly higher temperature than the front surface, consistent with experimental observations. This qualitative agreement validates the accuracy of the flow and temperature field simulations and demonstrates the effectiveness of the developed PV module heat transfer model in studying module temperature distribution.
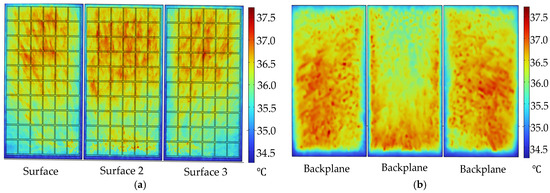
Figure 4.
Temperature contour of solar PV modules. (a) Temperature contour of module surfaces; (b) Temperature contour of module backplanes.
Based on the above analysis, the reasonableness of the developed PV module heat transfer model has been confirmed through comparison with experimental data. Nevertheless, some degree of error remains between the simulation and experimental findings. The main factors contributing to this error are outlined below.
- (1)
- The exclusion of rooftop surface temperature from the developed PV module heat transfer model may contribute to the observed discrepancies between simulation and experimental results.
- (2)
- During the experiment, the atmospheric parameters, encompassing irradiance, wind speed, ambient temperature, and humidity, exhibited variability. To minimize the impact of these dynamic environmental conditions on the simulation results, the boundary conditions were simplified in the simulation by employing the average values of the four parameters measured during the experiment. This simplification may have contributed to the discrepancies between the simulated and experimental results.
- (3)
- Due to computational resource limitations, it is challenging to fully and accurately simulate the heat transfer processes occurring between the PV module and its surroundings within the experimental setup. Moreover, the selection of relevant parameters relies on empirical formulas, which may deviate from actual values, potentially contributing to the observed errors.
4. Results and Discussion
This section utilizes the PV module heat transfer model established in Section 3 to simulate and analyze the temperature distribution on a dusty PV module with a 45° tilt angle. To optimize sustainable energy production, the simulations account for the combined effects of irradiance (Qa), dust accumulation (ρd), wind speed (w), wind direction, and ambient temperature (Ta). Based on these simulations, the influence of each factor on module output power is then evaluated, providing critical insights for maximizing energy yield and minimizing performance degradation.
4.1. Simulation of Dusty PV Module Temperature Under Multifactor Effects
4.1.1. Effect of Irradiance
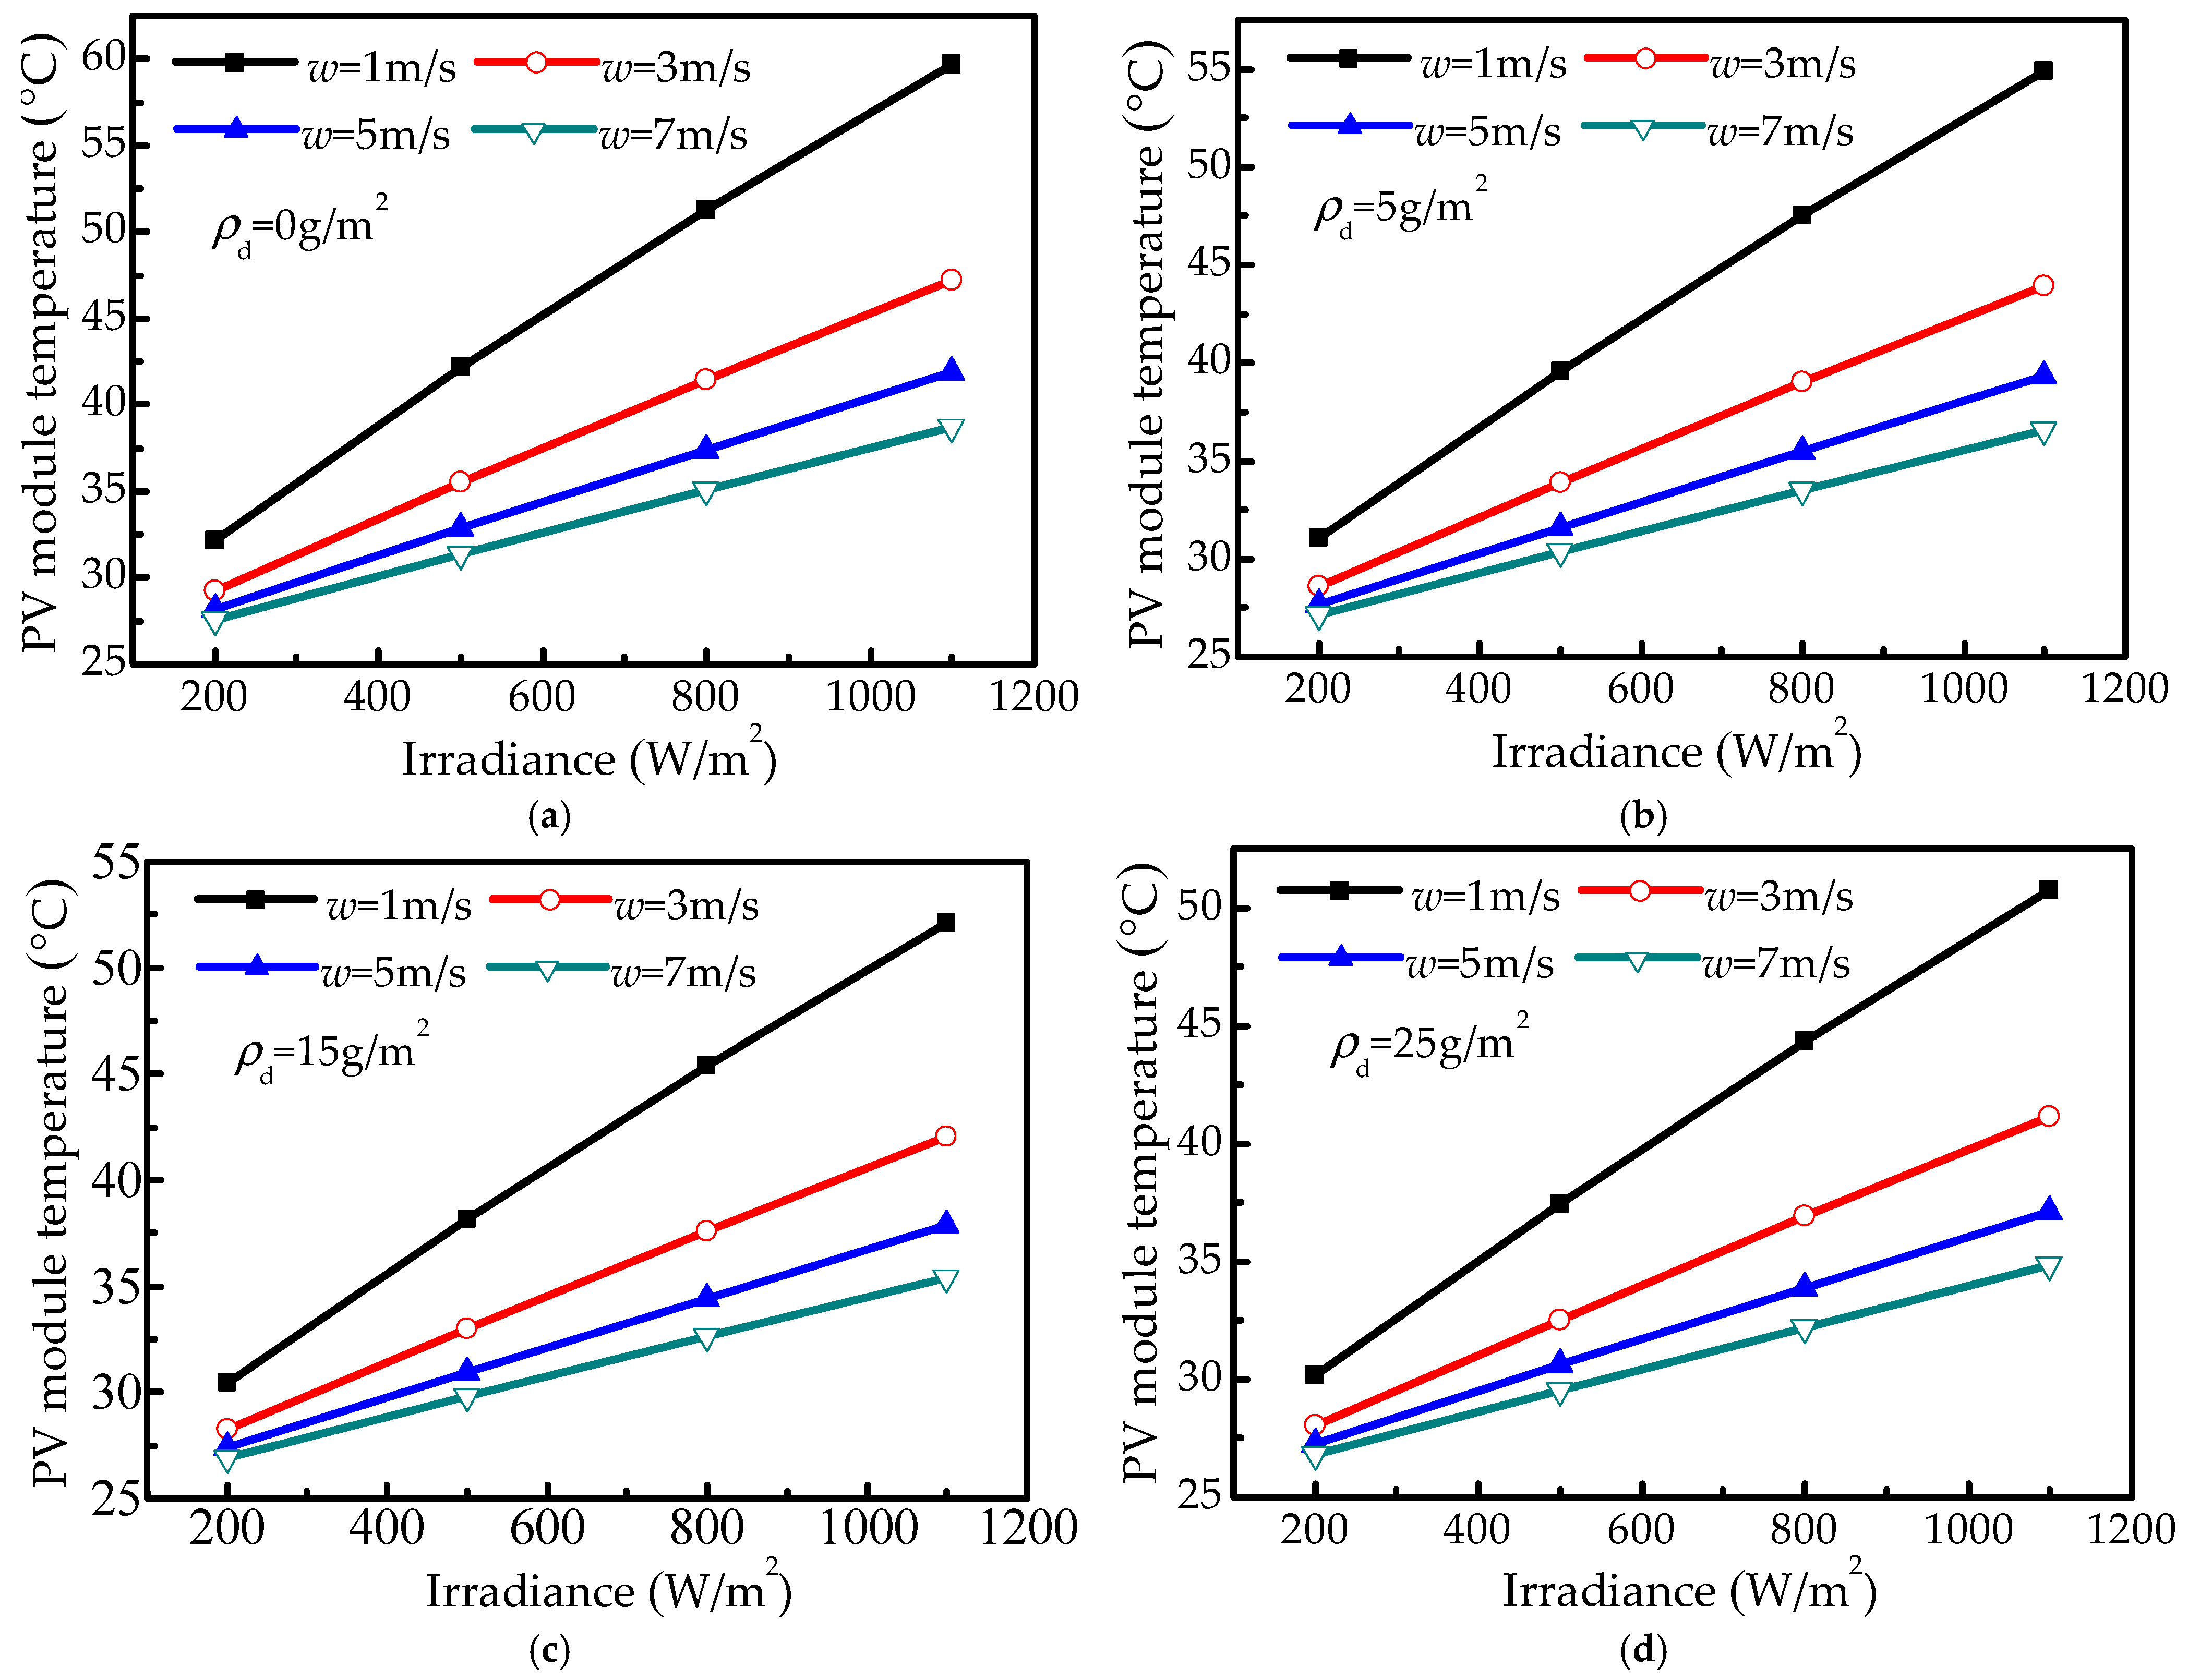
Irradiance directly influences the solar radiation amount absorbed by the PV module surface, a critical factor in determining module temperature and output power. When the ambient temperature is 25 °C, the relationship between dusty PV module temperature and irradiance, crucial for optimizing sustainable energy production, is illustrated in Figure 5.
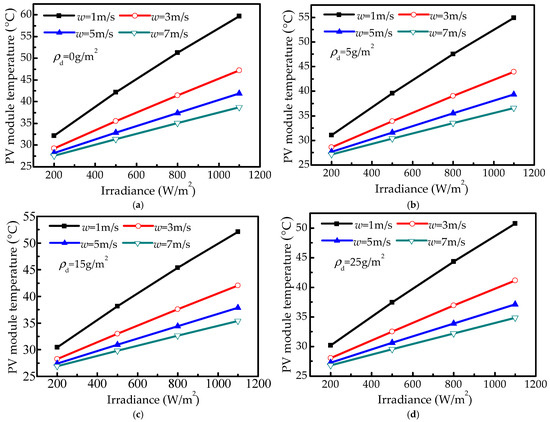
Figure 5.
Temperature of PV modules versus irradiance. (a) ρd = 0 g/m2; (b) ρd = 5 g/m2; (c) ρd = 15 g/m2; (d) ρd = 25 g/m2.
Figure 5 illustrates an approximately linear increase in PV module temperature with increasing irradiance, emphasizing the critical role of irradiance in energy production and the need for effective thermal management for sustainable operation. Specifically, at an irradiance of 200 W/m2 and a wind speed of 7 m/s, the clean module and a dusty module (15 g/m2 dust accumulation) reach temperatures of approximately 27.6 °C and 26.9 °C, respectively. Upon increasing the irradiance to 800 W/m2, these temperatures increase to approximately 35.0 °C and 32.6 °C, representing an increase of approximately 7.4 °C and 5.7 °C, respectively. This indicates that the impact of irradiance on module temperature is more pronounced for clean modules than for dusty modules, a key consideration for long-term performance.
A comparison analysis of the subgraphs in Figure 5 reveals an inverse relationship between PV module temperature and dust accumulation. Furthermore, at a constant ambient temperature, the temperature difference between clean and dusty modules increases with increasing dust accumulation and irradiance, underscoring the importance of mitigating dust-related losses to maximize energy yield. This phenomenon is attributed to the reduction in PV glass transmittance caused by dust, which diminishes the radiation absorbed by the module surface, thus reducing the energy harvest. Regions with heavy atmospheric pollution may experience significant dust accumulation on the module surfaces. Therefore, during the planning and construction of a PV power station, prioritizing locations with ample solar resources and high atmospheric cleanliness and considering mitigation strategies is essential to enhance the long-term sustainability and economic viability of the project.
4.1.2. Effect of Dust Accumulation Amount
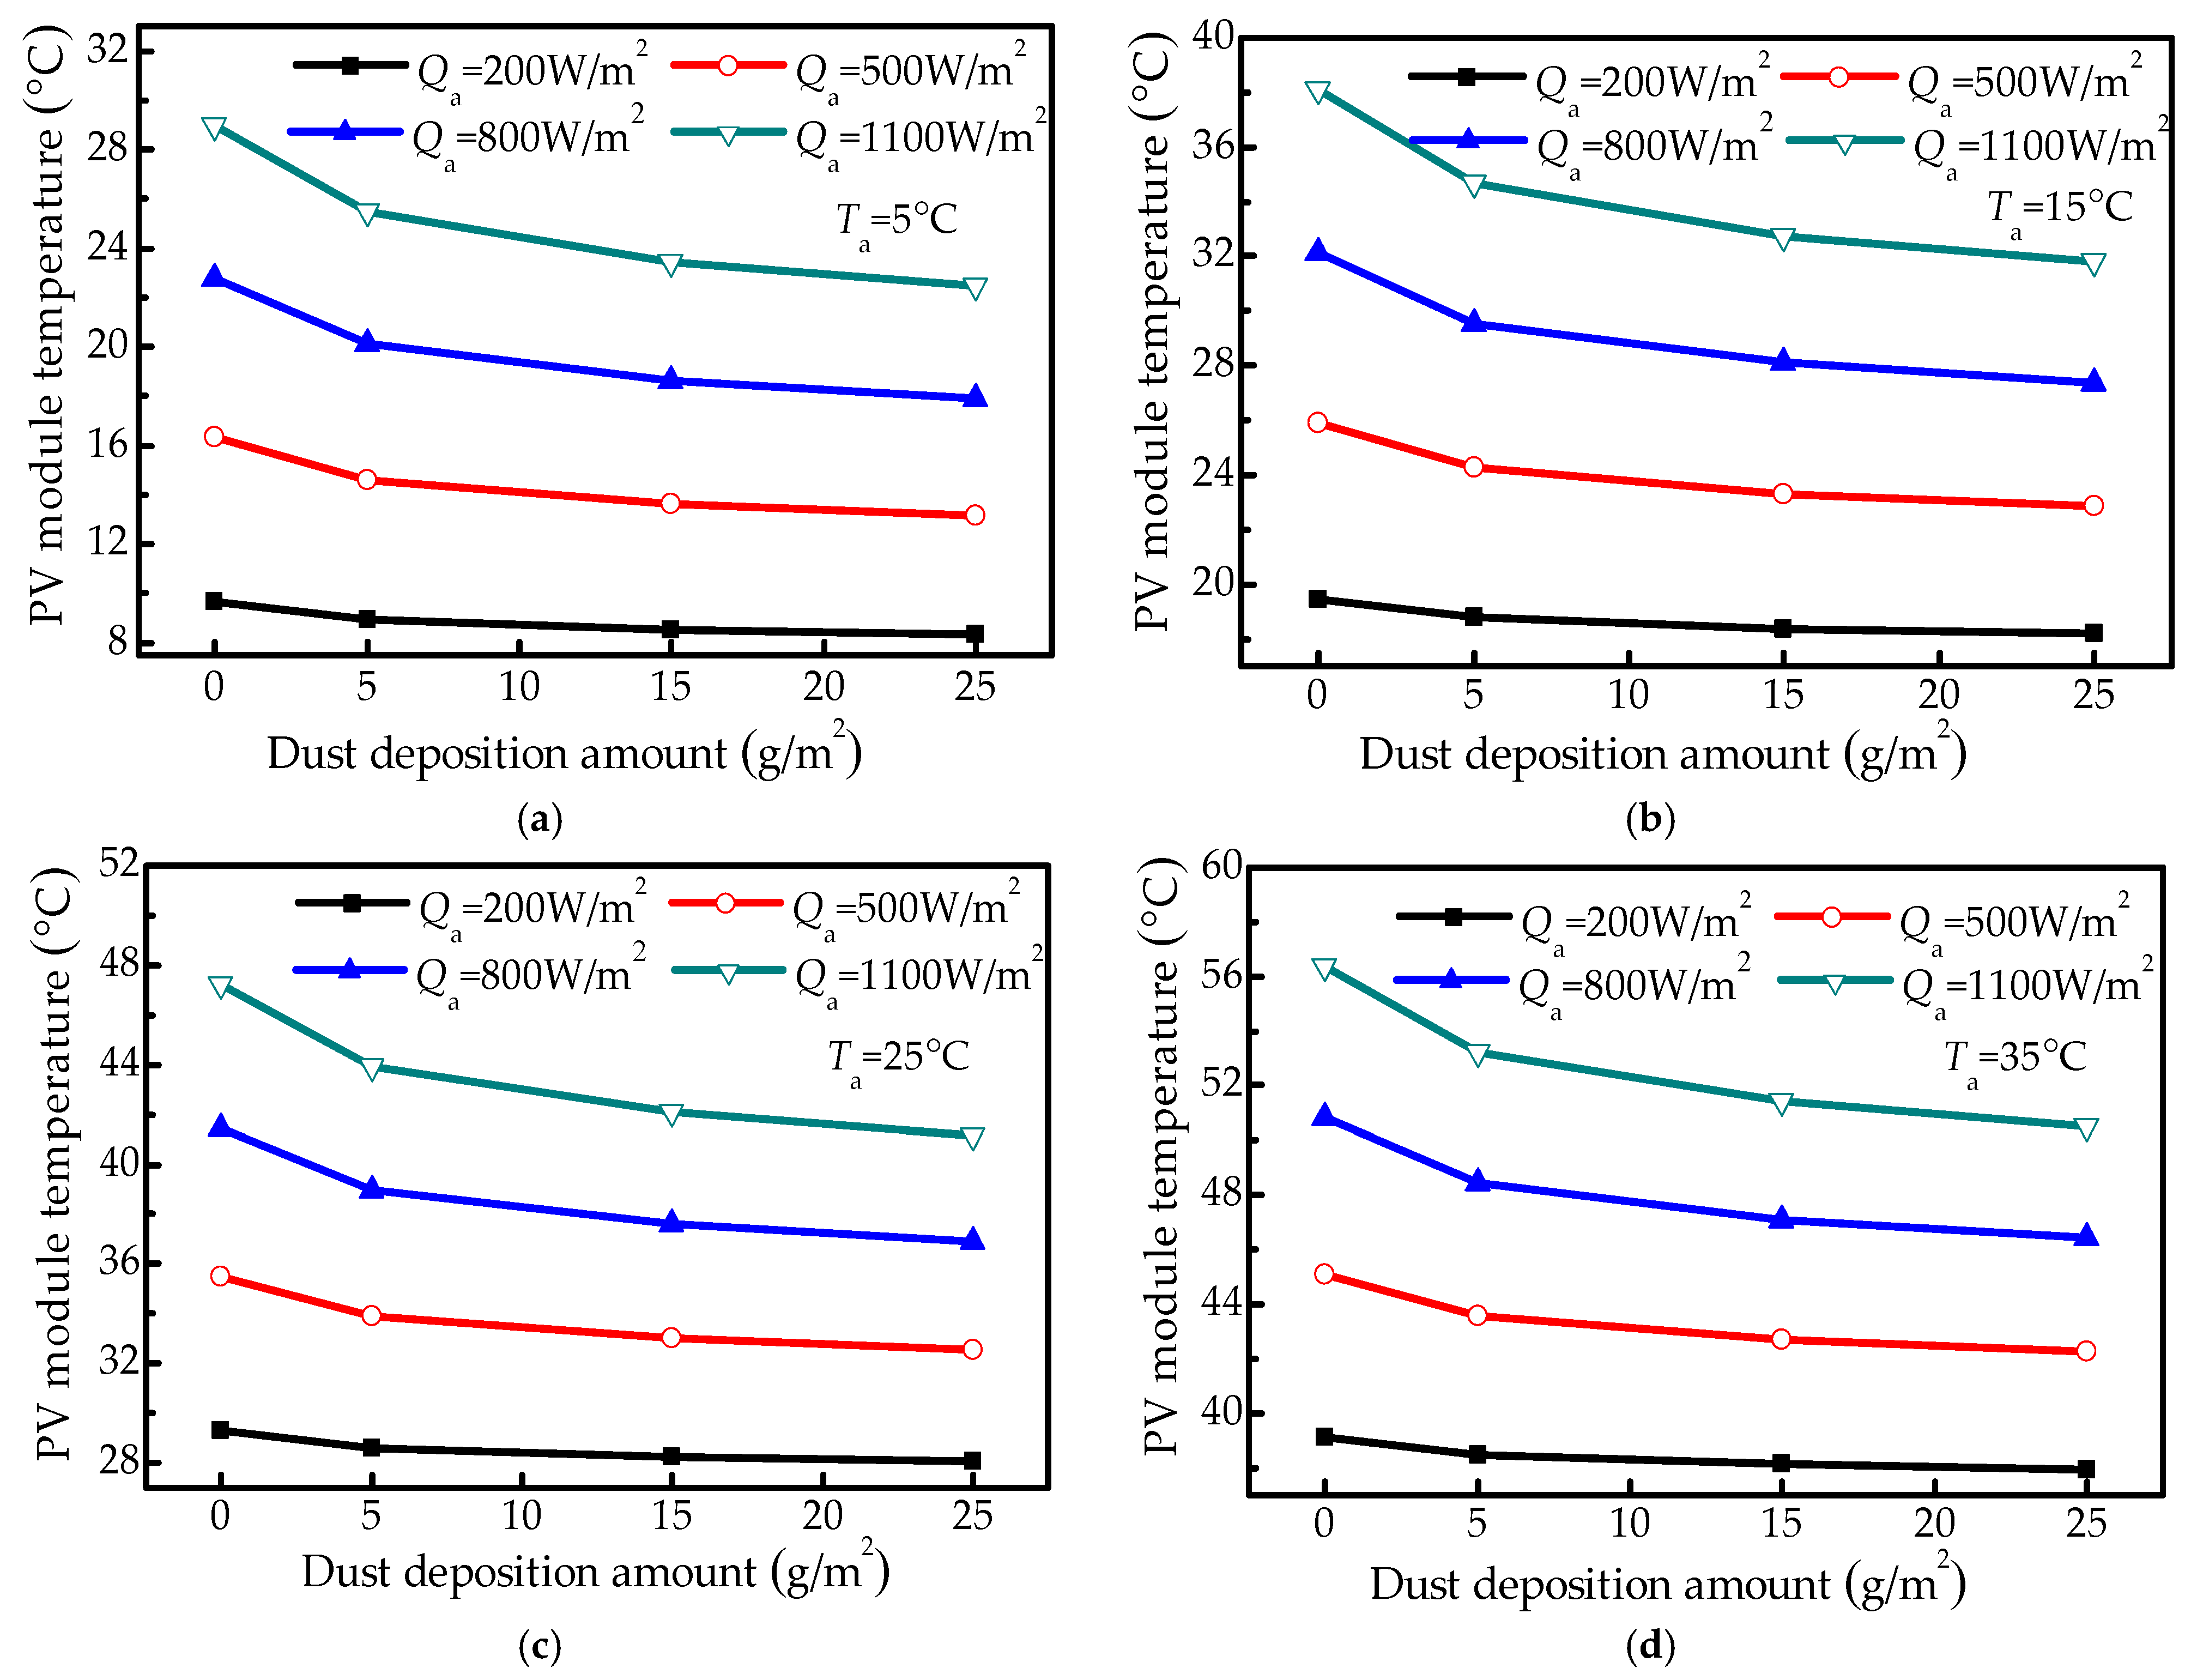
Dust accumulation on the PV module surfaces reduces solar absorption, increases thermal resistance, and thereby affects both module temperature and photoelectric conversion efficiency. When the wind speed is 3 m/s, the variation of PV module temperature with dust accumulation is shown in Figure 6.
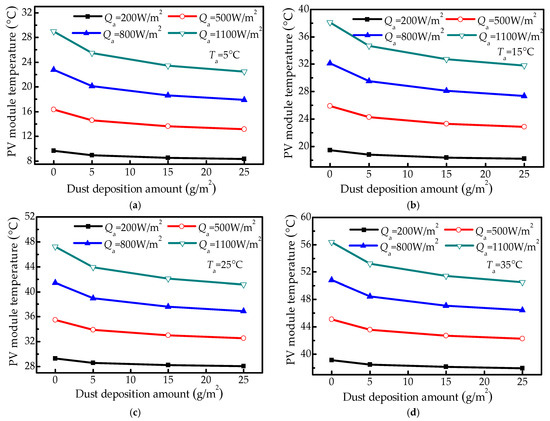
Figure 6.
PV module temperatures versus dust deposition amount. (a) Ta = 5 °C; (b) Ta = 15 °C; (c) Ta = 25 °C; (d) Ta = 35 °C.
Figure 6 demonstrates that PV module temperature decreases with increasing dust deposition amount, and dusty modules exhibit lower temperatures than clean modules. This observation aligns with the experimental results presented in Figure 3 of Section 3.3, which illustrates the relationship between PV module temperature and dust accumulation amount. Furthermore, this trend is consistent with experimental findings reported in the Refs. [11,12,32], which also indicates an inverse relationship between dust accumulation amount and module temperature. Considering an ambient temperature of 5 °C and a wind speed of 3 m/s as examples, the temperature differences between a clean module and dusty modules with dust accumulation amounts of 5 g/m2, 15 g/m2, and 25 g/m2 are approximately 1.7 °C, 2.6 °C, and 3.0 °C, respectively, at an irradiance of 500 W/m2. When the irradiance increases to 1100 W/m2, these temperature differences increase to approximately 3.4 °C, 5.3 °C, and 6.3 °C, respectively. This indicates that, for a given dust accumulation amount, the reduction in module temperature is greater at higher irradiances, influencing module performance and emphasizing the need for adaptive strategies. Therefore, accurate prediction of PV module temperature under polluted conditions, essential for assessing the power generation performance of a PV power station, requires consideration of both dust accumulation and irradiance.
Furthermore, Figure 6 also indicates that an increased dust accumulation amount leads to a more pronounced reduction in module temperature. This is primarily attributed to the fact that increased dust accumulation reduces the transmittance of PV glass, thereby decreasing the solar radiation reaching the glass surface and thus reducing the module temperature. While dust accumulation also increases the thermal resistance of the PV glass surface, hindering heat dissipation and potentially raising module temperature, the low thermal conductivity of dust particles and the typically limited dust layer thickness result in a relatively small temperature increase. In conclusion, dust accumulation primarily reduces module temperature by decreasing transmittance, highlighting the need to prioritize strategies that enhance transmittance to maximize energy harvest and promote sustainable energy production.
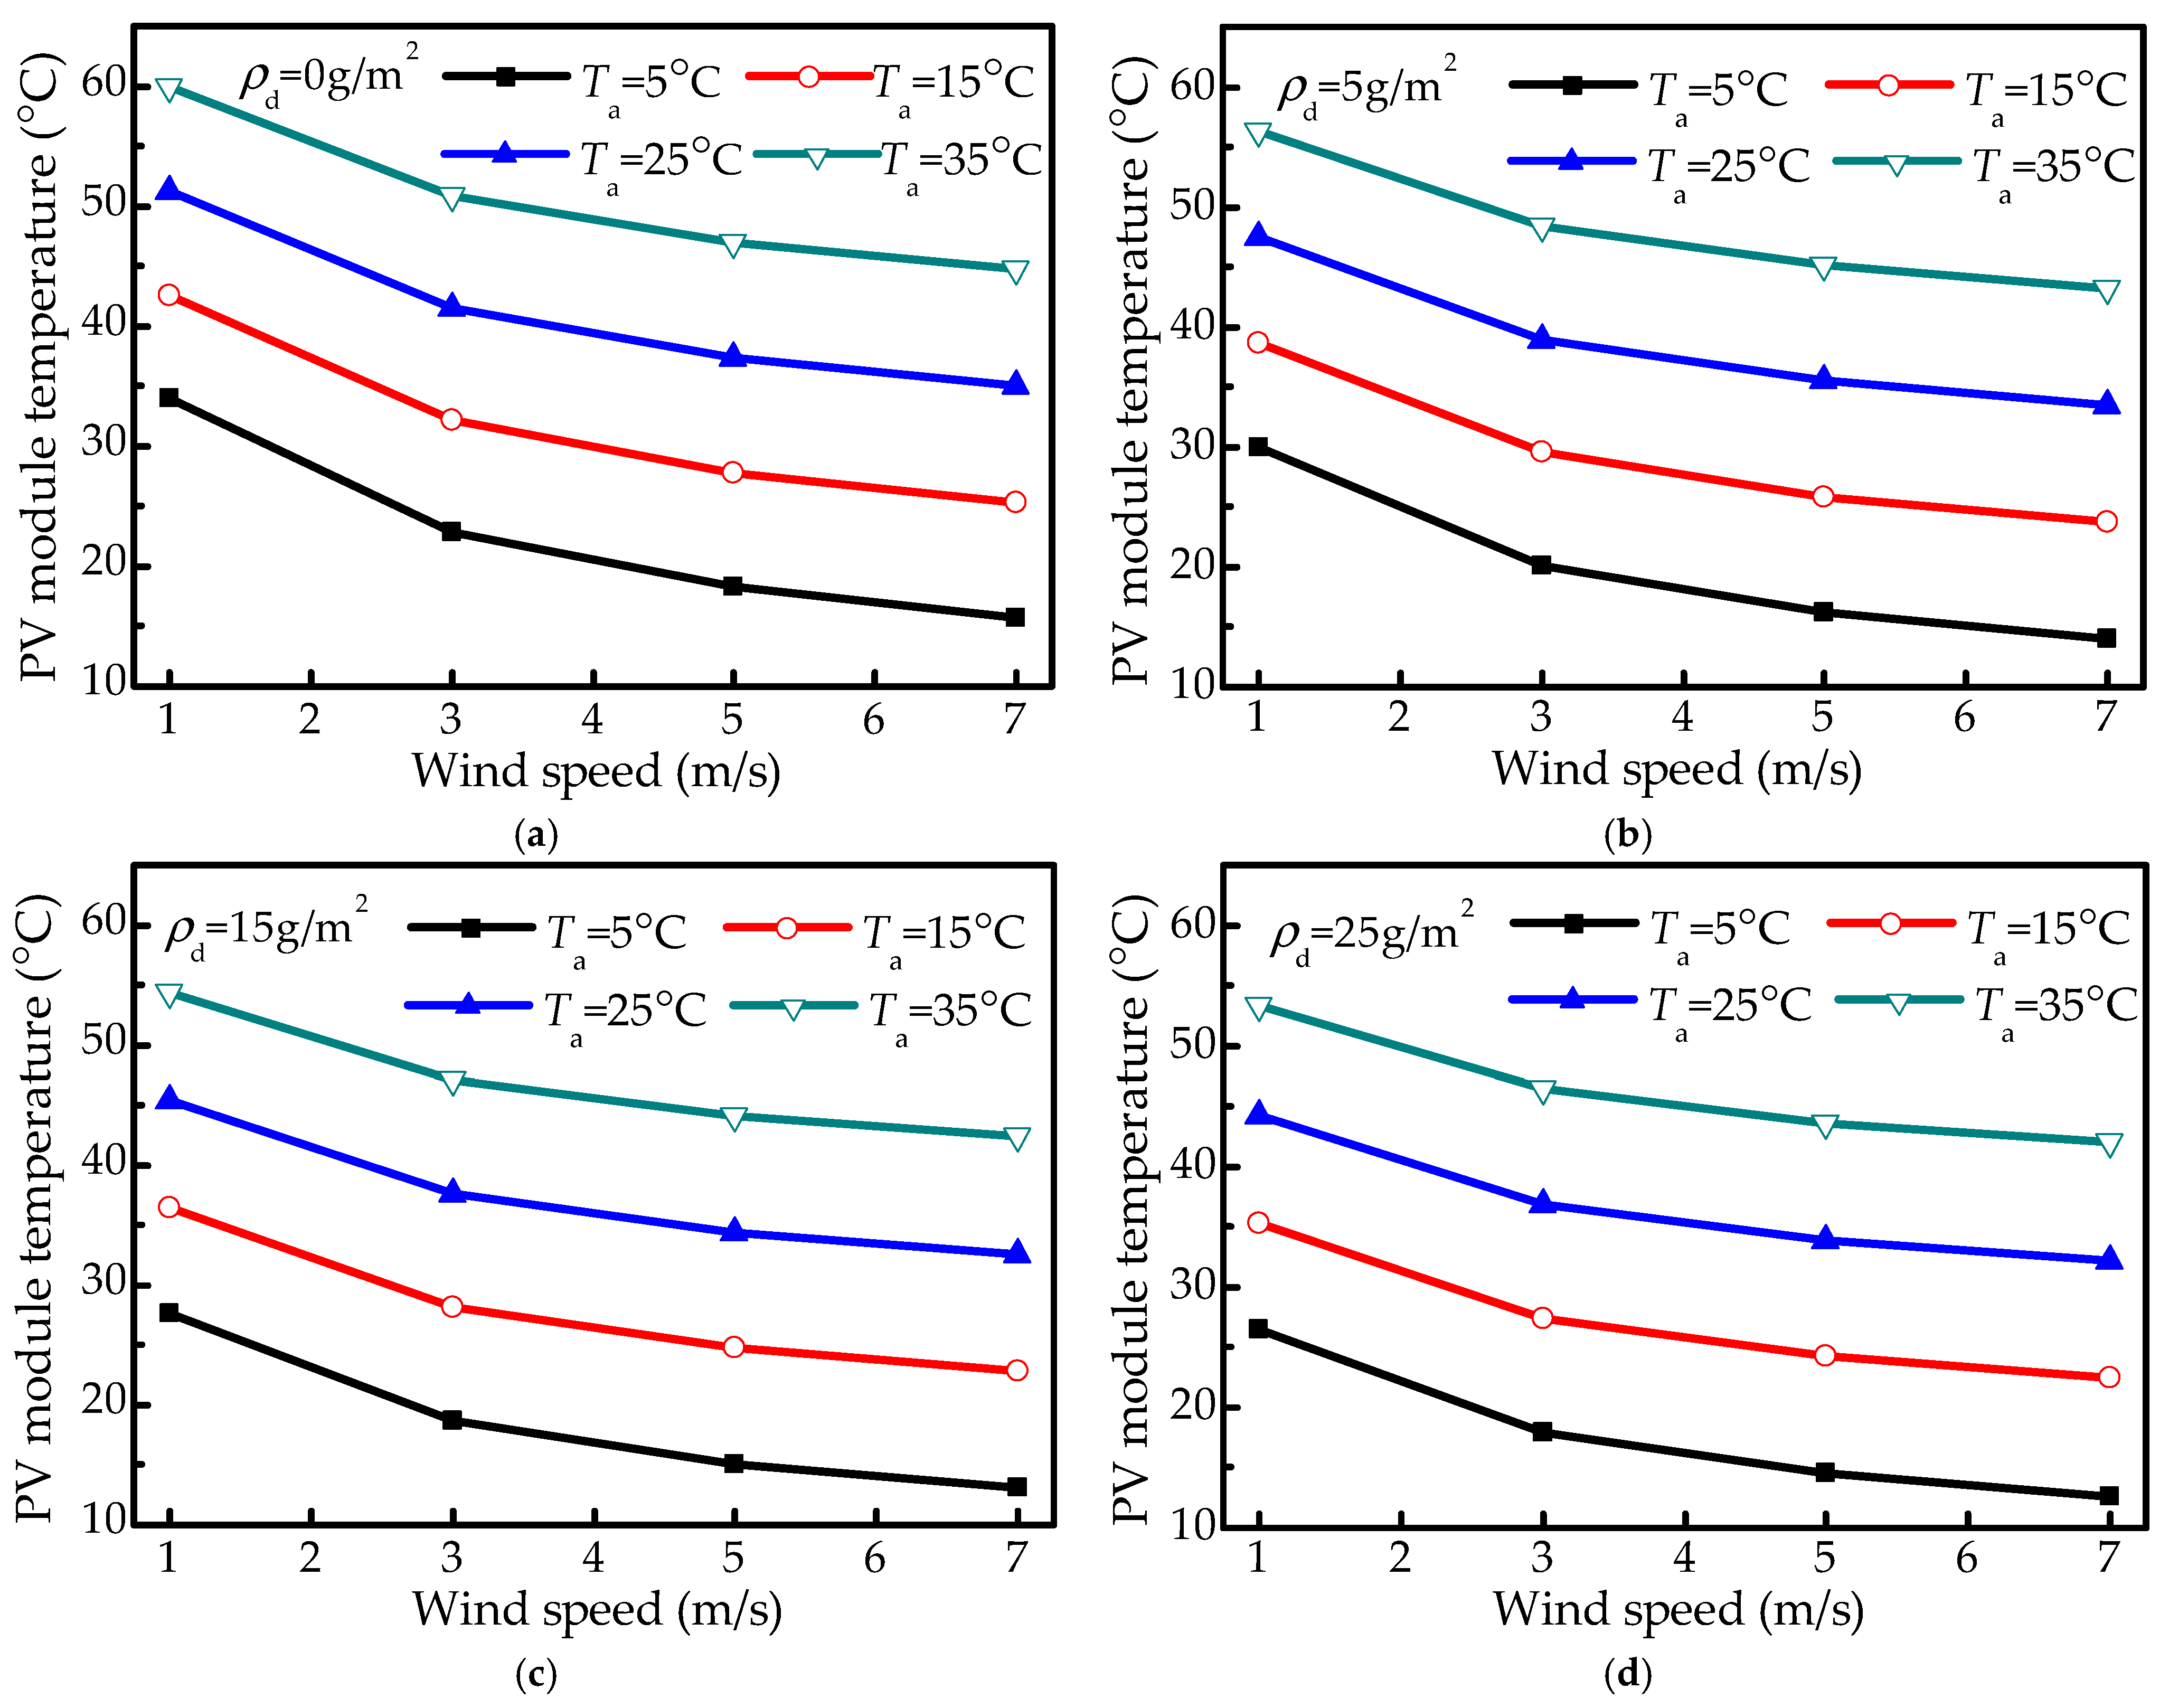
4.1.3. Effect of Wind Speed
Wind speed influences both the deposition of dust particles on the module surface and the flow field characteristics around the module, ultimately affecting module temperature. When the irradiance is 800 W/m2, Figure 7 illustrates the relationship between PV module temperature and wind speed.
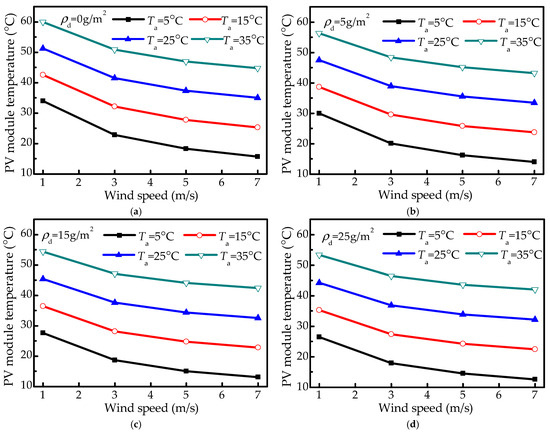
Figure 7.
PV module temperature versus wind speed. (a) ρd = 0 g/m2; (b) ρd = 5 g/m2; (c) ρd = 15 g/m2; (d) ρd = 25 g/m2.
As shown in Figure 7, a negative correlation exists between PV module temperature and wind speed for both dusty and clean modules, with temperature decreasing as wind speed increases, highlighting the role of wind in passively cooling PV arrays for more sustainable operation. This is consistent with the research results reported in Refs. [10,20]. At an ambient temperature of 25 °C and a wind speed of 1 m/s, the module temperature difference between a clean module and a dusty module with a dust accumulation amount of 25 g/m2 is approximately 6.9 °C. This difference decreases to approximately 4.6 °C, 3.5 °C, and 2.8 °C at wind speeds of 3 m/s, 5 m/s, and 7 m/s, respectively. Thus, compared to the clean module temperature, the dusty module temperature decreases by approximately 13.5%, 11.0%, 9.3%, and 8.1%, emphasizing the importance of wind speed for maintaining optimal module efficiency. This indicates that the temperature difference between dusty and clean modules diminishes with increasing wind speed, a key factor in long-term performance.
A comprehensive analysis of Figure 7 reveals that increased wind speed enhances PV module cooling, leading to a greater reduction in module temperature and contributing to improved energy yields over the module lifetime. However, the magnitude of this temperature reduction depends not only on wind speed but also on the interplay of ambient irradiance, ambient temperature, and dust accumulation. Therefore, a comprehensive assessment of these factors’ combined effects is crucial during the site selection for a PV power station to ensure optimal energy harvesting and long-term sustainability. Specifically, the cooling effect of wind speed should be carefully considered when evaluating the power generation potential, ultimately contributing to a more economically viable solar energy installation.
4.1.4. Effect of Wind Direction
Wind direction, as a factor influencing the deposition of dust particles, also affects the PV module temperature. According to historical wind direction data for the Baoding area, the prevailing winds are predominantly from the north and south, accounting for approximately 40% of the days included in the statistical analysis. Table 6 presents the impact of different wind directions on the temperature of a PV module with a 45° tilt angle, with a dust accumulation of 25 g/m2, an ambient temperature of 25 °C, and an irradiance of 1100 W/m2.
Table 6.
Relationship between PV module temperature and wind direction.
Table 6 reveals that the lowest temperatures for the dusty PV modules consistently occur with southerly wind. This is attributed to the south-facing orientation of the PV modules in this study, which aligns with the direction of the southern winds and promotes enhanced convective heat dissipation, thereby lowering module temperature. Furthermore, the impact of different wind directions on module temperature varies significantly. Consequently, the prevailing wind direction at a given site should be a key consideration during the installation of PV modules.
4.2. Evaluation of Output Power of Dusty PV Module
The accumulation of dust particles on PV module surfaces not only reduces transmittance but also influences module temperature, thereby diminishing output power. While Ref. [35] developed a PV radiation model comprehensively incorporating factors such as direct and diffuse solar radiation, solar elevation angle, module tilt angle, and installation azimuth for accurate power generation forecasting, this study diverges from the PV output calculation methodology presented therein. Instead, this study aims to analyze and assess the output power of dusty PV modules, leveraging module temperatures determined in Section 4.1. Considering the coupled effects of various influencing factors, this evaluation is based on the relationship defined in Equations (15) and (16) [36].
where Pout represents the module output power; η and ηref denote the photoelectric conversion efficiencies of the module under actual operating conditions and standard test conditions, respectively; and β0 and β1 are the temperature coefficient of the cell and the solar radiation coefficient, respectively.
The output power of a 750 W peak power dusty PV module, calculated using Equations (14)–(16) while accounting for the coupled effects of multiple factors, is presented in Figure 8.
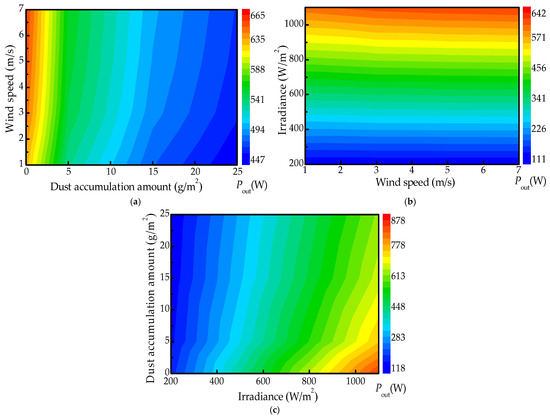
Figure 8.
Output power of PV modules versus different factors. (a) Ta = 25 °C, Qa = 800 W/m2; (b) Ta = 25 °C, ρd = 25 g/m2; (c) Ta = 25 °C, w = 3 m/s.
Figure 8 shows that the output power of the dusty PV module is lower than that of the clean module. Moreover, output power for both modules exhibits a positive correlation with irradiance and wind speed, while displaying a negative correlation with dust accumulation. This agrees with the research results from Ref. [37]. However, the influence of these factors varies. Specifically, output power increases approximately linearly with irradiance, increases more gradually with wind speed, and decreases slowly with increasing dust accumulation.
A comparative analysis of Figure 8 indicates that irradiance exerts the most significant impact on output power compared to wind speed and dust accumulation, a finding consistent with previous research [37]. At an irradiance of 200 W/m2, the output power losses for PV modules with dust accumulation amounts of 5 g/m2 and 25 g/m2 are approximately 27.4 W (representing an attenuation rate of approximately 16.2%) and 51.4 W (approximately 30.4% attenuation rate), respectively, compared to clean modules. When irradiance increases to 800 W/m2, these losses increase to approximately 102.1 W and 192.6 W, respectively, which correspond to output power attenuation rates of 15.7% and 29.6%. These results clearly demonstrate that increased dust accumulation leads to greater output power loss, emphasizing the necessity of timely dust removal to maintain energy yield and support the long-term economic viability of solar energy investments.
5. Conclusions
This paper presents a comprehensive heat transfer model designed to analyze the multiple factors that impact PV module temperature and output performance. The model’s validation is verified through comparisons with both experimental results and the NOCT model, ensuring its accuracy in simulating real-world conditions. This validated model is then used to simulate and investigate the influence of irradiance, dust accumulation amount, wind speed, and wind direction on module temperature, ultimately assessing the module output power under their combined influence. This multi-faceted approach provides a robust foundation for optimizing module performance, maximizing energy yield, and facilitating the sustainable deployment of solar energy technologies. The key findings are
- (1)
- Dust accumulation reduces PV module temperature compared to clean modules, primarily due to the decreased transmittance of PV glass caused by dust deposition.
- (2)
- Module temperature is positively correlated with irradiance and ambient temperature but negatively correlated with wind speed and dust accumulation. Specifically, at an irradiance of 500 W/m2, a module with 25 g/m2 dust accumulation exhibits a temperature 3.0 °C lower than a clean module.
- (3)
- The output power of both clean and dusty PV modules increases with irradiance and wind speed but decreases with dust accumulation, with irradiance exhibiting the most significant influence. At an irradiance of 800 W/m2, solar modules with dust accumulation amounts of 5 g/m2 and 25 g/m2 experience output power attenuation rates of approximately 15.7% and 29.6%, respectively.
- (4)
- Timely dust removal from heavily soiled PV modules is crucial for minimizing output power losses and maintaining optimal performance.
Author Contributions
Conceptualization, investigation, funding acquisition, and writing—original draft preparation, W.Z.; software and data curation, S.H.; validation, methodology, and writing—review and editing, Z.D. All authors have read and agreed to the published version of the manuscript.
Funding
This research was funded by the Talent Introduction Start-up Foundation of Shanghai Institute of Technology, grant number YJ2023-13.
Data Availability Statement
The data presented in this study are available on request from the corresponding author.
Conflicts of Interest
The authors declare no conflicts of interest.
References
- Chala, G.T.; Sulaiman, S.A.; Chen, X. A Study on the Performance of Soiled Solar Photovoltaic Panels at Different Tilt Angles in Al Seeb, Oman. Energies 2025, 18, 301. [Google Scholar] [CrossRef]
- Islam, M.I.; Jadin, M.S.; Mansur, A.A. Characterization of accumulated unknown and soil dust on the PV system: An experimental study on the impact and performance analysis. Renew. Energ. 2024, 237, 121864. [Google Scholar]
- Nezamisavojbolaghi, M.; Davodian, E.; Bouich, A.; Tlemçani, M.; Mesbahi, O.; Janeiro, F.M. The Impact of Dust Deposition on PV Panels’ Efficiency and Mitigation Solutions: Review Article. Energies 2023, 16, 8022. [Google Scholar] [CrossRef]
- Wan, L.T.; Zhao, L.Q.; Xu, W.S.; Guo, F.H.; Jiang, X.X. Dust deposition on the photovoltaic panel: A comprehensive survey on mechanisms, effects, mathematical modeling, cleaning methods, and monitoring systems. Sol. Energy 2024, 268, 112300. [Google Scholar] [CrossRef]
- Zhou, J.C.; Yi, Q.; Wang, Y.Y.; Ye, Z.B. Temperature distribution of photovoltaic module based on finite element simulation. Sol. Energy 2015, 111, 97–103. [Google Scholar] [CrossRef]
- Sunny, V.; Sachin, K. Analysis of temperature effect on PV panel. Mater. Today Proc. 2023, 69, 1–5. [Google Scholar]
- Naghavi, M.S.; Esmaeilzadeh, A.; Singh, B.; Yoon, T.M.; Ong, K.S. Experimental and numerical assessments of underlying natural air movement on PV modules temperature. Sol. Energy 2021, 216, 610–622. [Google Scholar] [CrossRef]
- Chala, G.T.; Sulaiman, S.A.; Chen, X.; Al Shamsi, S.S. Effects of Nanocoating on the Performance of Photovoltaic Solar Panels in Al Seeb, Oman. Energies 2024, 17, 2871. [Google Scholar] [CrossRef]
- Dong, Q.C.; Wu, X.J.; Song, Y.; Du, Y.H.; Qi, J.C.; Huang, L.; Li, W.G.; Huang, Y.B.; Shi, L. Temperature behaviors of transparent solar PV panels under various operating modes: An experimental and numerical study. Renew. Energ. 2025, 250, 123279. [Google Scholar] [CrossRef]
- Wang, C.L.; Yang, A.R.; Li, J.P.; Wang, L.; Si, Z.T. Experimental study on effect of multi-factor coupling on surface temperature of photovoltaic module. Acta Energiae Solaris Sin. 2019, 40, 112–118. [Google Scholar]
- Zhao, M.Z.; Miao, Y.M.; Zhang, X.; Sun, H. Experimental study on influence of different dust particle sizes on performance of PV modules. Acta Energiae Solaris Sin. 2019, 40, 803–808. [Google Scholar]
- Guan, Y.L.; Zhang, H.; Xiao, B. In-situ investigation of the effect of dust deposition on the performance of polycrystalline silicon photovoltaic modules. Renew. Energ. 2017, 101, 1273–1284. [Google Scholar] [CrossRef]
- Ceylan, İ.; Yilmaz, S.; İnanç, Ö. Determination of the heat transfer coefficient of PV panels. Energy 2019, 175, 978–985. [Google Scholar] [CrossRef]
- Kaplani, E.; Kaplanis, S. Thermal modelling and experimental assessment of the dependence of PV module temperature on wind velocity and direction, module orientation and inclination. Sol. Energy 2014, 107, 443–460. [Google Scholar] [CrossRef]
- Li, P.D.; Luo, Y.; Xia, X.; Shi, W. Advancing photovoltaic panel temperature forecasting: A comparative study of numerical simulation and machine learning in two types of PV power plant. Renew. Energ. 2024, 237, 121602. [Google Scholar] [CrossRef]
- Siddiqui, M.U.; Arif, A.F.M. Electrical, thermal and structural performance of a cooled PV module: Transient analysis using a multiphysics model. Appl. Energ. 2013, 112, 300–312. [Google Scholar] [CrossRef]
- Sundaram, A.S.; Dwivedi, U.D. Predictive analysis of power degradation rate in solar PV systems emphasizing hot spots and visual effects-based failure modes. Renew. Energ. 2024, 228, 120684. [Google Scholar]
- Sharma, S.; Malik, P.; Sinha, S. The impact of soiling on temperature and sustainable solar PV power generation: A detailed analysis. Renew. Energ. 2024, 237, 121864. [Google Scholar] [CrossRef]
- Carlos, S.G.; Jorge, A.M.; Carlos, V.S.; David, A.S. The novel evaluation method for PV module temperature and string size risk in utility-scale solar projects. Sol. Energy 2025, 295, 113520. [Google Scholar]
- Lin, H.; Song, Z.H.; Dong, Q.C.; Song, Y.; Zhao, X.Q.; Qi, J.C.; Shi, L. Surface temperature and power generation efficiency of PV arrays with various row spacings: A full-scale outdoor experimental study. Appl. Energ. 2024, 367, 123362. [Google Scholar]
- Xu, Z.M.; Kong, Q.L.; Qu, H.W.; Wang, C. Cooling characteristics of solar photovoltaic panels based on phase change materials. Case Stud. Therm. Eng. 2023, 41, 102667. [Google Scholar] [CrossRef]
- Xu, L.Y.; Li, S.Y.; Jiang, J.M.; Liu, T.S.; Wu, H.Z.; Wang, J.; Li, X.C. The influence of dust deposition on the temperature of soiling photovoltaic glass under lighting and windy conditions. Sol. Energy 2020, 199, 491–496. [Google Scholar] [CrossRef]
- Feng, Y.Y.; Zeng, Y.F.; Ding, M.C.; Gu, X.Y.; Wang, Z.X.; Li, Y.F.; Li, M.C. Research on temperature distribution and power prediction model of photovoltaic modules. Acta Energiae Solaris Sin. 2024, 11, 1–9. [Google Scholar]
- Qu, H.W.; Gao, B.; Kong, Q.L.; Xu, Z.M. Experimental study of the effect of ambient temperature on the output character-istics of PV-PCM systems. J. Energy Storage 2024, 88, 111535. [Google Scholar] [CrossRef]
- Kaplanis, S.; Kaplani, E.; Kaldellis, J.K. PV temperature and performance prediction in free-standing, BIPV and BAPV incorporating the effect of temperature and inclination on the heat transfer coefficients and the impact of wind, efficiency and ageing. Renew. Energ. 2022, 181, 235–249. [Google Scholar] [CrossRef]
- Zhao, W.P.; Lv, Y.K.; Zhou, Q.W.; Yan, W.P. Collision-adhesion mechanism of particles and dust deposition simulation on solar PV modules. Renew. Energ. 2021, 176, 169–182. [Google Scholar] [CrossRef]
- Zhao, W.P.; Lv, Y.K.; Dong, Z.G.; Zhao, F.; Lv, F.Y.; Yan, W.P. Effect of self-cleaning superhydrophobic coating on dust deposition and performance of PV modules. Renew. Energ. 2024, 227, 120576. [Google Scholar] [CrossRef]
- Zhu, J.Y.; Zou, S.; Sun, H. Analyses of heat dissipation of direct-cooling backsheets of crystalline silicon photovoltaic modules at ambient temperatures. Acta Phys. Sin. 2021, 70, 409–416. [Google Scholar] [CrossRef]
- Davis, M.W.; Dougherty, B.P.; Fanney, A.H. Prediction of Building Integrated Photovoltaic Cell Temperatures. J. Sol. Energy Eng. 2001, 123, 200–210. [Google Scholar] [CrossRef]
- Zhao, W.P.; Lv, Y.K.; Zhou, Q.W.; Yan, W.P. Investigation on particle deposition criterion and dust accumulation impact on solar PV module performance. Energy 2021, 233, 121240. [Google Scholar] [CrossRef]
- Belhaouas, N.; Mehareb, F.; Kouadri, B.E. The performance of solar PV modules with two glass types after 11 years of outdoor exposure under the mediterranean climatic conditions. Sustain. Energy Techn. 2022, 49, 101771. [Google Scholar] [CrossRef]
- Zhao, W.P.; Hu, S.; Dong, Z.G.; Zhao, F.; Lv, F.Y.; Guan, X.Y.; Lv, Y.K. Multifactor heat transfer modeling and performance evaluation of photovoltaic modules: Simulation and experimental study. Appl. Therm. Eng. 2025, 278, 127117. [Google Scholar] [CrossRef]
- Sartori, E. Convection coefficient equations for forced air flow over flat surfaces. Sol. Energy 2006, 80, 1063–1071. [Google Scholar] [CrossRef]
- Liang, N.W.; Ren, N.; Ji, Y. Study on the performance of surface water film cooled photovoltaic panels. Renew. Energ. Resour. 2020, 38, 1098–1102. [Google Scholar]
- Fu, X.Q.; Zhang, C.Y.; Xu, Y.; Zhang, Y.M.; Sun, H.B. Statistical machine learning for power flow analysis considering the influence of weather factors on photovoltaic power generation. IEEE Trans. Neural Netw. Learn. Syst. 2025, 36, 5348–5362. [Google Scholar] [CrossRef]
- Notton, G.; Cristofari, C.; Mattei, M. Modelling of a double-glass photovoltaic module using finite differences. Appl. Ther. Eng. 2005, 25, 2854–2877. [Google Scholar] [CrossRef]
- Lv, Y.K.; Zhao, R.Y.; Zhou, Q.W.; Zhao, W.P. Investigation on influence of environmental factors on temperature and output characteristics of solar PV modules. Acta Energiae Solaris Sin. 2024, 45, 194–203. [Google Scholar]


Disclaimer/Publisher’s Note: The statements, opinions and data contained in all publications are solely those of the individual author(s) and contributor(s) and not of MDPI and/or the editor(s). MDPI and/or the editor(s) disclaim responsibility for any injury to people or property resulting from any ideas, methods, instructions or products referred to in the content. |
© 2025 by the authors. Licensee MDPI, Basel, Switzerland. This article is an open access article distributed under the terms and conditions of the Creative Commons Attribution (CC BY) license (https://creativecommons.org/licenses/by/4.0/).