Author Contributions
The first author, H.J., proposed the conceptual framework and methodology of this study. The second author, W.H., conducted the numerical simulations, data processing, manuscript writing, and figure preparation. The third author, X.C., provided essential data support for the research. All authors have read and agreed to the published version of the manuscript.
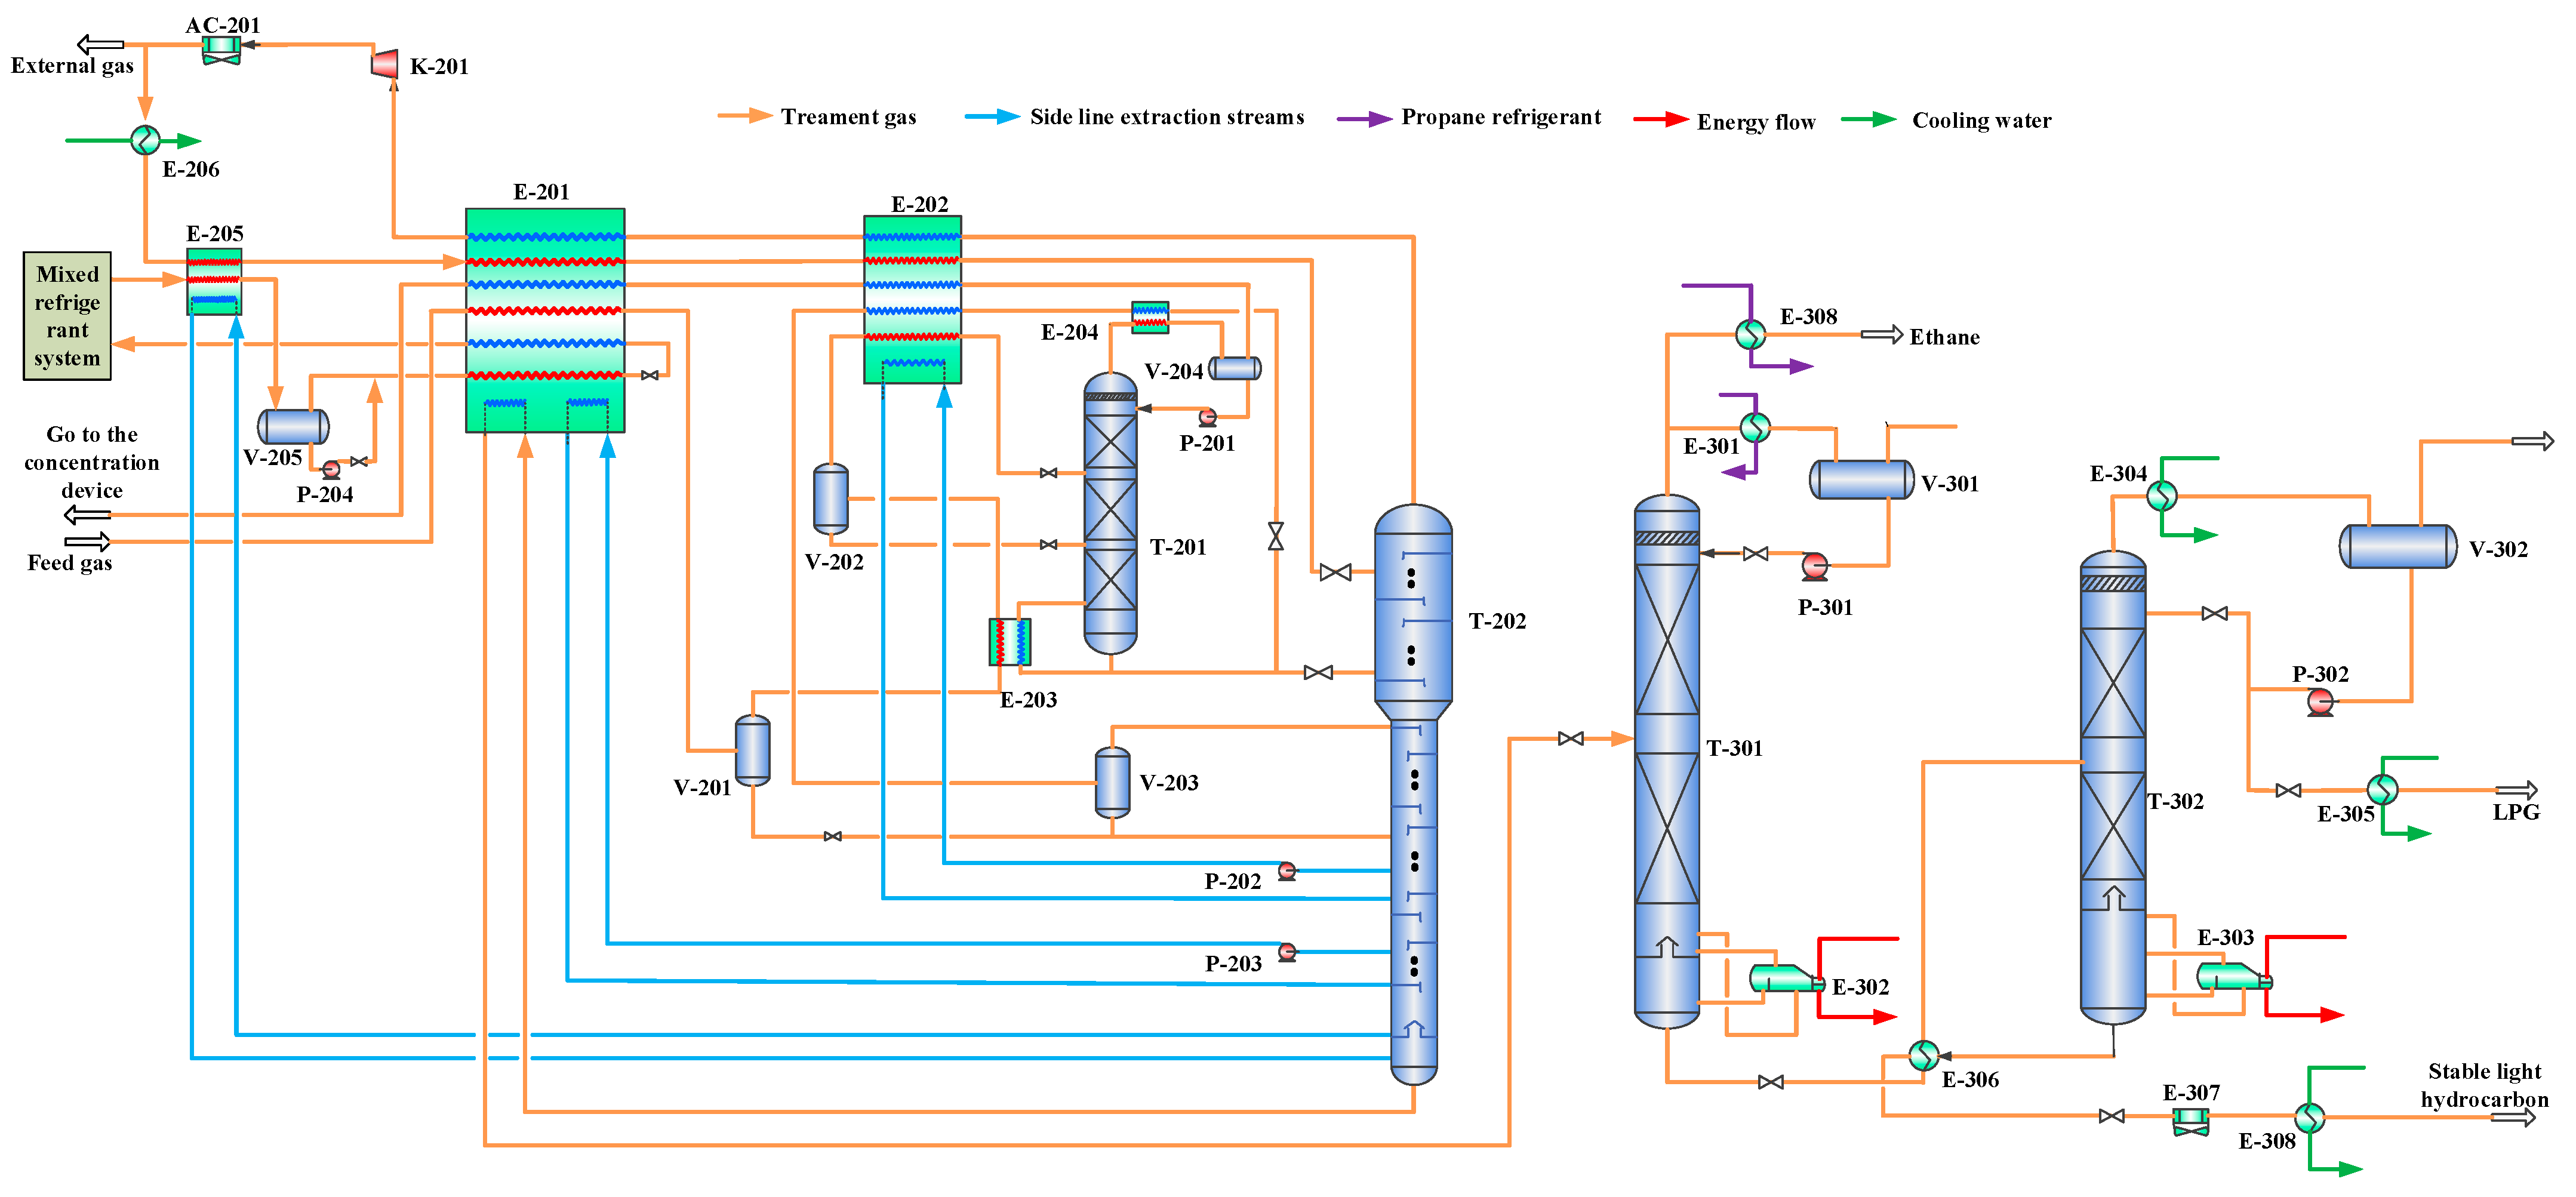
Figure 1.
Main process flow of combined propane and mixed refrigerant refrigeration system. E-201—primary cold box; E-202—secondary cold box; E-203—first-stage enrichment column bottom heat exchanger; E-204—first-stage enrichment column top condenser; E-205—demethanizer column bottom heat exchanger; E-206, E-304, E-305, and E-308—water coolers; E-301—propane evaporator; E-302—deethanizer column reboiler; E-303—liquefied petroleum gas column reboiler; E-306 and E-308—shell-and-tube heat exchangers; AC-201 and AC-307—air coolers; T-201—helium first-stage enrichment column; T-202—demethanizer column; T-301—deethanizer column; T-302—LPG column; K-201—export gas compressor; V-201, V-202, V-203, V-204, V-205, V-301, and V-302—separators; P-201, P-202, P-203, P-204, P-301, and P-302—pumps.
Figure 2.
Main process flow of ethylene -propane cascade refrigeration. E-201—primary cold box; E-202—secondary cold box; E-203—primary enrichment column bottom exchanger; E-204—primary enrichment column overhead condenser; E-205—demethanizer bottom exchanger; E-301—propane evaporator; E-302—deethanizer reboiler; E-303—LPG column reboiler; E-304 and E-308—water coolers;AC-201 and AC-202—air coolers; E-306—shell-and-tube heat exchanger;T-201—helium primary enrichment column; T-202—demethanizer; T-301—deethanizer; T-302—LPG column; K-201—export gas compressor;V-201, V-202, V-203, V-204, V-301, and V-302—separators; P-201, P-202, P-203, P-301, and P-302—pumps.
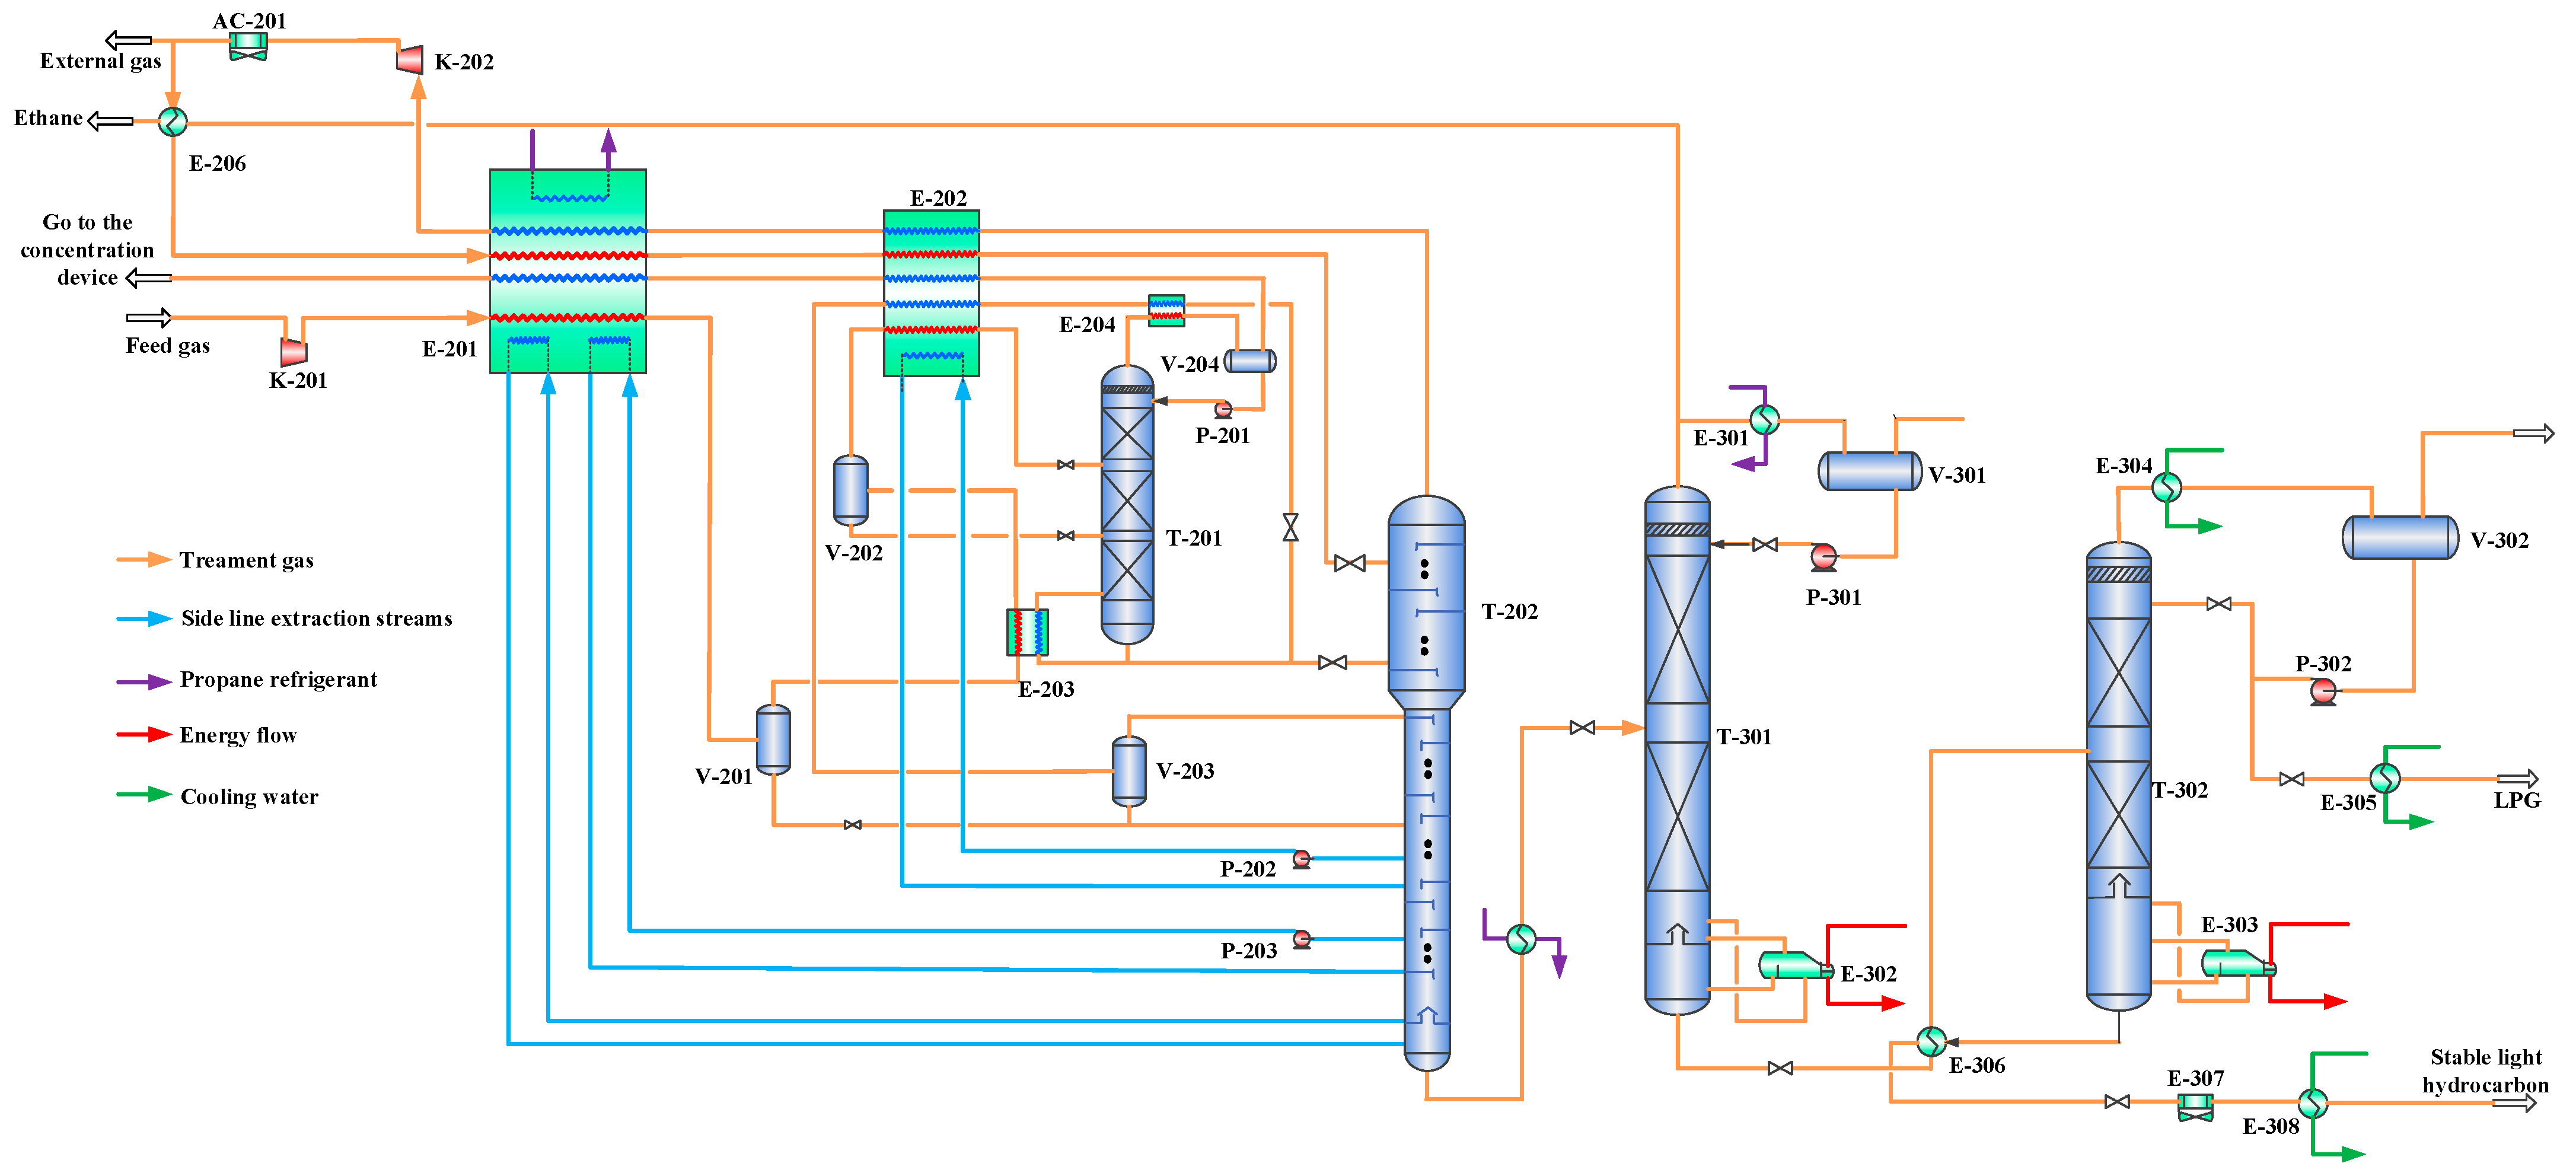
Figure 3.
Main process flow of pre-compression combined with propane refrigeration. E-201—primary cold box; E-202—secondary cold box; E-203—primary enrichment column bottom exchanger; E-204—primary enrichment column overhead condenser; E-205—demethanizer bottom exchanger; E-206 and E-306—shell-and-tube heat exchangers; E-301—propane evaporator; E-302—deethanizer reboiler; E-303—LPG column reboiler; E-304, E-305, and E-308—water coolers; AC-20 and AC-301—air coolers; T-201—helium primary enrichment column; T-202—demethanizer; T-301—deethanizer; T-302—LPG column; K-201—feed gas booster compressor; K-202—export gas compressor; V-201, V-202, V-203, V-204, V-301, and V-302—separators; P-201, P-202, P-203, P-301, and P-302—pumps.
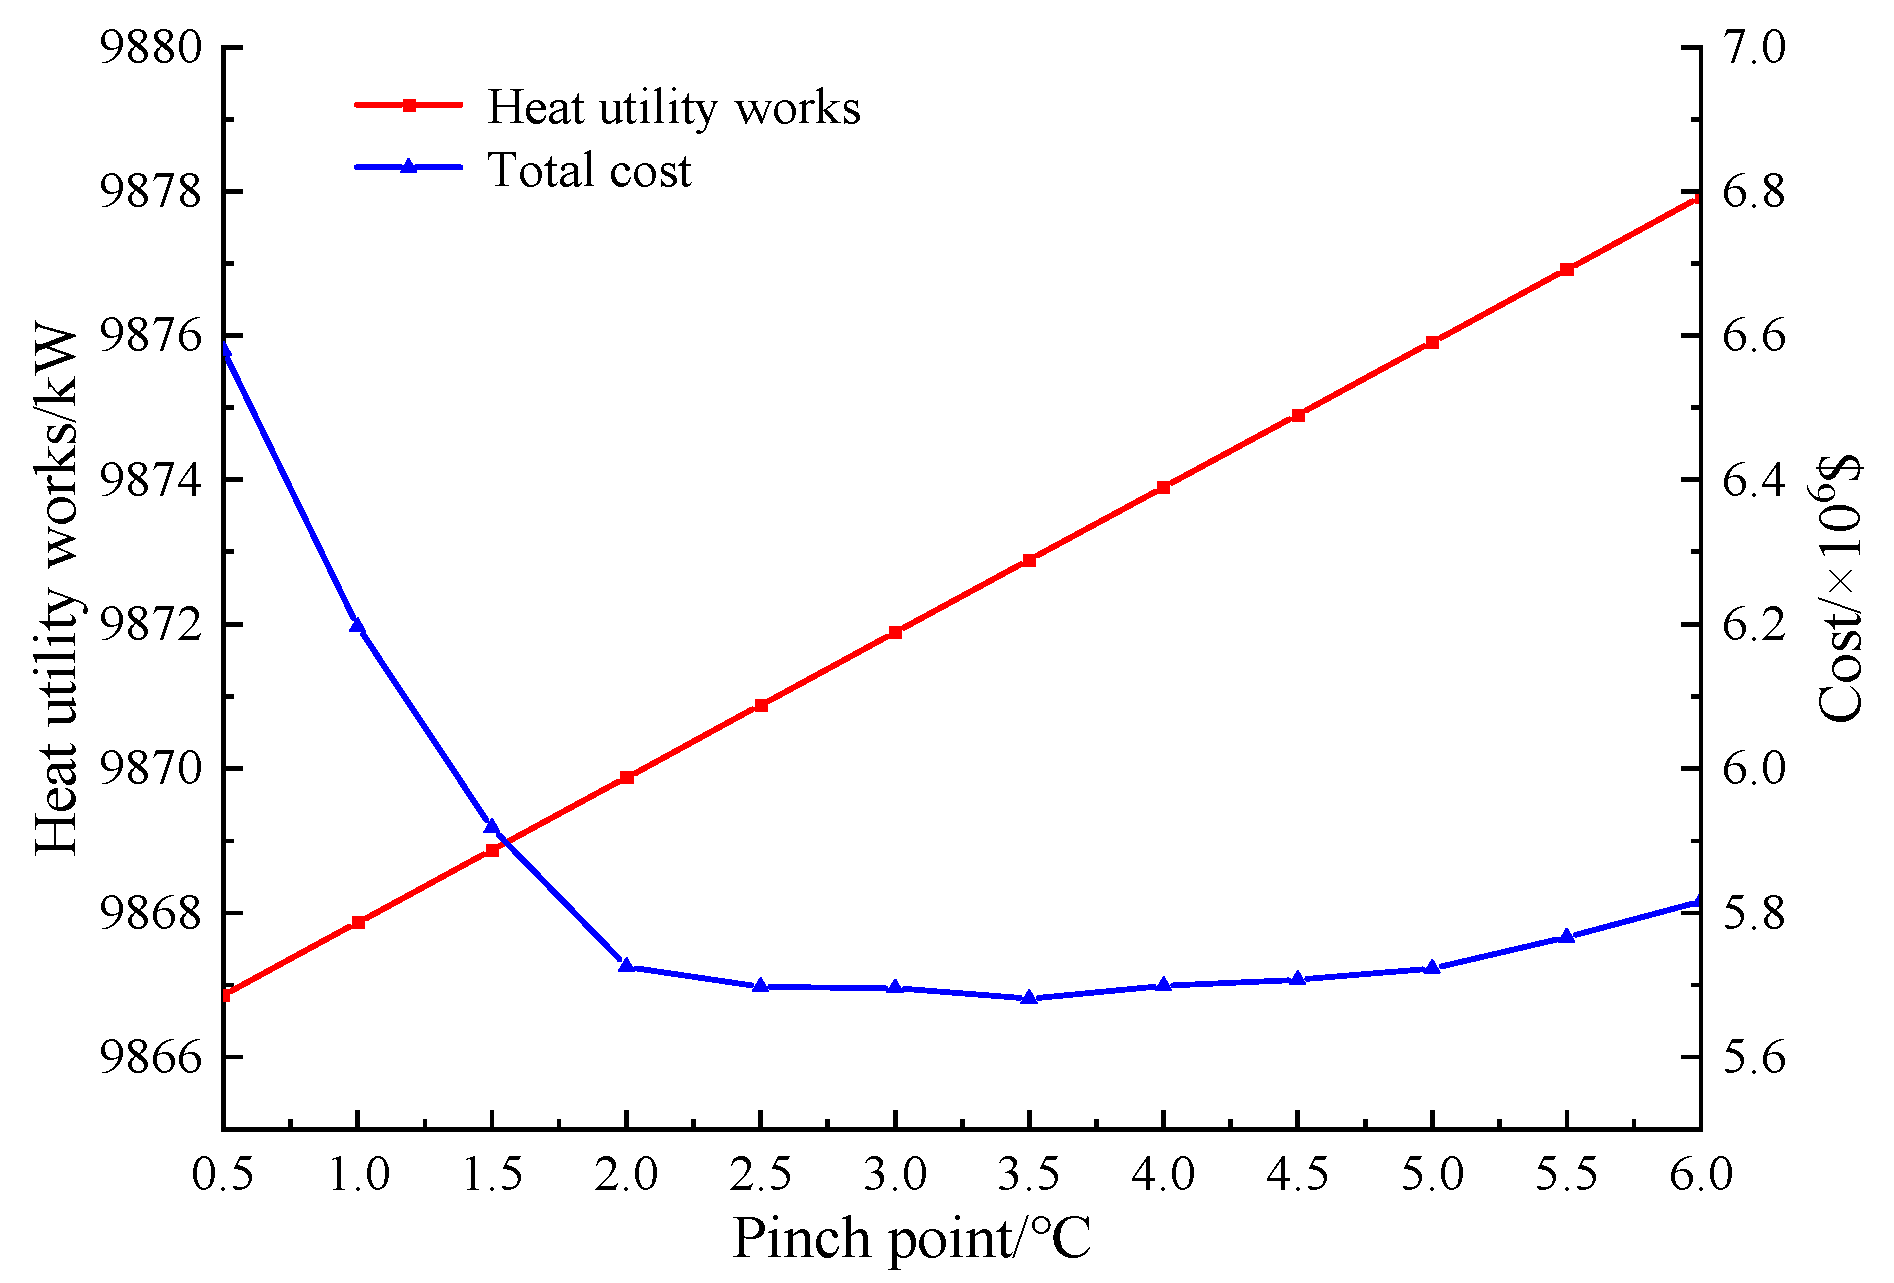
Figure 4.
The variation curves of investment cost and heat utility consumption with the pinch point.
Figure 4.
The variation curves of investment cost and heat utility consumption with the pinch point.
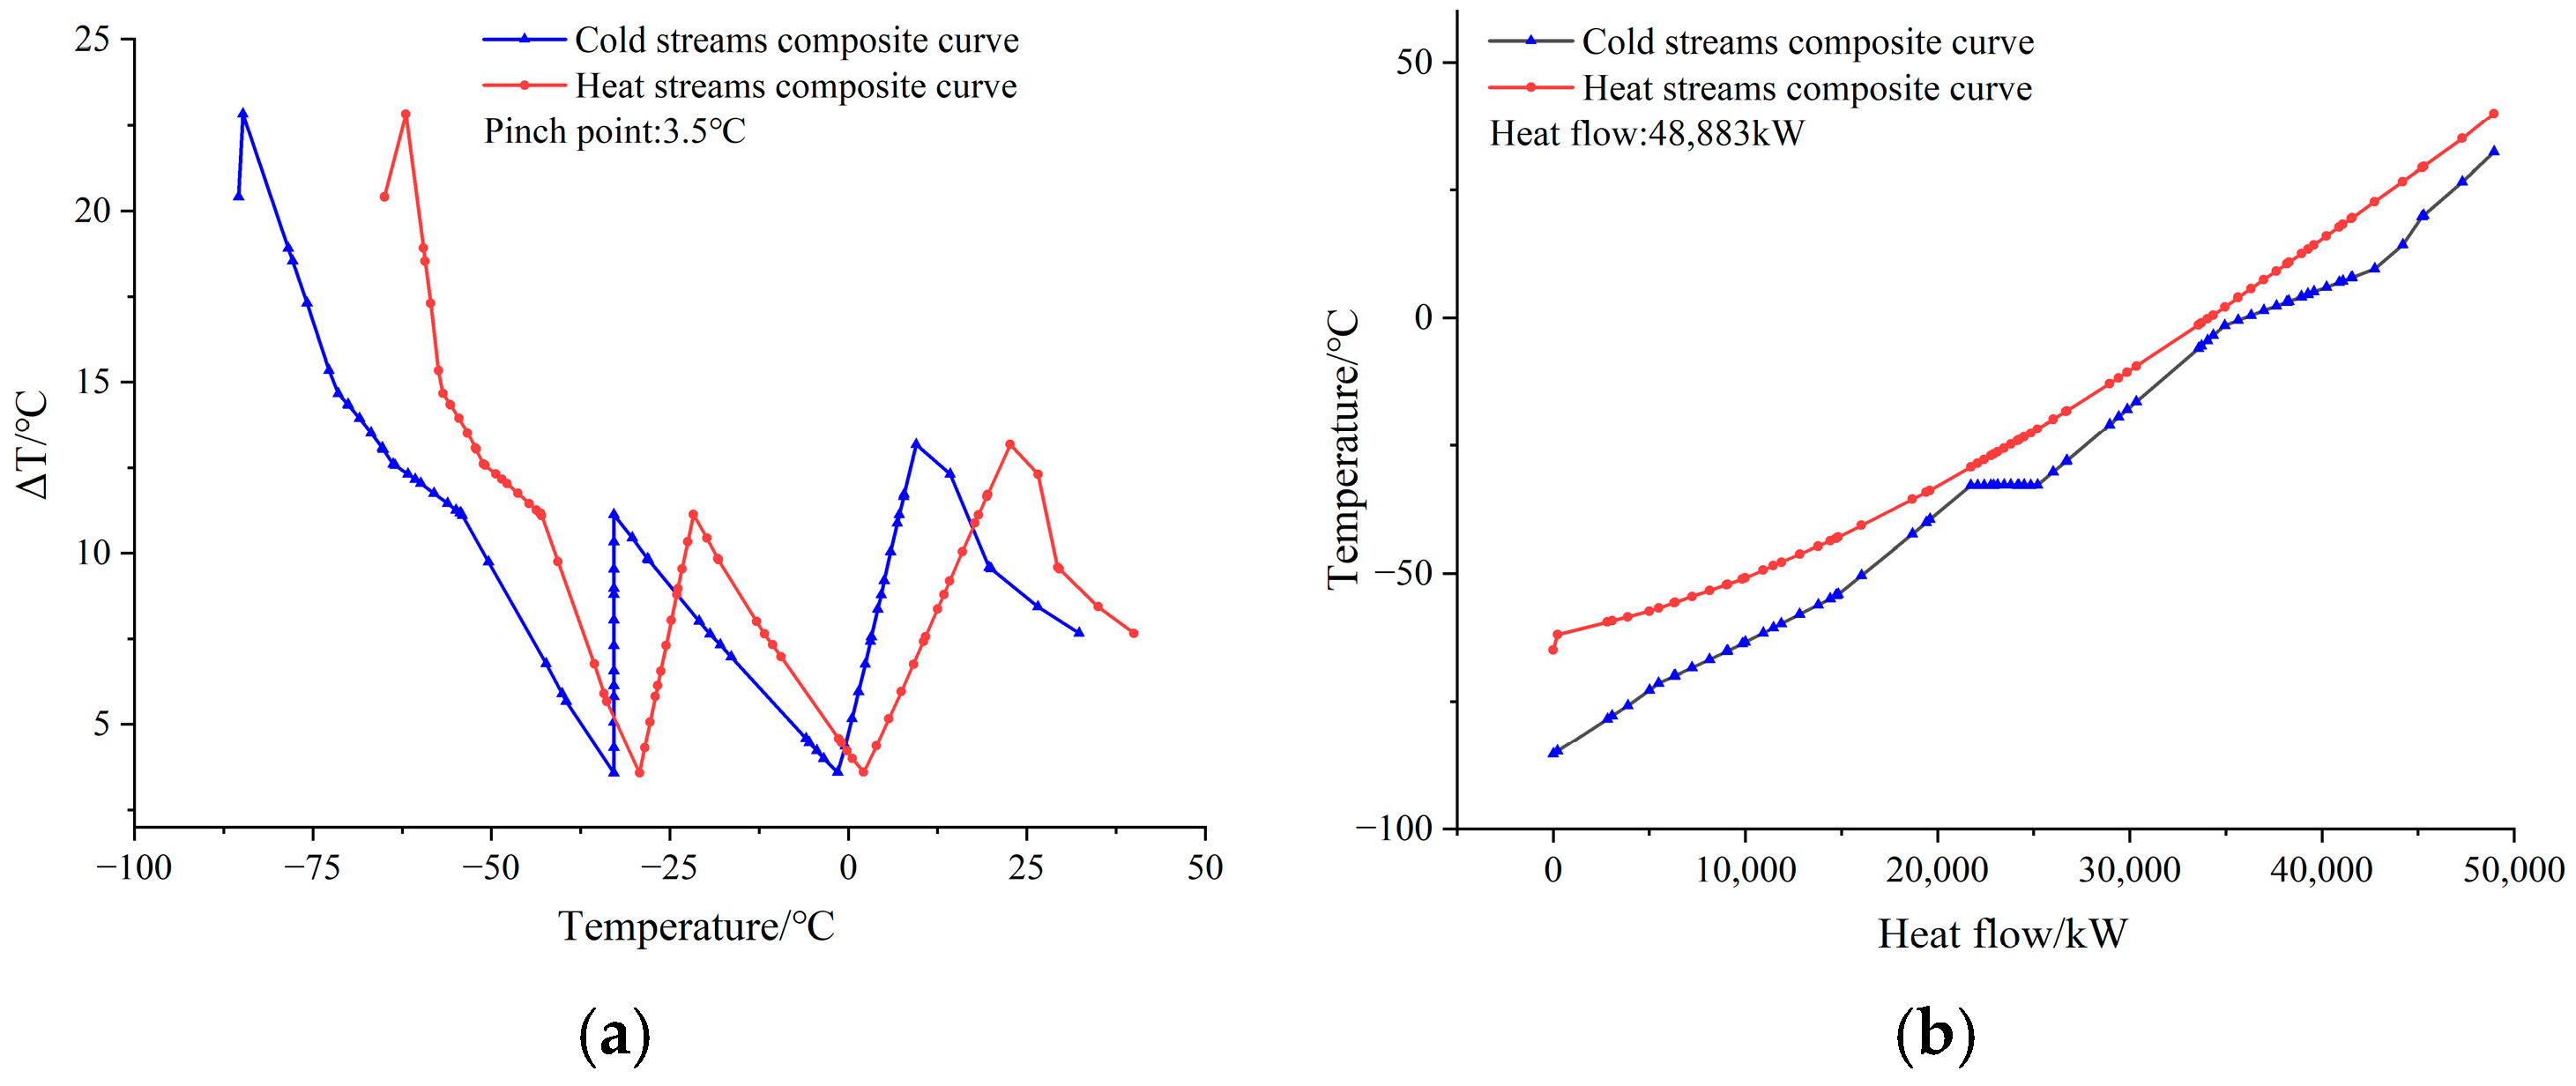
Figure 5.
Process Scheme 1: primary cold box curve. (a) Temperature differential curves. (b) Heat exchange curves.
Figure 5.
Process Scheme 1: primary cold box curve. (a) Temperature differential curves. (b) Heat exchange curves.
Figure 6.
Process Scheme 2: primary cold box curve. (a) Temperature differential curves. (b) Heat exchange curves.
Figure 6.
Process Scheme 2: primary cold box curve. (a) Temperature differential curves. (b) Heat exchange curves.
Figure 7.
Process Scheme 3: primary cold box curve. (a) Temperature differential curves. (b) Heat exchange curves.
Figure 7.
Process Scheme 3: primary cold box curve. (a) Temperature differential curves. (b) Heat exchange curves.
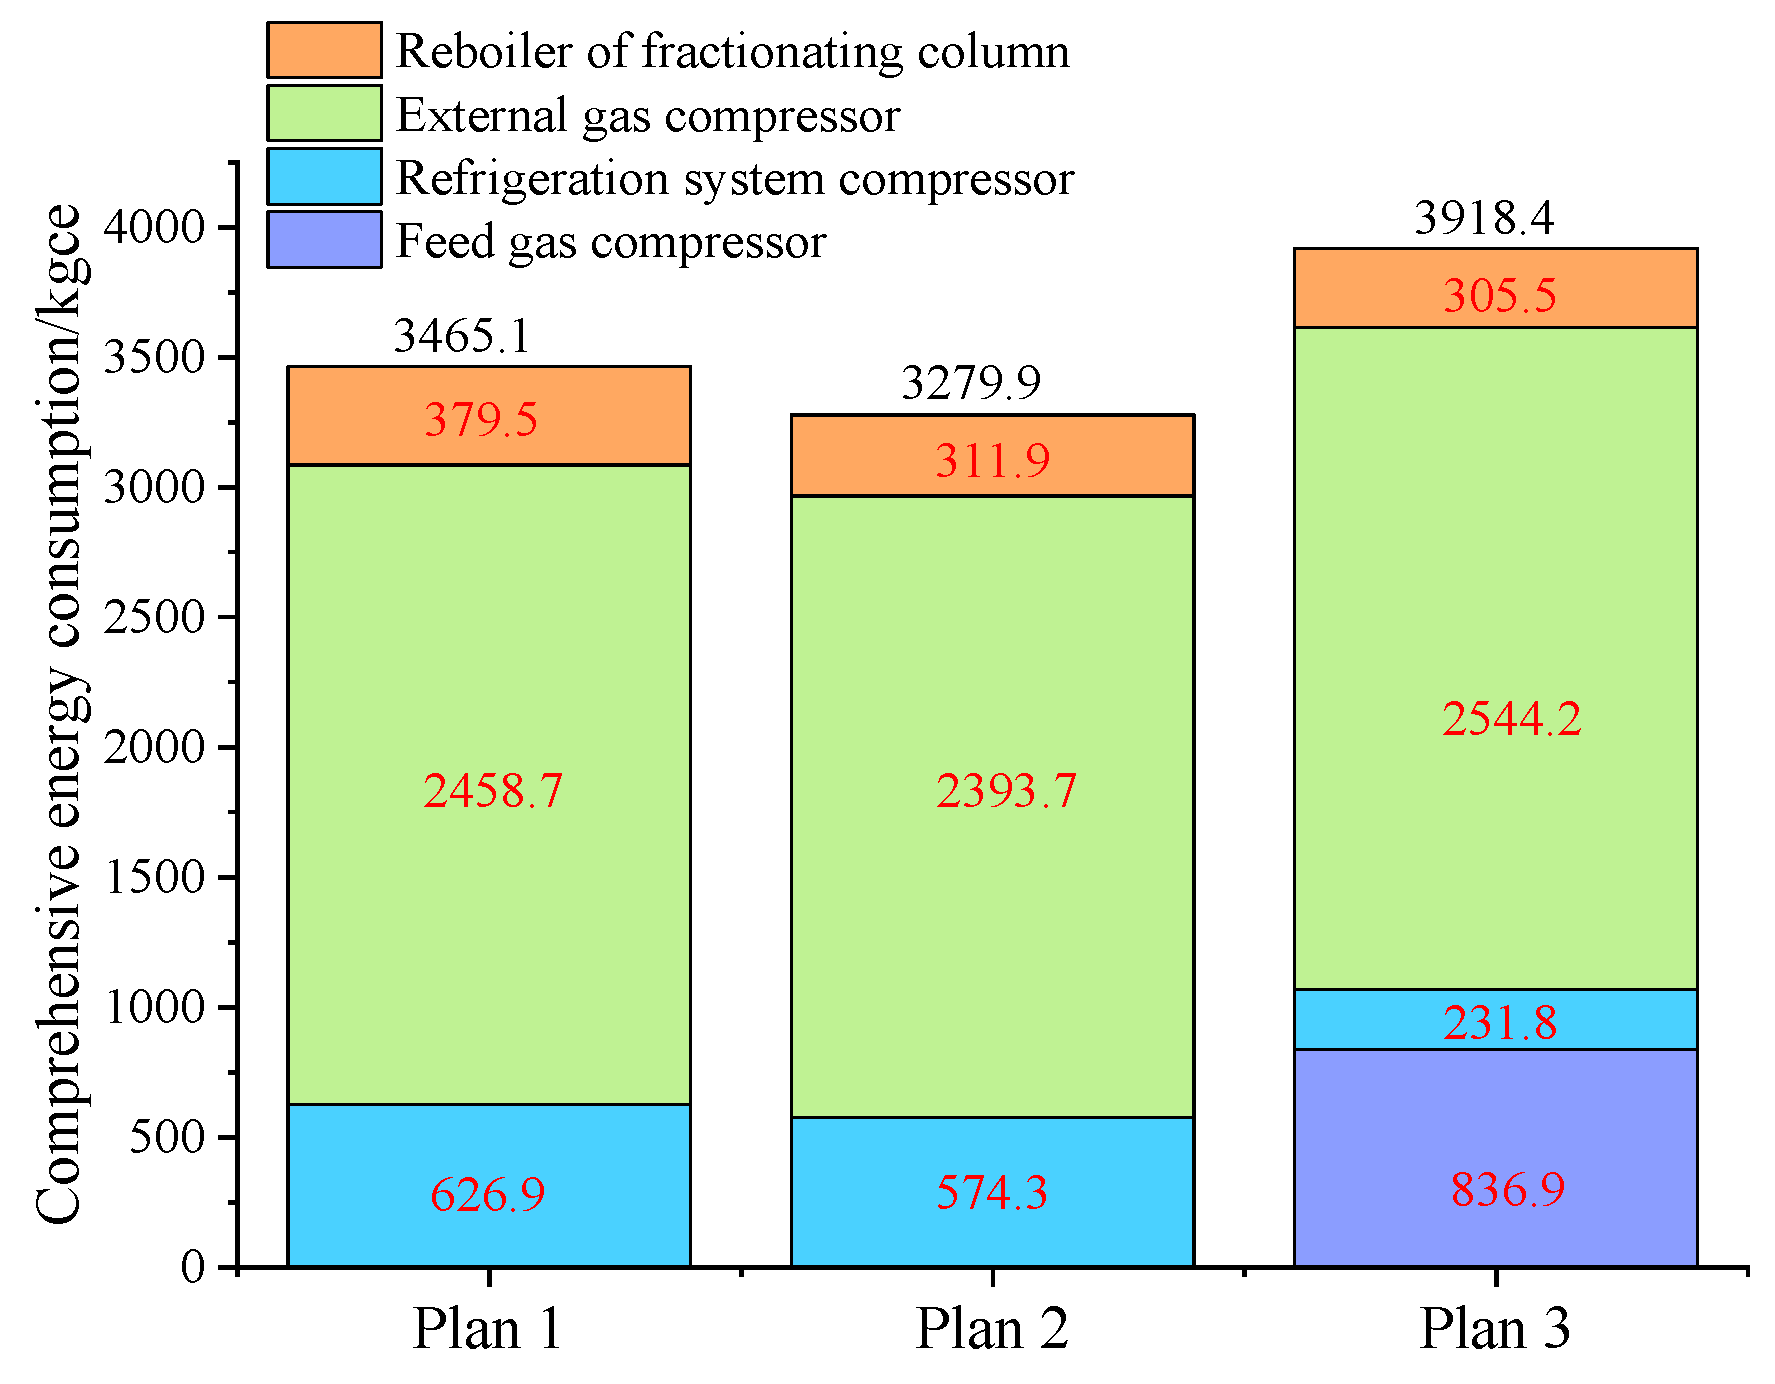
Figure 8.
A comparison chart of comprehensive energy consumption among the three Schemes.
Figure 8.
A comparison chart of comprehensive energy consumption among the three Schemes.
Figure 9.
Exergy destruction of each device.
Figure 9.
Exergy destruction of each device.
Figure 10.
CO2 freeze-out curves in demethanizer for varied feed gas compositions (a) CO2 Freeze-out curve in demethanizer at 0.99 mol% feed concentration (b) CO2 freeze-out curve in demethanizer at 1.39 mol% feed concentration (c) CO2 freeze-out curve in demethanizer at 1.79 mol% feed concentration.
Table 1.
Composition of feed gas.
Table 1.
Composition of feed gas.
| Components | Content/mol% |
|---|
| H2 | 0.0157 |
| He | 0.0409 |
| N2 | 0.5073 |
| H2S | 0.0002 |
| CH4 | 93.5174 |
| C2H6 | 3.8631 |
| C3H8 | 0.6710 |
| i-C4H10 | 0.1185 |
| n-C4H10 | 0.1159 |
| i-C5H12 | 0.0540 |
| n-C5H12 | 0.0222 |
| C6 | 0.0411 |
| C7 | 0.0227 |
| C8 | 0.0038 |
Table 2.
Basic and control parameters.
Table 2.
Basic and control parameters.
| Parameters | |
|---|
| Basic parameters | |
| Simulation tools | Aspen HYSYS V12 |
| Property packages | Peng–Robinson |
| Enthalpy–entropy model | Lee–Kesler |
| Compressor models | Centrifugal |
Helium first-stage enrichment column,
Deethanizer column, LPG column | Packed |
| Demethanizer column | Plate |
| The process is steady state, disregardingkinetic and potential energy | |
| Control parameter | |
| External gas outlet pressure/MPa | 5.8 |
| Adiabatic efficiency of the compressor/pump/% | 75 |
| Outlet temperature of the air cooler/°C | 50 |
| Outlet temperature of cooling water/°C | 38 |
| Ethane recovery rate/% | 95 |
| Ambient temperature/°C | 25 |
| Ambient pressure/kPa | 101.325 |
Table 3.
Comparison of simulation parameters and operating parameters.
Table 3.
Comparison of simulation parameters and operating parameters.
| Parameters | Simulation Data | Operating Data |
|---|
| Primary cryogenic separator | Temperature/°C | −70 |
| Pressure/kPa | 4340 |
| Secondary cryogenic separator | Temperature/°C | −76.3 |
| Pressure/kPa | 4400 |
| Primary enrichment column | Bottom temperature/°C | −92.1 | −90.2 |
| Operating pressure/kPa | 3740 | 3740 |
| Helium concentration/mol% | 0.8932 | 0.7812 |
| CO2 concentration/mol% | 0.0025 | 0.0023 |
| Demethanizer | Top temperature/°C | −99.1 | −98.6 |
| Operating pressure/kPa | 2680 | 2680 |
| Refrigeration system power/kW | 8177 | 7962 |
Table 4.
Comparison of key parameters for three process Schemes.
Table 4.
Comparison of key parameters for three process Schemes.
| Parameters | Scheme 1 | Scheme 2 | Scheme 3 |
|---|
| Primary cryogenic separator | Temperature/°C | −70 | −70 | −62 |
| Pressure/kPa | 4340 | 4340 | 5850 |
| Secondary cryogenic separator | Temperature/°C | −76.9 | −76.8 | −67.3 |
| Pressure/kPa | 4290 | 4290 | 5800 |
| Primary enrichment column | Bottom temperature/°C | −86.7 | −86.2 | −83.9 |
| Top temperature/°C | −92 | −91.3 | −91.2 |
| Operating pressure/kPa | 3740 | 3800 | 4000 |
| Helium concentration factor | 22.04 | 21.85 | 21.83 |
| Bottom liquid split ratio/% | 0.75 | 0.75 | 0.75 |
| Demethanizer | Bottom temperature/°C | 6.3 | 6.3 | 7.8 |
| Top temperature/°C | −98 | −98 | −96.9 |
| Operating pressure/kPa | 2700 | 2700 | 2800 |
| Reboiler duty/kW | 3399 | 3419 | 3762 |
| Reflux ratio/% | 11 | 10 | 11 |
| Export gas flow rate/104 m3/d | 138.5 | 138.5 | 168.6 |
| Ethane recovery rate/% | 95 | 95 | 94 |
| Ethane production/104 m3/d | 13.4 | 13.5 | 13.3 |
| LPG production/t/d | 508 | 495 | 504 |
| Stabilized light hydrocarbon production/t/d | 166 | 166 | 166 |
| Mixed refrigerant circulation/kgmol/h | 2800 | / | / |
| Propane refrigerant circulation/kgmol/h | 980 | 2215 | 1331 |
| Ethylene refrigerant circulation/kgmol/h | / | 1366 | / |
| Feed gas compressor power/kW | / | / | 6810 |
| Refrigeration system power/kW | 5101 | 4754 | 1886 |
| Export compressor power/kW | 20,006 | 19,477 | 20,701 |
| Total power consumption/kW | 25,107 | 24,231 | 29,397 |
Table 5.
Exergy loss calculation results of the equipment.
Table 5.
Exergy loss calculation results of the equipment.
| Parameters | Scheme 1 | Scheme 2 | Scheme 3 |
|---|
| Exergy destruction of the heat exchanger/kW | 5113.49 | 8826.27 | 7034.01 |
| Exergy destruction of the column/kW | 16,129.92 | 14,810.9 | 13,985.69 |
| Exergy destruction of the compressor/kW | 5451.72 | 5196.89 | 6498.29 |
| Exergy destruction of the valve/kW | 2700.53 | 2902.39 | 2690.57 |
| Exergy destruction of the air cooler/kW | 20,684.03 | 9766.23 | 17,998.64 |
| Total exergy destruction/kW | 50,079.69 | 41,502.68 | 48,207.20 |
Table 6.
Parameters of temperature for different feed gas.
Table 6.
Parameters of temperature for different feed gas.
| Parameters | | |
|---|
| Feed gas | Temperature/°C | 30.0 | 18.8 |
| Pressure/kPa | 4440 | 4440 |
| Export gas outlet temperature/°C | 20.0 | 7.8 |
| Primary cryogenic load/kW | 40,983 | 39,901 |
| Export gas compression power/kW | 20,010 | 19,477 |
| Refrigeration system compression power, kW | 5037 | 4754 |
| Total compression power, kW | 25,047 | 24,231 |
| Helium recovery rate, % | 98.32 | 98.32 |
| Ethane recovery rate, % | 95.01 | 95.01 |
Table 7.
Impact of N2 content in feed gas on process performance.
Table 7.
Impact of N2 content in feed gas on process performance.
| Parameters | The N2 Content of the Feed Gas/mol% |
|---|
| 0.3 | 0.5 | 0.7 | 0.9 | 1.1 |
|---|
| Primary cryogenic separate temperature, °C | −70.0 | −70.0 | −70.0 | −70.0 | −70.0 |
| Primary enrichment column | Bottom split ratio/% | 75 | 75 | 75 | 75 | 75 |
| Top pressure/kPa | 3800 | 3800 | 3800 | 3800 | 3800 |
| Top temperature/°C | −91.3 | −91.3 | −91.9 | −92.5 | −93.2 |
| Bottom temperature/°C | −86.2 | −86.2 | −86.3 | −86.5 | −86.7 |
| Demethanizer | Top pressure/kPa | 2700 | 2700 | 2700 | 2700 | 2700 |
| Top temperature/°C | −98.0 | −98.0 | −98.1 | −98.2 | −98.2 |
| Bottom temperature/°C | 6.2 | 6.2 | 6.1 | 6.1 | 6.1 |
| N2 concentration/mol% | 3.1802 | 3.1802 | 4.4670 | 5.8651 | 7.2393 |
| The N2 content in LNG/mol% | 0.4106 | 0.6488 | 0.8515 | 1.0000 | 1.2282 |
| Helium loss/kg/h | 0.559 | 0.559 | 0.524 | 0.480 | 0.468 |
| Export gas compression power/kW | 19,995 | 20,006 | 20,015 | 20,001 | 20,011 |
| Refrigeration compression power/kW | 4421 | 4421 | 4421 | 4421 | 4421 |
| Total compression power/kW | 24,416 | 24,427 | 24,436 | 24,422 | 24,432 |
| Helium recovery rate/% | 98.32 | 98.32 | 98.42 | 98.52 | 98.56 |
| Ethane recovery rate/% | 95.01 | 95.01 | 95.02 | 95.04 | 95.05 |
Table 8.
Impact of CO2 content in feed gas on process performance.
Table 8.
Impact of CO2 content in feed gas on process performance.
| Parameters | The CO2 Content of the Feed Gas/mol% |
|---|
| 0.99 | 1.39 | 1.79 |
|---|
| Primary cryogenic separate temperature, °C | −70.0 | −70.0 | −70.0 |
| Primary enrichment column | Bottom split ratio/% | 75 | 75 | 75 |
| Top pressure/kPa | 3800 | 3800 | 3800 |
| Top temperature/°C | −91.3 | −91.3 | −91.3 |
| Bottom temperature/°C | −86.2 | −86.0 | −85.9 |
| Demethanizer | Top pressure/kPa | 2700 | 2700 | 2700 |
| Top temperature/°C | −98.1 | −97.9 | −97.7 |
| Bottom temperature/°C | 5.6 | 2.5 | 0 |
| N2 concentration/mol% | 3.1802 | 3.1792 | 3.1761 |
| The CO2 concentration in the overhead gas of the distillation column/mol% | 0.0094 | 0.0132 | 0.0170 |
| Helium loss/kg/h | 0.559 | 0.529 | 0.504 |
| Export gas compression power/kW | 20,006 | 19,435 | 19,398 |
| Refrigeration compression power/kW | 4421 | 5329 | 5696 |
| Total compression power/kW | 24,427 | 24,764 | 25,094 |
| Helium recovery rate/% | 98.32 | 98.36 | 98.37 |
| Ethane recovery rate/% | 95.00 | 95.02 | 95.03 |


