1. Introduction
In recent years, the global community has established a common goal to reduce greenhouse gas emissions, which directly contribute to global warming. As the realization of carbon neutrality has emerged as an essential objective, reducing carbon emissions has become a key priority in the construction industry [
1].
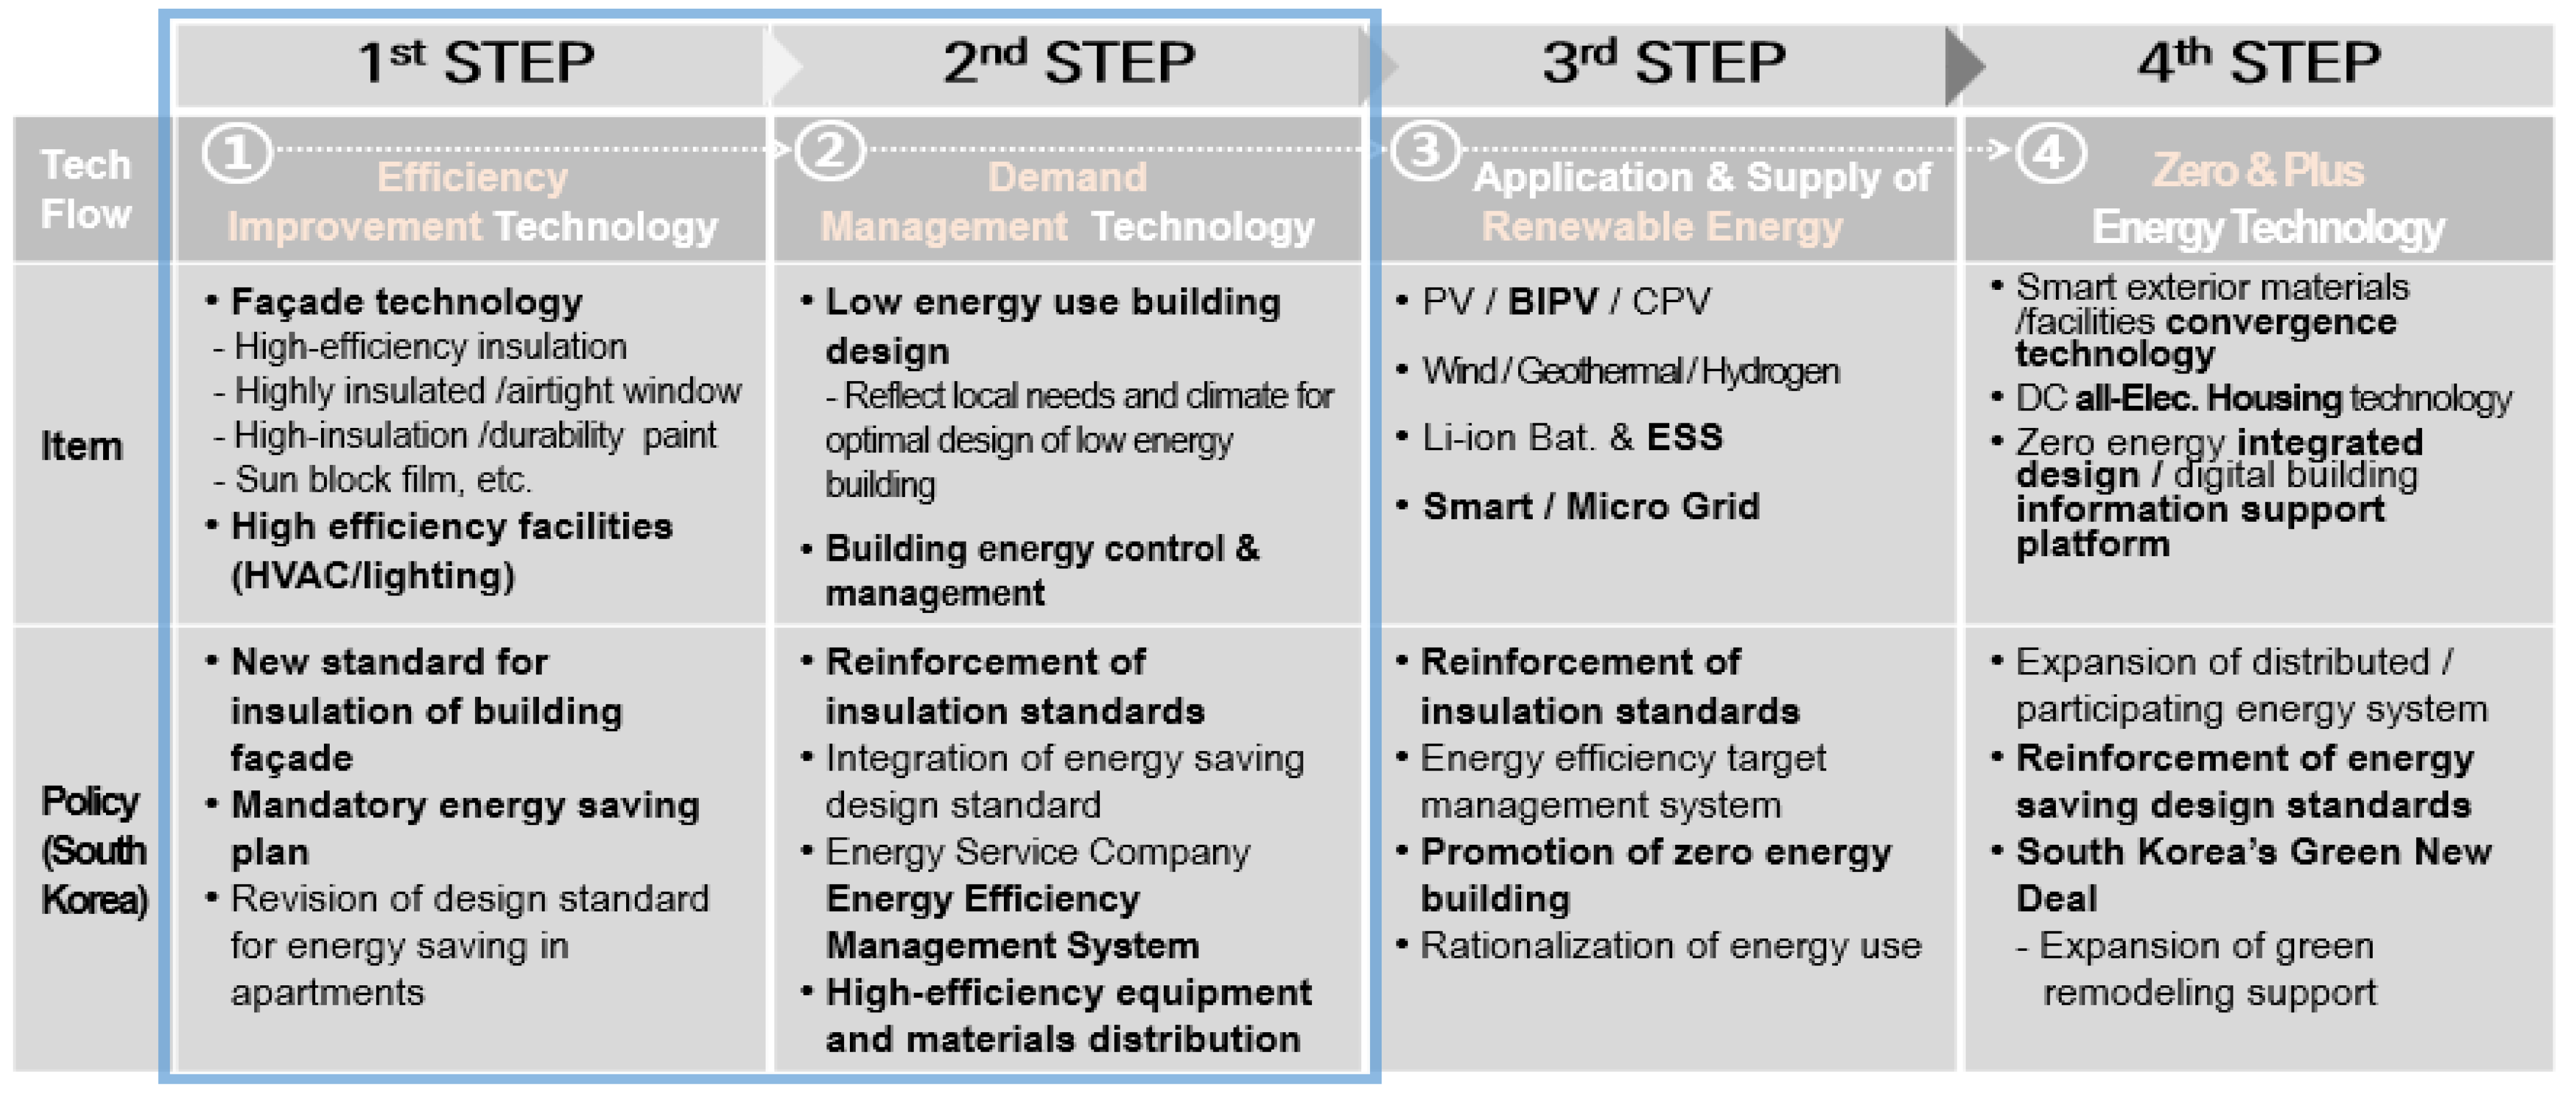
If the stages of improving energy efficiency in the building sector are divided into four phases (as illustrated in
Figure 1), the initial focus is on enhancing the building envelope and adopting high-efficiency systems for “efficiency improvement”. The second phase emphasizes “demand management” technologies, such as passive building design and energy control and management strategies [
2]. Once the industrial foundation and systems for efficiency improvement and demand management are established, the focus shifts toward the adoption of “new and renewable energy” solutions. Technologies and policies aimed at realizing zero-energy buildings—such as solar thermal systems, photovoltaics, and energy storage systems (ESS)—are being increasingly implemented. Finally, efforts to achieve the Green New Deal are accompanied by keywords such as convergence and digital architecture, targeting “zero energy” or “plus energy” technologies [
3]. In addition, energy efficiency is one of the key national strategies for improving national economic competitiveness and sustainability, and the development of policies and interest in energy efficiency are closely related to the national economic growth rate. If we analyze the energy efficiency policies promoted at that time based on indicators such as the economic growth rate or income of advanced countries, we believe that we will be able to establish a more efficient industrial and policy foundation [
4,
5,
6].
In particular, ASEAN countries with tropical climates are focusing on improving building energy efficiency as one of the main policies for reducing carbon emissions, as electricity and energy demand increases due to rapid economic development and urbanization [
7,
8,
9]. Among them, Vietnam is currently the country with the highest construction market growth rate among ASEAN countries, at an annual average of about 7% (2019–2025), and has selected building energy efficiency policies as a priority to secure stability in energy supply and demand. A comprehensive reform of building energy efficiency regulations and support systems is underway [
10]. In addition, the northern region of Vietnam is affected by a subtropical climate and can be compared to South Korea, which is changing to a subtropical climate, and the direct solar irradiance is also similar. In this study, Hanoi, Vietnam, was selected as a demonstration site for the application of building energy element technology [
11].
Accordingly, this study aims to derive an optimal combination of technologies for reducing cooling load and enhancing energy efficiency.
As the average temperature increases due to climate change caused by global warming, the results of the comparative demonstration test in Vietnam are expected to serve as effective guidelines for reducing cooling energy in subtropical climates such as South Korea.
2. Derivation of Elementary Technology for Optimal Design in Subtropical Climate Response
Vietnam is a country centered on cooling loads, so it is necessary to select customized building energy efficiency items and technology levels. Therefore, through previous research [
1,
2,
3,
4,
5], a building energy package element technology for responding to cooling loads was developed, as summarized in
Table 1. It includes radiant insulation materials with improved insulation performance and air thermal resistance, window films that can reduce solar heat loads, heat-insulating paints to reduce heat accumulation due to solar radiation, hidden-rail aluminum windows to respond to high-temperature and high-humidity environments, lighting that improves energy consumption efficiency, and high-efficiency inverter cooling equipment [
12,
13,
14].
3. Optimized Design and Verification of Building Energy Package Technology Through Demonstration Chamber
As a result of analyzing the energy saving performance according to the combination of element technologies through simulation of demonstration chamber and prior research [
1,
2,
3], the optimized design element technologies for reducing the cooling load in response to subtropical climate are “passive system” windows, films, insulation, and paints; “active system” ventilation, lighting, and air-conditioning; and “renewable energy” solar cells. Therefore, this study proposes a Cooling Load Package System (CPS), which is the optimal design factor for responding to cooling load, and it is an organic combination design to cope with climate change, not just the application of advanced element technologies or the incorporation of integrated technologies. Although the proportion of each elemental technology may vary depending on the architectural design such as economic conditions and window area ratio, CPS intends to verify in this chapter by applying design technology with 60% for “passive system”, 30% for “active system”, and 10% for “renewable energy” [
18].
3.1. Demonstration Outdoor Chamber Overview and Experimental Planning
The demonstration chamber is located at the Institute for Building Science and Technology (IBST), a research institute under the Vietnamese Ministry of Construction (MOC), in Hanoi, Vietnam.
Detailed specifications are shown in
Table 3 and
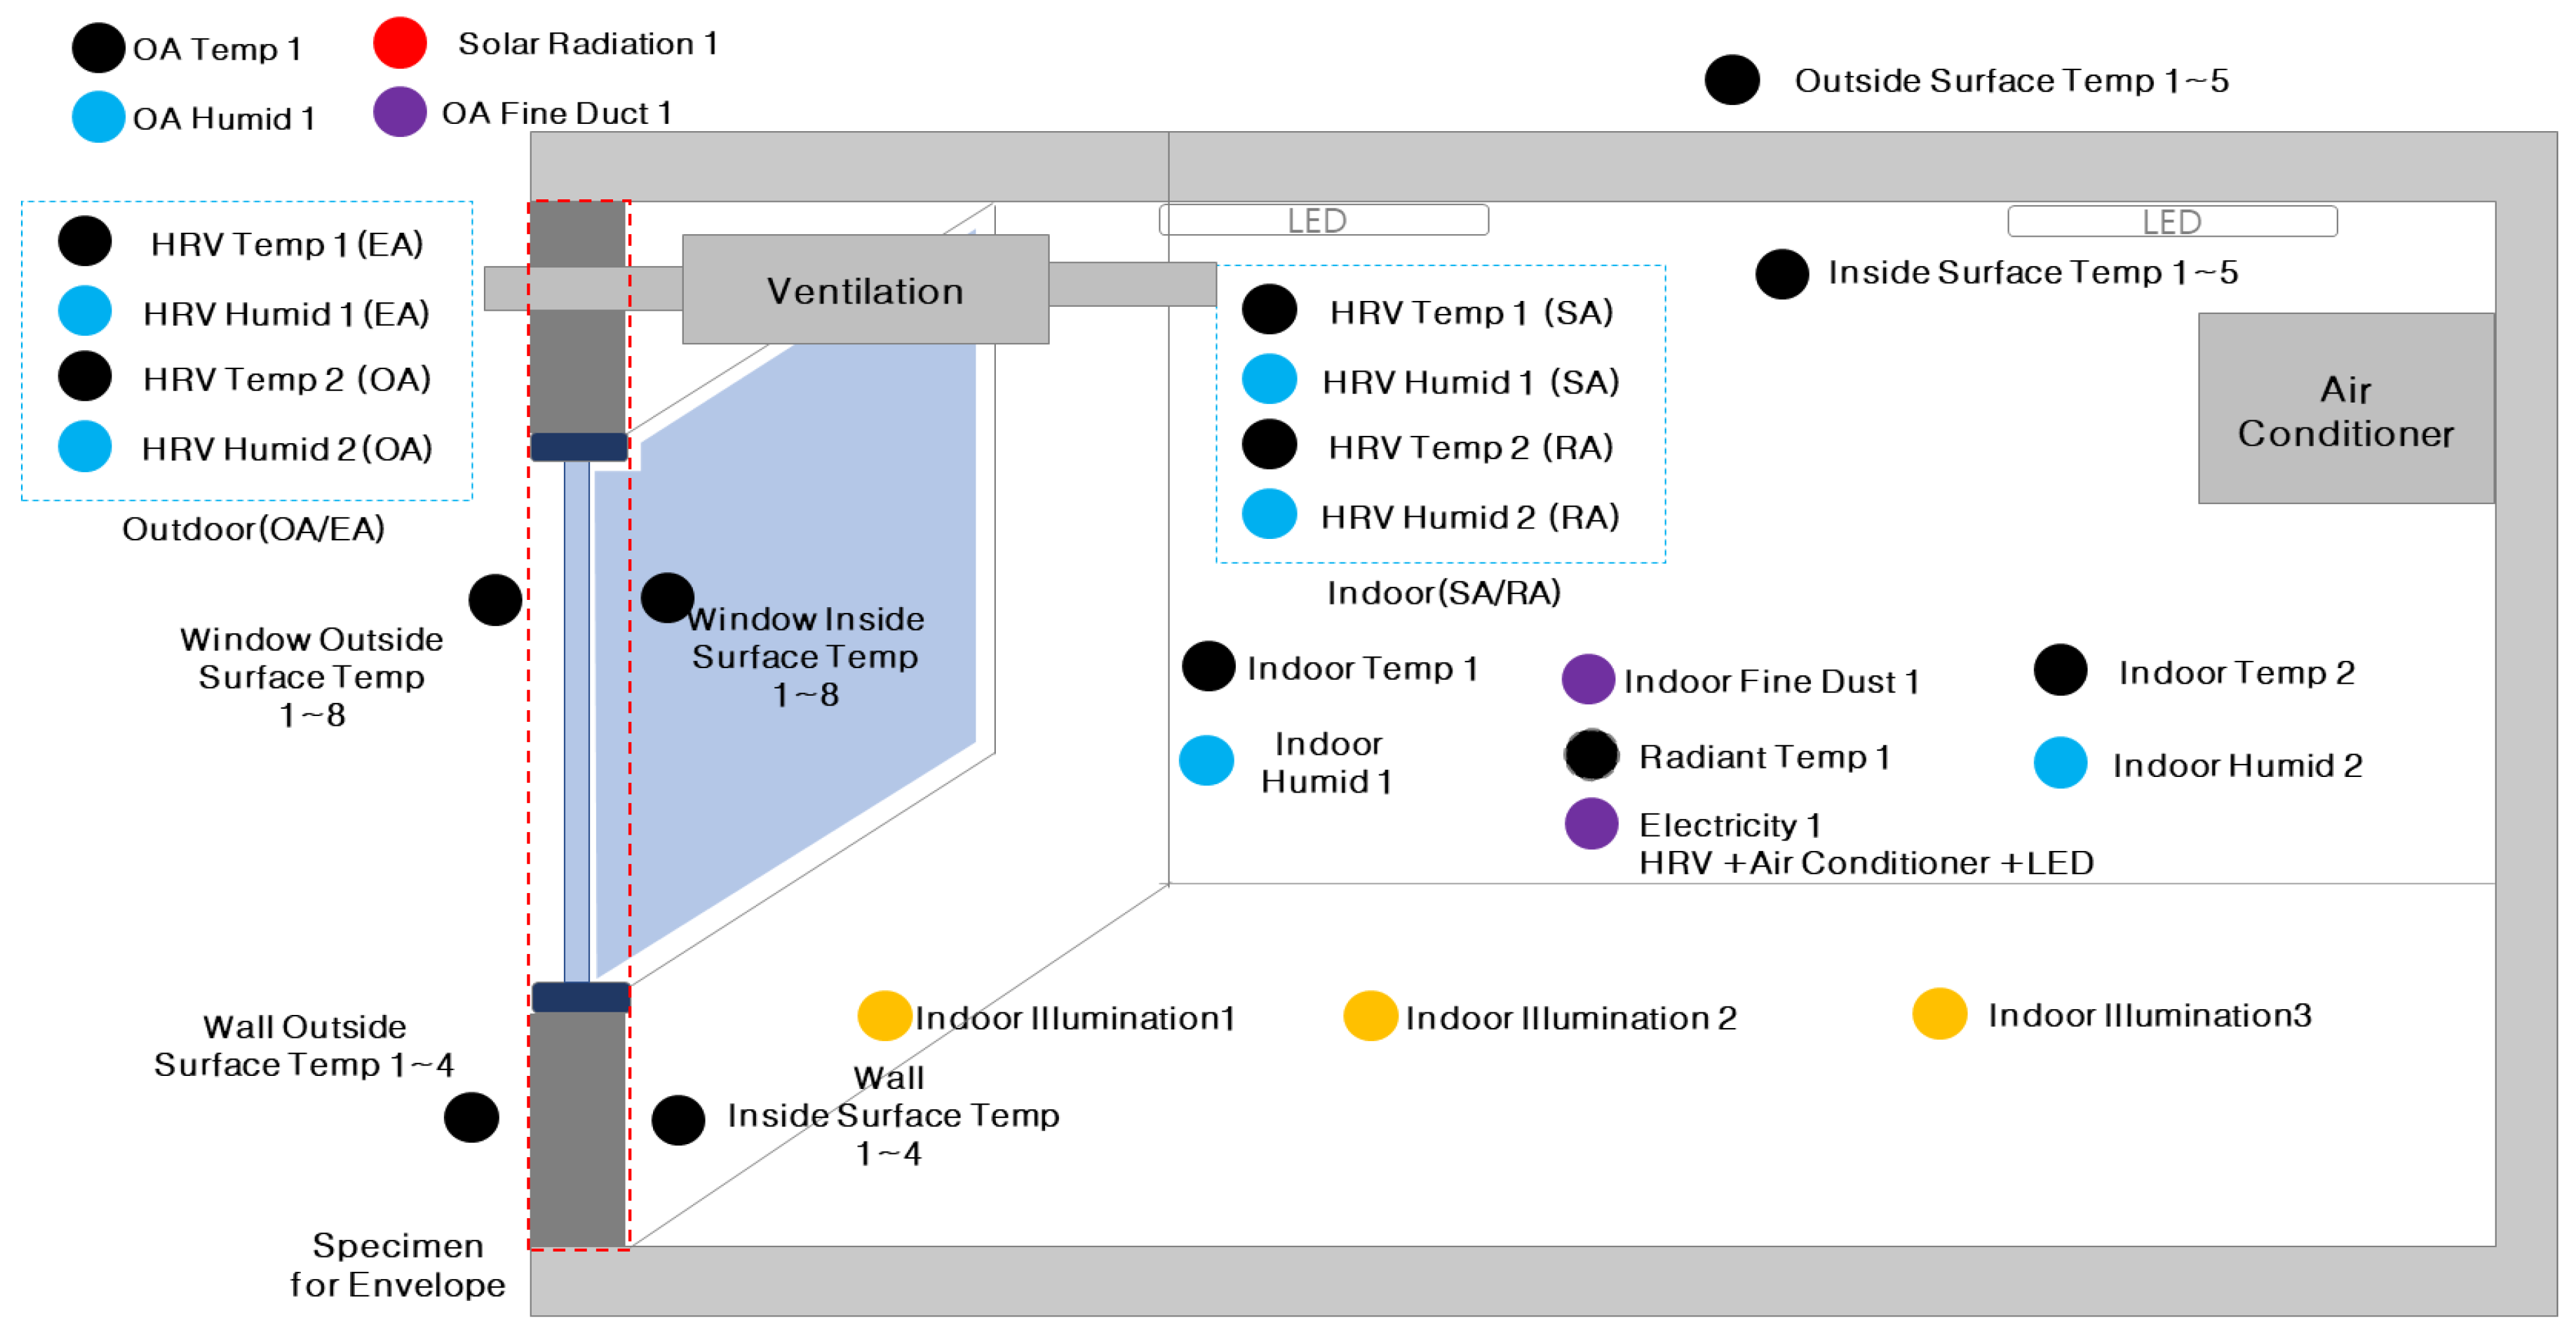
Table 4. The demonstration chamber was constructed to simulate the actual environment, and the configuration of the measuring devices and the locations and number of installations for monitoring are shown in
Figure 3.
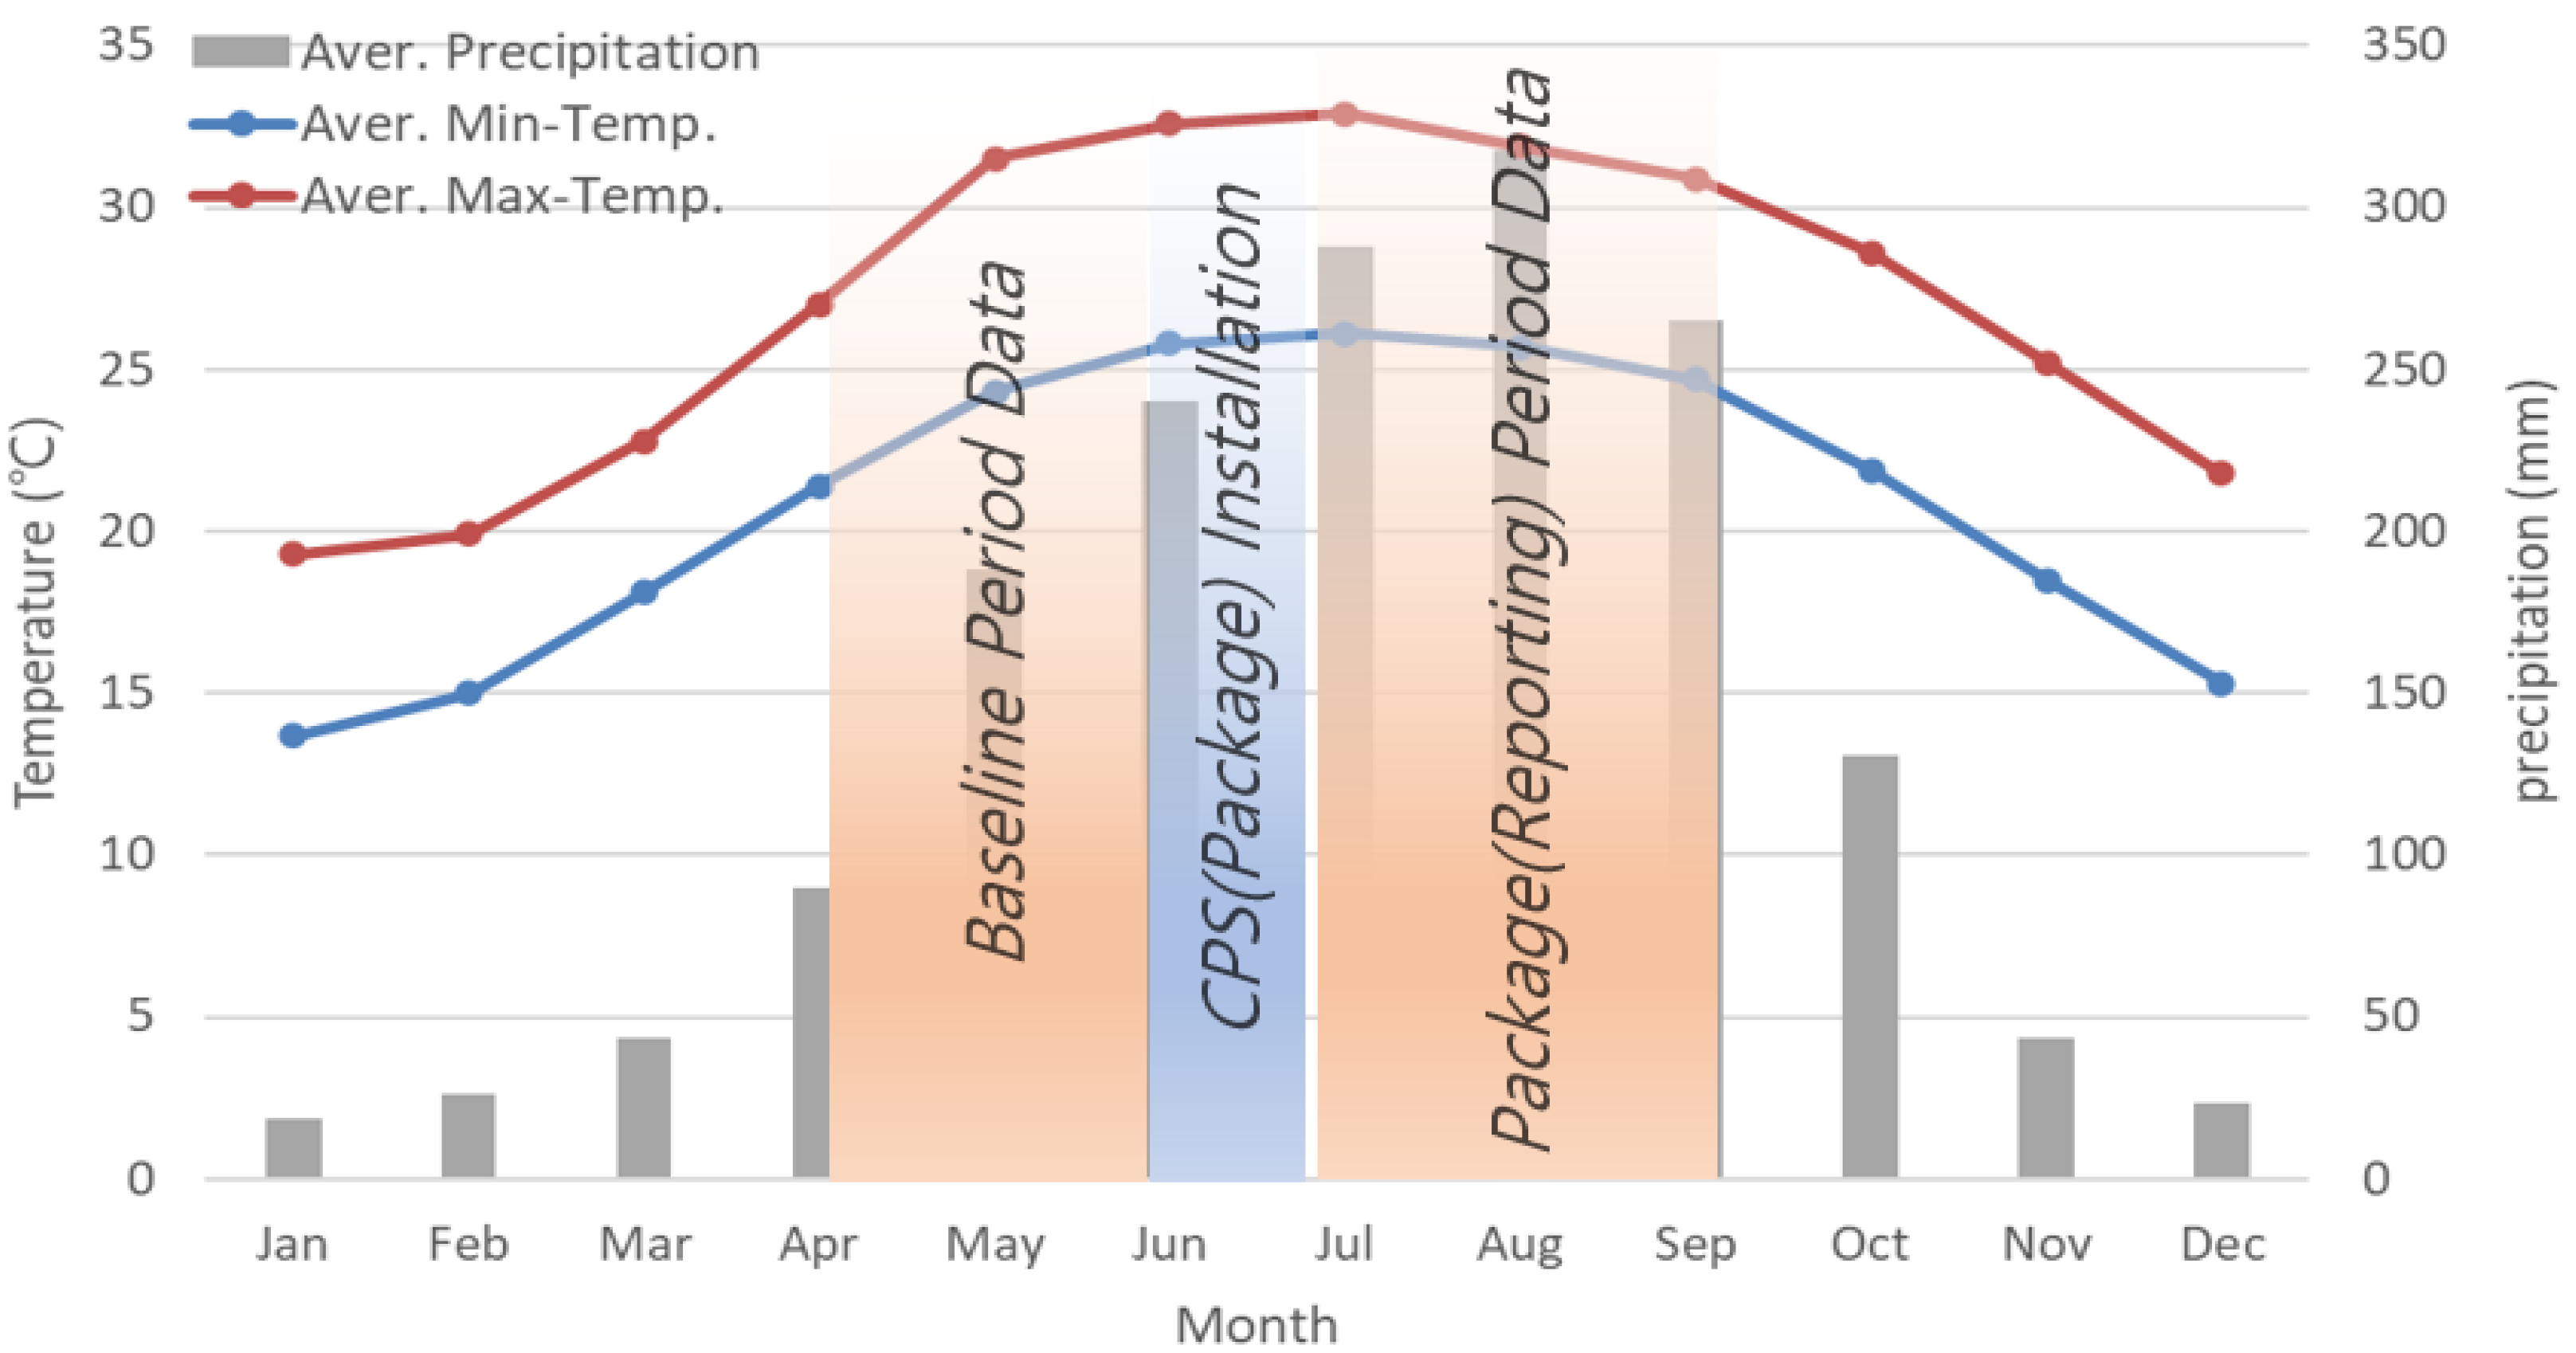
Although the demonstration period was shorter than initially planned, efforts were made to collect reliable data by selecting periods with outdoor temperature distributions that were as similar as possible before and after the retrofit.
Table 5 summarizes the detailed technology application status before and after the implementation of CPS.
Figure 4 presents the annual temperature distribution in Vietnam, and
Table 6 outlines the demonstration period details.
The indoor air conditioning setpoint was consistently maintained at 28 °C throughout all procedures. The power consumption of internal heat gains and lighting systems was measured in response to external environmental conditions, such as solar radiation, outdoor air temperature, and humidity [
19,
20]. Furthermore, the energy savings were analyzed using the International Performance Measurement and Verification Protocol (IPMVP), Option C [
21], with appropriate modifications for the study context.
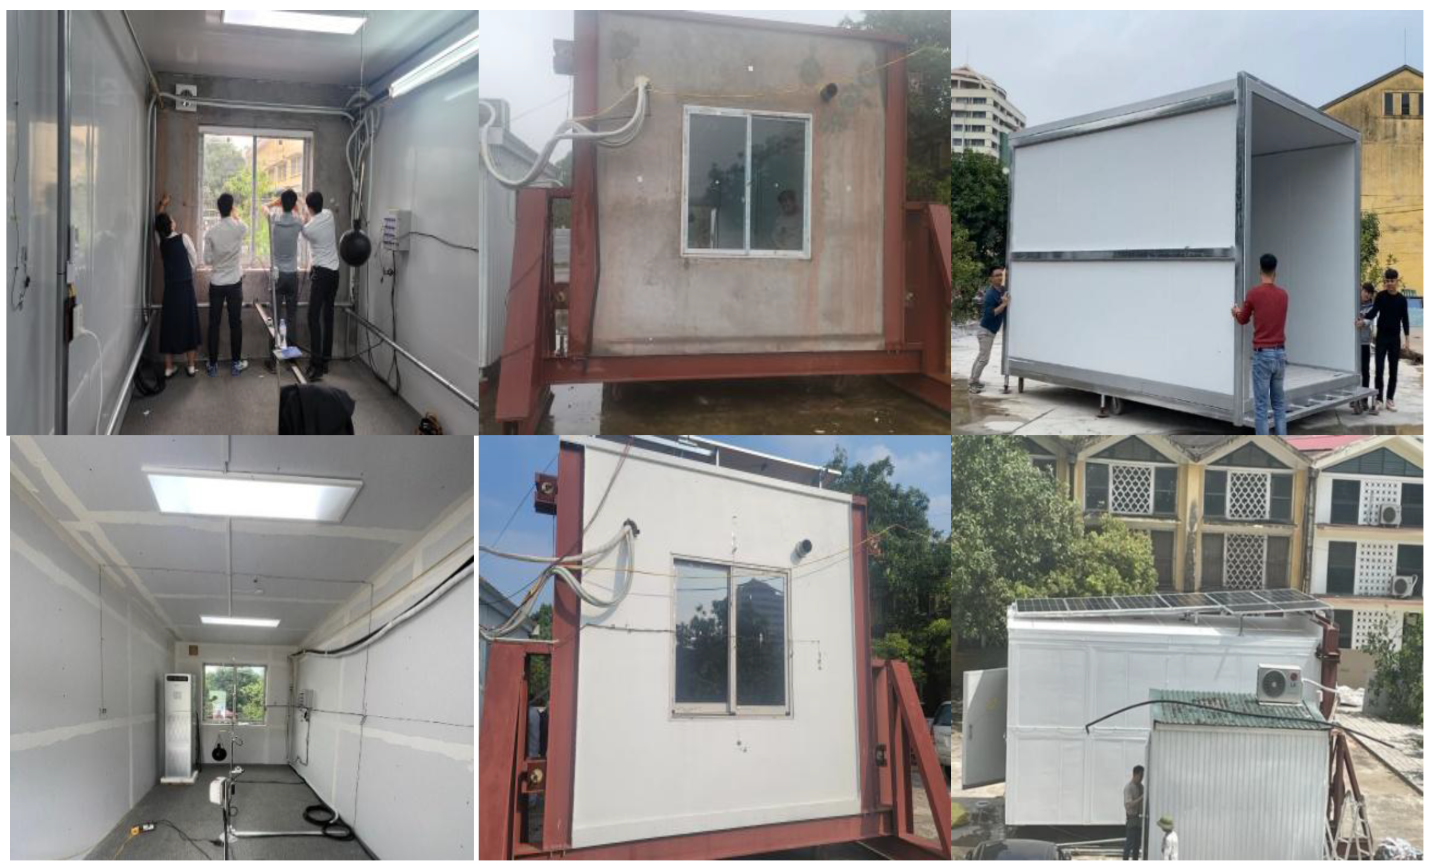
Figure 5 presents photographs of the test site before and after the implementation of the Cooling Load Package System (CPS).
3.2. Analysis of Savings from Demonstration Chamber Simulation
EnergyPlus is a representative dynamic building energy simulation tool developed by the US Department of Energy (DOE), and it can interpret energy consumption of various factors such as cooling and heating, ventilation, lighting, and renewable energy systems in detail. In addition, DesignBuilder was used for 3D modeling associated with EnergyPlus.
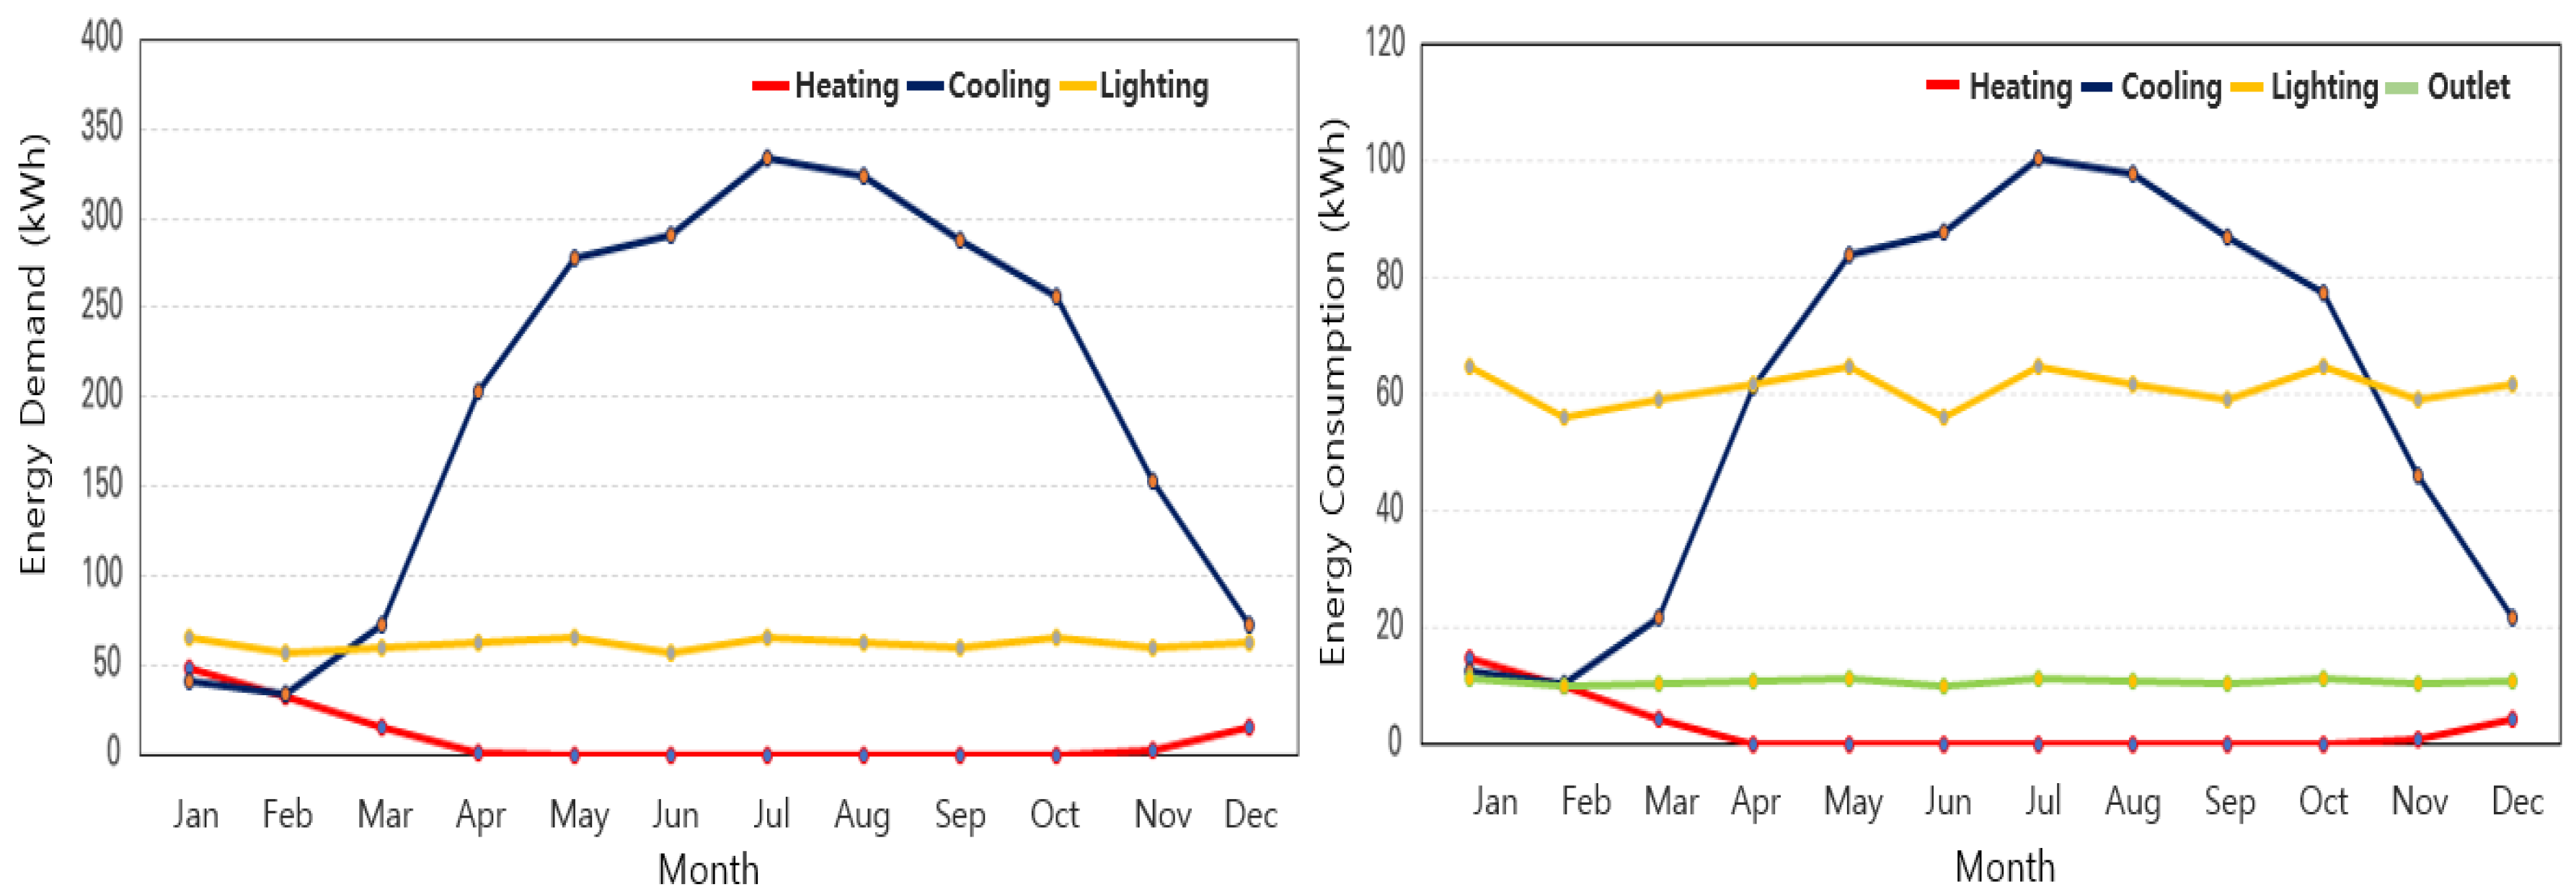
According to the energy analysis of the CPS before application (baseline energy), the heating energy demand per unit area was 6.26 kWh/(m
2·year), and the cooling energy demand was 128.34 kWh/(m
2·year) (
Figure 6). Heating accounted for approximately 3.6% of the total energy demand, while cooling accounted for 73.4%, indicating that the cooling load was significantly higher due to the influence of local climatic conditions. Before applying CPS, the heating energy consumption per unit area was about 1.89 kWh/(m
2·year), and the cooling energy consumption was 38.77 kWh/(m
2·year), with cooling accounting for 44.1% of the total energy and lighting accounting for about 45.7%. Heating accounted for about 2.2%, which is completely different from the energy pattern of commercial buildings in Korea. The energy analysis results are shown in
Figure 7.
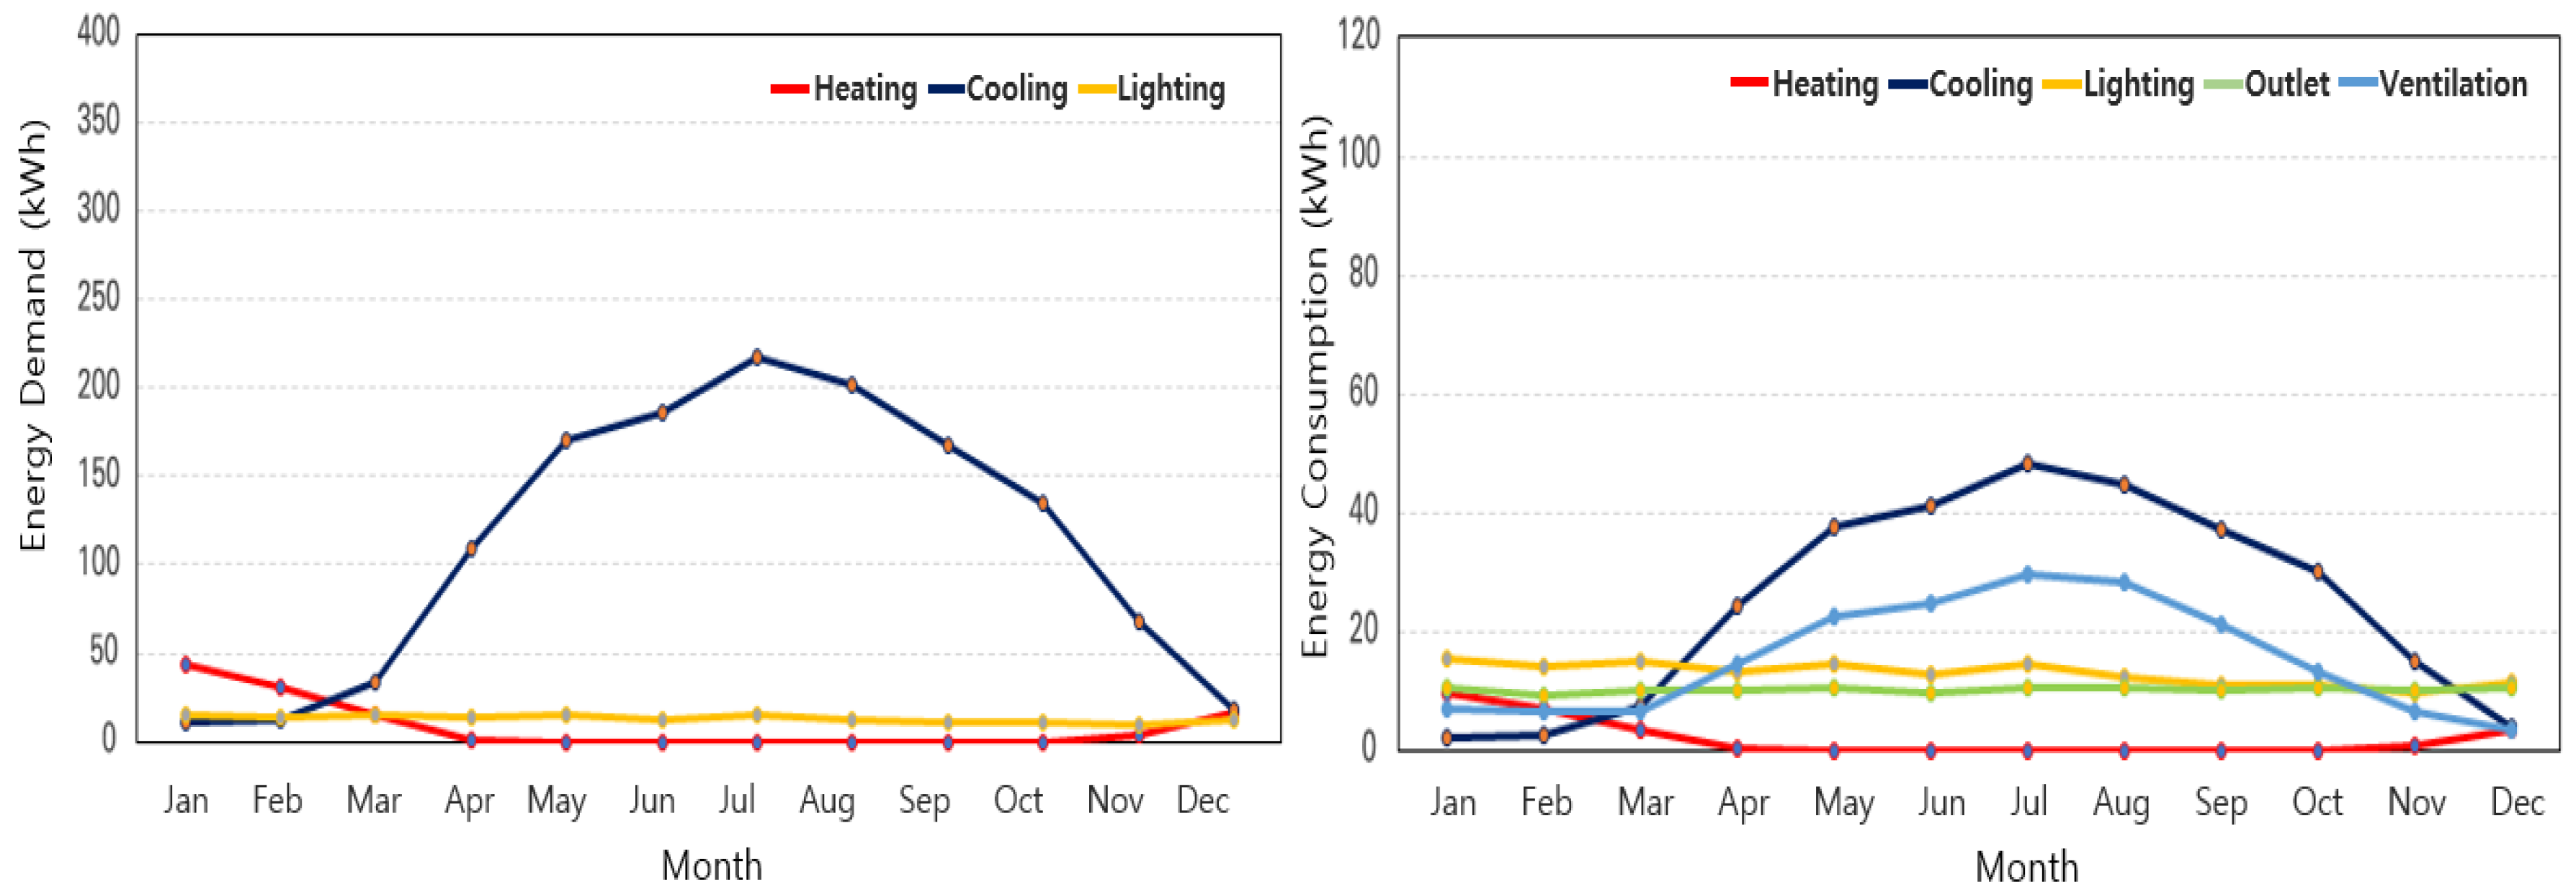
As a result of energy analysis after applying CPS (package measured energy), the heating energy demand per unit area was 6.02 kWh/(m2·year), and the cooling energy demand was 72.58 kWh/(m2·year). Heating accounted for approximately 6.9% of the total energy demand, and cooling for 83.3%, indicating that the cooling load was significantly higher than before construction.
After applying CPS, the heating energy consumption per unit area was approximately 1.34 kWh/(m
2·year), and the cooling energy consumption was 16.13 kWh/(m
2·year), indicating that cooling accounted for 37.7% of the total energy and lighting for about 19.85%. According to the application of the total heat exchanger, the ventilation energy consumption per unit area was 10.1 kWh/(m
2·year), which accounted for a relatively large proportion—23.6% of the total. The results of the energy analysis are shown in
Figure 8.
As a result of the analysis of the energy-saving effect according to the application of CPS, the heating energy demand per unit area showed a slight saving rate of about 3.83%, while the cooling energy demand was 43.45%, and the lighting energy demand was 78.89%. The total energy demand was 174.80 kWh/(m2·year) before construction and 87.09 kWh/(m2·year) after construction, showing an energy-saving effect of about 50.18%.
As a result of the analysis of energy consumption per unit area, lighting was the highest at 78.89%, followed by cooling at 58.40% and heating at 29.1%. According to the application of the total heat exchanger, ventilation energy consumption per unit area was calculated as 10.08 kWh/(m
2·year). However, since energy was saved in cooling and heating, the total energy consumption decreased by about 51.43%, from 88.01 kWh/(m
2·year) before construction to 42.75 kWh/(m
2·year). The results of the energy-saving effect analysis are shown in
Table 7.
As a result of the analysis of energy-saving effects from CPS and the application of solar facilities, the annual solar power generation forecast is about 2572.46 kWh, and the primary energy consumption per unit area, including power generation, is about 23.01 kWh/(m
2·year).
Table 8 shows the results of calculating the primary energy consumption according to the application of solar PV.
3.3. Results of Empirical Application of Optimized Design Model
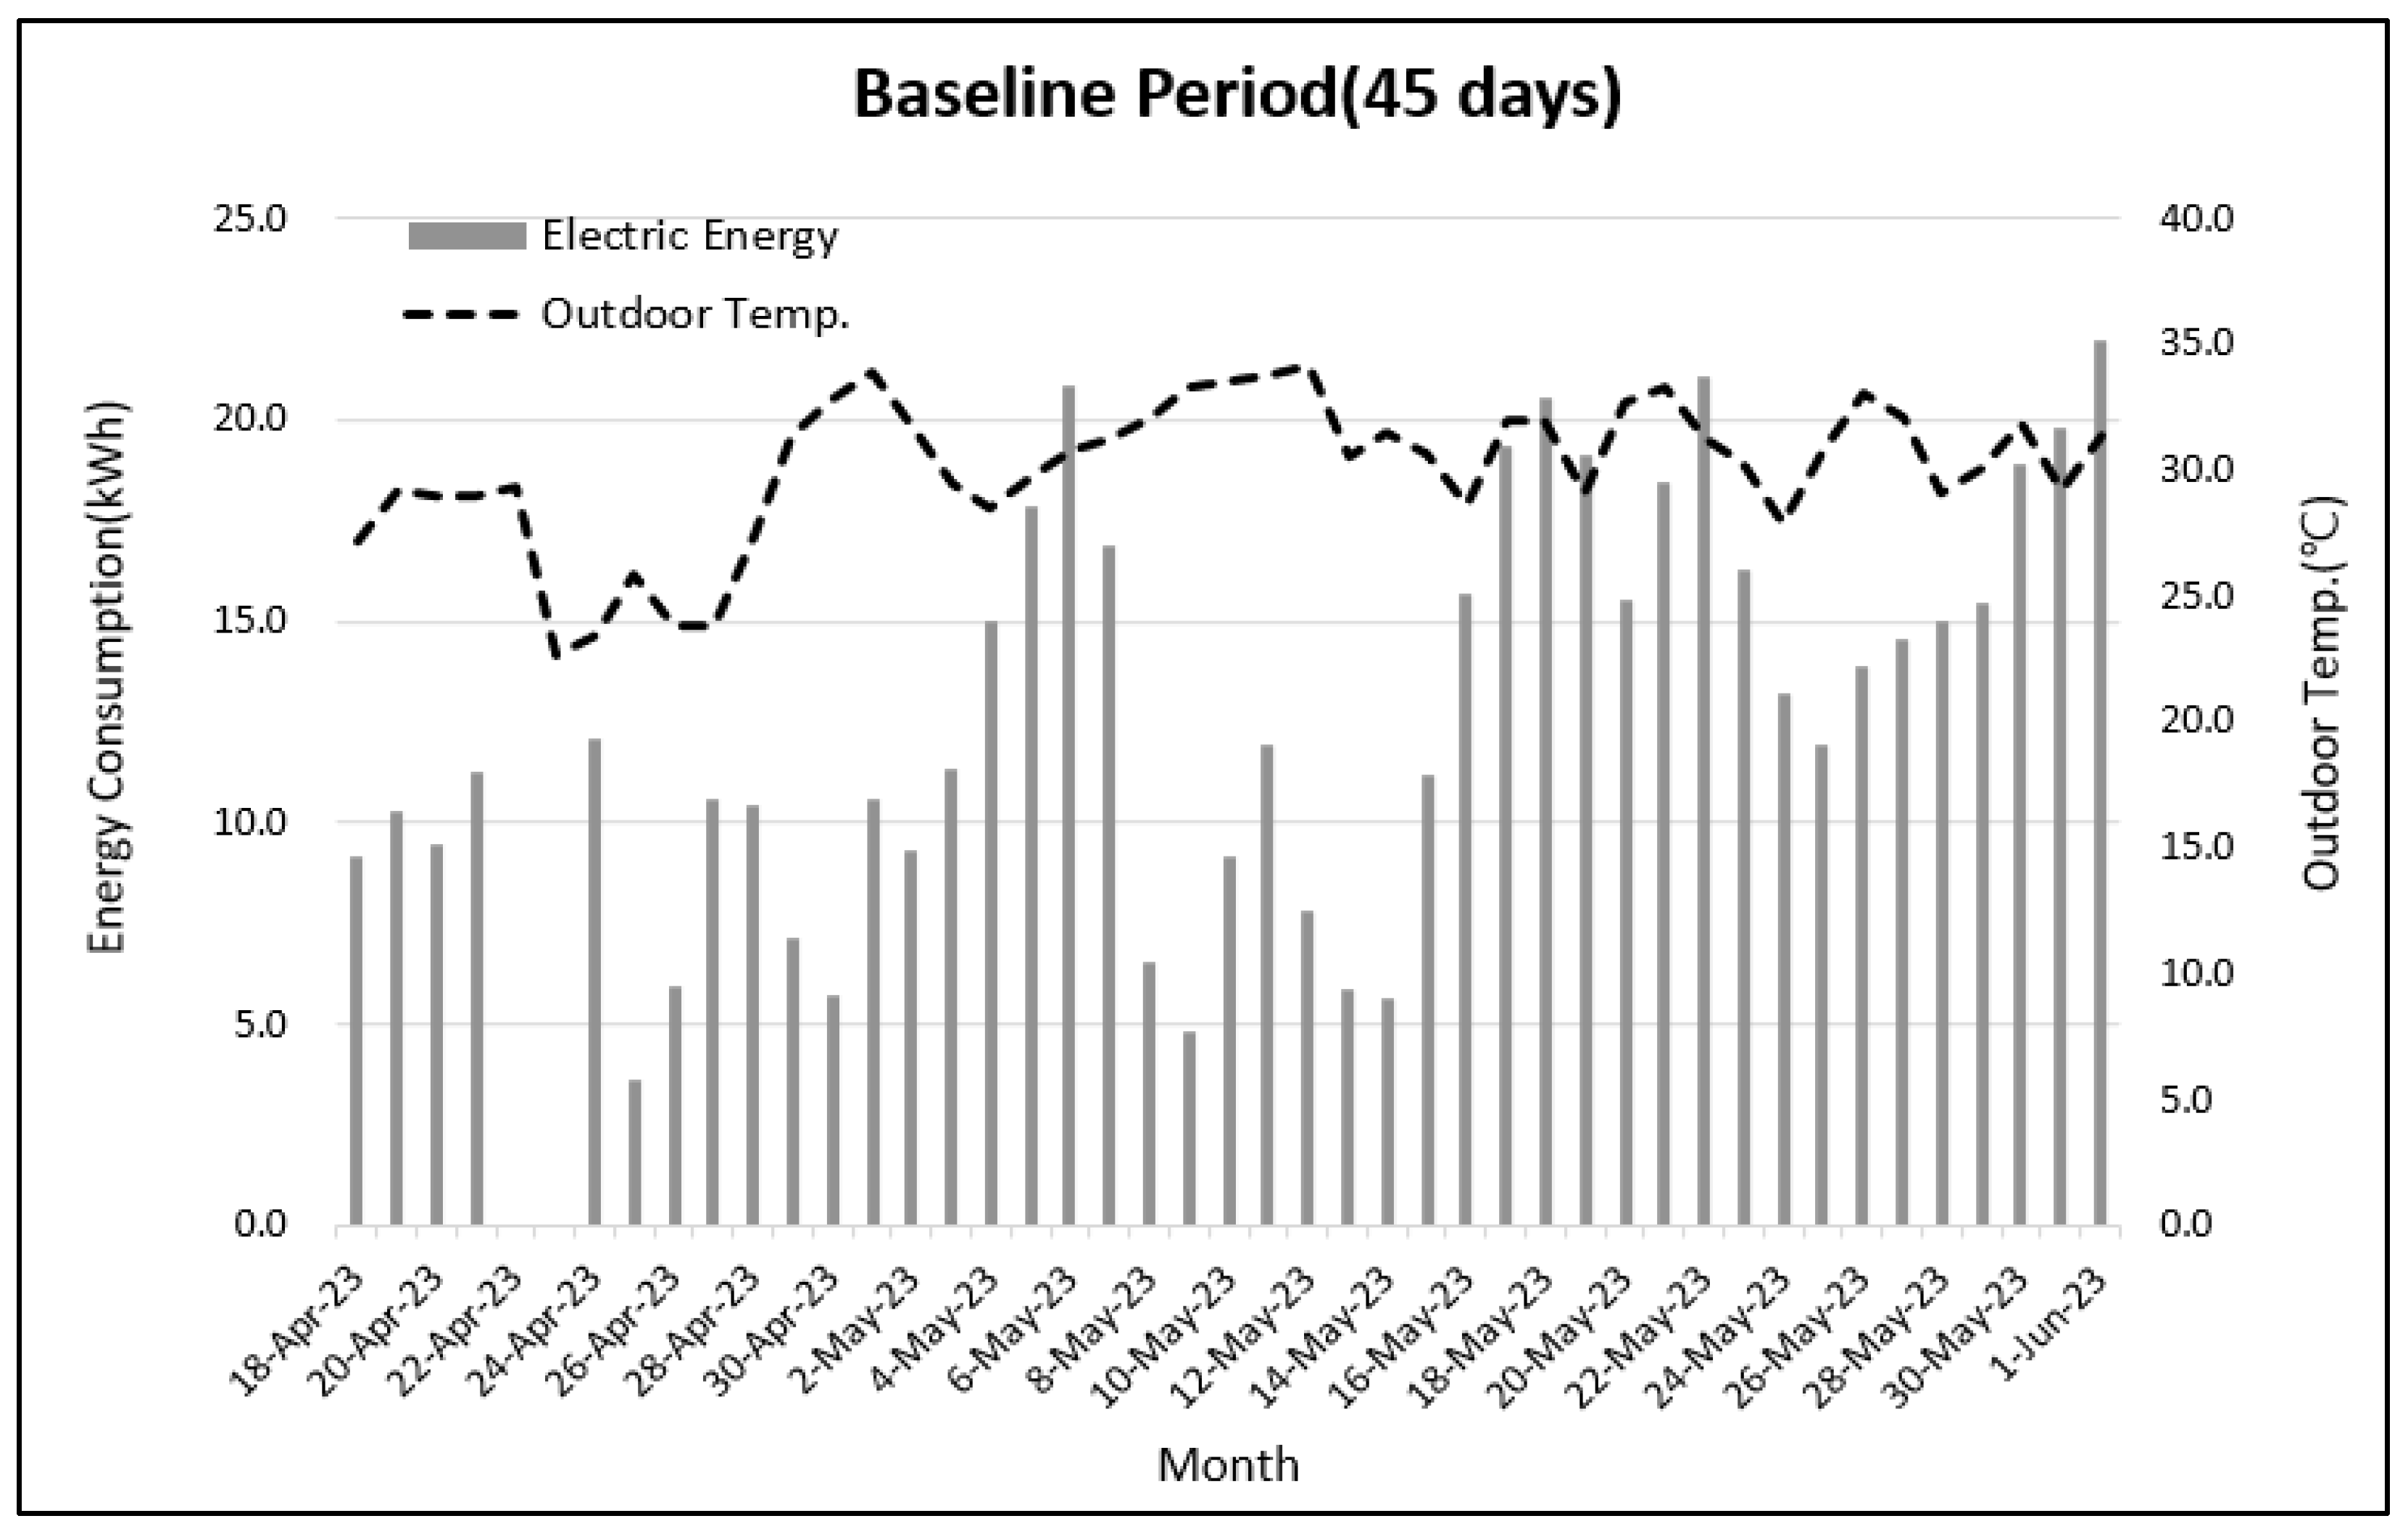
In order to secure as reliable data as possible by analyzing the monthly similar outdoor temperature distribution, the baseline period (18 April 2023~1 June), 45 days, and the package period (5 July 2023~18 August), also 45 days, were compared and analyzed under the same conditions.
As a result of energy analysis before CPS application (baseline energy), the average outside temperature for 45 days is 30.8 °C, the cumulative energy consumption is 551.33 kWh, and the energy consumption per unit area is 30.13 kWh/(m
2·day). As a result of energy analysis after applying CPS, the average outside temperature for 45 days is 30.1 °C, the cumulative energy consumption is 141.57 kWh, and the energy consumption per unit area is 7.74 kWh/(m
2·day), which is 74.3% lower than before applying CPS. In this way, the reliability could be increased by verifying the prediction results of the simulation model through outdoor demonstration tests. By comparing the results of the two methods in the future, the limitations of each method should be supplemented, and even if it takes more cost and time, it seems that long-term empirical tests should be conducted to secure reliable analysis results.
Table 9 shows the results of the energy-saving effect analysis through demonstration tests.
As a result of the analysis of the energy-saving effect of the application of CPS and solar facilities, solar power generation is 11.21 kWh/(m
2·day), and energy consumption per unit area, including solar power generation, is −3.48 kWh/(m
2·day), indicating a net energy gain of 11.5% when renewable energy sources are included. Even if the initial investment cost is high, the application of new and renewable energy is considered to have a great energy-saving effect.
Table 10 shows the results of calculating energy consumption according to the application of solar power generation with CPS.
Figure 8 shows the energy consumption according to the outside temperature during the baseline period, and
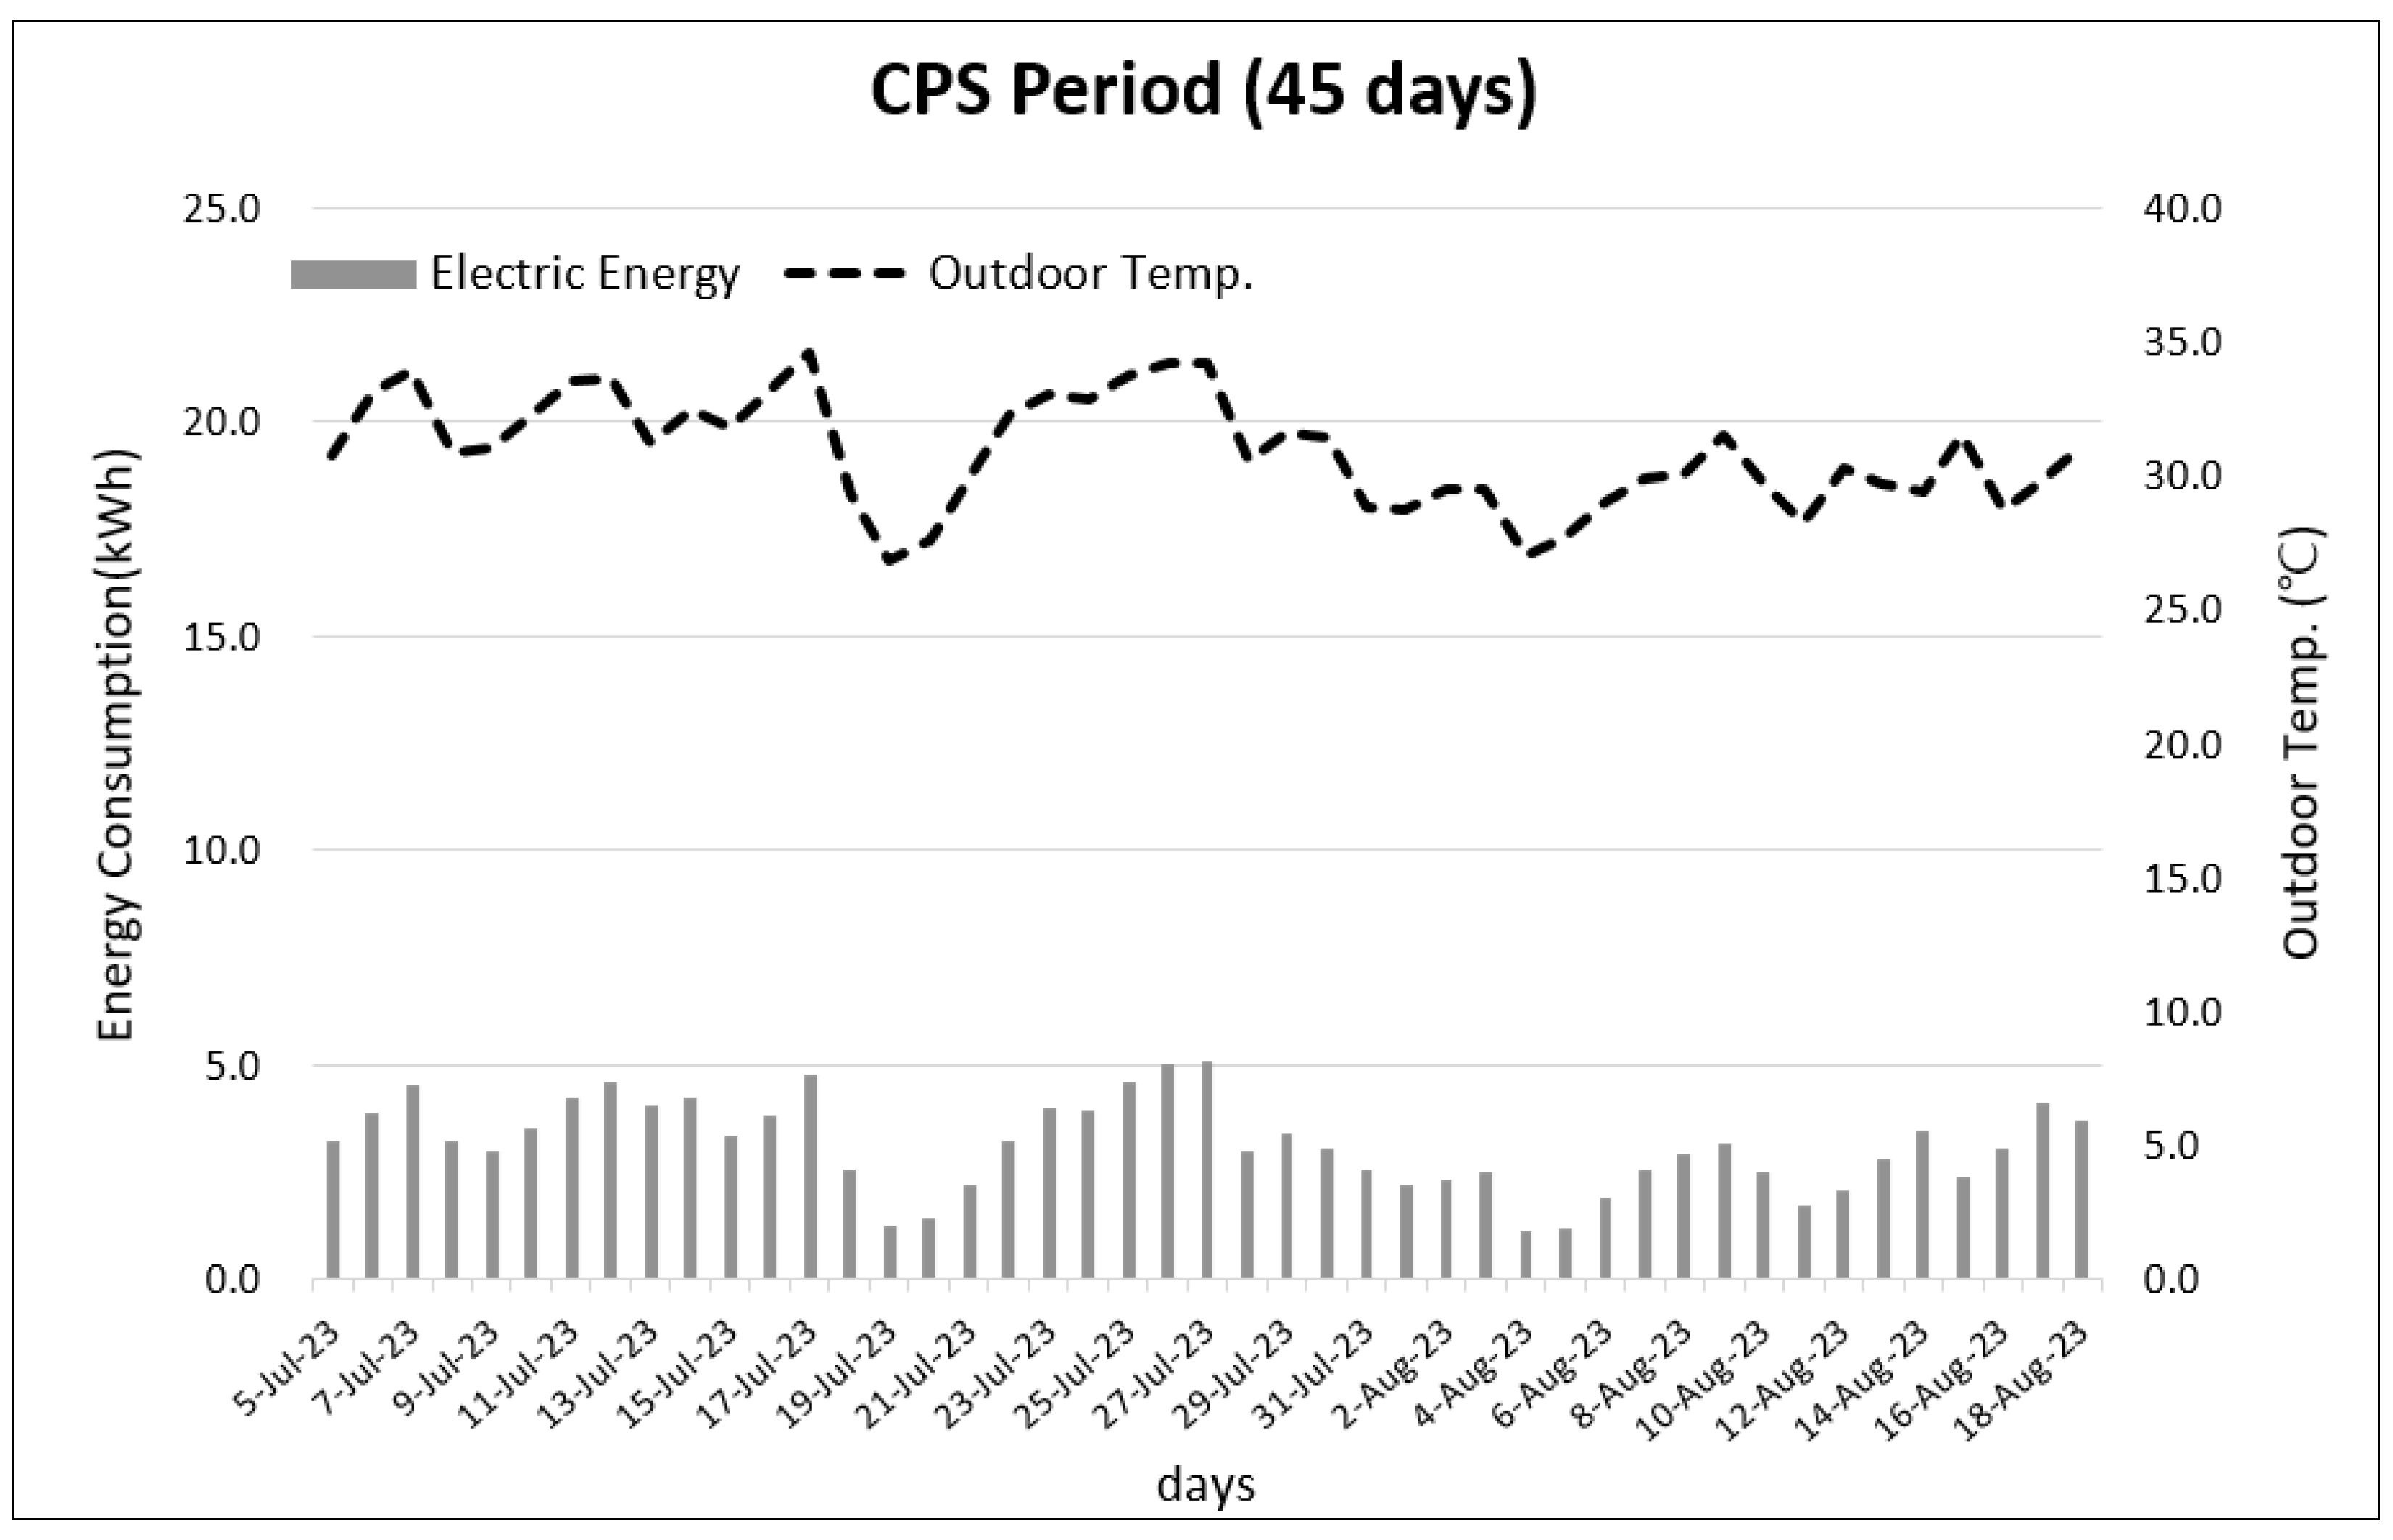
Figure 9 shows the energy consumption according to the outside temperature during the CPS period. In addition,
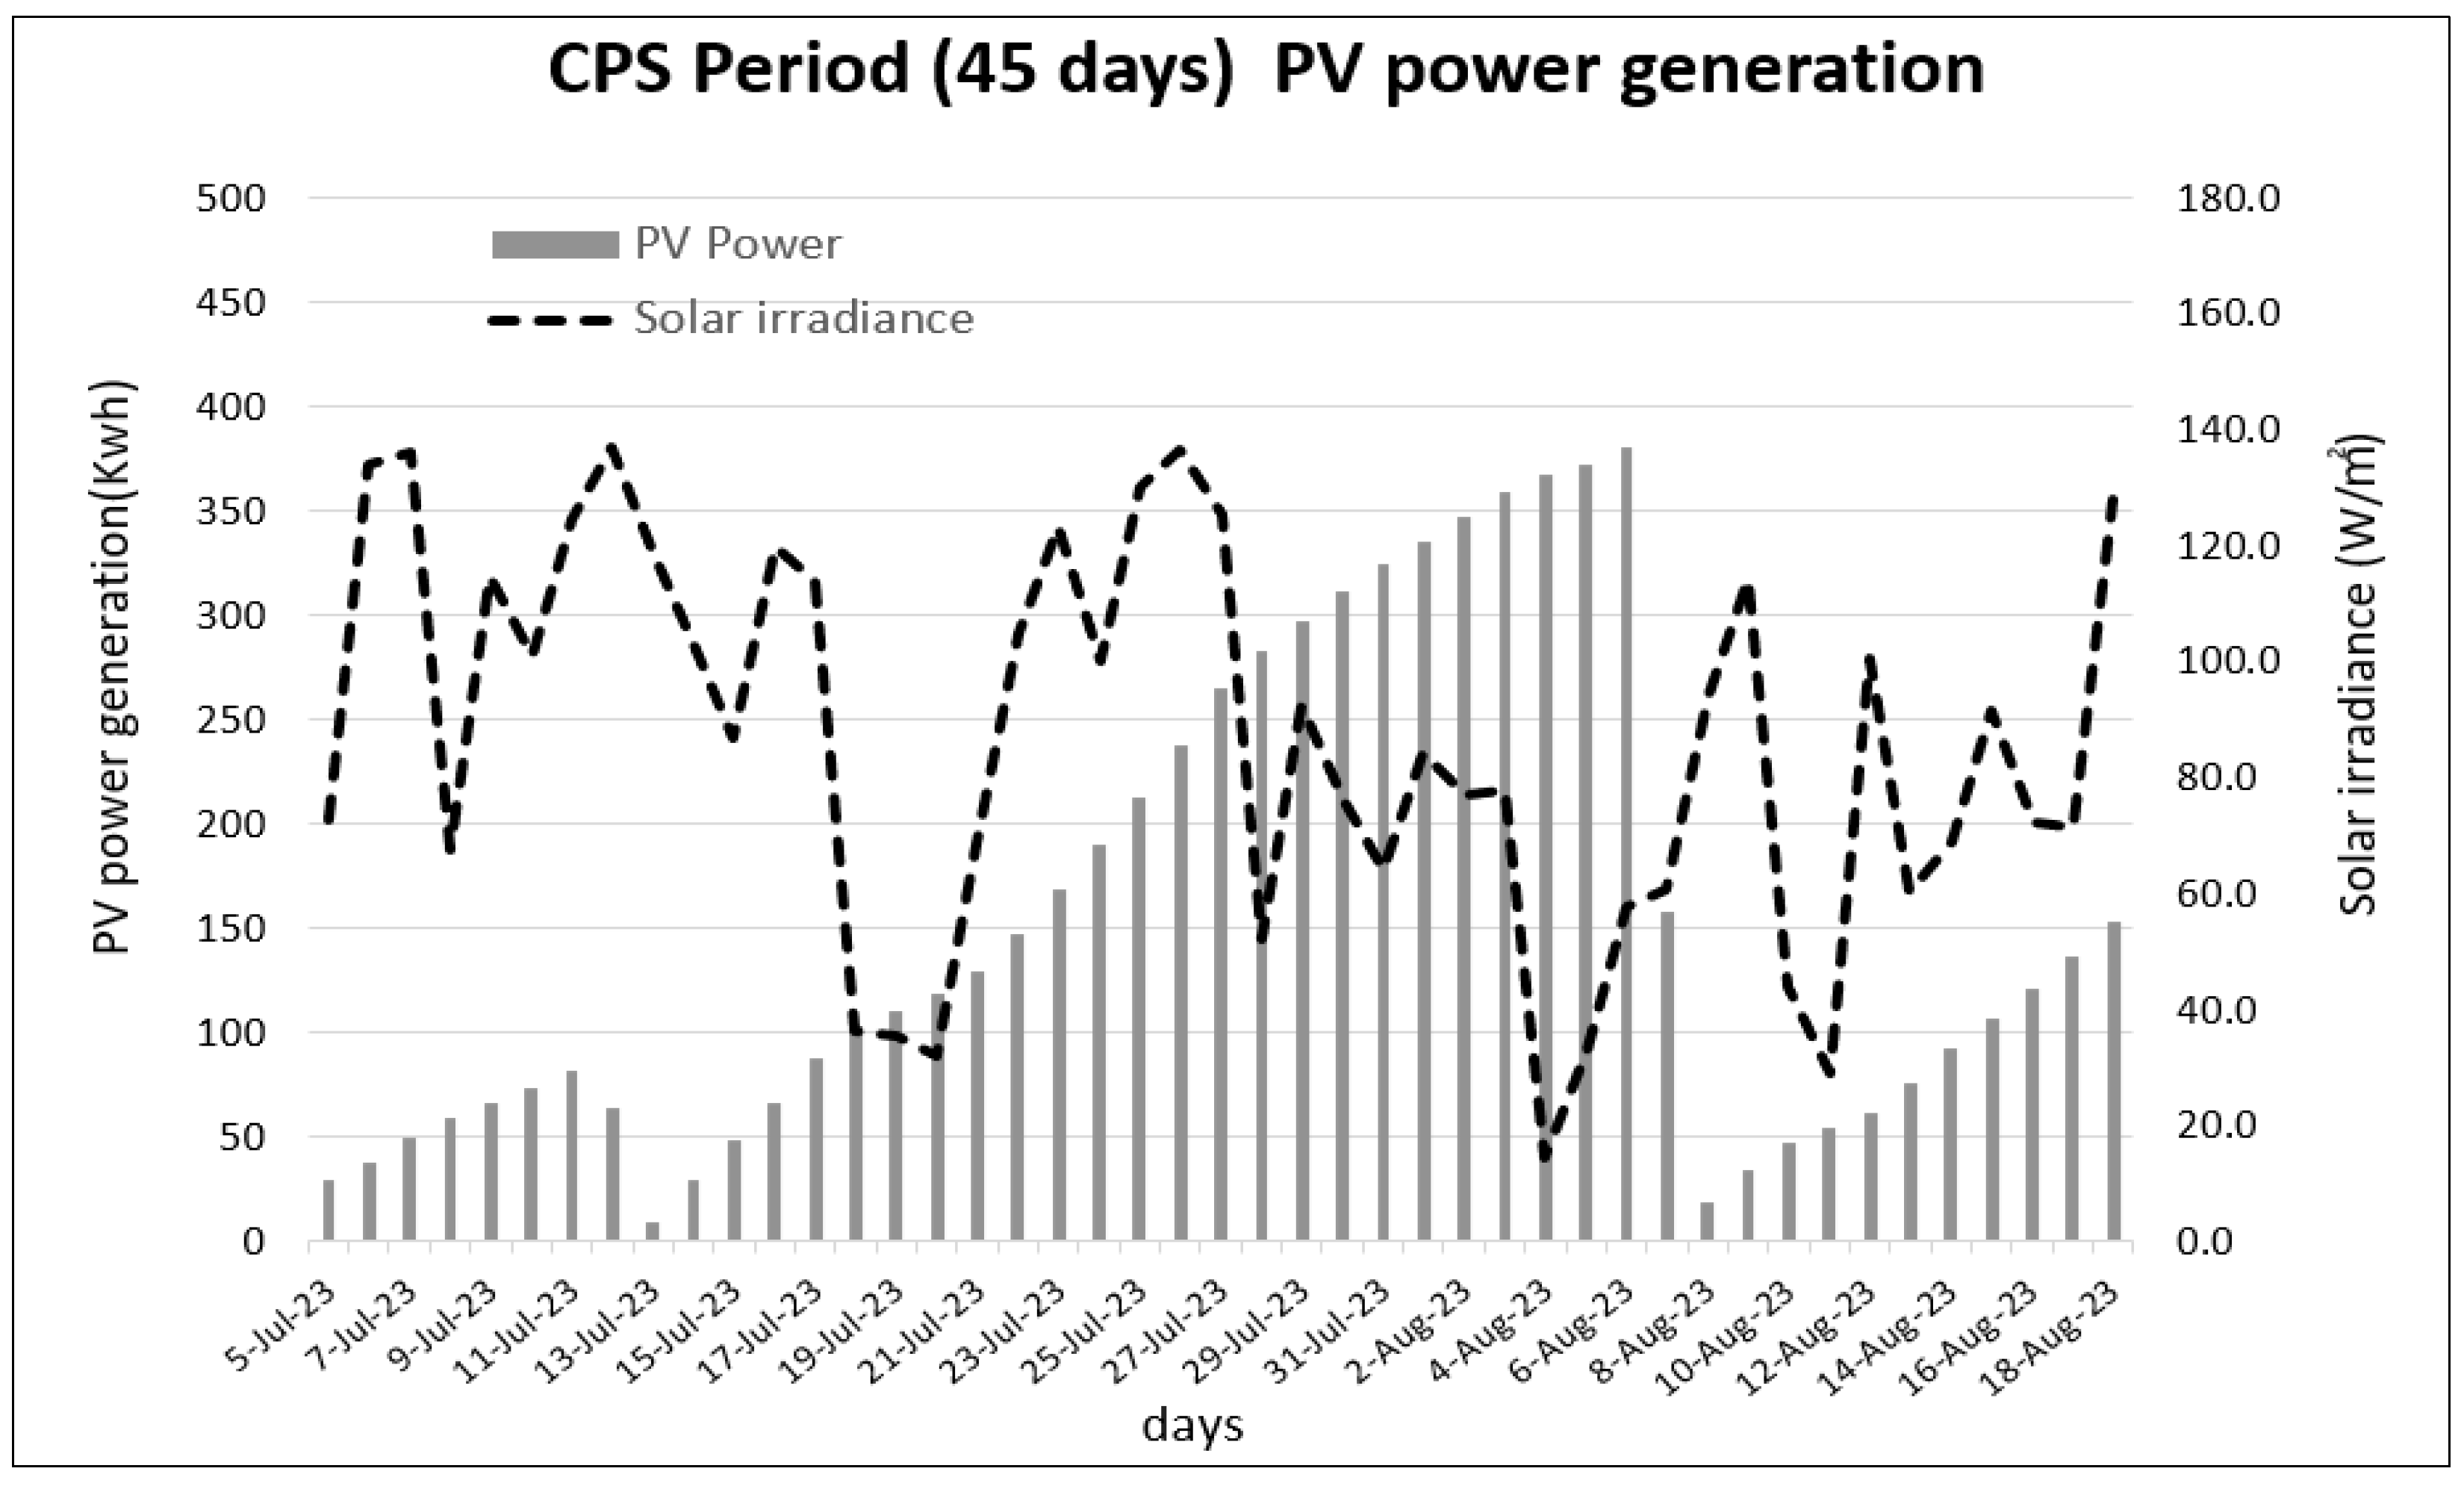
Figure 10 shows the amount of solar power generated according to the amount of insolation.
4. Conclusions
In this study, we propose building energy element technologies that address increasing cooling loads due to the rise in average temperatures caused by climate change. Through both simulation and field demonstration, we analyze performance variations and energy savings associated with design factors of each element technology, ultimately deriving a Cooling Load Package System (CPS) optimized for climte-responsive performance. Furthermore, the applicability and usability of the CPS-based optimized design configuration are evaluated.
The key findings of this study, based on the proposed element technologies, are summarized as follows:
The final selection of technologies aimed at reducing cooling loads includes passive system components such as high-performance windows, solar control films, thermal insulation materials, and heat-shielding coatings as well as active system technologies, including lighting, air-conditioning systems, and mechanical ventilation. Additionally, renewable energy components, such as photovoltaic (PV) solar panels, are incorporated.
Simulation-based performance prediction confirmed that the application of passive design technologies effectively reduced cooling energy demand. Moreover, the analysis enabled the identification of priority levels in energy-saving contributions from each individual element technology.
The simulation results for the demonstration chamber indicated that, compared to the baseline condition prior to the application of the package element technologies, the energy requirements were reduced by 3.8% for heating, 43.5% for cooling, and 78.9% for lighting. Overall, the total energy requirement—including that for ventilation—was reduced by approximately 55.4%. Furthermore, when renewable energy generated from solar photovoltaic (PV) systems was integrated, the total energy consumption showed a net reduction of 109.5%, indicating surplus generation beyond building demand.
The empirical analysis conducted after applying the Cooling Load Package System (CPS) revealed that the average accumulated energy requirement was 141.57 kWh, with a unit-area energy demand of 7.74 kWh/(m2·day). This represents an energy saving of approximately 74.3% compared to the pre-CPS condition. Additionally, the energy saving attributed solely to the application of solar PV systems demonstrated an improvement of approximately 115%, again indicating a surplus in energy generation.
The proposed building energy element technologies, developed in response to increasing cooling loads, were validated through both simulation and empirical testing. To ensure greater reliability and representativeness of the findings, future studies should incorporate long-term performance monitoring over periods exceeding one year. Given the ongoing rise in global temperatures due to climate change, the empirical results obtained from this Vietnam-based demonstration are considered valuable as practical guidelines for reducing cooling energy consumption in hot and humid climates.
Author Contributions
Conceptualization, formal analysis, data calculation, T.G.Y.; investigation, H.M.D. and S.-J.L.; methodology, S.-P.K.; project administration, H.M.D.; software, N.D.L.; validation, B.Y.P.; visualization, S.-P.K.; writing—original draft, T.G.Y.; writing—review and editing, T.G.Y., B.Y.P. and S.-P.K. All authors have read and agreed to the published version of the manuscript.
Funding
This work was supported by the Korea Institute of Energy Technology Evaluation and Planning (KETEP) grant funded by the Ministry of Trade, Industry and Energy (No. 20208510010080).
Data Availability Statement
The original contributions presented in the study are included in the article, further inquiries can be directed to the corresponding author.
Conflicts of Interest
The authors have no conflicts of interest to declare.
References
- Yun, T.G.; Shin, J.Y.; Kang, S.P. Analysis of Building Energy Reduction by Building Energy Package Regarding Vietnam Environmental Condition and Economic. J. Korean Sol. Energy Soc. 2022, 42, 63–71. [Google Scholar] [CrossRef]
- Ministry of Trade, Industry and Energy, Korea Energy Technology Evaluation Institute. Energy International Joint Research Project, Establishment of Foundation for Demonstration of Localization of High-Efficiency Building Energy Package Considering Climate/Economic Conditions in Vietnam; KCL, TOP and 7 Other Institutions, 2023. [Google Scholar]
- Han, S.-L.; Jeong, H.-G.; Lee, J.-S.; Park, S.-I. An empirical analysis of energy savings from climate-customized remodeling in Vietnam. Energy Build. 2024, 306, 113940. [Google Scholar] [CrossRef]
- Cho, K.J.; Cho, D.W. Effect Analysis on Building Energy Consumption of Solar Control Windows reflecting the Climate Characteristics of Vietnam-Focusing on Climate and Standard Application in Northern; Korean Institute of Ecological Architecture and Environment: Seoul, Republic of Korea, 2017; Volume 17, No. 6. [Google Scholar] [CrossRef]
- Choi, M.H.; Shin, S.-Y.; Shin, J.-Y.; Sung, U.-J. A Study on Cooling Load Reduction of Building Insulation Package Considering Climate Condition in Vietnam; Korean Institute of Architectural Sustainable Environment and Building Systems: Seoul, Republic of Korea, 2020; Volume 14, No. 1; pp. 1–9. [Google Scholar]
- Le, V.T. Low Energy Housing for the Hot Humid Climatr of Vietnam: The Value of a Passive House Approach. Ph.D. Thesis, University of Huddersfield, Huddersfield, UK, 2021. Available online: http://eprints.hud.ac.uk/id/eprint/35600 (accessed on 19 June 2025).
- Mohd Pauzi, N.; Kah Yeow, P.; Hang Go, Z.; Hadibarata, T. Overview on the Implementation of Green Building Design in Malaysia, Singapore, Vietnam and Thailand. Int. J. Adv. Res. Technol. Innov. 2021, 3, 35–48. [Google Scholar]
- QCVN 09:2017/BXD. National Technical Regulation on Energy Efficiency Buildings; Ministry of Construction, Vietnam, 2017. Available online: https://vanbanphapluat.co/qcvn-09-2017-bxd-cong-trinh-xay-dung-su-dung-nang-luong-hieu-qua (accessed on 1 July 2024).
- Nguyen, C.T.; Nguyen, D.L. Solutions for developing zero energy building from other countries and recommendations for Vietnam. J. Sci. Technol. Civ. Eng. 2023, 17, 91–100. [Google Scholar]
- Park, B.R.; Chung, M.H. Analysis of the additional energy-saving potential of residential buildings after mandatory zero-energy buildings to achieve carbon neutrality in South Korea. Build. Environ. 2023, 228, 109908. [Google Scholar] [CrossRef]
- Chowdhury, A.A.; Rasul, M.G.; Khan, M.M.K. Low Energy Cooling Technologies for Sub-Tropical/Warm Humid Climate Building Systems. In Proceedings of the Second National IBPSA-USA Conference, Cambridge, MA, USA, 2–4 August 2006; pp. 191–199. [Google Scholar]
- Lee, S.-J.; Kim, K.-J.; Kim, D.-S.; Ryu, E.-H.; Choi, J.-J. Analysis of relation between power generation performance for design elements of BIPV system through mock-up demonstration. In Proceedings of the 2018 IEEE 7th World Conference on Photovoltaic Energy Conversion (WCPEC) (A Joint Conference of 45th IEEE PVSC, 28th PVSEC & 34th EU PVSEC), Waikoloa Village, HI, USA, 10–15 June 2018; pp. 590–595. [Google Scholar]
- Duffie, J.A.; Beckman, W.A.; Blair, N. SOLAR Engineering of Thermal Processes, Photovoltaiccs and Wind; WILEY Co.: Hoboken, NJ, USA, 2020; pp. 45–136. [Google Scholar]
- Korea Institute of Construction Technology. Development of Low-Cost and High-Performance Hidden Rail Windows Optimized for Subtropical Climate in Southeast Asia. Final Report, Seoul, Korea, 2017. Available online: https://www.codil.or.kr/viewDtlConRpt.do?gubun=rpt&pMetaCode=OTKCRK186040 (accessed on 17 June 2023).
- Ministry of Trade, Industry and Energy; KOTRA Korea Investment Enterprise Support Center. Vietnam Renewable Energy Market Status and Features/Vietnam Power Market Status Features. 2018, pp. 1–26. Available online: https://vir.com.vn/vietnam-renewable-energy-report-2018-63034.html (accessed on 17 June 2023).
- Ministry of Land, Infrastructure and Transport. Development of a Model for Optimization of Zero Energy Housing and the Construction of a Demonstration Complex; Final Report; Myongji University and two other institutions, 2018. Available online: https://www.codil.or.kr/viewDtlConRpt.do?gubun=rpt&pMetaCode=OTKCRK180902 (accessed on 17 June 2023).
- Korea Institute of Energy Technology Evaluation. Final Report on “Project to Demonstrate Complex Envelope Systems in Residential Buildings in Response to Zero Energy.”; KICT: Goyang, Republic of Korea, 2013. [Google Scholar]
- Yun, Y.S.; Cho, D.W.; Chae, C.U. A Comparison of the Green Building Certification System between South Korea and Vietnam. Appl. Mech. Mater. 2017, 864, 290–295. [Google Scholar] [CrossRef]
- LOTUS Rating Systems-VGBC, (n.d.). Available online: https://vgbc.vn/en/rating-systems/ (accessed on 18 January 2023).
- LEED Rating System|U.S. Green Building Council, (n.d.). Available online: https://www.usgbc.org/leed (accessed on 11 September 2023).
- BREEAM-BRE Group, (n.d.). Available online: https://bregroup.com/products/breeam/ (accessed on 11 September 2023).
Figure 1.
Building energy technology/policy development stage and Southeast Asian technology entry scope [
2].
Figure 1.
Building energy technology/policy development stage and Southeast Asian technology entry scope [
2].
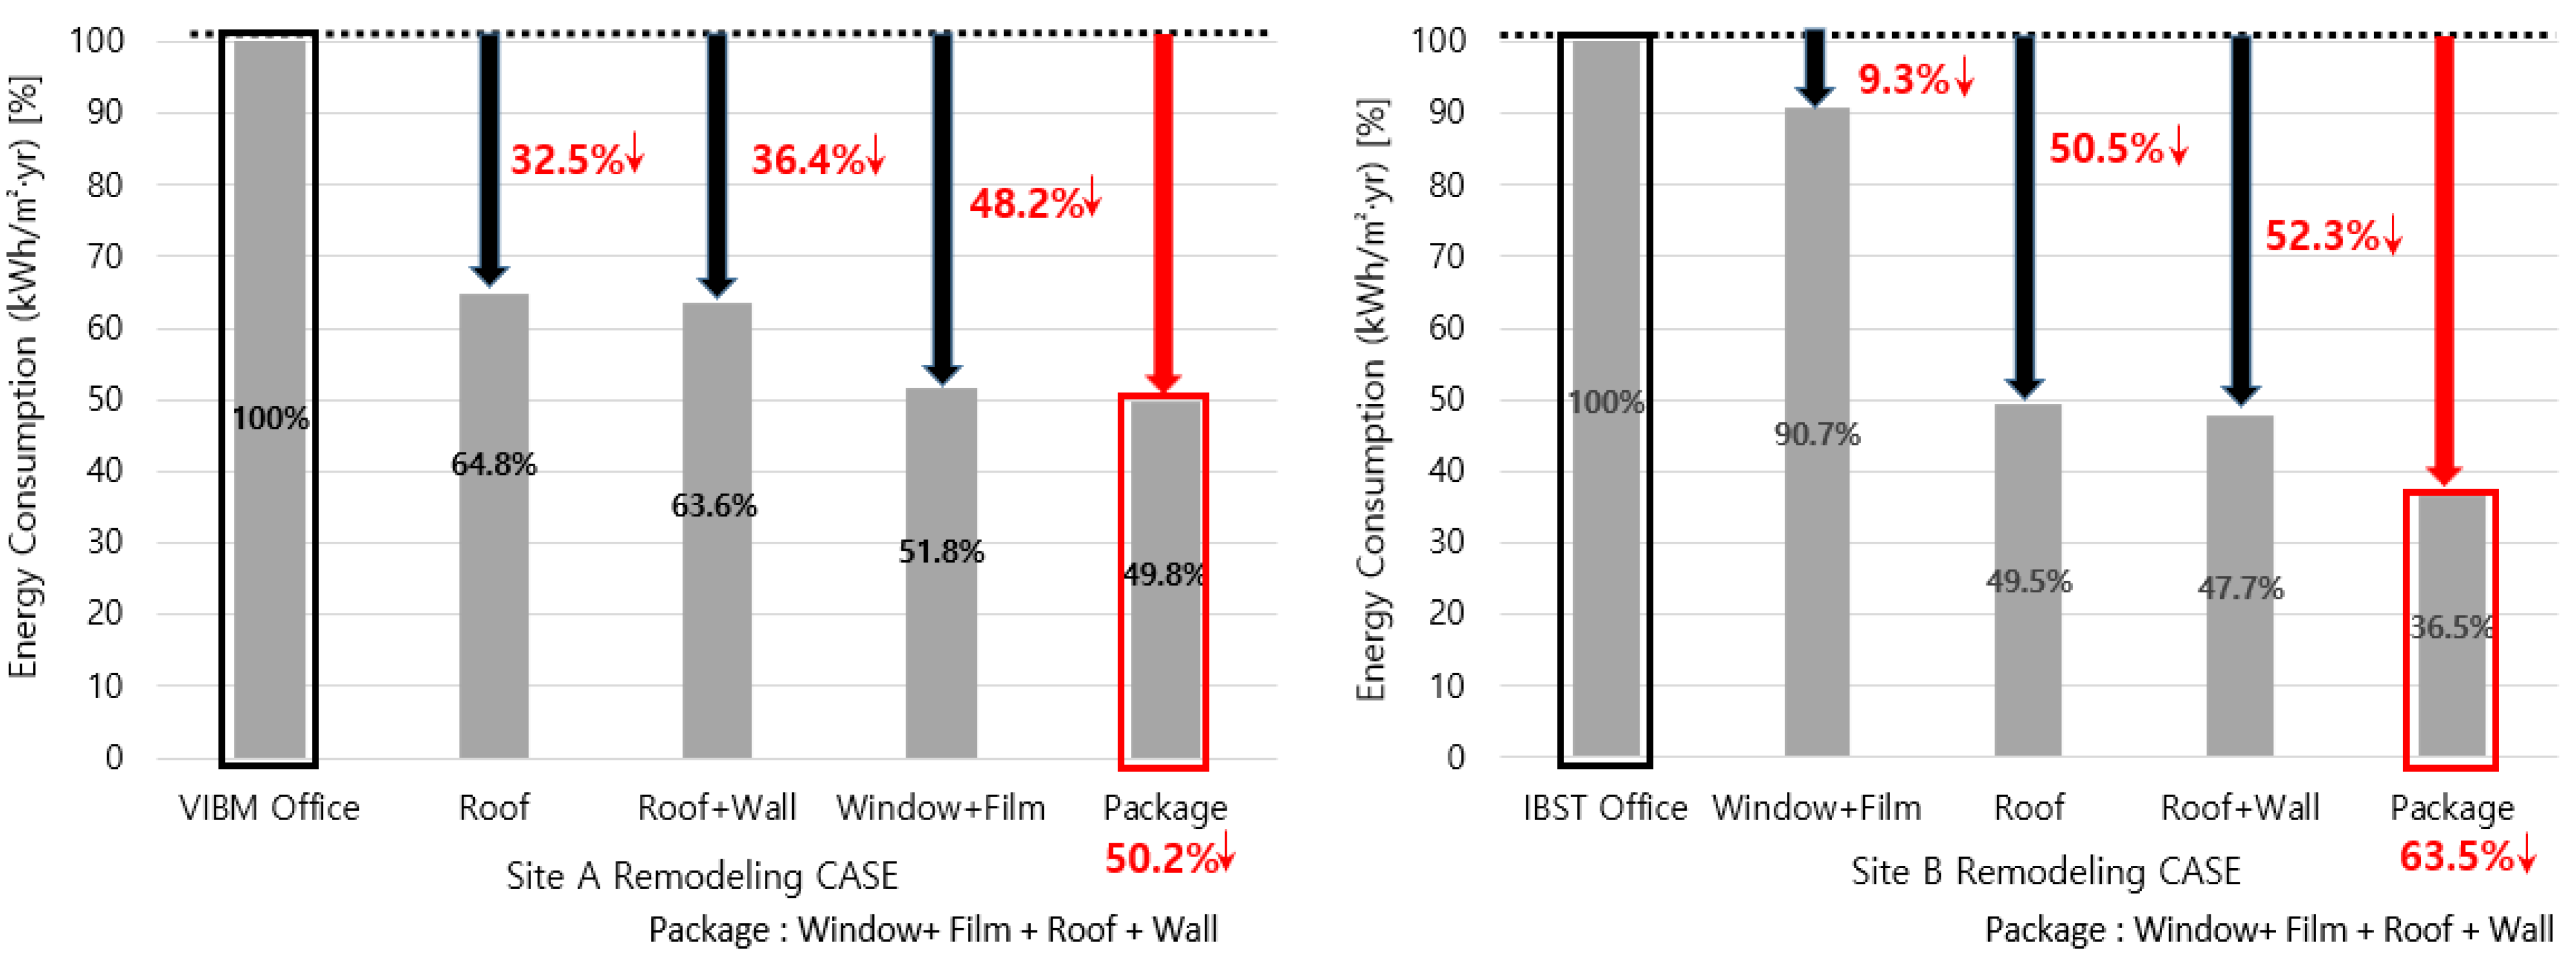
Figure 2.
Energy-saving effects by application of element technologies (Building A: left, Building B: right).
Figure 2.
Energy-saving effects by application of element technologies (Building A: left, Building B: right).
Figure 3.
Installation location and number of demonstration chamber measuring instruments.
Figure 3.
Installation location and number of demonstration chamber measuring instruments.
Figure 4.
Setting the verification period according to the annual temperature distribution in Vietnam.
Figure 4.
Setting the verification period according to the annual temperature distribution in Vietnam.
Figure 5.
Before (above) and after (below) photos of optimized design elements applied.
Figure 5.
Before (above) and after (below) photos of optimized design elements applied.
Figure 6.
Energy demand (left)/energy consumption (right) per unit area before CPS application.
Figure 6.
Energy demand (left)/energy consumption (right) per unit area before CPS application.
Figure 7.
Energy demand (left)/energy consumption (right) per unit area after CPS application.
Figure 7.
Energy demand (left)/energy consumption (right) per unit area after CPS application.
Figure 8.
Baseline period (45 days) outdoor temperature and energy consumption.
Figure 8.
Baseline period (45 days) outdoor temperature and energy consumption.
Figure 9.
CPS period (45 days) outdoor temperature and energy consumption.
Figure 9.
CPS period (45 days) outdoor temperature and energy consumption.
Figure 10.
CPS period (45 days) solar irradiance and PV power generation.
Figure 10.
CPS period (45 days) solar irradiance and PV power generation.
Table 1.
Building energy package technologies considering Vietnam’s climate and economic conditions.
Table 1.
Building energy package technologies considering Vietnam’s climate and economic conditions.
| Item | Purpose |
|---|
| Window and Film | Enhance thermal and optical performance to reduce cooling load |
| Insulation | Improve thermal performance of building envelope |
| Paint | Reflect solar radiation using low-emissivity materials |
| Air Conditioner | Apply an energy-efficient model (higher COP) to improve the indoor thermal condition |
| Lighting | Using LED to reduce lighting energy consumption |
| Ventilation | 300 CMH class High Temperature and Humidity Climate Response Dehumidifying HRV System |
| Solar Photo Voltaic | Development of low-cost facility package linked to renewable energy (Solar PV) |
Table 2.
Building energy package technology considering Vietnam’s climate and economic conditions.
Table 2.
Building energy package technology considering Vietnam’s climate and economic conditions.
| Site | Category | Before Application | After Application |
|---|
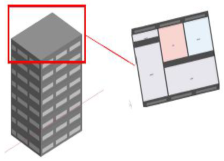
![Energies 18 03314 i001]() | Wall [W/(m2·K)] | 1.264 | 0.500 |
| Roof [W/(m2·K)] | 3.515 | 0.440 |
| Floor [W/(m2·K)] | 3.515 | 0.440 |
| Window [W/(m2·K)] | 5.300
Single-layer glass 5 mm | 2.800
Double-layer glass 24 mm (film) |
| Setpoint [°C] | 22(Heating)/24(Cooling) | 22(Heating)/24(Cooling) |
| Light Density [W/m2] | 5.0 | 5.0 |
| COP | 2.0 | 2.0 |
| [Site A] | Energy Demand [kWh/(m2·year)] | 254.58 | 126.51 |
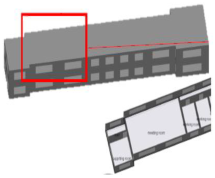
![Energies 18 03314 i002]() | Wall [W/(m2·K)] | 0.904 | 0.500 |
| Roof [W/(m2·K)] | 4.489 | 0.440 |
| Floor [W/(m2·K)] | 4.489 | 4.489 |
| Window [W/(m2·K)] | 5.300
Single-layer glass 5 mm | 2.800
Double-layer glass 24 mm (film) |
| Setpoint [°C] | 22/24 | 22/24 |
| Light Density [W/m2] | 5.0 | 5.0 |
| COP | 2.0 | 2.0 |
| [Site B] | Energy Demand [kWh/(m2·year)] | 251.90 | 92.00 |
Table 3.
Demonstration chamber overview.
Table 3.
Demonstration chamber overview.
| Location | Hanoi, Vietnam |
| Year of completion | April 2023 |
| Floor number/total floor area | 1st floor/18.3 m2 (detailed size: 3 m × 6.1 m × 2.5 m) |
| Structure | Sandwich Panel (PU) |
| Details | windows | 5mm general glass (aluminum frame applied) |
| walls | 100 mm concrete + 10 mm insulation gypsum board 9.5 mm etc. |
| air conditioning | Multi air conditioner |
| lighting | LPD 13.11 W/m2 (fluorescent lamp applied) |
Table 4.
Demonstration chamber configuration and construction specifications.
Table 4.
Demonstration chamber configuration and construction specifications.
| Division | Construction Specification |
| Space unit chamber | - -
Dimensions: 3 m (width) × 6.1 m (length) × 2.5 m (height) - -
Exterior wall thickness and material: 150 mm, polyurethane (thermal conductivity 0.019 W/(m·k)) - -
Exterior finish: paint
|
| Sample mounting frame | - -
Dimensions: 4.5 m (width) × 4.51 m (height) × 1.8 m (thickness) - -
Weight: approximately 1.78 tons - -
Opening for wall test installation (maximum size 3.3 m (W) × 3.1 m (H) × 0.25 m (D) - -
Detachable stud construction, anti-corrosive finish paint treatment
|
| Measurement room (monitoring room) | - -
Dimensions: 2 m (width) × 2 m (length) × 2.5 m (height), container structure
|
Table 5.
Details before and after application of element technology.
Table 5.
Details before and after application of element technology.
| Division | Before Construction(Baseline) | After Construction (CPS Application) |
|---|
| Passive system | windows | Aluminum frame, single layer glass 5 mm | Aluminum frame, double-layer glass 24 mm |
| film | - | Attach low-emissivity film to glass |
| insulation | PU Panel | Construction of low radiation insulation 40 mm |
| paint | - | Apply the heat shield to the middle of the road and to the top |
| Active system | ventilation | - | Heat Recovery Ventilation (HRV) 1 EA |
| lighting | Fluorescent light efficiency—55 (lm/W)
Power consumption (30 W) | LED light efficiency—134 (lm/W)
Power consumption (25 W, 20 W) |
| air conditioning | EHP COP 3.0(-), 1EA | EHP COP 4.5(-), 1 EA |
| Renewable energy—PV | - | Single crystal capacity—3115 W
Module efficiency 20.8% |
Table 6.
Demonstration period before and after CPS.
Table 6.
Demonstration period before and after CPS.
| | Site and Duration | Outdoor Chamber (IBST) Demonstration Period |
|---|
| Category | |
|---|
| Baseline period data | 17 April 2023~2 June 2023 (47 days) |
| CPS installation | 7 June 2023~30 June 2023 (24 days) |
| CPS period data | 4 July 2023~26 September 2023 (85 days) |
Table 7.
Results of energy demand and energy consumption analysis before and after CPS application.
Table 7.
Results of energy demand and energy consumption analysis before and after CPS application.
| Division | Energy Demand [kWh/(m2·year)] | Total Energy Demand [kWh/(m2·year)] | Energy Consumption [kWh/(m2·year)] | Total Energy Consumption [kWh/(m2·year)] |
|---|
| Heating | Cooling | Lighting | Outlet | Heating | Cooling | Lighting | Ventilation |
|---|
| Before CPS | 6.26 | 128.34 | 40.20 | 174.80 | 7.14 | 1.89 | 38.77 | 40.20 | - | 88.01 |
| After CPS | 6.02 | 72.58 | 8.49 | 87.09 | 6.71 | 1.34 | 16.13 | 8.49 | 10.08 | 42.75 |
| Savings rate (%) | 3.83 | 43.45 | 78.89 | 50.18 | 6.05 | 29.10 | 58.40 | 78.89 | - | 51.43 |
Table 8.
Results of analysis of primary energy requirements according to solar power application.
Table 8.
Results of analysis of primary energy requirements according to solar power application.
| Division | Primary Energy Demand [kWh/(m2·year)] | Solar Energy Production [kWh/(m2·year)] | Primary Energy Demand Including Power Generation [kWh/(m2·year)] |
|---|
| Before CPS application | 242.03 | - | 242.03 |
| After CPS application | 117.56 | 140.57 | −23.01 |
| Savings rate (%) | 109.51% |
Table 9.
Results of energy consumption analysis before and after the application of CPS.
Table 9.
Results of energy consumption analysis before and after the application of CPS.
| Category | Data |
|---|
| Baseline Period | Average outdoor temperature | 30.8 (°C) |
| Average indoor temperature | 28.2 (°C) |
| 45 days of cumulative energy consumption | 551.33 (kWh) |
| Energy consumption per unit area | 30.13 (kWh/m2·day) |
| CPS Period | Average outdoor temperature | 30.1 (°C) |
| Average indoor temperature | 28.3 (°C) |
| 45 days of cumulative energy consumption | 141.57 (kWh) |
| Energy consumption per unit area | 7.74 (kWh/m2·day) |
| Energy saving | 74.32% |
Table 10.
Results of energy consumption analysis according to CPS with solar PV application.
Table 10.
Results of energy consumption analysis according to CPS with solar PV application.
| Division | Primary Energy Demand [kWh/(m2·day)] | Solar Energy Production [kWh/(m2·day)] | Primary Energy Demand Including Power Generation [kWh/(m2·day)] |
|---|
| Before CPS application | 30.13 | - | 30.13 |
| After CPS application | 7.74 | 11.21 | −3.48 |
| Savings rate (%) | 111.54% |
| Disclaimer/Publisher’s Note: The statements, opinions and data contained in all publications are solely those of the individual author(s) and contributor(s) and not of MDPI and/or the editor(s). MDPI and/or the editor(s) disclaim responsibility for any injury to people or property resulting from any ideas, methods, instructions or products referred to in the content. |
© 2025 by the authors. Licensee MDPI, Basel, Switzerland. This article is an open access article distributed under the terms and conditions of the Creative Commons Attribution (CC BY) license (https://creativecommons.org/licenses/by/4.0/).
