Article

Fast Identification of LiNMC Cells for Railway Applications

Department of Industrial Engineering, University of Florence, Via di Santa Marta 3, 50139 Firenze, Italy
*
Author to whom correspondence should be addressed.
Energies 2025, 18(13), 3300; https://doi.org/10.3390/en18133300
Submission received: 10 May 2025 / Revised: 30 May 2025 / Accepted: 30 May 2025 / Published: 24 June 2025

Abstract

Batteries are a key element in the development of both battery-operated and hybrid trains. For this type of system, the most common anode choice is LTO (lithium titanate), as the adoption of lithium titanate instead of graphite for anodes ensures an unrivaled level of reliability, especially against calendar aging. LTO also ensures prolonged load-cycle lifespans. However, LTO’s known drawbacks involve its high production cost and mediocre energy density, which is mainly due to its high anodic potential compared to graphite. In this study, we perform a rapid identification of an LiNMC (lithium, nickel, manganese, and cobalt) cell and propose some preliminary scaled HIL (hardware in the loop) and SIL (software in the loop) testing, aiming to verify the possible usage of LiNMC cells for railway applications.

1. Introduction

Batteries are a strategic component in the development of future railway systems [1]. The large-scale adoption of battery-operated rolling stock is substantially constrained by performance assessments and battery reliability.
Even the diffusion of alternative hybrid solutions [2,3] based on fuel cell technology is strongly constrained by the performance of batteries, which contribute to the sizing and dynamic performance optimization of an entire power buffer system [4].
Batteries are also widely used on conventional rolling stock as backup auxiliary power sources [5,6]. Finally, stationary applications for peak shaving and energy recovery on railway infrastructures should be mentioned [7,8,9]. Thus, it can be concluded that batteries are a key component for the development of both innovative and conventional railway systems. Design and development processes are strongly conditioned by some specific features related to railway applications:
  • Size of the Storage System: The size of storage systems is relatively large; correspondingly, the development of full-scale prototypes and their testing is relatively expensive.
  • Production Scale: With respect to other sectors, such as the automotive sector, the scale of production is relatively modest. Thus, the costs of product development and assessment cannot be justified by large production scales.
  • Required Life and Safety levels: The operational life of rolling stock is typically over 25–30 years, with associated mileages of 107 km (30 million kilometers should be a statistically feasible estimation). The current life of batteries is limited both in terms of equivalent cycles [10] and calendar [11] aging. Therefore, batteries with a lifespan corresponding to approximately 8–10 years are often required, along with a corresponding mileage of several million kilometers.
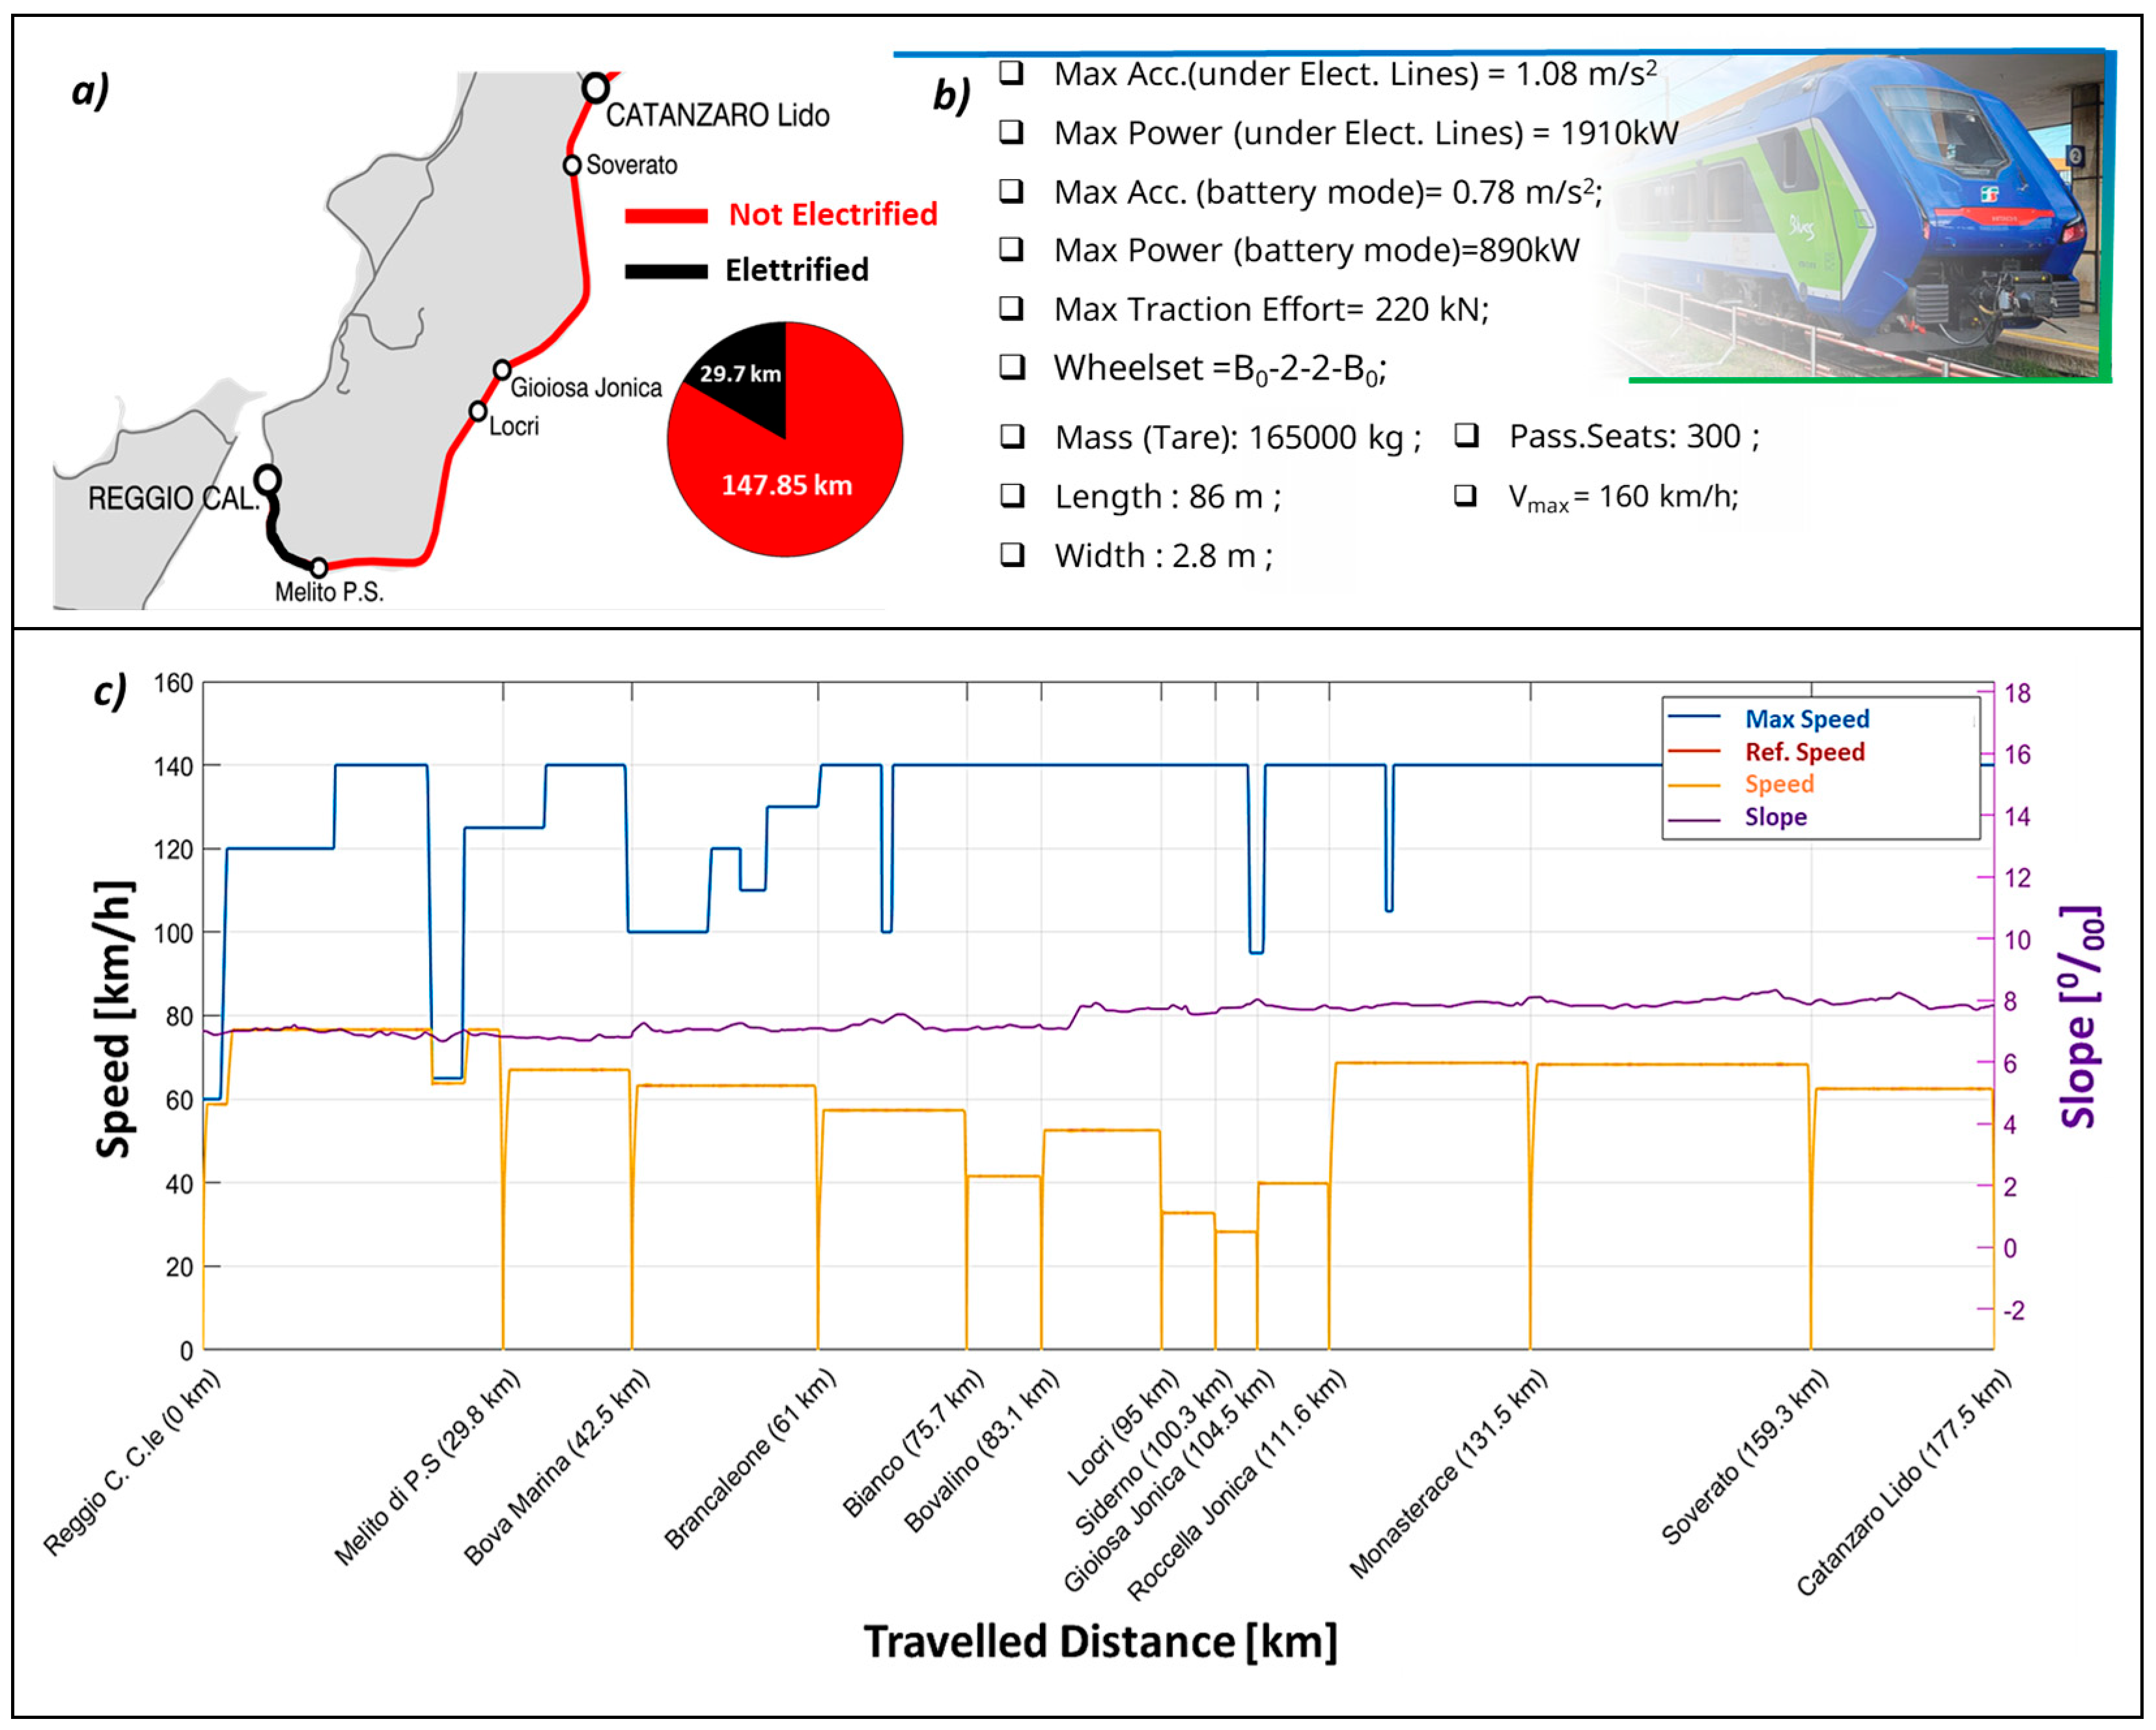
  • Operational Stress Conditions: The inertia of rolling stock is typically relatively important with respect to motion resistances. Thus, to ensure an acceptable level of autonomy, the size of the battery is relatively small. At the same time, peak traction demand and regenerative braking are quite demanding, as power and energy are transferred during both phases due to the train’s high inertia. As an example, for a Hitachi Blues BEMU (battery electric multiple unit), the size of the DC-DC controller used to interface the battery with the traction and braking loads is approximately three times greater than the nominal power of the battery [12,13,14]; this means that it is possible to charge and discharge the battery pack with a peak performance that is near or about 3C. Moreover, thermal and fire protection specifications are even more demanding, as the battery is not only subjected to high charge and discharge rates but also unfavorable conditions when the train is not in operation.
This combination of strict constraints and limitations has driven the railway market to favor highly reliable but also extremely expensive batteries, such as LTO batteries. The typical features of LTO batteries that should be adopted for railway applications are compared with those of other concurrent chemistries (LiNMC and LiFePO4) in Table 1 [15,16].
It is interesting to note that performance in terms of the durability and reliability of LTO is superior. However, its cost and overall performance are substantially penalized with respect to its counterparts, which are more often used in the automotive sector. Moreover, in terms of sustainability, despite their superior duration, the construction of LTO cells has a more important impact in terms of equivalent CO2 emissions. Thus, there is increasing interest in alternative chemistries that, despite their shorter lifespan, could contribute to increasing the current autonomy of battery trains from 80 to 100 km to over 300 km at relatively lower costs.
In this study, we develop tools for the rapid identification and prototyping of the RT lumped thermal electric models of cells, which can eventually be used for the preliminary suitability evaluation of different cell chemistries for proposed railway applications. For this reason, the proposed approach is tested on benchmark LiNMC cells, and their main features are described in Table 2, describing a relatively inexpensive commercial LiNMC cell.
This study is organized as follows:
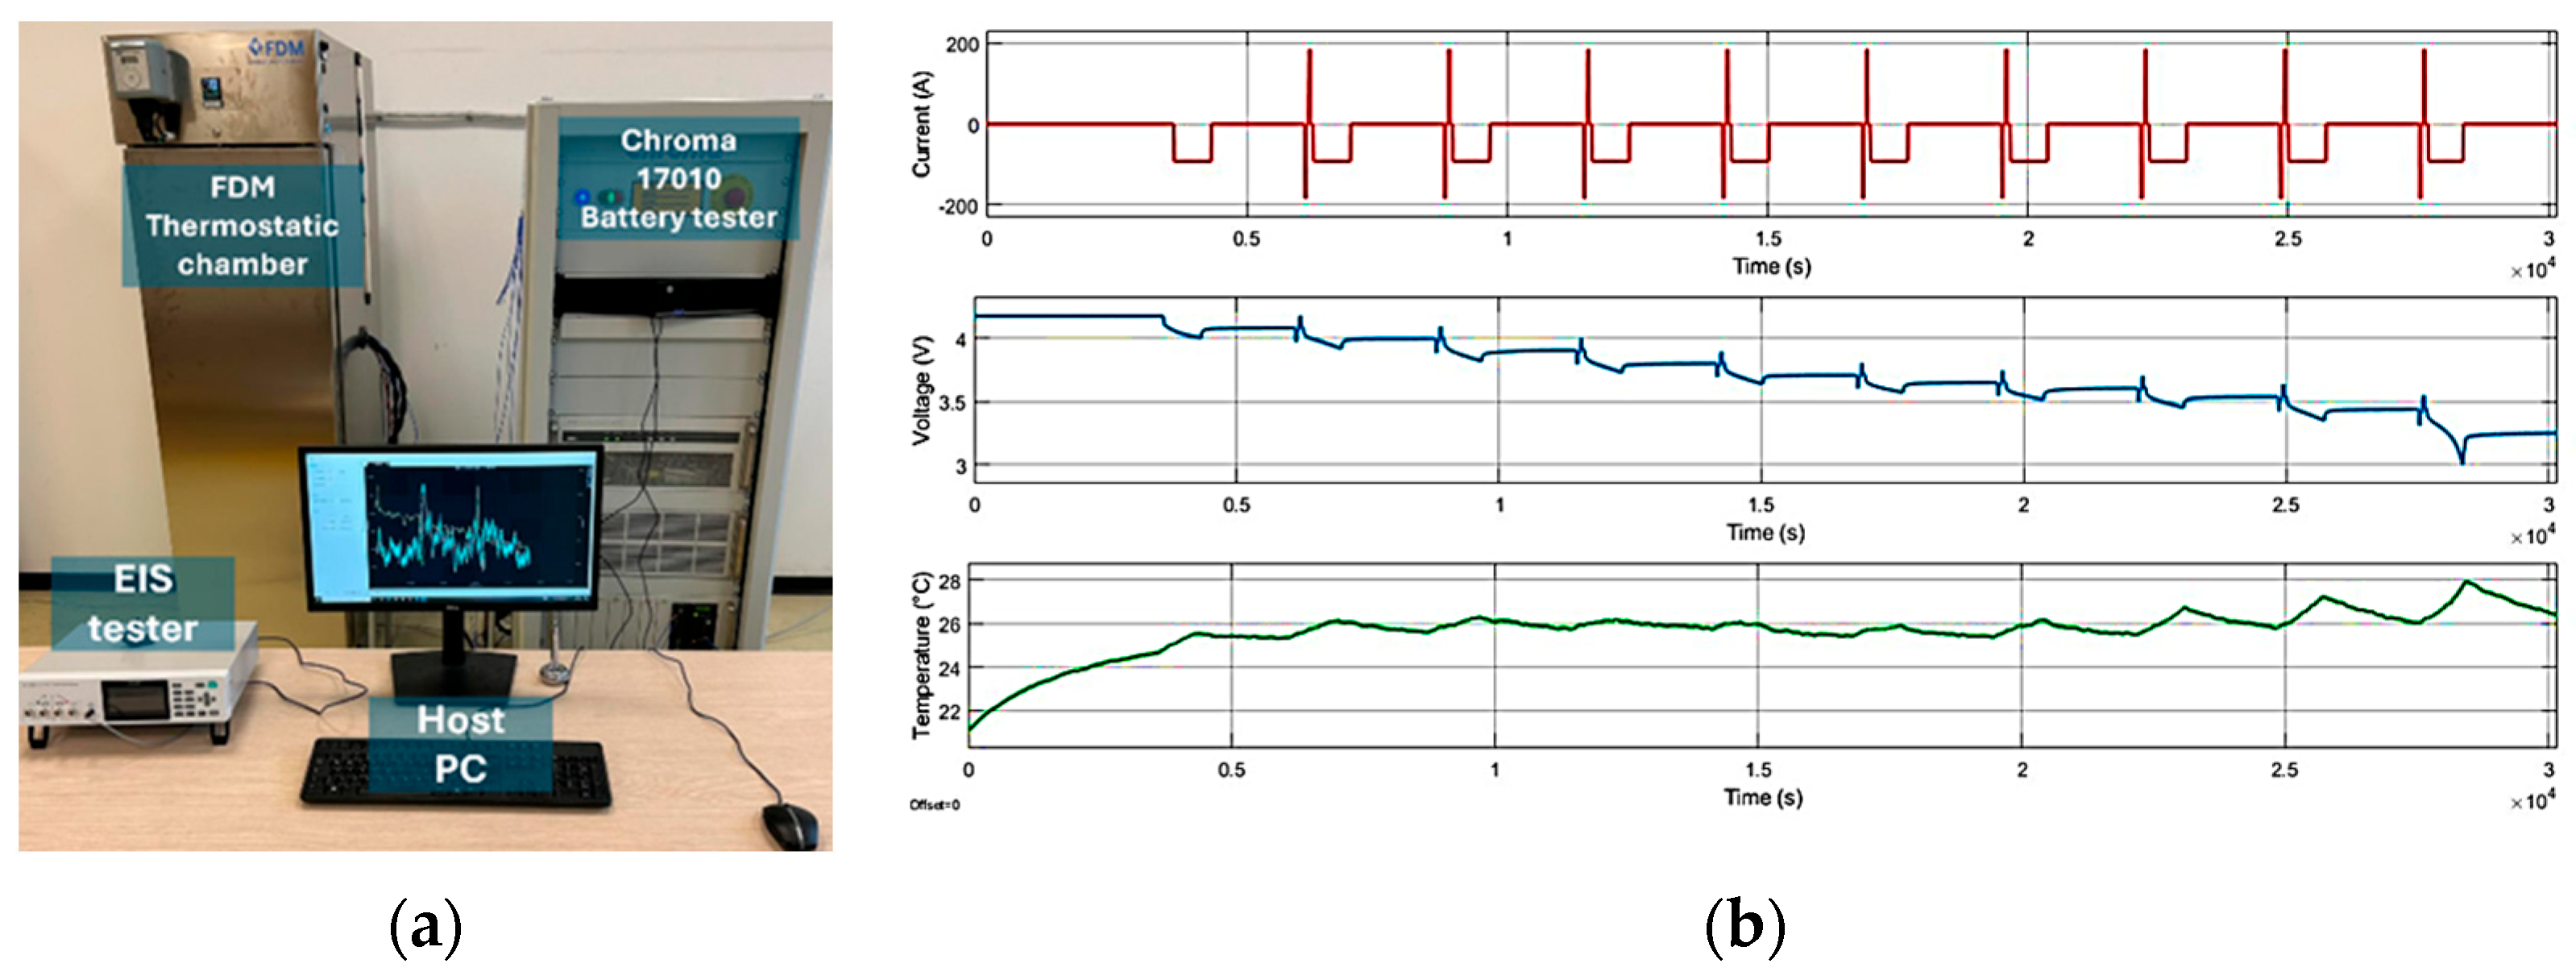
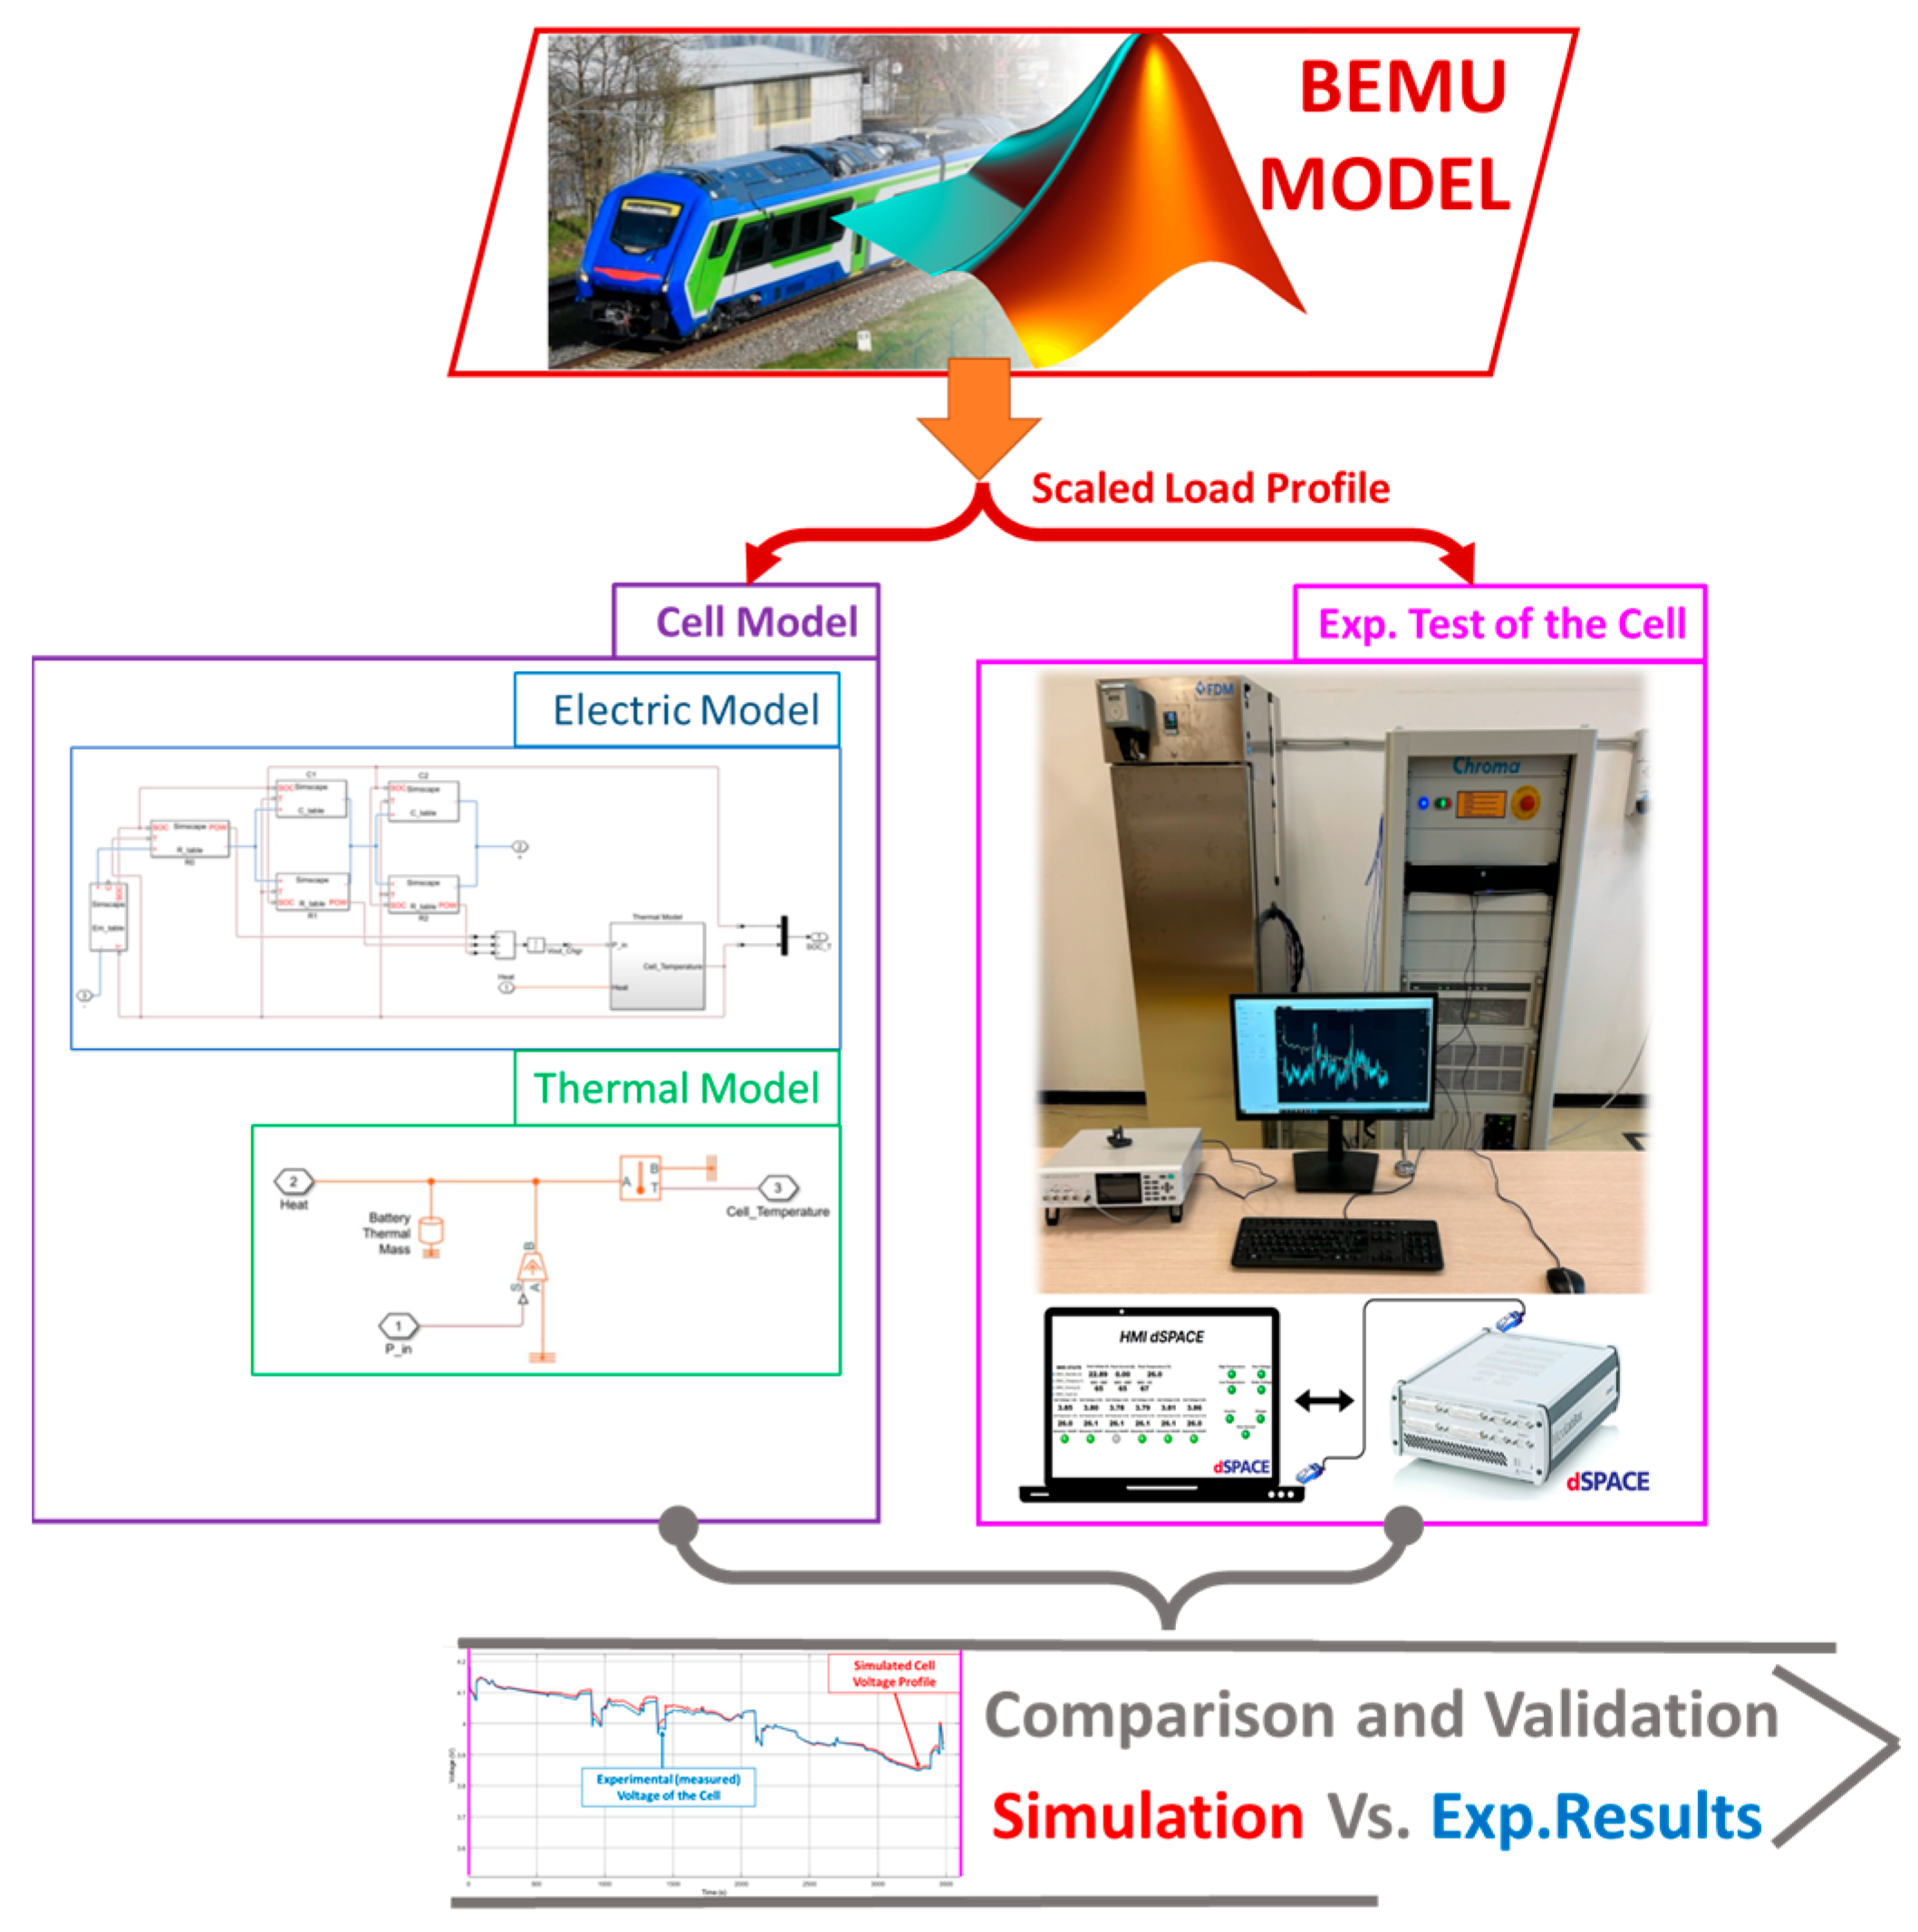
  • Cell Identification with a Lumped Thermal–Electric Model: Using the testing devices of Florence University, the behavior of SOC and temperature are identified.
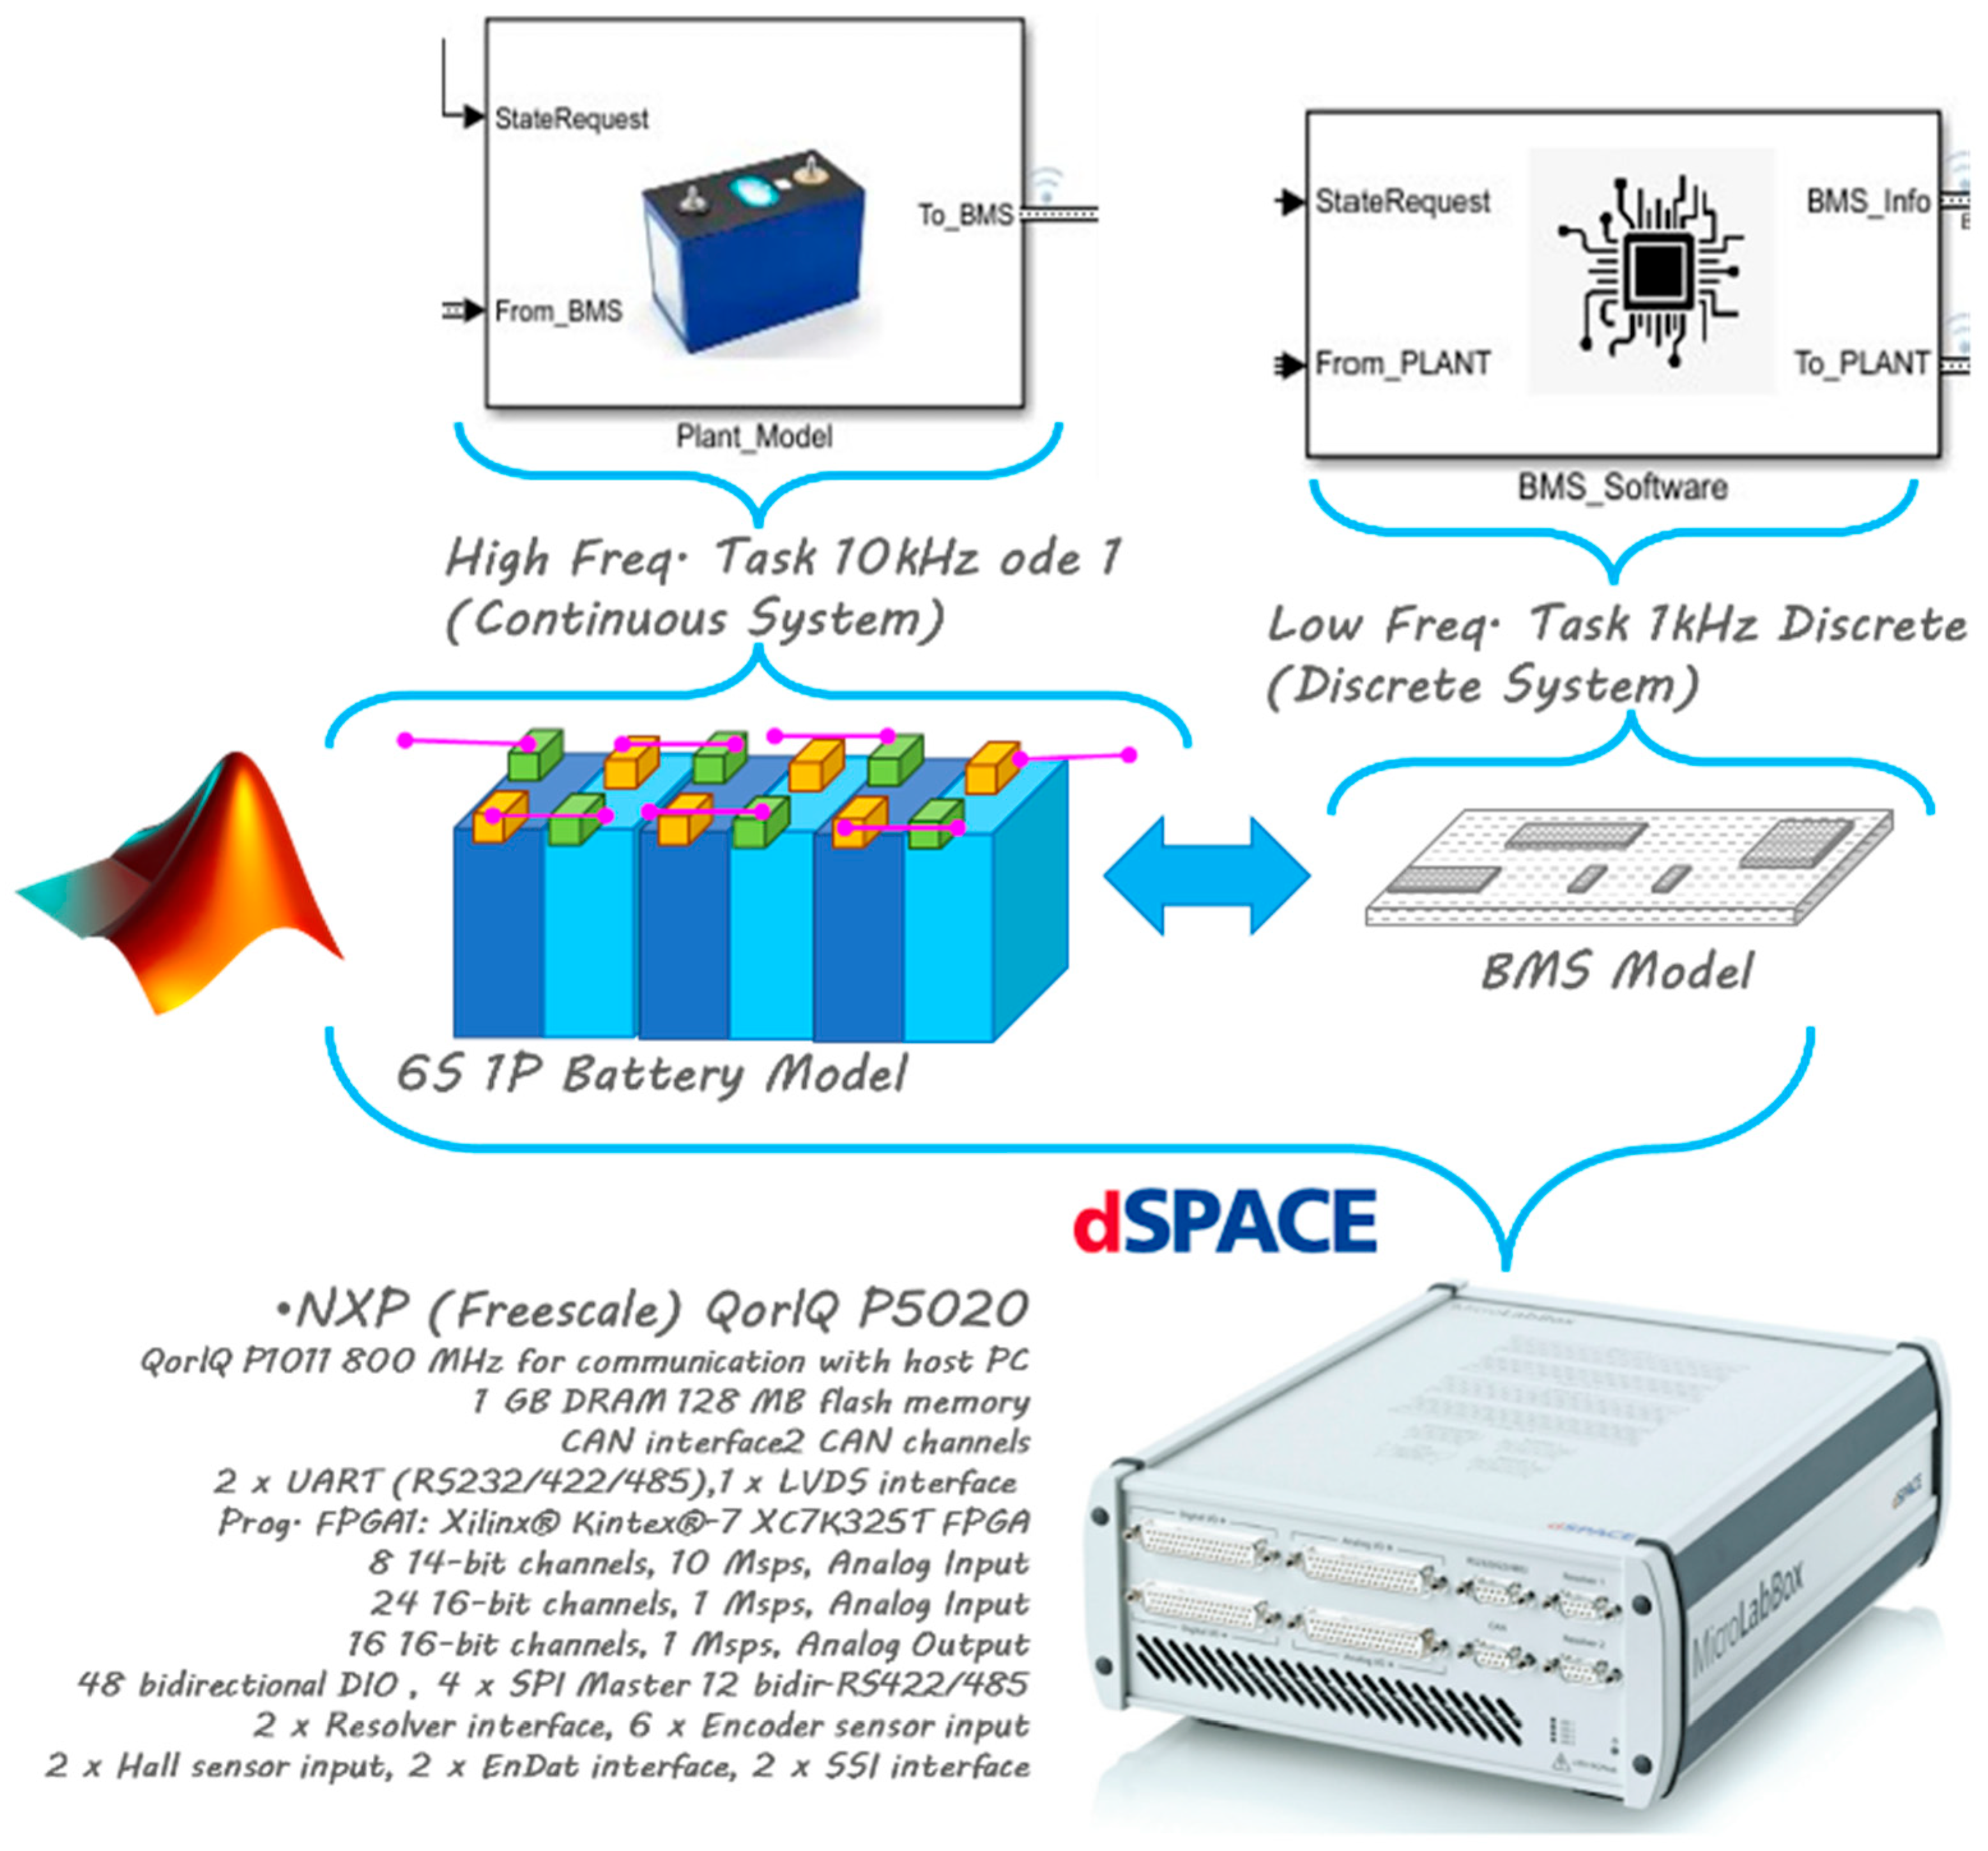
  • BMS SIL Testing: The identified model is then used to implement a battery module model with its BMS. Moreover, the SIL testing of the BMS module is implemented.
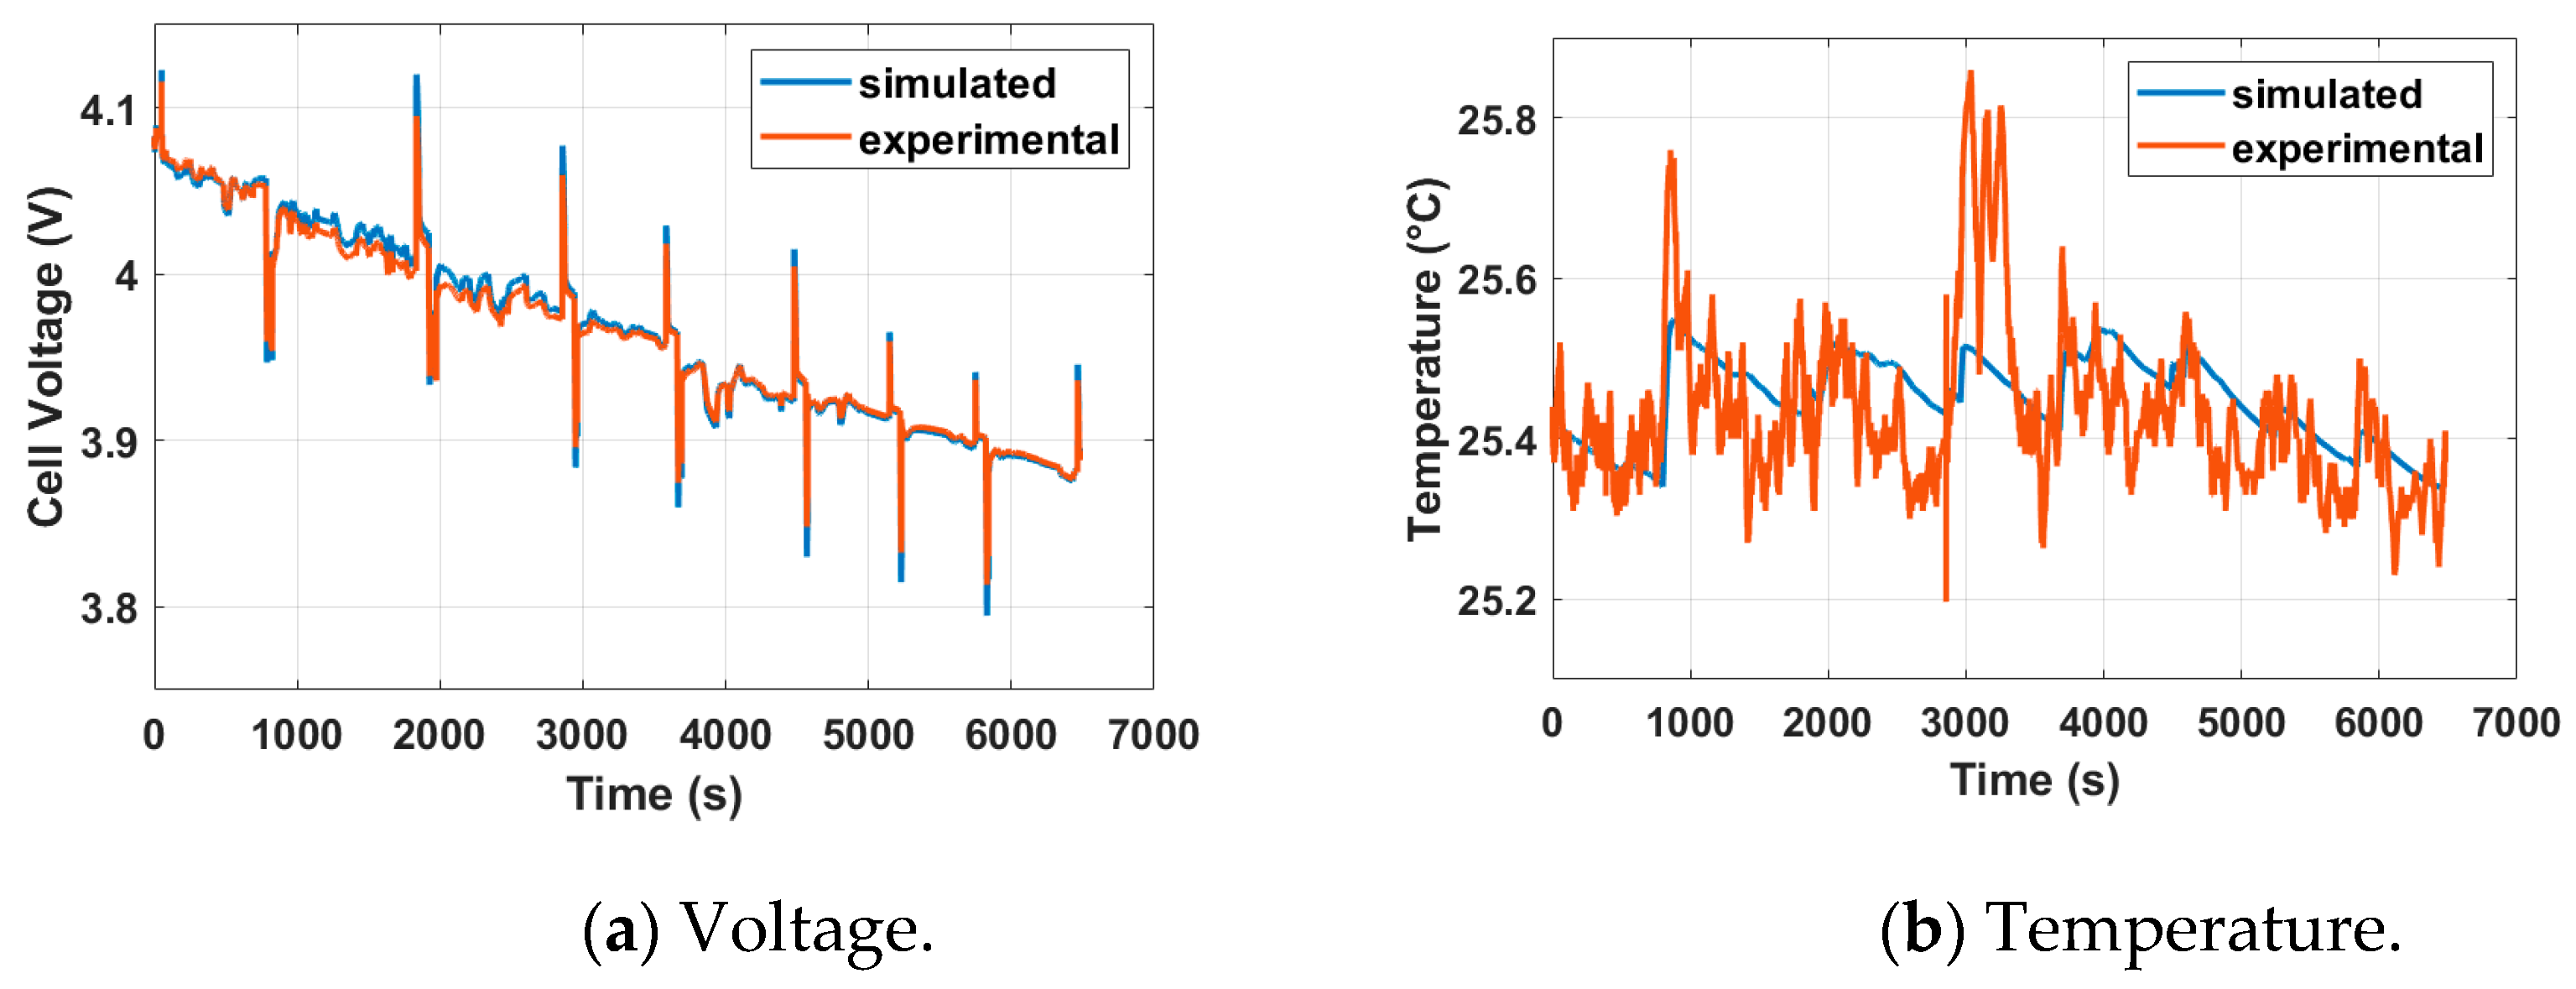
  • Application of a Scaled Railway Mission Profile and Validation: A scaled mission profile of the BEMU train is applied to both the tested and simulated cells. A comparison between the experimental and simulated responses of the cell is used to further validate the identified model.

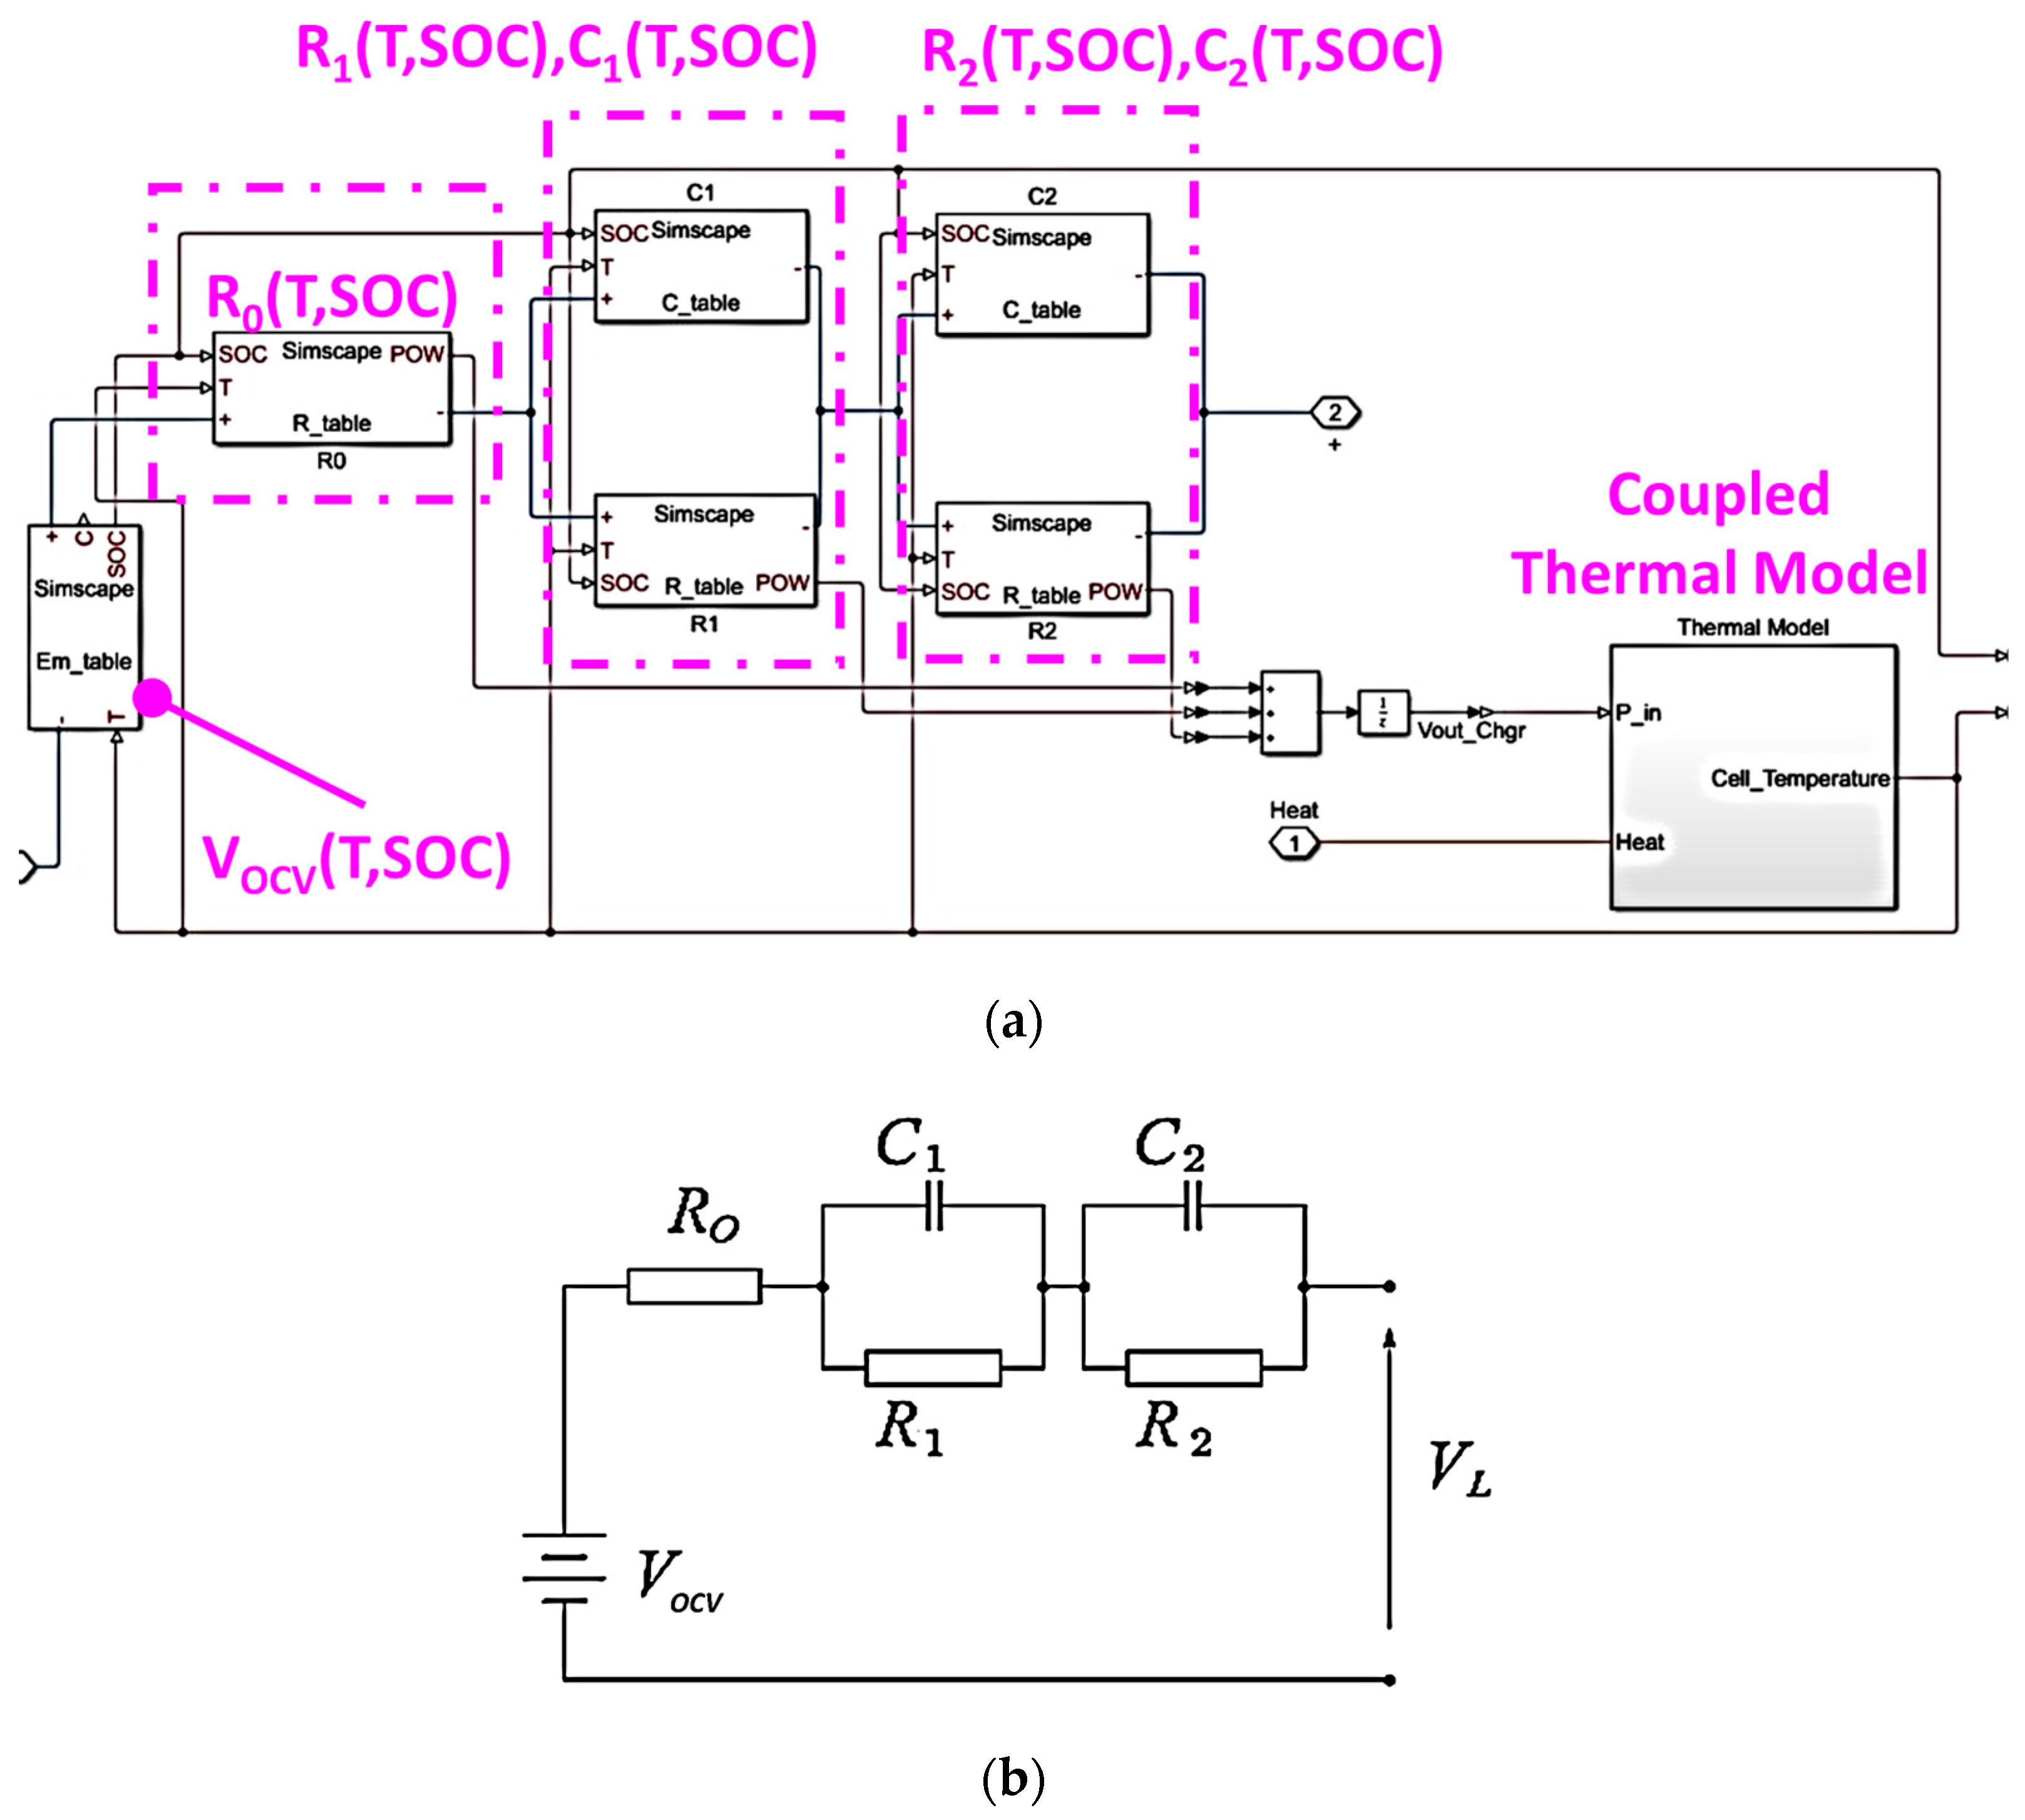
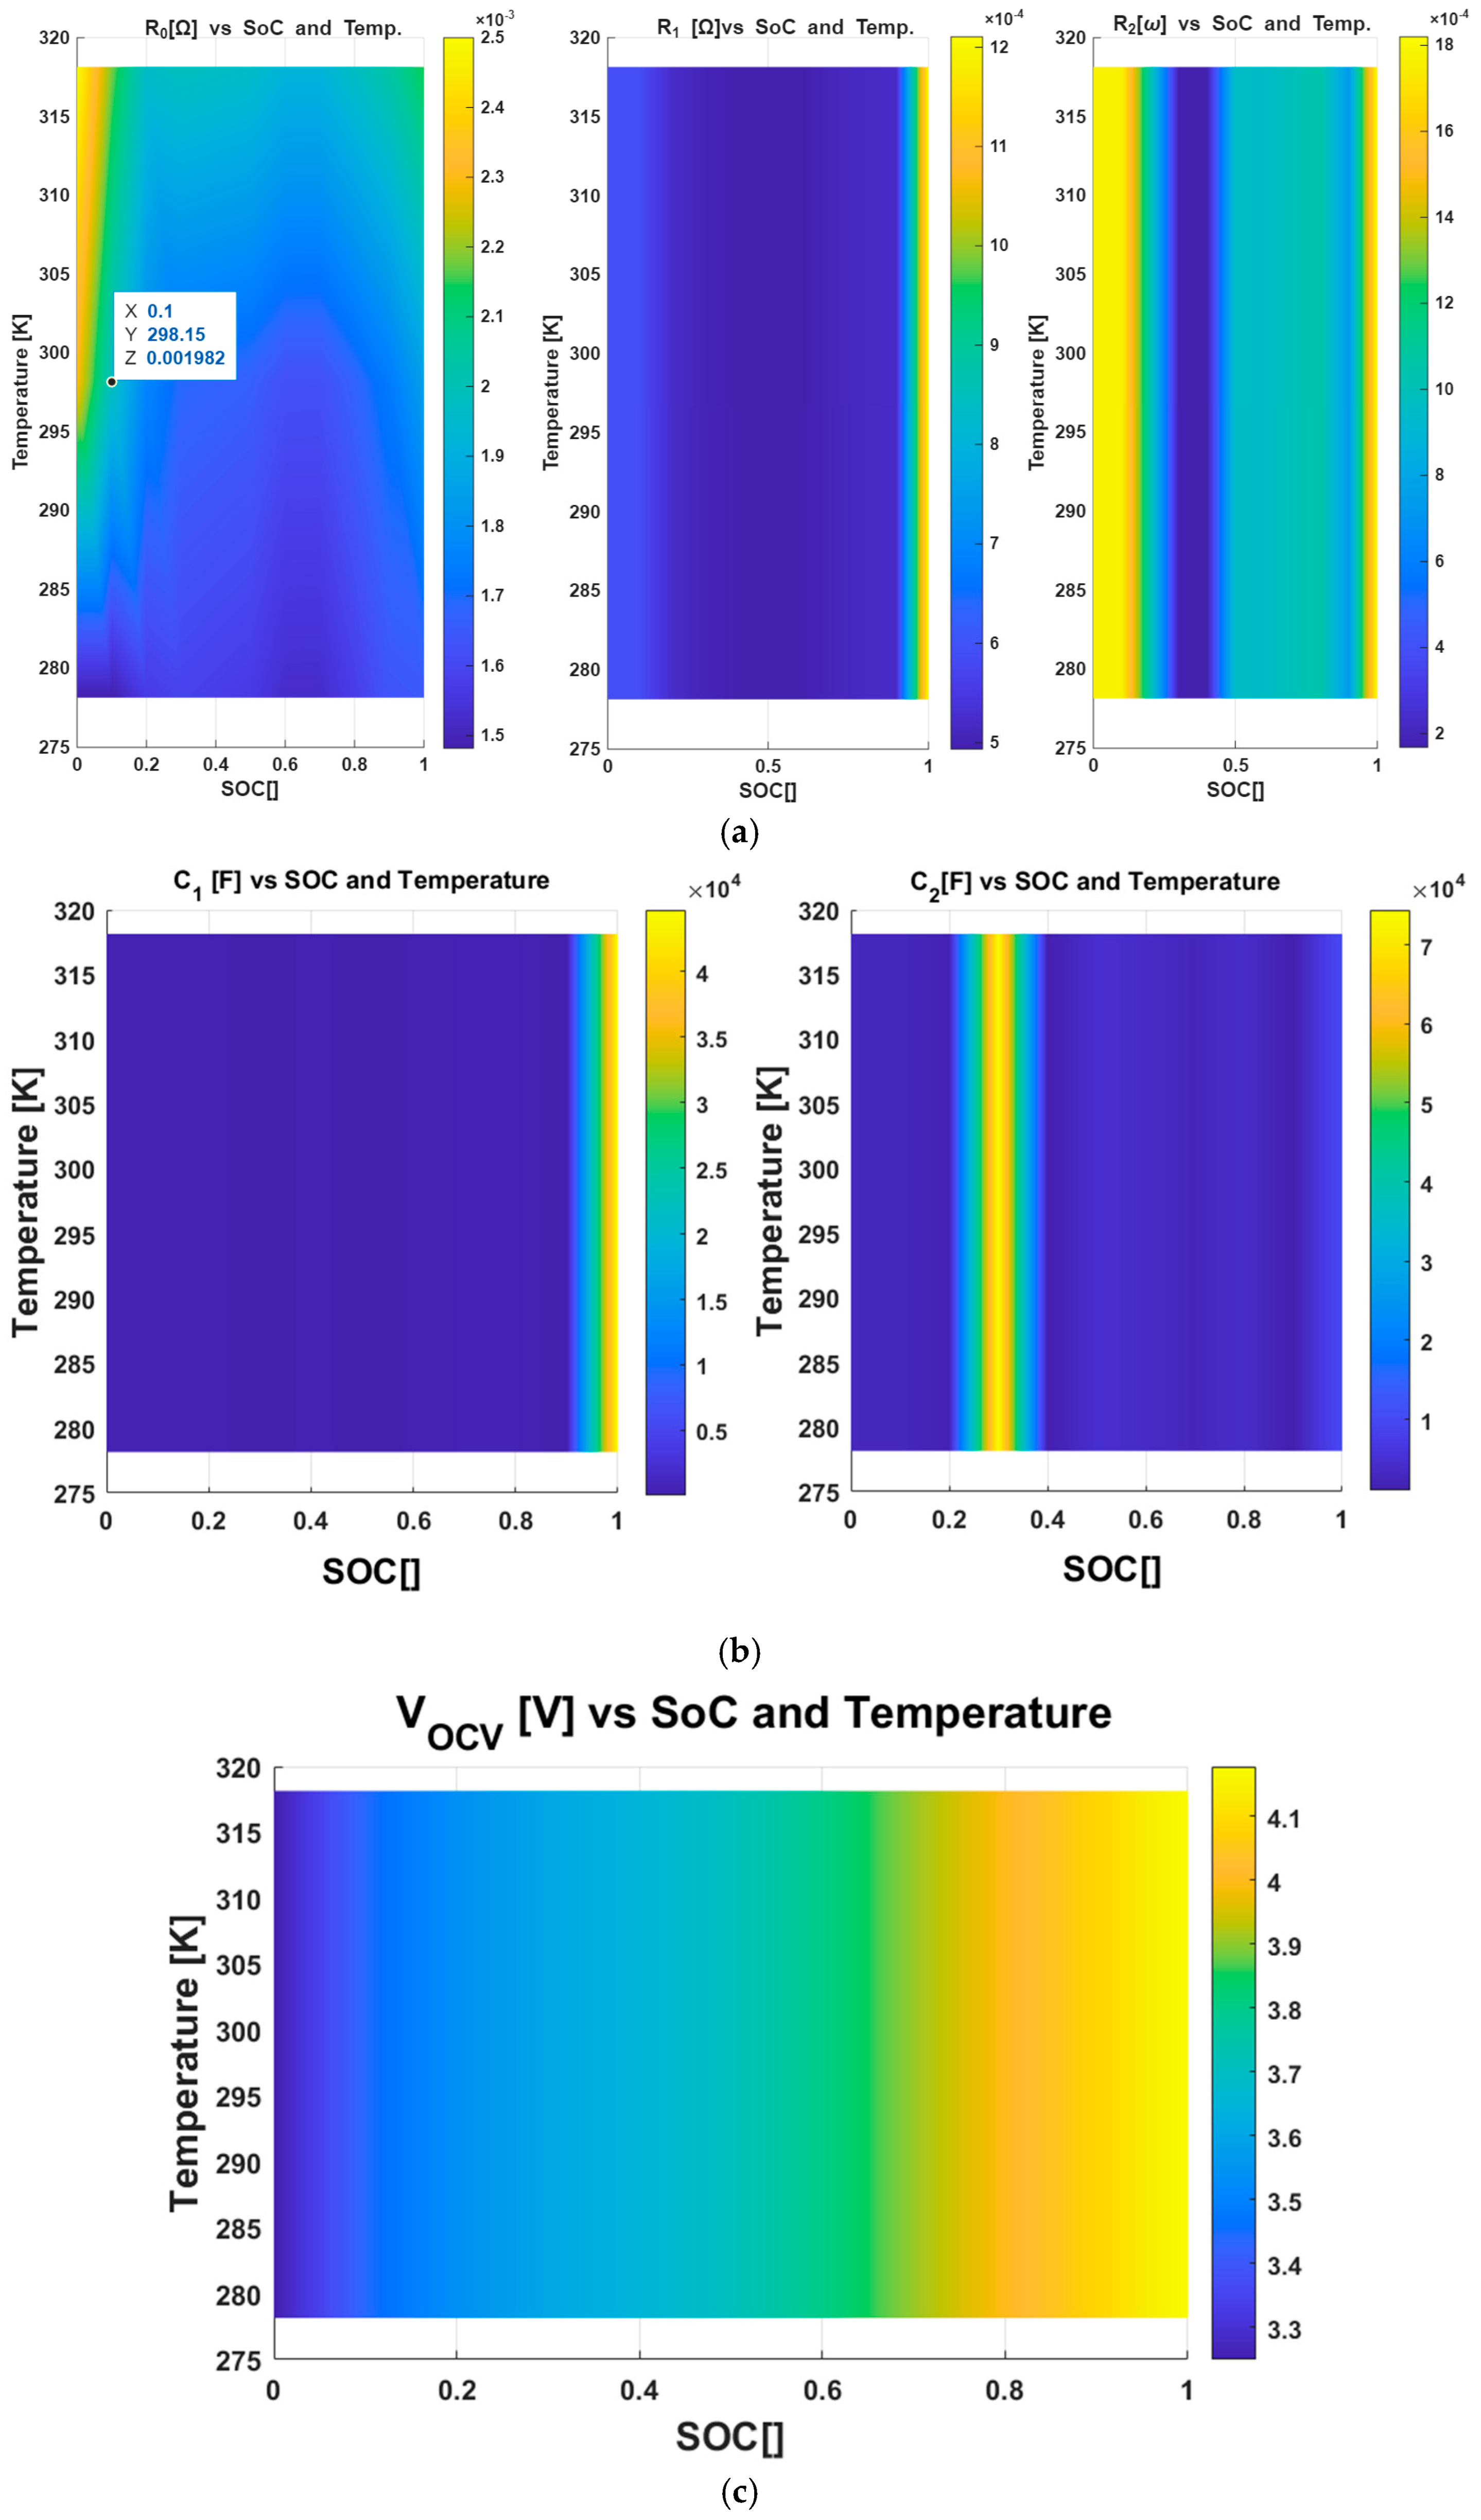
2. Cell Identification with a Lumped Thermal–Electric Model

After some preliminary testing cycles in which the cell is preconditioned/stabilized, the cell’s capacity is fully measured. The benchmark test cell is subjected to the HPPC (hybrid pulse power characterization) cycle, which is briefly described in Table 3 [17,18,19]. Instrumentation was used to perform the test, and the experimental results are shown in Figure 1a,b.
Impulses applied at different SOC levels and temperatures are used to identify the lumped parameters of the double RC model and implemented in Simulink, as shown in Figure 2a,b: All parameters of the lumped electric networks (open-circuit voltage VOCV; resistances R0, R1, and R2; and capacities C1 and C2 of the two RC poles) are tabulated with respect to the cell’s SOC and temperature. The cell’s temperature T is evaluated with a lumped Simcape thermal model, as shown in Figure 3, which reproduces the following thermal balance Equation (1)
m c e l l c p d T d t = ( R 0 I 0 2 + R 1 I 1 2 + R 2 I 2 2 ) h c o n v A c e l l T T a m b
where the following symbols are adopted:
  • Ri and Ii are the i-th resistances and corresponding currents, respectively;
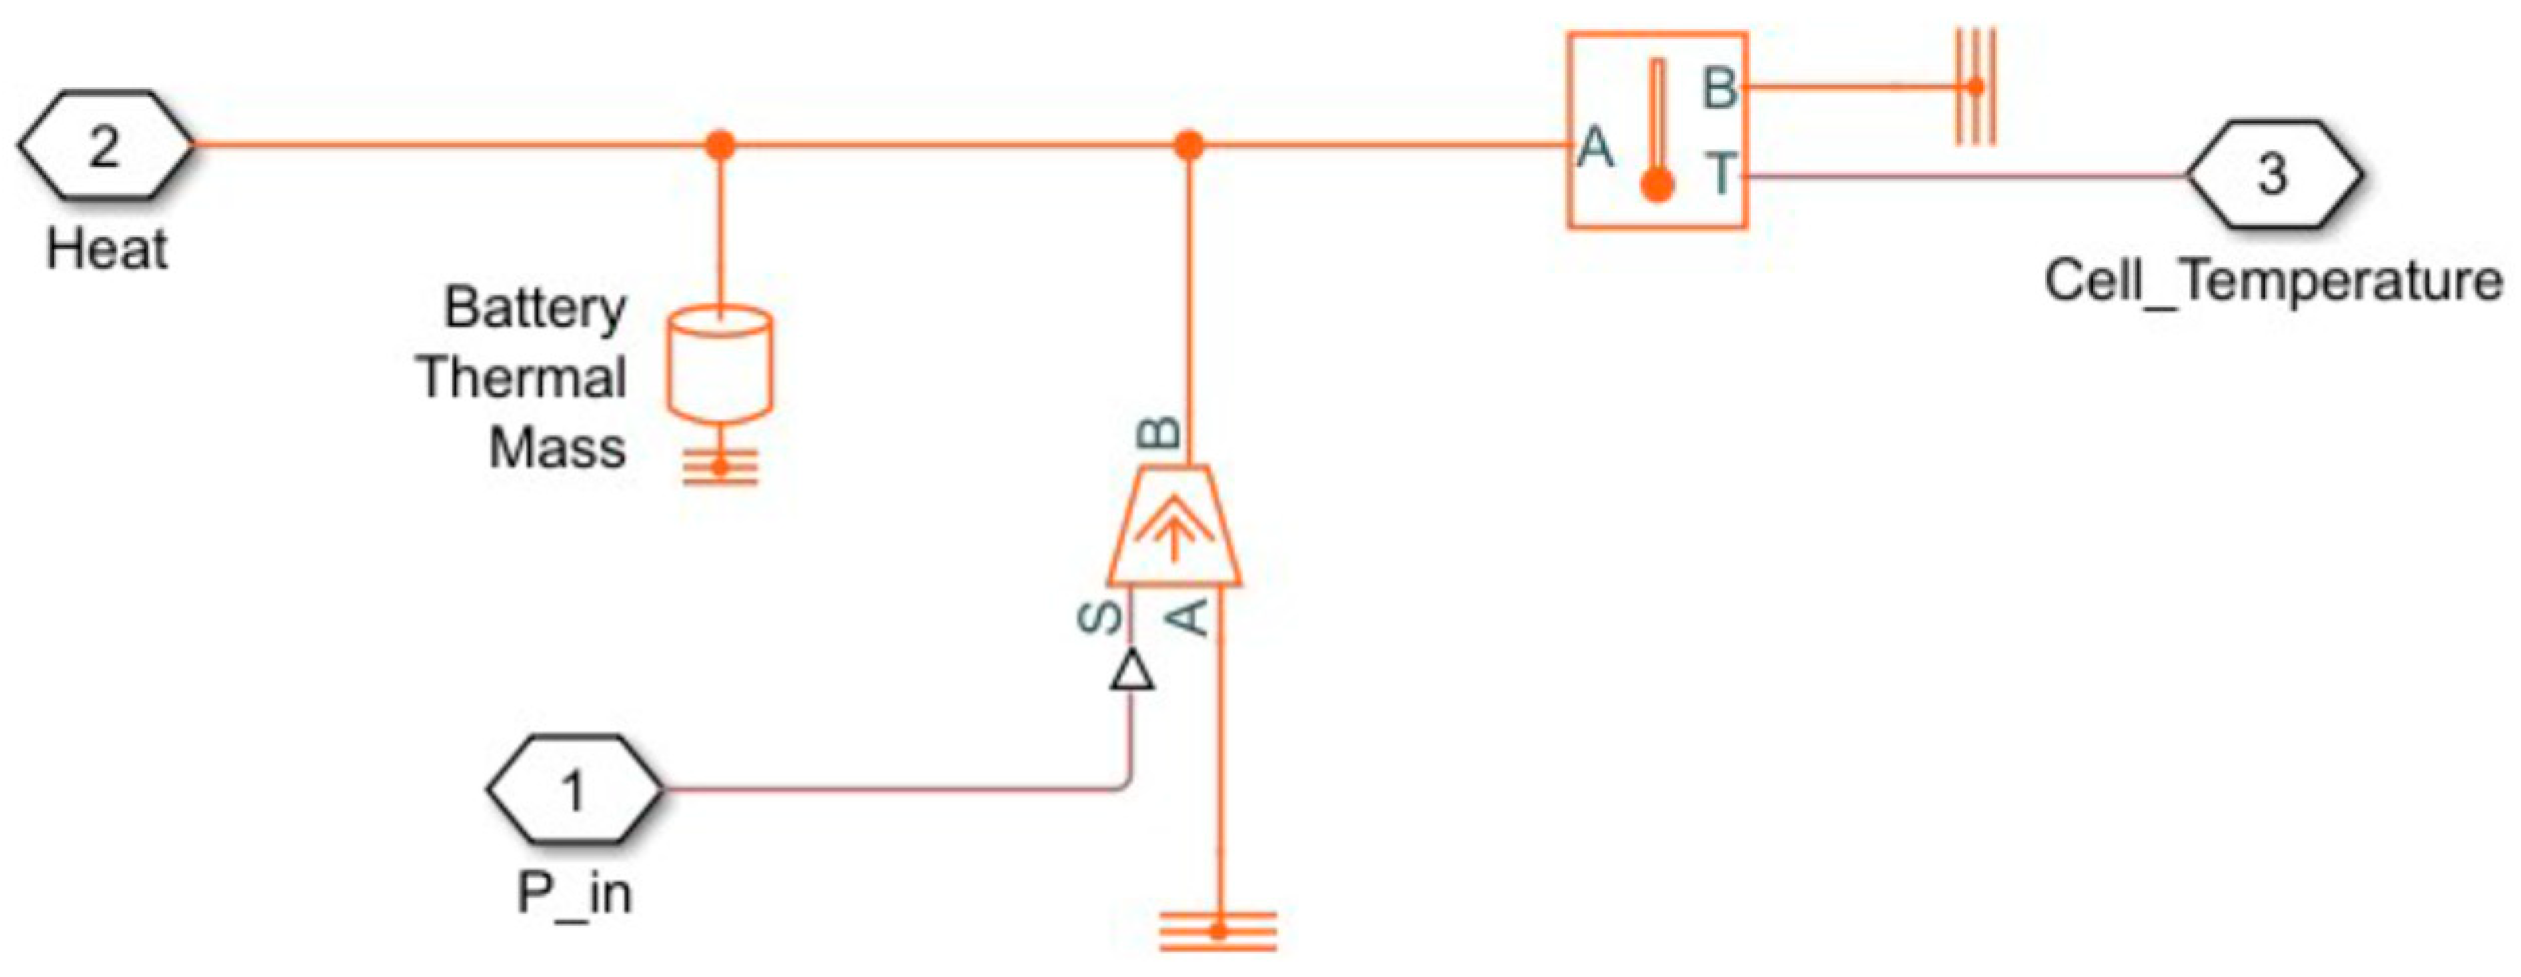
  • T and Tamb are the temperatures of the cell and the surrounding environment;
  • mcell, cp, hconv, and Acell are thermal parameters of the cell (mass, mean specific heat, thermal exchange coefficient, and corresponding surface).
From the experimental results, the parameters are identified using a least-squares Levenberg–Marquardt [20] fitting procedure by iterating the investigated parameter with respect to the measured outputs: cell temperature T and voltage temperature V.
The identified thermal parameters are shown in Table 4, while the tabulated values of Ri(SOC, T), Ci(SOC, T), and VOCV(SOC, T) are shown in Figure 4a–c. Concerning the fitting of the electrical lumped model, a further validation was obtained by comparing the results of EIS performed with Hioki BT4560 to the corresponding impedance behavior obtained by calibrating the parameters with HPPC tests in the time domain. The results, as shown in Figure 5, provide clear evidence of good model fitting, at least in terms of the cross-validation results from tests conducted in both the time and frequency domains.

3. SIL Testing of a Simulated BMS

We implemented a simplified model of a BMS (battery management system) capable of implementing the following features:
  • Safety and Protection: Protection against the maximum current according to the cell’s state is implemented. Allowable currents are estimated from the SOC and temperature measurements through tabulated functions. The voltage and temperature of cells are also monitored.
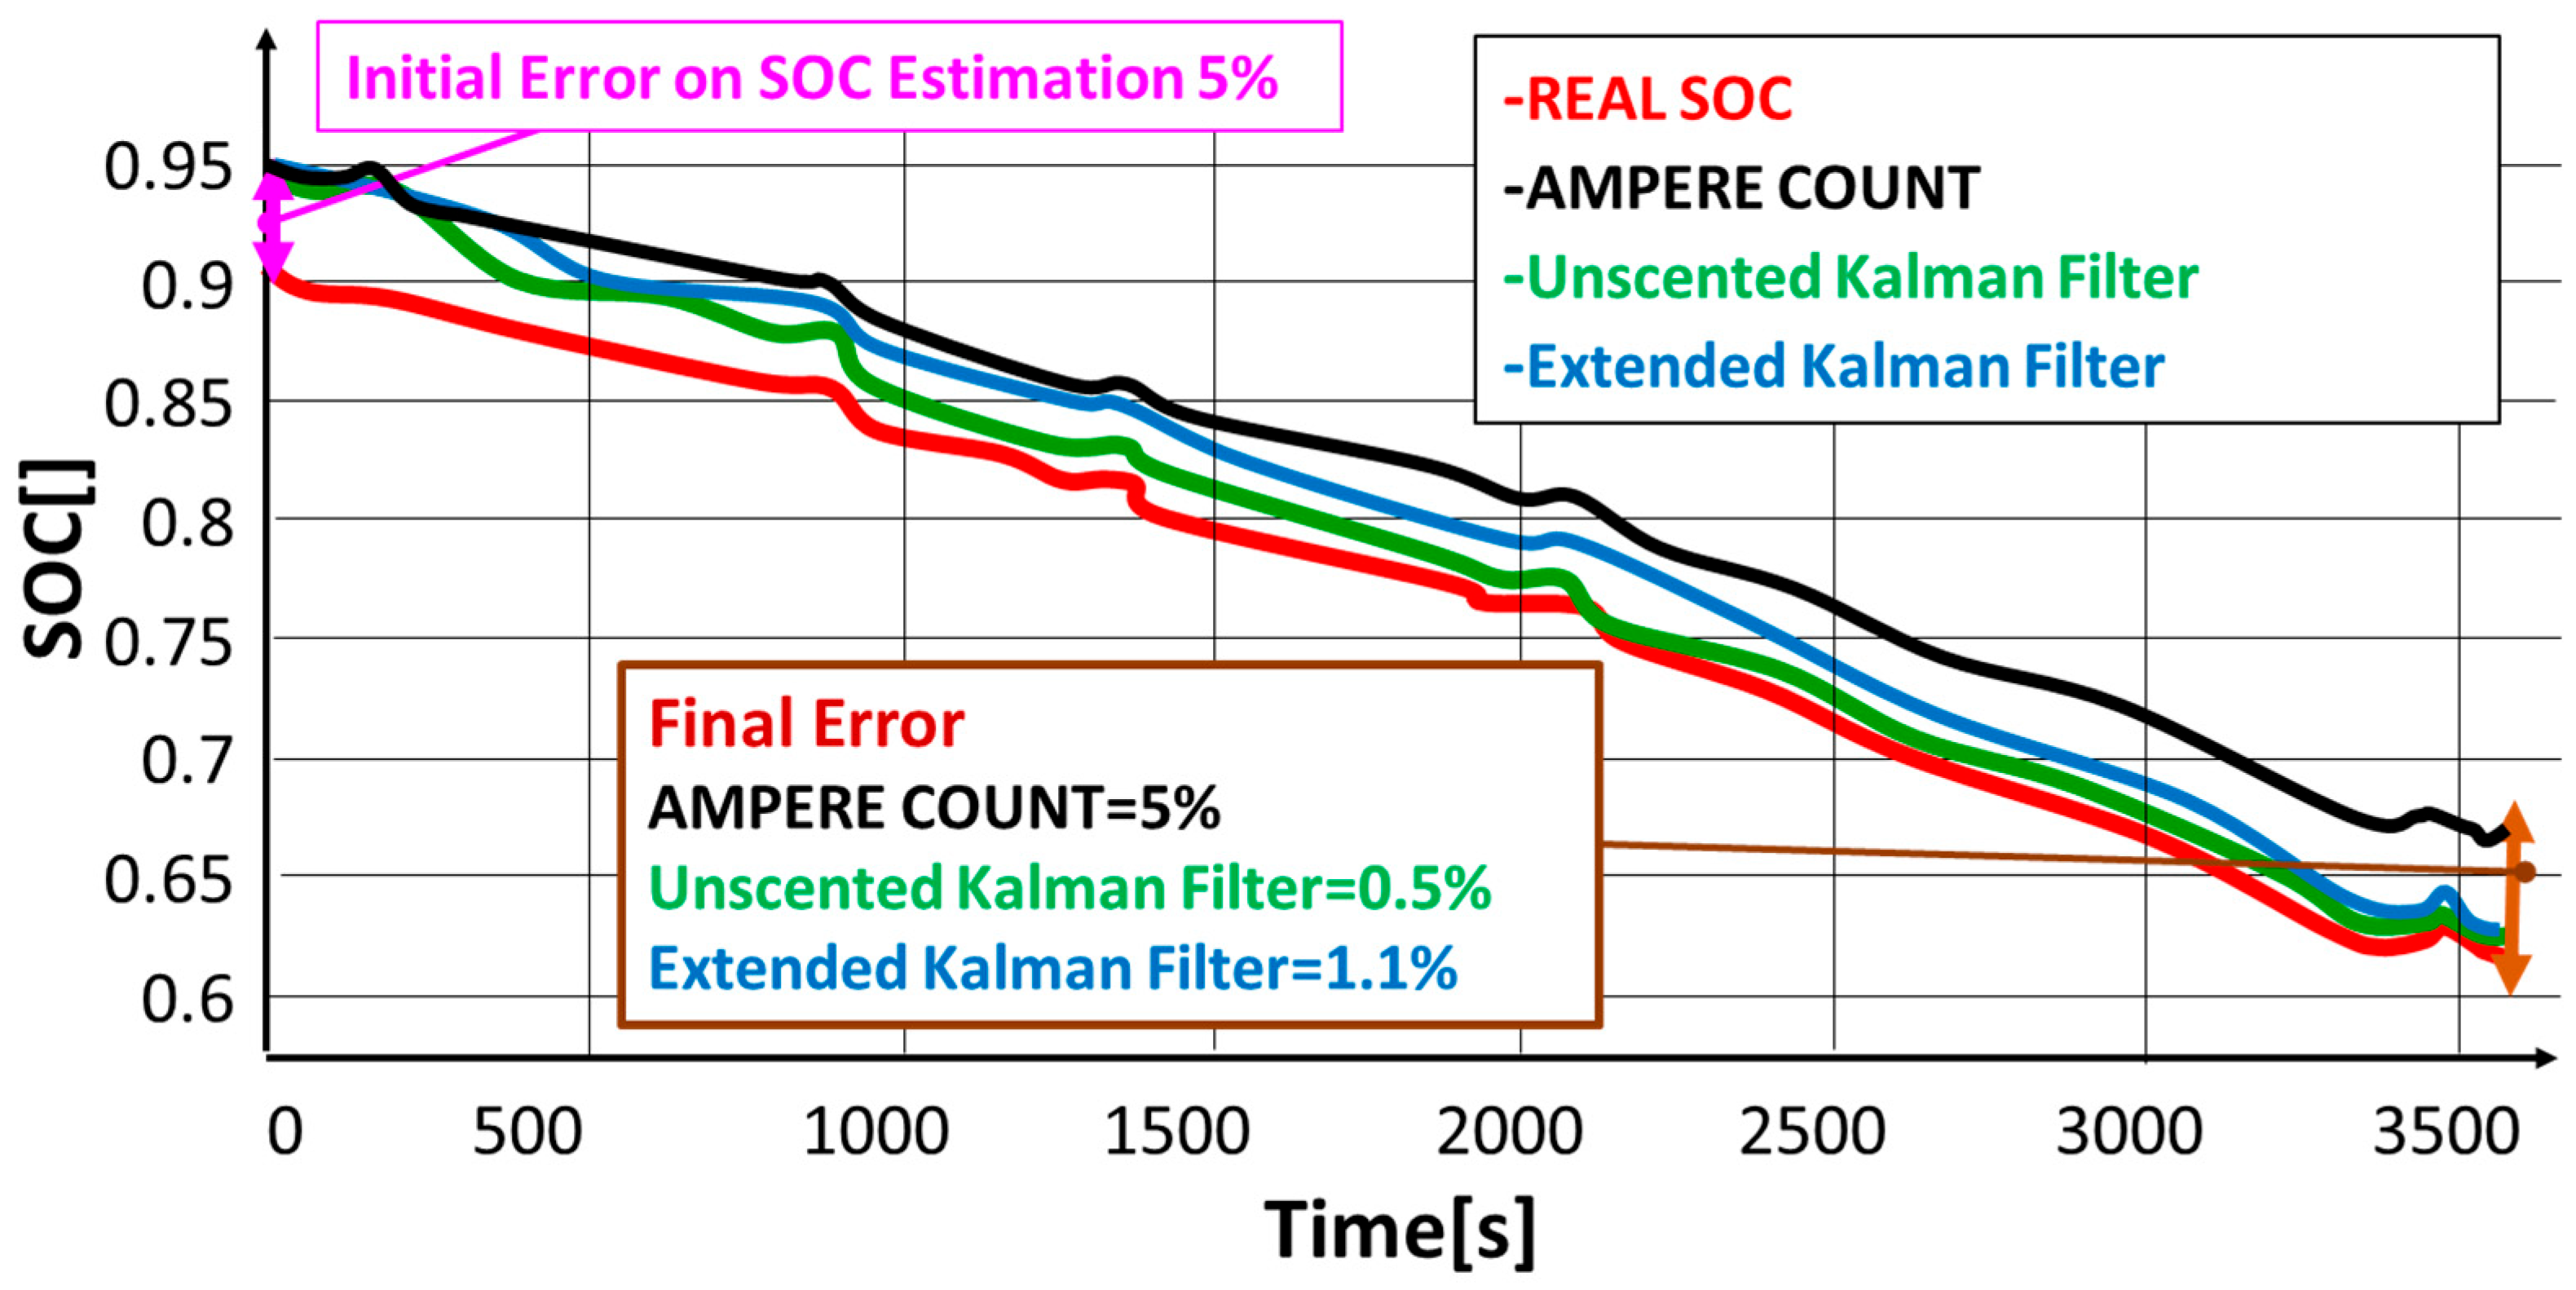
  • SOC Estimation: Battery state function (2) is assumed, where the modeled states are the battery’s SOC and the voltage differences measured across two RC groups, V1 and V2 (2):
S O C k + 1 = S O C k I k d t 3600 E b a t ; V 1 , k + 1 = V 1 , k + I k V 1 , k R 1 S O C k , T k C 1 S O C k , T k d t ; V 2 , k + 1 = V 2 , k + I k V 2 , k R 2 S O C k , T k C 2 S O C k , T k d t ;
In Equation (2), the symbol Ebat represents the battery total capacity (energy), while dt is the sampling interval. As battery parameters were identified with laboratory testing, they are tabulated as functions of SOC and temperature T. The corresponding battery measurement function is described by Equation (3).
V ( k ) = V O S O C k , T k I k R 0 S O C k , T k V 1 , k V 2 , k
Both the measurement and model can be processed with different implementations of the Kalman Filter, such as the extended or unscented filters, which substantially differ in terms of computational loads and their ability to model the nonlinear behavior of systems. Further considerations should be carried out, verifying the convergence and robustness of filters with respect to a perturbed initialization, as shown in Figure 6: Different SOC estimators are implemented by considering an initial error/offset estimation of 5%. To emphasize robustness, both EKF and UKF are compared with a rough Coulomb count estimator, in which the DOD (degree of discharge) is directly calculated according to Equation (4) as the integral of the ratio between the measured current I and cell/capacity Ebat.
D O D ( t ) = D O D ( 0 ) + 0 t I E b a t d t S O C ( t ) = 1 D O D ( t )
Both EKF and UKF are able to reject this initial estimation offset, which cannot be rejected using the simplified estimator (4). After approximately an hour, both estimators have considerably rejected the error, with the UKF being more precise. Moreover, from a computational point of view, the EKF also exhibits more stable behavior during the first 5–10 min, with smoother initial convergence. Differences between different Kalman implementations are modest; thus, after testing the lighter version of the Kalman filter (EKF), a reasonable compromise between performance and required resources should be reached.
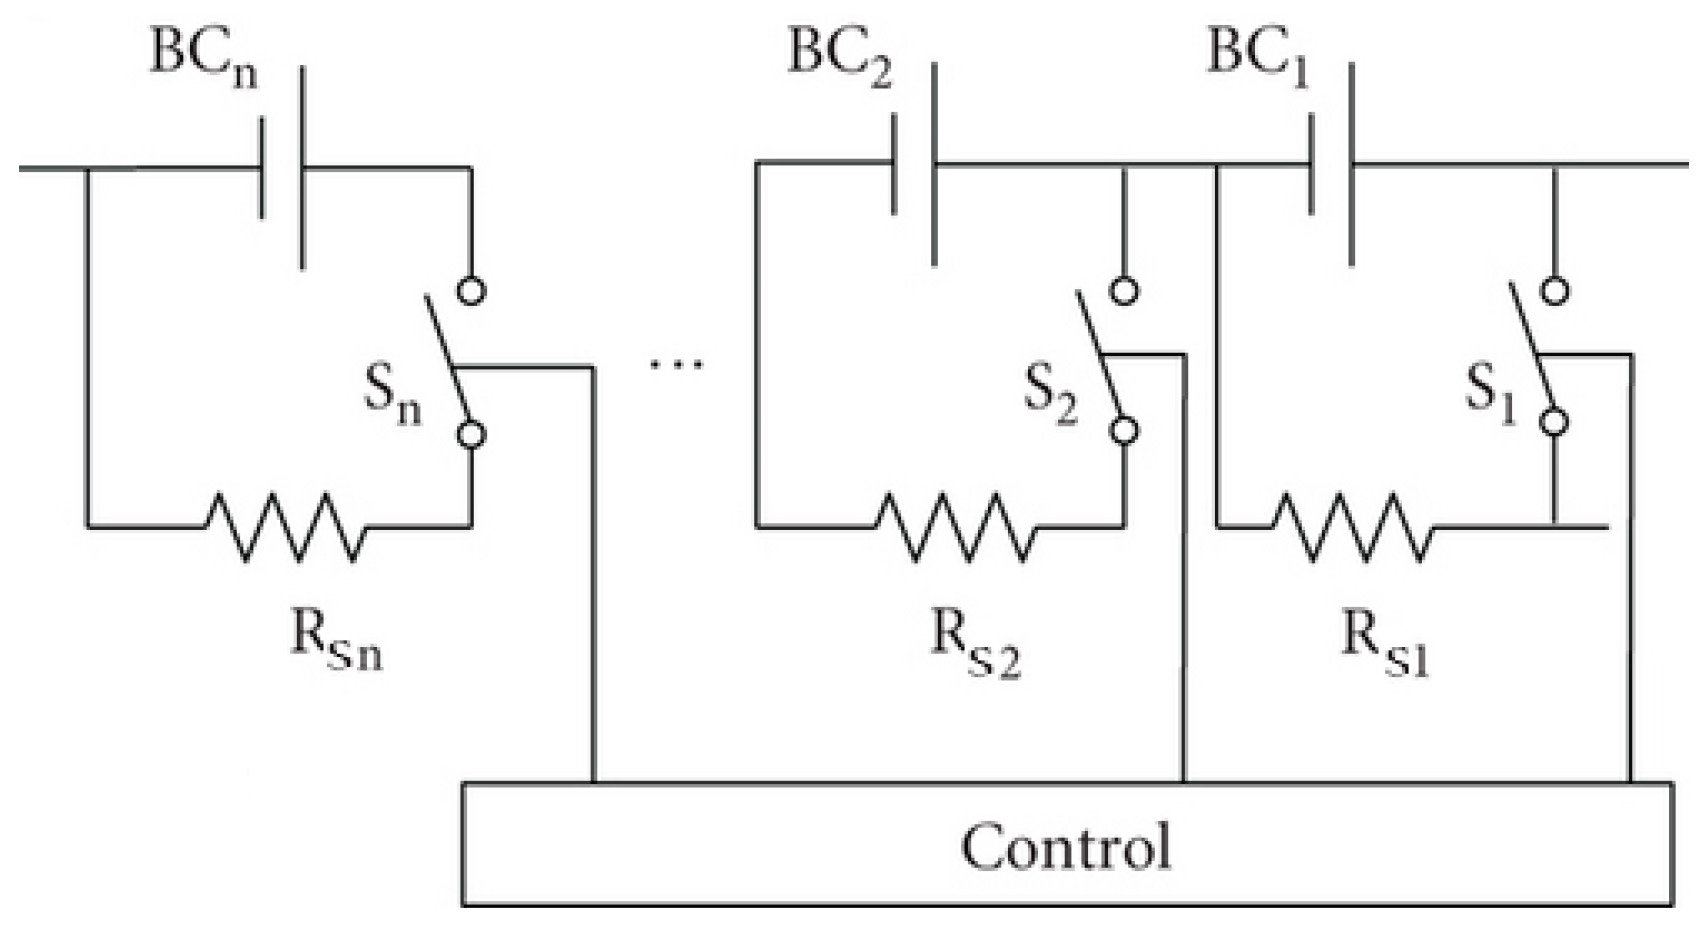
  • Cell Balancing: Differential aging and natural construction tolerance result in cell unbalancing [21]. For this reason, the BMS is often integrated with a balancing circuit that can be used actively or passively to restore the system. In this study, a model of a passive resistive balancing circuit, taken from the authors of [22], is implemented. The cells are balanced through commutated shunt resistors according to the circuit scheme described in Figure 7. When balancing is activated, the connected cells (Figure 6) are discharged on passive resistors (Rsi) that are connected or disconnected, acting on the controlled relay/contact Si. The activation logic is relatively simple: During balancing, the maximum voltage of a cell, Vcell_ref (lower than 4.2 [V]), is defined, and if this threshold is exceeded, the cell is shunted and discharged by the corresponding resistor. To avoid excessive chattering with respect to the controlled contact, hysteresis (of about 0.02 [V]) is introduced in the commutation logic.
The simulated BMS is implemented in Matlab-Simulink™ 2024b and executed in an RT target (dSPACE MicroLabBox™) to perform the SIL simulation represented in the scheme shown in Figure 8: The BMS is implemented as a discrete task, and it is operated at a reasonable frequency (minimum sampling freq. of 10 Hz) and interacts with the controlled battery module’s model, which is composed (simplified example) of six cells in series. Because the battery model implements the simulation of a continuous system, the implemented integration is performed at a substantially higher frequency (min integration freq. from 100 Hz to 1 kHz).
In Figure 9a,b, the results are shown. Unbalanced cells are discharged, and balancing is then activated. The cells converge to the same reference voltage level; finally, the entire battery is recharged, but the system is now balanced; thus, the voltage value of each cell is identical to that of the others.
In Figure 9b, the corresponding switching command Si is shown: It is interesting that once balancing is activated, intense activity is carried out. Moreover, during the final stage of the recharging phase, further actions are performed.
However, the most important result of the entire activity is the fact that the EMBEDDED version of the BMS is in operation; thus, this intermediate result proves that activity can be continued, and the possibility of implementing an HIL (hardware-in-the-loop) test as the next step can be considered, in which the virtualized BMS will drive the shunt resistors of a real battery pack.

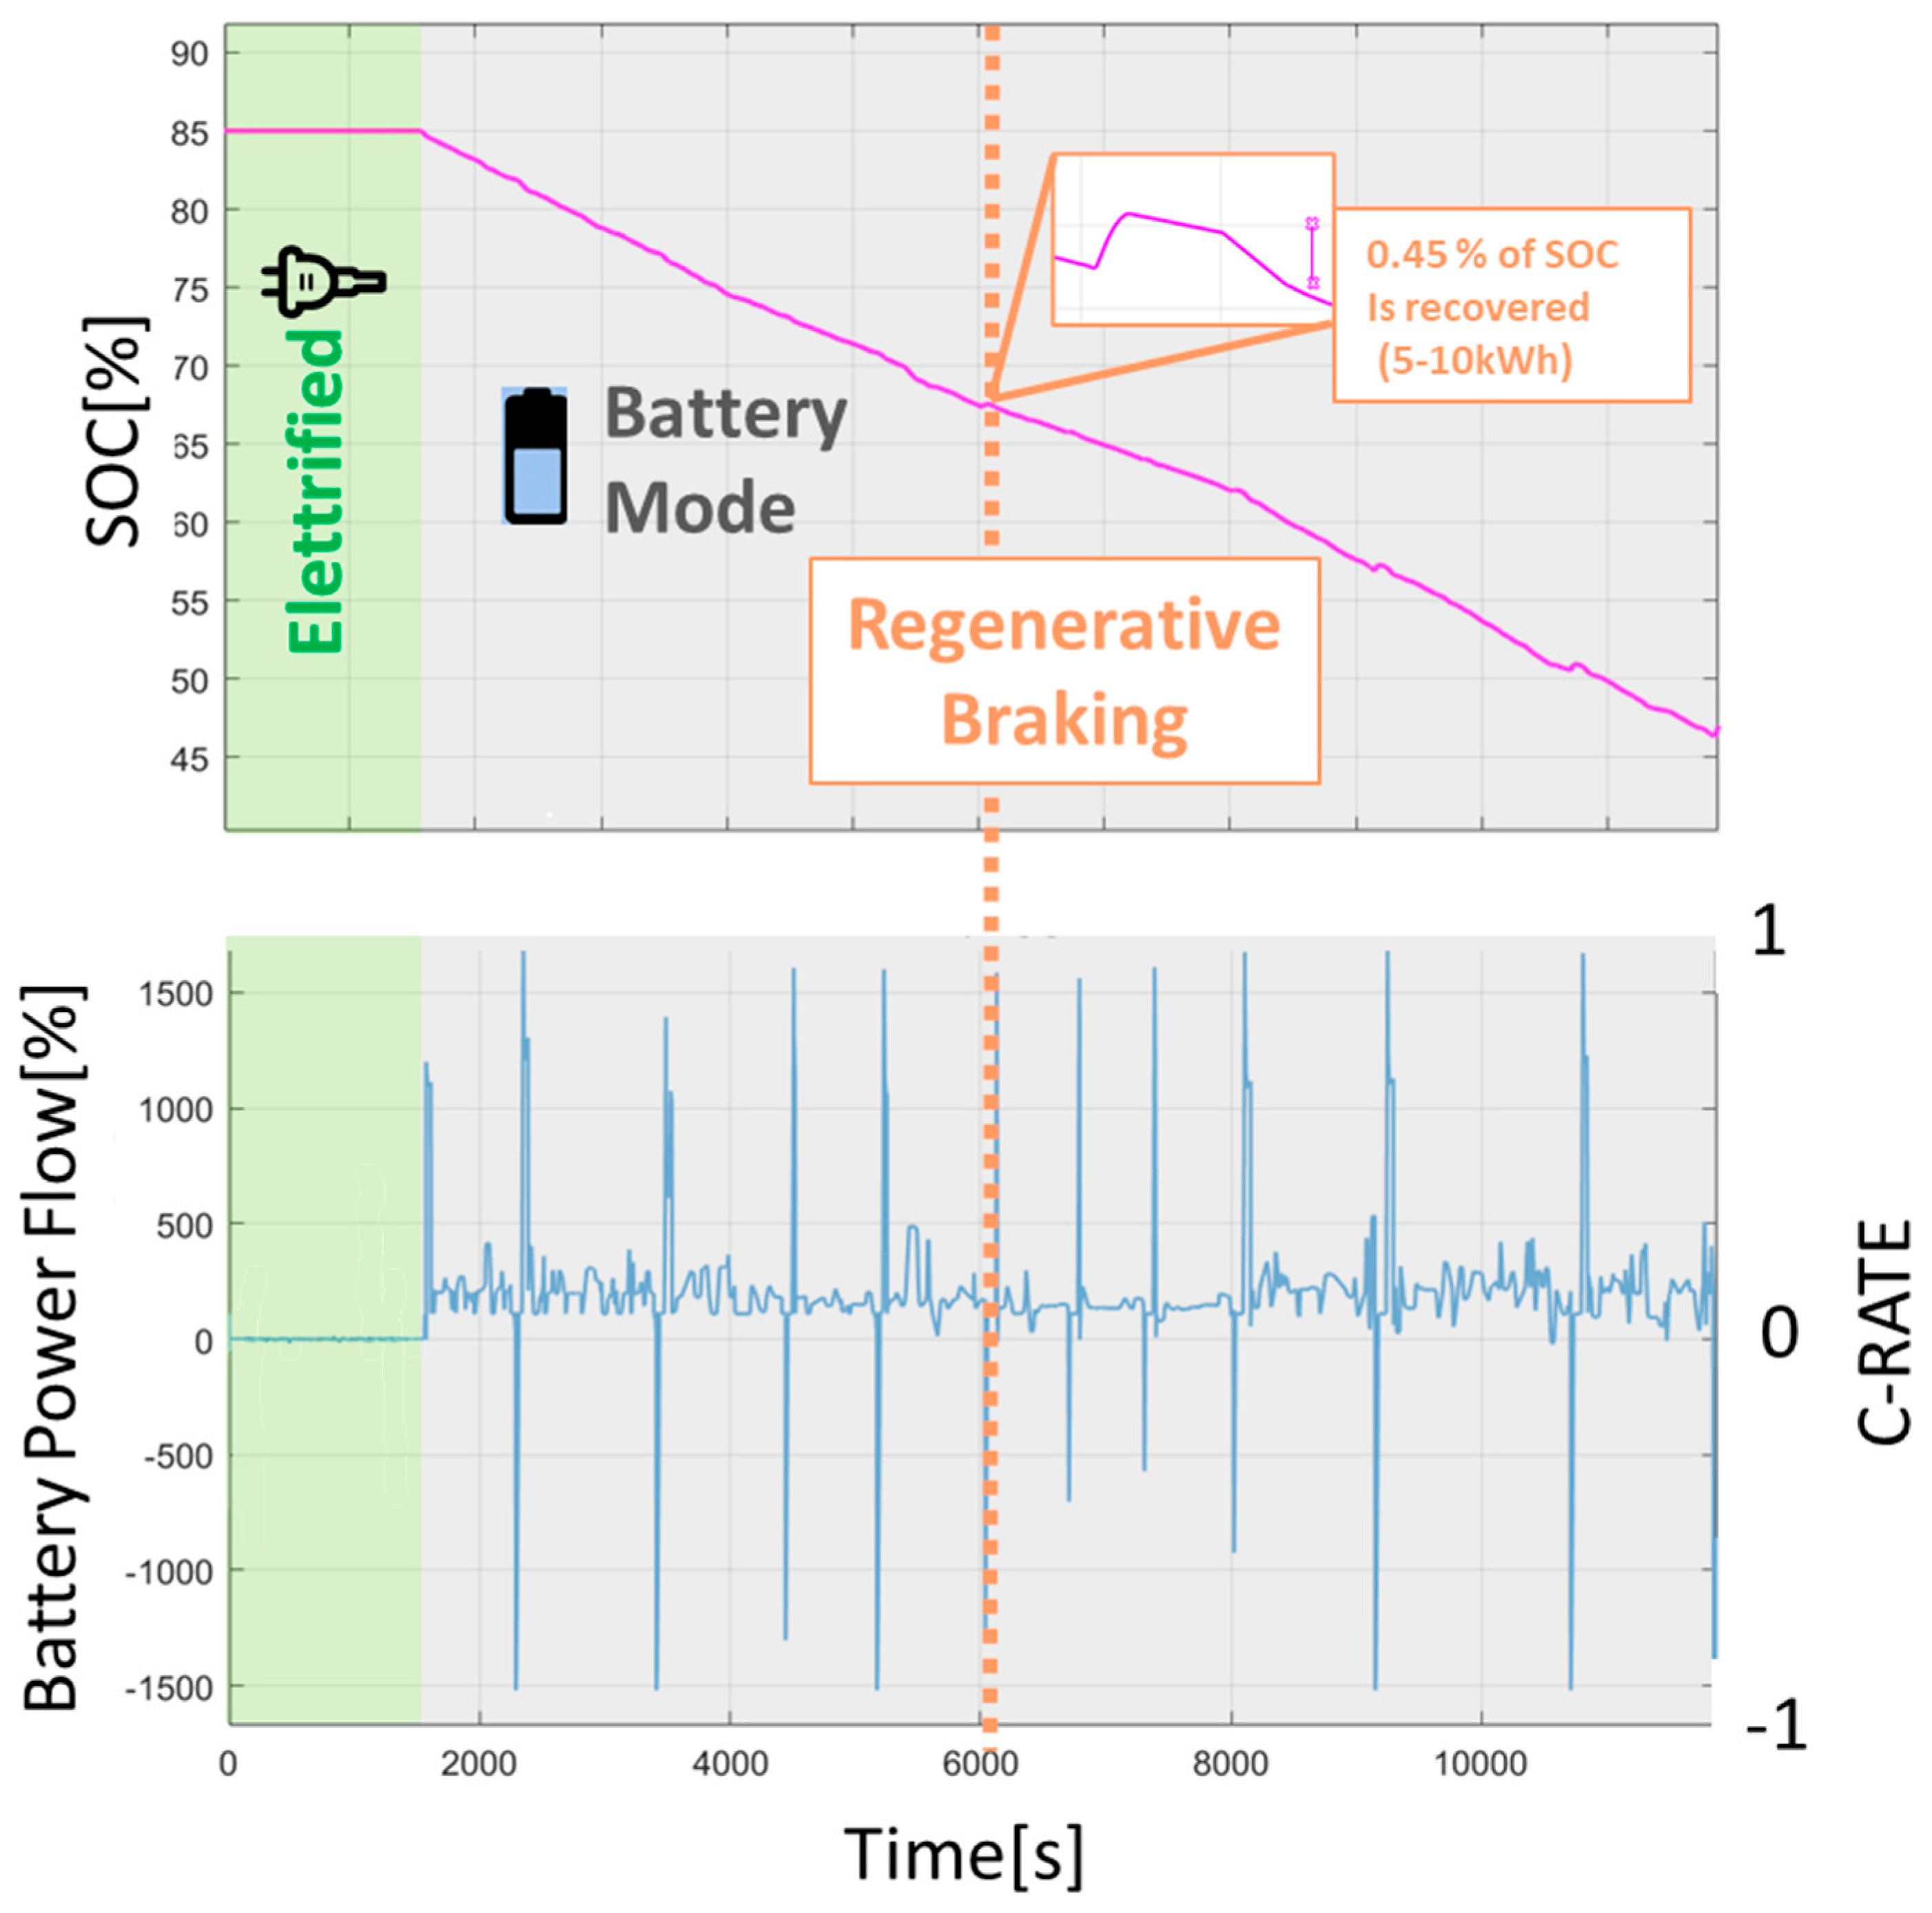
4. Application of a Scaled Railway Mission Profile and Validation

In a previous research study [23], the authors of developed a modular model of a BEMU (battery electric multiple unit) train inspired by an existing product: the Masaccio Blues train developed by Hitachi-Rail. This product was developed as a general-purpose platform for the industrial development of hybrid and battery-operated trains, and it was featured in various presentations and events [12,13,14]. Moreover, the authors took advantage of the extensive information available on the Masaccio Blues train to propose and investigate different hybrid or battery-operated solutions as customizations of this widely studied platform. These prior studies also guided our study, including a hybrid fuel cell solution [3], a battery-operated solution optimized for operation on different railway lines and a comparative analysis of the expected performances of different battery chemistries and pack designs. In all these previous studies [24], the authors mainly used data concerning batteries from external datasets; moreover, the accumulators were taken from the literature. However, the results of these studies have clearly demonstrated how designs can not only be strongly influenced by the lumped electrical parameters of batteries but also by their expected thermal behavior.
In this section, the model of a battery-operated train is used to produce a detailed mission profile of the train in terms of the required power that is applied to the cell model described in Figure 2. Data concerning the simulated line (Catanzaro Lido-Reggio C.) and the benchmark rolling stock and mission profile are shown in Figure 10.
The simulation results in terms of the simulated voltage cell and the temperature of a cell are compared and validated using corresponding measurements performed on a tested cell subjected to the same load. The resulting validation procedure is summarized in Figure 11.

Sizing of Battery Pack and Generation of the Scaled Test Profile

To produce a scaled loading profile for the investigated cell, a preliminary sizing of the battery pack must be assumed. We have assumed the substitution of an LTO battery pack that is currently installed on trains with an alternative LiNMC pack that possesses the same volume as the LTO pack. For the design of the LiNMC battery pack, the assumed benchmark cells are shown in Table 2.
Because the densities of LTO and LiNMC are not the same, the assumptions resulted in a few differences in terms of weight, which is tolerable considering the preliminary level of this study (load variations on rail axles of about 1–2%). The resulting battery pack, for which its features are shown in Table 5, should be organized into smaller or larger modules (for example, Battery 1 and Battery 2 in Table 5); however, the total number of cells should be the same (2304), with a total installed power of about 1.65 MWh. Concerning the battery voltage, the pack is intended to be designed with approximately the same voltage level as the original LTO pack (about 710 V) in order to minimize the impact on connected power electronics.
This choice allows us to suppose that the size and efficiency of the connected power electronics are almost identical, simplifying both the simulation and the possible development of the proposed solution.
The battery power demand is calculated from the mission profile of Figure 10; an example (route from Reggio C. to Catanzaro Lido) is shown in Figure 12. It is interesting to observe that regenerative braking is highly exploited (about 0.5% of the SOC is recovered when the train stops at a station). The maximum charge and discharge rates to which the battery is subjected are quite similar; thus, it can be concluded that regenerative braking contributes to both energy saving and aging in a significant manner.
The mission profile in terms of power demand for the entire battery, Wbattery, can be scaled to an equivalent power profile for a single cell, Wcell, by obtaining the total number of cells Nc employed in the battery. If this power profile Wcell is divided by the voltage of the cell Vcell, the corresponding current profile Icell of the cell can be calculated (5).
W c e l l = W b a t t e r y t N c I c e l l = W c e l l t V c e l l ( S O C , T )
As shown in Figure 13, strong agreement is observed, particularly for the voltage, where the simulation closely follows the experimental trend. Although the temperature prediction shows slightly lower accuracy, it is important to highlight that the temperature variations are relatively small in absolute terms, rendering the observed discrepancies acceptable.
Table 6 summarizes the model’s performance in terms of accuracy across both metrics. The minor deviations between simulation and experimental results can be attributed to unmodeled secondary effects and instrumental tolerances in temperature measurements. Nevertheless, these differences are limited and do not compromise the model’s validity.
To quantitatively support this assessment, Table 6 reports the root mean square error (RMSE), percentage RMSE, and maximum deviation for both voltage and temperature. All error metrics fall within acceptable ranges for practical applications, confirming the model’s robustness and its capability to reliably capture the electrical and thermal behavior of the NMC cell.
Thus, it can be concluded that the performed identification procedure can also be used to simulate—in a realistic manner—the behavior of the cells installed on simulated BEMU trains.
The obtained results substantially confirm the good fit of the proposed model, which is validated with respect to a real mission profile. It is also clear that the proposed solution corresponds to a condition in which cells are poorly loaded; thus, further investigations would be highly valuable to determine whether low-cost commercial LiNMC cells can be feasibly employed, potentially accepting more frequent substitutions or maintenance activities.

5. Conclusions

In this study, we presented a set of tools developed in Matlab-Simulink in order to properly simulate an RT target storage system. The behavior of a single cell was identified in a rapid manner, assembling a battery model via BMS logic. Both tested and simulated cell models were compared and cross-validated on realistic mission profiles that are completely different from the HPPC tests used for cell identification and model calibration. The performed identification procedures should be robustly verified, at least for single cells. To improve the quality of the performed research, tests should be further extended to an entire module with a cooling system and inter-cell sheets in order to better identify fundamental aspects related to the exchange coefficients and capacities of various battery pack parts.
The fundamental innovative contributions of this study can be summarized as follows:
  • The proposed SIL-HIL testing procedure is innovative for the proposed railway application at the academic level, or at least in terms of the currently available literature.
  • Moreover, the application of scaled testing for both batteries and BMSs is relatively uncommon in railway applications.
  • The performed research is innovative not only in its proposed applications but also in the customizations that make the railway applications significantly different from conventional automotive or industrial applications—particularly in terms of required lifespan and thermal stability. These factors justify the applications of chemistries and technologies such as LTO cells, which are relatively uncommon with respect to more conventional and well-studied sectors. At the same time, the application of batteries and hybrid technologies to railway rolling stock has a wide potential impact, as outlined in the Introduction section of this study.
New tools, such as the Matlab-Simulink BatteryModelBuider™, offer the possibility of accelerating this process in a significant manner. We are currently working on this topic and hope to present further advancements beyond this work in the future.
In Figure 14, a brief scheme of the proposed workflow is shown: It is possible to define and assemble hierarchical battery models, starting from cells to assembled modules and packs. For each sub-model, it is possible to associate different electrical, thermal, and aging models that are automatically assembled in a single Simulink-Simscape™ model, which can be further integrated into more complex simulation tools. This tool is extremely useful for modeling large batteries, enabling the simulation of packs with hundreds or even thousands of cells. It allows for the introduction of varying cooling conditions between components, as the paths of cooling circuits and additional boundary conditions can be easily specified. In particular, this tool will be especially important for rapidly updating the thermal properties of models, taking into account different configurations.
Future research activities will also be focused on innovative modeling approaches that could be used to fit the experimental behavior of cells. In particular, we are interested in the application of transmission line models [25,26], which are expected to more accurately represent the behavior of porous electrodes.

Author Contributions

L.P., A.K. and A.S.: Methodology and experimental testing. N.T., A.S. and L.B.: Software. L.P. and A.K.: Writing. L.P. and M.D.: Funding acquisition, supervision, and project administration. All authors have read and agreed to the published version of the manuscript.

Funding

This study was carried out within the MOST—Sustainable Mobility National Research Center and received funding from the European Union Next-Generation EU (PIANO NAZIONALE DI RIPRESA E RESILIENZA (PNRR)—MISSIONE 4 COMPONENTE 2, INVESTIMENTO 1.4—D.D. 1033 17/06/2022, CN00000023). This manuscript only reflects the authors’ views and opinions; neither the European Union nor the European Commission can be considered responsible for them.

Data Availability Statement

The data presented in this study are available on request from the corresponding author due to an internal agreement between the authors.

Conflicts of Interest

The authors declare no conflicts of interest.

References

  1. Pugi, L.; Povolato, T.E.; Tiezzi, N. Simulation of Combined Aging Effects for Battery Operated Trains: A Benchmark Case Study on the Line Between Reggio Calabria and Catanzaro. Energies 2025, 18, 1143. [Google Scholar] [CrossRef]
  2. Cole, C.; Sun, Y.; Wu, Q.; Spiryagin, M. Exploring hydrogen fuel cell and battery freight locomotive options using train dynamics simulation. Proc. Inst. Mech. Eng. Part F J. Rail Rapid Transit 2024, 238, 310–321. [Google Scholar] [CrossRef]
  3. Pugi, L.; Berzi, L.; Spedicato, M.; Cirillo, F. Hydrogen for railways: Design and simulation of an industrial benchmark study. Int. J. Model. Identif. Control. 2023, 43, 43–53. [Google Scholar] [CrossRef]
  4. Fragiacomo, P.; Piraino, F.; Genovese, M.; Flaccomio Nardi Dei, L.; Donati, D.; Migliarese Caputi, M.V.; Borello, D. Sizing and Performance Analysis of Hydrogen- and Battery-Based Powertrains, Integrated into a Passenger Train for a Regional Track, Located in Calabria (Italy). Energies 2022, 15, 6004. [Google Scholar] [CrossRef]
  5. Vinnikov, D. Research, Design and Implementation of Auxiliary Power Supplies for the Light Rail Vehicles; Tallinn University of Technology Press: Tallin, Estonia, 2005. [Google Scholar]
  6. Fisher, I.; Bolton, G. Auxiliary power systems for rolling stock. In The 9th Institution of Engineering and Technology Professional Development Course on Electric Traction Systems; IET: London, UK, 2006; pp. 167–174. [Google Scholar]
  7. Ceraolo, M.; Lutzemberger, G.; Frilli, A.; Pugi, L. Regenerative braking in high speed railway applications: Analysis by different simulation tools. In Proceedings of the 2016 IEEE 16th International Conference on Environment and Electrical Engineering (EEEIC), Florence, Italy, 7–10 June 2016; p. 7555474. [Google Scholar] [CrossRef]
  8. Pugi, L.; Grasso, F.; Rossi, G. Energy Simulation of Tramway Systems, Simplified and Efficient Models. In Proceedings of the 2018 IEEE International Conference on Environment and Electrical Engineering and 2018 IEEE Industrial and Commercial Power Systems Europe (EEEIC/I&CPS Europe), Palermo, Italy, 12–15 June 2018; p. 8494431. [Google Scholar] [CrossRef]
  9. Domínguez, M.; Fernández-Cardador, A.; Fernández-Rodríguez, A.; Cucala, A.; Pecharromán, R.; Sánchez, P.U.; Cortázar, I.V. Review on the use of energy storage systems in railway applications. Renew. Sustain. Energy Rev. 2025, 207, 114904. [Google Scholar] [CrossRef]
  10. Vermeer, W.; Mouli, G.R.C.; Bauer, P. A comprehensive review on the characteristics and modeling of lithium-ion battery aging. IEEE Trans. Transp. Electrif. 2021, 8, 2205–2232. [Google Scholar] [CrossRef]
  11. Dubarry, M.; Qin, N.; Brooker, P. Calendar aging of commercial Li-ion cells of different chemistries—A review. Curr. Opin. Electrochem. 2018, 9, 106–113. [Google Scholar] [CrossRef]
  12. Vannucchi, A. Hitachi Rail STS SPA La piattaforma Masaccio di Hitachi Rail per la decarbonizzazione dei treni regionali, La Transizione Tecnologica Dalla Trazione Diesel Ai Nuovi Treni A Batteria E Idrogeno Mercoledì 29 settembre 2021. Webinar at Expo Ferroviaria Free Presentation. Available online: https://www.cifi.it/UplDocumenti/Milano29092021/04Vannucchi.pdf (accessed on 29 May 2025).
  13. Sacchi, M. Responsabile Hitachi Rail Italy—Piattaforma Rolling Stock Il Nuovo Treno Ibrido Per Trenitalia Caratteristiche Tecniche—Il Punto Di Vista Hitachi Rail Italy. In Proceedings of the Official CIFI Webinar, 21 April 2022; Available online: https://www.cifi.it/UplDocumenti/Firenze21042022/Il%20nuovo%20treno%20ibrido%20per%20Trenitalia.pdf (accessed on 29 May 2025).
  14. Caposciutti, M. Responsabile Trenitalia—Direzione Tecnica Il Nuovo Treno Ibrido Per Trenitalia Caratteristiche Tecniche—Il Punto Di Vista Trenitalia. In Proceedings of the Webinar, 21 April 2022; Available online: https://www.cifi.it/UplDocumenti/Firenze21042022/Presentazione%20Trenitalia.pdf (accessed on 29 May 2025).
  15. Ma, J. Battery Technologies: Materials and Components; John Wiley & Sons: Hoboken, NJ, USA, 2025; ISBN 978-3527830039. [Google Scholar]
  16. Kirby, W. Beard Linden’s Handbook of Batteries, 5th ed.; Mc Graw Hill: New York, NY, USA, 2019; ISBN 978-1260115925. [Google Scholar]
  17. IEC 62660-1:2010; Secondary Lithium-Ion Cells for the Propulsion of Electric Road Vehicles—Part 1: Performance Testing. International Electrotechnical Commission: Geneva, Switzerland, 2010.
  18. SAE J2464; Recommended Practice for Electric and Hybrid Vehicle Battery Test Procedures. SAE International: Warrendale, PA, USA, 2021.
  19. ISO 12405; Lithium-Ion Batteries for Propulsion of Electric Road Vehicles. International Organization for Standardization: Geneva, Switzerland, 2011.
  20. Madsen, K.; Nielsen, H.B.; Tingleff, O. Methods for Non-Linear Least Squares Problems, 2nd ed.; Technical University of Denmark: Copenhagen, Denmark, 2004. [Google Scholar]
  21. Molla, S.; Shawon; Nawaj, S.; Emon, A.E. Analysis of Aging Effect and Cell Balancing Problem of Lithium-Ion Battery. J. Electr. Electron. Eng. 2025, 13, 92–107. [Google Scholar] [CrossRef]
  22. Uzair, M.; Abbas, G.; Hosain, S. Characteristics of Battery Management Systems of Electric Vehicles with Consideration of the Active and Passive Cell Balancing Process. World Electr. Veh. J. 2021, 12, 120. [Google Scholar] [CrossRef]
  23. Pugi, L.; di Carlo, L. Multi-modal battery-operated trains on partially electrified lines: A case study on some regional lines in Italy. Proc. Inst. Mech. Eng. Part F J. Rail Rapid Transit 2024, 238, 873–885. [Google Scholar] [CrossRef]
  24. Locorotondo, E.; Lutzemberger, G.; Pugi, L. State-of-charge estimation based on model-adaptive Kalman filters. Proc. Inst. Mech. Eng. Part I J. Syst. Control. Eng. 2021, 235, 1272–1286. [Google Scholar] [CrossRef]
  25. Moškon, J.; Gaberšček, M. Transmission line models for evaluation of impedance response of insertion battery electrodes and cells. J. Power Sources Adv. 2021, 7, 100047. [Google Scholar] [CrossRef]
  26. Cruz-Manzo, S.; Greenwood, P. An impedance model based on a transmission line circuit and a frequency dispersion Warburg component for the study of EIS in Li-ion batteries. J. Electroanal. Chem. 2020, 871, 114305. [Google Scholar] [CrossRef]
Figure 1. (a) Laboratory testing device of Florence University; (b) results of the HPPC test.
Energies 18 03300 g001
Figure 2. Lumped Simulink model with double RC groups tabulated with respect to temperature and SOC (a) and corresponding electric DP model (b).
Energies 18 03300 g002
Figure 3. Lumped thermal model of the cell.
Energies 18 03300 g003
Figure 4. Behavior of resistances (a), capacities (b), and open-circuit voltages (c) as functions of the cell temperature and SOC.
Energies 18 03300 g004
Figure 5. Interpolated data fitting (identified from the HPPC test) and corresponding impedance behavior of the EIS analysis at a constant temperature and SOC (25 °C; SOC 50%).
Energies 18 03300 g005
Figure 6. Simplified scheme of the simulated balancing circuit, comparing different implementations of Kalman filters, such as UKF (unscented Kalman filter) or EKF (extended Kalman filter).
Energies 18 03300 g006
Figure 7. Simplified scheme of the simulated balancing circuit.
Energies 18 03300 g007
Figure 8. SIL model implemented on a real-time target.
Energies 18 03300 g008
Figure 9. Cell-balancing simulation: voltage of cells (a) and corresponding switching commands applied during balancing (b).
Energies 18 03300 g009
Figure 10. (a) Simulated line (round trip from Reggio C. to Catanzaro Lido), (b) main features of the simulated rolling stock, and (c) simulated mission profile.
Energies 18 03300 g010
Figure 11. Performed validation process.
Energies 18 03300 g011
Figure 12. Simulated battery power flow, Wbattery, for a simulated mission profile (from Reggio C. to Catanzaro Lido).
Energies 18 03300 g012
Figure 13. Comparison of the simulated voltage and temperature profiles, with corresponding values measured on the tested cell (test performed at an environmental temperature of 25 °C).
Energies 18 03300 g013
Figure 14. Example of usage and workflow.
Energies 18 03300 g014
Table 1. Comparison of some typical features for different lithium chemistries [15,16].
ParametersChemistry
LTO
(Lithium Titanate)
LiNMC
(Lithium Nickel Manganese Cobalt)
LiFePO4
(Lithium Iron Phosphate)
Cost of “Naked” Cells [USD/kWh]500–1000120–200 *90–150
Cost of Battery Pack [USD/kWh]800–1500250–350 *150–300
Sustainability/Impact [kg CO2/kg] 100–15060–10040–80
Specific Energy [Wh/kg] 80180–250120–160
Volumetric Energy [Wh/dm3] 90–140400–600220–330
Specific Power [W/kg]1500–30001000–25001000–1500
Volumetric Power [W/L]2000–60002000–50001000–3000
Expected Life [Cycle]10,000–20,0001000–30002000–7000
Total Specific Stored Energy until EOL [Wh/kg]8 × 105–1 × 1061.8 × 105–7.5 × 1052.4 × 105–2.3 × 10⁶
Operational Temp Range
(ExtremePreferred)
−30 55 °C
0 55 °C
−20 60 °C
0 45 °C
−20 60 °C
0 45 °C
* For large automotive orders, the prices of LiNMC have further reductions.
Table 2. Main features of the identified benchmark test cell.
ParameterValue
Chemistry LiNMC
Shape//Dimensions//WeightPrismatic Cell//80 × 148 × 103[mm]//2.8[kg]
Nominal Capacity195 [Ah]
Min. Nom. Max Voltage2.5//3.7//4.2 [V]
Max Charge/Disch. Current3C
Int. Resistance<0.6[Ώ°0]
Min. Charge Temp.//Max Charge Temp.//Min. Discharge Temp.//Max Discharge Temp.0 [°C]//55 [°C]//−30 [°C]//55 [°C]
Expected Life2000 Cycles
Table 3. HPPC test: main parameters.
ParameterValue
Initial SOC 100
Discharge pulse duration and intensity18 [s]-1C
Charge pulse duration and intensity18 [s]-1C
Pause 60 [s]
Different levels of SOC during which impulses are repeatedFrom 90% to 10% and steps of 10% of SOC
Transition between different SOC levelsConstant Discharge at 0.5 C
Test repeated for different temperatures5 °C, 25 °C, 45 °C
Table 4. Known and identified thermal lumped parameters of the cell.
ParameterValue
mcell2.8 [kg] (known)
Cp1000 [J kg−1 K−1] (known)
hconv24 [Wm−2 K−1] (identified)
Acell7 × 10−2 [m2] (known)
Table 5. Sizing of the train battery.
ParameterBattery 1Battery 2
Module 6s1p16s2p
Pack32s12p12s6p
Num. of Modules38472
Num. of Cells (Nc)2304
Nom. VoltageAbout 710 [V]
Weight6451 [kg]
Installed PowerAbout 1650 [kWh]
Table 6. Performance of the model in the test scenario in terms of accuracy.
MissionVariableRMSERMSE%Maximum Error
Jonica lineVoltage5 mV0.1% 20 mV
Temperature0.1 °C0.3%0.3 °C
Disclaimer/Publisher’s Note: The statements, opinions and data contained in all publications are solely those of the individual author(s) and contributor(s) and not of MDPI and/or the editor(s). MDPI and/or the editor(s) disclaim responsibility for any injury to people or property resulting from any ideas, methods, instructions or products referred to in the content.

