Article

Numerical Modelling of 1d Isothermal Lithium-Ion Battery with Varied Electrolyte and Electrode Materials

Dipartimento di Ingegneria Enzo Ferrari, Università degli Studi di Modena e Reggio Emilia, 41125 Modena, Italy
*
Author to whom correspondence should be addressed.
Energies 2025, 18(13), 3288; https://doi.org/10.3390/en18133288
Submission received: 26 May 2025 / Revised: 17 June 2025 / Accepted: 21 June 2025 / Published: 23 June 2025
(This article belongs to the Special Issue Current Advances in Fuel Cell and Batteries)

Abstract

In this study, the lithium-ion (Li-ion) battery type, which has a high-power density and utilizes lithium as the primary conductive terminal, has been employed. Within the scope of this research, a one-dimensional isothermal Li-ion battery model has been investigated under various electrolyte (both liquid and solid) and electrode materials using the COMSOL Multiphysics software. The obtained simulation results have been corroborated with information sourced from the literature and establish a foundational framework for future studies. The average range of electrolyte salt concentration in battery components is slightly higher for batteries utilizing polymer electrolytes compared to those with liquid electrolytes. During discharge at five different C-rates, Li-ion batteries with liquid electrolytes displayed higher voltage than those with polymer electrolytes. On the other hand, the one with the lithium iron phosphate (LFP) positive electrode exhibits the greatest variation in lithium concentration at the surface of the positive electrode at the end of discharge. Conversely, the battery using a LiNiO2 cathode shows the smallest surface lithium concentration variation during the same period. This pattern is similarly observed for the lithium concentration at the center of the electrode particles. The presented model can be used to explore innovative electrolyte and electrode materials to improve the design of Li-ion batteries.

1. Introduction

Since the onset of the industrial revolution, there has been a significant increase in worldwide energy usage [1]. Battery technologies enable the storage and on-demand utilization of energy derived from renewable and clean sources, thereby contributing to the reduction of fossil fuel consumption and consequently mitigating harmful effects [2]. Moreover, they provide an essential energy storage (buffer) function to stabilize electric grids against ever-fluctuating power generation from renewable energy sources (RES). Rechargeable secondary batteries encompass nickel-cadmium and nickel-metal hydride, as well as Li-ion and lithium-polymer variants [3]. The Li-ion battery examined within the context of this study represents a rechargeable energy storage system based on the reversible electrochemical reduction of lithium ions. Conventionally, Li-ion batteries are constructed with a graphite negative electrode juxtaposed with a metal oxide positive electrode, while the electrolyte solution typically comprises a lithium salt dissolved within an organic solvent medium [4,5]. This technology finds extensive utility across several domains, including the military, aviation, and mass-market electronic devices such as computers and mobile phones [6].
When the literature is examined, the electrolyte in Li-ion batteries typically consists of organic components known for their stability. It is primarily composed of lithium salts, solvents, and additives, with the concentration and type of these constituents significantly influencing the electrolyte and battery’s overall performance. A “mixed solvent system” is commonly employed, where 95% comprises “carbonate solvents.” These solvents are categorized into cyclic carbonates and chain carbonates, including dimethyl carbonate (DMC), diethyl carbonate (DEC), ethyl methyl carbonate (EMC), ethylene carbonate (EC), and propylene carbonate (PC). The primary role of the solvent is to dissolve lithium salts, such as lithium hexafluorophosphate (LiPF6), and to generate the conductive paths for the generated ions. The electrolyte’s viscosity, which impacts its wettability, is determined by both the lithium salt and the solvent. Organic solvents with high dielectric constants and low viscosity are generally preferred for Li-ion battery electrolytes. A higher dielectric constant facilitates the dissolution and dissociation of lithium salts, whereas lower viscosity enhances ion mobility. However, there is often a trade-off: solvents with high dielectric constants tend to have higher viscosity, while those with low viscosity exhibit lower dielectric constants. To address this, a mixture of solvents is typically used to optimize the electrolyte system. Studying the performance of single-solvent systems is fundamental to developing more complex mixed-solvent systems [7].
In recent studies, gel electrolytes made from widely available polymers such as polyethylene oxide (PEO), polyvinylidene fluoride (PVDF), PVDF-hexafluoropropylene (HFP), polymethyl methacrylate (PMMA), polyacrylonitrile (PAN), polyvinyl chloride (PVC), and polyacrylates, along with lithium salts such as LiPF6, LiClO4, LiBF4, and LiN(CF3SO2)2, and organic solvents such as EC, PC, DMC, EMC, and DEC, have gained significant attention. For practical applications, polymer gel electrolytes must exhibit key properties, including high ionic conductivity, robust mechanical strength, a wide electrochemical stability window, and an extensive operating temperature range. Additionally, the components for these electrolytes must be commercially accessible, aligning with lithium cell technology. These gel electrolytes function as both separators and electrolytes, effectively preventing dendrite growth and facilitating the formation of the solid electrolyte interphase (SEI) film. Among the various options, gel electrolytes based on PVDF and polyacrylates show considerable promise for lithium cell development. Recent advancements focus on modifying polymer matrices through copolymerization and cross-linking to reduce crystallinity, thereby enhancing their compatibility with organic solvents and enabling higher liquid electrolyte absorption. For instance, the PVDF-HFP copolymer combines the mechanical stability of crystalline PVDF with the electrolyte-absorbing properties of HFP units. Bellcore technology-based PVDF-HFP gel electrolytes are extensively used in lithium cell production. Polymers capable of forming network structures are particularly suitable as matrices for uniform gels, as they retain the ability to hold liquid electrolytes even with minimal polymer content. Network gel electrolytes can be synthesized in situ through radiation or thermal polymerization, introducing only minor adjustments to the manufacturing processes of lithium cells using liquid electrolytes [8]. Organic liquid electrolytes typically exhibit low electrical conductivity. However, when a gel polymer electrolyte diaphragm absorbs the liquid electrolyte, it undergoes full gelation. This process enhances the electrolyte’s thermal stability and mechanical strength, addressing issues such as battery leakage while balancing the requirements of energy storage devices for both high ionic conductivity and robust mechanical properties. In gel polymer electrolyte Li-ion batteries, plasticizers and similar additives are incorporated into the solid polymer electrolyte. These additives promote ion conductivity, enabling the batteries to operate effectively at room temperature [9]. LiPF6 is an inorganic compound appearing as a white crystalline powder. It is produced through a chemical reaction involving phosphorus pentachloride, hydrogen fluoride, and lithium fluoride [10,11].
P C l 5 + L i F + 5 H F L i P F 6 + 5 H C l
LiPF6 is primarily used in commercial secondary batteries due to its high solubility in polar aprotic solvents. It is a key component in modern Li-ion battery electrolytes, typically dissolved in carbonate mixtures such as EC, DMC, DEC, and EMC. These formulations often include small amounts of additives such as fluoroethylene carbonate and vinylene carbonate to enhance performance [12,13,14]. The hexafluorophosphate anion ([PF6]) is chemically inert to strong reducing agents, such as lithium metal, and contributes to the passivation of the aluminum positive current collector, which is crucial for battery stability and efficiency [15]. LiPF6 dissolves easily in various solvents, particularly in dipolar aprotic organic solvents such as cyclic carbonates (e.g., EC) and linear carbonates (e.g., DMC, DEC, and EMC), enabling high ionic conductivity. When dissolved in a 1:1 mixture of EC and DEC, LiPF6 achieves a conductivity of 10.7 mS/cm [16]. The size of the anion significantly impacts ionic conductivity, with LiPF6 having an anionic size of 0.255 nm. Smaller anion sizes generally enhance ionic conductivity. LiPF6 exhibits excellent electrochemical properties, including high electrochemical stability and the ability to form a protective passivation layer on the aluminum current collector, preventing corrosion [17]. It also offers notable anionic mobility, contributing to its effectiveness as an electrolyte component. Choosing the right electrolyte is a crucial step in optimizing Li-ion battery performance. Over the past few decades, solid polymer electrolytes (SPEs) have garnered significant attention for their enhanced properties, including high conductivity, excellent stability, and improved safety. SPEs consist of a polymer matrix and lithium salt, where the polymer structure effectively dissolves lithium salts with low lattice energy. Polymer hosts such as PEO, PAN, PMMA, PVDF, PVDF-HFP, polyvinyl alcohol (PVA), PVC, polystyrene (PS), and PC have been extensively studied. Recent publications provide detailed insights into the performance of these polymer hosts when paired with various lithium salts. The choice of solvent is critical for dissolving lithium salts and ensuring high ion mobility. Solid polymer electrolytes are considered highly promising for commercial applications, as they offer a combination of desirable features. These include low leakage, reduced flammability, superior mechanical strength, flexibility, a wide electrochemical stability range, and higher thermal stability compared to liquid and gel polymer electrolytes [18].
The energy density of Li-ion batteries has attracted significant interest from researchers and scientists, particularly for use in electric vehicles (EVs), which face challenges in achieving high energy density for long-range applications. Lithium is a preferred choice due to its lightweight nature, enabling the development of batteries with higher energy density, thus enabling their integration with the ever-tighter vehicle layout constraints (e.g., curb weight, cabin volume, vehicle dynamics characteristics, etc.). Li-ion batteries can be designed using various materials, including iron (Fe), aluminum (Al), cobalt (Co), nickel (Ni), manganese (Mn), and others [19]. Compared to other cathode materials, lithium cobalt oxide (LiCoO2 or LCO) exhibits a high specific energy. Lithium manganese oxide (LiMn2O4 or LMO) operates within a voltage range of 3.0–4.2 V with a nominal voltage of 3.7 V, whereas LiFePO4 or LFP has a working voltage range of 2.5–3.65 V and a nominal voltage of 3.2 V. Additionally, despite its lower capacity, LFP is considered one of the most reliable types of Li-ion batteries due to its exceptionally flat voltage curve. lithium nickel cobalt aluminum oxide (LiNiCoAlO2 or NCA) offers high specific energy, excellent specific power, and an extended cycle life [20].
Shim et al. [21] found that as the density of the electrode rose, the capacity retention at elevated rates exhibited an increase until reaching 0.9 g/cm3, followed by a subsequent decline. With an increase in electrode density, there was a slight decrease observed in both charge and discharge capacities. According to Choi et al.’s [22] investigation, it was noted that the capacity retention improves when the cathode density is reduced. With an increase in density from 1.5 to 3.5 g/cm3, both rate capability and cyclability deteriorate notably due to a substantial reduction in porosity, as shown by surface and cross-sectional scanning electron microscope (SEM) images, notwithstanding enhancements in electrical conductivity. Increasing the electrode density leads to a reduction in the active surface area of the positive electrode material. As the electrode density rises, the volume fraction of electrolyte (or porosity) decreases. The Li-ion battery cells under examination, featuring high-density positive electrodes, exhibit lower DC resistance (DCR) and marginally higher discharge capacities at lower current rates. Cells with a higher positive electrode density demonstrate slightly increased discharge capacities at lower current rates. However, at higher current rates, cells with a lower positive electrode density demonstrate superior performance. It is noteworthy that this effect is likely more prominent at lower rates if the electrodes were composed of more active material per square centimeter of electrode (higher loading, thicker electrodes, or, in other words, more energy-dense cells). In terms of DCR, higher-density positive electrodes perform better, showing a reduction of 4% to 5% in DCR, as found by Smekens et al. [23]. Chabot et al. [24] discovered that the diffusion rate notably impacts the performance of the cell. Opting for an active material characterized by a lithium diffusion coefficient below 3.9 × 10⁻¹⁴ m2/s results in a marked decline in cell performance. Ye et al. [25] demonstrate that a notable concentration disparity within solid particles can impair the battery capacity. As per Zheng et al.’s study [26], while discharging, a considerable gradient in Li-ion concentration within the active material particles leads to a swift decrease in electrode potential towards the cut-off threshold, thereby diminishing the cell’s discharge capacity.
In this study, the Li-ion battery model used for the electrolyte and electrode materials is considered to have a one-dimensional geometry, and the model assumes uniformity and constancy in the entire domain. The model was analyzed on COMSOL Multiphysics 6.0 Software under different electrolyte materials, negative electrode solid-phase lithium diffusivities, and positive electrode materials.

2. Materials and Methods

2.1. Physical and Chemical Properties

Figure 1 [27] depicts a schematic representation of a typical Li-ion battery. The negative electrode employs graphite intercalation compound (LiC6), whereas the positive electrode is based on LMO, although alternative materials may be employed for both electrodes. Throughout the discharge process, lithium ions migrate from the anode through the electrolyte to the cathode. Conversely, during charging, an external power source drives electrons to migrate from the cathode to the anode. The chemical reactions taking place at the negative electrodes during both the charging and discharging stages are elucidated through the subsequent equations [28]. In the provided equations, the variable ‘x’ indicates the quantity of lithium ions (Li+) and electrons (e) participating in the reaction for every formula unit of the graphite (C6) structure.
L i x C 6 6 C + x L i + + x e
6 C + x L i + + x e L i x C 6
The chemical processes unfolding at the positive electrode during both the charging and discharging intervals are delineated in [28]:
L i 1 x M n 2 O 4 + x L i + + x e L i M n 2 O 4
L i M n 2 O 4 L i 1 x M n 2 O 4 + x L i + + x e
The model adopts a one-dimensional (through-electrolyte direction) geometric configuration and maintains isothermal conditions. The applied temperature is 298 K. Material properties are representative of those commonly encountered in Li-ion batteries. The electrolyte consists of a solution comprising 2 M LiPF6 salt in a 1:2 volume ratio of EC:DMC solvent and PVDF-HFP. Carbon-based graphite material serves as the negative electrode, while LiMnA4 is utilized for the positive electrode [27]. Figure 2 illustrates the one-dimensional battery geometry, featuring labelled components. Three sub-domains are identified: the negative electrode, electrolyte, and positive electrode [27]. The negative electrode extends over a length of 10–4 m, followed by a separator spanning 0.52 × 10⁻⁴ m, and concluding with a positive electrode measuring 1.74 × 10⁻⁴ m. This depiction represents a cross-sectional view of the battery within a one-dimensional model, wherein edge effects along the battery’s length and height are disregarded.
The simulated loading cycle starts with a discharge period lasting 2000 s at 17.5 A/m2 current density, followed by a 300 s interval of open circuit and by a charging phase lasting 2000 s at the same current density, finally concluding with open circuit conditions [30] until 8000 s. The variation in total discharge/charge current density over time is illustrated in Figure 3.

2.2. Numerical Method

The equations presented in Section 2.2 are derived from the 1D isothermal Li-ion battery model implemented in COMSOL Multiphysics.
This set of equations describes the current distribution and charge transport in a Li-ion battery, specifically in the electrolyte and electrode phases. These equations represent the conservation of mass and charges (both negative and positive):
J l = R l
i l = Q l
i s = Q s
J l is the flux of Li-ions in the electrolyte, i l is the ionic current density in the electrolyte, i s is the electronic current density in the solid electrode, and R l , Q l ,   Q s are source terms related to reactions.
J l = D l c l + i l t + F
Equation (9) describes the flux of Li-ions in the electrolyte. It consists of:
  • A diffusion term, D l c l , which accounts for Li-ion movement due to concentration gradients.
  • A migration term, i l t + F , which accounts for Li-ion movement due to the electric field.
D l is the diffusion coefficient of Li-ions in the electrolyte, c l is the Li-ion concentration, t + is the transference number (fraction of current carried by Li-ions), and F is Faraday’s constant.
The following equation describes the current in the electrolyte, consisting of
i l = σ l ϕ l + 2 σ l R T F 1 + l n f l n c l 1 t + l n c l
  • A conductive term, ( σ l ϕ l ), representing the movement of charged species under an electric potential.
  • A concentration gradient term, 2 σ l R T F 1 + l n f l n c l 1 t + l n c l , which accounts for the variation of ionic conductivity with concentration, and with c s , i n i t being the initial concentration of that species at the beginning of the simulation.
σ l is the ionic conductivity of the electrolyte, ϕ l is the electrolyte potential, R is the universal gas constant, T is temperature, and f is the activity coefficient.
i s = σ s ϕ s
This equation follows Ohm’s law and describes the current in the solid electrode, where σ s is the electrical conductivity of the solid electrode, and ϕ s is the electrode potential.
n J l = 0
This equation represents a no-flux boundary condition for the Li-ion flux ( J l ) at a specific surface, and n is the unit normal vector to the boundary (points outward from the domain).
n i l = 0
n i s = 0
This set of equations represents a mathematical model describing the current distribution and transport phenomena in a porous electrode, commonly used in battery modelling or electrochemical systems.
The charge conservation in electrolyte and solid phases is expressed by
J l = R l ,     R l = m   ν L i + , m i v , m F + R l , s r c
To represent the consumption or generation of Li-ions in electrochemical reactions, the following equations are used, with i v ,   total being the total volumetric current density (related to reaction rates).
i l = i v ,   total   + Q l
i s = i v ,   total   + Q s
i v ,   total   : Total volumetric current density (related to reaction rates).
As for the effective transport properties, these are expressed as in the following equations, with f l being the volume fraction of the electrolyte phase.
D l , eff   = f l D l ,     σ l ,   eff   = f l σ l ,     σ s ,   eff   = σ s
The total volumetric current density is expressed as in Equation (19), with i v , m being the reaction current density contributions and i v , d l the double-layer current (capacitive effects at interfaces).
i v ,   total   = . m .   i v , m + i v , d l
Regarding the potential losses (overpotentials), η is the driving force for electrochemical reactions E c t is the charge transfer potential (actual potential difference during operation), and E e q is the equilibrium potential is (material-dependent and relative to a no-current state. Overpotential ensures the reaction proceeds by overcoming equilibrium conditions, with the charge transfer potential ( E c t ) defined as in Equation (21):
η = E c t E e q
E c t = ϕ s ϕ l
The difference between the electric potential in the solid phase and that in the liquid electrolyte drives the charge transfer at the electrode-electrolyte interface. The volumetric current density ( i v ) is expressed as
i v = a v i l o c
  • i v : Current per unit volume (A/m3), critical for porous electrodes with high surface area.
  • a v : Specific surface area (m2/m3), representing the reactive surface area per unit volume.
  • i l o c : Local current density (A/m2): current per unit surface area at the reaction sites.
This equation links microscopic reaction rates ( i l o c ) to macroscopic performance ( i v ) in porous structures.
Equation (23) defines a boundary condition in the context of modeling electrochemical systems.
ϕ s = 0
Equation (24) is used as a boundary condition for current continuity at the interface of a porous electrode.
n i s = i n ,   s
  • i n : normal current density (scalar value representing current per unit area perpendicular to the surface).
  • s : surface area factor (may represent specific surface area or a scaling parameter).

3. Results

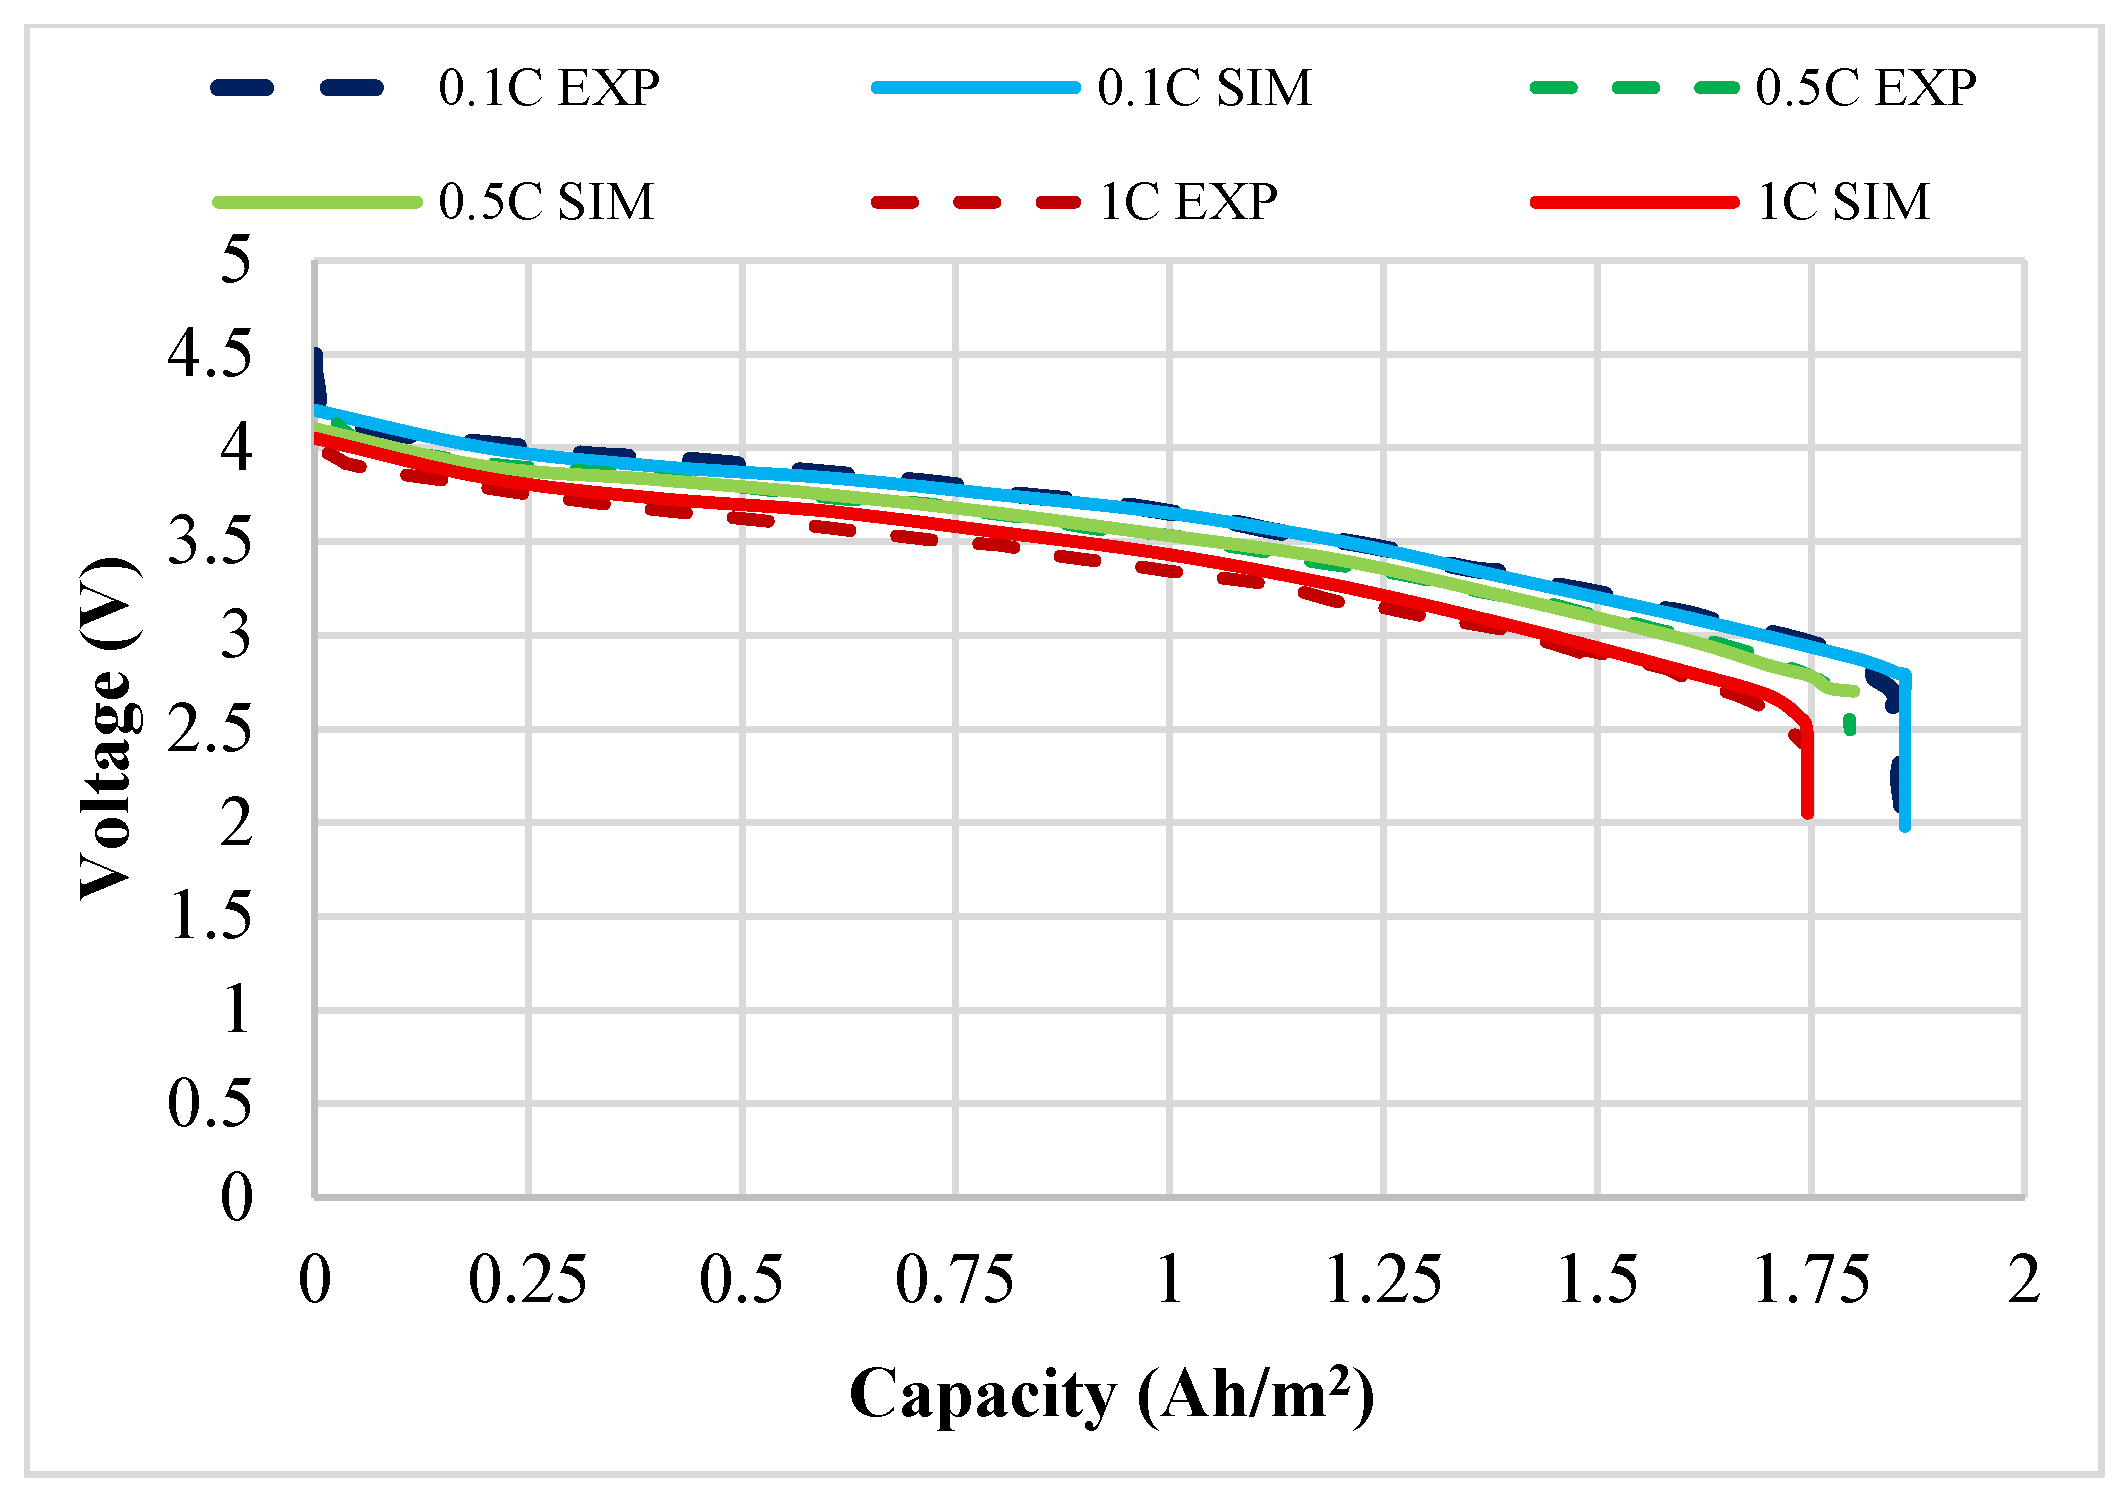
3.1. Validation of the Experimental Results

To illustrate the concept of C-rate, consider a 20 Ah cell capable of delivering 20 A (1C) for 1 h or 2 A (C/10) for approximately 10 h, although this relationship is not strictly linear. For instance, if the cell is discharged at a 10C rate, it would be completely depleted in roughly six minutes [31]. The model employed in this study is based on research conducted by Doyle et al. The applied temperature in the experimental model is also 298 K [32]. Experimental findings were corroborated across three distinct C-rates using a numerical model developed with COMSOL Multiphysics software.
As depicted in Figure 4, the numerical and experimental outcomes exhibited remarkable similarity, confirming the capacity/voltage relationship for several discharge rates.

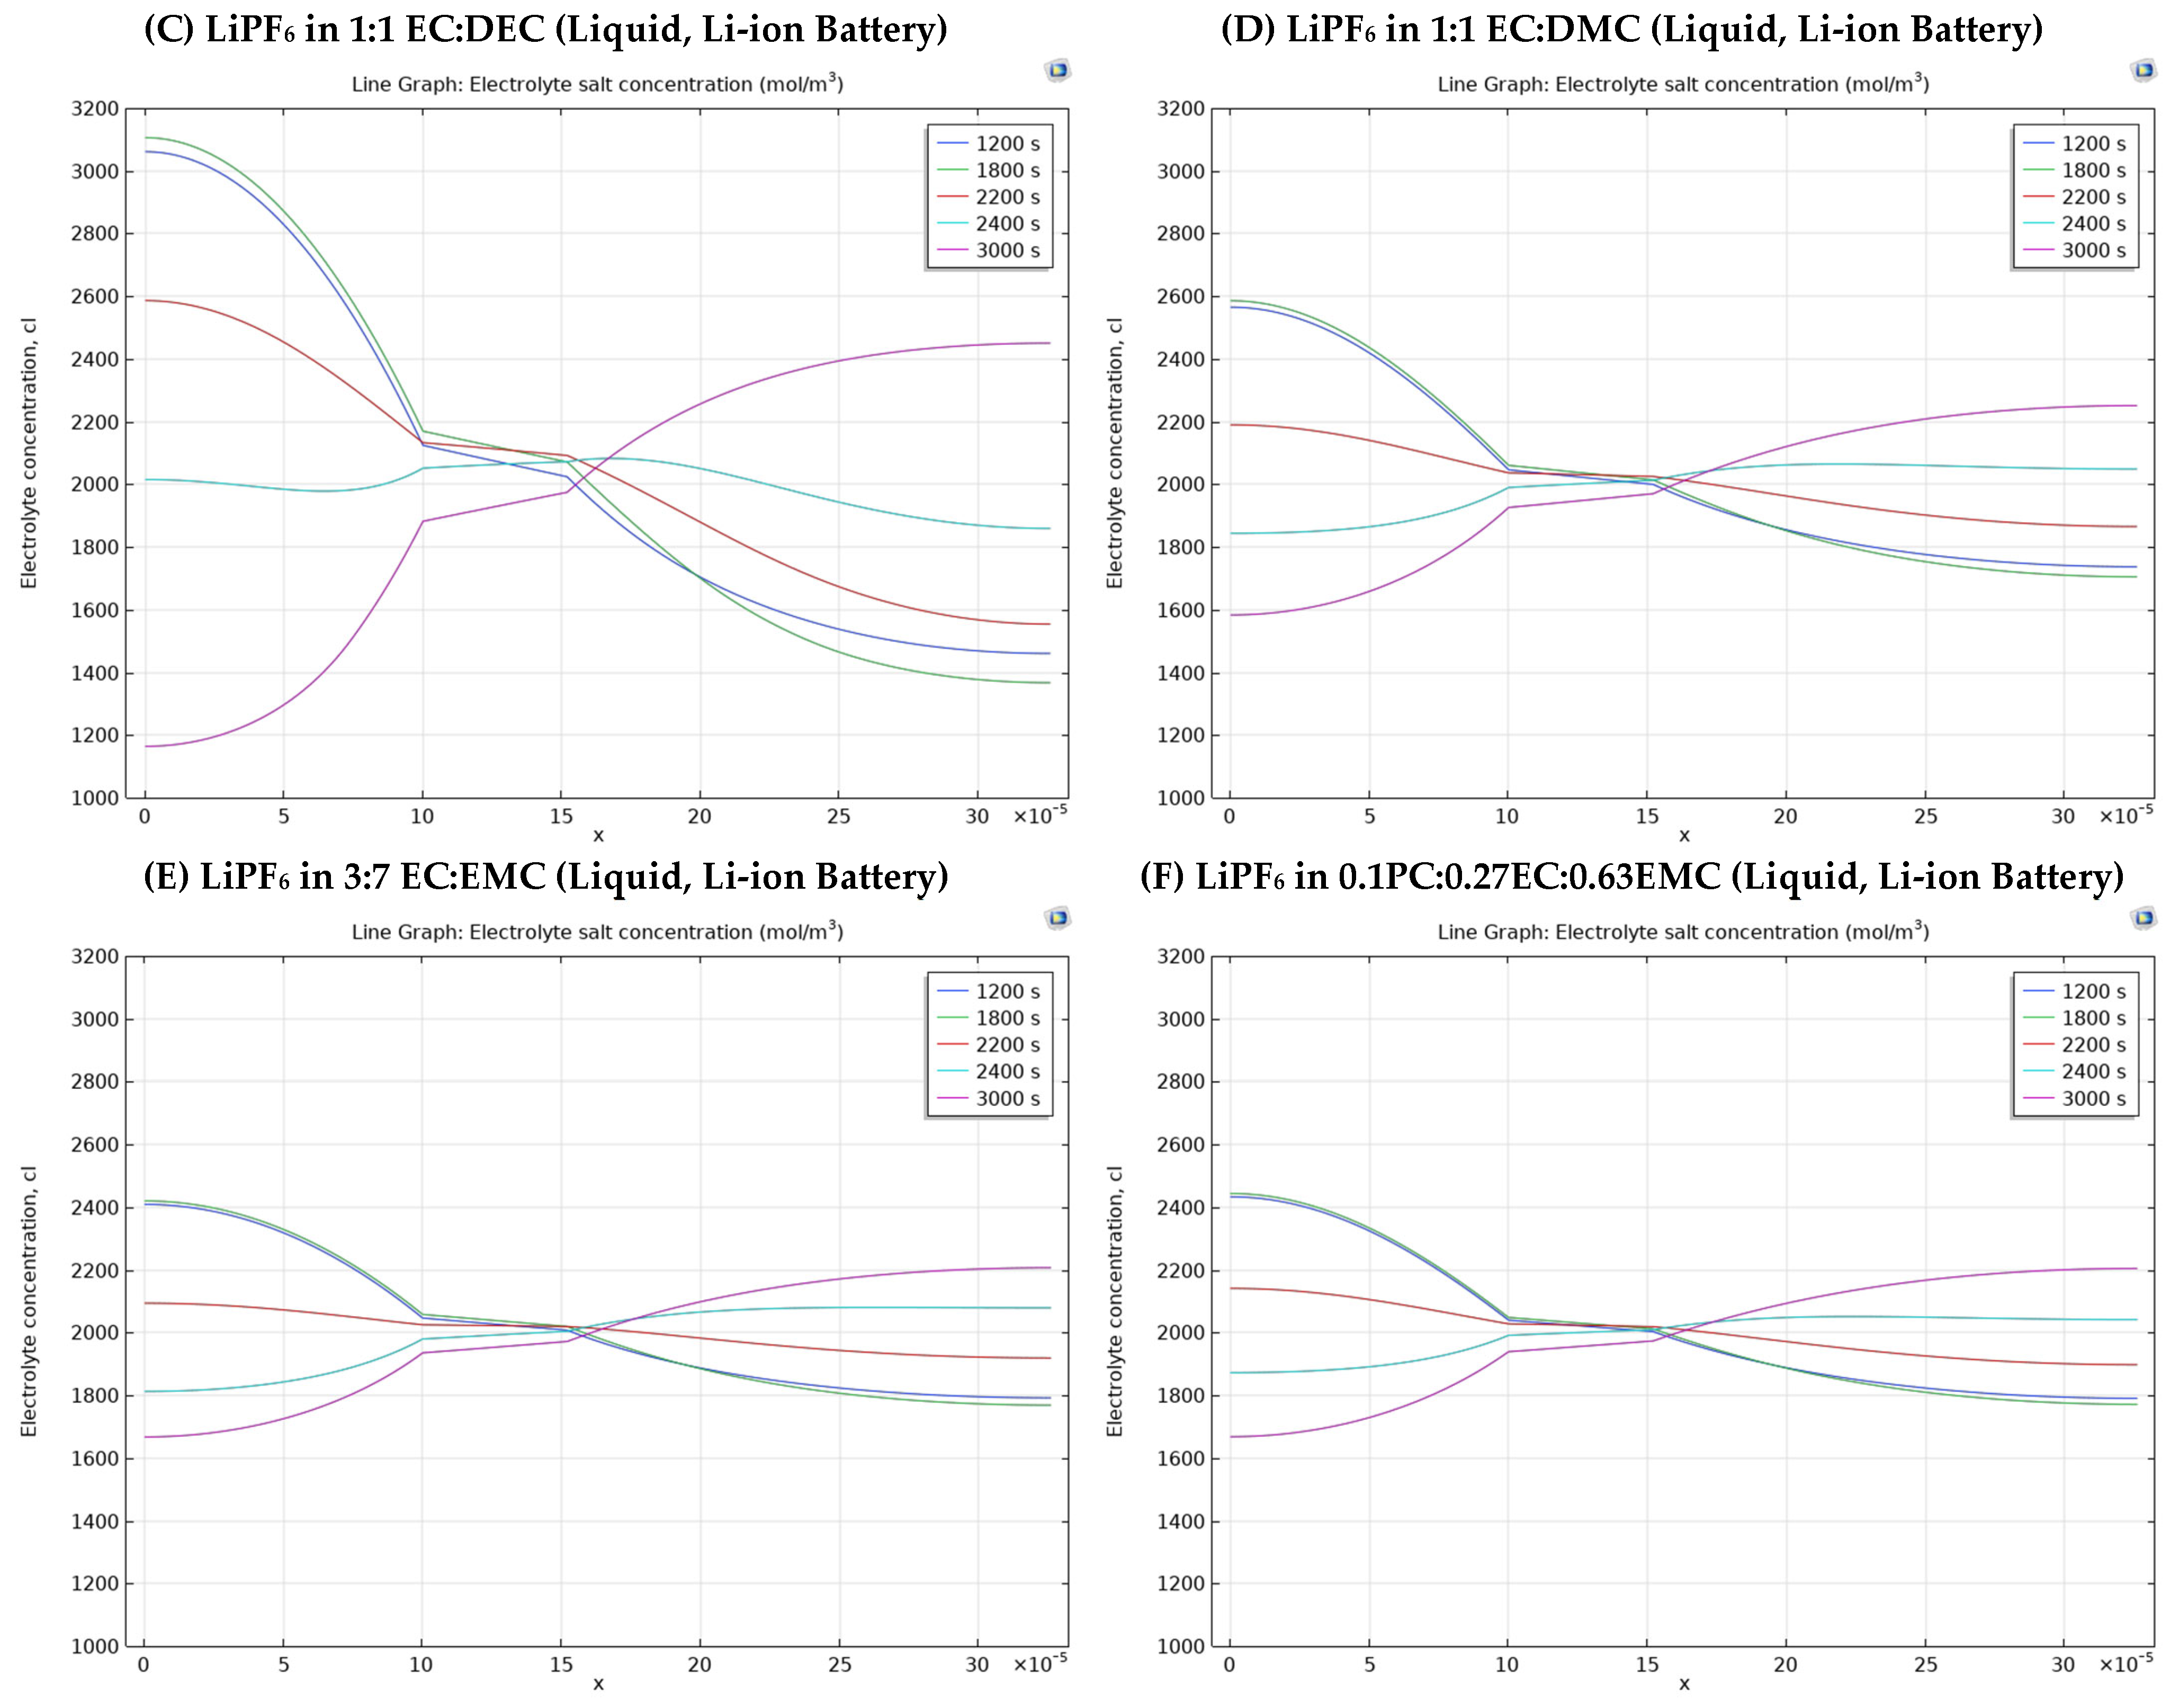
3.2. Different Electrolyte Material Effects on Simulation Results

Batteries primarily consist of electrodes and electrolytes. Since batteries function through electrochemical processes, the inherent properties and chemical behavior of materials are critically important. In this study six different electrolyte material effects were examined on a 1D isothermal Li-ion battery module in COMSOL Multiphysics. These electrolyte materials separate into two groups:
  • Group 1 has two Li-ion batteries having different solvents in polymer electrolytes.
  • Group 2 has four Li-ion batteries having different solvents in liquid electrolytes.
The electrolyte materials and some of their properties used in this study are derived from the COMSOL Multiphysics battery and design module material library and are summarized as follows:
  • Polymeric electrolyte consisting of LiPF6 salt dissolved in a 1:2 EC:DMC (by volume) solvent mixture, combined with a PVDF-HFP polymer matrix for Li-ion batteries. Its main properties include a diffusion coefficient of 7.5 × 10⁻¹¹ m2/s, a transport number of 0.363, an electrolyte salt concentration of 1000 mol/m3, and an electrolyte conductivity of 1000 mol/m3.
  • Polymeric electrolyte with LiPF6 salt but in a 2:1 EC:DMC (by volume) solvent with the same PVDF-HFP polymer structure, exhibiting identical material properties.
  • Liquid electrolyte based on LiPF6 dissolved in a 1:1 EC:DEC solvent system (liquid electrolyte), with an electrolyte salt concentration of 1000 mol/m3.
  • Liquid electrolyte with LiPF6 in a 1:1 EC:DMC mixture (liquid Li-ion battery).
  • Liquid electrolyte with LiPF6 in a 3:7 EC:EMC solvent system with a salt concentration of 1200 mol/m3.
  • Liquid electrolyte with LiPF6 in a 0.1 PC:0.27 EC:0.63 EMC mixture, also with an electrolyte salt concentration of 1200 mol/m3.
These different electrolyte formulations enable a comparative evaluation of ion transport and electrochemical performance in Li-ion battery simulations. The selected observation instants (1200, 1800, 2200, 2400, and 3000 s) in the ‘Electrolyte Salt Concentration’ graph correspond to critical stages of the battery’s charge-discharge cycle at a 1C rate.
  • 1200 s: captures the mid-discharge phase (within the first 2000 s), offering insight into the concentration profile during active discharge before nearing completion.
  • 1800 s: represents the late discharge phase, revealing how concentration changes as the battery approaches full depletion.
  • 2200 s: occurs during the rest period after discharge (300 s), observing the post-discharge electrolyte relaxation.
  • 2400 s: marks the start of the charge phase, providing a baseline for concentration changes as charging begins.
  • 3000 s: reflects the late charge phase (2000 s), showing how lithium ions redistribute as charging nears completion.
Figure 5 shows the electrolyte salt concentration values through the battery section with six different electrolytes for 1 C-rate in five different durations. The x coordinate is the battery cross-sectional dimension (m), and the y axis is the electrolyte salt concentration values (mol/m3). When looking at the graphs in Figure 5 and Table 1, the electrolyte salt concentration values of all battery components (negative electrode, electrolyte, and positive electrode) are similar for batteries with electrolyte material of LiPF6 salt in 1:2 EC:DMC solvent and PVDF-HFP (Case A) and LiPF6 salt in 2:1 EC:DMC solvent and PVDF-HFP (Case B). On the other hand, batteries with electrolyte material of LiPF6 in 1:1 EC:DMC (Case D), LiPF6 in 3:7 EC:EMC (Case E), and LiPF6 in 0.1 PC:0.27 EC:0.63 EMC (Case F) have similar electrolyte salt concentration amounts for all of the battery components. Moreover, the first two battery types (polymer electrolyte) and LiPF6 in 1:1 EC:DEC (Case C) have a higher average electrolyte salt concentration. The top and the lowest electrolyte salt concentrations of battery components middle point was chosen, and their differences were calculated as the average electrolyte salt concentration range.
Figure 6 is a discharge curve comparison for different C-rates for Li-ion batteries having different electrolytes. The x coordinate is capacity (Ah/m2) and the y axis is voltage (V). On the left, two Li-ion batteries with polymer electrolyte have the same chart, whereas on the right, four Li-ion batteries with liquid electrolyte have the same curve. When we compare polymer and liquid electrolyte discharge curve graphs, liquid electrolyte Li-ion batteries have a higher voltage, especially under elevated C-rates. Table 2 presents Figure 6 data for better explanation.

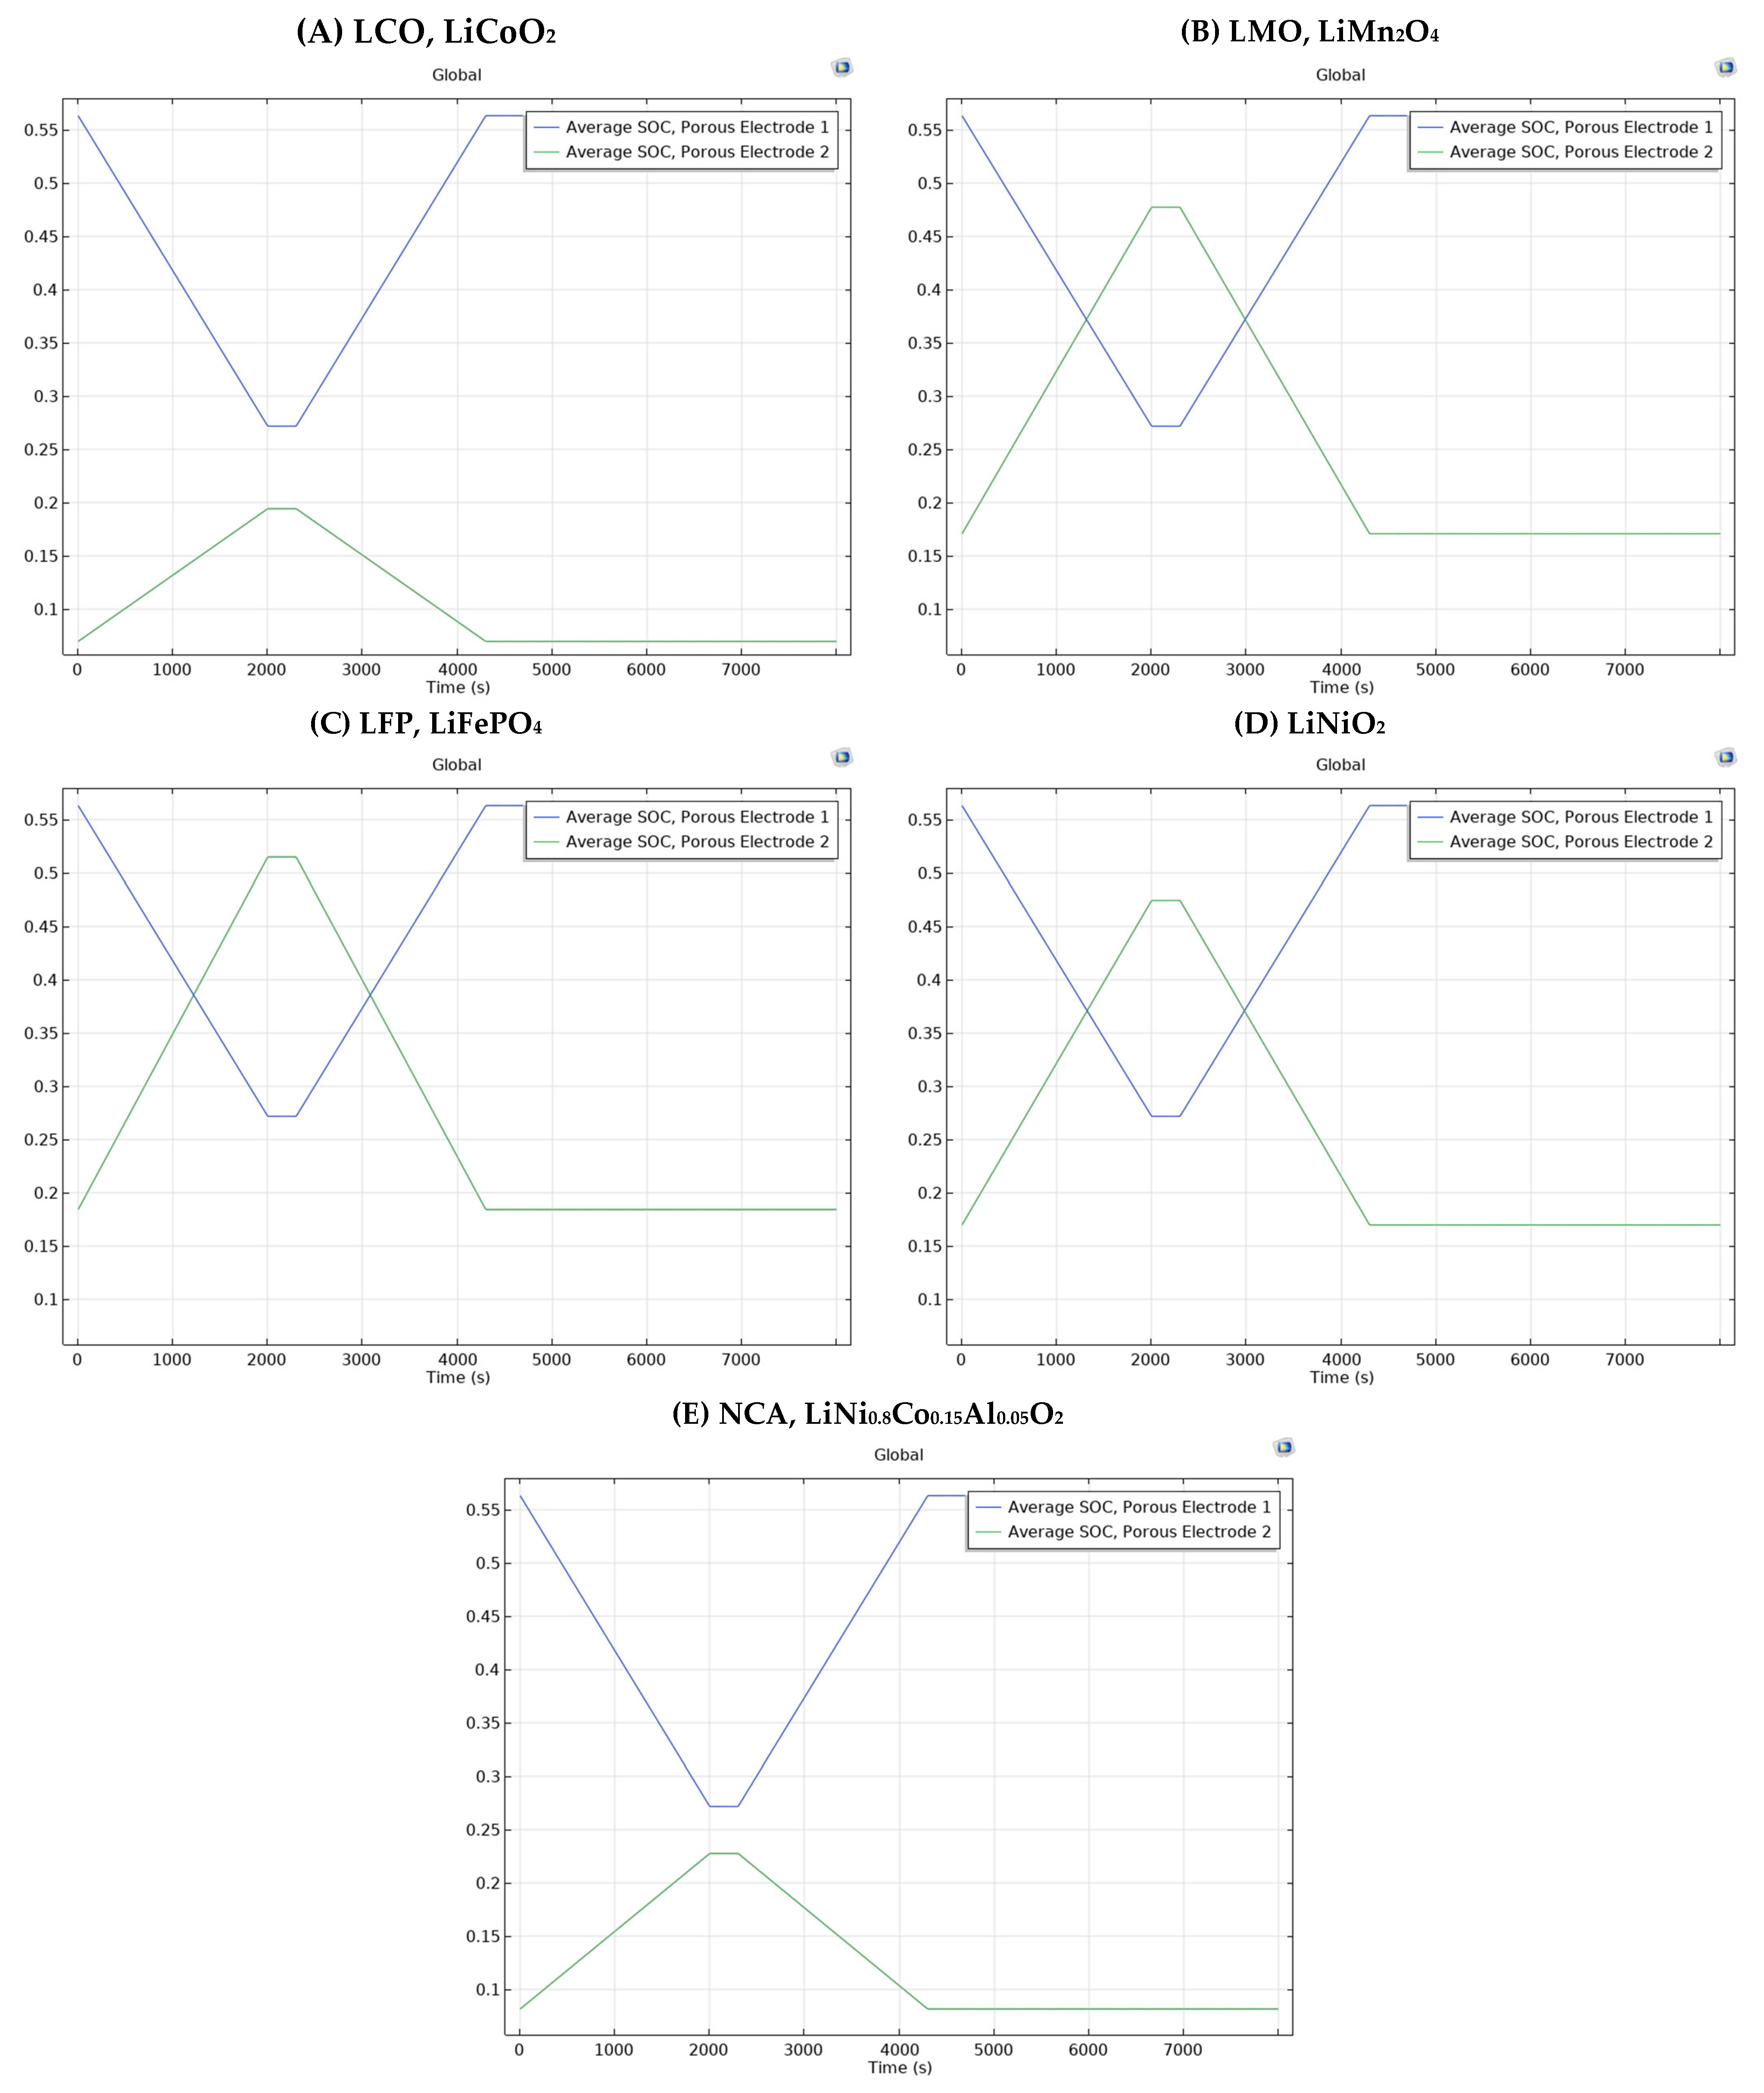
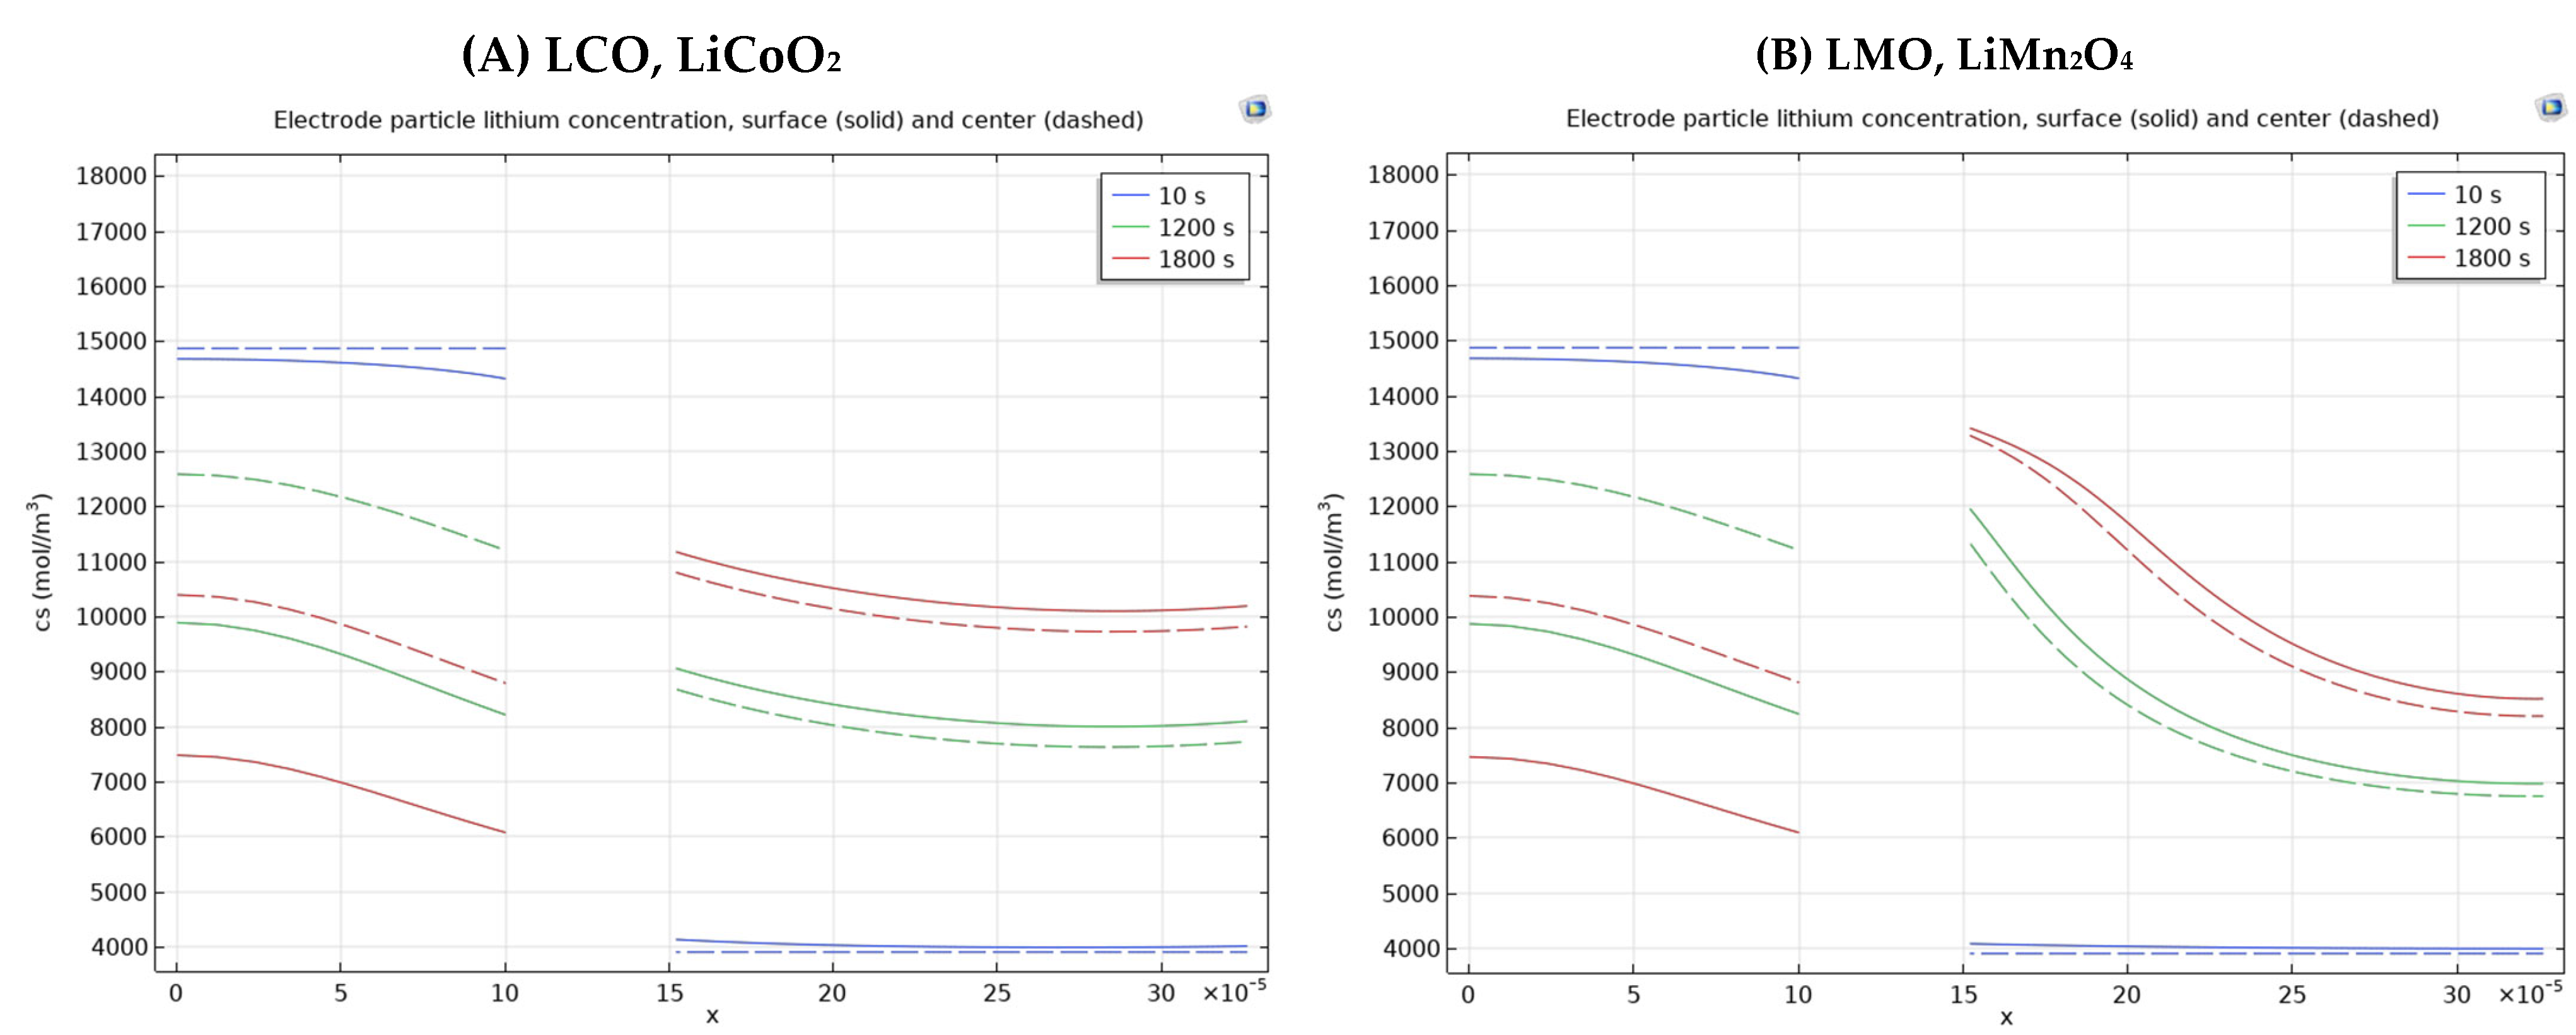
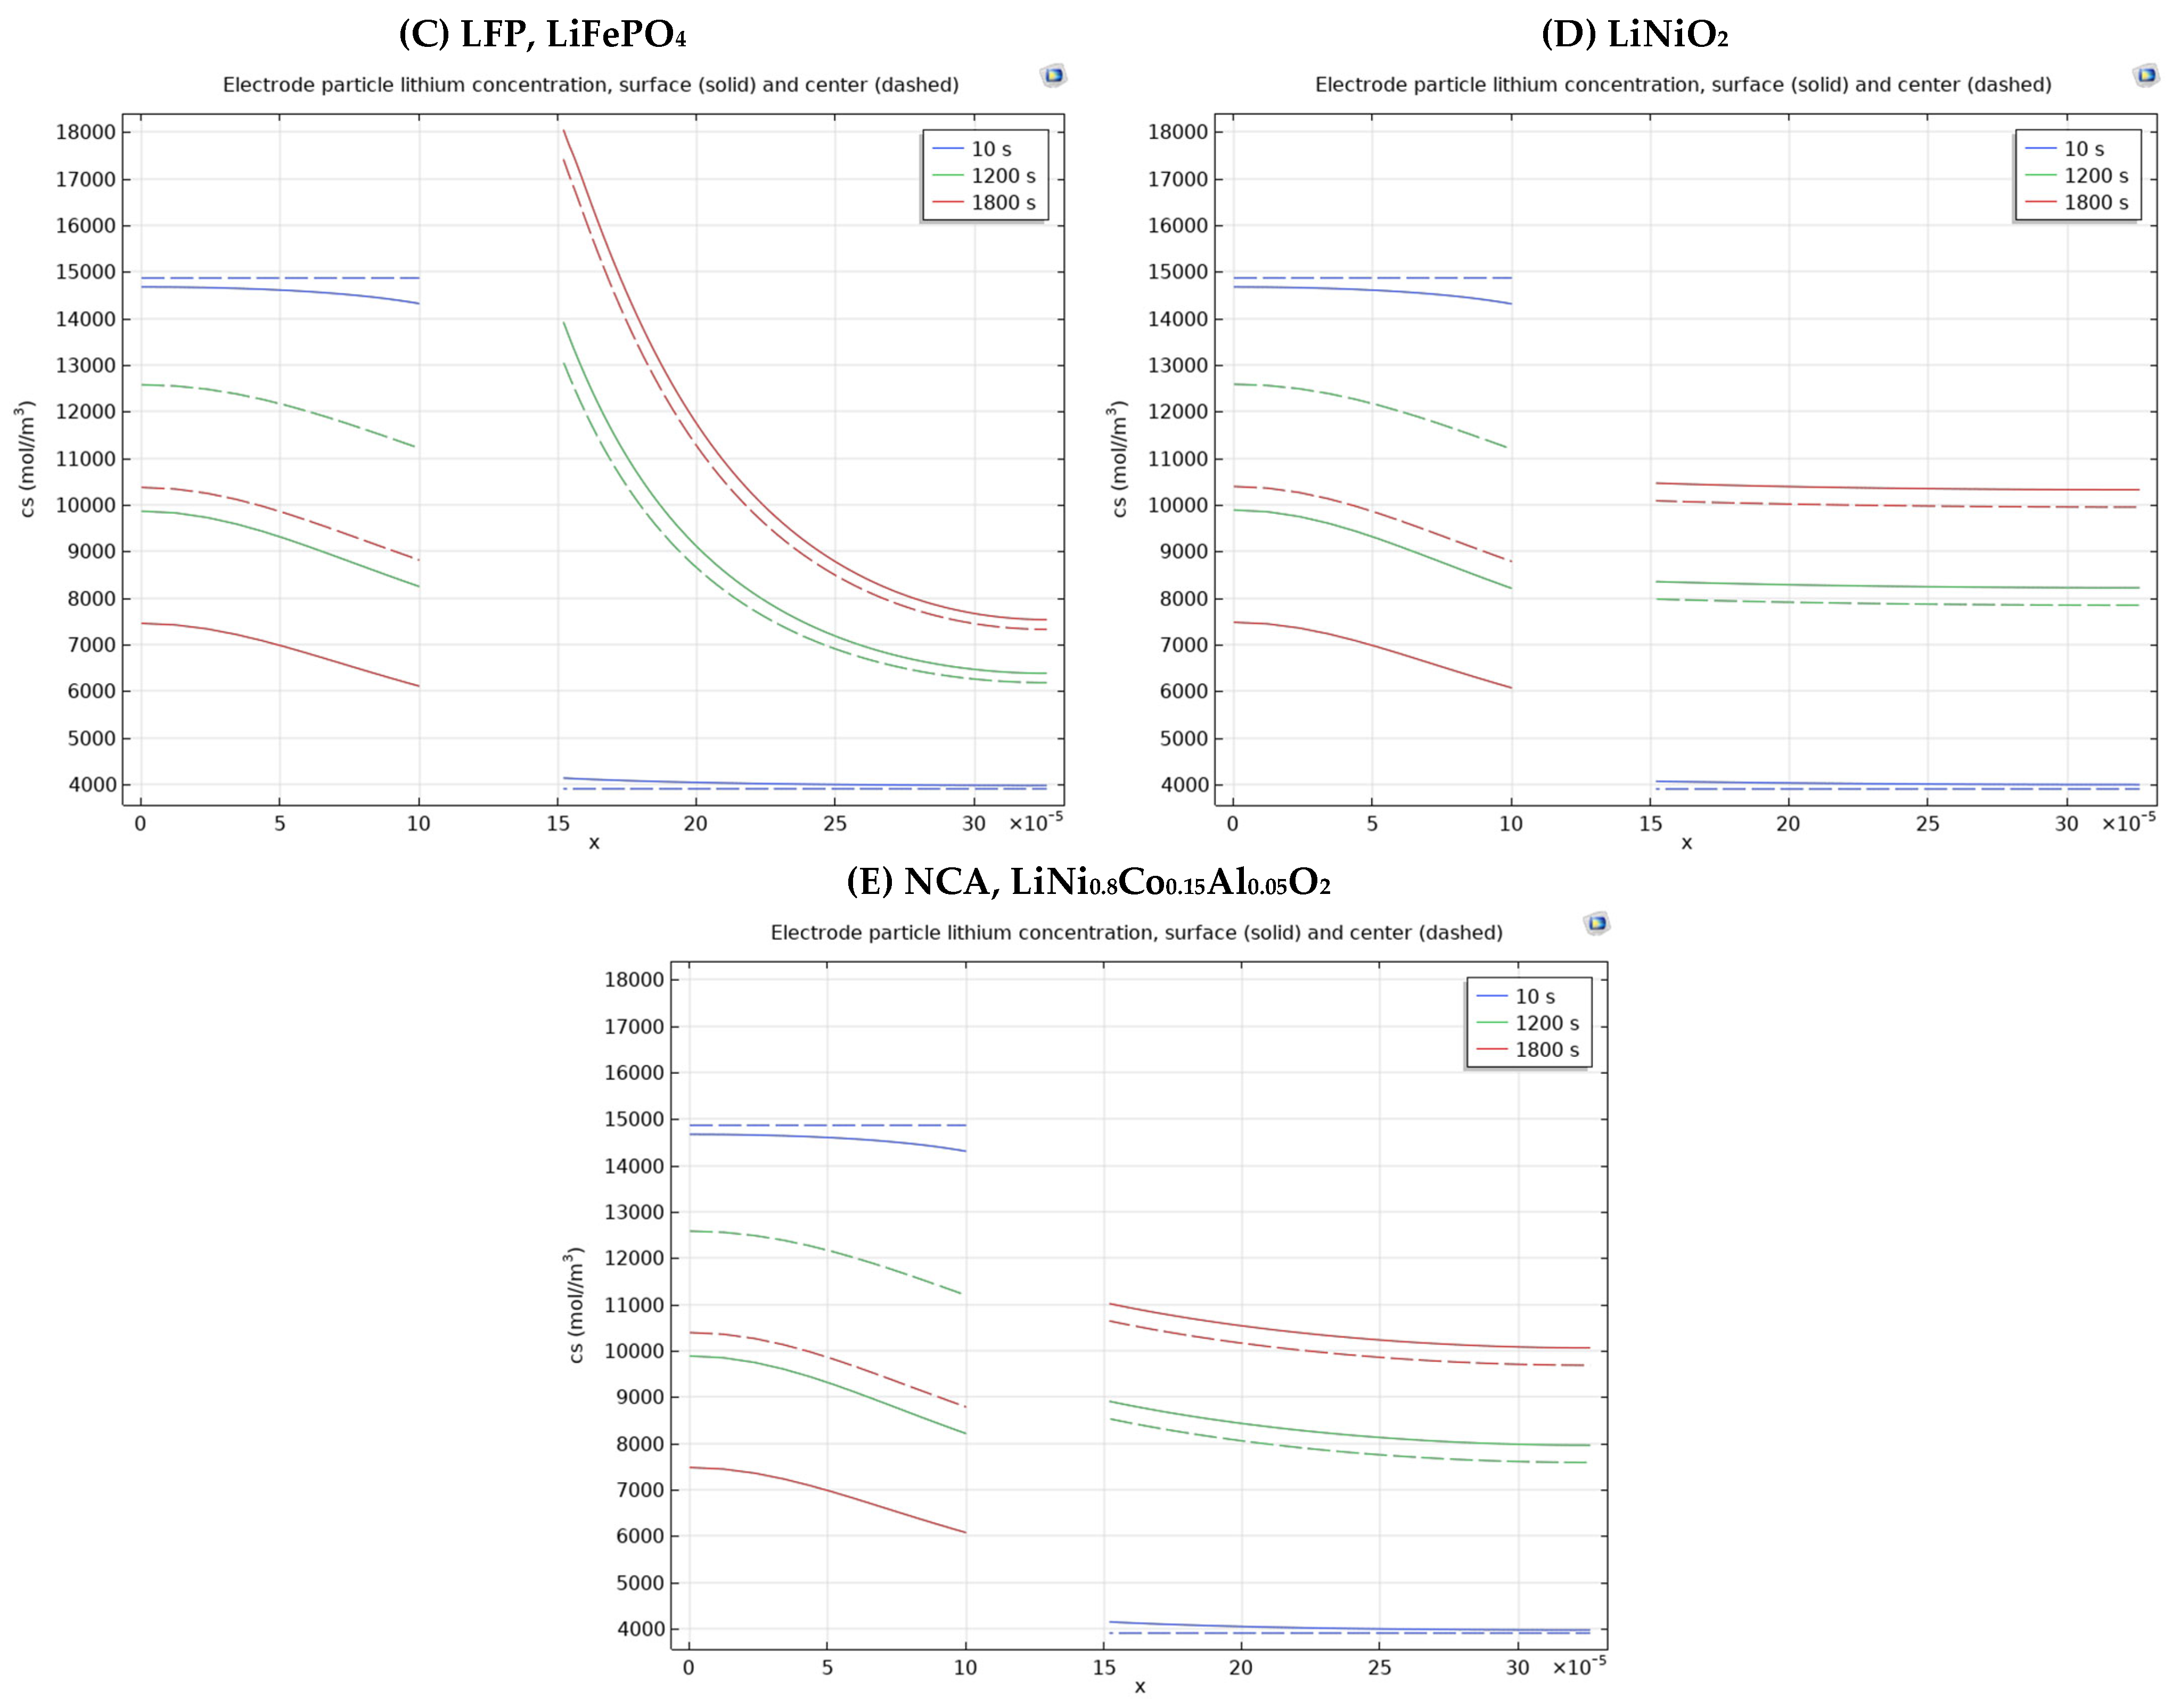
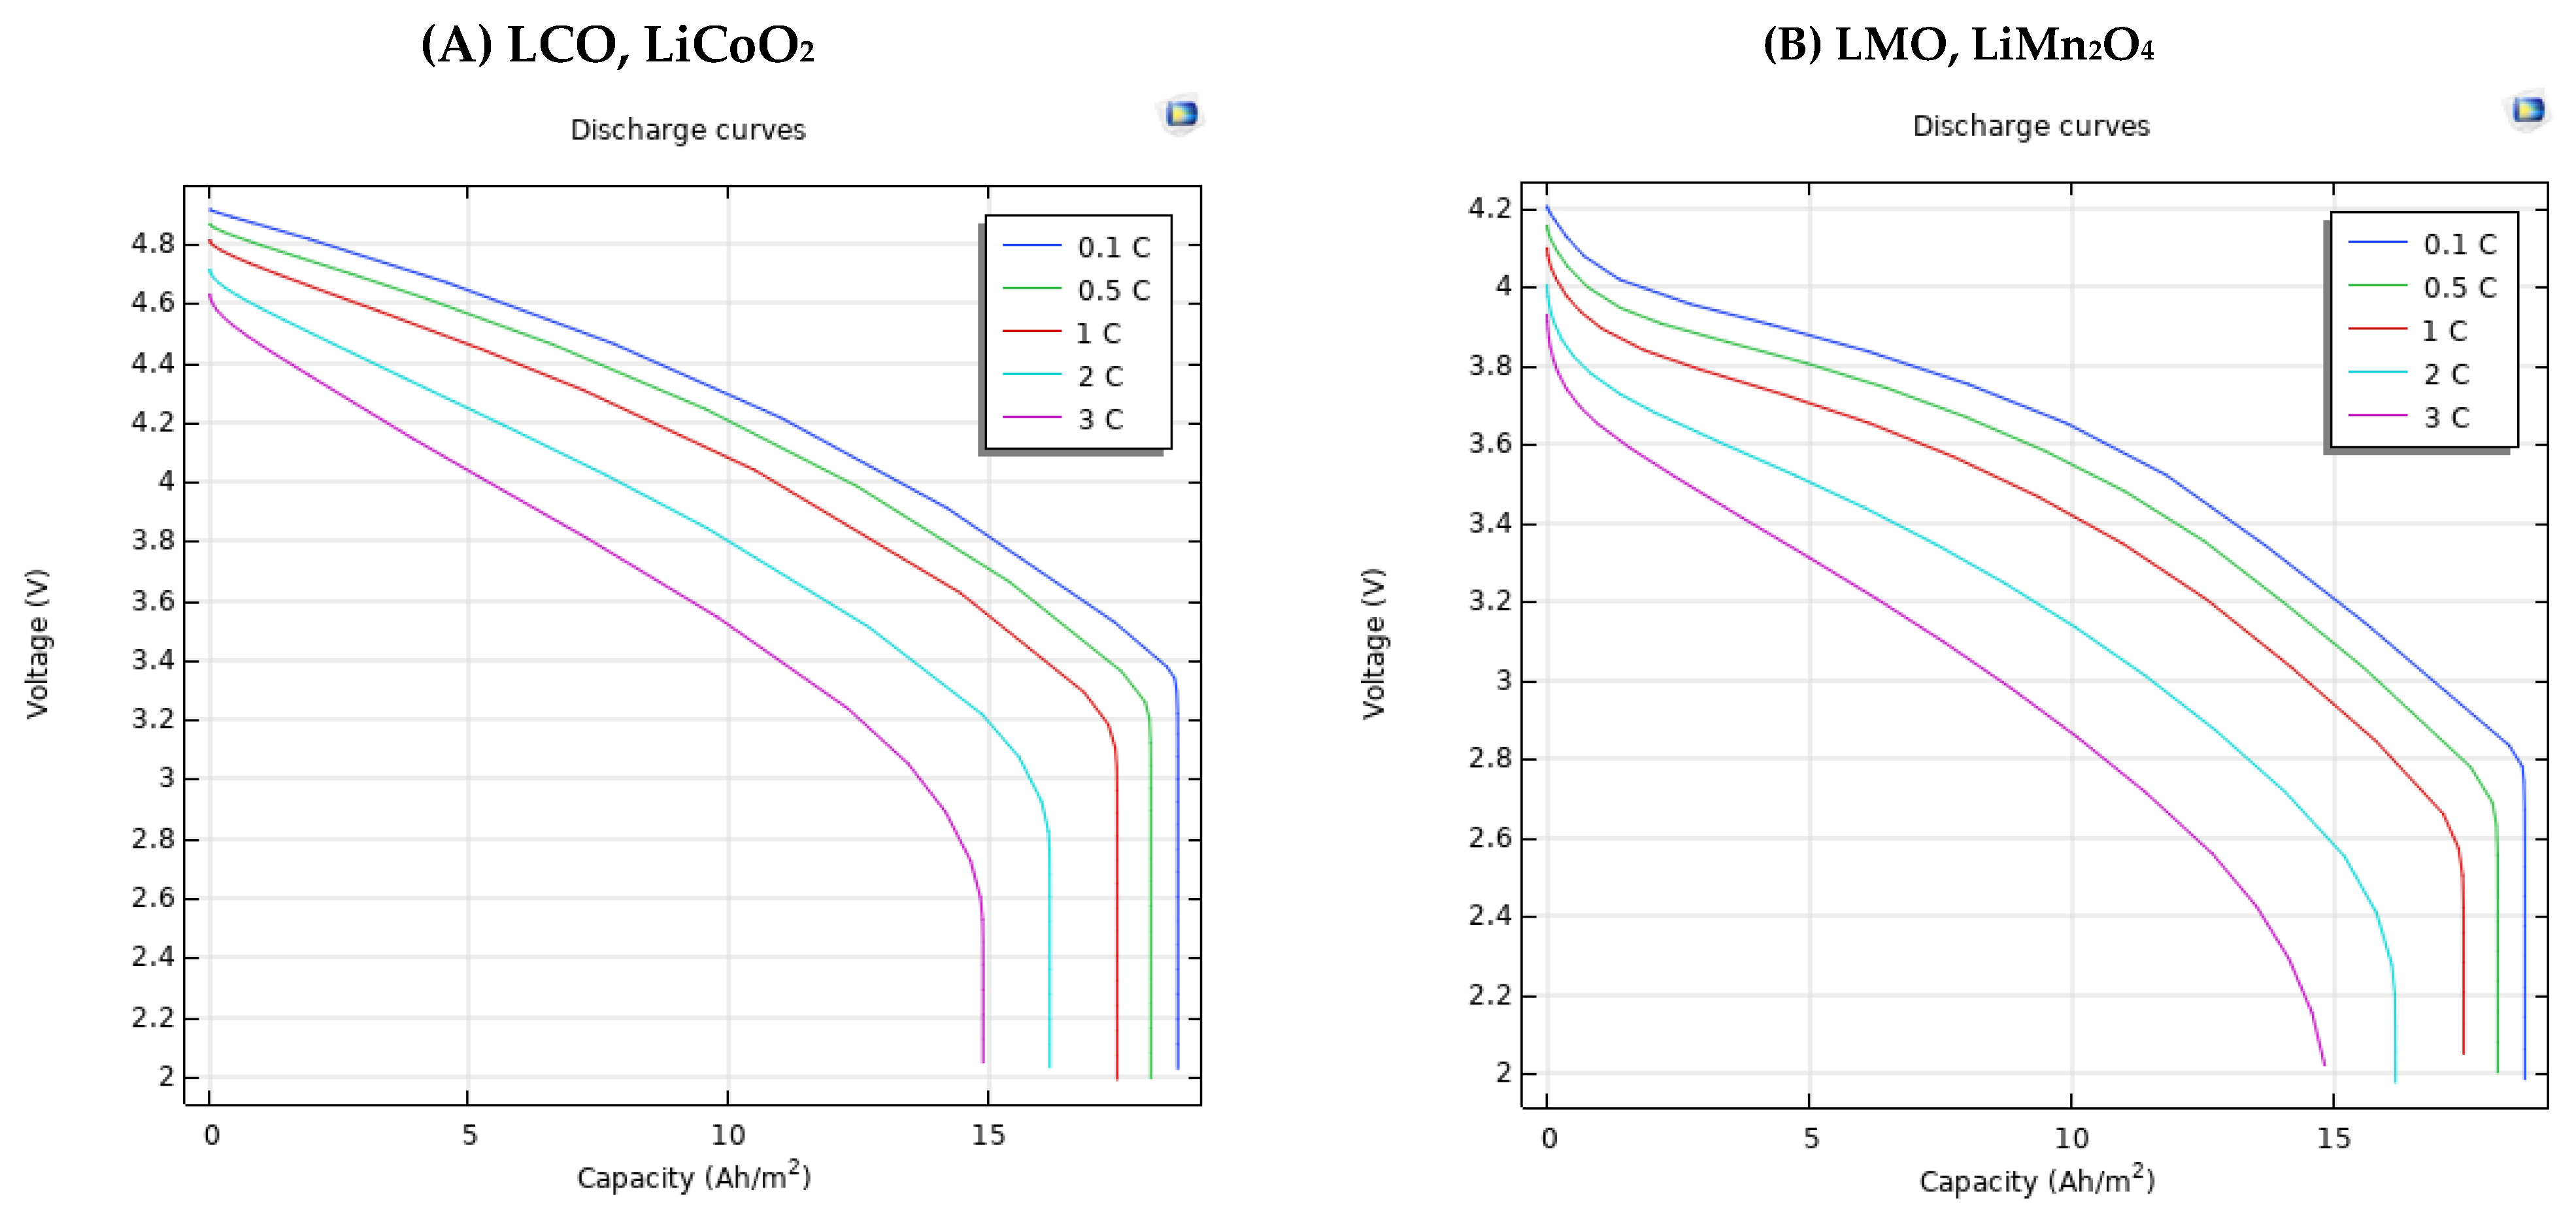
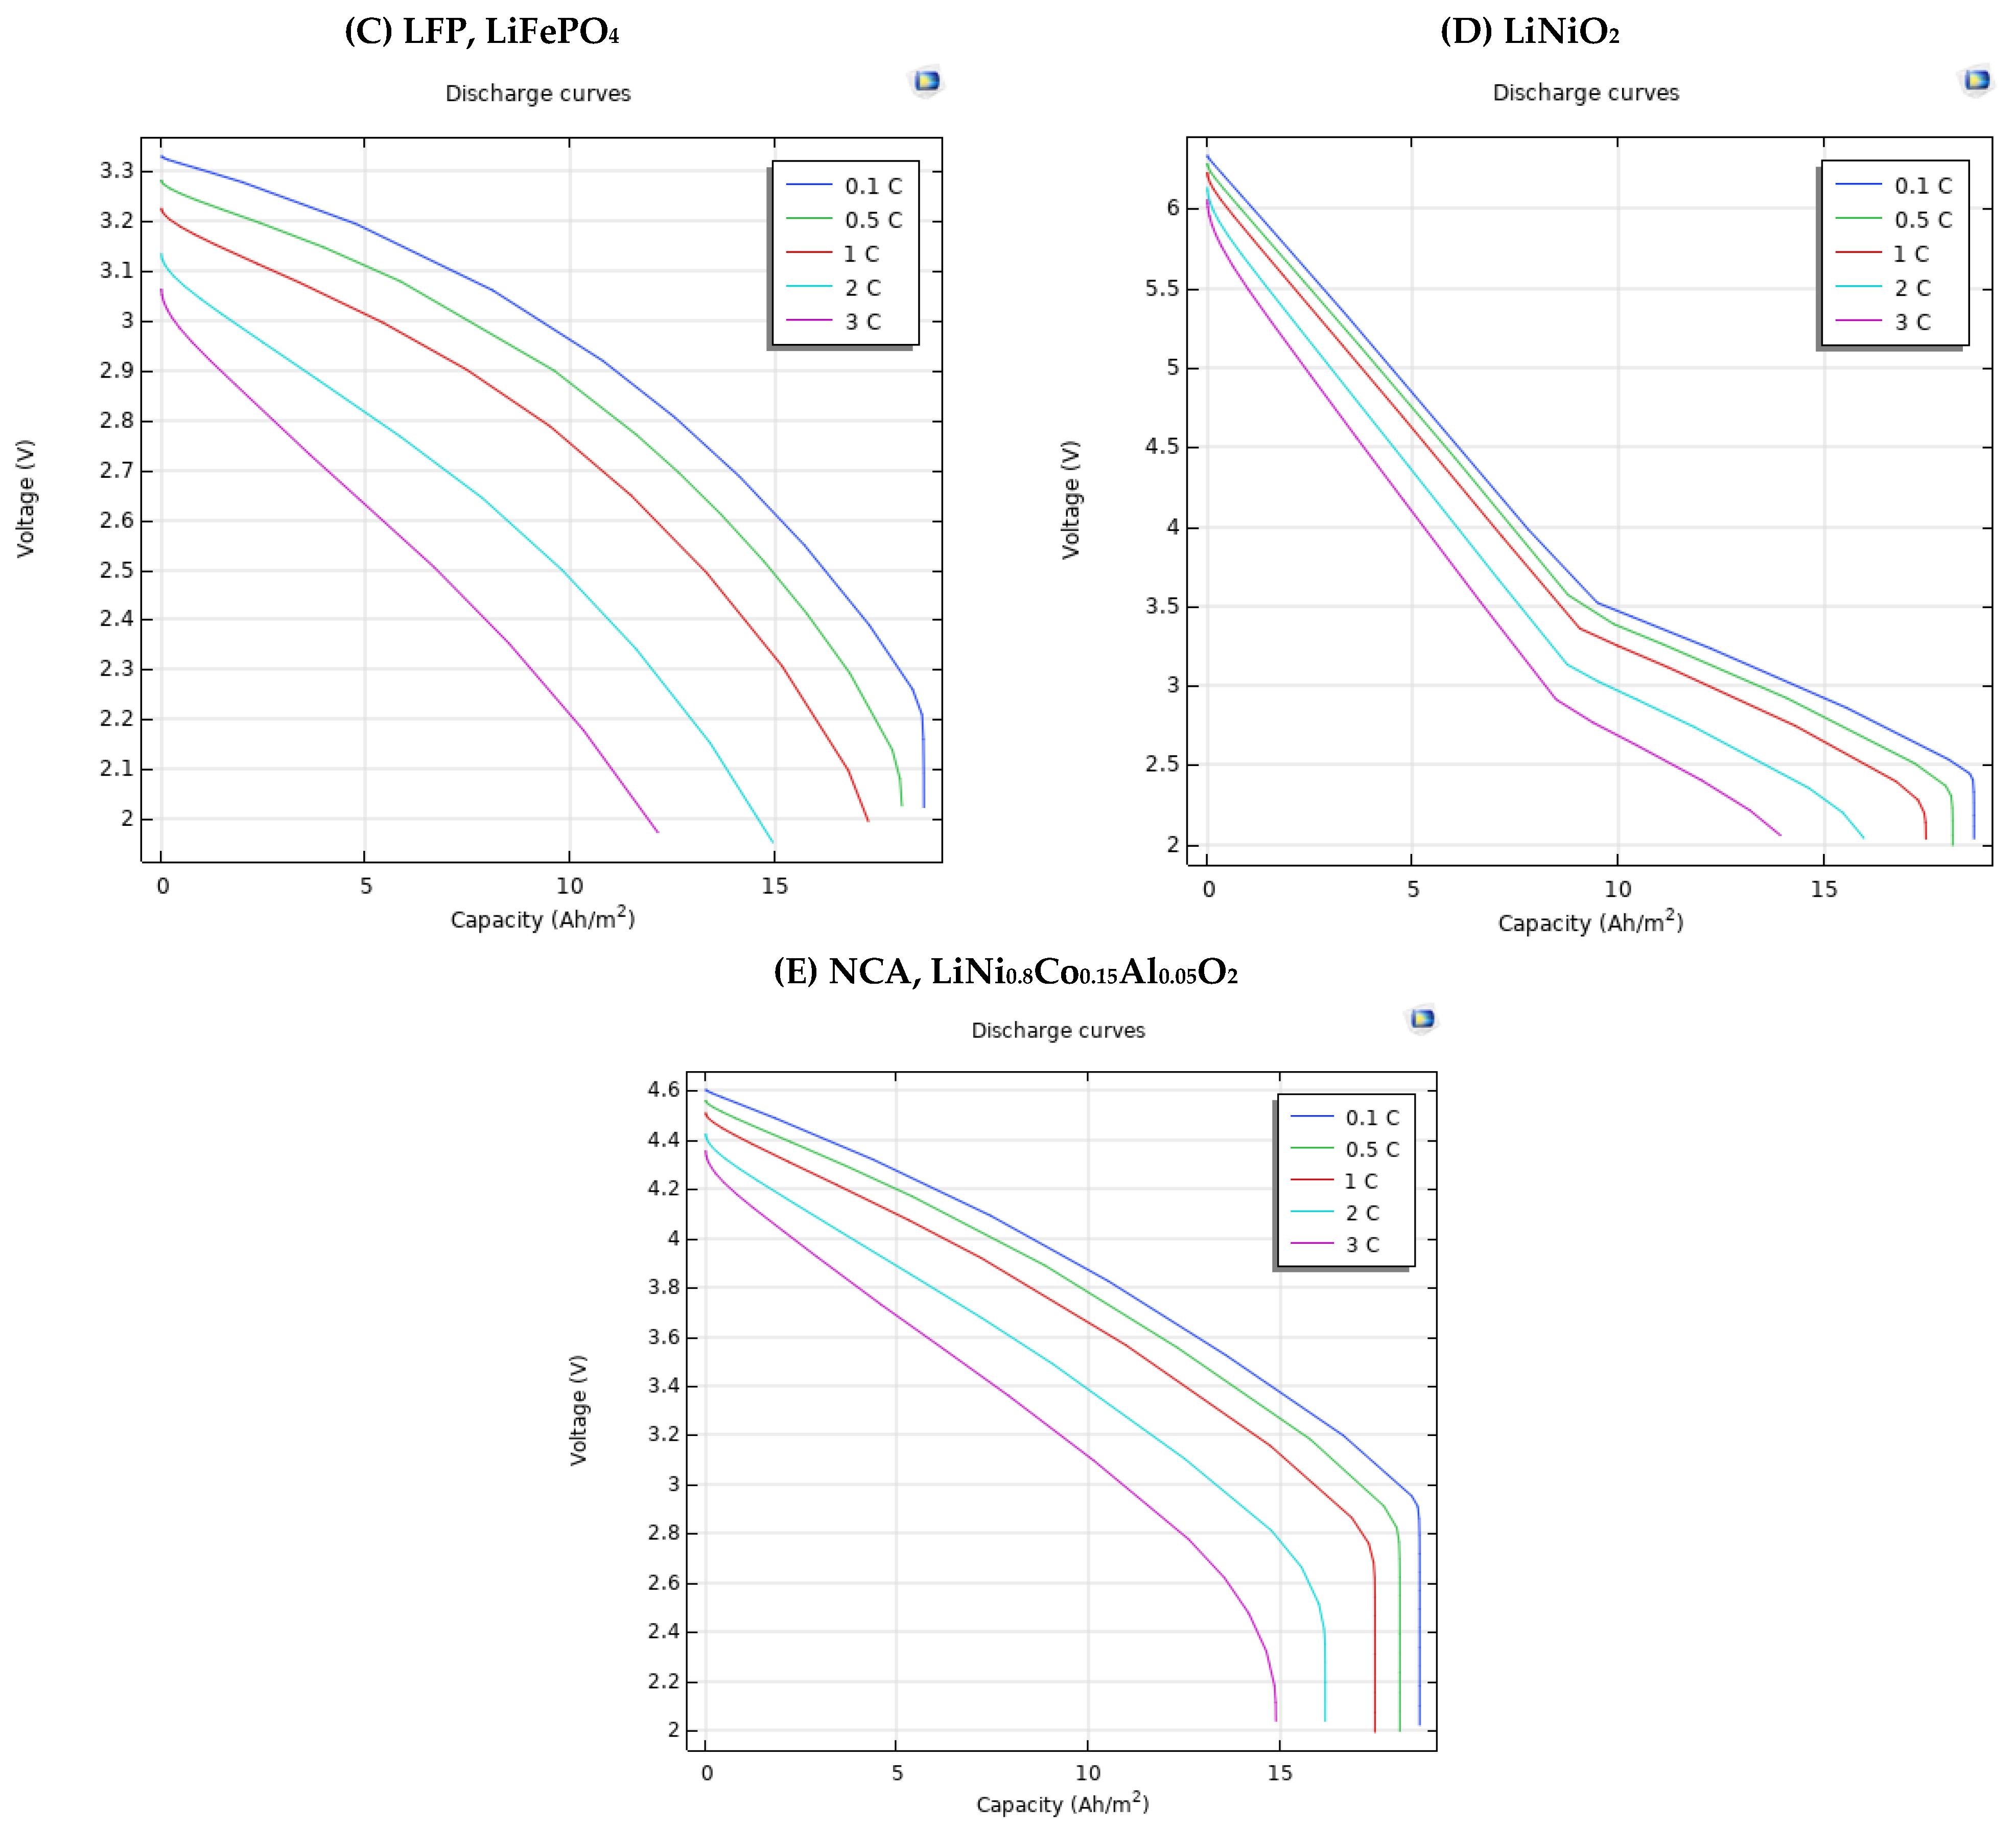
3.3. Different Electrode Material Effects on Simulation Results

Among common cathode materials, LCO demonstrates superior specific energy density. The electrochemical characteristics vary significantly between materials: LMO batteries function between 3.0 and 4.2 V (nominal 3.7 V), while LFP cells operate at 2.5–3.65 V with a 3.2 V nominal voltage. Although LFP exhibits reduced capacity compared to alternatives, its remarkable voltage plateau stability makes it one of the most dependable Li-ion battery technologies. Notably, NCA cathodes combine three key advantages: high energy density, outstanding power density, and superior cycle durability. LFP demonstrates exceptional electrochemical performance during high-current operation. LFP exhibits a comparatively low operating voltage and specific capacity, along with a notably slow reaction rate with the electrolyte. In contrast, NCA stands out due to its high specific capacity and elevated operating voltage [20].
Some properties of the five different positive electrode materials from the COMSOL Multiphysics battery and design module material library are listed in the Appendix A section.
Figure 7 and Table 3 show that average electrode state of charge (AESOC) amounts for five Li-ion batteries having different positive electrode materials, under the same load cycling as the previous set of results and under 1 C-rate. Negative electrodes (porous electrode 1 in the graphs) have the same AESOC values for all battery types examined in this paper. In terms of the positive electrode (porous electrode 2 in the graphs), LFP (graph C) has the biggest AESOC increase with 0.33, followed by lithium nickel oxide (LiNiO2) with 0.31, LMO with 0.3, NCA with 0.14, and LCO has the smallest AESOC rise with 0.121 in the discharge period. If reference concentration and density of cathode materials are put in increasing order, the ranking would be LFP, LMO, LiNiO2, NCA, and LCO. This order is nearly the same as the average SOC increase in the alignment of positive materials from higher to lower. Finally, LFP exhibits outstanding performance under high-rate operational conditions, as already indicated in [20]. Variations in AESOC provide valuable insight into the electrochemical balance, operational efficiency, and durability of Li-ion batteries throughout charge–discharge cycling. The reference concentration and density of cathode materials significantly influence AESOC behavior by determining the Li-ion storage capacity and the mass transport characteristics of the electrode. Materials with lower reference concentrations and densities, such as LFP and LMO, exhibit greater changes in AESOC during discharge. This is due to their lower initial lithium content per unit volume or mass, which leads to a larger fractional change in SOC during cycling. On the other hand, high-density and high-concentration materials such as LCO and NCA have a greater capacity to store lithium but show smaller AESOC variations because their total lithium content is larger, and the relative change in SOC is more moderate under the same cycling conditions. These AESOC trends are closely related to battery performance and health. Materials with higher AESOC fluctuations (e.g., LFP) tend to offer improved safety, structural stability, and longer cycle life, although at the cost of lower energy density. In contrast, materials with smaller AESOC variations (e.g., LCO or NCA) enable higher energy output but may face greater structural stress and degradation over time, potentially reducing battery lifespan. Therefore, AESOC behavior not only reflects the electrochemical properties of electrode materials but also provides insight into trade-offs between energy density, cycling stability, and long-term battery health.
Positive and negative electrode surface and center particle lithium concentration values of five different Li-ion batteries for a 1 C-rate are reported in Figure 8. Moreover, Table 4 provides expanded knowledge about Figure 8. When focusing on Table 4, LFP has the biggest difference in electrode particle lithium concentration of the positive electrode surface for the beginning and end of the electrode with 1200 and 1800 s. LiNiO2 has the smallest difference in electrode particle lithium concentration of the positive electrode surface for the beginning and end of the electrode at chosen times. These comparisons are also the same for electrode particle lithium concentration of the center.
Finally, when we look at the Figure 9 and Table 5 discharge curves, LiNiO2 has the highest voltage value; after that, LCO, NCA, LMO, and finally, LFP have the lowest potential at the beginning of the discharge period. On the other hand, LCO has the maximum potential; after that, NCA, LMO, LiNiO2 and finally, LFP have the minimum voltage value when examining voltage values according to the increase of capacity toward the end of discharge. Figure 9 and Table 5 also illustrate that the highest voltage difference belongs to LiNiO2 with 3.58 V for 1 C-rate between 0 Ah/m2 and 15 Ah/m2. This can be advantageous in applications that require high energy but where voltage stability is a secondary concern. LFP has the least potential difference, with 0.9 V for 1 C-rate between 0 Ah/m2 and 15 Ah/m2. On the other hand, although LFP’s low voltage difference indicates limited energy density, its highly stable voltage profile makes it suitable for applications that demand safety and long cycle life. LFP is characterized by a relatively low operating voltage and specific capacity and exhibits a significantly slow rate of reactivity with the electrolyte. NCA is distinguished by its high specific capacity and operating voltage [20].

4. Conclusions

Electrodes and electrolytes are the main components of batteries. A model-guided selection of these basic components is an effective development strategy to design more efficient battery types and operation modes. Electric batteries depend on electrochemistry, so functional materials (in terms of physical and chemical properties) have a first-order importance. This paper researched material effects on 1D isothermal Li-ion battery simulation results with the battery and design module of COMSOL Multiphysics 6.0 software. According to this study, the average electrolyte salt concentration range of electrodes is approximately 70% higher for batteries with polymer electrolyte material compared with liquid electrolyte material battery species, except for the battery with LiPF6 in 1:1 EC:DEC (liquid) electrolyte material. On the other hand, the average electrolyte salt concentration range of electrolyte components is approximately 40% higher for the same situation. The battery with LiPF6 in 1:1 EC:DEC (liquid) electrolyte material has the widest range of average electrolyte salt concentration, with 195 mol/m3 for the electrolyte component. The discharge profiles of Li-ion batteries with liquid electrolyte materials exhibited higher voltage, with around 0.05 V for 1 C-rate, compared to those with polymer electrolyte materials. This difference is similar to the other C-rates. Subsequently, variations in positive electrode materials were investigated. Throughout the discharge duration, the material type demonstrating lower concentration and density values exhibited a more pronounced elevation in AESOC values, whereas during the charging duration, a more substantial decline in AESOC values was observed. The Li-ion battery with LFP positive electrode material shows the largest variation with 9122 mol/m3 in lithium concentration at the surface of the chosen two points across the battery for 1800 s. In contrast, another Li-ion battery having LiNiO2 cathode material exhibits the smallest variation, with 123 mol/m3 in lithium concentration for the same case. This trend also holds true for the lithium concentration in the center of the electrode particles. Finally, the highest voltage difference belongs to the LiNiO2 with 3.58 V, and LFP has the least potential difference with 0.9 V for 1 C-rate between 0 Ah/m2 and 15 Ah/m2. The highest potential belongs to the LiNiO2 with 6.17 V, and the lowest voltage is 3.21 for LFP at the beginning of the discharge period. On the other hand, LCO has the highest voltage, and LFP has the smallest potential at the end of the discharge time.
In addition to revealing the material-based variations in battery performance, the outcomes of this simulation study provide critical insights for battery designers and modelers. The observed differences in electrolyte salt concentration ranges and discharge voltage profiles suggest that selecting between polymer and liquid electrolytes can significantly impact battery efficiency and operational stability, depending on the intended application. Furthermore, the analysis of positive electrode materials demonstrates how different material properties, such as lithium diffusion rates and density, influence the battery’s state of charge dynamics and overall voltage behavior. These insights can help battery modelers to enhance the accuracy of their simulations, particularly when designing batteries for applications requiring high power output, fast charging, or long cycle life. For high-energy applications such as electric vehicles, LiNiO2 and NCA emerge as the most promising candidates due to their high initial discharge voltages and superior energy density characteristics. In contrast, for applications where long-term stability, operational safety, and extended cycle life are of paramount importance, LFP stands out as the most suitable material, offering a balanced trade-off between performance and reliability. By understanding the relationship between material choice and electrochemical performance characteristics, designers can make more informed decisions during the material selection and design process. This ultimately supports the development of more efficient, reliable, and application-specific Li-ion batteries. The findings of this study thus serve as a reference for both practical battery engineering and future simulation-based research in the field.

Author Contributions

Conceptualization, A.d.; methodology, E.K.; software, E.K.; validation, E.K.; formal analysis, E.K. and A.d.; investigation, E.K.; resources, A.d.; data curation, E.K.; writing—original draft preparation, E.K.; writing—review and editing, E.K. and A.d.; visualization, E.K.; supervision, A.d.; project administration, E.K. and A.d.; funding acquisition, E.K. and A.d. All authors have read and agreed to the published version of the manuscript.

Funding

This research was funded by the Türkiye Ministry of National Education for Elif Kaya, PhD, at the University of Modena and Reggio Emilia, and this research was funded by the European Union, NextGenerationEU_National Sustainable Mobility Center_MOST, CN00000023, Italian Ministry of University and Research, Spoke 12 (CUP: E93C22001070001) for Alessandro d’Adamo.

Data Availability Statement

The data presented in this study are available on request from the corresponding author due to ongoing development of the model in the context of the PhD research.

Acknowledgments

Elif Kaya acknowledges the financial support provided by the Republic of Türkiye Ministry of National Education for her PhD at the University of Modena and Reggio Emilia. Alessandro d’Adamo acknowledges the financial support provided by the European Union, NextGenerationEU_National Sustainable Mobility Center_MOST, CN00000023, Italian Ministry of University and Research, Spoke 12 (CUP: E93C22001070001).

Conflicts of Interest

The authors declare no conflict of interest.

Abbreviations

The following abbreviations are used in this manuscript:
Li-ionLithium-ion
LFPLithium Iron Phosphate
RESRenewable Energy Source
DMCDimethyl Carbonate
DECDiethyl Carbonate
EMCEthyl Methyl Carbonate
ECEthylene Carbonate
PCPropylene Carbonate
PEOPolyethylene Oxide
PVDFPolyvinylidene Fluoride
HFPHexafluoropropylene
PMMAPolymethyl Methacrylate
PANPolyacrylonitrile
PVCPolyvinyl Chloride
SEISolid Electrolyte Interphase
SPESolid Polymer Electrolyte
PVAPolyvinyl Alcohol
PSPolystyrene
EVElectric Vehicle
FeIron
AlAluminum
CoCobalt
NiNickel
MnManganese
LCOLithium Cobalt Oxide
LMOLithium Manganese Oxide
NCALithium Nickel Cobalt Aluminum Oxide
SEMScanning Electron Microscope
DCRDirect Current Resistance
AESOCAverage Electrode State of Charge

Appendix A

Table A1. Five different positive electrode material properties.
Electrode Material TypeElectrical ConductivityReference ConcentrationMaximum-Minimum Electrode SOCPoisson’s RatioYoung’s ModulusDensityDiffusion CoefficientSome Other Properties
LCO, LiCoO21.13 mS/cm56250 mol/m31
0.43
0.24191 GPa5000 kg/m35 × 10−13 m2/sCoefficient of Thermal Expansion
1.3 × 10⁻⁵ 1/K
LMO, LiMn2O43.8 S/m22860 mol/m30.995
0.175
0.26194 GPa4140 kg/m3
LFP, LiFePO491 S/m21190 mol/m30.90
0.01
0.3117.8 GPa3600 kg/m33.2 × 10−13 m2/sThermal ConductivityHeat Capacity at Constant Pressure
1 W/(m × K)881 J/(kg × K)
LiNiO2100 S/m23000 mol/m31
0.45
4650 kg/m3 Temperature Derivative of Equilibrium Potential
0 V/K
NCA, LiNi0.8Co0.15Al0.05O291 S/m48000 mol/m31
0.25
4740 kg/m31.5 × 10−15 m2/s

References

  1. Kaya, A.F.; Acir, A.; Kaya, E. Numerical investigation of wind-lens combinations for improving aerodynamic performance of an elliptical-bladed Savonius wind turbine. J. Braz. Soc. Mech. Sci. Eng. 2023, 45, 309. [Google Scholar] [CrossRef]
  2. Available online: https://www.turcomoney.com/batarya-teknolojisi-gelecegi-sekillendirmede-belirleyici-olacak.html (accessed on 1 March 2025).
  3. Available online: https://www.pilsitesi.com/blog/icerik/pil-nedir (accessed on 5 March 2025).
  4. Silberberg, M. Chemistry: The Molecular Nature of Matter and Change; McGraw-Hill Higher Education: New York, NY, USA, 2014. [Google Scholar]
  5. Li, A.; Yuen, A.C.Y.; Wang, W.; De Cachinho Cordeiro, I.M.; Wang, C.; Chen, T.B.Y.; Zhang, J.; Chan, Q.N.; Yeoh, G.H. A review on lithium-ion battery separators towards enhanced safety performances and modelling approaches. Molecules 2021, 26, 478. [Google Scholar] [CrossRef]
  6. Available online: https://evreporter.com/understanding-memory-effect-in-lithium-ion-batteries/ (accessed on 2 February 2025).
  7. Lithium Salts And Solvents Effects On Electrolyte Wetting. Available online: https://iestbattery.com/effect-of-lithium-salts-on-the-electrolyte-wetting/ (accessed on 24 March 2025).
  8. Baskakova, Y.V.; Yarmolenko, O.V.; Efimov, O.N. Polymer gel electrolytes for lithium batteries. Russ. Chem. Rev. 2012, 81, 367–380. [Google Scholar] [CrossRef]
  9. Different Electrolytes between Li-ion and Li-Po Batteries—Lithium ion Battery Manufacturer and Supplier in China-DNK Power. Available online: https://www.dnkpower.com/different-electrolytes-li-ion-vs-lipo/ (accessed on 17 January 2025).
  10. Esd, A. Material and Energy Flows in the Materials Production, Assembly, and End-of-Life Stages of the Automotive Lithium-Ion Battery Life Cycle Energy Systems Division. n.d. Available online: www.anl.gov (accessed on 15 January 2025).
  11. O’leary, B. High-Volume Manufacturing of LiPF 6, A Critical Lithium-Ion Battery Material; Honeywell International Inc.: Buffalo, NY, USA, 2011. [Google Scholar]
  12. Goodenough, J.B.; Kim, Y. Challenges for rechargeable Li batteries. In Chemistry of Materials; ACS Publications: Washington, DC, USA, 2010; Volume 22, pp. 587–603. [Google Scholar] [CrossRef]
  13. Qian, Y.; Hu, S.; Zou, X.; Deng, Z.; Xu, Y.; Cao, Z.; Kang, Y.; Deng, Y.; Shi, Q.; Xu, K.; et al. How electrolyte additives work in Li-ion batteries. Energy Storage Mater. 2019, 20, 208–215. [Google Scholar] [CrossRef]
  14. Ball, R. Electrolytes for Lithium and Lithium-Ion Batteries. Johns. Matthey Technol. Rev. 2015, 59, 30–33. [Google Scholar] [CrossRef]
  15. Yang, S.; Li, S.; Meng, Y.; Yu, M.; Liu, J.; Li, B. Corrosion inhibition of aluminum current collector with molybdate conversion coating in commercial LiPF6-esters electrolytes. Corros. Sci. 2021, 190, 109632. [Google Scholar] [CrossRef]
  16. Walker, C.W.; Cox, J.D.; Salomon, M. Conductivity and electrochemical stability of electrolytes containing organic solvent mixtures with Lithium tris(Trifluoromethanesulfonyl)methide. J. Electrochem. Soc. 1996, 143, L80–L82. [Google Scholar] [CrossRef]
  17. Kanamura, K.; Okagawa, T.; Takehara, Z.-I. Electrochemical oxidation of propylene carbonate (containing various salts) on aluminium electrodes. J. Power Sources 1995, 57, 119–123. [Google Scholar] [CrossRef]
  18. Sashmitha, K.; Rani, M.U. A comprehensive review of polymer electrolyte for lithium-ion battery. In Polymer Bulletin; Springer Science and Business Media Deutschland GmbH: Berlin/Heidelberg, Germany, 2023; Volume 80, pp. 89–135. [Google Scholar] [CrossRef]
  19. Ramasekhara Reddy, M.; Srinivas, D. Comparative Performance Analysis of Different Cathode materials of Solid State Lithium ion Battery. Int. J. Recent Innov. Trends Comput. Commun. 2023, 11, 465–478. [Google Scholar] [CrossRef]
  20. Available online: https://batteryuniversity.com/articles/article/types_of_lit (accessed on 27 January 2025).
  21. Shim, J.; Striebel, K.A. Effect of electrode density on cycle performance and irreversible capacity loss for natural graphite anode in lithium-ion batteries. J. Power Sources 2003, 119, 934–937. [Google Scholar] [CrossRef]
  22. Choi, J.; Son, B.; Ryou, M.H.; Kim, S.H.; Ko, J.M.; Lee, Y.M. Effect of LiCoO2 cathode density and thickness on electrochemical performance of lithium-ion batteries. J. Electrochem. Sci. Technol. 2013, 4, 27–33. [Google Scholar] [CrossRef]
  23. Smekens, J.; Gopalakrishnan, R.; Van den Steen, N.; Omar, N.; Hegazy, O.; Hubin, A.; Van Mierlo, J. Influence of electrode density on the performance of Li-ion batteries: Experimental and simulation results. Energies 2016, 9, 104. [Google Scholar] [CrossRef]
  24. Chabot, V.; Farhad, S.; Chen, Z.; Fung, A.S.; Yu, A.; Hamdullahpur, F. Effect of electrode physical and chemical properties on lithium-ion battery performance. Int. J. Energy Res. 2013, 37, 1723–1736. [Google Scholar] [CrossRef]
  25. Ye, Y.; Shi, Y.; Cai, N.; Lee, J.; He, X. Electro-thermal modeling and experimental validation for lithium ion battery. J. Power Sources 2012, 199, 227–238. [Google Scholar] [CrossRef]
  26. Zheng, H.; Li, J.; Song, X.; Liu, G.; Battaglia, V.S. A comprehensive understanding of electrode thickness effects on the electrochemical performances of Li-ion battery cathodes. Electrochim. Acta 2012, 71, 258–265. [Google Scholar] [CrossRef]
  27. 1D Isothermal Lithium Ion Battery. COMSOL Inc. Available online: https://www.comsol.com/model/1d-isothermal-lithium-ion-battery-686 (accessed on 17 February 2025).
  28. Lu, J. Development of Fast One-Dimensional Model for Prediction of Coupled Electrochemical-Thermal Behavior of Lithium-Ion Batteries. Doctoral Dissertation, The Ohio State University, Columbus, OH, USA, 2013. [Google Scholar]
  29. Huber, I.S. Using COMSOL to Model a 1-D Lithium-Ion Battery; College of William and Mary, Department of Physics: Williamsburg, VA, USA, 2017. [Google Scholar]
  30. Linden, D. Handbook of Batteries; McGraw-Hill: New York, NY, USA, 1995. [Google Scholar]
  31. Kaya, E.; Reina, L.; d’Adamo, A. Investigating the Impact of Varied C-Rates on Lithium-Ion Batteries: A 1D Simulation Study. J. Phys. Conf. Ser. 2024, 2893, 012050. [Google Scholar] [CrossRef]
  32. Doyle, M.; Newman, J.; Gozdz, A.S.; Schmutz, C.N.; Tarascon, J.M. Comparison of modeling predictions with experimental data from plastic lithium ion cells. J. Electrochem. Soc. 1996, 143, 1890. [Google Scholar] [CrossRef]
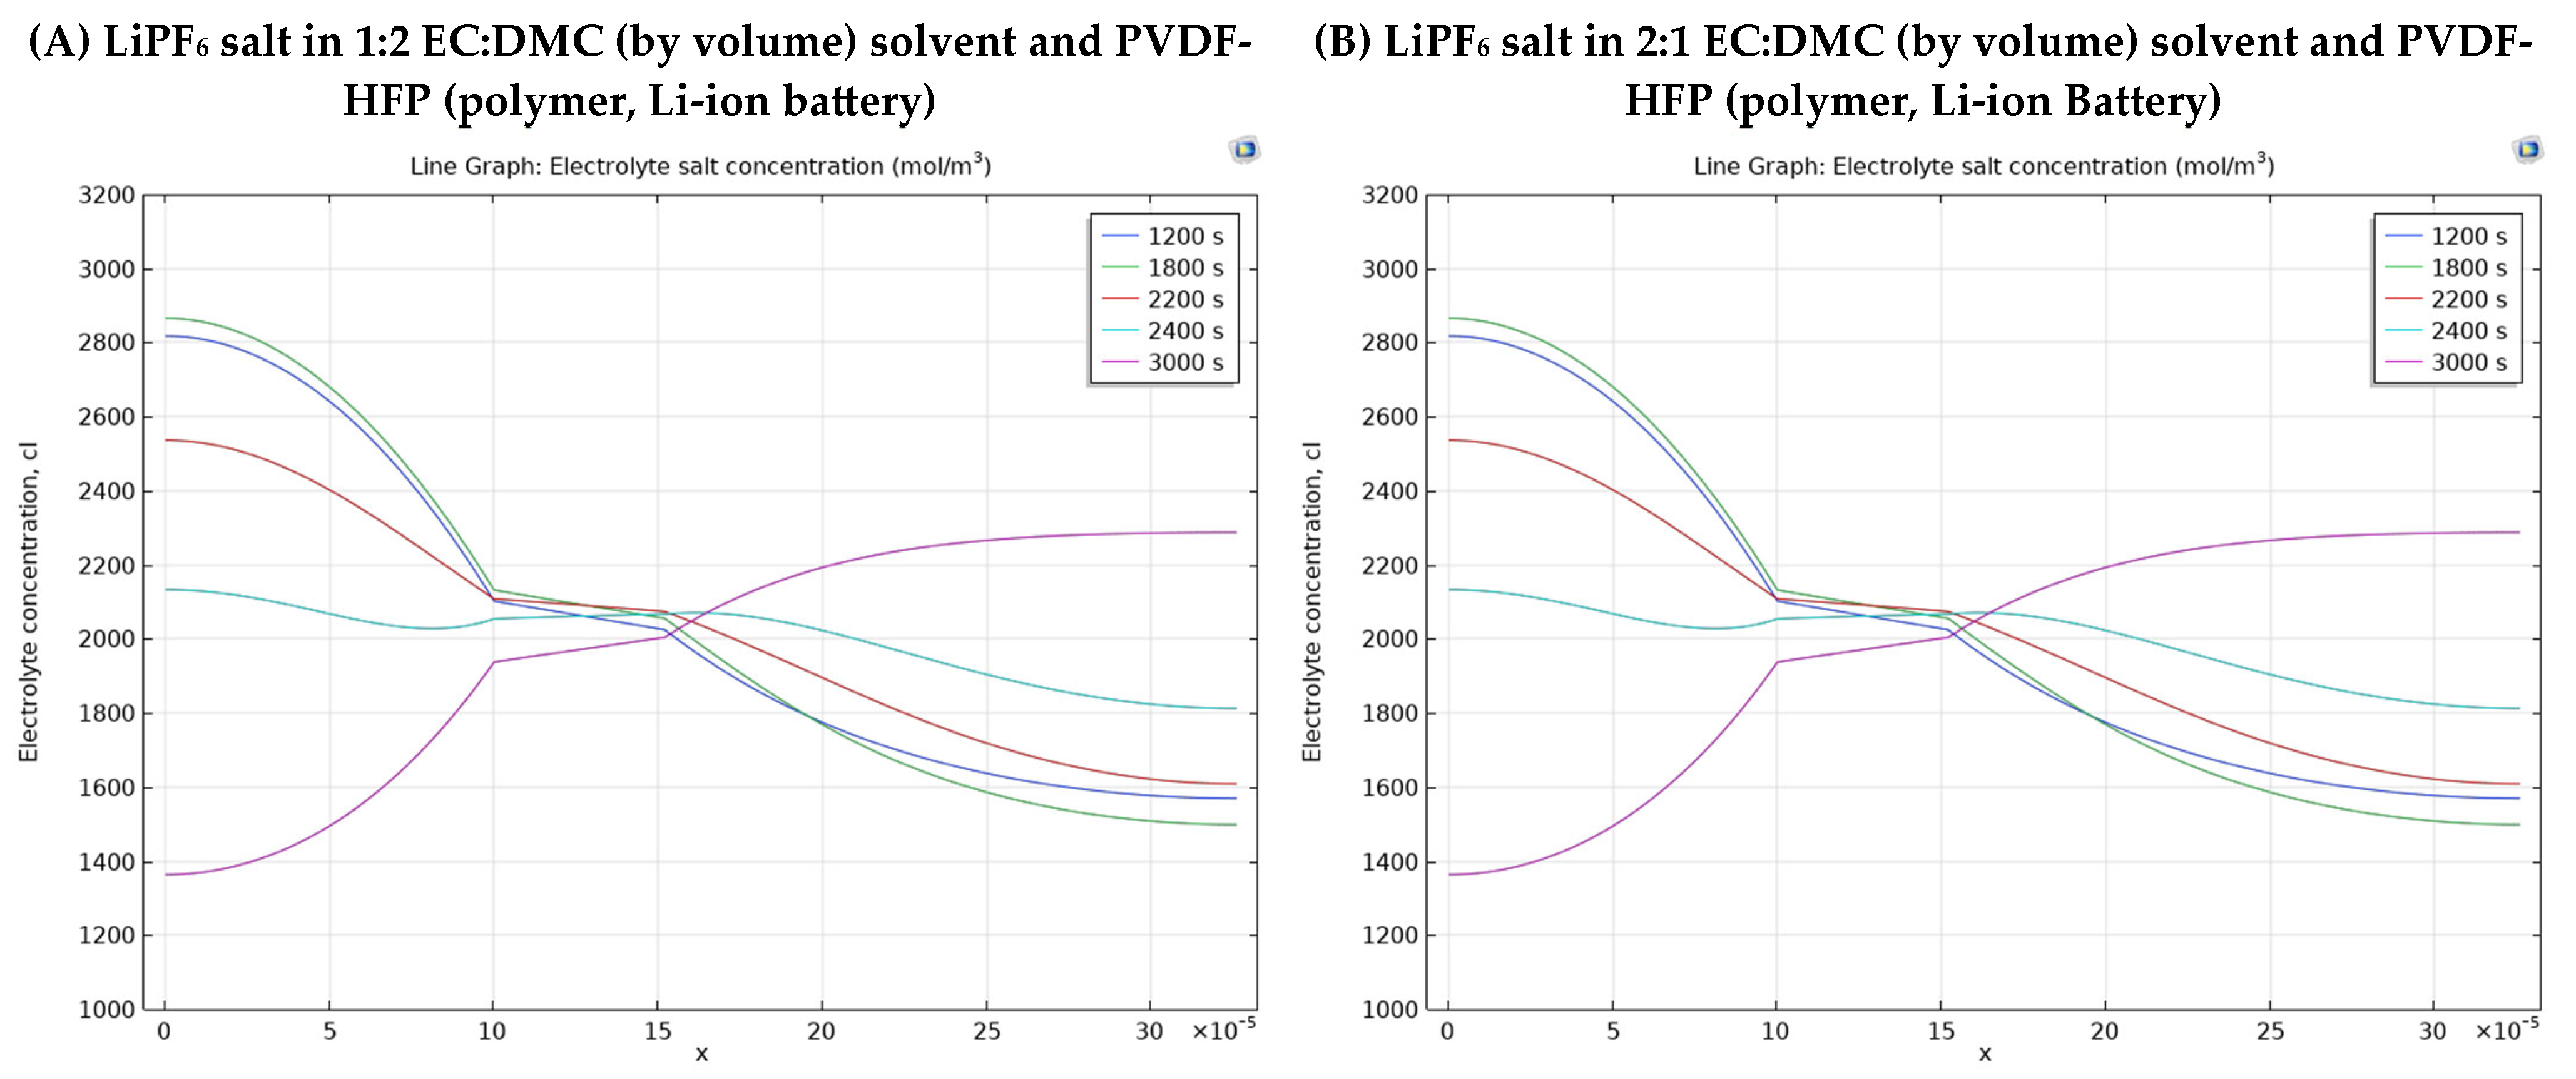
Figure 1. The internal configuration of a Li-ion battery, adapted from [27].
Energies 18 03288 g001
Figure 2. The one-dimensional Li-ion battery model, adapted from [29].
Energies 18 03288 g002
Figure 3. The continuous charging process is being conducted on the battery [29].
Energies 18 03288 g003
Figure 4. Variations in cell potential (V) plotted against capacity (Ah/m2) across different discharge rates.
Energies 18 03288 g004
Figure 5. Electrolyte salt concentration for Li-ion batteries having different electrolyte materials at several instants.
Energies 18 03288 g005aEnergies 18 03288 g005b
Figure 6. Discharge curve comparison of Li-ion batteries having different electrolyte materials for five C-rates.
Energies 18 03288 g006
Figure 7. Average SOC values of porous electrodes for Li-ion batteries having different cathode materials during discharge and charge periods for 1 C-rate.
Energies 18 03288 g007
Figure 8. Surface and center solid lithium concentration for Li-ion batteries having different cathode materials during discharge periods for 1 C-rate.
Energies 18 03288 g008aEnergies 18 03288 g008b
Figure 9. Discharge curve comparison of Li-ion batteries having different electrode materials for five C-rates.
Energies 18 03288 g009aEnergies 18 03288 g009b
Table 1. Average electrolyte salt concentration range of battery components for Li-ion batteries having different electrolyte materials.
Electrolyte Material TypesAverage Electrolyte Salt Concentration Range of Negative Electrode [0–10] × 10−5 mAverage Electrolyte Salt Concentration Range of Electrolyte [10–15.2] × 10−5 mAverage Electrolyte Salt Concentration Range of Positive Electrode [15.2–32.6] × 10−5 m
LiPF6 salt in 1:2 EC:DMC (by volume) solvent and PVDF-HFP (polymer, Li-ion battery)2680 mol/m3–1495 mol/m3 Difference = 1185 mol/m32095 mol/m3–1970 mol/m3 Difference = 125 mol/m32265 mol/m3–1586 mol/m3 Difference = 679 mol/m3
LiPF6 salt in 2:1 EC:DMC (by volume) solvent and PVDF-HFP (polymer, Li-ion battery)2680 mol/m3–1515 mol/m3 Difference = 1165 mol/m32095 mol/m3–1980 mol/m3 Difference = 115 mol/m32245 mol/m3–1583 mol/m3 Difference = 662 mol/m3
LiPF6 in 1:1 EC:DEC (liquid, Li-ion battery)2870 mol/m3–1297 mol/m3 Difference = 1573 mol/m32122 mol/m3–1927 mol/m3 Difference = 195 mol/m32395 mol/m3–1465 mol/m3 Difference = 930 mol/m3
LiPF6 in 1:1 EC:DMC (liquid, Li-ion battery)2436 mol/m3–1659 mol/m3 Difference = 777 mol/m32037 mol/m3–1947 mol/m3 Difference = 90 mol/m32208 mol/m3–1754 mol/m3 Difference = 454 mol/m3
LiPF6 in 3:7 EC:EMC (liquid, Li-ion battery)2330 mol/m3–1725 mol/m3 Difference = 605 mol/m32040 mol/m3–1953 mol/m3 Difference = 87 mol/m32171 mol/m3–1807 mol/m3 Difference = 364 mol/m3
LiPF6 in 0.1PC:0.27EC:0.63EMC (iquid, Li-ion battery)2333 mol/m3–1729 mol/m3 Difference = 604 mol/m32031 mol/m3–1955 mol/m3 Difference = 76 mol/m32167 mol/m3–1810 mol/m3 Difference = 357 mol/m3
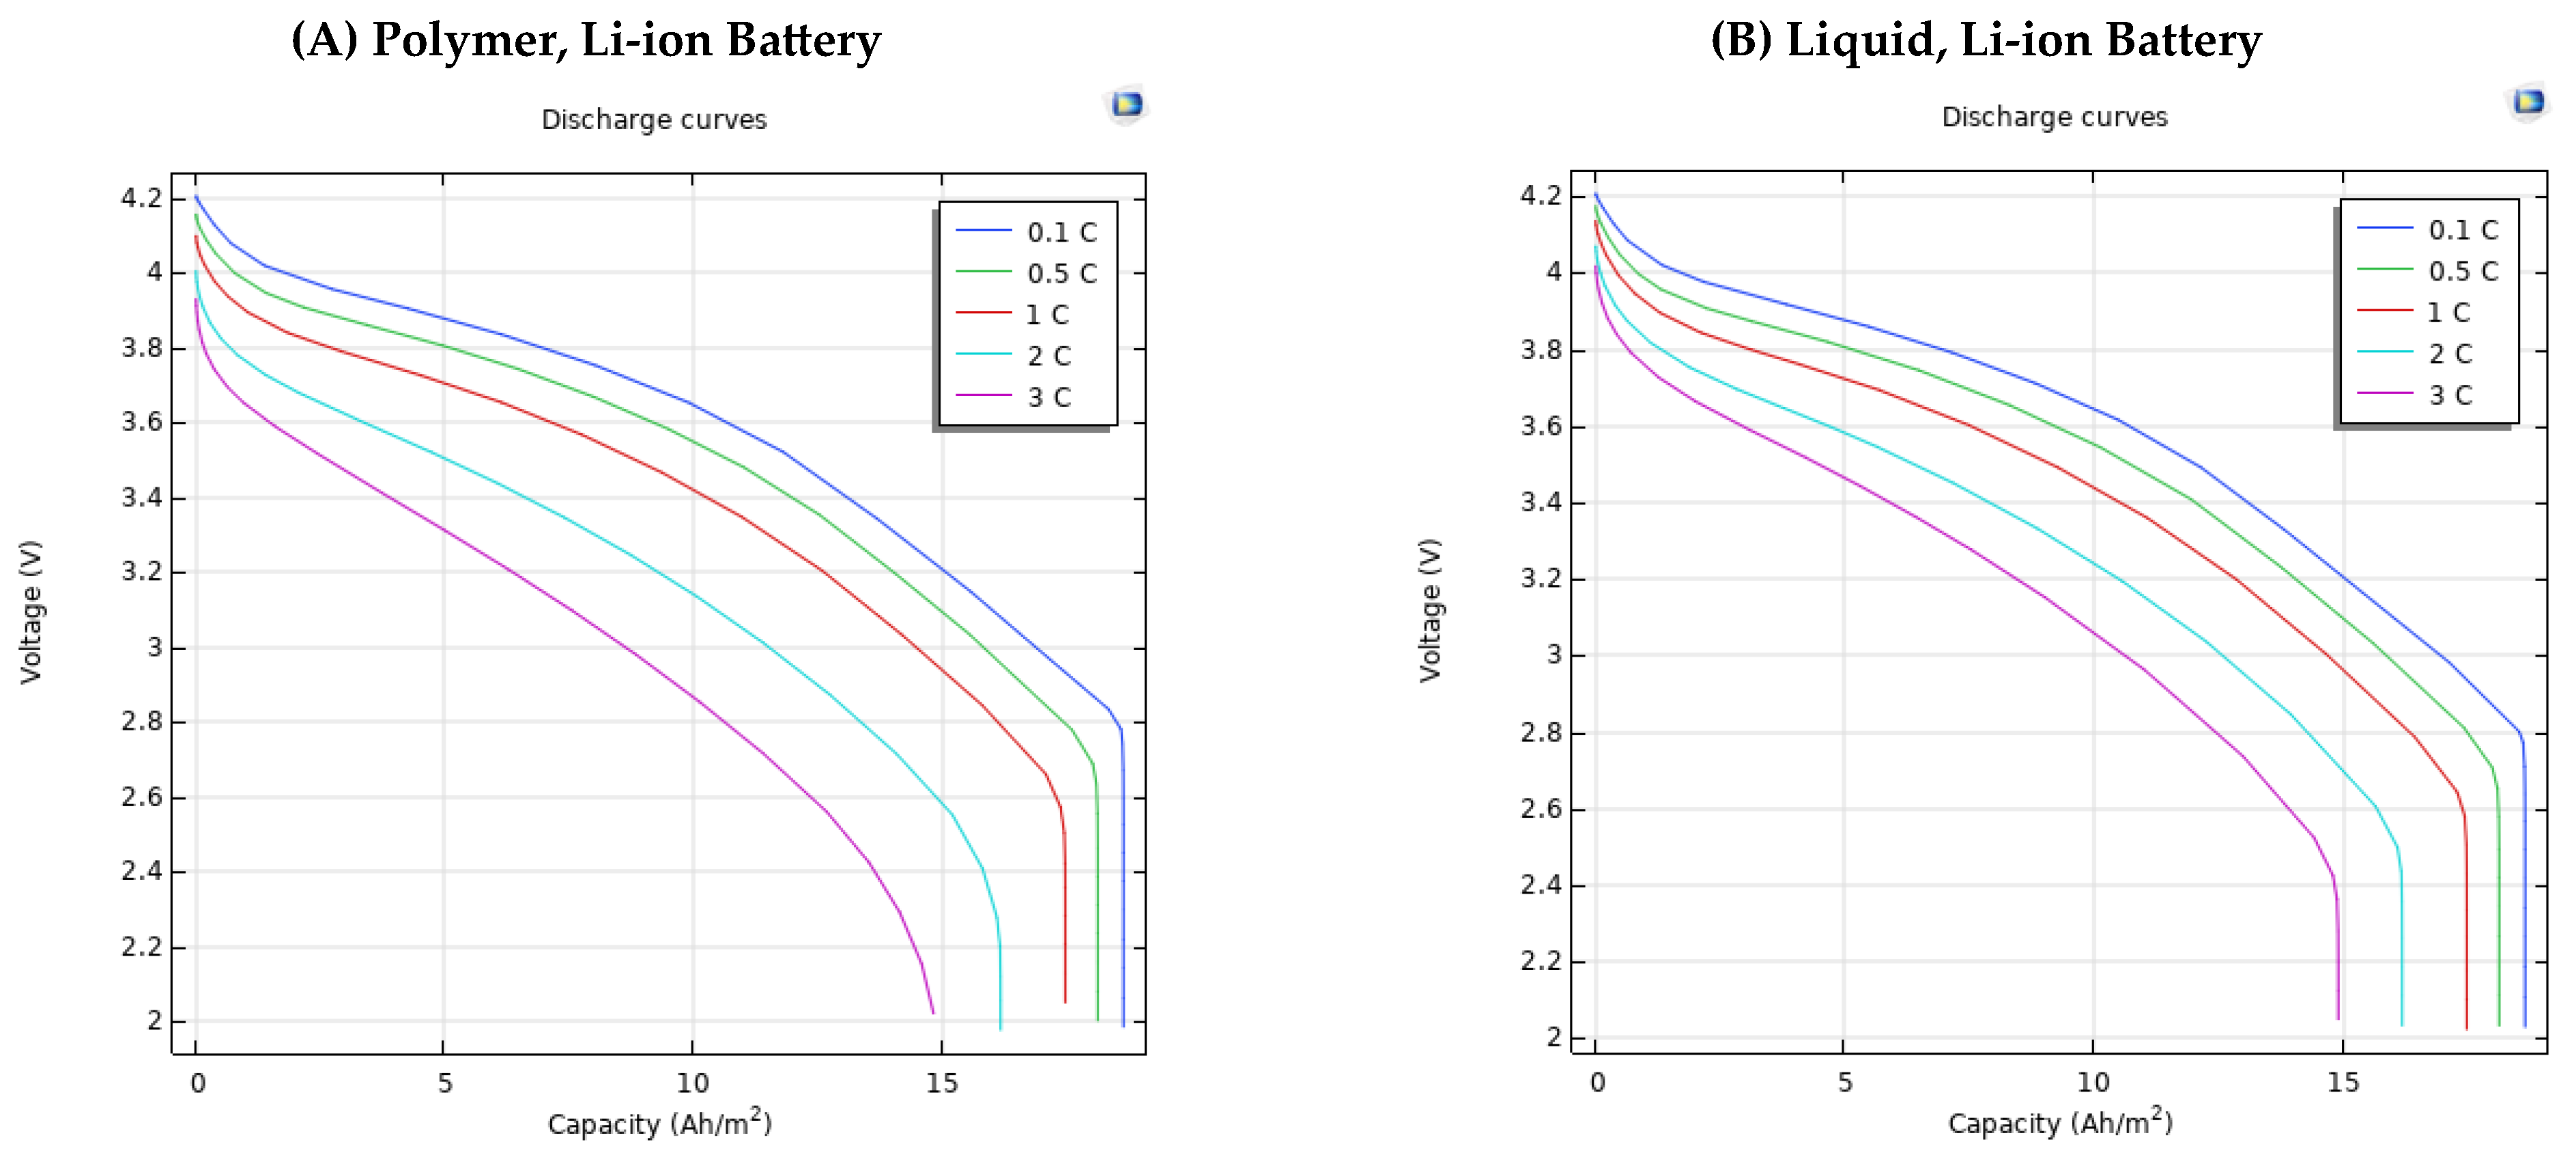
Table 2. Voltage values comparison of Li-ion batteries having different electrolyte materials according to capacity for five C-rates.
Electrolyte Material Type Capacity(Ah/m2)
C-Rate051015
Polymer, Li-ion Battery0.14.2 V3.875 V3.65 V3.2 V
0.54.155 V3.8 V3.55 V3.09 V
14.099 V3.7 V3.419 V2.93 V
24 V3.5 V3.14 V2.58 V
33.93 V3.31 V2.86 V-
liquid, Li-ion battery0.14.21 V3.87 V3.65 V3.2 V
0.54.17 V3.82 V3.57 V3.1 V
14.14 V3.74 V3.47 V2.98 V
24.08 V3.6 V3.28 V2.7 V
34.02 V3.47 V3.08 V-
Table 3. Average SOC values of porous electrodes for Li-ion batteries having different cathode materials for chosen times of 1 C-rate.
Positive Electrode Material TypeTime (s)
020004000
LCO, LiCoO2Negative Electrode (Porous Electrode 1)0.560.270.519
Positive Electrode (Porous Electrode 2)0.0690.190.087
LMO, LiMn2O4Negative Electrode (Porous Electrode 1)0.560.270.519
Positive Electrode (Porous Electrode 2)0.170.470.21
LFP, LiFePO4Negative Electrode (Porous Electrode 1)0.560.270.519
Positive Electrode (Porous Electrode 2)0.180.510.23
LiNiO2Negative Electrode (Porous Electrode 1)0.560.270.519
Positive Electrode (Porous Electrode 2)0.160.470.21
NCA, LiNi0.8Co0.15Al0.05O2Negative Electrode (Porous Electrode 1)0.560.270.519
Positive Electrode (Porous Electrode 2)0.080.220.1
Table 4. Difference of electrode particle lithium concentration of the positive electrode surface at two chosen points for Li-ion batteries having different cathode materials in the discharge period at chosen times.
Positive Electrode Material TypeDifference of Electrode Particle Lithium Concentration of the Positive Electrode Surface Two Chosen Points [(16–30) × 10−5 m] According to Times
1012001800
LCO, LiCoO24105 mol/m3–3991 mol/m3 = 114 mol/m38918 mol/m3–8011 mol/m3 = 907 mol/m311034 mol/m3–10108 mol/m3 = 926 mol/m3
LMO, LiMn2O44069 mol/m3–3992 mol/m3 = 77 mol/m311341 mol/m3–7023 mol/m3 = 4318 mol/m313227 mol/m3–8604 mol/m3 = 4623 mol/m3
LFP, LiFePO44110 mol/m3–3975 mol/m3 = 135 mol/m312742 mol/m3–6465 mol/m3 = 6277 mol/m316787 mol/m3–7665 mol/m3 = 9122 mol/m3
LiNiO24059 mol/m3–3997 mol/m3 = 62 mol/m38337 mol/m3–8222 mol/m3 = 115 mol/m310449 mol/m3–10326 mol/m3 = 123 mol/m3
NCA, LiNi0.8Co0.15Al0.05O24122 mol/m3–3971 mol/m3 = 151 mol/m38810 mol/m3–7979 mol/m3 = 831 mol/m310920 mol/m3–10081 mol/m3 = 839 mol/m3
Table 5. Voltage values comparison of Li-ion batteries having different electrode materials according to capacity for five C-rates.
Positive Electrode Material TypeCapacity(Ah/m2)
C-Rate051015
LCO, LiCoO20.14.91 V4.64 V4.29 V3.81 V
0.54.87 V4.56 V4.2 V3.7 V
14.81 V4.46 V4.07 V3.55 V
24.71 V4.24 V3.79 V3.19 V
34.63 V4.03 V3.51 V-
LMO, LiMn2O40.14.2 V3.875 V3.65 V3.2 V
0.54.155 V3.8 V3.55 V3.09 V
14.099 V3.7 V3.419 V2.93 V
24 V3.5 V3.14 V2.58 V
33.93 V3.31 V2.86 V-
LFP, LiFePO40.13.32 V3.18 V2.96 V2.61 V
0.53.28 V3.1 V2.87 V2.49 V
13.22 V3.01 V2.75 V2.32 V
23.13 V2.81 V2.48 V-
33.06 V2.62 V2.2 V-
LiNiO20.16.33 V4.83 V3.46 V2.92 V
0.56.28 V4.74 V3.37 V2.79 V
16.22 V4.61 V3.24 V2.64 V
26.13 V4.34 V2.96 V2.28 V
36.05 V4.08 V2.68 V-
NCA, LiNi0.8Co0.15Al0.05O20.14.6 V4.27 V3.87 V3.37 V
0.54.56 V4.19 V3.77 V3.26 V
14.5 V4.09 V3.65 V3.12 V
24.42 V3.88 V3.38 V2.76 V
34.35 V3.68 V3.11 V-
Disclaimer/Publisher’s Note: The statements, opinions and data contained in all publications are solely those of the individual author(s) and contributor(s) and not of MDPI and/or the editor(s). MDPI and/or the editor(s) disclaim responsibility for any injury to people or property resulting from any ideas, methods, instructions or products referred to in the content.

