Article

Study on the Influence Mechanisms of Reservoir Heterogeneity on Flow Capacity During Fracturing Flooding Development

1
SINOPEC Zhongyuan Oilfield Company, Puyang 457001, China
2
Key Laboratory of Unconventional Oil & Gas Development (China University of Petroleum (East China)), Ministry of Education, Qingdao 266580, China
3
School of Petroleum Engineering, China University of Petroleum (East China), Qingdao 266580, China
*
Author to whom correspondence should be addressed.
Energies 2025, 18(13), 3279; https://doi.org/10.3390/en18133279
Submission received: 13 May 2025 / Revised: 17 June 2025 / Accepted: 18 June 2025 / Published: 23 June 2025

Abstract

Low-permeability reservoirs face significant challenges in pressure transmission during field applications of fracturing flooding development. Influenced by reservoir properties and well spacing, fracturing flooding development in such reservoirs often encounters limited propagation of high-pressure zones, ineffective pressure diffusion during water injection, low producer pressure, and poor response. This study develops a numerical simulation model for fracturing flooding development in low-permeability reservoirs of Shengli Oilfield and investigates flow capacity variations under heterogeneous reservoir conditions. Key findings reveal (1) flow capacity is maximized under low-to-high interwell permeability distribution and minimized under high-to-low distribution, with a five-fold difference between the two patterns; (2) flow capacity exhibits near-linear growth with increasing average permeability, while showing an initial increase followed by decrease with growing permeability contrast, peaking at contrast ratios of 4–6; (3) flow capacity improves with injected volume but demonstrates diminishing returns after reaching 0.05 PV, establishing this value as the critical threshold for optimal fracturing flooding performance.

1. Introduction

With the coordinated development of exploration theory and engineering technology, low-permeability reservoirs have emerged as strategic replacement resources, with their development scale continuously expanding [1,2,3]. Statistics indicate that such reservoirs now exceed conventional reservoirs in China’s oil and gas development, becoming crucial backup resources for energy security [4,5,6]. The Chinese government’s 2025 energy plan specifically targets these resources for substantial investment, aiming to add 850 million tons of recoverable reserves and increase production capacity by 25 million tons annually through advanced techniques including nano-scale pore characterization, multi-stage hydraulic fracturing, and integrated digital field technologies, as part of broader efforts to enhance energy self-sufficiency and secure the nation’s long-term energy supply.
The geological characteristics of low-permeability reservoirs primarily manifest as complex reservoir properties, dense pore structures, diverse sand body types, and discrete remaining oil distribution. Based on formation permeability, they can be technically classified into three grades: conventional low-permeability (50–10 mD), ultra-low permeability (10–1 mD), and extra-low permeability (1–0.1 mD) [7]. Unlike medium-high permeability reservoirs, low-permeability reservoirs exhibit low porosity, low maturity, high clay content, and small particle size, resulting in poor reservoir permeability, pronounced heterogeneity, strong interfacial forces between fluid and solid phases, significant imbibition effects, and relatively difficult fluid flow. These characteristics lead to low fluid and oil production rates, impacting the economic development of such reservoirs [8,9]. In actual development processes, both mature and newly explored areas frequently encounter challenges of ineffective injection-production systems, specifically manifested as difficulties in surpassing injection pressure thresholds, continuous decline in liquid production efficiency, and delayed formation energy replenishment. Technical analyses demonstrate that even with chemical flooding methods, constrained by both reservoir permeability thresholds and fracture initiation pressures, substantial oil layers remain difficult to effectively mobilize. The fundamental reason lies in the inability of existing injection pressures to reach formation fracture pressure, failing to establish effective fluid migration channels [10,11,12].
To address this technical bottleneck, industry experts have proposed a dual-track solution: optimizing displacement systems to reduce chemical agent migration losses while developing rapid pressure replenishment mechanisms to meet the threshold pressure gradient requirements [13]. In this context, fracturing flooding development has demonstrated unique advantages. This technology achieves precise displacement agent delivery by constructing directional fracture networks. In industrial applications at Shengli Oilfield, fracturing flooding development has been implemented across 33 blocks covering 198 million tons of geological reserves. In a representative case, Block Yi 184-1 maintained high reservoir pressure through fracturing flooding development, successfully avoiding pressure-sensitive effects and extending the natural flowing period to 2.3 times that of conventional development [14,15].
Shengli Oilfield possesses abundant low-permeability reservoir resources, accounting for 72.6% of its total reserves. Since 2020, the oilfield has conducted fracturing flooding development trials in 33 blocks of low, medium-high permeability, and heavy oil reservoirs, covering 198 million tons of geological reserves. These trials have yielded promising results, with enhanced formation pressure and significantly increased production, demonstrating strong application potential [16]. Currently, water flooding remains the dominant development mode but is constrained by development and injection-production technological limitations, and low-permeability reservoirs still cannot achieve economic development. Existing low-permeability reservoir developments face challenges including high water injection pressures, low formation injectivity, and dual-low liquid and oil production rates, resulting in overall low recovery factors [17,18].
This study addresses issues of unstable response and directional effectiveness in fracturing flooding development of Shengli’s low-permeability reservoirs. By analyzing flow capacity variation patterns under reservoir heterogeneity and establishing a characterization method for fracturing flooding development flow capacity considering threshold pressure gradient, we develop a technical limit well spacing model for fracturing flooding development, providing technical support for enhancing injection efficiency and production in low-permeability reservoir development.

2. Methods

2.1. Characterization Method for Dual-Porosity Dual-Permeability Models

2.1.1. Technical Development Approach

Fracturing flooding simulation is a technique used to model the fracturing flooding processes in oilfield development. It employs computer models to simulate and predict both the displacement of oil–water or oil–gas interfaces during fluid injection (such as water or gas) and the distribution of reservoir parameters including pressure, temperature, and fluid properties [19,20]. This simulation is critical for optimizing oilfield development plans and enhancing hydrocarbon recovery [21].
Fracturing flooding simulation typically involves sophisticated mathematical and physical models that incorporate multiple aspects including fluid dynamics, thermodynamics, chemical reactions, and rock physics [22,23]. The simulation results enable engineers to predict the performance of different development scenarios, assess potential risks, and provide operational guidance for field implementation.
Through fracturing flooding simulation, development teams can gain an improved understanding of reservoir behavior, optimize the type and volume of injection fluids, adjust the configuration of injection and production wells, and consequently improve both economic returns and recovery rates.
The dual-porosity model is constructed by creating matrix and fracture units for each structured grid. In this model, the two porosity systems (matrix and fractures) share identical geometry, while grid properties such as porosity and permeability may differ between matrix and fracture units [24]. Permeable connections are established within the fracture system in the dual-porosity model. In the dual-permeability model, permeable connections are additionally created within the matrix. Finally, matrix–fracture connections are established as described in the dual-porosity discretization.
A dual-porosity dual-permeability flow model was constructed with identical initial permeability settings for both the matrix system and fracture system. However, the fracture system exhibited significantly stronger stress sensitivity compared to the matrix [25,26,27]. During fracturing flooding water injection, near-wellbore formation pressure buildup occurred, creating a high-pressure zone where the porosity and permeability of the fracture system substantially increased. This process facilitated the progressive propagation of the fracturing flooding fracture network from the wellbore toward production wells (Figure 1).

2.1.2. Determination of Fracturing Flooding Fracture Network Morphology

In this study, we thoroughly investigate the fluid-solid coupling phenomena during fracturing flooding development. When fluids flow through the formation, they induce changes in pore pressure. These pressure variations subsequently cause deformation of the reservoir matrix, generating effective stress [28,29]. This effective stress, in turn, acts back on the fluids, ultimately altering the porosity and permeability of the porous medium and establishing an interactive feedback loop. Figure 2 clearly illustrates this mechanism.
During fracturing flooding development, the injected water significantly increases formation pore pressure, which not only induces rock stress deformation but also modifies porosity and permeability parameters. Thus, the fracturing flooding development process can be characterized as a classical fluid–solid coupling problem. This coupling effect has substantial implications for oilfield development strategies and production efficiency [30].
In this study, we developed a fracturing flooding development model (Figure 3) using Abaqus2020 finite element software to simulate fluid–solid coupling phenomena during the pressurization process. The key mechanical parameters, including the formation’s Young’s modulus and permeability, were obtained from field measurements in the target block [31]. The primary simulation parameters are summarized in Table 1, which comprehensively lists the model’s physical and mechanical properties.
This study employed numerical simulations to analyze the evolution patterns of injection-induced pressure fields and permeability–porosity fields under varying permeability and stress difference conditions. The simulation results reveal that fractures propagate elliptically along the direction of the maximum horizontal principal stress, a finding that aligns with rock mechanics principles and stress field distributions, demonstrating the dominant influence of surrounding stress conditions on fracture propagation [32,33].
Further analysis indicates that fracture networks develop higher aspect ratios (long-axis-to-short-axis ratio) under conditions of lower permeability and greater stress difference. This phenomenon clearly illustrates the synergistic effects of permeability and stress difference on fracture morphology, particularly in complex formation environments.
Figure 4 presents the typical fracture network morphology during injection stimulation. By integrating the injection-induced pressure field distribution under varying stress differences and permeability conditions, the pressure propagation paths along the major (a) and minor (b) axes were obtained (Figure 5). The curves in the legend represent the relationship between fracture width and distance along the short axis under injection stimulation.
Based on these data, a specialized pressure field analysis chart was developed for Shengli low-permeability reservoirs. This chart enables the determination of the post-injection pressure front, thereby defining the stimulation coverage area (fracture network extension range), and the derivation of the fracture network aspect ratio (b/a) through the established solution chart (Figure 6).
Through Abaqus fluid–solid coupling simulation of pressure-driven injection, we analyzed the evolution patterns of injection pressure fields and porosity–permeability fields under varying permeability and stress difference conditions. By integrating the pressure field distributions during pressure-driven injection under different stress differences and permeability conditions, we obtained the pressure propagation paths along the major (a) and minor (b) axes (Figure 5). We separately extracted data from the major (a) and minor (b) axes to construct a pressure-driven injection pressure field analysis chart suitable for Shengli low-permeability reservoirs. Based on this chart, we can determine the pressure front after injection, thereby defining the stimulation coverage area (fracture network extension range), and further obtain the b/a ratio solution chart (Figure 6) for the minor-to-major-axis ratio of the fracture network.

2.1.3. Determination of Stress Sensitivity in Fracture Systems

The model is a dual-porosity dual-permeability numerical simulation model with one injector and four producers. The model dimensions are 300 m × 300 m × 30 m (thickness), with a total of 36,000 grid cells. The model configuration includes 4 production wells and 1 water injection well. The schematic diagram of the model is presented in Figure 7.
Numerical simulation of the fracturing process was conducted using identical parameters to those employed in Abaqus simulations. The stress sensitivity characterization of the fracture system was calibrated to match the fracture network propagation range predicted by Abaqus. This calibration ensured consistency between the simulated fracture network morphology (Figure 8) and Abaqus simulation results, while also approximating field-observed pressure dynamics during fracturing operations. Consequently, the stress sensitivity parameter table for the fracture system was determined, as presented in Table 2.

2.1.4. Establishment of Dual-Porosity Dual-Permeability Model

Based on the geological characteristics of low-permeability reservoirs developed by typical fracturing flooding methods in the Shengli oilfield, a heterogeneous dual-porosity dual-permeability numerical simulation model was established. The model dimensions are 200 m × 200 m with a thickness of 3 m, containing 2700 grid cells. The model includes 1 production well and 1 water injection well, simulating 1 year of production.
This study employs an innovative pressure-driven approach where water is injected into low-permeability zones while production occurs from high-permeability zones, with permeability gradually increasing from injector to producer. All models were configured with an average permeability of 4.7 mD to ensure experimental consistency and result comparability. This permeability value was selected based on actual field conditions in typical reservoirs and facilitates comparative analysis with existing research findings.
In this study, an innovative fracturing flooding method was adopted, where water is injected into low-permeability oil layers while production occurs from high-permeability layers. The permeability gradually increases from the injection well to the production well (Figure 9), and the flow characteristics under fracturing flooding conditions were analyzed.

2.2. Development Performance of Fracturing Flooding in Heterogeneous Reservoirs

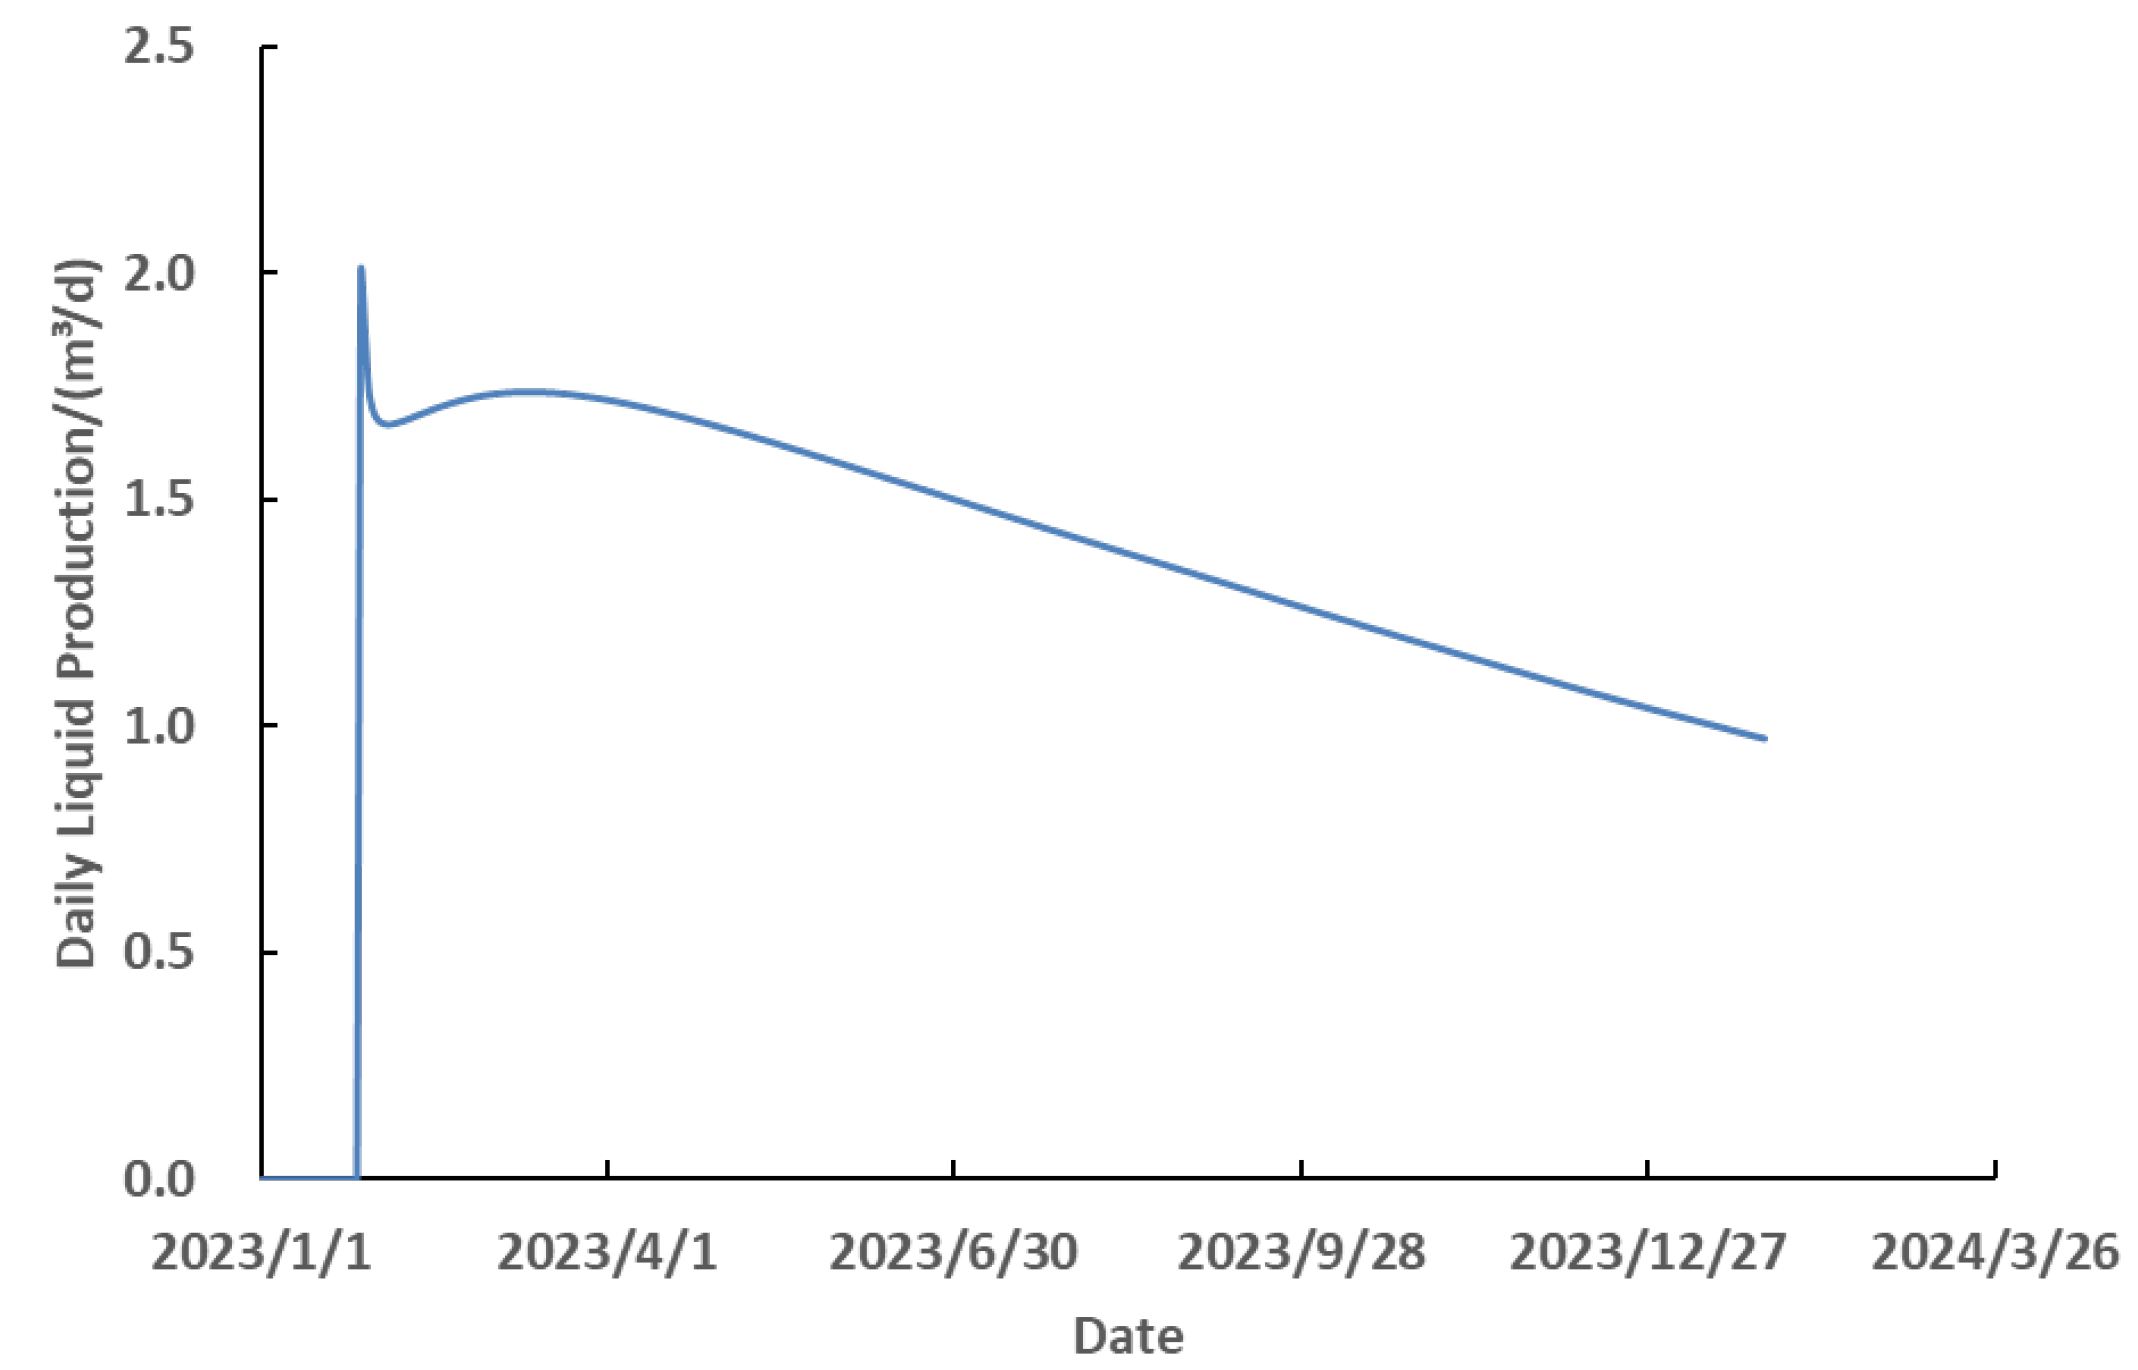
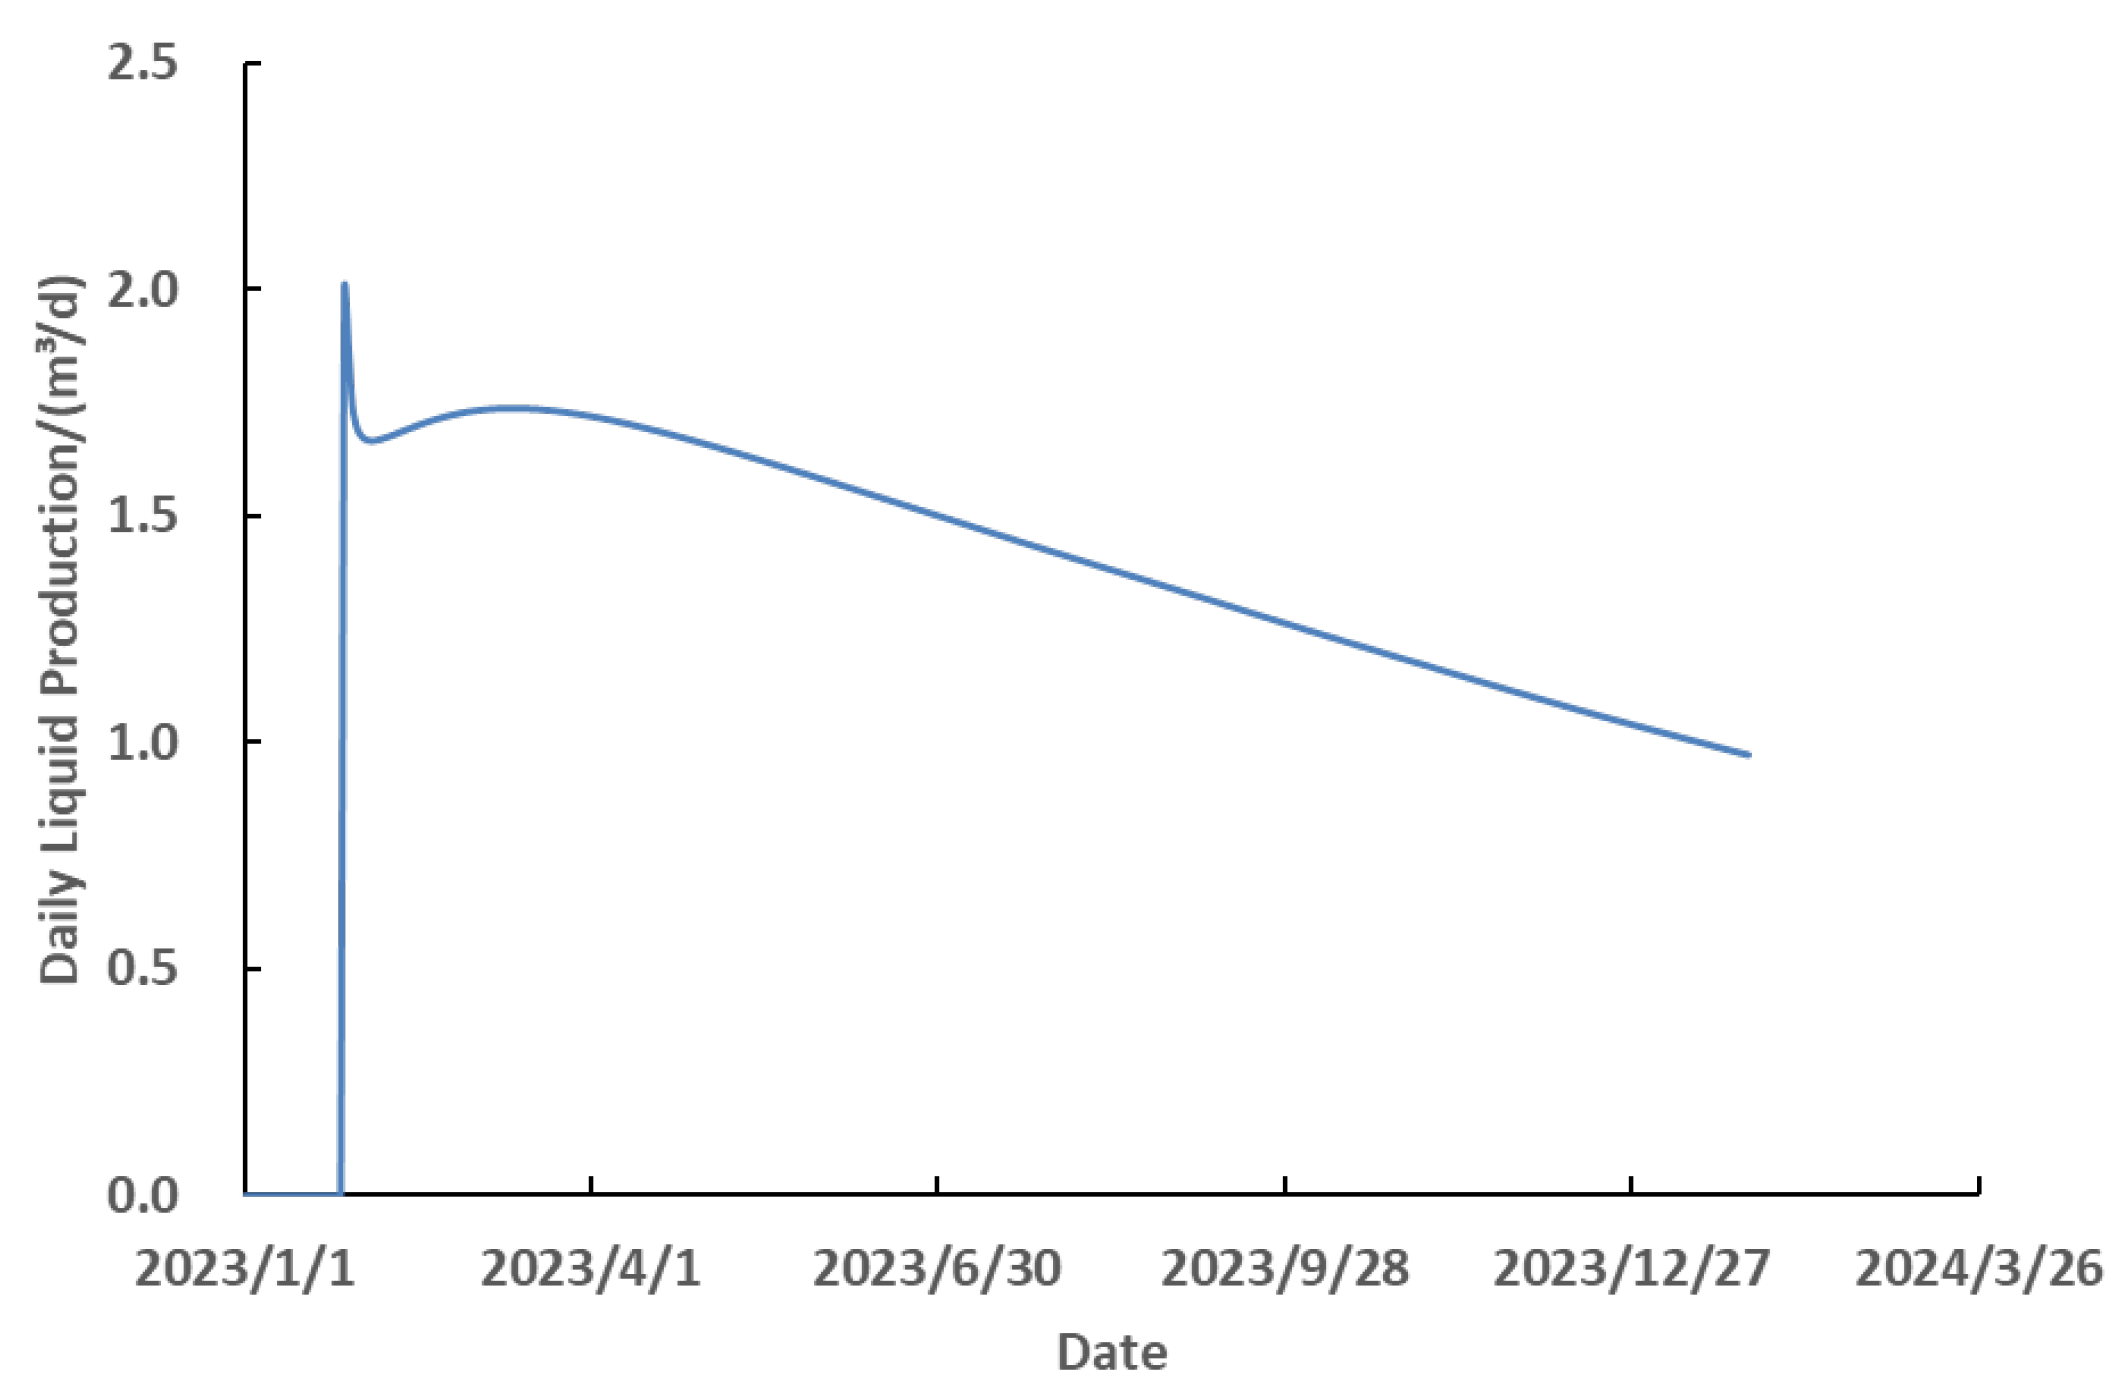
2.2.1. Production Performance Indicators

In this study, we conducted an in-depth analysis of the variation patterns of bottom-hole flowing pressure and formation pressure during fracturing flooding.
During the injection phase, both bottom-hole flowing pressure and formation pressure exhibited rapid increases, with the wellbore pressure buildup reaching approximately 70 MPa.
After well opening, distinct pressure response patterns were observed between bottom-hole flowing pressure and formation pressure. The bottom-hole flowing pressure initially dropped sharply before stabilizing, whereas the formation pressure declined rapidly and then gradually decreased. This pressure behavior reflects the impact of field production operations on subsurface fluid dynamics and well production efficiency.
This study presents a detailed analysis of oil well production performance during the initial depletion development stage. The results demonstrate that fluid production rates experience a rapid decline in the early production phase, primarily due to initial reservoir pressure depletion and accelerated consumption of recoverable reserves. However, with the subsequent injection and release of fracturing flooding energy, production rates first stabilize temporarily before entering a gradual decline phase, a behavior that reflects the reservoir’s unique fluid dynamics and variations in fracturing flooding efficiency. Notably, the water cut maintains remarkable stability throughout the production process, clearly demonstrating the balanced nature of the water flooding process and the effectiveness of field management practices. These findings provide valuable insights into production characteristics during early-stage depletion development in fracturing flooding reservoirs, highlighting the complex interplay between reservoir dynamics and production management strategies [33].

2.2.2. Production Performance Indicators

Based on the production rate variation patterns observed during fracturing flooding development, the establishment of fluid connectivity between injection and production wells occurs within the first three months of operation, indicating the onset of fracturing flooding effectiveness. During this period, both fluid and oil production rates enter a relatively stable phase. Consequently, the average per-thickness production rates of fluid and oil during these initial three months were selected as characterization indicators for fracturing flooding flow capacity. The production rate profiles for both fluid and oil under fracturing flooding development are presented in Figure 10 and Figure 11, respectively.

3. Simulation Results

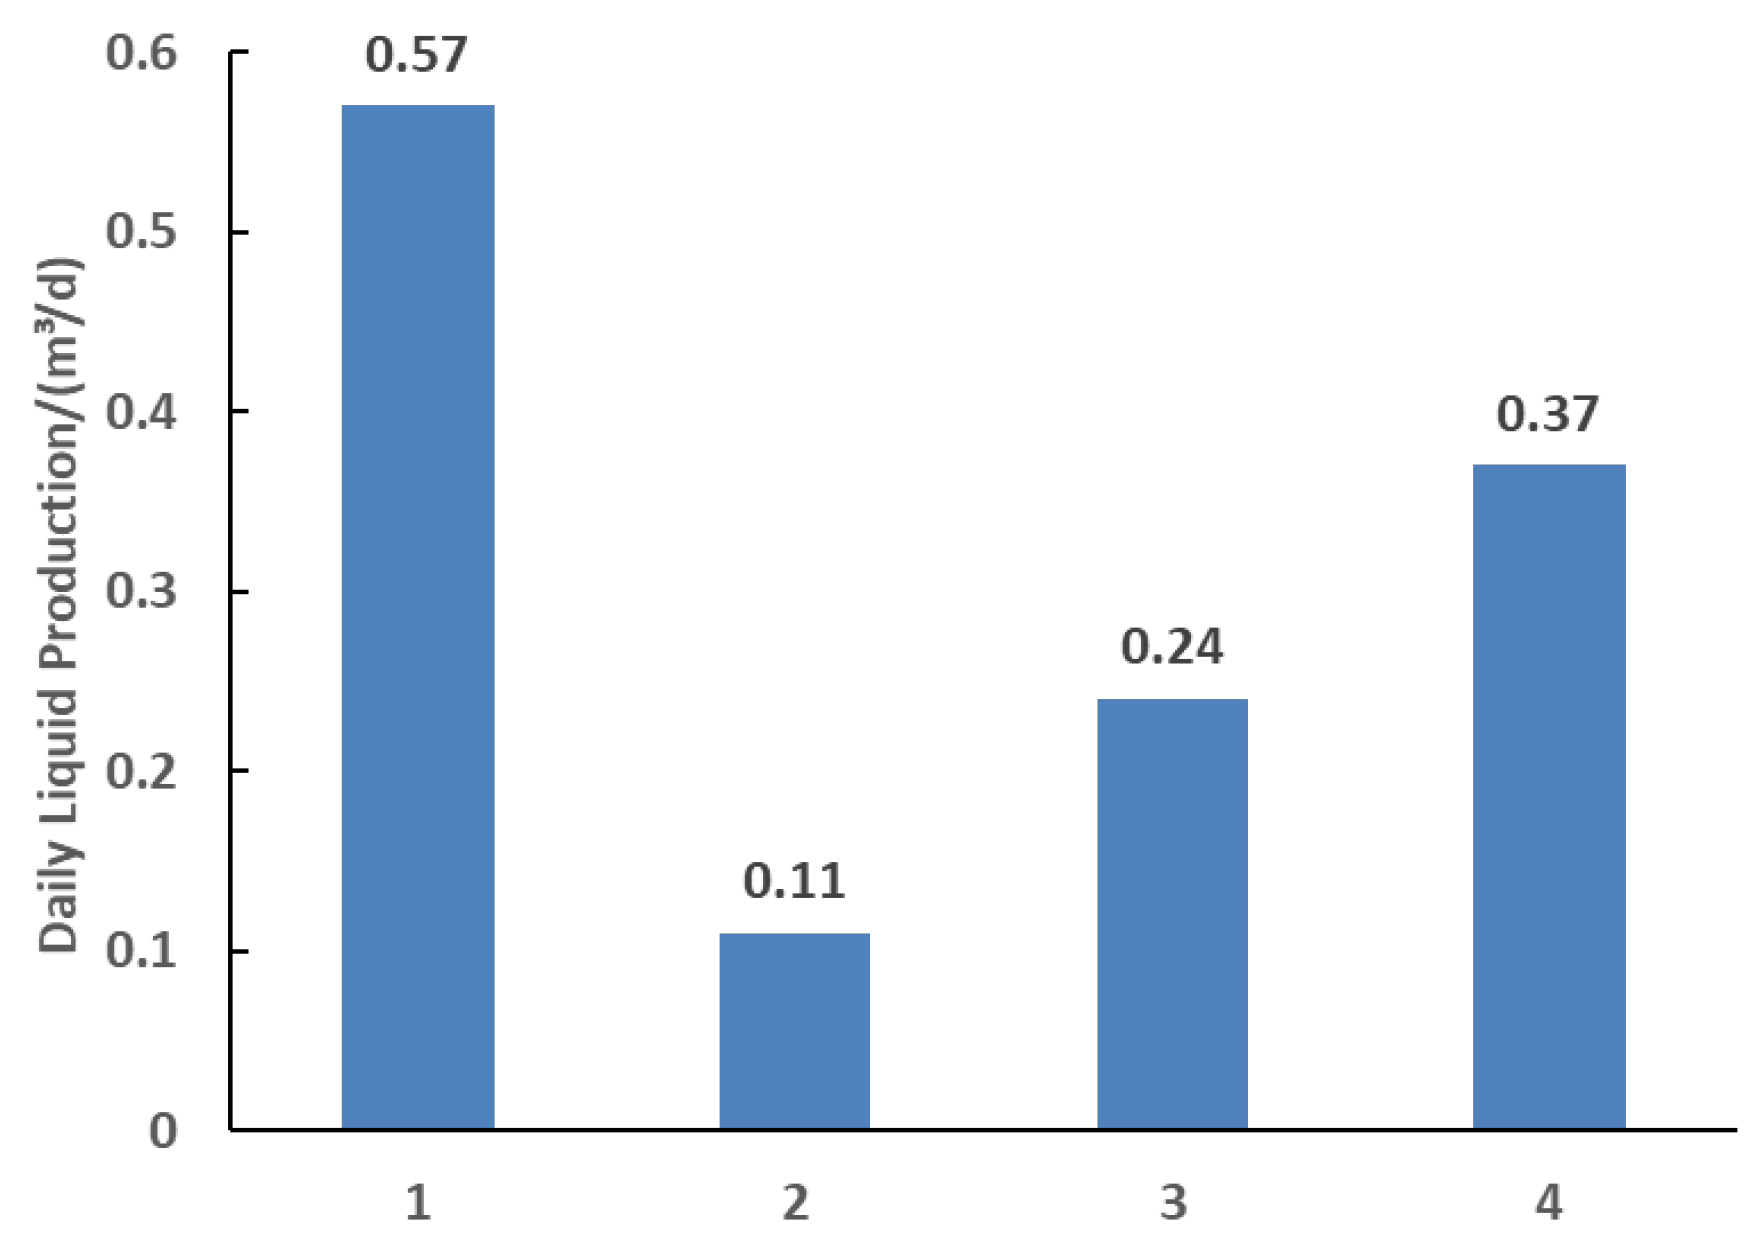
3.1. Influence Laws of Heterogeneous Distribution Patterns on Seepage Capacity

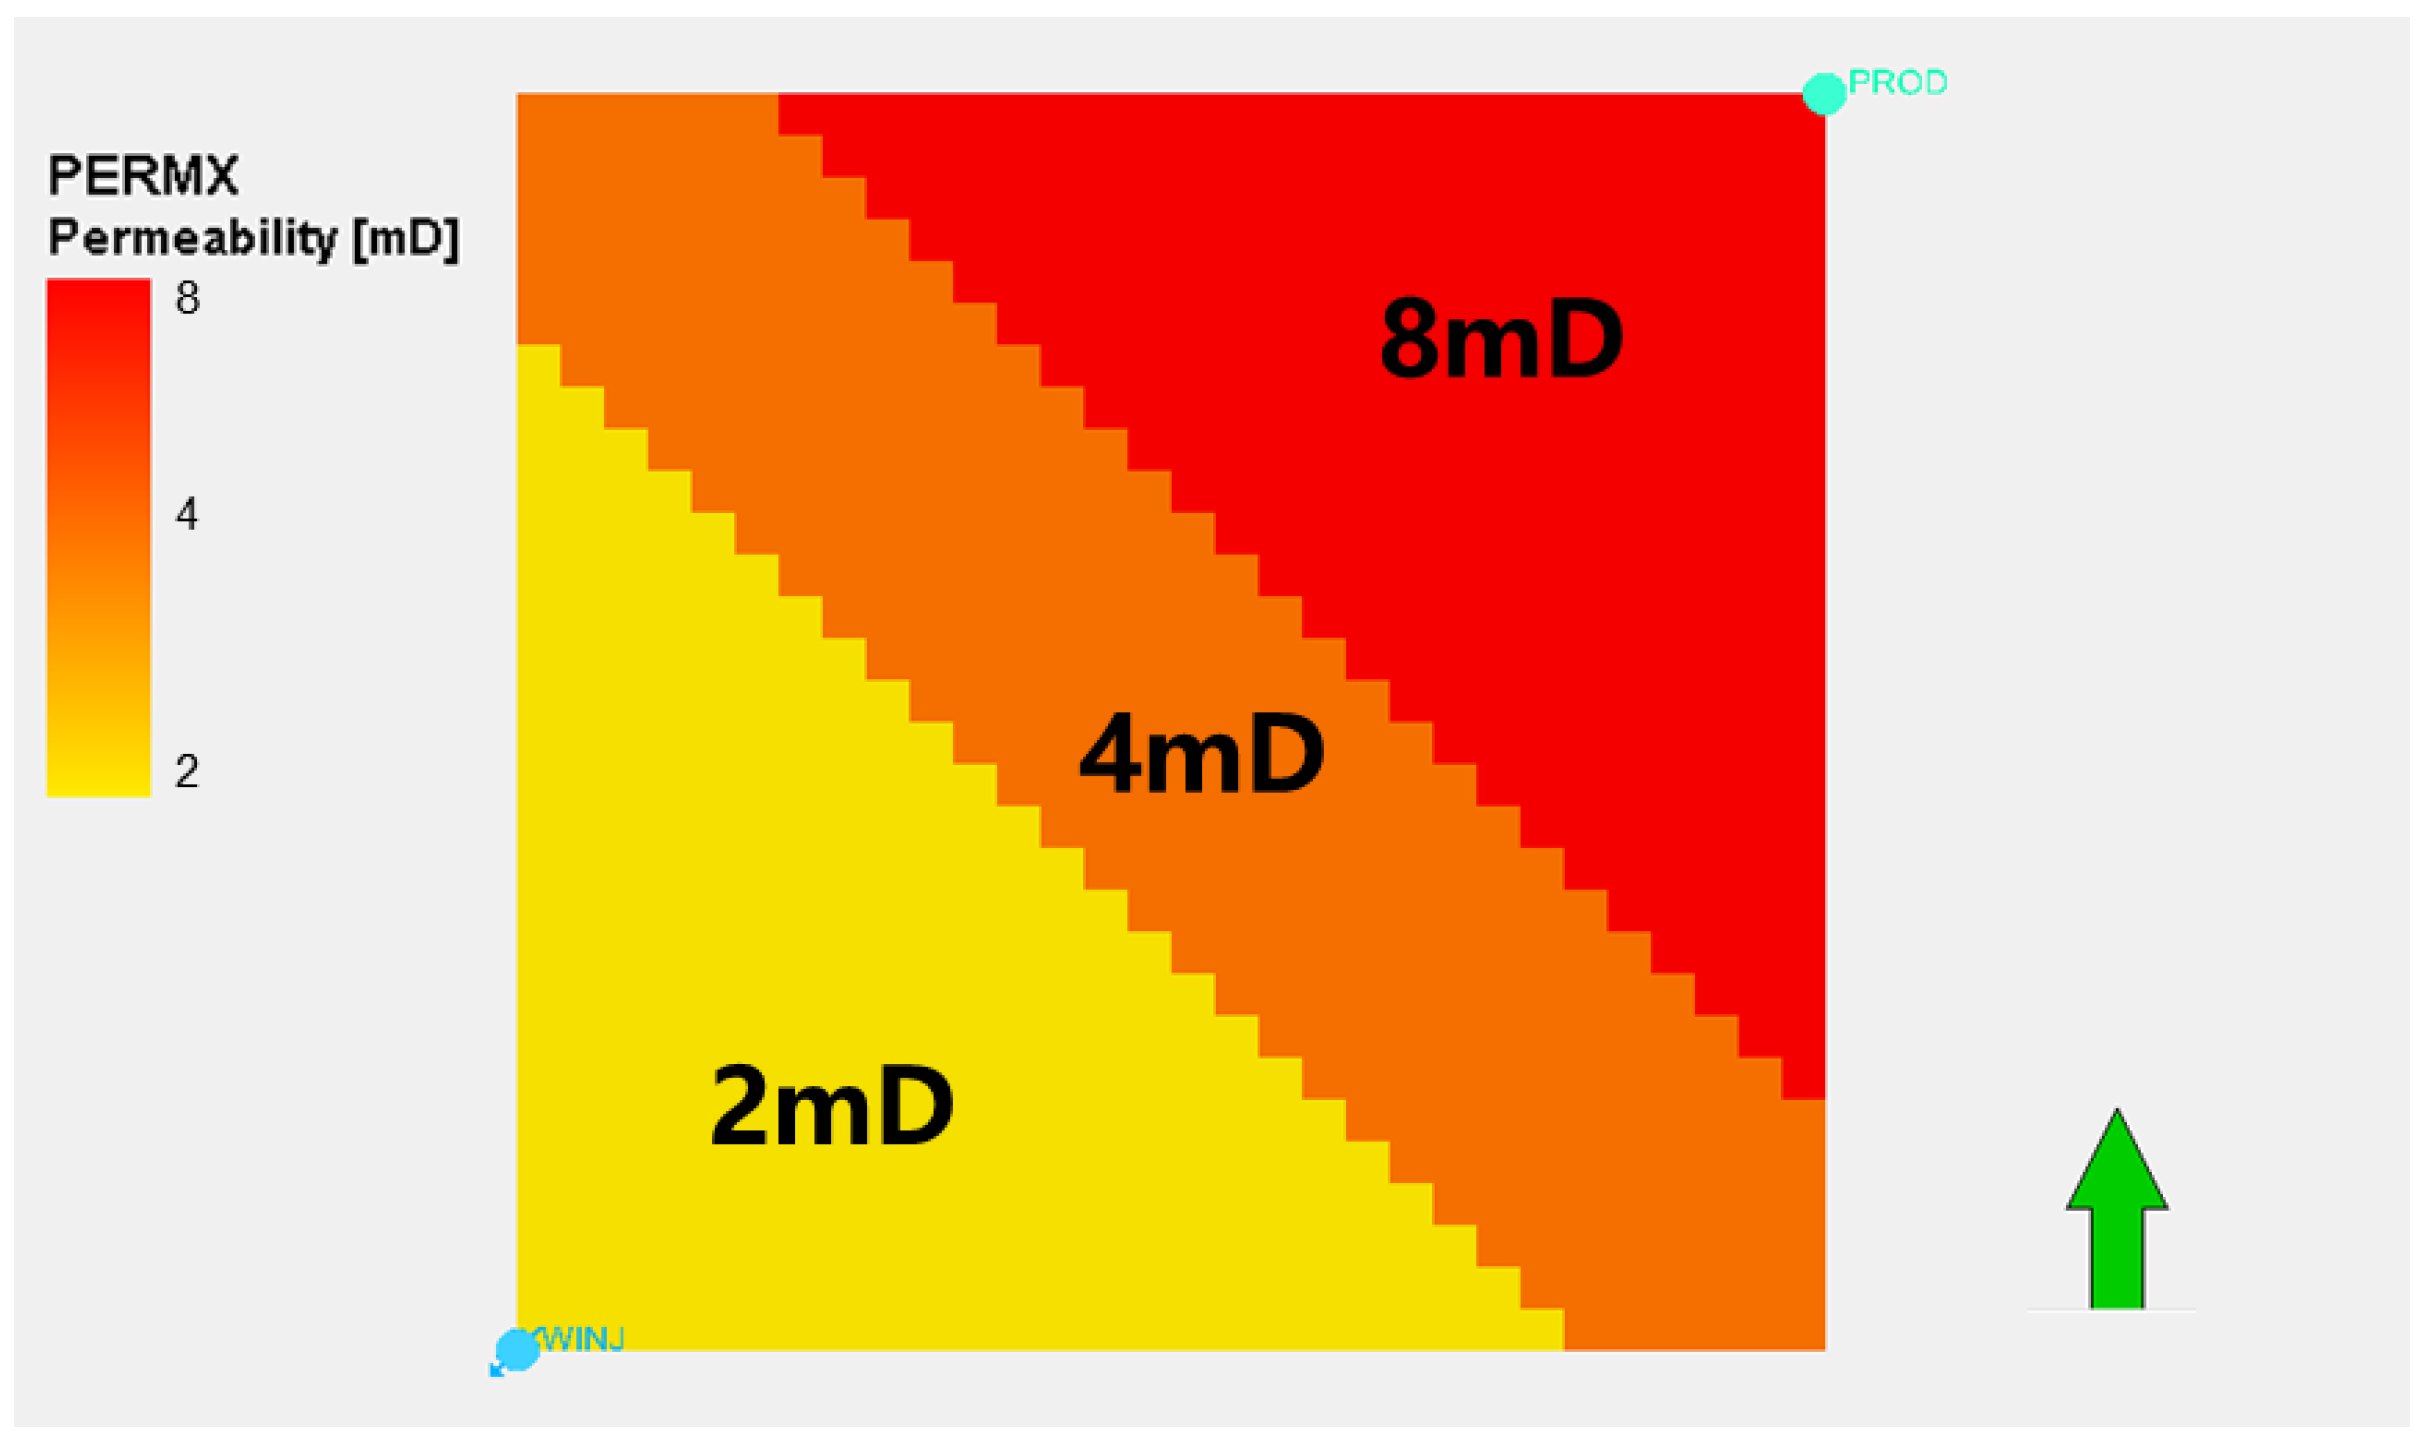
3.1.1. Modeling of Different Heterogeneous Distribution Patterns

In this study, we focus on investigating the influence of heterogeneous distribution patterns on fracturing flooding seepage capacity. To achieve this, four distinct numerical simulation models with different interwell permeability heterogeneity distributions were established. These models were designed to replicate common heterogeneity conditions encountered in actual oilfields, enabling more accurate predictions of seepage dynamics and hydrocarbon displacement efficiency.
All models were configured with an identical average permeability of 4.7 mD to ensure experimental consistency and result comparability. This value was selected based on typical oilfield conditions and facilitates direct comparison with existing research findings. Figure 12 illustrates the heterogeneous distribution patterns employed, which encompass a range of permeability configurations from simple to complex. Each pattern was designed to simulate distinct geological and physical characteristics of hydrocarbon reservoirs.
Through systematic analysis of these models, this research provides fundamental insights into how heterogeneity affects fluid flow behavior and fracturing flooding recovery efficiency in oilfields. Such an understanding is critical for designing more effective hydrocarbon extraction strategies, particularly when addressing complex geological settings. The findings not only offer valuable theoretical guidance but also have direct practical applications in field development, assisting engineers in optimizing production management and operational decision-making.

3.1.2. Fracturing Flooding Seepage Capacity

This study investigates the variations in the unit-thickness liquid production rate and the oil production rate under different heterogeneous distribution patterns. Through detailed analysis of the computational results presented in Figure 13 and Figure 14, it was found that the fracturing flooding seepage capacity reaches its maximum when the interwell permeability follows a low-to-high distribution pattern while showing minimum values under high-to-low permeability distribution with a remarkable 5-fold difference between these two scenarios. This demonstrates the significant influence of fracturing flooding directionality on seepage capacity. The corresponding data for unit-thickness liquid and oil production rates across different heterogeneous distribution patterns are systematically presented in Table 3 and Table 4.
Specifically, in the low-to-high permeability configuration, the low-permeability zones surrounding injection wells exhibit significant improvement in porosity–permeability characteristics during pressure flooding, resulting in more pronounced permeability enhancement throughout the entire reservoir. This finding carries substantial implications for oilfield development, demonstrating that for reservoirs with complex permeability distributions, priority should be given to implementing pressure flooding from low-permeability to high-permeability zones. This approach not only enhances hydrocarbon recovery efficiency but also optimizes overall reservoir production performance.

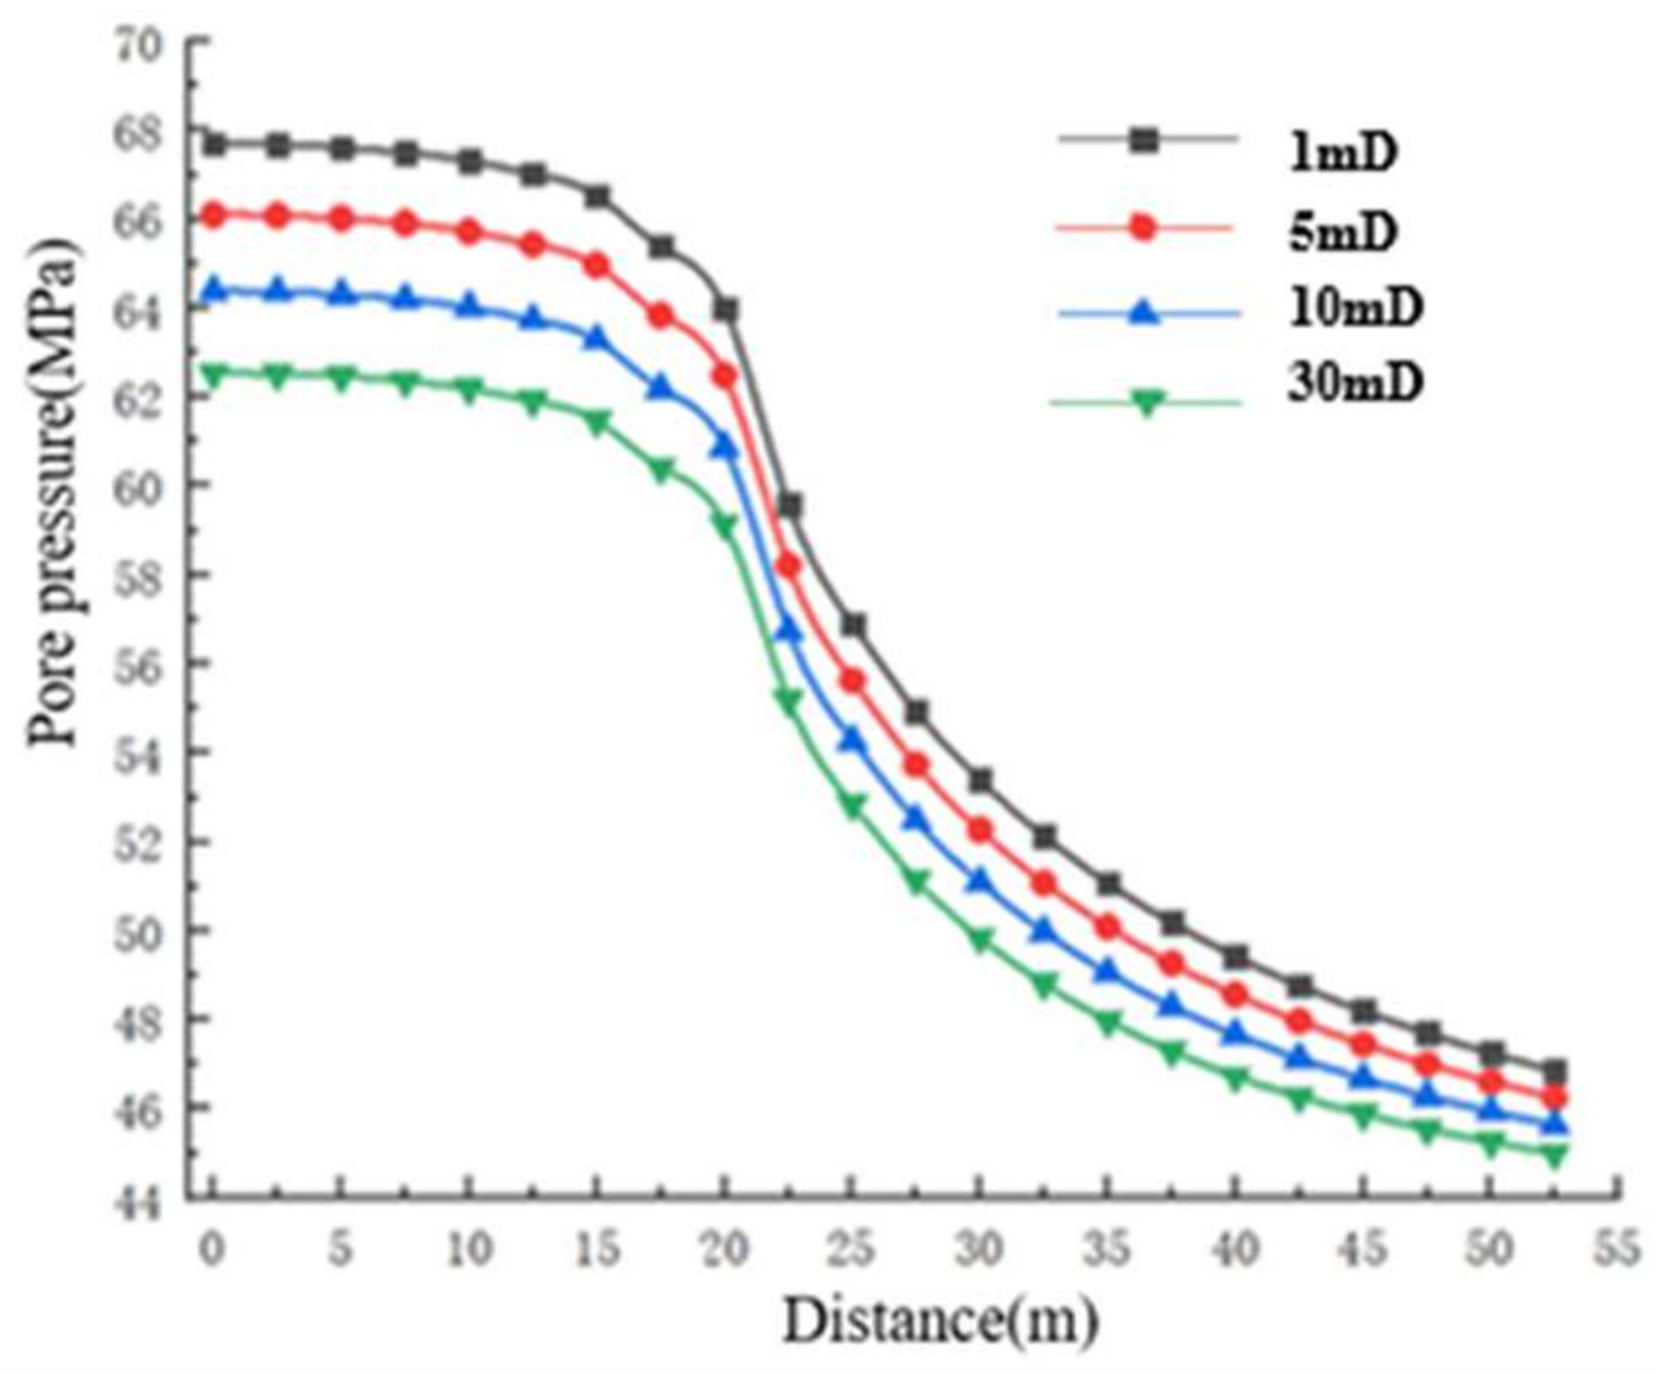
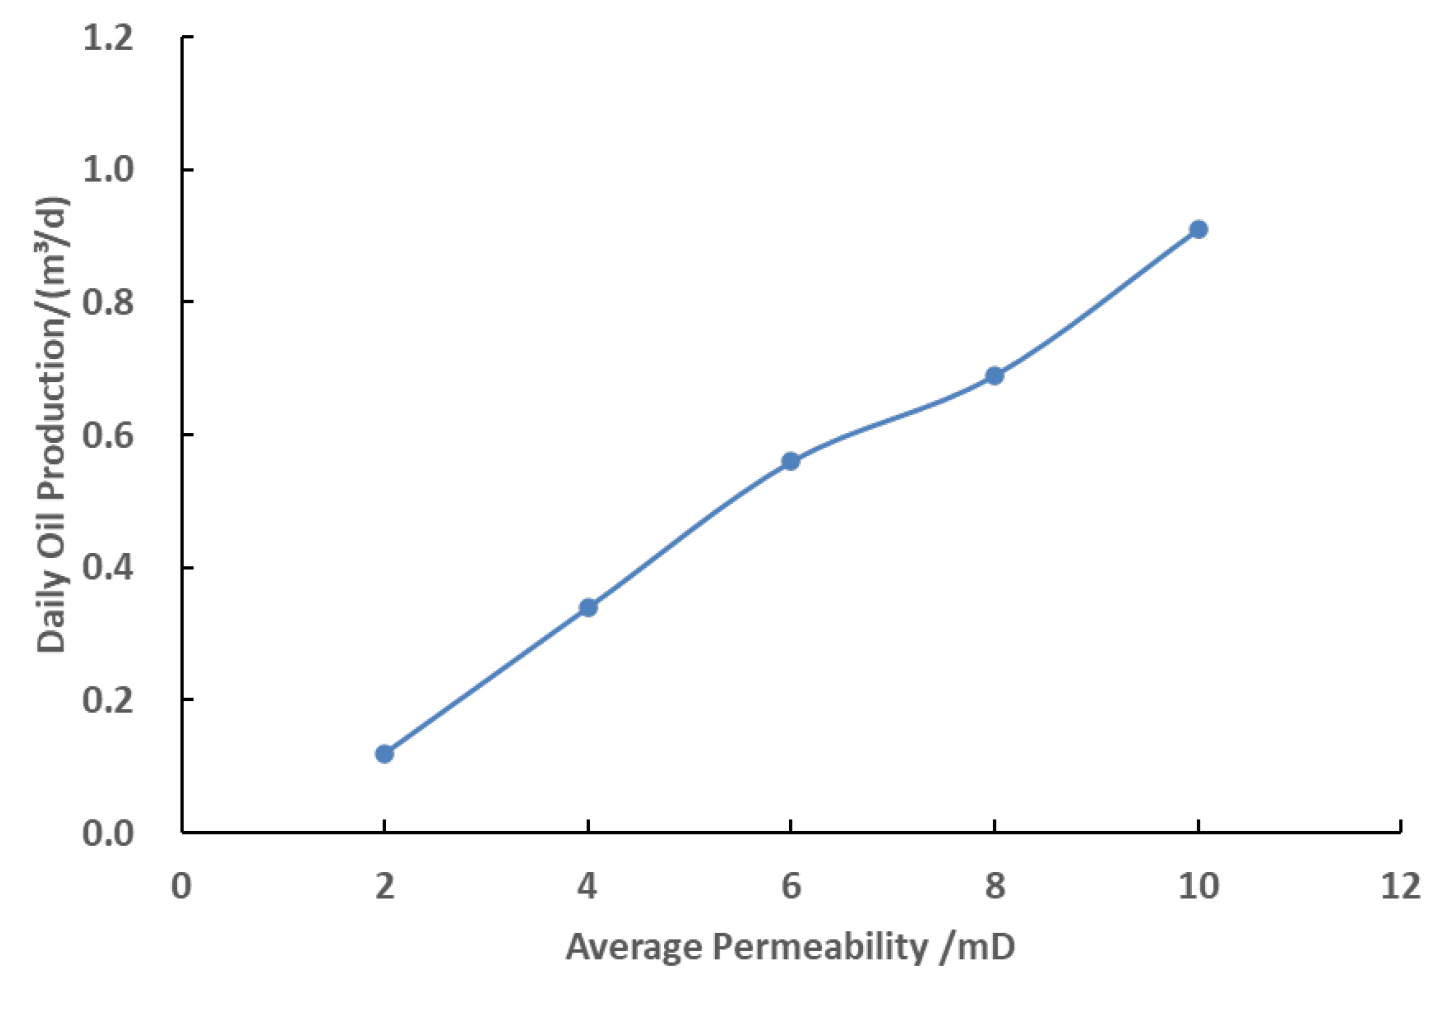
3.2. Influence of Permeability Gradation on Seepage Capacity Characteristics

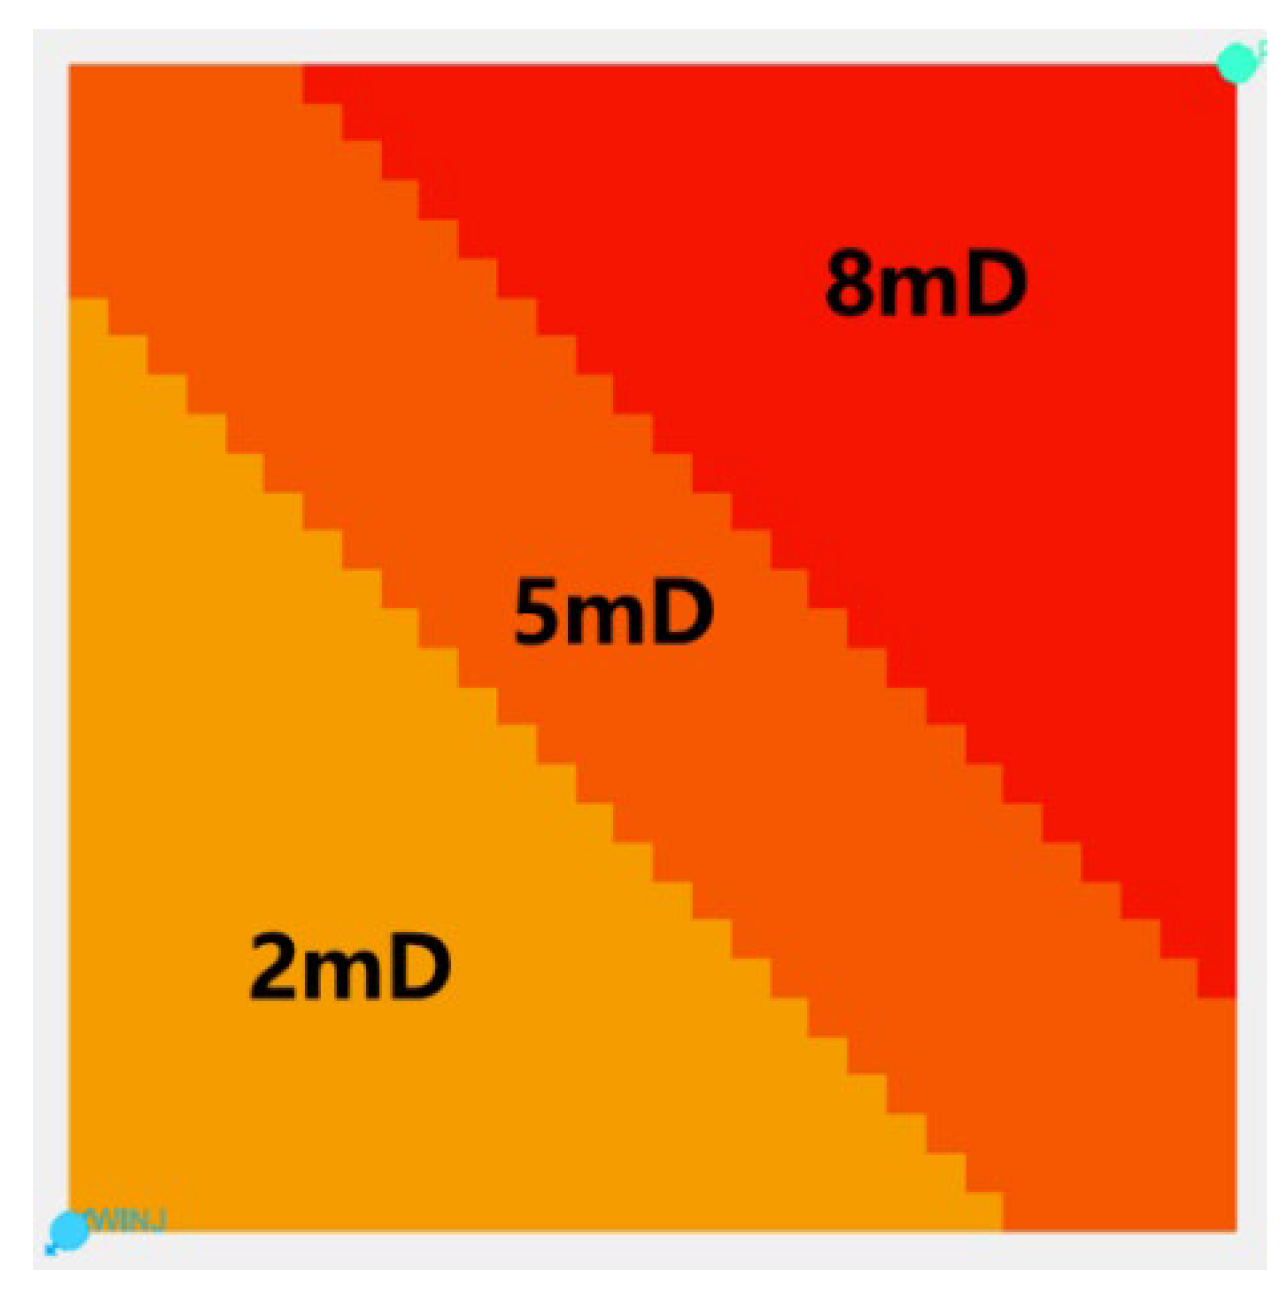
3.2.1. Modeling of Different Heterogeneous Distribution Patterns

This study systematically investigates the impact of permeability gradation on seepage capacity by establishing a series of numerical models with low-to-high permeability distributions (2–10 mD range) between injection and production wells. The carefully selected permeability range serves dual purposes: (1) accurately simulating actual reservoir conditions across various oilfield types, including both conventional (2–5 mD) and tight (5–10 mD) formations; and (2) enabling a comprehensive evaluation of permeability’s influence on hydrocarbon displacement and recovery efficiency under diverse geological environments. This experimental design ensures the research findings maintain both scientific rigor and practical relevance for field applications. The method adopts a fracturing flooding approach from low-permeability zones to high-permeability zones, which is considered more effective in heterogeneous reservoirs. Through this directional pressure drive, a higher-pressure gradient is expected to form in low-permeability areas, thereby promoting the flow of oil and gas toward high-permeability regions. This process aims to enhance overall seepage efficiency and hydrocarbon recovery rates.
Figure 15 presents the established models with different permeability levels. These models, by simulating the heterogeneous distribution of permeability in detail, provide an opportunity to gain an in-depth understanding of how permeability affects seepage capacity. A comparison of the seepage characteristics under these different permeability models reveals that variations in permeability significantly influence hydrocarbon displacement efficiency. These findings are crucial for optimizing oilfield development strategies, particularly when dealing with reservoirs exhibiting complex permeability distributions.

3.2.2. Fracturing Flooding Seepage Capacity

This study conducts a detailed analysis of the calculated liquid production rate per unit thickness and oil production rate under different permeability levels, as presented in Figure 16 and Figure 17. The results reveal that the fracturing flooding seepage capacity exhibits an approximately linear increasing trend with rising average permeability. This finding demonstrates that average permeability is a crucial factor influencing fracturing flooding flow capacity. The corresponding production data for different permeability levels are provided in Table 5 and Table 6.

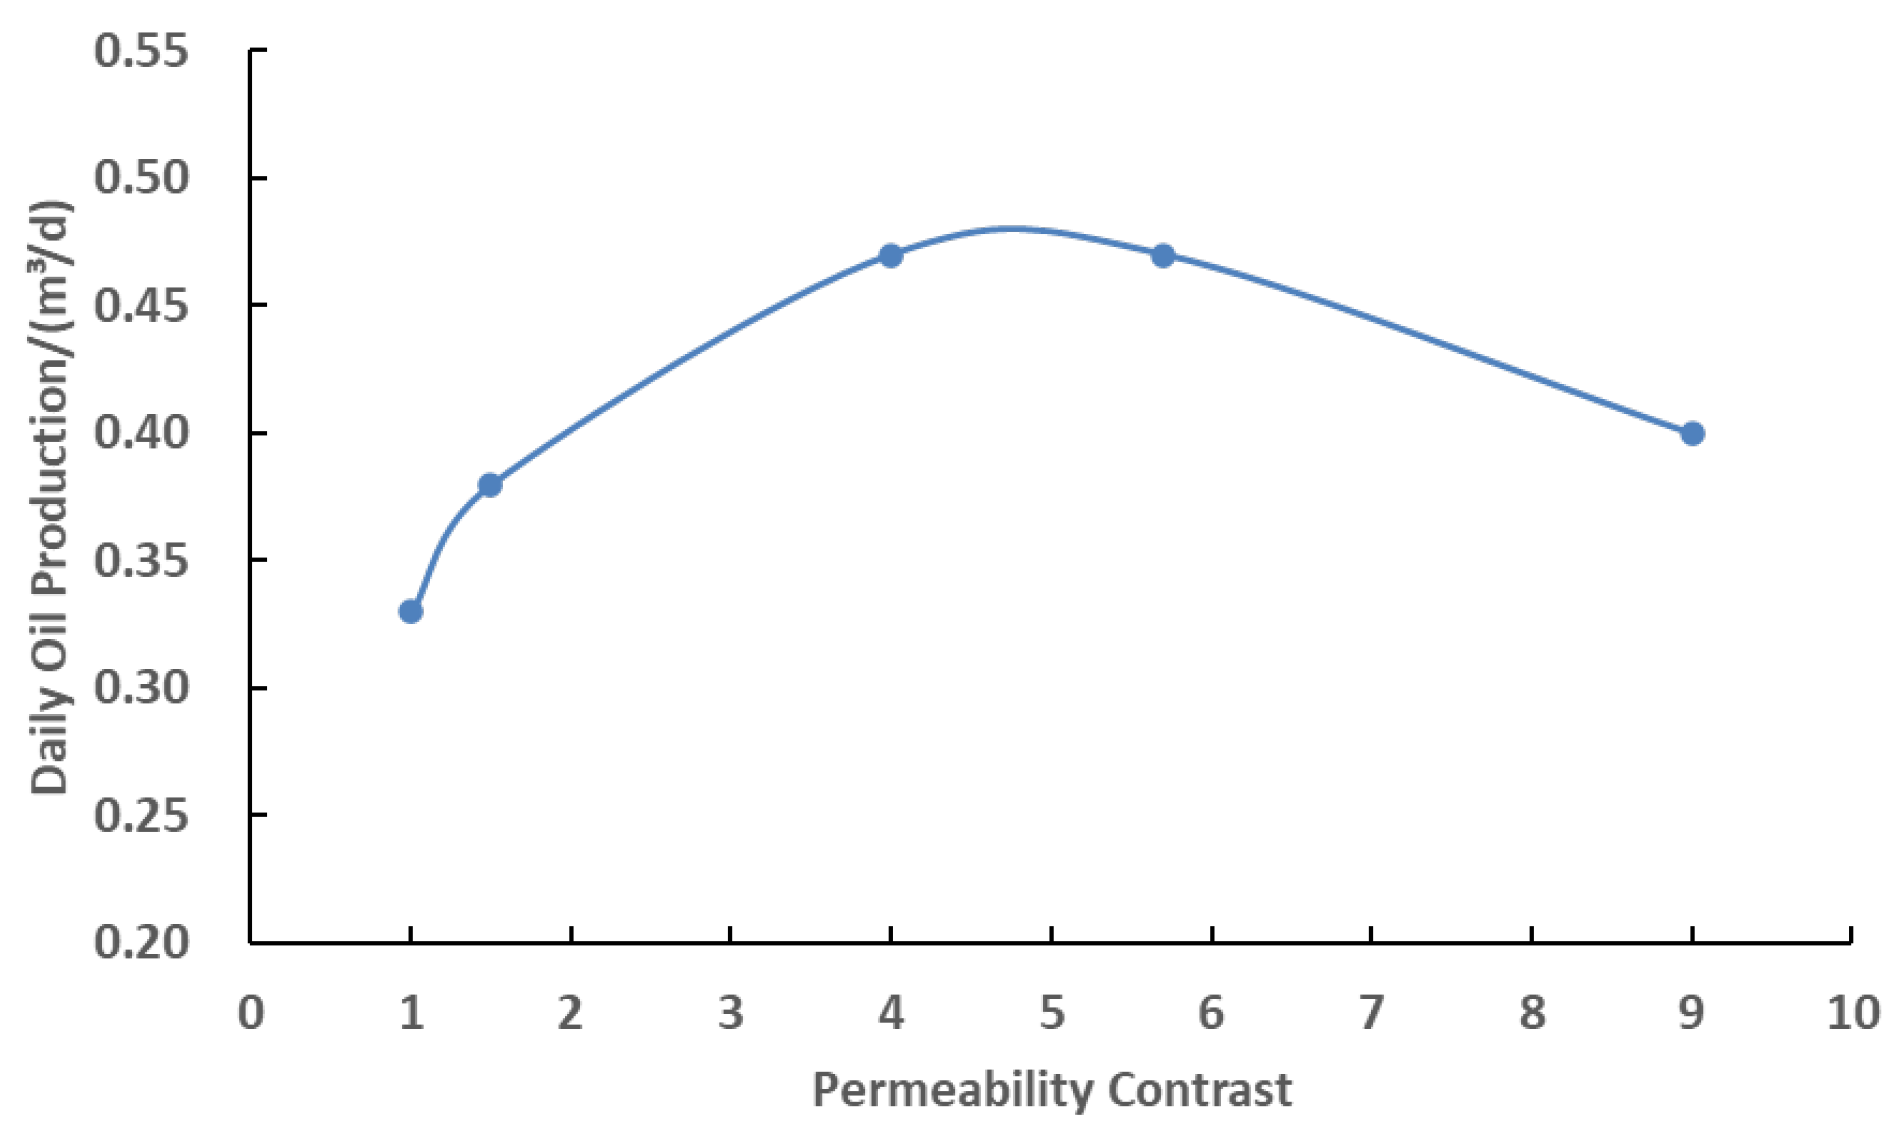
3.3. Influence of Heterogeneity Contrast on Seepage Capacity

3.3.1. Modeling of Different Heterogeneous Distribution Patterns

In this study, a series of models were established with permeability distributed in a low-to-high pattern between injection and production wells, where the average permeability was set at 5 mD. The influence of permeability contrast (ranging from 1 to 9) on hydrocarbon flow capacity was investigated. This configuration was designed to simulate permeability variations in real oilfields and examine how these variations affect hydrocarbon flow and displacement efficiency. Figure 18 displays the constructed models with different permeability contrasts. Through these models, the effects of permeability contrast on hydrocarbon flow characteristics can be systematically observed.

3.3.2. Fracturing Flooding Seepage Capacity

This study presents a detailed analysis of the liquid and oil production rates per unit thickness under varying permeability contrasts, as illustrated in Figure 19 and Figure 20. The results demonstrate that fracturing flooding flow capacity initially increases with growing permeability contrast, peaks at a contrast range of 4–6, and subsequently declines. This finding reveals the existence of an optimal permeability contrast that maximizes fracturing flooding flow efficiency under constant average permeability conditions. The corresponding production rate data for different permeability contrasts are systematically summarized in Table 7 and Table 8.

3.4. Influence of Heterogeneity Contrast on Seepage Capacity

In this study, a simulation model was established, with permeability increasing from low to high (average permeability: 5 mD; permeability contrast: 4) to simulate the fracturing flooding flow from low-permeability to high-permeability zones. The effects of different water injection volumes (0.03–0.10 PV) on flow capacity were investigated. This injection range was selected to simulate common water injection strategies in oilfield development and to explore the optimal injection volume for enhancing hydrocarbon recovery efficiency.
The simulation results demonstrate that flow capacity increases with water injection volume. Notably, when the injection volume reaches 0.05 PV, the rate of improvement slows significantly, indicating that 0.05 PV represents the threshold for optimal fracturing flooding flow performance. This finding is crucial for determining the optimal water injection volume in oilfield development, as it helps identify a balance between improving hydrocarbon recovery and reducing development costs.
Figure 21 illustrates the specific model configuration and parameters, while Figure 22 presents the variation curves of liquid and oil production rates under different water injection volumes. These curves provide visual evidence of how water injection volume affects the efficiency of fracturing flooding flow and how injection strategies can be optimized to enhance overall oilfield production efficiency. The corresponding liquid and oil production rate data under different injection volumes are detailed in Table 9.

4. Conclusions

Based on field data from fracturing flooding development in Shengli low-permeability reservoirs, a dual-porosity dual-permeability flow model was established, with the fracture system exhibiting significantly higher stress sensitivity than the matrix. This study developed a numerical simulation method to characterize fracturing flooding flow capacity. The simulation results indicate that at water injection completion, the saturation field has a sweep radius of approximately 100 m. Within three months of production, stable flow connectivity is established between injector–producer pairs, accompanied by a stabilization period in liquid (oil) production rates. Therefore, the average liquid production rate per unit thickness during the first three months was selected as the key indicator for evaluating fracturing flooding flow capacity.
The study reveals that flow capacity is maximized when permeability follows a low-to-high distribution between wells (approximately 5 times higher than the high-to-low distribution). Flow capacity demonstrates near-linear growth with increasing average permeability, confirming its importance as a controlling factor. An optimal permeability contrast range of 4–6F was identified, beyond which capacity declines. While flow capacity improves with injection volume, the enhancement rate significantly decreases after reaching 0.05 PV, establishing this as the critical threshold for effective fracturing flooding development.

Author Contributions

Conceptualization, H.X. and B.N.; methodology, H.X.; software, L.H.; validation, B.N.; writing—original draft, L.Z. and Z.Y.; writing—review & editing, Y.H. All authors have read and agreed to the published version of the manuscript.

Funding

This research received no external funding.

Data Availability Statement

This study did not generate or analyze any new datasets.

Conflicts of Interest

Authors, Haimin Xu, Baolun Niu, Li Huang, and Lei Zhang were employed by Sinopec Zhongyuan Oilfield Company. The remaining authors declare that the research was conducted in the absence of any commercial or financial relationships that could be construed as a potential conflict of interest.

References

  1. Bao, X.Z. Research on high-pressure water injection development in low-permeability oilfields. Chem. Eng. Des. Commun. 2020, 46, 7–8. [Google Scholar]
  2. Kang, W.-L.; Zhou, B.-B.; Issakhov, M.; Gabdullin, M. Advances in enhanced oil recovery technologies for low-permeability reservoirs. Pet. Sci. 2022, 19, 1622–1640. [Google Scholar] [CrossRef]
  3. Song, H.G. Application of ultra-high-pressure water injection technology in low-permeability reservoirs in Jianghan Oilfield. J. Jianghan Pet. Univ. Staff. Work. 2012, 25, 30–32. [Google Scholar]
  4. Wang, Y. Accurate determination method of formation pore pressure in fractured shale gas reservoirs. Pet. Drill. Tech. 2020, 48, 29–34. [Google Scholar]
  5. Li, X.L.; You, L.J.; Kang, Y.L.; Liu, J.; Chen, M.; Zeng, T.; Hao, Z. Investigation on the thermal cracking of shale under different cooling modes. J. Nat. Gas Sci. Eng. 2022, 97, 104359. [Google Scholar] [CrossRef]
  6. Shi, M.X.; Liu, Z.D.; Yang, X.F.; Yang, J.R.; Chen, X.J.; Liu, H.Z.; Cao, J.L. Review and prospects of geophysical logging prediction technology for formation pore pressure. Prog. Geophys. 2020, 35, 1845–1853. [Google Scholar]
  7. Fan, Q.L.; Wu, E.Z. Study on formation pressure variation after waterflood development in Daqing Oilfield. Pet. Explor. Dev. 1990, 6, 58–63+57. [Google Scholar]
  8. Shanley, K.W.; Cluff, R.M.; Robinson, J.W. Factors controlling prolific gas production from low-permeability sandstone reservoirs: Implications for resource assessment, prospect development, and risk analysis. AAPG Bull. 2004, 88, 1083–1121. [Google Scholar] [CrossRef]
  9. Li, N. Oil-water movement patterns in delta front of Haiwaihe Oilfield. Chem. Eng. Equip. 2013, 3, 100–102. [Google Scholar]
  10. Cui, C.; Wang, J.; Qian, Y.; Li, J.; Lu, S. Fracturing–flooding for low-permeability oil reservoirs: A coupled model integrating DDM and black-oil model. Rock Mech. Rock Eng. 2025, 58, 4069–4089. [Google Scholar] [CrossRef]
  11. Han, L.; Chen, J.S.; Chen, L. Study on diffusion radius and numerical simulation of curtain grouting. Rock Soil Mech. 2012, 33, 2235–2240. [Google Scholar]
  12. Luan, J.; Dong, P.C.; Zheng, J.L. Experimental studies on reaction laws during the process of air injection into the oil reservoirs with low permeability. J. Pet. Sci. Eng. 2020, 194, 107526. [Google Scholar] [CrossRef]
  13. Yang, Z.Q.; Lu, J.; Wang, Y.; Zhang, Z.W.; Yang, Y.; Zhu, Y.Y.; Zhang, J.; Guo, Y.F.; Chen, X.G. Power-law fluid cylindrical permeation grouting mechanism considering tortuosity effect of porous media. Chin. J. Rock Mech. Eng. 2021, 40, 410–418. [Google Scholar]
  14. Xu, J.Q.; Chang, Y.L.; An, J.L.; Wang, Y.Q. Development test of water injection system in Wendong Oilfield. Inn. Mong. Petrochem. Ind. 2011, 37, 140–142. [Google Scholar]
  15. Di, S.Y.; Cheng, S.Q.; Bai, W.P.; Wei, C.; Wang, Y.; Qin, J.Z. Mechanism and application of dynamic fracture propagation in tight oil reservoirs. Chin. J. Theor. Appl. Mech. 2021, 53, 2141–2155. [Google Scholar]
  16. Austad, T.; Rezaeidoust, A.; Puntervold, T. Chemical Mechanism of Low Salinity Water Flooding in Sandstone Reservoirs. In Proceedings of the SPE Improved Oil Recovery Conference, SPE 129767, Tulsa, OK, USA, 24 April 2010. [Google Scholar]
  17. Zhao, M.L. Numerical Simulation Study of CO2-Water Two-Phase Transport in Porous Media. Ph.D. Thesis, Dalian University of Technology, Dalian, China, 2013. [Google Scholar]
  18. Gao, Z.H.; Zhai, X.Y.; Wang, J.D. Study on distribution law of abnormal formation pressure after waterflood development in Daqing Oilfield. Pet. Geol. Oilfield Dev. Daqing 2005, 1, 51–53+108. [Google Scholar]
  19. Tian, X.F.; Cheng, L.S.; Li, C.L.; Li, C.Y.; Zhang, M.Y.; Jiang, L.W.; Hou, T.; Li, Q.; Wang, H.L. Calculation model of liquid-measured stress sensitivity in tight oil reservoirs. Chin. J. Comput. Phys. 2015, 32, 334–342. [Google Scholar]
  20. Pu, C.S.; Zheng, H.; Yang, Z.P.; Gao, Z.D. Research status and development trends of complex fracture formation mechanism in staged volume fracturing of horizontal wells. Acta Pet. Sin. 2020, 41, 1734–1743. [Google Scholar]
  21. Katende, A.; Sagala, F. A critical review of low salinity water flooding: Mechanism, laboratory and field application. J. Mol. Liq. 2019, 278, 627–649. [Google Scholar] [CrossRef]
  22. Qu, Y.N.; Ding, J.X.; Zou, X.Y.; Han, A.W. Production characteristics and influencing factors of waterflood development in low-permeability oilfields. China Pet. Chem. Stand. Qual. 2021, 41, 42–43. [Google Scholar]
  23. Zhao, Z.; Jiang, S.; Lei, T.; Wang, J.; Zhang, Y. Optimization of key parameters of fracturing flooding development in offshore reservoirs with low permeability based on numerical modeling approach. J. Mar. Sci. Eng. 2025, 13, 282. [Google Scholar] [CrossRef]
  24. Zhang, Y.F.; Yang, Y.; Sun, Z.G. Physical simulation and quantitative characterization of fractures in fracturing flooding development of low-permeability reservoirs. Pet. Geol. Recovery Effic. 2022, 29, 143–149. [Google Scholar]
  25. China Petroleum Exploration and Development Research Institute (RIPED). Global Petroleum E&D Trends and Company Dynamics (2021); Petroleum Industry Press: Houston, TX, USA, 2021. [Google Scholar]
  26. Wang, X.; Yu, W.; Xie, Y.; He, Y.; Xu, H.; Chu, X.; Li, C. Numerical simulation of the dynamic behavior of low permeability reservoirs under fracturing-flooding based on a dual-porous and dual-permeable media model. Energies 2024, 17, 6203. [Google Scholar] [CrossRef]
  27. Cao, H.; Zhang, G.; Li, S.; Zhou, D.; Yu, C.; Sun, Q. Fracturing initiation and breakdown pressures in fracturing-flooding sandstone reservoirs. Rock Mech. Rock Eng. 2024, 44, 34–37. [Google Scholar] [CrossRef]
  28. Sun, Y.Z. Performance comparison and application of oil displacement agents in tertiary oil recovery. Chem. Eng. Equip. 2022, 9, 85–86. [Google Scholar]
  29. Xiang, H.; Feng, N.; Zhi, W.D. Research and application of surfactant injection technology for enhanced oil recovery in low-permeability reservoirs. Chem. Eng. 2022, 36, 42–45+95. [Google Scholar]
  30. Tong, X.G.; Zhang, G.Y.; Wang, Z.M. Potential and distribution of global oil and gas resources. Pet. Explor. Dev. 2018, 45, 727–736. [Google Scholar] [CrossRef]
  31. Ding, S.W.; Xi, Y.; Liu, G.W. Adaptability of different CO2 injection methods for enhanced oil recovery and geological storage in low-permeability reservoirs. Pet. Geol. Recovery Effic. 2023, 30, 104–111. [Google Scholar]
  32. Liu, F.N.; Zhang, X.Y.; Fu, C.Y. Experimental study on the effect of injection media on recovery factor in ultra-low permeability reservoirs. Petrochem. Technol. 2022, 29, 159–161. [Google Scholar]
  33. Fan, Y.M. Classification evaluation of undeveloped reserves in low-permeability reservoirs based on development technologies. Pet. Geol. Exp. 2022, 44, 337–341. [Google Scholar]
Figure 1. Permeability fields of matrix and fracture systems after fracturing flooding simulation.
Energies 18 03279 g001
Figure 2. Fluid–solid coupling mechanism.
Energies 18 03279 g002
Figure 3. Abaqus-based fluid–solid coupling model for fracturing flooding development.
Energies 18 03279 g003
Figure 4. Typical fracture network morphology under injection stimulation.
Energies 18 03279 g004
Figure 5. Pressure propagation paths along major/minor axes.
Energies 18 03279 g005
Figure 6. Determination chart for fracture network aspect ratio (b/a).
Energies 18 03279 g006
Figure 7. Well location distribution.
Energies 18 03279 g007
Figure 8. Numerical simulation of fracture propagation morphology.
Energies 18 03279 g008
Figure 9. Permeability distribution.
Energies 18 03279 g009
Figure 10. Liquid production rate in fracturing flooding development.
Energies 18 03279 g010
Figure 11. Oil production rate in fracturing flooding development.
Energies 18 03279 g011
Figure 12. Heterogeneous distribution pattern diagrams.
Energies 18 03279 g012
Figure 13. Bar chart of liquid production rates under different heterogeneous distribution patterns.
Energies 18 03279 g013
Figure 14. Bar chart of oil production rates under different heterogeneous distribution patterns.
Energies 18 03279 g014
Figure 15. Models with different permeability levels.
Energies 18 03279 g015
Figure 16. Production rate curves for different permeability levels.
Energies 18 03279 g016
Figure 17. Oil production rate curves for different permeability levels.
Energies 18 03279 g017
Figure 18. Models with different permeability contrasts.
Energies 18 03279 g018
Figure 19. Liquid production rate curves under heterogeneous permeability contrasts.
Energies 18 03279 g019
Figure 20. Oil production rate curves under heterogeneous permeability contrasts.
Energies 18 03279 g020
Figure 21. Simulation model for the impact of fracturing flooding water injection volume on seepage capacity.
Energies 18 03279 g021
Figure 22. Production rate curves under different fracturing flooding water injection volumes.
Energies 18 03279 g022
Table 1. Key parameters for Abaqus fluid–solid coupling simulation of fracturing flooding development.
ParametersValuesParametersValues
Permeability
/mD
5.5Hydraulic conductivity/(m/s)1 × 10−7
Porosity/%10.8Fracture pressure/MPa58
Fluid leakage1 × 10−10Initial pore pressure/MPa30
Young’s modulus
/GPa
30σH/MPa55
Poisson’s ratio0.28σh/MPa45
Viscosity/cP1Displacement/(m3/d)800
Table 2. Fracture system stress sensitivity table.
Formation
Pressure/MPa
Porosity FactorConductivity Factor
200.990.8
301.01.0
401.650
501.6100
601.8150
701.9180
801.9200
Table 3. Bar chart of liquid production rates under different heterogeneous distribution patterns.
Non-Uniform Distribution PatternsDaily Liquid Production per Unit Thickness/(m³/d)
Low-to-high permeability distribution0.57
High-to-low permeability distribution0.11
Central-low/edge-high distribution0.24
Central-high/edge-low distribution0.37
Table 4. Bar chart of oil production rates under different heterogeneous distribution patterns.
Non-Uniform Distribution PatternsDaily Oil Production per Unit Thickness/(m³/d)
Low-to-high permeability distribution0.46
High-to-low permeability distribution0.09
Central-low/edge-high distribution0.2
Central-high/edge-low distribution0.3
Table 5. Liquid production rates at different permeability levels.
Average Permeability/mDDaily Liquid Production per Unit Thickness/(m³/d)
20.15
40.41
60.69
80.85
101.11
Table 6. Oil production rates at different permeability levels.
Average Permeability/mDDaily Liquid Production per Unit Thickness/(m³/d)
20.12
40.34
60.56
80.69
100.91
Table 7. Liquid production rates at different permeability contrasts.
Permeability ContrastDaily Liquid Production per Unit Thickness/(m³/d)
10.41
1.50.46
40.58
5.70.58
90.48
Table 8. Oil production rates at different permeability contrasts.
Permeability ContrastDaily Liquid Production per Unit Thickness/(m³/d)
10.33
1.50.38
40.47
5.70.47
90.4
Table 9. Production rate under different fracturing flooding water injection volumes.
Water Injection Volume/PVDaily Liquid Production/(m³/d)Daily Oil Production/(m³/d)
0.030.170.14
0.040.620.52
0.051.321.1
0.061.741.42
0.072.041.64
0.082.291.83
0.092.572.03
0.12.882.23
Disclaimer/Publisher’s Note: The statements, opinions and data contained in all publications are solely those of the individual author(s) and contributor(s) and not of MDPI and/or the editor(s). MDPI and/or the editor(s) disclaim responsibility for any injury to people or property resulting from any ideas, methods, instructions or products referred to in the content.

