1. Introduction
In the last century, energy demand has increased noticeably, causing human societies to face several challenges, such as global warming [
1]. The urgent need to address climate change, energy security, and economic stability has raised global debate about our energy sources’ future. In other words, as the third decade of the twenty-first century advances, human society is at a turning point in the energy industry [
2]. On the other hand, the long-term and extensive use of fossil fuels has played a major role in climate change, which has affected the Earth’s climatic system. Fossil fuel combustion releases large amounts of greenhouse gases into the atmosphere, particularly carbon dioxide, which traps heat and raises global temperatures [
3]. Sea levels are increasing as a result of the melting of glaciers and polar ice caps brought on by global warming, endangering coastal ecosystems and livelihoods through increased erosion and floods. Furthermore, extreme occurrences like intense heat waves are being brought on by climate change throughout southern Europe, the Middle East, and a large portion of North America [
4]. According to a recent study conducted in 2024, the climate has shifted to a consistently warmer-than-average state. Notably, the global temperature rise has exceeded the 1.5 °C threshold set by the Paris Agreement’s climate goals much earlier than anticipated, driven by both human activities and specific meteorological conditions [
5]. Therefore, switching to clean energies would have varied impacts on energy security and environment protection. Accordingly, embracing renewable energy sources such as solar, wind, and hydrogen is essential for creating a more resilient and environmentally friendly energy system [
6].
The International Energy Agency (IEA) has emphasized hydrogen’s potential as an alternative fuel in its 2050 net-zero road map, particularly for the transportation and aviation sectors [
7]. Hydrogen serves as a viable alternative for transitioning from fossil fuels to renewable energy, as it produces no greenhouse gas emissions when burned or oxidized for energy. In fuel cells, it generates electricity by reacting with oxygen, with water being the only byproduct. Unlike natural gas combustion, hydrogen avoids emitting harmful pollutants like nitrogen oxides and particulate matter, contributing to better air quality and improved public health [
8]. Hydrogen production methods have been characterized using a color coding scheme proposed by Noussan et al. [
9] to indicate their process design and associated GHG emissions. Grey hydrogen is defined as being created by fossil fuels, blue hydrogen is defined as being produced by combining grey hydrogen with carbon capture and storage (CCS), and green hydrogen is primarily produced by water electrolysis energized by renewable power. In this regard, the process of making hydrogen from hydrocarbons frequently results in the creation of syngas, which can be used as a feedstock or as a step in the process of creating pure hydrogen. Natural gas pyrolysis, coal gasification, steam methane reforming, and auto-thermal reforming are examples of industrial-scale techniques, among which the last two technologies are the most commercialized ones [
10]. It is also worth noting that while previous studies have primarily focused on optimizing blue hydrogen production technologies such as reforming, there has been limited investigation into the impact of full utility integration, including compression and storage systems, on the overall efficiency and economics of hydrogen production. Therefore, in addition to advancing core production technologies through experimental and numerical studies, it is essential to highlight and analyze the role of these complementary systems in achieving a more accurate and holistic evaluation of blue hydrogen plant performance [
11].
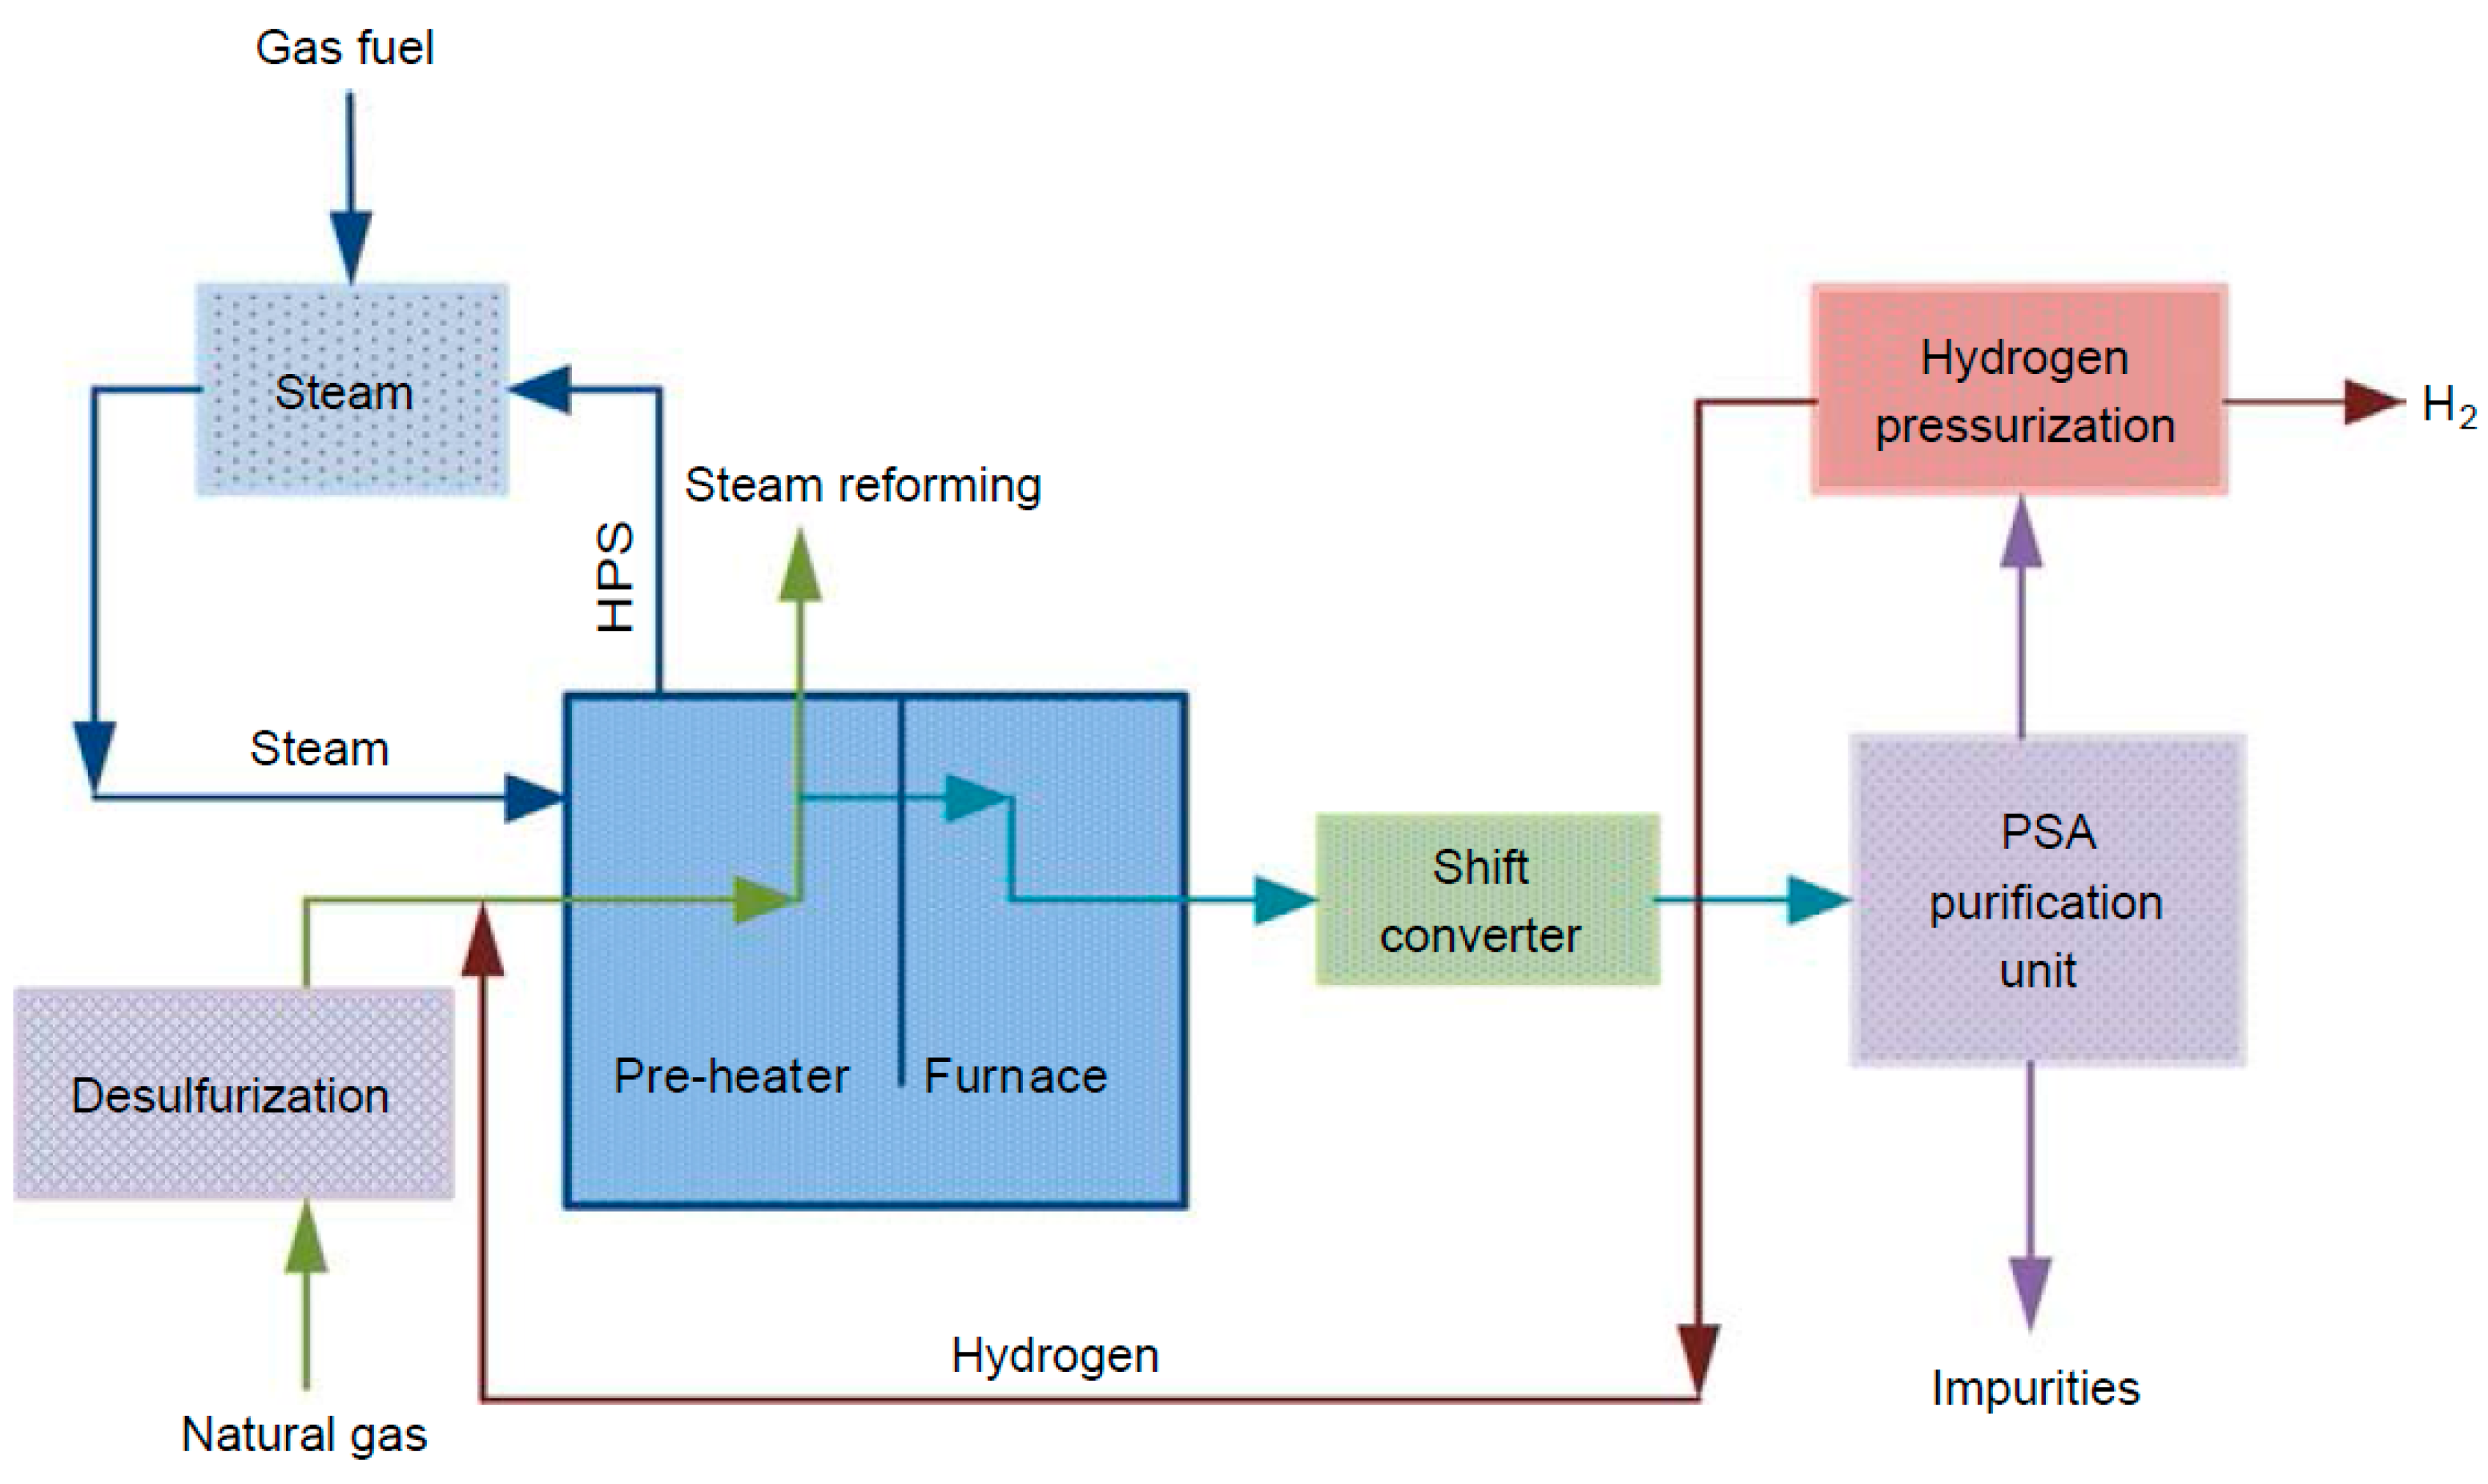
At the moment, the most popular technique for producing hydrogen is steam–methane reforming technology (SMR). This well-established method produces hydrogen from natural gas, LPG, refinery off-gases, and other sources [
12]. When methane and steam are combined under 3 to 25 bar (g) and 750 to 1000 °C with a catalyst present, steam–methane reforming (SMR) produces hydrogen, carbon monoxide, and a negligible quantity of carbon dioxide. The complementary water–gas shift process then produces CO
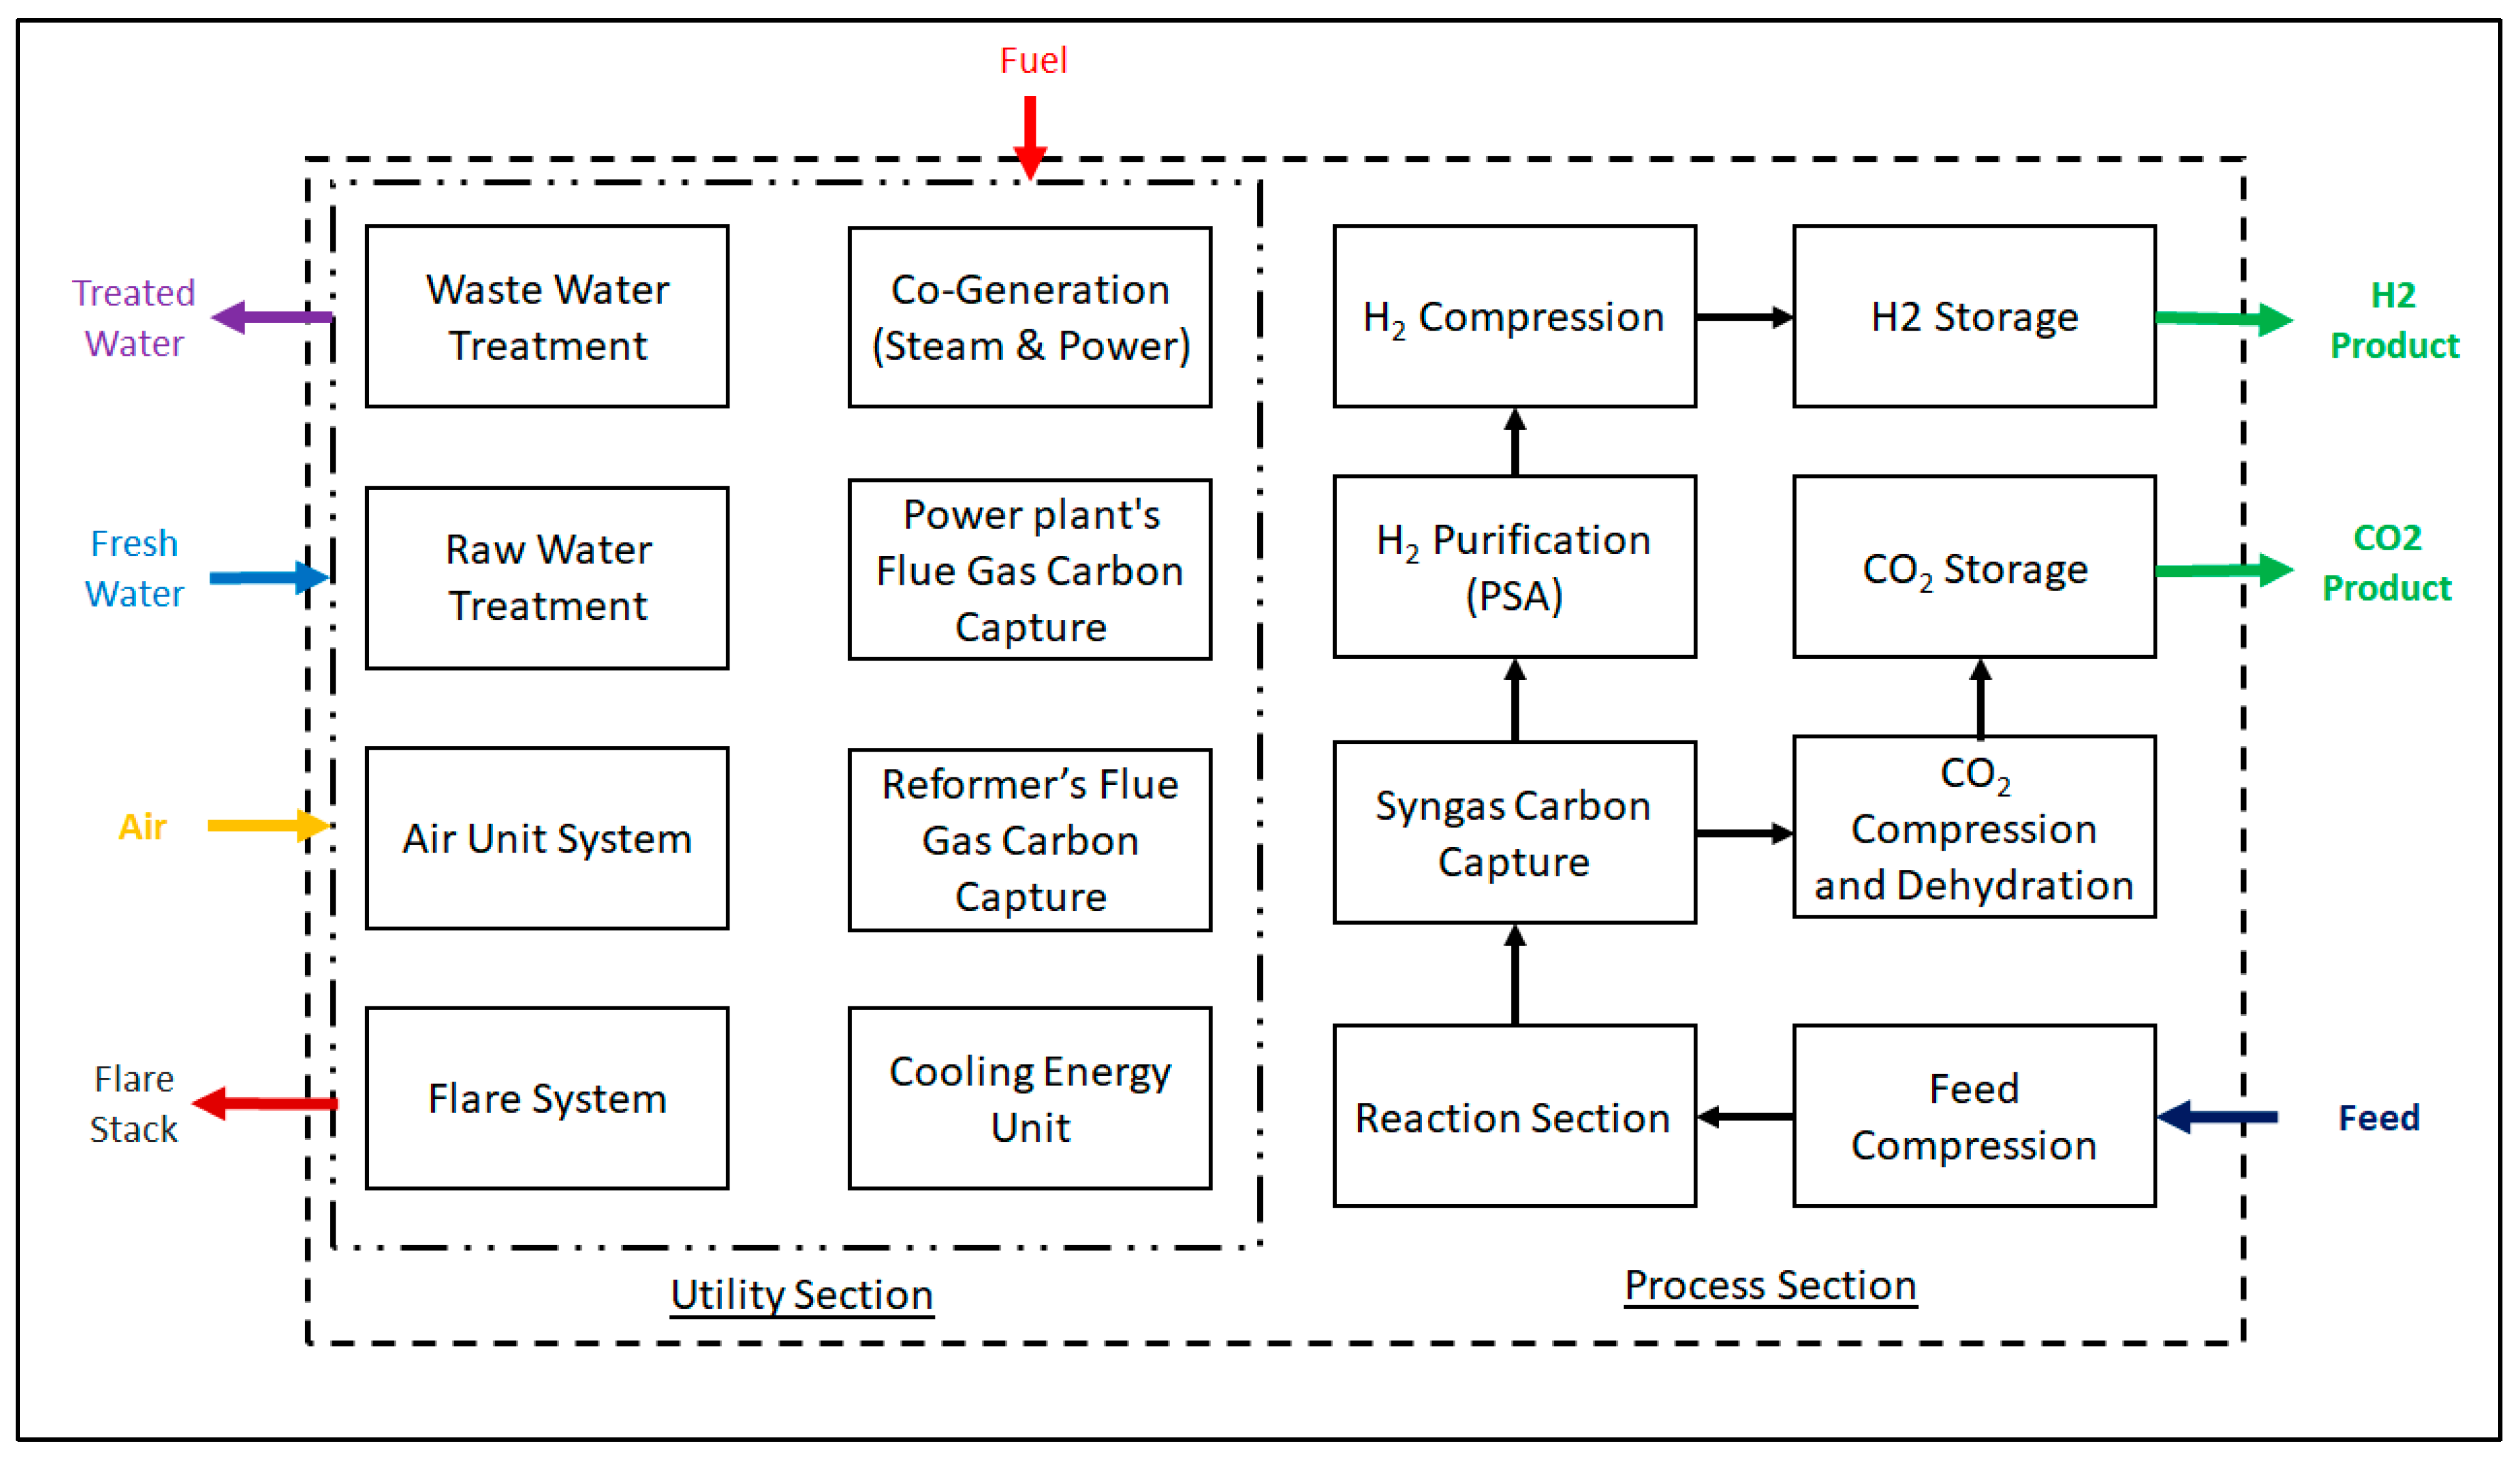
2 and hydrogen by reacting carbon monoxide and steam over a catalyst, which takes place at two stages: a high-temperature shift reaction (HTS) in the range of 300 to 500 °C) and a low-temperature shift reaction (LTS) working between 200 and 300 °C. Afterwards, the produced syngas undergoes purification into high quality hydrogen with 99.99 mol.% purity. A generalized block flow diagram for a hydrogen production unit utilizing steam–methane reforming is illustrated in
Figure 1.
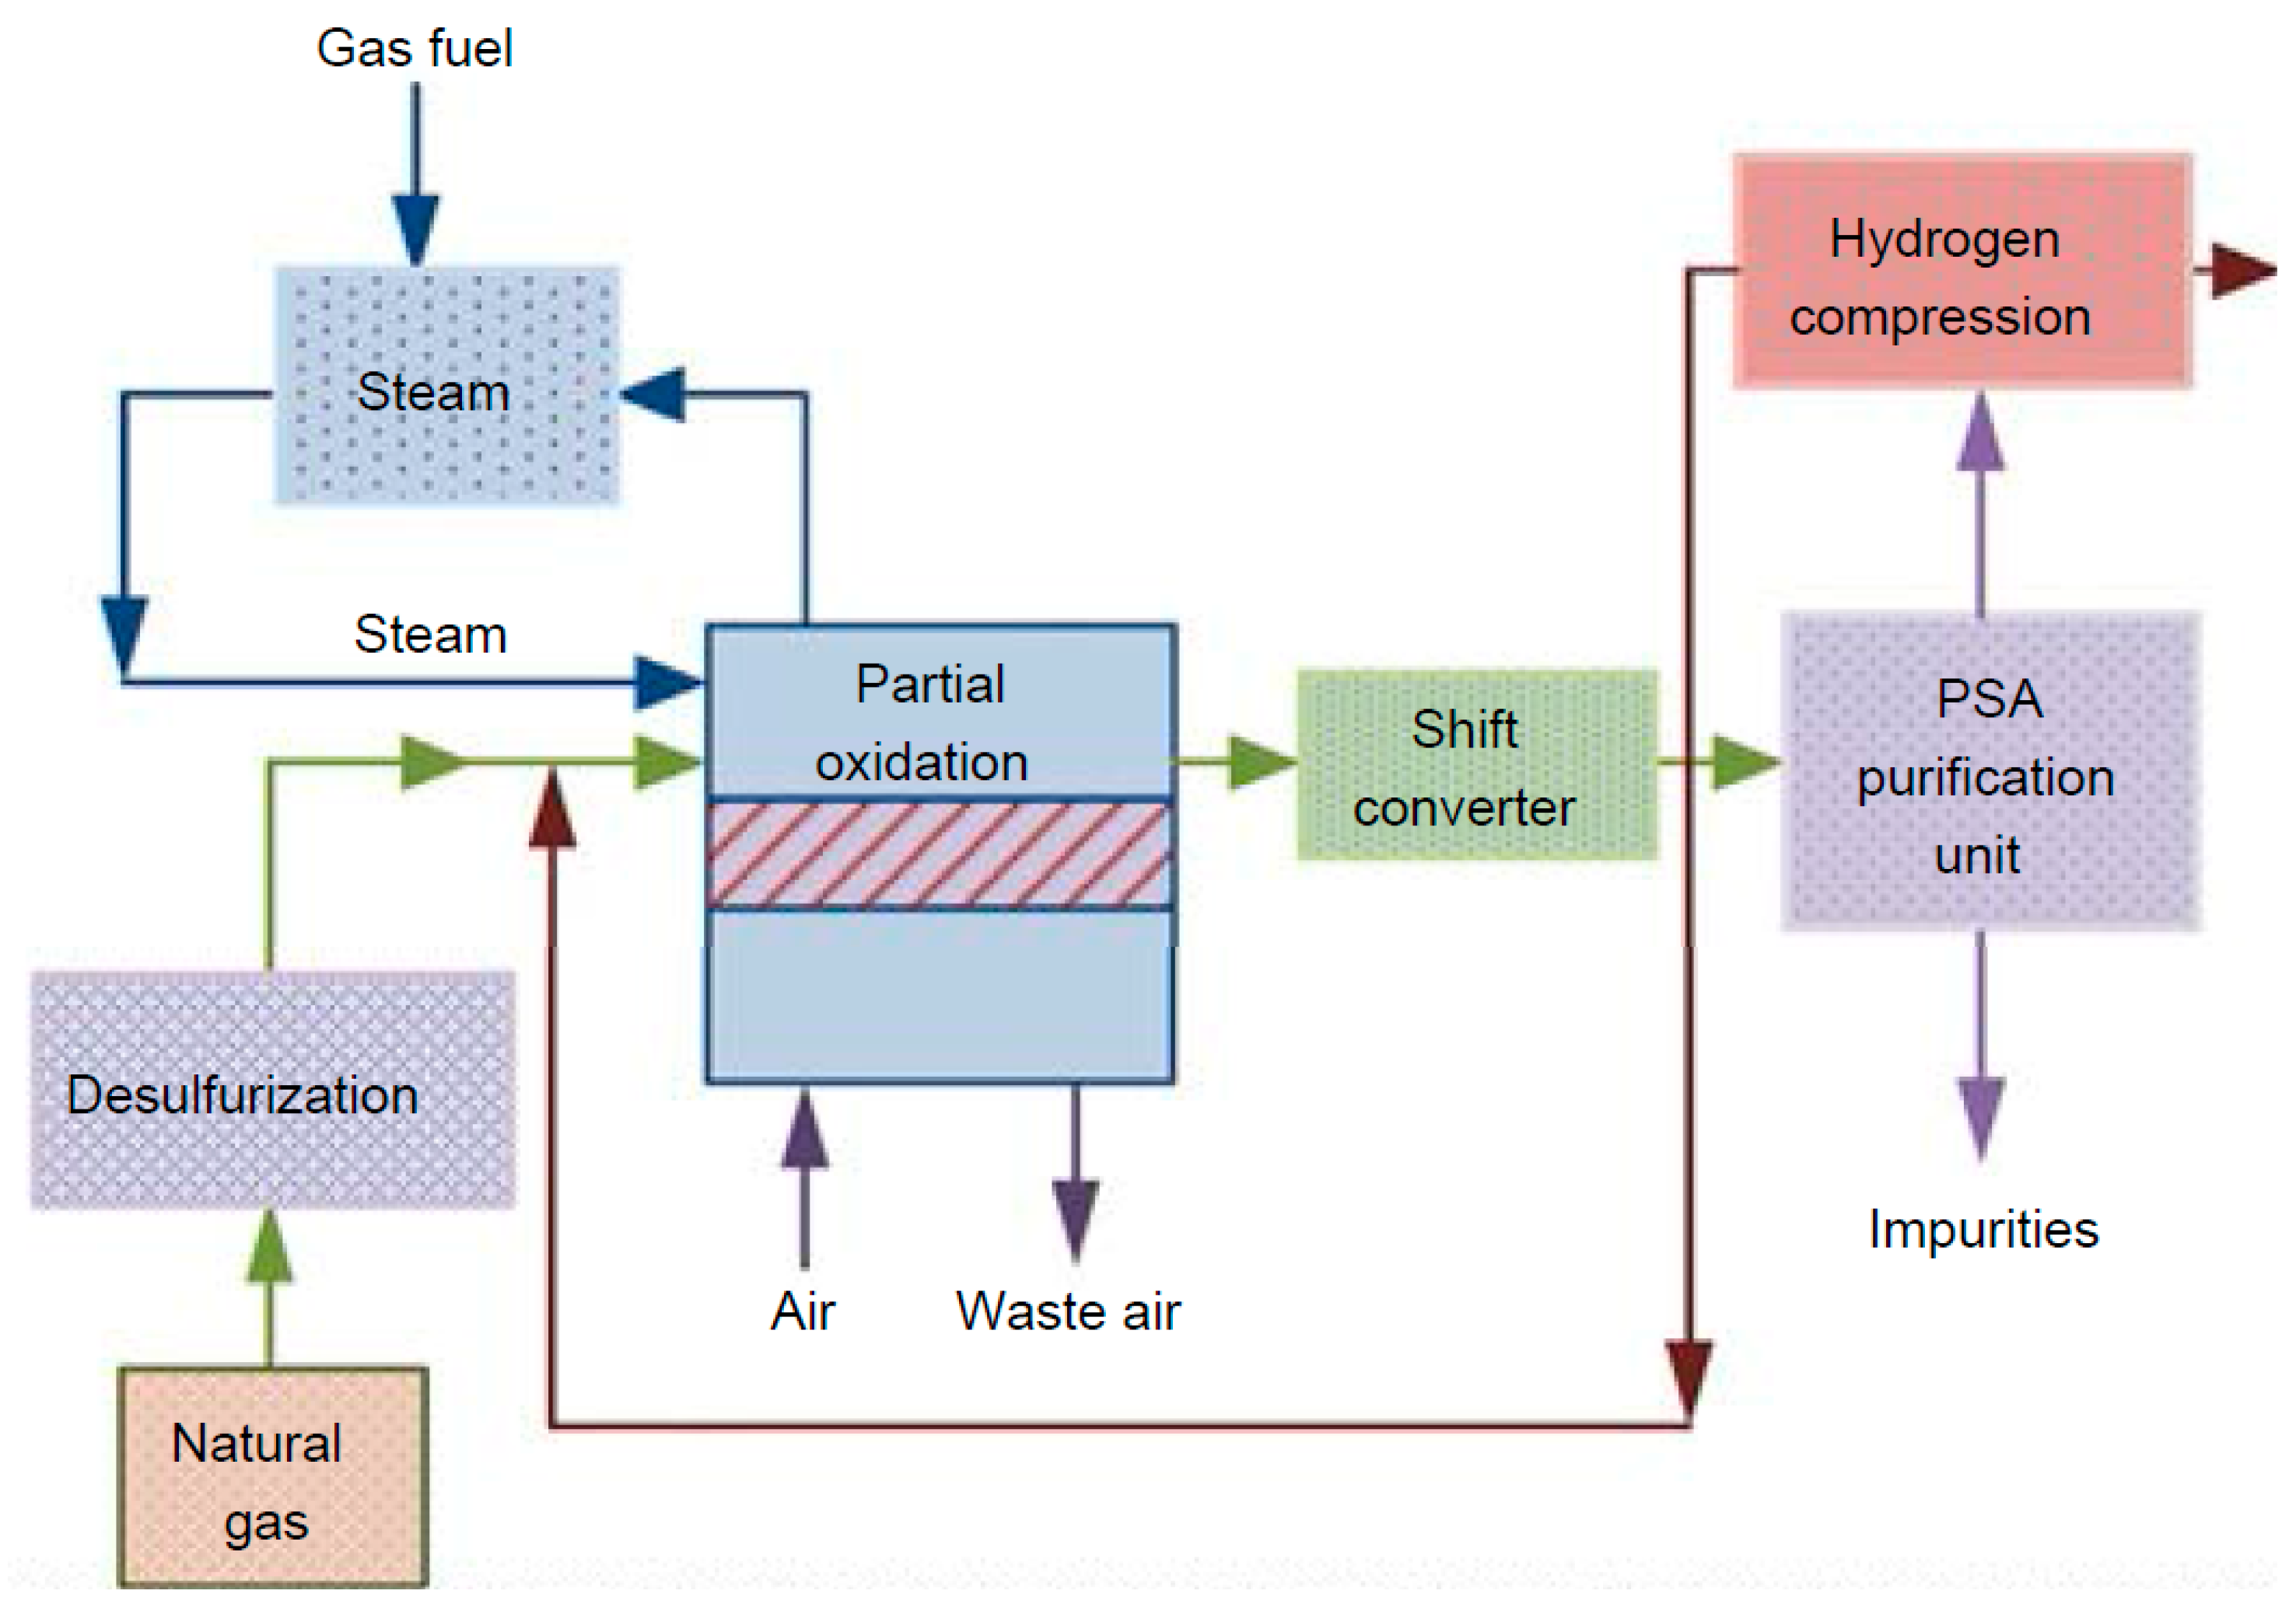
Auto-thermal reforming (ATR) is an alternate method that combines steam–methane reforming and partial oxidation of natural gas. Combusting part of the natural gas generates the heat required to facilitate the reaction of CH
4 with steam and helps reduce the requirement for external reactor heating via a process furnace [
13]. Accordingly, by combining exothermic and endothermic reactions, ATR efficiently utilizes the heat generated within the process, reducing the need for external heating. A generalized process flow diagram for a hydrogen production unit utilizing auto-thermal reforming technology is illustrated in
Figure 2.
Since ATR requires less reaction external energy than other technologies, it performs better in environmental assessments and has a lower carbon footprint.
Numerous techno-economic studies have been conducted in the past to evaluate various aspects of these two hydrogen production methods. For instance, Oni et al. carried out a comparative economic and environmental evaluation of the production of hydrogen using SMR, ATR, and gas decomposition technologies [
14]. Their results showed that blue H
2 from auto-thermal reforming generated the lowest equivalent greenhouse gas emissions compared to others, while it had the highest cost of production. Also, it was estimated that depending on the production technology, the price of blue hydrogen can vary from USD 1.69 to USD 2.55 per kg of H
2. Dara et. al. [
15] compared several techniques for producing blue hydrogen, and auto-thermal reforming performed better in terms of thermal efficiency. It was revealed that the selling price of hydrogen should be adapted in accordance with the energy intensity requirements for carbon capture. Riemer et al. [
16] also presented the discrepancy between estimates from the literature and real-world experience regarding the environmental effects of carbon capture units in the production of blue hydrogen. Their results showed that energy sources, consumption, and capture rate differ between studies, which significantly affects emissions. In 2025, Yoon et. al. analyzed integrated hydrogen liquefaction with autothermal reforming utilizing liquefied oxygen as a pre-coolant, which led to decreased specific energy consumption by 6.6% and an 11% reduction in the global warming impact of blue hydrogen production [
17]. On the other hand, Canada also has great potential for blue hydrogen production. So, finding appropriate and customized design arrangements of different technologies becomes vital for optimum production. It is said that by 2050, Canada must address and overcome a number of economic, policy, technological, and infrastructure obstacles in order to achieve a net-zero economy. Canada has a natural advantage in this area due to its wealth of natural resources and the necessary technological capability [
18]. For instance, Zhang et al. proposed using blue hydrogen to decarbonize heavy oil and oil sands operations in Canada, which would result in a 76% reduction in CO
2 emissions [
19].
Despite various available techno-economic studies for blue hydrogen production methods, the main focus remained on production technology development and analysis of design arrangements in main process units. In other words, the effects of compression and storage as well as utility units in H2 have not been elaborated well in terms of the environmental and economic aspects of plant production. This point highlights the significance of the greenfield approach, which comprises all associated utility units for process plant production. In this regard, this work provided a detailed analysis of a greenfield blue hydrogen plant to clarify the various direct and indirect aspects of hydrogen production. Given the wide range of hydrogen production methods and locales, production cost estimates vary widely. Thus, understanding the effects of proper carbon capture design arrangements based on current technologies becomes significant and is the core objective and contribution of this paper.
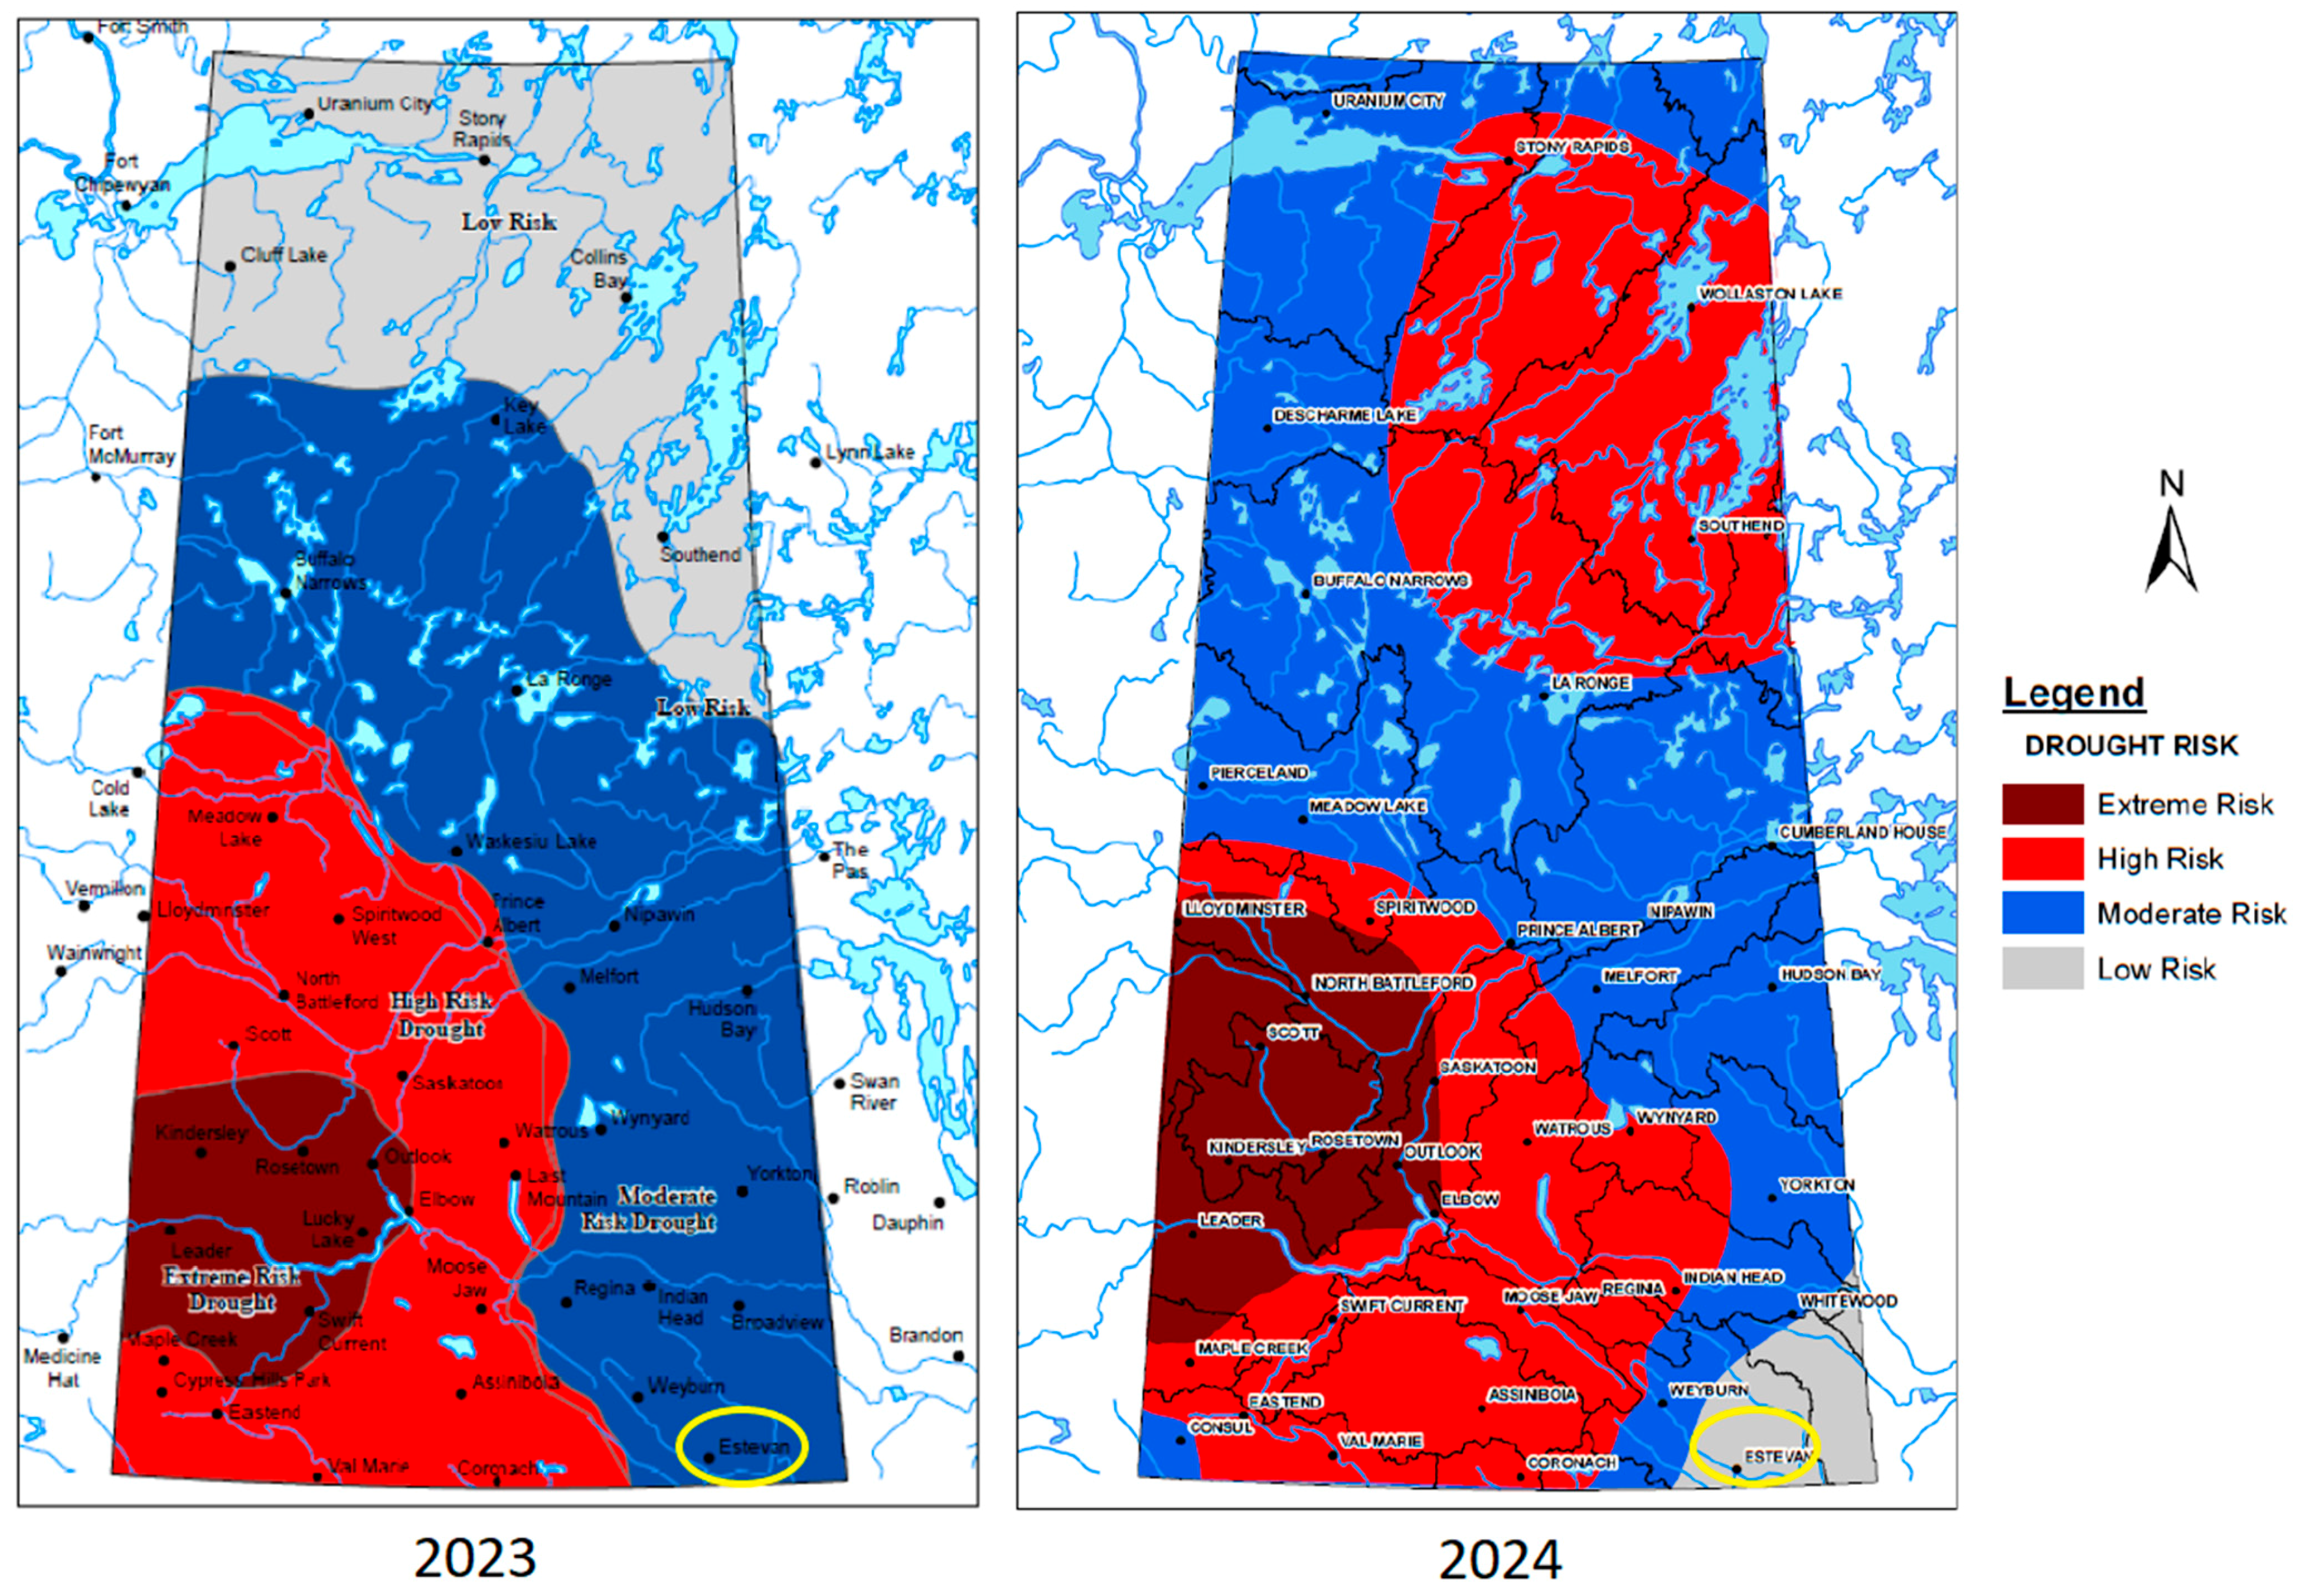
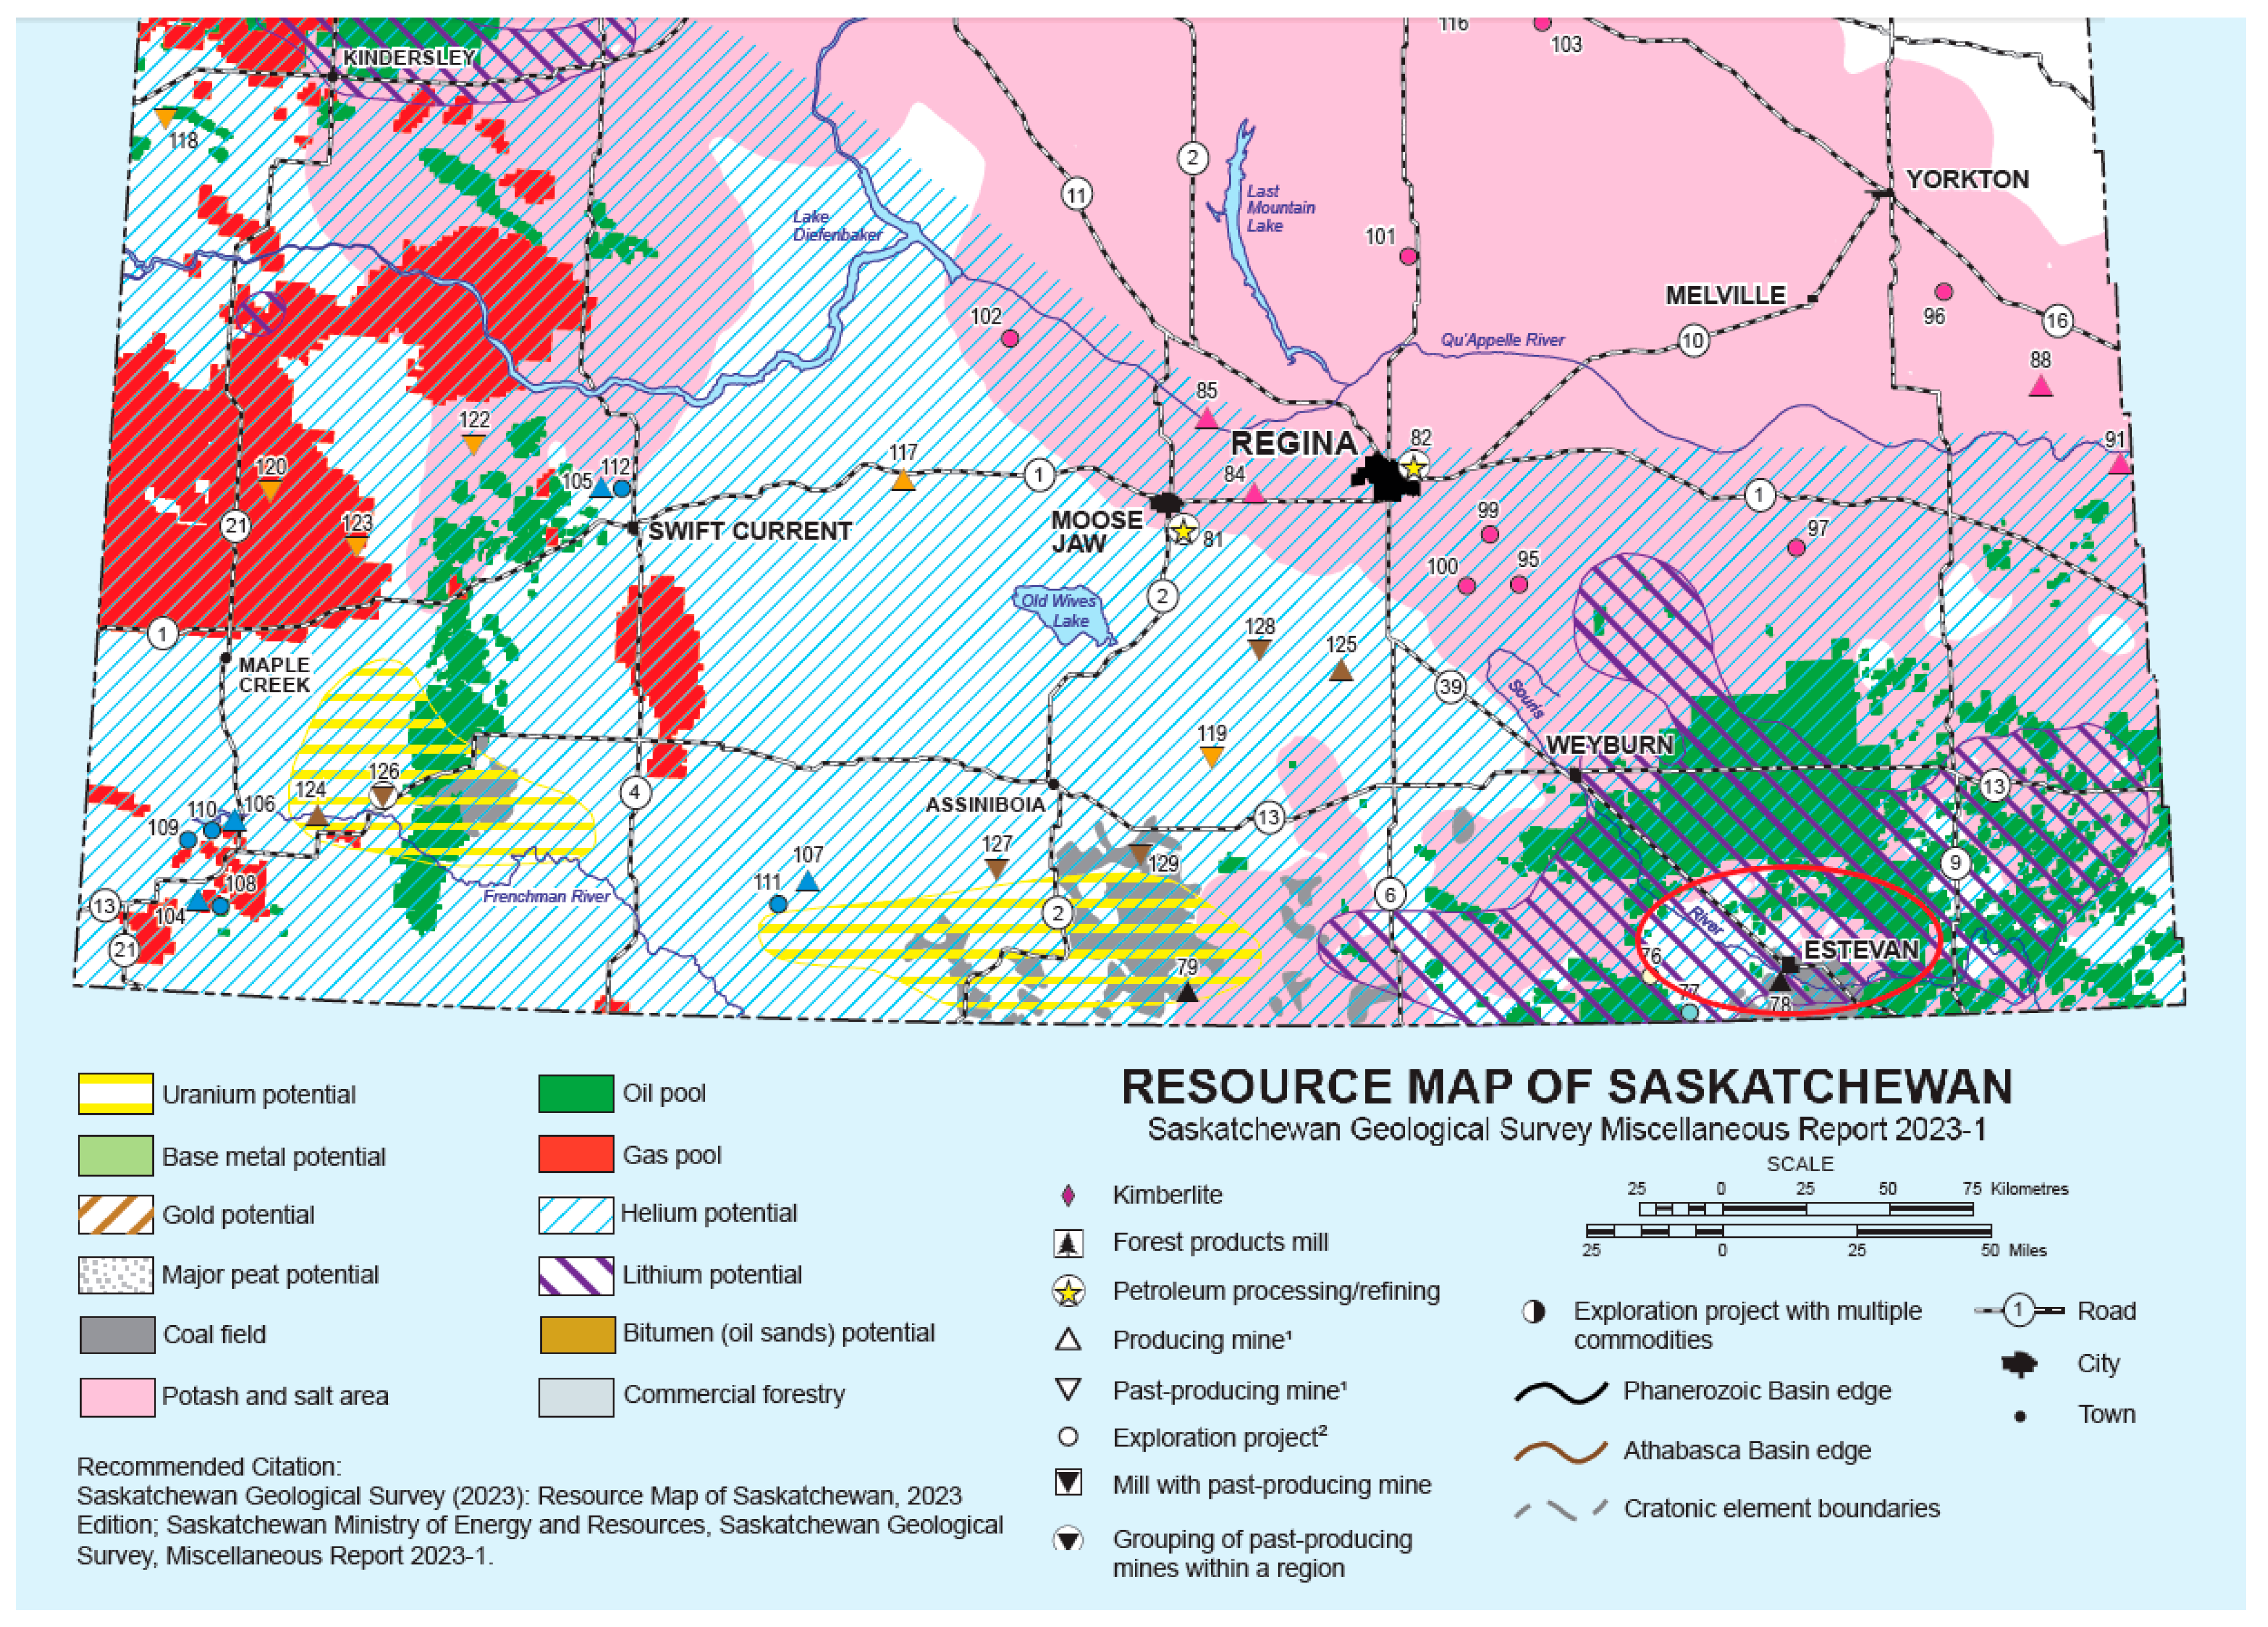
This study presents a comprehensive case study for a greenfield blue hydrogen plant in Estevan, Saskatchewan, Canada, a region with significant fossil fuel resources and emerging carbon management initiatives. Given the growing demand for low-carbon hydrogen as an alternative energy source, it is essential to analyze the entire production process, including both core hydrogen generation technologies and supporting utility systems. While previous research has primarily focused on optimizing the main reforming units, there has been limited investigation into the impact of complete utility integration, compression, and storage on overall hydrogen production efficiency and economics. This study uniquely fills this gap by conducting a detailed techno-economic and environmental analysis that considers the full energy, economic, and environmental footprint of hydrogen production in a realistic industrial setting. A key novelty of this work is its holistic approach, which evaluates both SMR and ATR technologies while incorporating essential utility systems such as air separation, refrigeration, CO2 compression, dehydration, and water treatment, all of which play a significant role in energy consumption and distribution among various units. To obtain accurate results across all these units, a comprehensive Aspen HYSYS simulation was conducted, enabling precise modeling of energy requirements, process interactions, and emissions. Furthermore, the study provides a detailed economic evaluation, including operating costs, revenue streams, and net present value (NPV), while assessing the sensitivity of hydrogen production costs to key economic variables. The environmental assessment reinforces the analysis by quantifying the Global Warming Potential (GWP) of each process, demonstrating the CO2 footprint reduction potential of ATR compared to SMR. By offering a real-world case study with a detailed, system-wide evaluation, this work serves as a good reference for designing and optimizing future blue hydrogen plants in regions with similar energy landscapes.
3. Results and Discussion
In this study, the authors compared two hydrogen production cases: steam–methane reforming (SMR) and auto-thermal reforming (ATR), focusing on their process configurations and utility requirements. The comparison was provided for both technologies, highlighting key operational differences and their implications for efficiency and energy consumption. Both SMR and ATR processes involved hydrocarbon feed conversion into syngas, followed by hydrogen separation and purification. The process began with feed gas compression to the required pressure before being introduced into the reformer. In SMR, the reformer utilized high-pressure steam and an external heat source to drive the endothermic reaction, whereas ATR combined partial oxidation with steam reforming within the reformer. The generated syngas then underwent high-temperature shift (HTS) and low-temperature shift (LTS) reactions to convert residual carbon monoxide into additional hydrogen and carbon dioxide. Following the shift reaction, the gas stream entered the absorption section, where CO2 was separated using an amine-based solvent, facilitating carbon capture. The hydrogen-rich stream was further purified using pressure swing adsorption (PSA) to meet product specifications. In ATR, the presence of the ASU enabled oxygen supply for partial oxidation, influencing process heat balance and reducing energy demand in the reformer noticeably, while its syngas carbon removal unit underwent a slight increase in the solvent regeneration part. Additionally, CO2 compression and dehydration units ensured the captured carbon from the syngas purification section and flue gas from post-combustion units were stored or utilized effectively.
This section presents a detailed analysis of these factors, incorporating operating parameters, energy demand, and the role of auxiliary units such as compression, separation, and purification systems. The insights gained from this comparison provide a basis for evaluating the feasibility and sustainability of each hydrogen production route.
In this regard,
Table 4 summarizes the main operating parameters, which are compared with acceptable specification ranges in the literature.
The simulation results for the hydrogen production plant demonstrated strong alignment with typical values found in the literature, ensuring process reliability and efficiency. The hydrogen product quality of 99.99 mol.% matched the highest purity levels expected for industrial hydrogen applications, such as ammonia production, fuel cells, and refining processes. This high purity was essential to prevent catalyst poisoning in downstream applications. Additionally, the hydrogen product pressure of 400 bar fell within the acceptable range of 400–700 bar, making it suitable for storage, transport, and pipeline distribution without requiring additional compression in many cases.
The carbon capture section also showed favorable results, achieving a CO2 product purity of 98 mol.% through separation by the carbon capture and dehydration units. It surpassed the benchmark of >95 mol.%. This high purity indicated that the separation and purification process was effective, ensuring that captured CO2 met the standards for utilization in enhanced oil recovery (EOR) or geological storage. The CO2 product pressure of 100 bar was at the lower end of the 100–150 bar range, meaning it was already at a pressure suitable for transport but might have required additional compression for long-distance pipeline injection. The water content in the CO2 product pipeline was 2.7 lb/MMSCF, significantly lower than the upper limit of 7 lb/MMSCF. Keeping the moisture content low was crucial to prevent corrosion and hydrate formation in pipelines, ensuring the reliability of CO2 transportation infrastructure.
The reformer operating temperature of 923 °C was well within the optimal range of 800–1000 °C, supporting efficient methane conversion while avoiding excessive thermal stress that could have led to equipment degradation. The high-temperature shift (HTS) and low-temperature shift (LTS) reactors operated at 357 °C and 255 °C, respectively, both within their expected operational ranges. These temperatures were carefully selected to maximize carbon monoxide conversion into additional hydrogen while preventing unwanted side reactions or catalyst deactivation.
The steam-to-methane ratio of 3.4 was within the expected range of 2.5–5, balancing hydrogen yield and process efficiency. A lower ratio could have led to incomplete methane conversion, while a higher ratio would have increased energy consumption without significant hydrogen yield improvement. The energy demand for DEA amine regeneration was 3.8 MJ/kg_CO2, fitting within the 2.7–4.2 MJ/kg_CO2 range, which confirmed that the solvent regeneration process operated efficiently. Maintaining energy consumption within this range ensured that CO2 capture remained cost-effective while still achieving high removal efficiency. The DEA amine concentration at 35 mass% enhanced CO2 absorption capacity and reduced solvent circulation rates, leading to lower energy consumption.
For the dehydration system, the TEG-to-water ratio of 3.1 gallon_TEG/lb_water was well within the acceptable range of 2–6, allowing effective moisture removal from the gas stream. Proper dehydration was necessary to prevent corrosion and hydrate formation in downstream equipment. The TEG concentration of 98 mass% aligned with the typical range, ensuring high dehydration efficiency while preventing excessive solvent degradation. Finally, the TEG regenerator reboiler temperature was 204 °C, safely below the 207 °C threshold, ensuring efficient solvent regeneration without risking thermal degradation, which could have reduced system performance over time. Overall, these specifications confirmed that the process operated within industry standards and in an optimum range, which enabled the authors to elaborate the effects of SMR and ATR technologies for a greenfield hydrogen production plant.
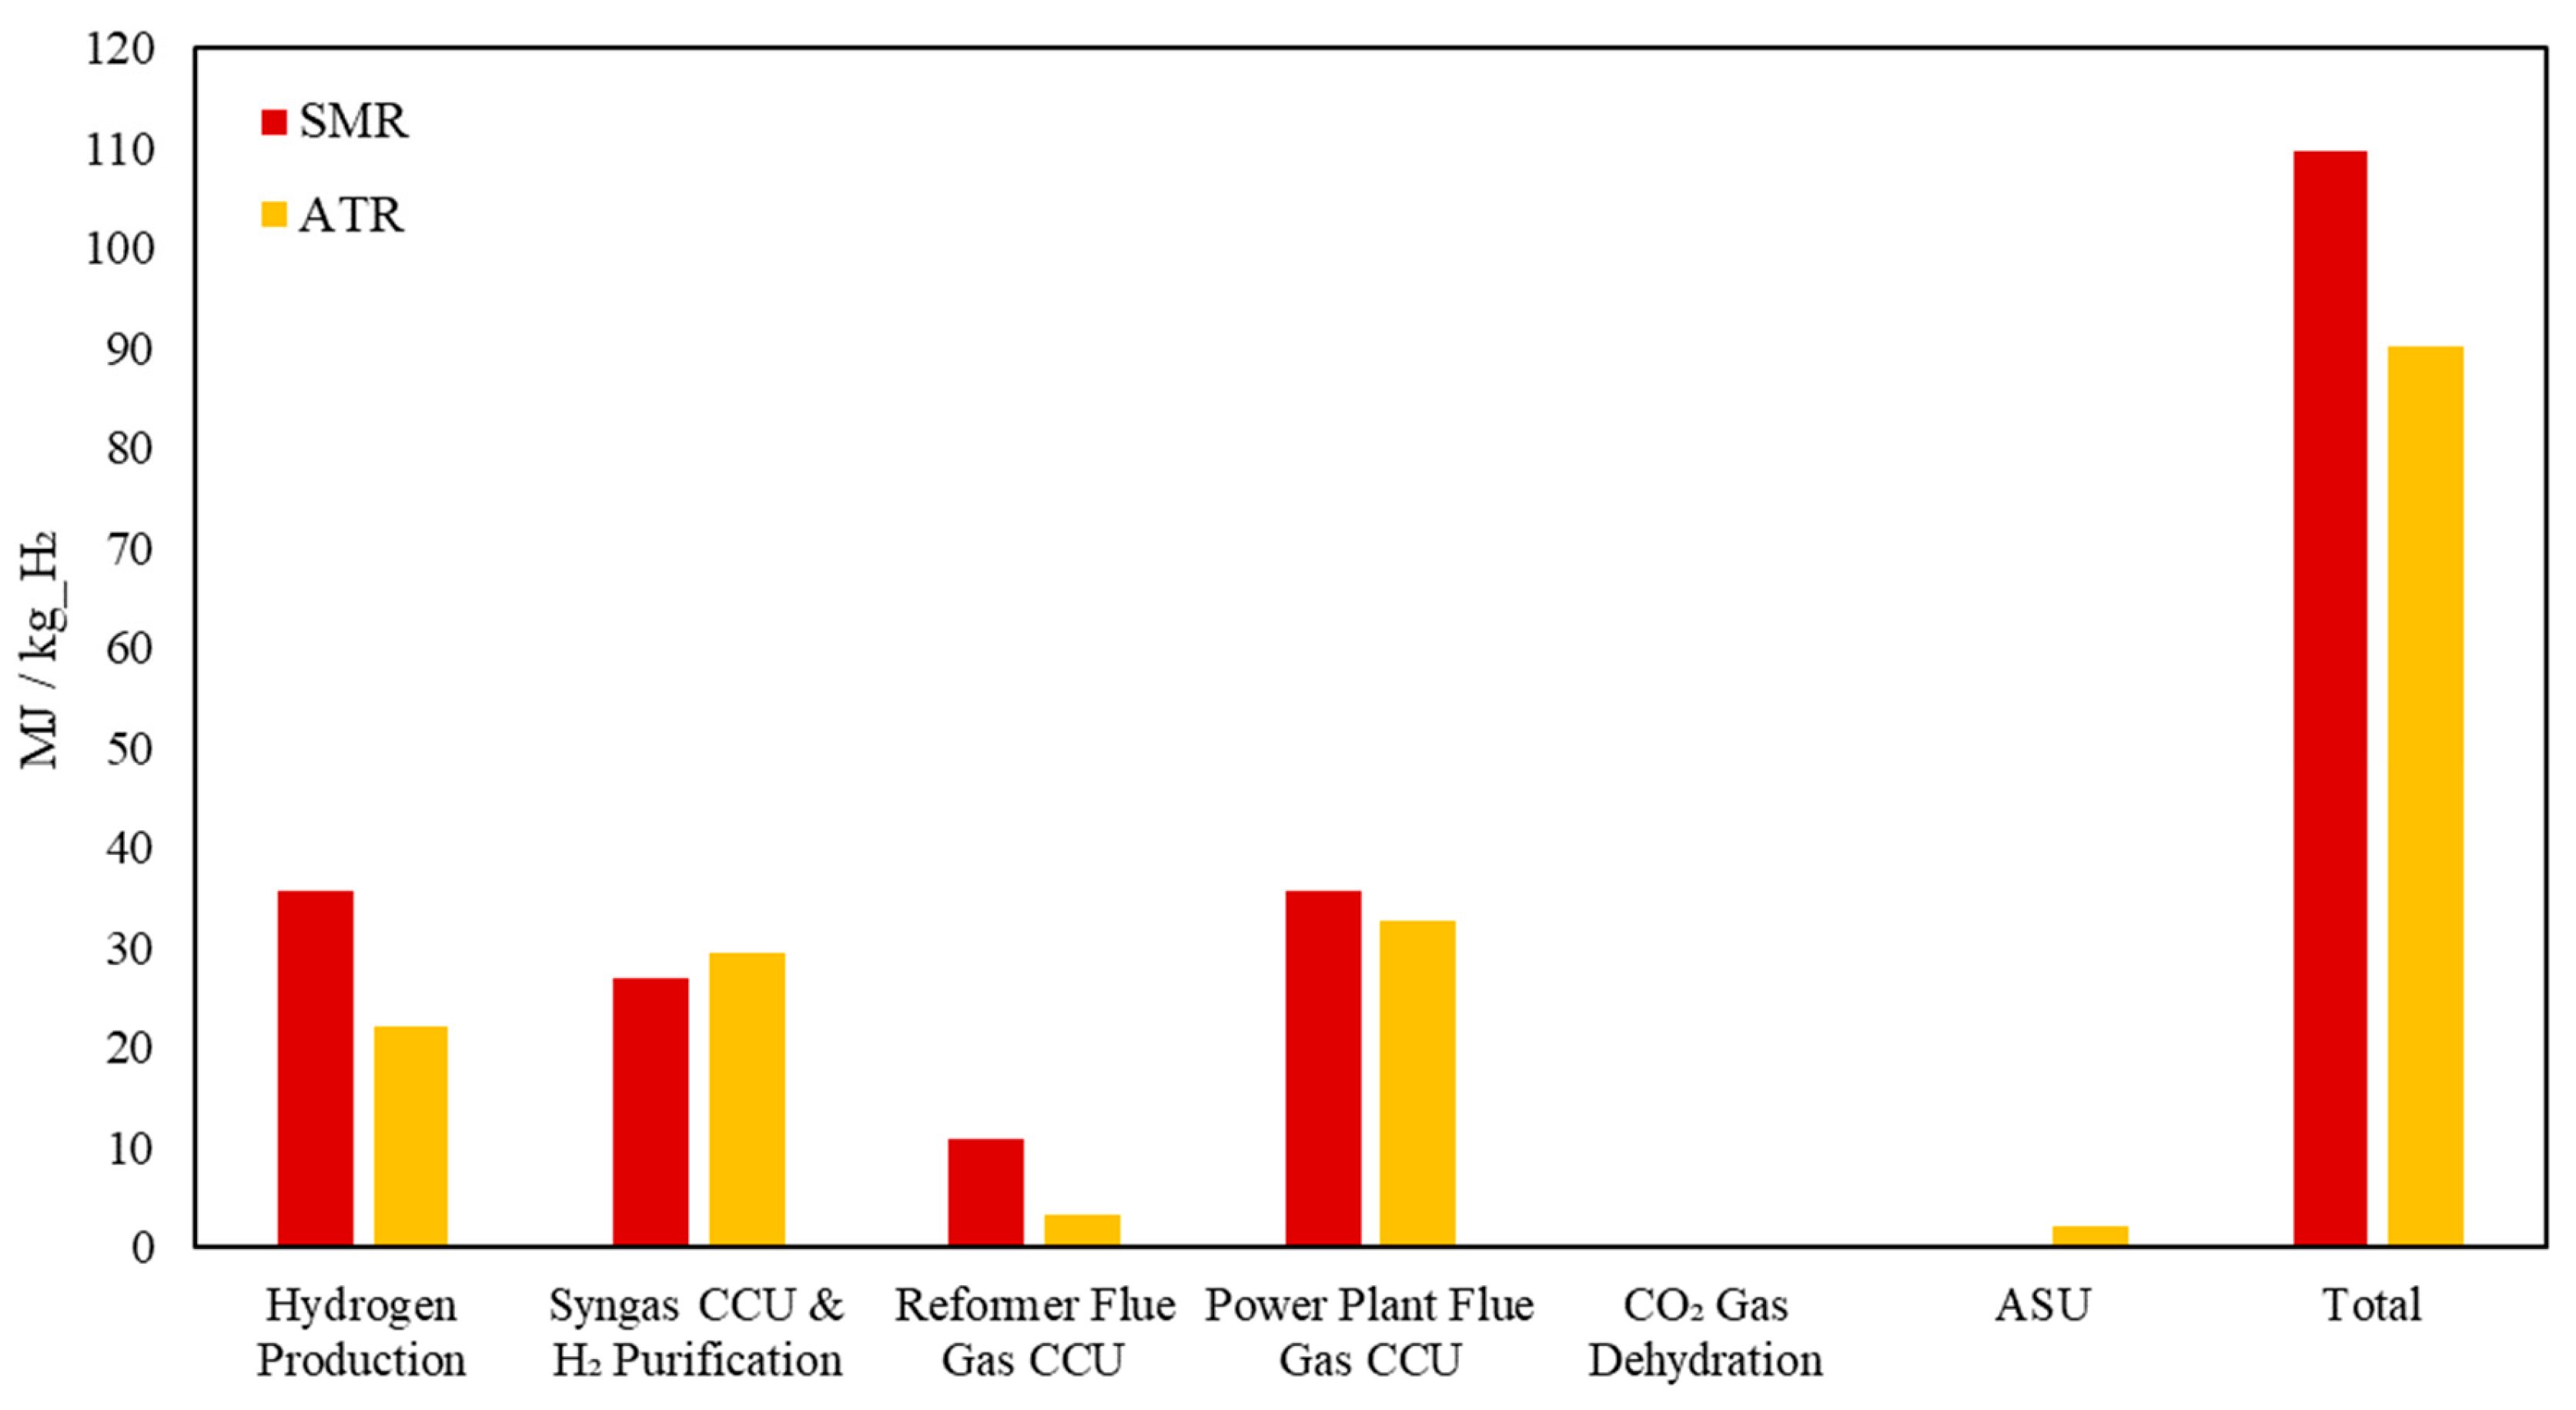
Accordingly,
Figure 10 compares the energy consumption of SMR and ATR technologies across various units of the blue hydrogen plant, including their related downstream process units, such as syngas carbon removal, as well as the associated utility units.
The thermal energy consumption breakdown for SMR and ATR highlights key differences in their process efficiencies and carbon capture requirements. The hydrogen production stage in ATR requires significantly less thermal energy (22 MJ/kg_H2) compared to SMR (36 MJ/kg_H2) due to the partial oxidation step in ATR, which supplies additional heat internally, reducing the external fuel demand. In contrast, syngas carbon capture and hydrogen purification require slightly more energy in ATR than in SMR because ATR produces a syngas with a higher CO2 concentration, necessitating more intensive separation efforts. Meanwhile, for reformer flue gas CCU, ATR consumed 72% less energy, as ATR does not require external combustion in a reformer furnace, leading to significantly lower flue gas emissions. Similarly, power plant flue gas CCU showed a 9% reduction in ATR, reflecting its lower overall combustion-related CO2 emissions. Lastly, the Air Separation Unit (ASU) is an exclusive source of energy demand in ATR (2 MJ/kg) due to its oxygen requirement for auto-thermal reforming, which is absent in SMR. The overall trend suggests that ATR achieves better thermal efficiency with lower flue gas-related emissions but requires additional energy for syngas carbon capture and oxygen supply.
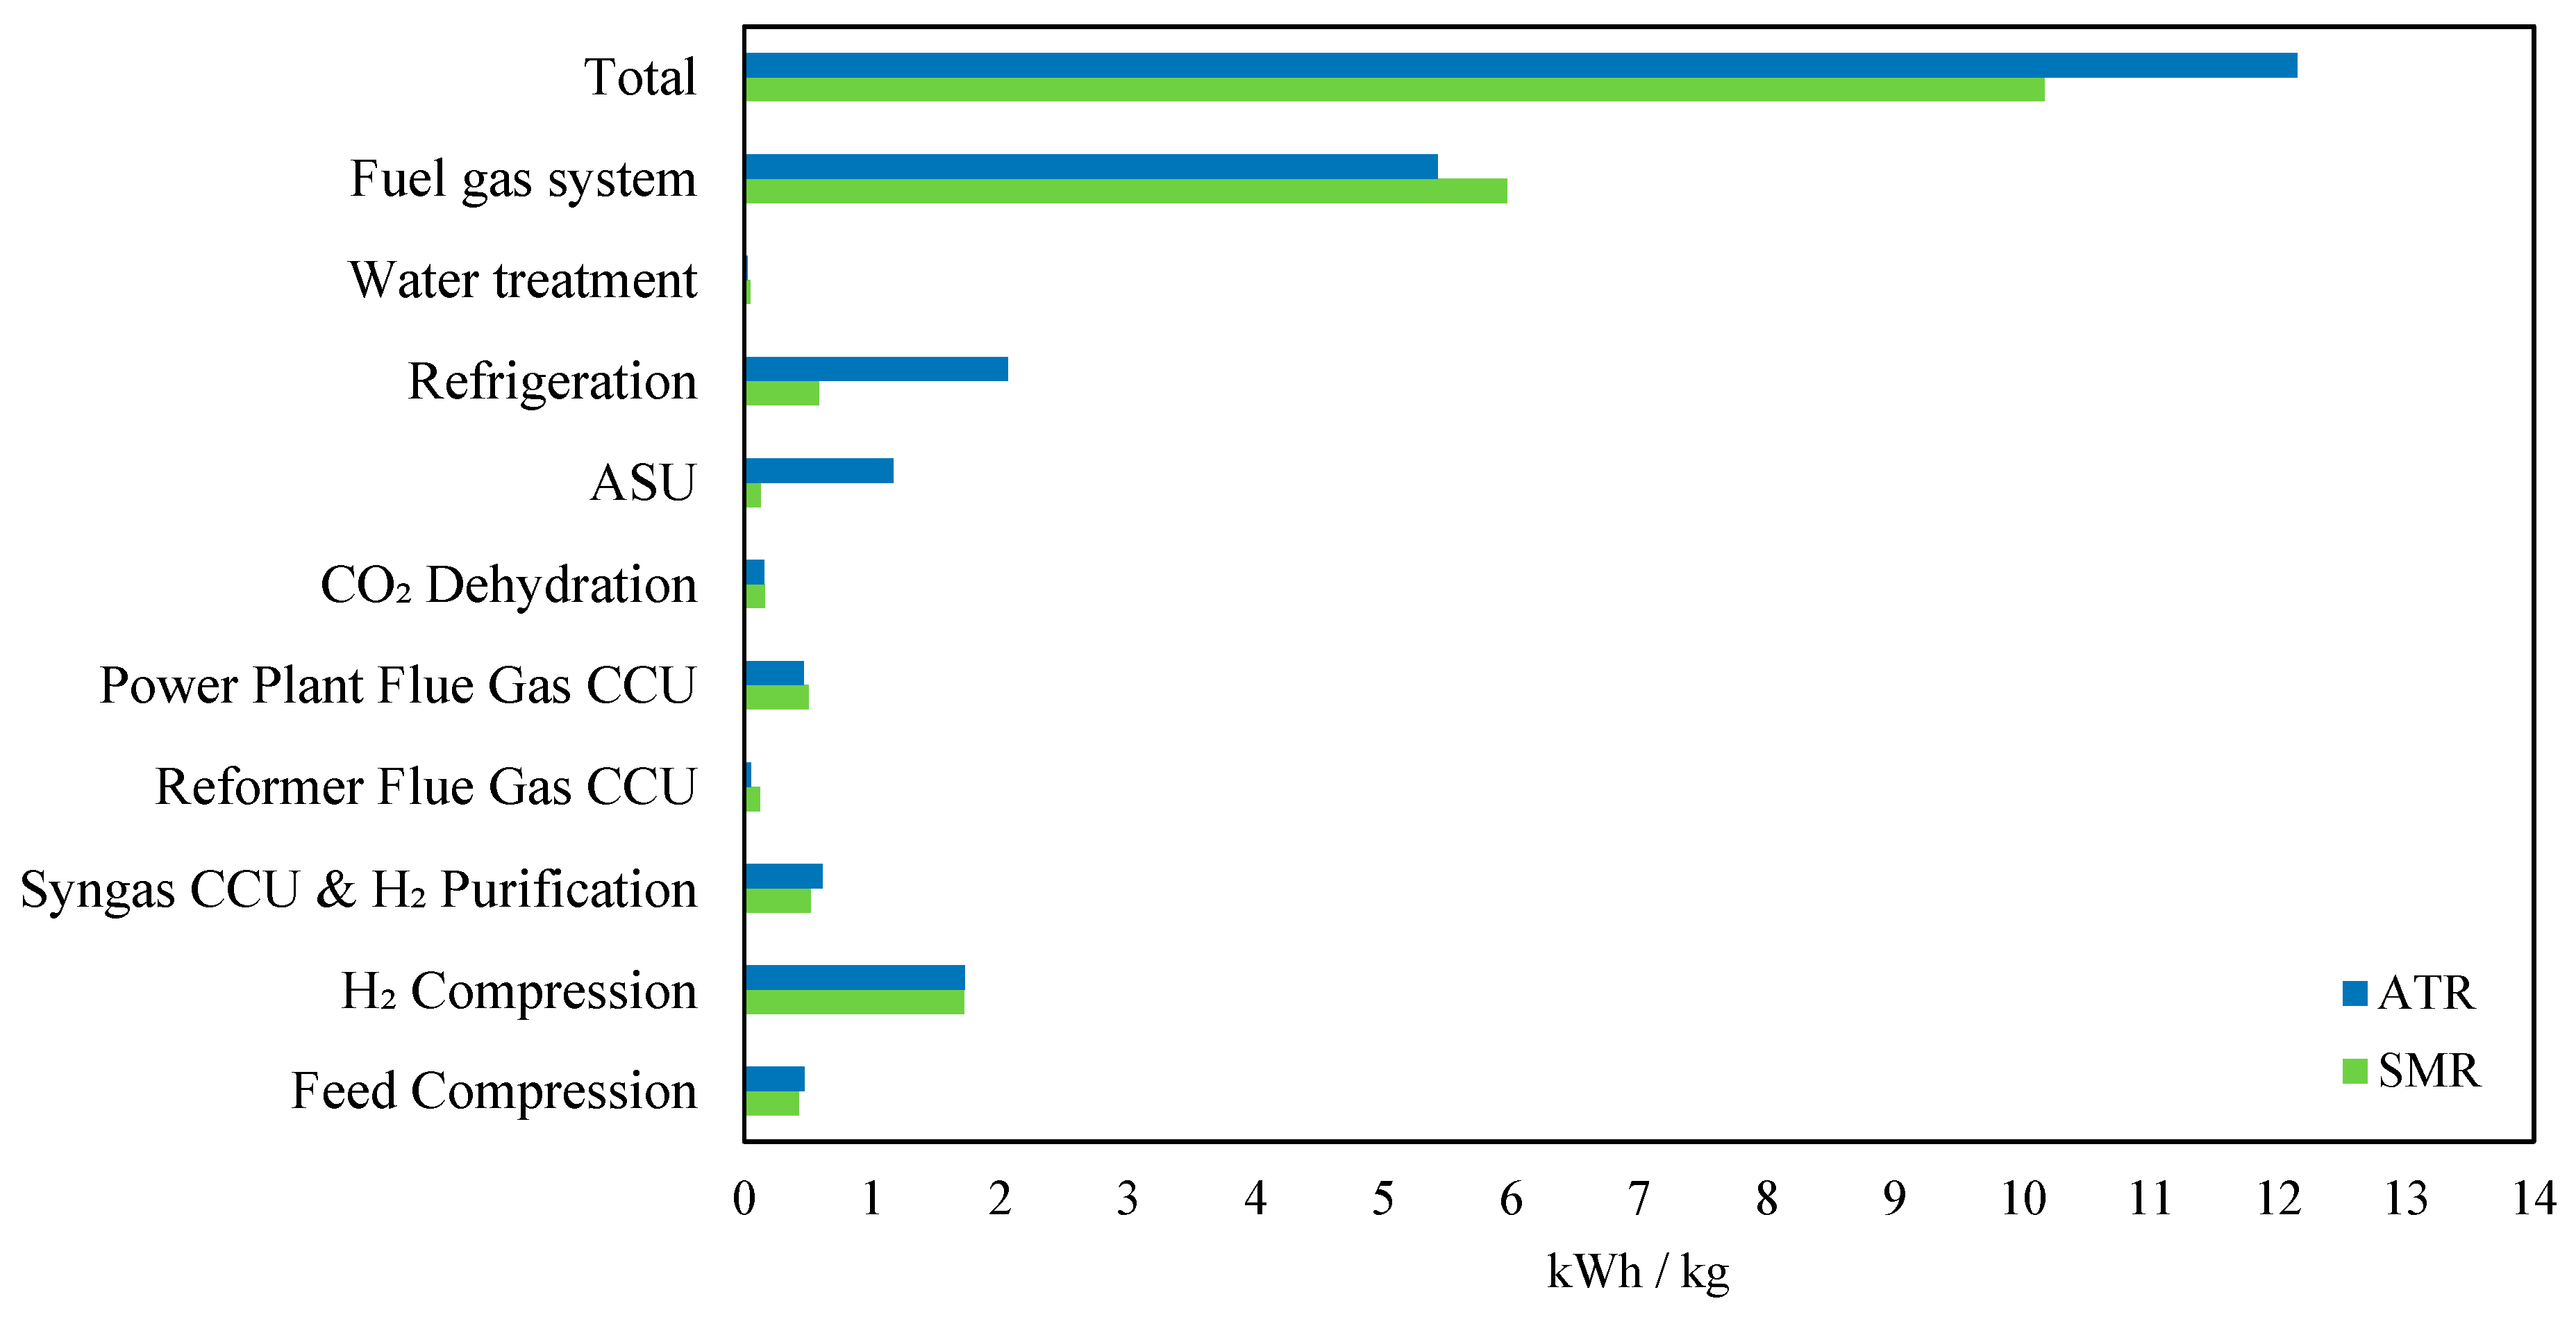
Figure 11 highlights key differences in electricity demand between SMR and ATR. The total electricity consumption in ATR was 19.5% higher than that of SMR (12.15 kWh/kg vs. 10.17 kWh/kg), primarily due to additional units required in ATR. Meanwhile, the fuel gas system, a major contributor to power demand, consumed 9% less electricity in ATR (5.42 kWh/kg vs. 5.97 kWh/kg in SMR), due to differences in fuel usage efficiency. However, ATR requires an air separation unit (ASU), which significantly increased electricity consumption in ATR to 1.17 kWh/kg compared to 0.13 kWh/kg in SMR, marking a ninefold increase. Additionally, refrigeration energy demand in ATR was 3.5 times higher than in SMR (2.06 kWh/kg vs. 0.58 kWh/kg), due to the need for cooling in oxygen liquefaction and cryogenic processes. For carbon capture, ATR showed 58% lower electricity demand for reformer flue gas CCU (0.05 kWh/kg vs. 0.12 kWh/kg in SMR), reflecting its lower flue gas emissions. Power plant flue gas CCU and syngas CCU andH
2 purification had minor variations, with ATR being slightly higher by 18% for syngas CCU and 6% lower for power plant CCU. Hydrogen compression, water treatment, and CO
2 dehydration showed negligible differences. Overall, ATR’s increased power demand is mainly due to ASU and refrigeration, while SMR has a higher reformer-related energy demand.
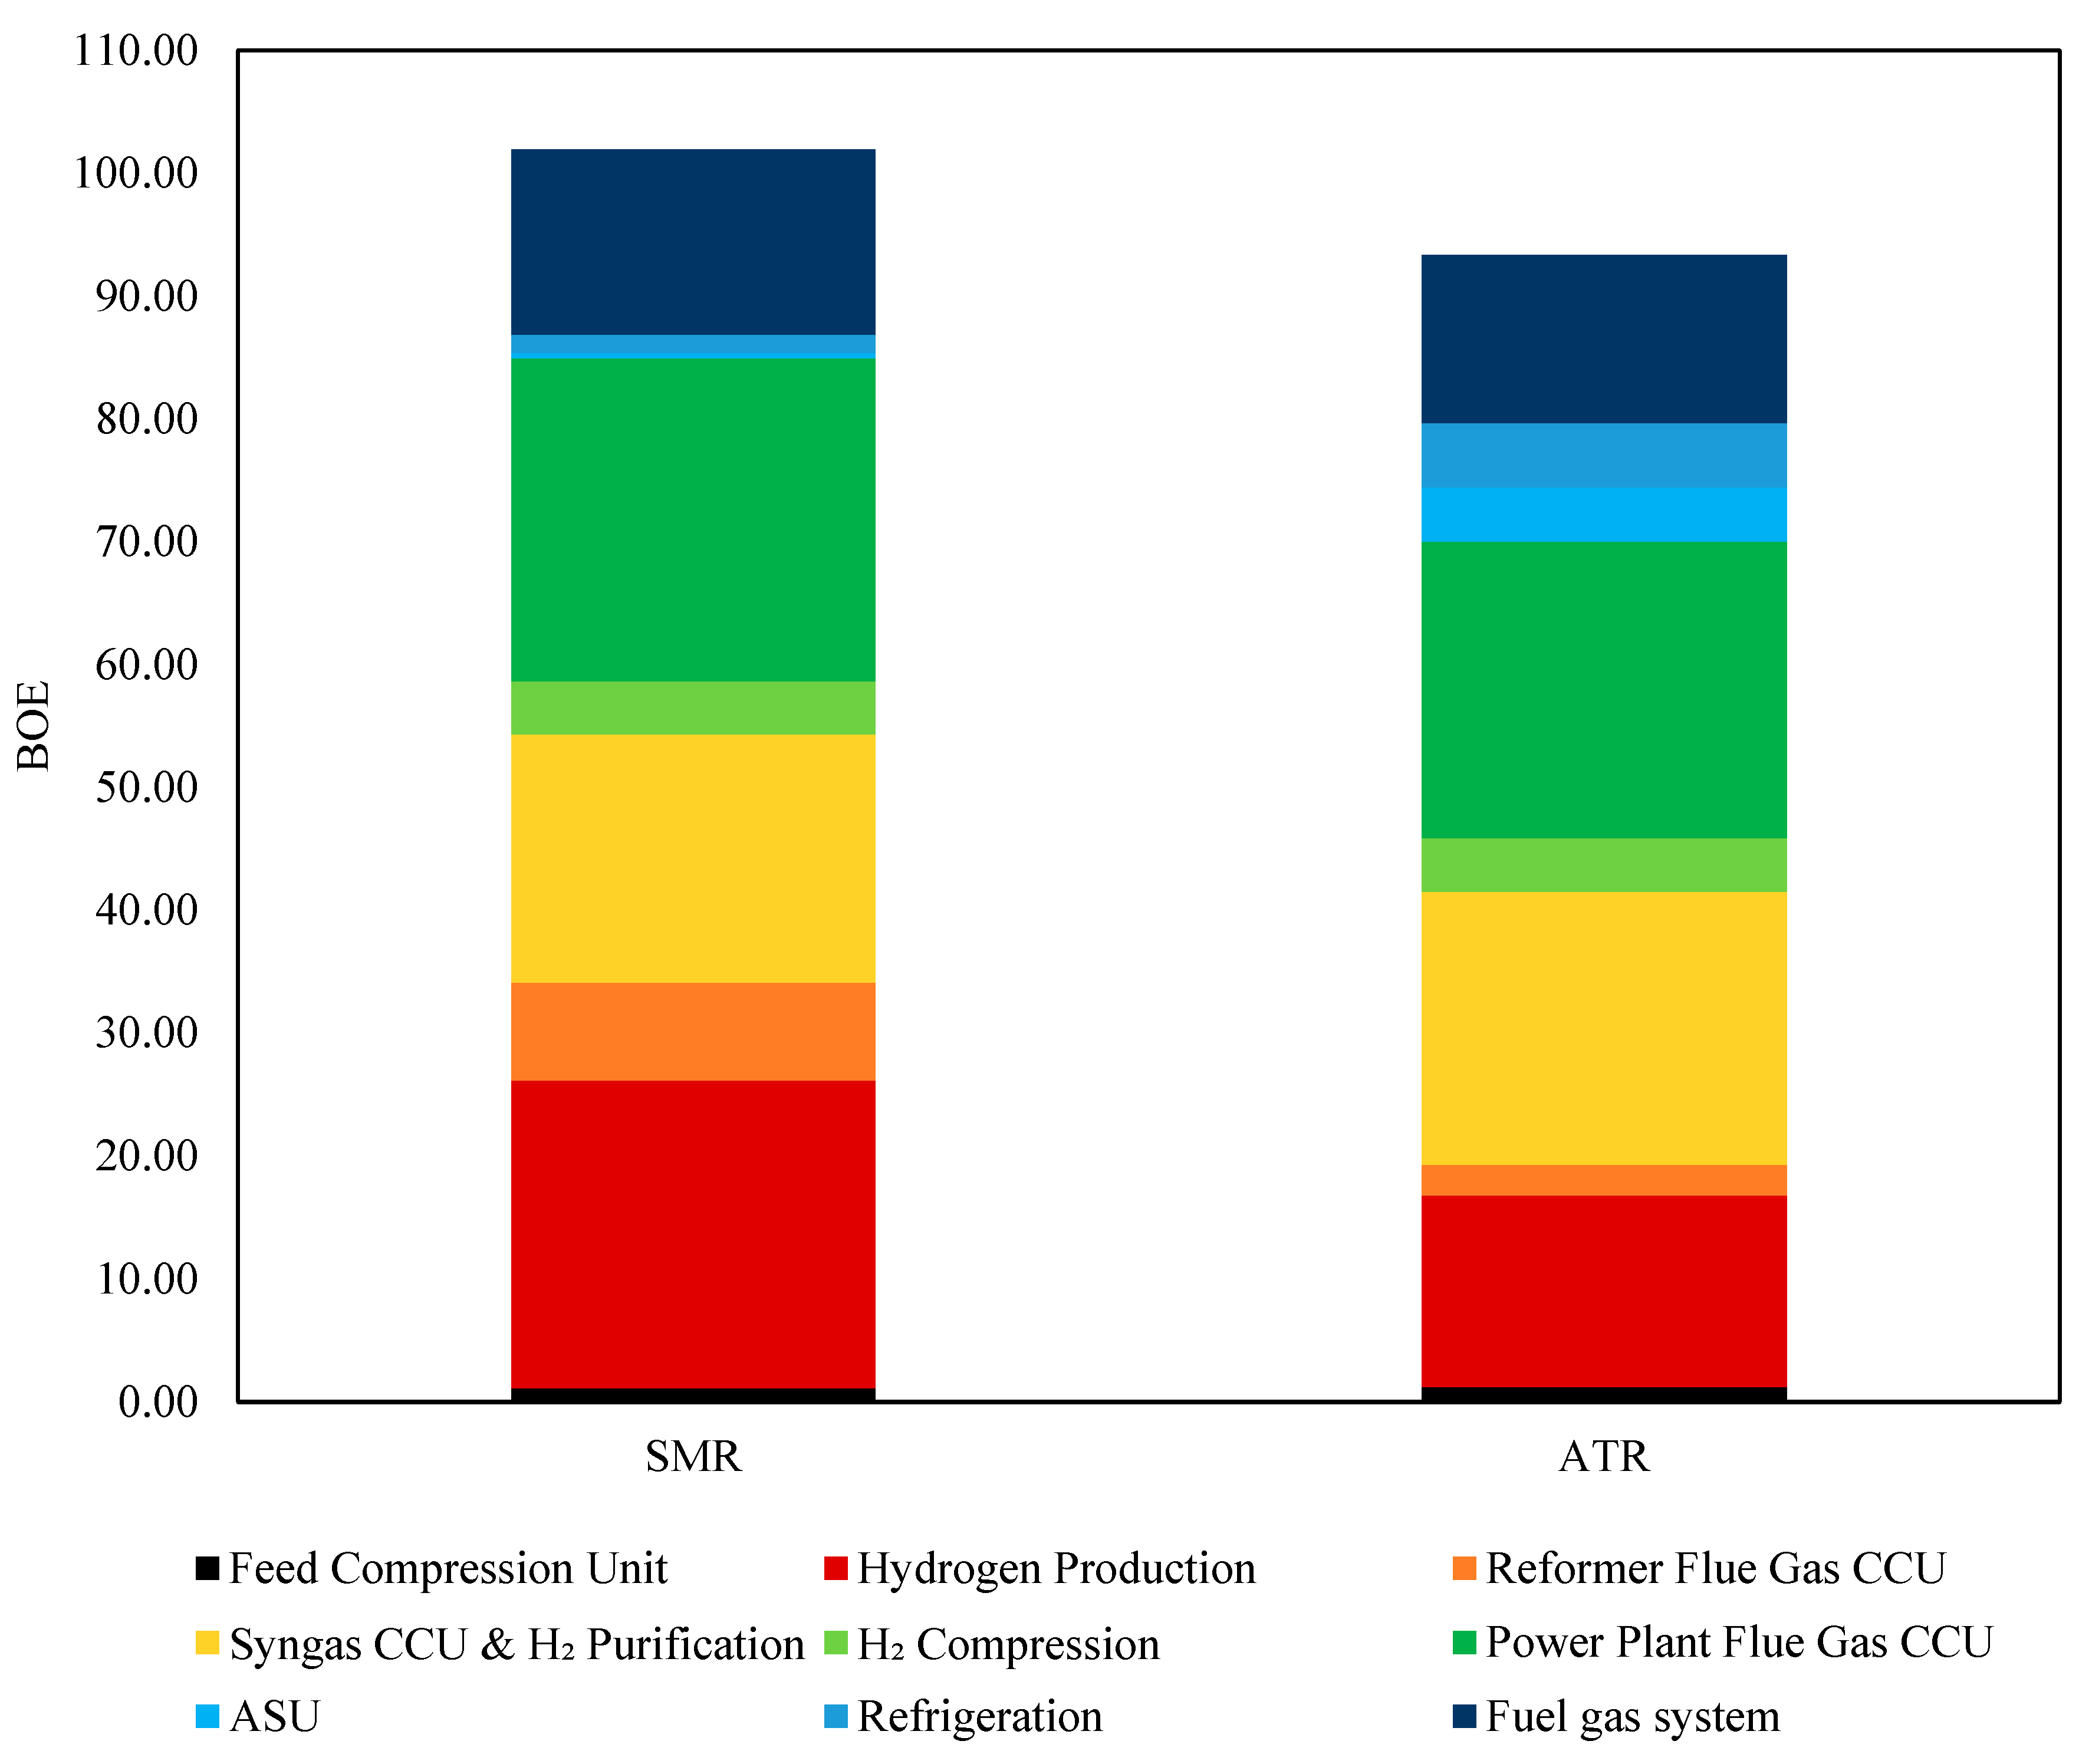
For a greenfield hydrogen plant with a 100 MTD capacity, converting energy demand into barrels of oil equivalent (BOE) provided a standardized comparison of heat and electricity consumption, offering a clearer assessment of overall energy efficiency. As shown in
Figure 12, the total energy demand for ATR was 93.89 BOE, which was 8.4% lower than SMR’s 102.50 BOE. The most significant reduction was observed in hydrogen production, where ATR consumed noticeably less energy due to its exothermic partial oxidation process, reducing the need for external heat. However, ATR required 4.44 BOE for ASU operation. Additionally, ATR consumed 3.5 times more energy for refrigeration, reflecting its reliance on cryogenic air separation for oxygen supply. ATR also exhibited a 68% lower energy demand for reformer flue gas CCU (2.49 BOE vs. 7.98 BOE) and an 8% reduction in the fuel gas system demand, improving fuel efficiency. Meanwhile, syngas CCU and H
2 purification required 10% more energy in ATR. Other sections, including hydrogen compression, power plant flue gas CCU, and CO
2 dehydration, showed only minor variations. Overall, ATR’s lower total energy demand, despite its higher electricity consumption, suggests a more efficient system when integrated with a low-carbon power source.
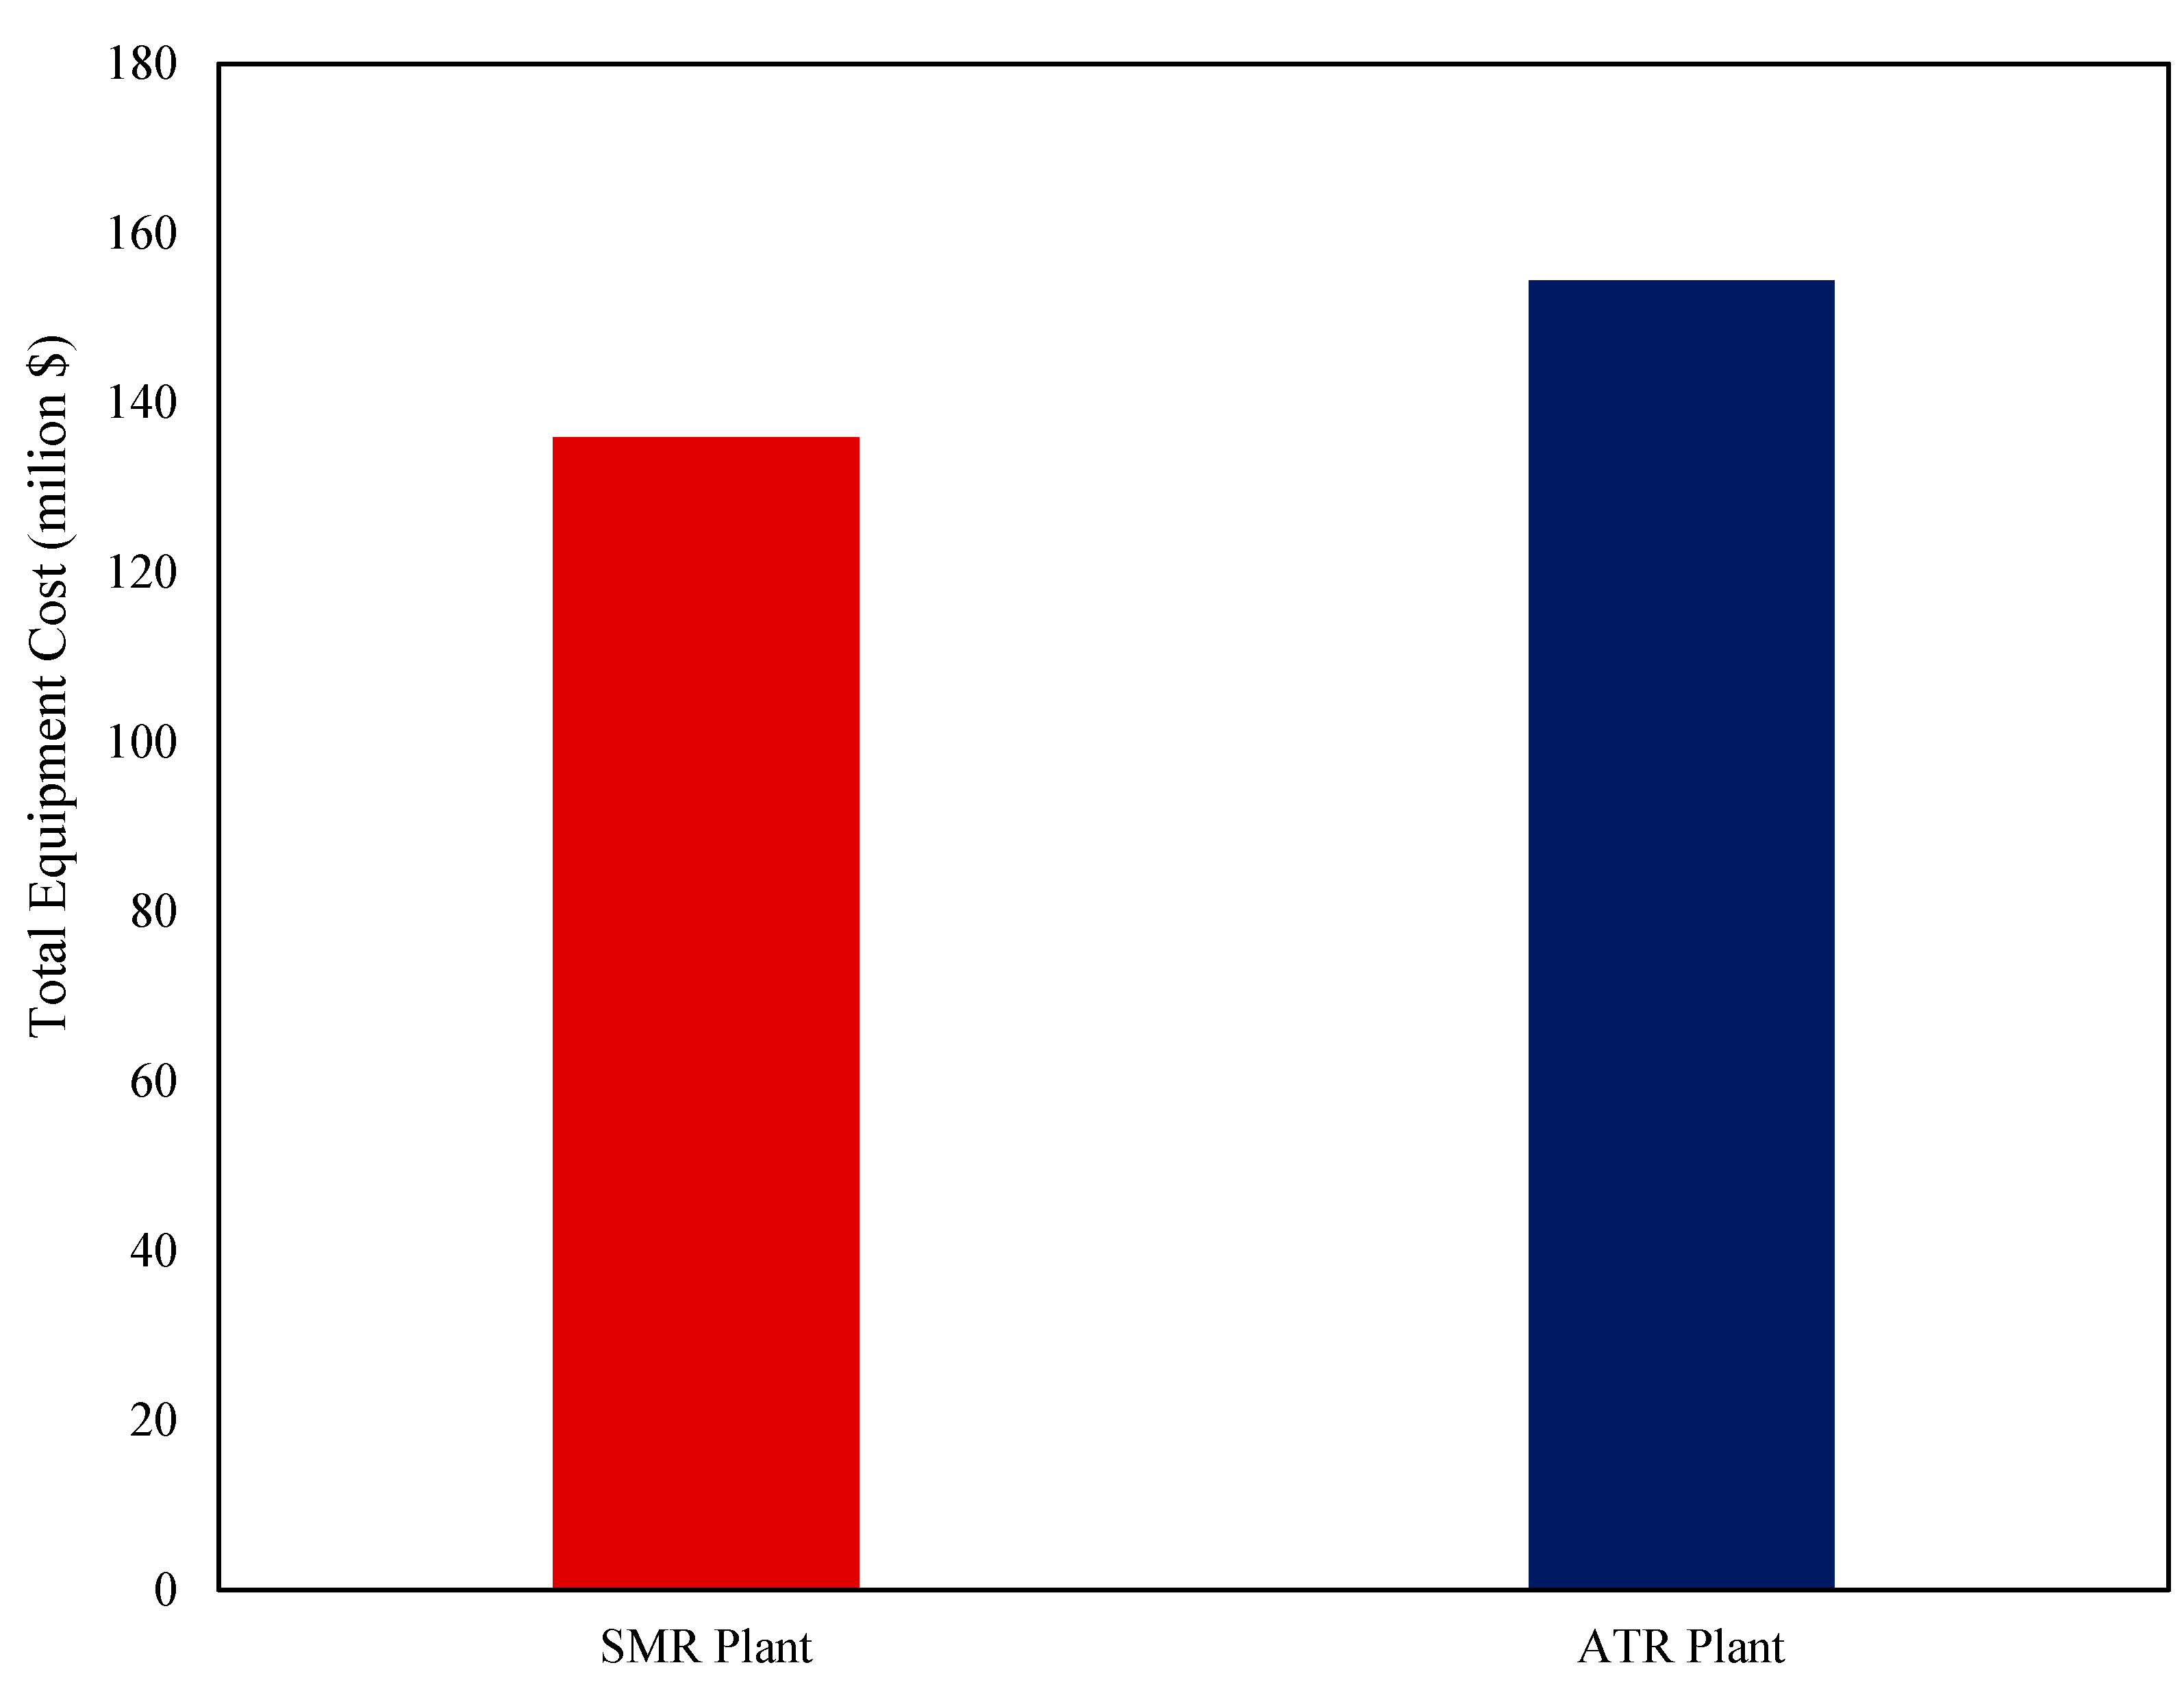
The economic analysis of the SMR and ATR hydrogen production plants revealed key differences in capital and operating costs, profitability, and hydrogen production costs. As shown in
Figure 13, ATR required a higher total equipment cost of USD 154.45 million, which was 13.6% more than the USD 135.94 million for SMR. The total capital investment for ATR reached USD 625.52 million, 13.6% higher than SMR’s USD 550.55 million. Despite the higher upfront costs, ATR benefited from lower annual operating expenses, with a total utility cost of USD 43.79 million, 10.9% lower than SMR’s USD 49.14 million. Feedstock costs remained similar, with ATR requiring only 1.2% more than SMR, while the annualized adsorbent cost remained constant at USD 3.56 million for both. As a result, ATR had a 5.6% lower total operating cost (USD 83.07 million vs. USD 88.01 million). In addition, ATR’s total revenue was USD 136.65 million, slightly lower than SMR’s USD 138.55 million, due to a 5.8% decrease in CO
2 sales (USD 31.05 million vs. USD 32.95 million). The levelized cost of hydrogen (LCOE) was slightly lower for ATR at USD 3.28/kg, compared to USD 3.33/kg for SMR, highlighting its cost efficiency in production. From an investment perspective, the Net Present Value (NPV) of SMR was USD 329.38 million, 7.2% higher than ATR’s USD 307.40 million, suggesting a faster return on investment.
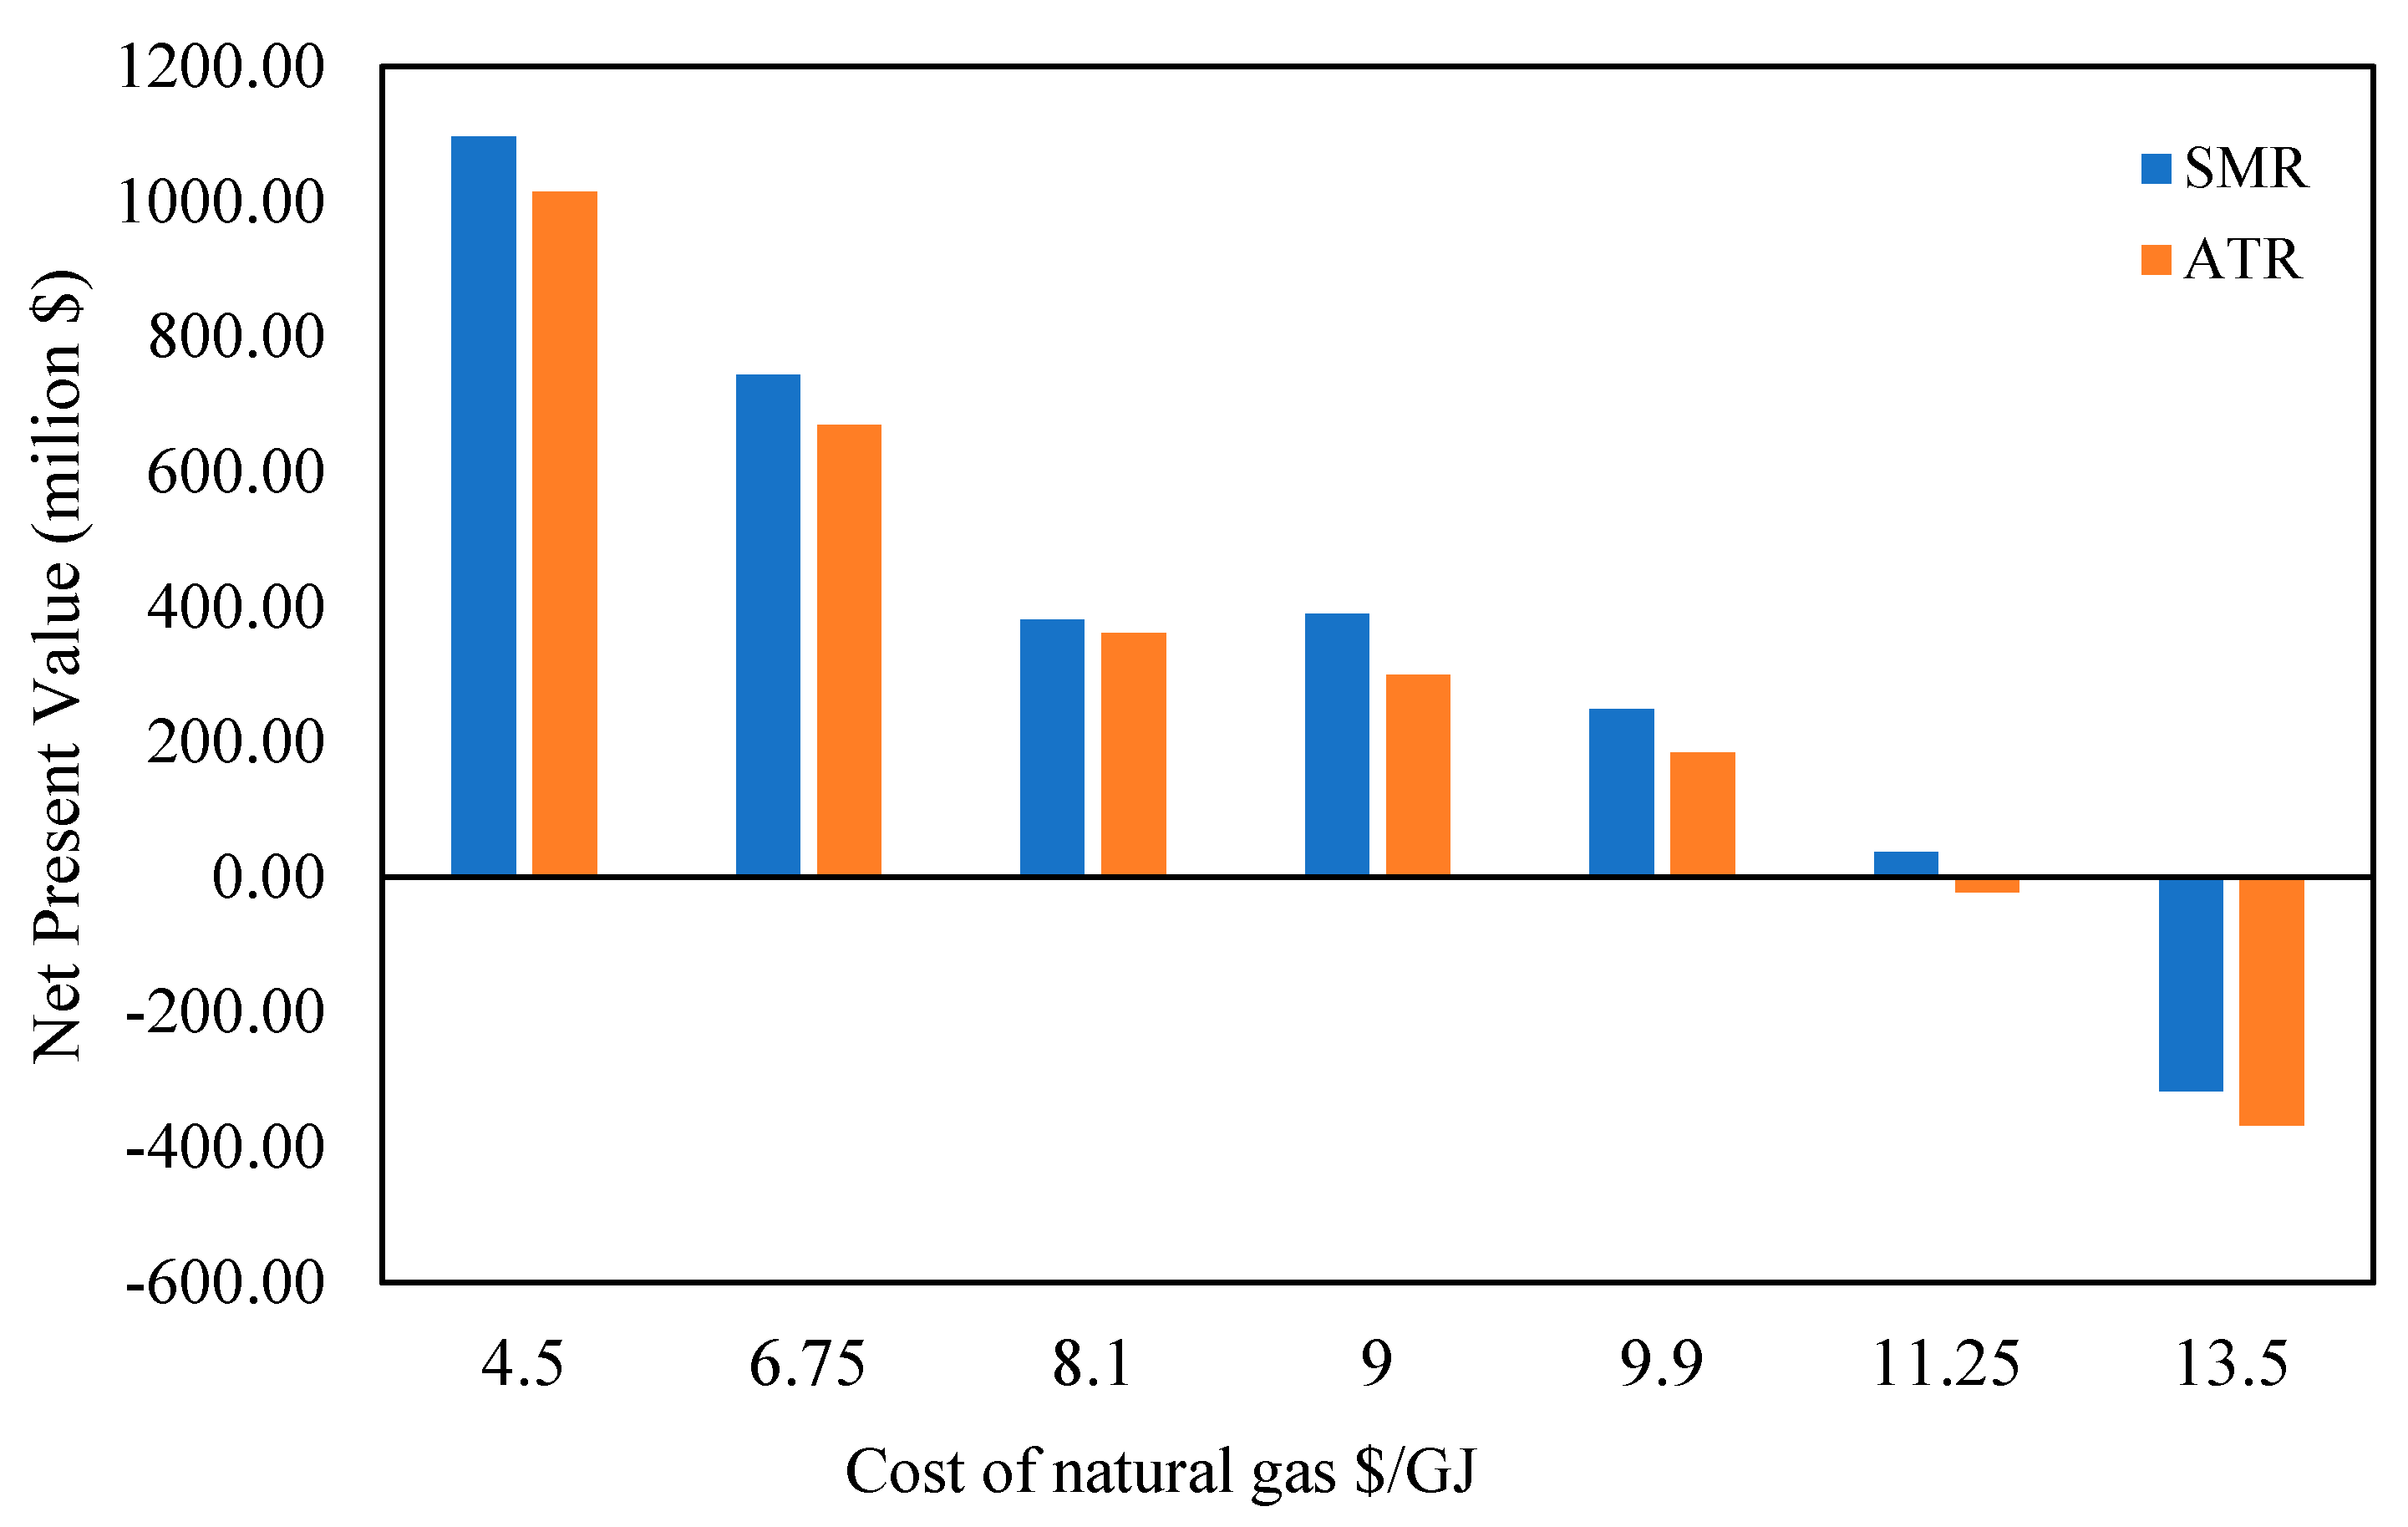
On the other hand, the authors tried to conduct sensitivity analysis for various economic aspects.
Figure 14 illustrates how the price of natural gas feedstock was examined in relation to the net present value (NPV) in SMR and ATR scenarios. Both systems’ NPV dramatically dropped as feed natural gas prices rose from USD 4.5/kg to USD 13.5/kg, demonstrating how sensitive economic performance is to feedstock prices. Furthermore, compared to Case I, Case II is more susceptible to changes in feedstock costs, particularly when it hits negative net present value (NPV) at 13.5/GJ of natural gas.
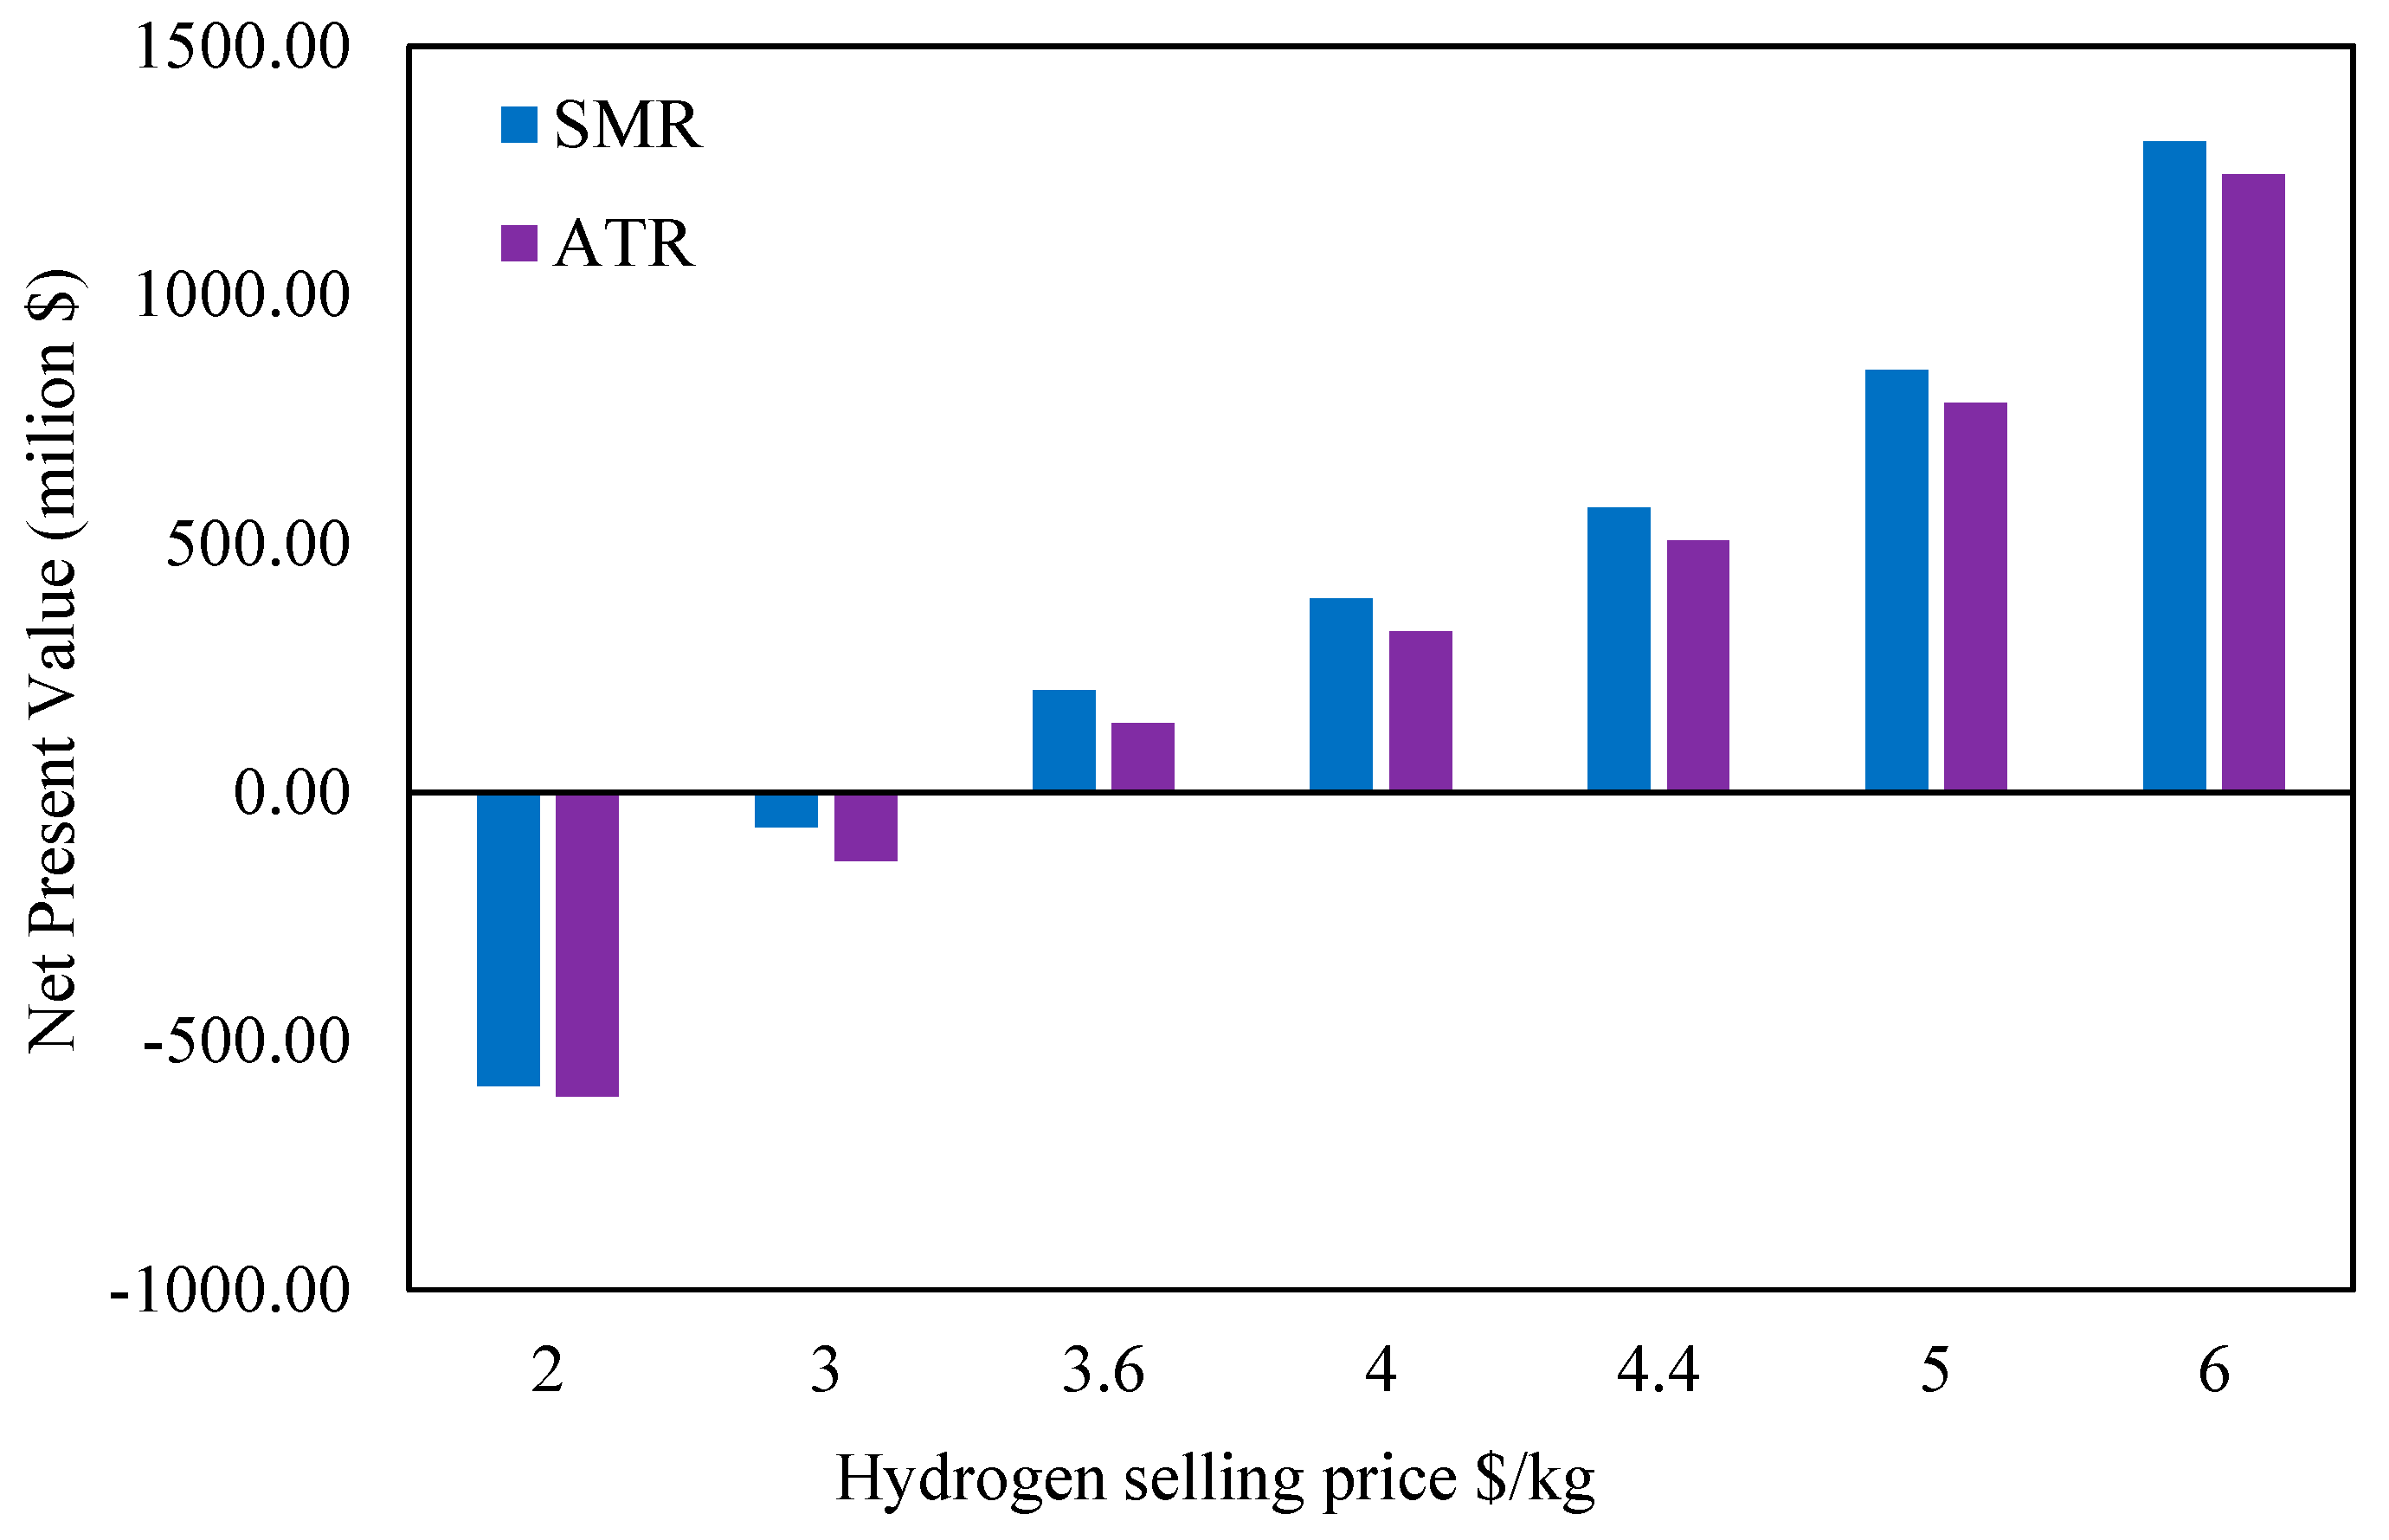
The effect of the hydrogen selling price on the NPV for both scenarios is examined in
Figure 15. The net present value (NPV) for both scenarios changed dramatically, going from negative to extremely positive values, as the selling price of hydrogen rose from USD 2/kg to USD 6/kg. This suggests that raising the selling price of hydrogen is crucial to the two facilities’ economic survival. Also, both scenarios saw a change from negative to positive NPV at roughly USD 3.3/kg. Both scenarios ran at a loss at the lower selling price of USD 2/kg, with SMR displaying a marginally lower negative net present value than ATR. As the price increased beyond the break-even point, SMR consistently outperformed ATR.
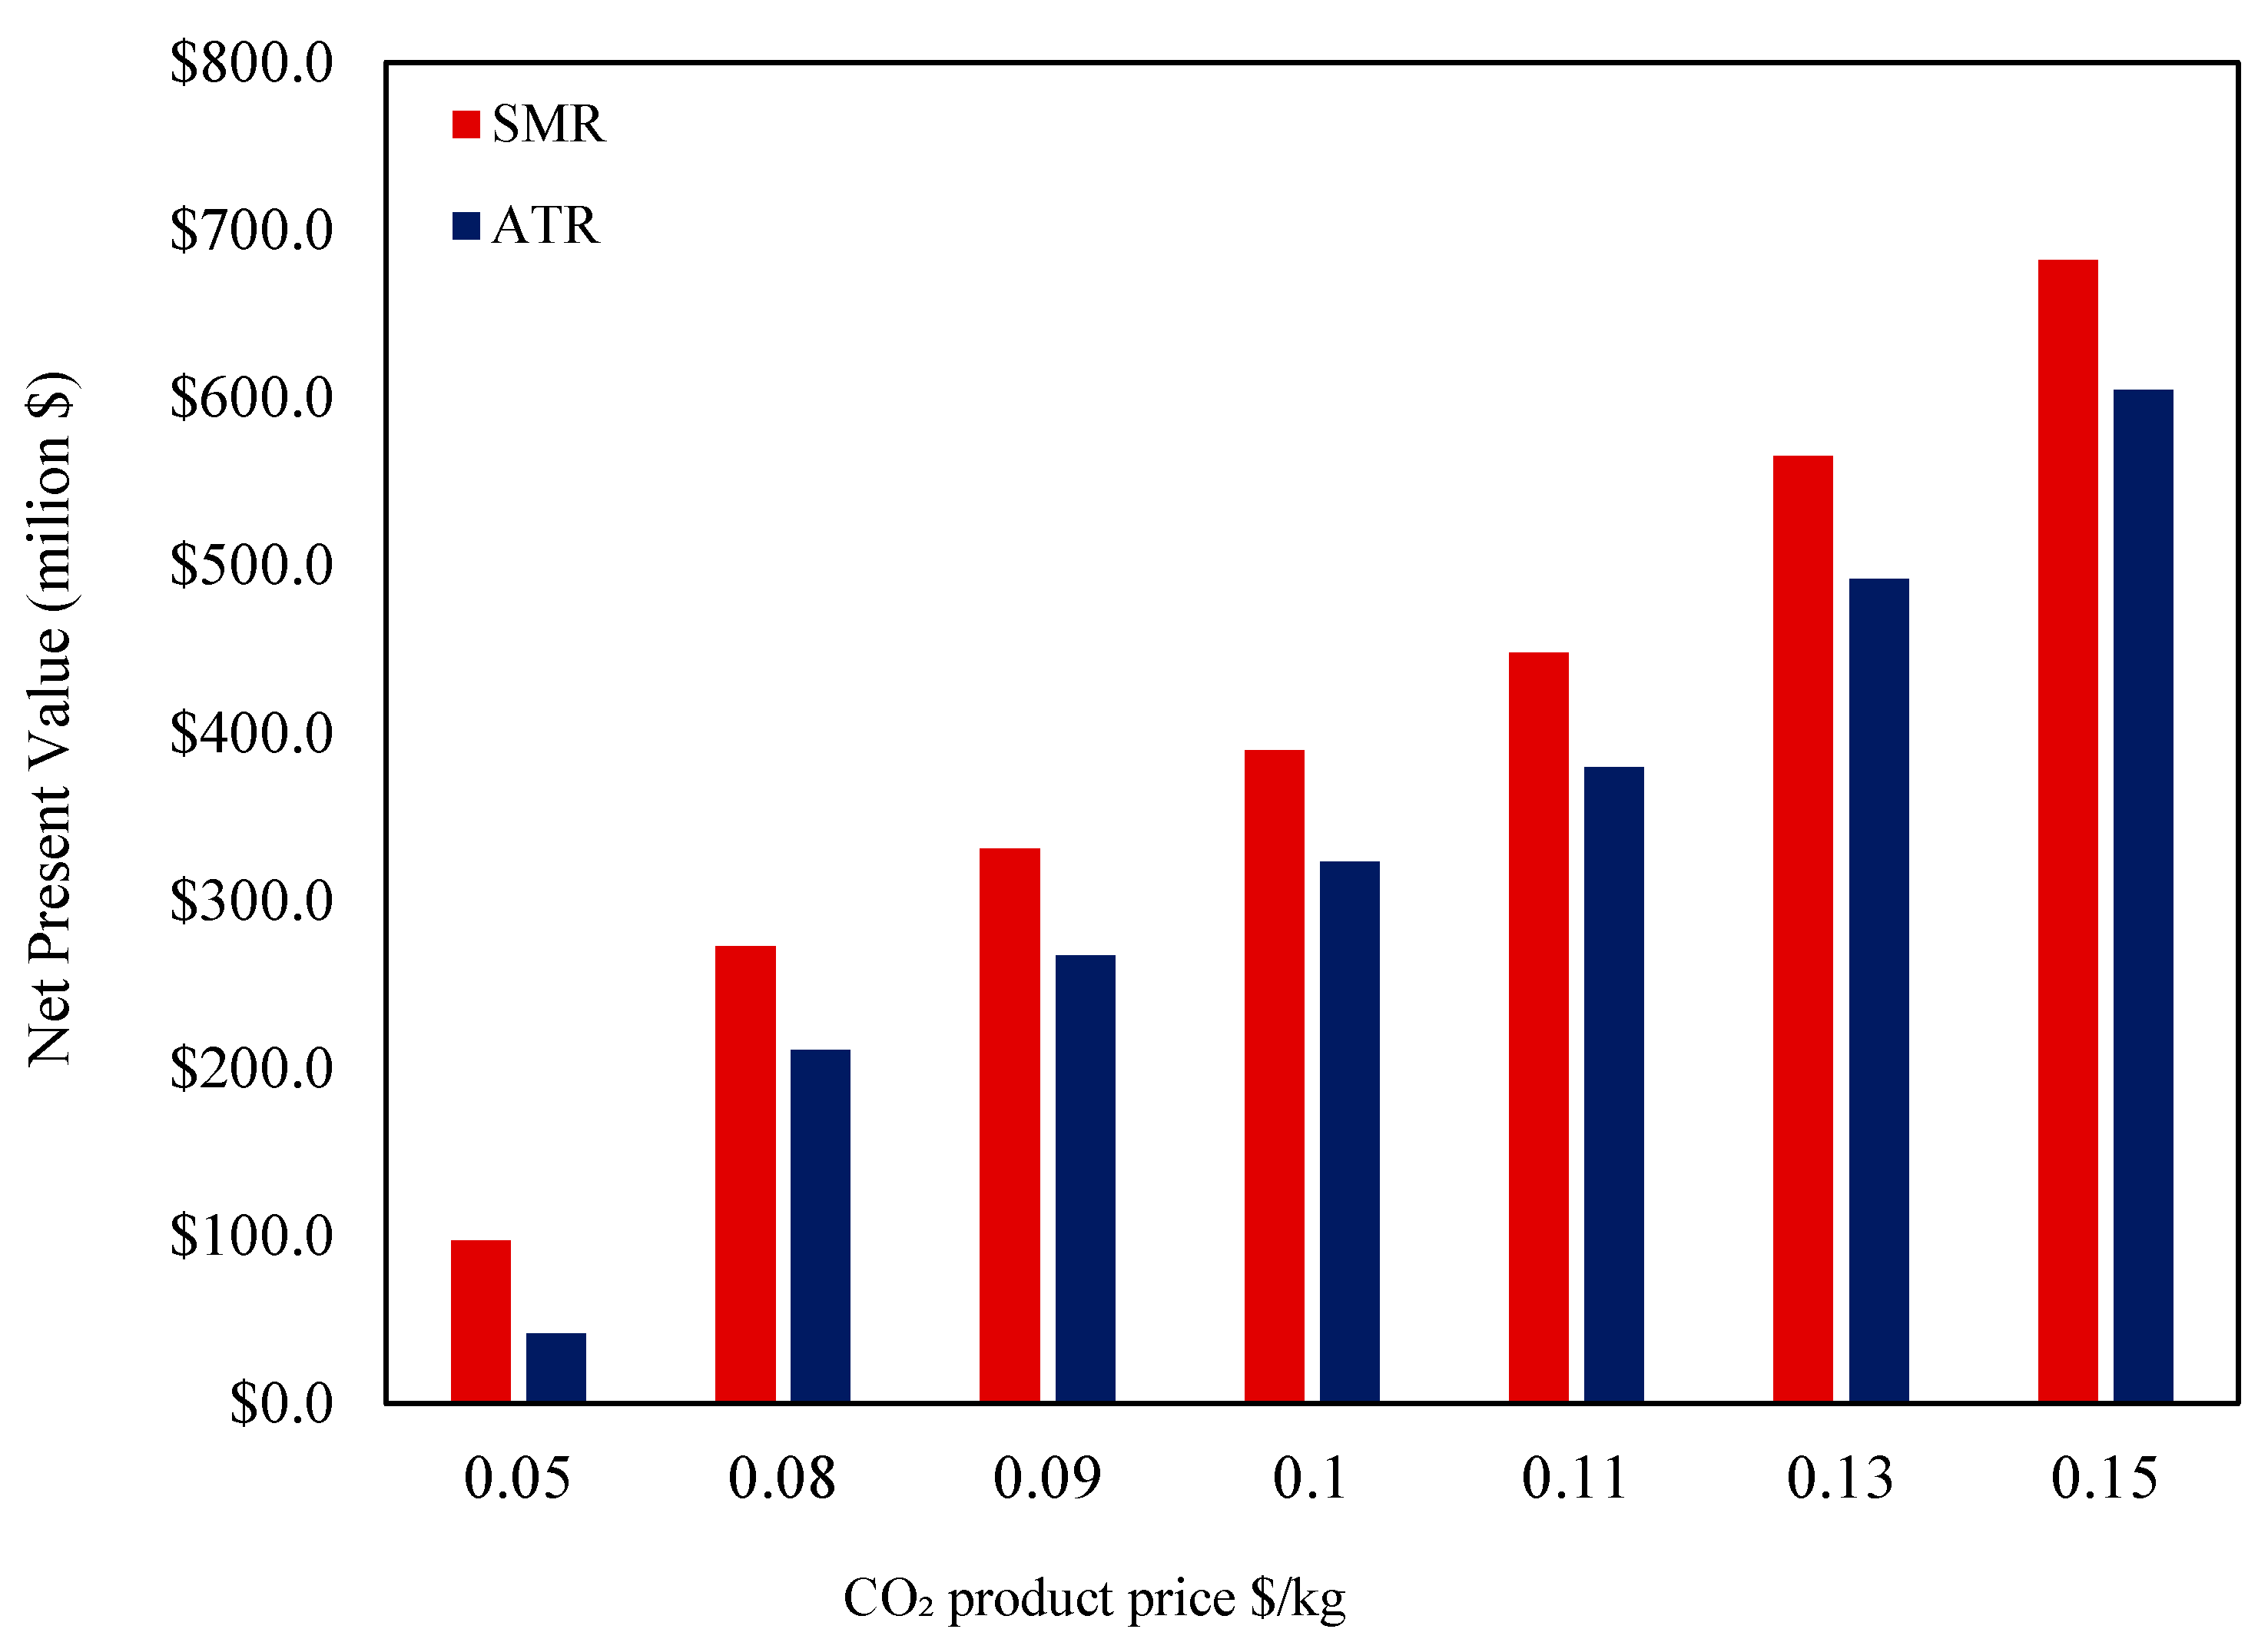
On the other hand, the sensitivity analysis shown in
Figure 16 evaluates the impact of the CO
2 selling price on the net present value (NPV) for both SMR and ATR hydrogen production cases for the CO
2 selling price, ranging from USD 0.05/kg to USD 0.15/kg. As the CO
2 price increases, both SMR and ATR experience a significant rise in NPV. This trend highlights the economic benefit of monetizing captured CO
2, which enhances project profitability.
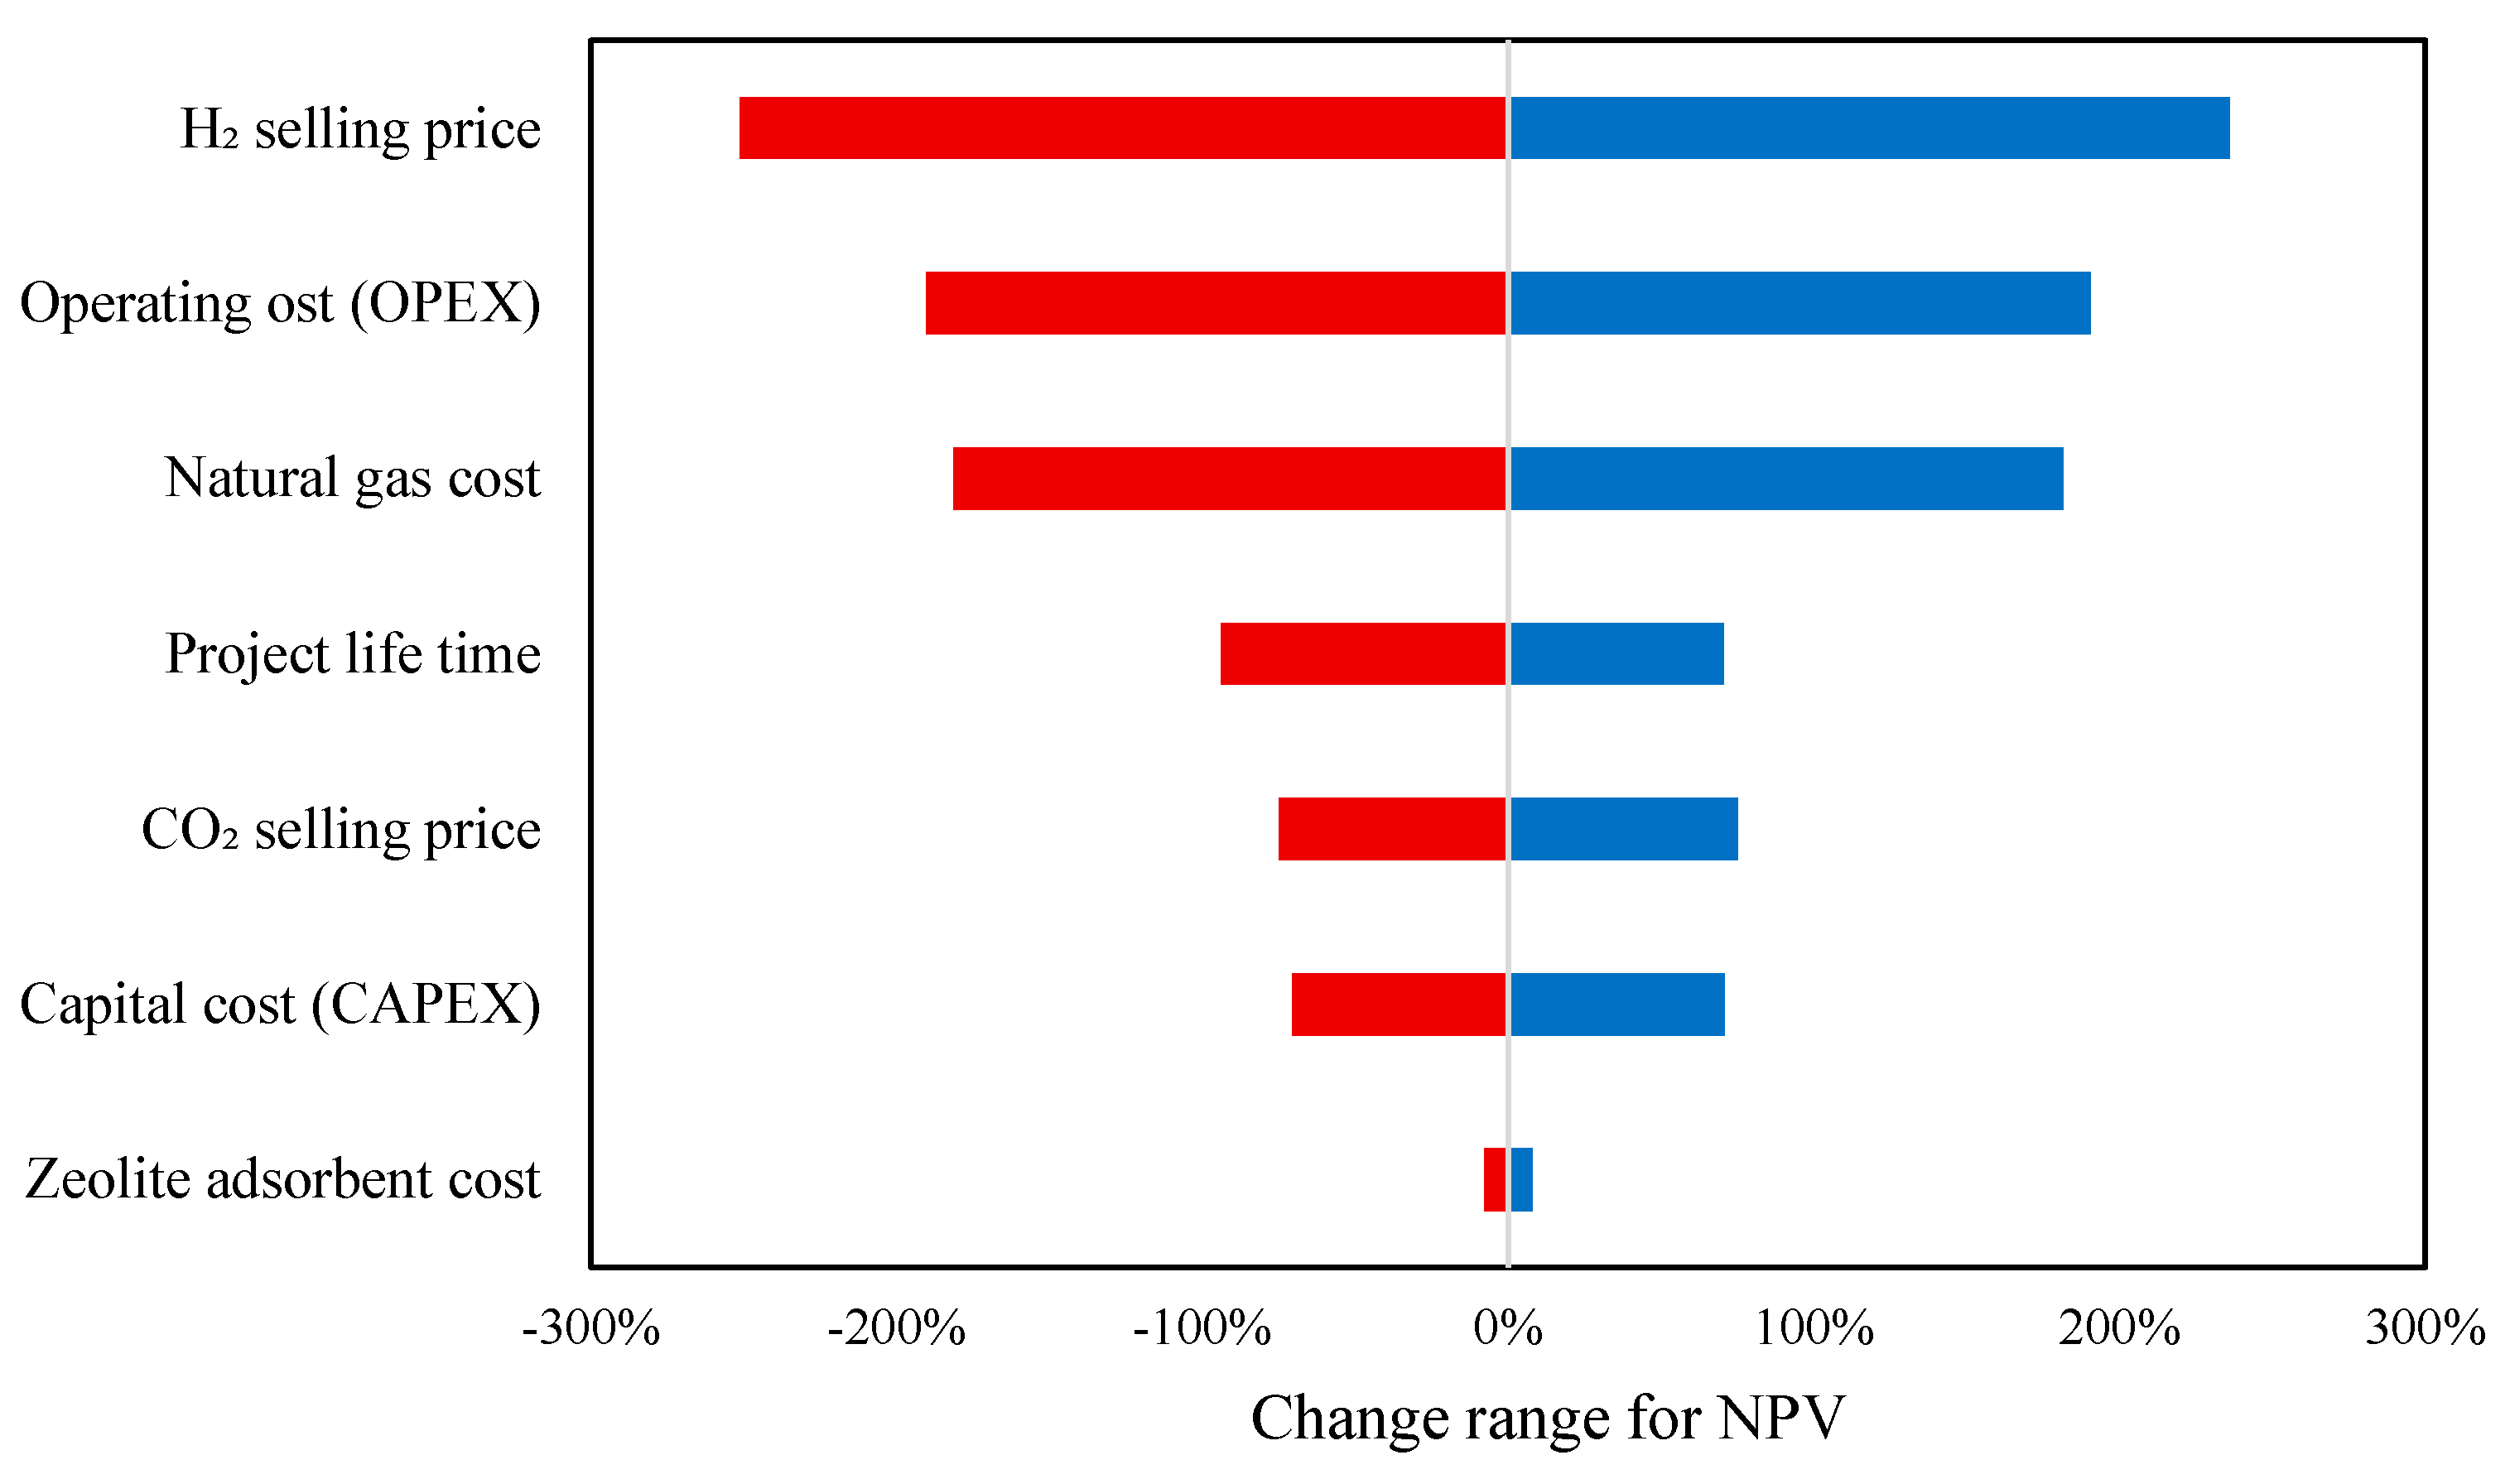
The tornado plot illustrated in
Figure 17 illustrates the sensitivity of net present value (NPV) to variations in different economic parameters for the hydrogen production projects. The horizontal bars represent the range of change in NPV when each parameter varies within its expected limits, with the longest bars indicating the most influential factors. The hydrogen selling price has the most significant impact on NPV, meaning that fluctuations in market prices for hydrogen strongly affect project profitability. A higher hydrogen price leads to substantial increases in NPV, while a lower price drastically reduces it. Plant operating cost (OPEX) and natural gas feedstock cost also have a major influence, as these are key expenses in hydrogen production. A rise in either of these costs lowers NPV, whereas cost reductions improve profitability. Project lifetime and CO
2 selling price have moderate effects, indicating that longer operational periods and higher CO
2 revenues enhance the project’s financial performance, but not as dramatically as hydrogen price or OPEX. Plant capital cost (CAPEX) shows a noticeable but smaller effect, suggesting that while initial investment is important, operational factors dominate long-term profitability. Lastly, zeolite adsorbent cost has a minimal impact on NPV, implying that variations in its cost do not significantly affect overall project economics.
The tornado plot in
Figure 17 illustrated the sensitivity of Net Present Value (NPV) to key economic parameters in the blue hydrogen project. The analysis was conducted by varying each parameter within a defined range: ±10%, ±25%, and ±50%, ensuring a balanced evaluation of potential fluctuations in cost and revenue factors. In the figure, red bars represent the negative deviation (a decrease from the base value), while blue bars indicate the positive deviation (an increase from the base value) for each parameter’s impact on NPV. Among these, hydrogen selling price remains the most influential factor, exhibiting a wide sensitivity range from −251% to +251%. This underscores its critical role in determining project feasibility, as fluctuations in market pricing can substantially impact overall profitability. Plant operating costs (OPEX) emerge as another significant driver, with NPV variations up to −190% and +190%. Similarly, natural gas feedstock cost plays a crucial role, demonstrating a notable impact ranging from −181% to +181%, reinforcing its position as a major cost driver in hydrogen production. In addition, changes in parameters like project lifetime, CO
2 selling price, and capital cost showed almost similar effects on project cost. Meanwhile, zeolite adsorbent cost remained the least sensitive parameter, influencing NPV only within a narrow range of −10% to +10%. This suggests that variations in this material’s cost have a minimal impact on overall project economics. In summary, the study shows that major cost contributors (OPEX and natural gas feedstock) and revenue-related factors (the selling prices of hydrogen and CO
2) have the biggest effects on NPV.
On the other hand, incorporating national policy incentives is essential for a comprehensive evaluation of hydrogen production economics, particularly in the context of emerging low-carbon technologies. Governmental support mechanisms can substantially influence the financial viability and market competitiveness of blue hydrogen projects [
44]. In this regard, to enhance the techno-economic evaluation of blue hydrogen production, national incentive structures were incorporated into the analysis. In Canada, the Clean Hydrogen Investment Tax Credit (ITC) provides up to a 40% credit on eligible capital expenditures for hydrogen production processes with a carbon intensity (CI) below 0.45 kg CO
2 e/kg H
2. Assuming the modeled process achieves this threshold, the levelized cost of hydrogen (LCOH) could be reduced from approximately USD 3.30/kg to an estimated USD 2.64/kg, based on the relative contribution of capital cost to the overall hydrogen production cost. These incentives significantly improve project economics and demonstrate the critical role of policy frameworks in enhancing the competitiveness of low-carbon hydrogen technologies.
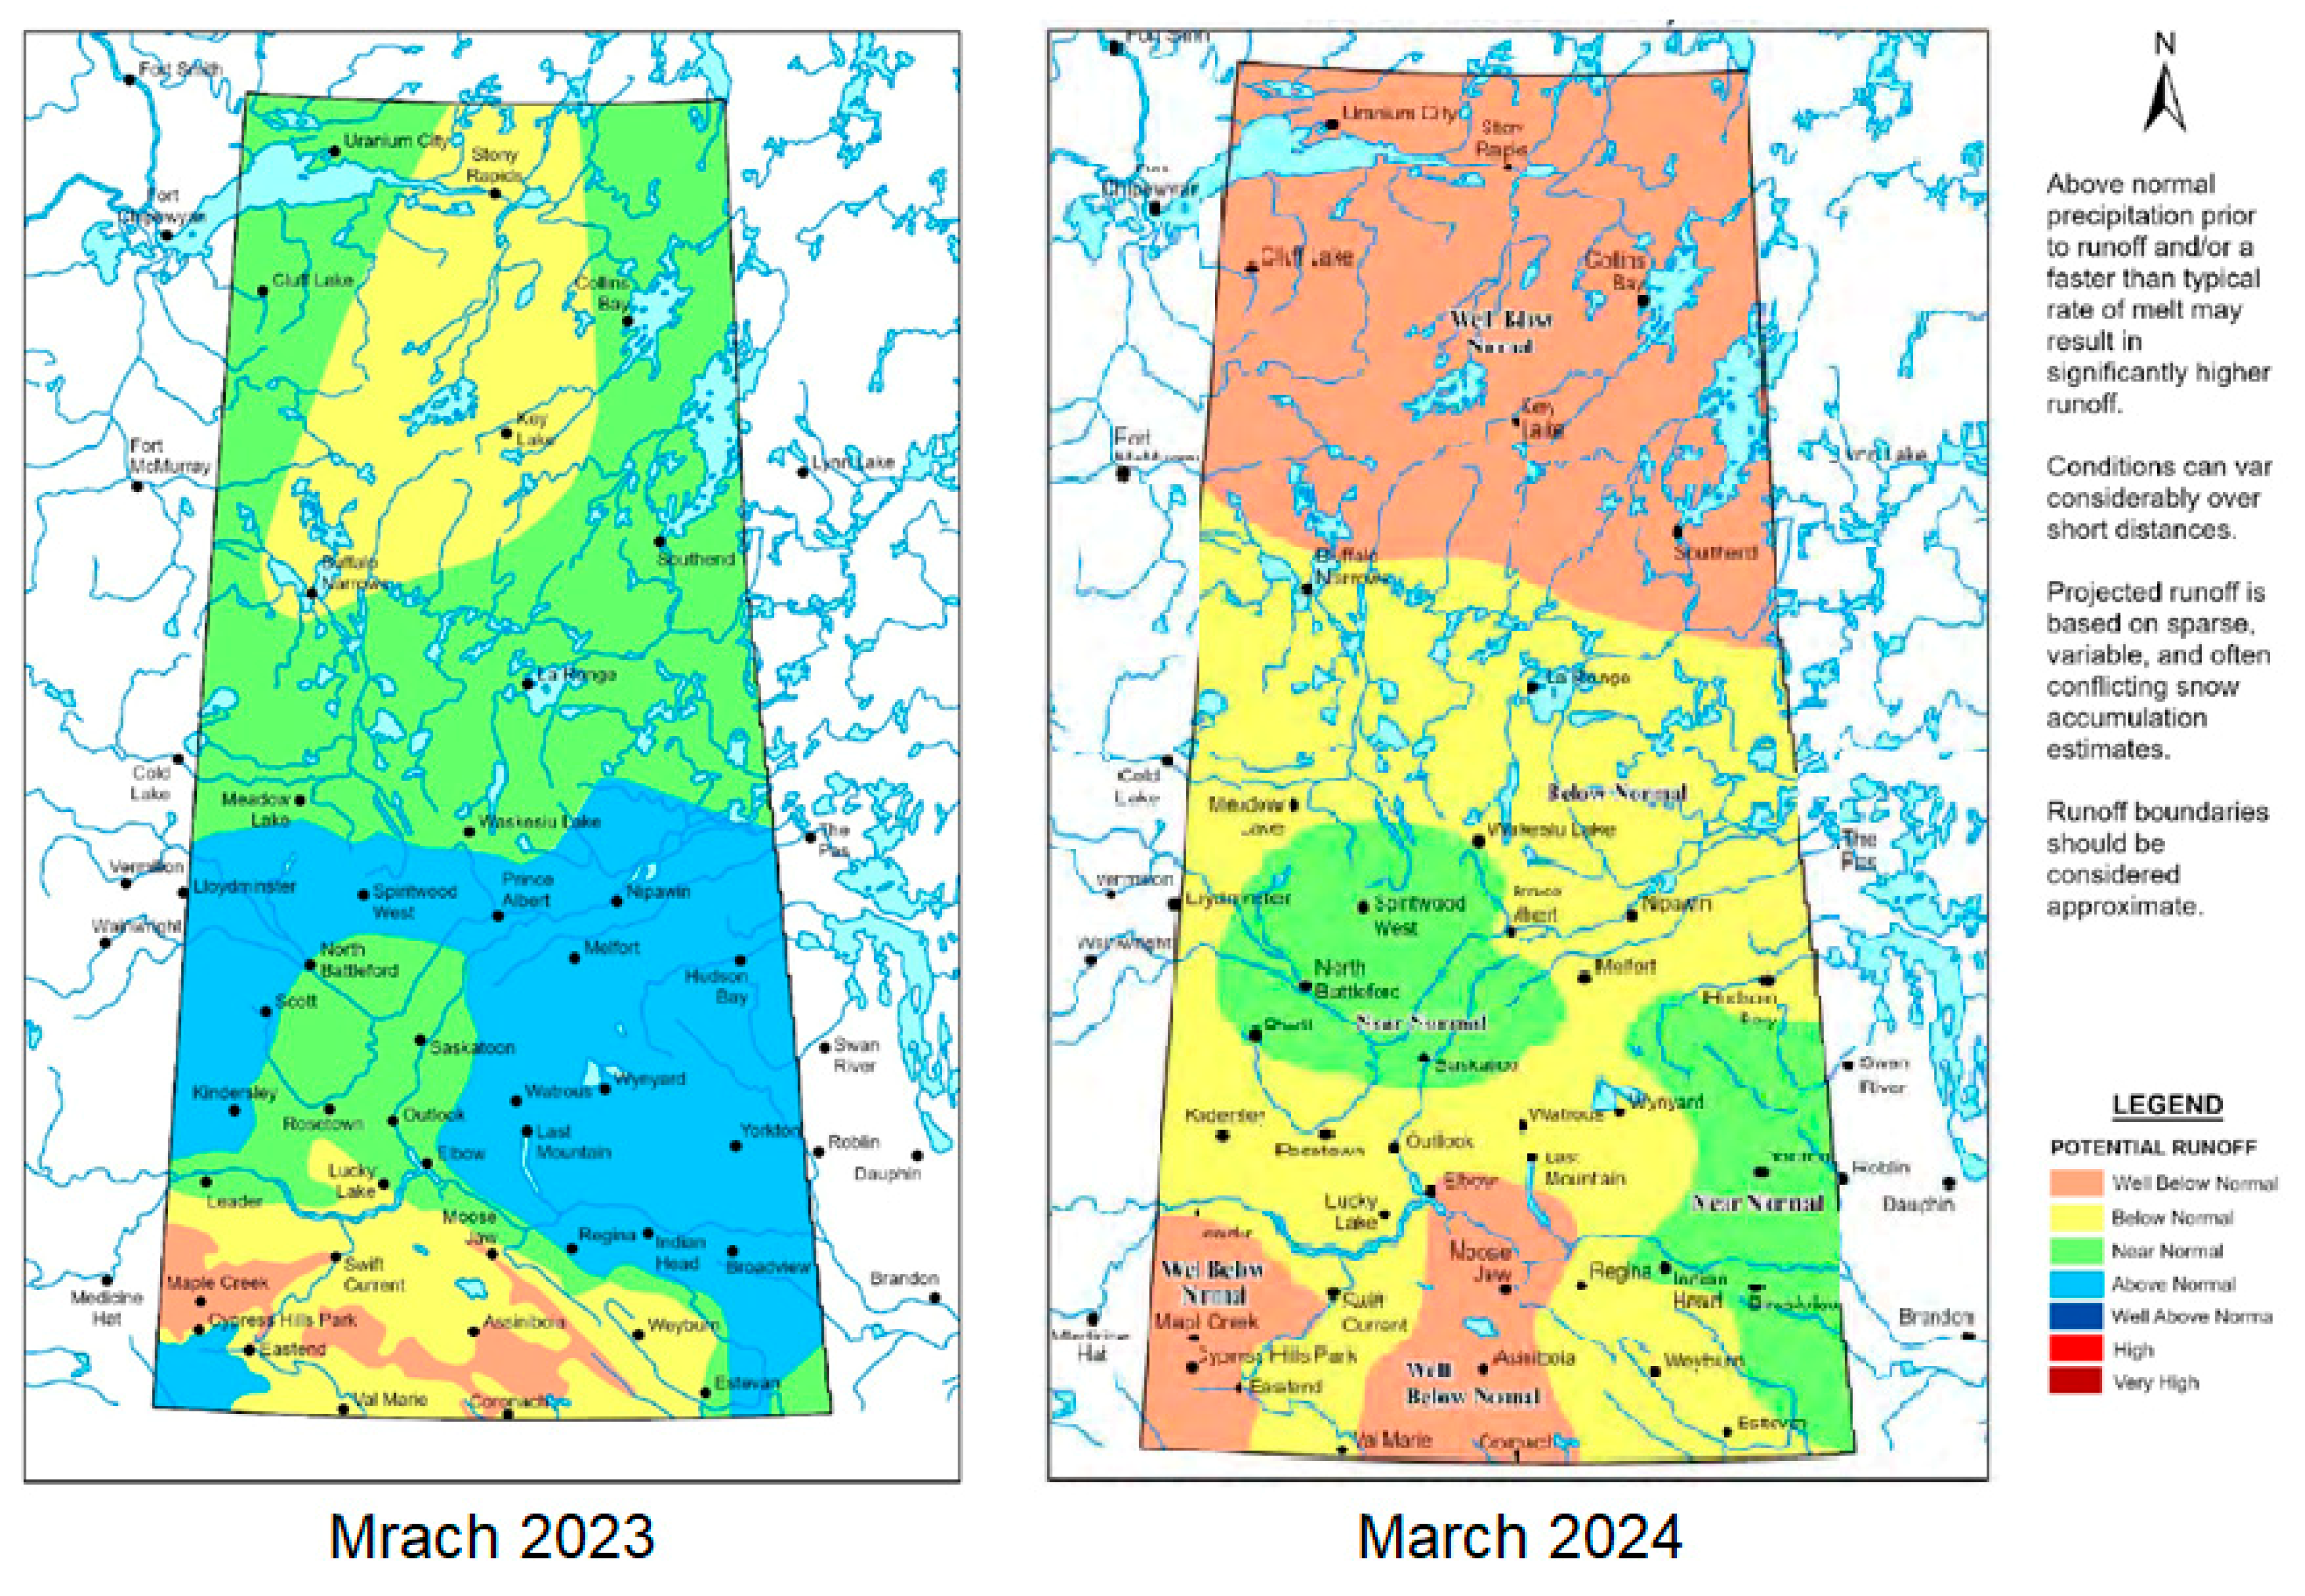
In addition, the feasibility of large-scale hydrogen production depends on site-specific operational risks and mitigation strategies. While geological suitability for CO2 storage and preliminary water availability have been identified in the Estevan region, explicit quantification of water consumption rates for SMR and ATR processes is necessary. Under projected drought scenarios, reduced water availability may necessitate supplementary water treatment or desalination technologies, thereby increasing operational expenditures (OPEX). For instance, integration of reverse osmosis desalination under water-scarce conditions could elevate utility costs by an estimated 5–10%.
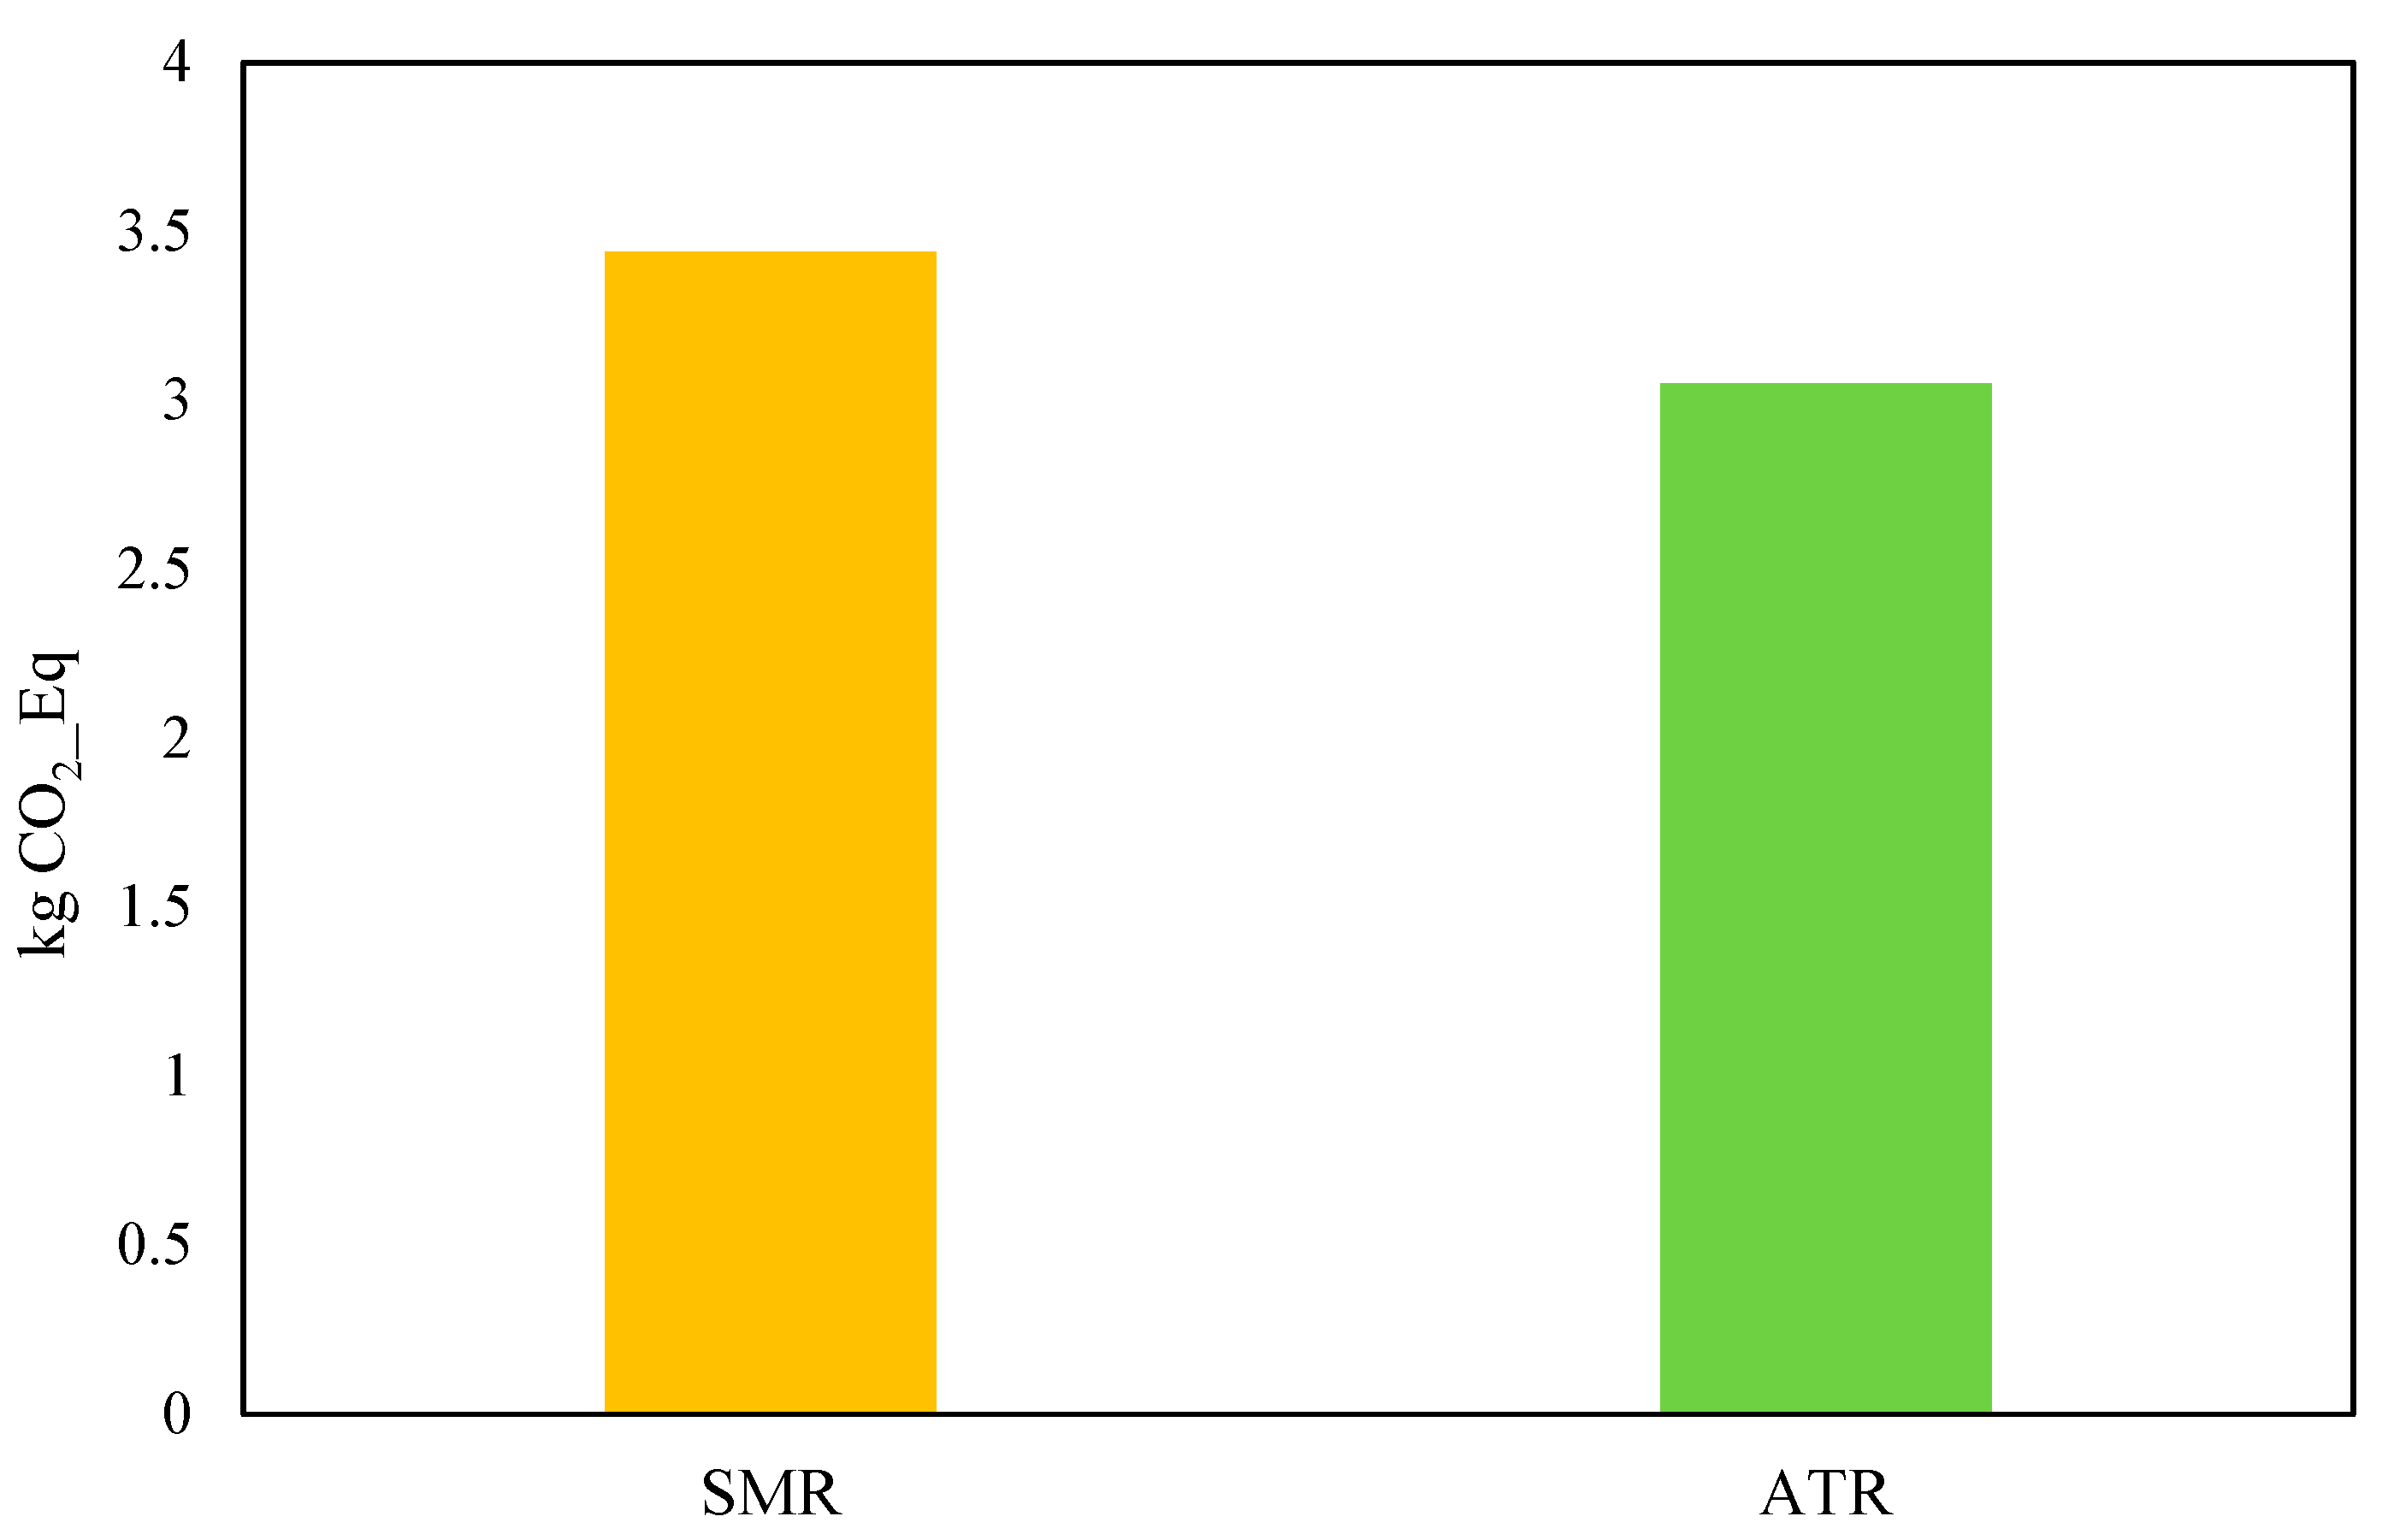
Regarding the environmental analysis results for the greenfield blue hydrogen plant shown in
Figure 18, the Global Warming Potential (GWP) values of 3.44 for steam–methane reforming (SMR) and 3.05 for auto-thermal reforming (ATR) represent the carbon footprints of producing 1 kg of hydrogen via each method. The GWP is a measure of the total greenhouse gas emissions, expressed as CO
2-equivalents, associated with hydrogen production. As explained in the energy results, SMR and ATR are processes for hydrogen production from natural gas (methane), but they differ significantly in how they operate, leading to variations in their environmental impact. ATR’s inherent efficiency in utilizing natural gas and minimizing combustion emissions results in a lower overall carbon footprint.
While the analysis considers direct emissions and on-site CO
2 capture, the broader climate impact of blue hydrogen is highly sensitive to upstream methane leakage in the natural gas supply chain. Maintaining methane leakage rates below 1.5% is critical to preserving the environmental benefits of blue hydrogen [
44]. Incorporating methane leakage into the assessment results in an approximate increase in total GWP by up to 29%. These findings underscore the importance of accounting for upstream methane emissions and implementing stringent mitigation measures to ensure the climate effectiveness of blue hydrogen pathways.
Apart from technological and financial viability, the creation of blue hydrogen infrastructure needs to be analyzed in the context of larger social and policy structures. In order to make low-carbon hydrogen pathways more competitive, carbon pricing policies—such as carbon taxation or cap-and-trade schemes—are essential. In comparison to the use of fossil fuels without any reduction, blue hydrogen is much more economically attractive under Canada’s federal carbon pricing framework. Furthermore, social factors like land use concerns, environmental equity, and public perceptions of the safety of CO2 storage all have an impact on the success of large-scale hydrogen deployment, especially in areas with remnant fossil fuel infrastructure. Policy mechanisms must therefore address not only financial incentives but also public engagement, labor transition strategies, and transparent environmental assessment processes to ensure social license to operate.
4. Conclusions
The transition toward hydrogen as a clean energy carrier is critical for reducing carbon emissions and meeting global sustainability goals. Hydrogen offers a high energy density, versatile applications, and the potential for low-carbon production when integrated with carbon capture or renewable energy sources. However, achieving cost-effective and energy-efficient hydrogen production remains a challenge, especially for large-scale greenfield plants where all infrastructure, utilities, and supporting systems must be designed from scratch. A greenfield hydrogen plant requires extensive consideration of utilities such as steam networks, refrigeration systems, air separation units (ASU), and flue gas treatment, all of which directly affect energy efficiency, operational costs, and environmental performance. Understanding these interdependencies is essential for optimizing hydrogen production pathways and selecting the most viable process.
This study compared steam–methane reforming (SMR) and auto-thermal reforming (ATR) for a 100 MTD greenfield blue hydrogen production plant, analyzing their energy, economic, and environmental performance. The total energy consumption, expressed in barrels of oil equivalent (BOE), showed that ATR required 93.89 BOE, which was 8.4% lower than the 102.50 BOE for SMR. This reduction was due to ATR’s lower hydrogen production energy demand (15.62 BOE vs. 25.04 BOE in SMR) and improved carbon capture in reformer flue gas (2.49 BOE vs. 7.98 BOE in SMR). However, ATR required additional energy in ASU and refrigeration systems due to its oxygen-enriched reformer design.
Regarding the economic perspective in the greenfield plant, ATR had lower total operating costs due to reduced fuel gas demand, resulting in a slightly lower hydrogen production cost of USD 3.28/kg compared to USD 3.33/kg for SMR due to higher capital cost. The sensitivity analysis further highlighted that hydrogen selling price, operating costs, and feedstock price were the most influential parameters on project feasibility.
From an environmental standpoint, ATR demonstrated lower CO2 emissions, with a Global Warming Potential (GWP) of 3.05, compared to 3.44 for SMR, due to enhanced CO2 capture efficiency and reduced emissions in the reforming stage. This suggests that ATR is a more environmentally favorable option, particularly in scenarios where carbon regulations and emission reduction policies are strict.
For future research, energy optimization within steam networks, ASU, and refrigeration systems should be explored to reduce energy consumption and improve efficiency. Additionally, alternative hydrogen production methods, such as biomass gasification or water electrolysis with renewable energy, should be evaluated for large-scale implementation. The integration of advanced carbon capture technologies, including sorption-enhanced reforming or cryogenic separation, could further enhance CO2 capture rates and improve economic viability. Finally, conducting detailed site-specific environmental analysis, including a full life cycle assessment (LCA), would provide a more comprehensive understanding of the long-term sustainability of SMR and ATR technologies. Future work will aim to integrate full hydrogen supply chain costs—including compression, storage, transportation, and distribution—into the techno-economic model to enable a more comprehensive assessment of costs from production to end use.


