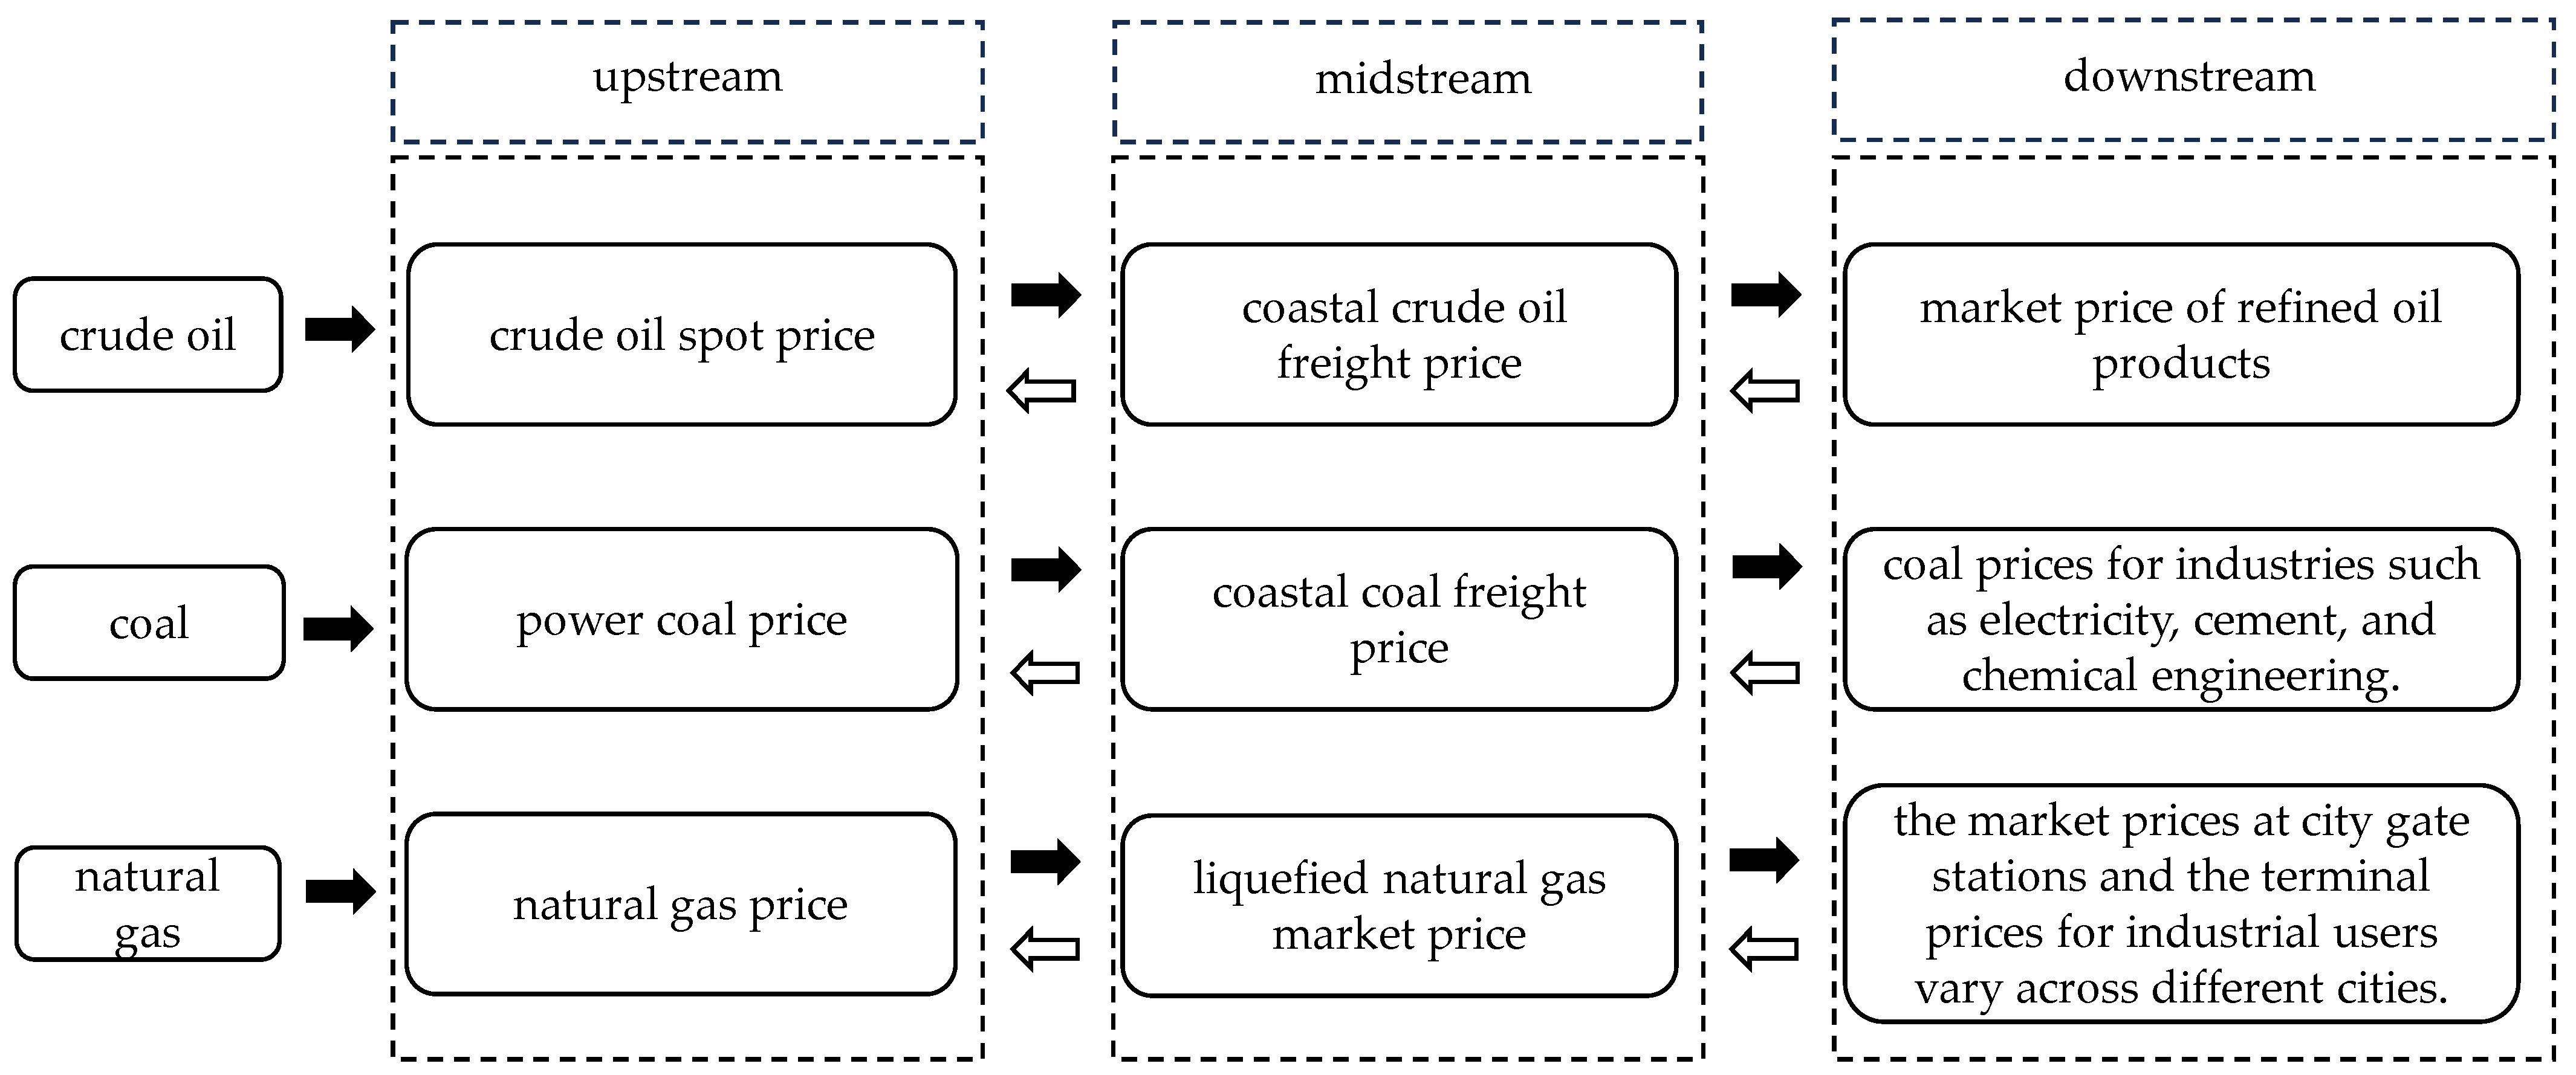
3.1. The Selection of Sample Specimens and the Preprocessing of Relevant Data
The time span of the sample in this study is from 1 August 2015 to 31 July 2024, and all the data are daily data. The specific price indicators selected are as follows. For the Chinese crude oil supply chain, in the upstream, the Crude Oil Spot Price (COSP) is selected; in the midstream, the coastal Crude Oil Freight Price (COFP) is selected; and in the downstream, the Diesel Market Price (DMP), 92 Gasoline Market Price (92GMP), and 95 Gasoline Market Price (95GMP) are selected. For the Chinese coal supply chain, in the upstream, the Power Coal Price (PCP) is selected; in the midstream, the coastal Coal Freight Price (CFP) is selected. For the Chinese natural gas supply chain, the upstream Natural Gas Price (NGP) and the midstream Liquefied Natural Gas Market Price (LNGMP) are selected. The sample data are sourced from the Wind Database, the National Bureau of Statistics, and the Choice Database.
Considering potential heteroskedasticity in the nine time-series, we first apply a natural logarithmic transformation to the market price data to reduce volatility. Subsequently, we compute the logarithmic returns by taking first-order differences and scaling the results by 100. This approach effectively eliminates potential trend components and extracts return information. Meanwhile, considering that some markets (such as the coal and natural gas markets) have obvious seasonal characteristics, their prices show strong seasonal fluctuations due to heating demand. The first-order difference processing method we adopt can, to a certain extent, eliminate the seasonal components in the data. The difference operation subtracts the data of adjacent time points, thus weakening the impact of periodic changes caused by seasonal patterns. This processing method not only helps to eliminate seasonal factors but also can more clearly reveal the real fluctuations and trends in the data, making the subsequent analysis results more reliable.
Based on the descriptive statistics of the price-index returns presented in
Table 1, several key observations can be made. First, the skewness values of the sample index returns are all non-zero, and the kurtosis values are greater than 3. This indicates that these data deviate from the standard normal distribution. Second, the J-B statistics are extremely large, and all values are far greater than the critical value (approximately 5.99) at the 5% significance level. This provides strong evidence that the data significantly deviate from the normal distribution and exhibit characteristics of leptokurtosis and fat tails. In particular, for the COFP series, its extremely high kurtosis value and the corresponding extremely large J-B statistic both show a highly significant deviation from the normal distribution (large skewness and large excess kurtosis will directly lead to a large Jarque–Bera value). Third, the high kurtosis and fat-tailed features suggest a relatively high probability of extreme values. The high-risk and asymmetric nature of price volatility in the energy supply chain market is reflected by this, which also suggests that this market is vulnerable to a variety of external risks, such as geopolitical conflicts, policy reforms, and supply–demand imbalances.
Therefore, considering the aforementioned statistical characteristics, this paper demonstrates that opting for the DGC-t-MSV portfolio model is extremely viable and productive. Reliable model-based support for the subsequent empirical analysis can be provided by this model, which is capable of efficiently grasping the high volatility and asymmetry of the return series.
On this basis, as can be seen from
Table 2, the logarithmic return of the index meets the stationarity test, but there is a ARCH effect in the heteroscedasticity test. This indicates that from an economic perspective, the DGC-t-MSV model can capture specific characteristics that the ARCH model cannot achieve. Therefore, the DGC-t-MSV model used in this paper is more suitable for the data and research objectives of this paper.
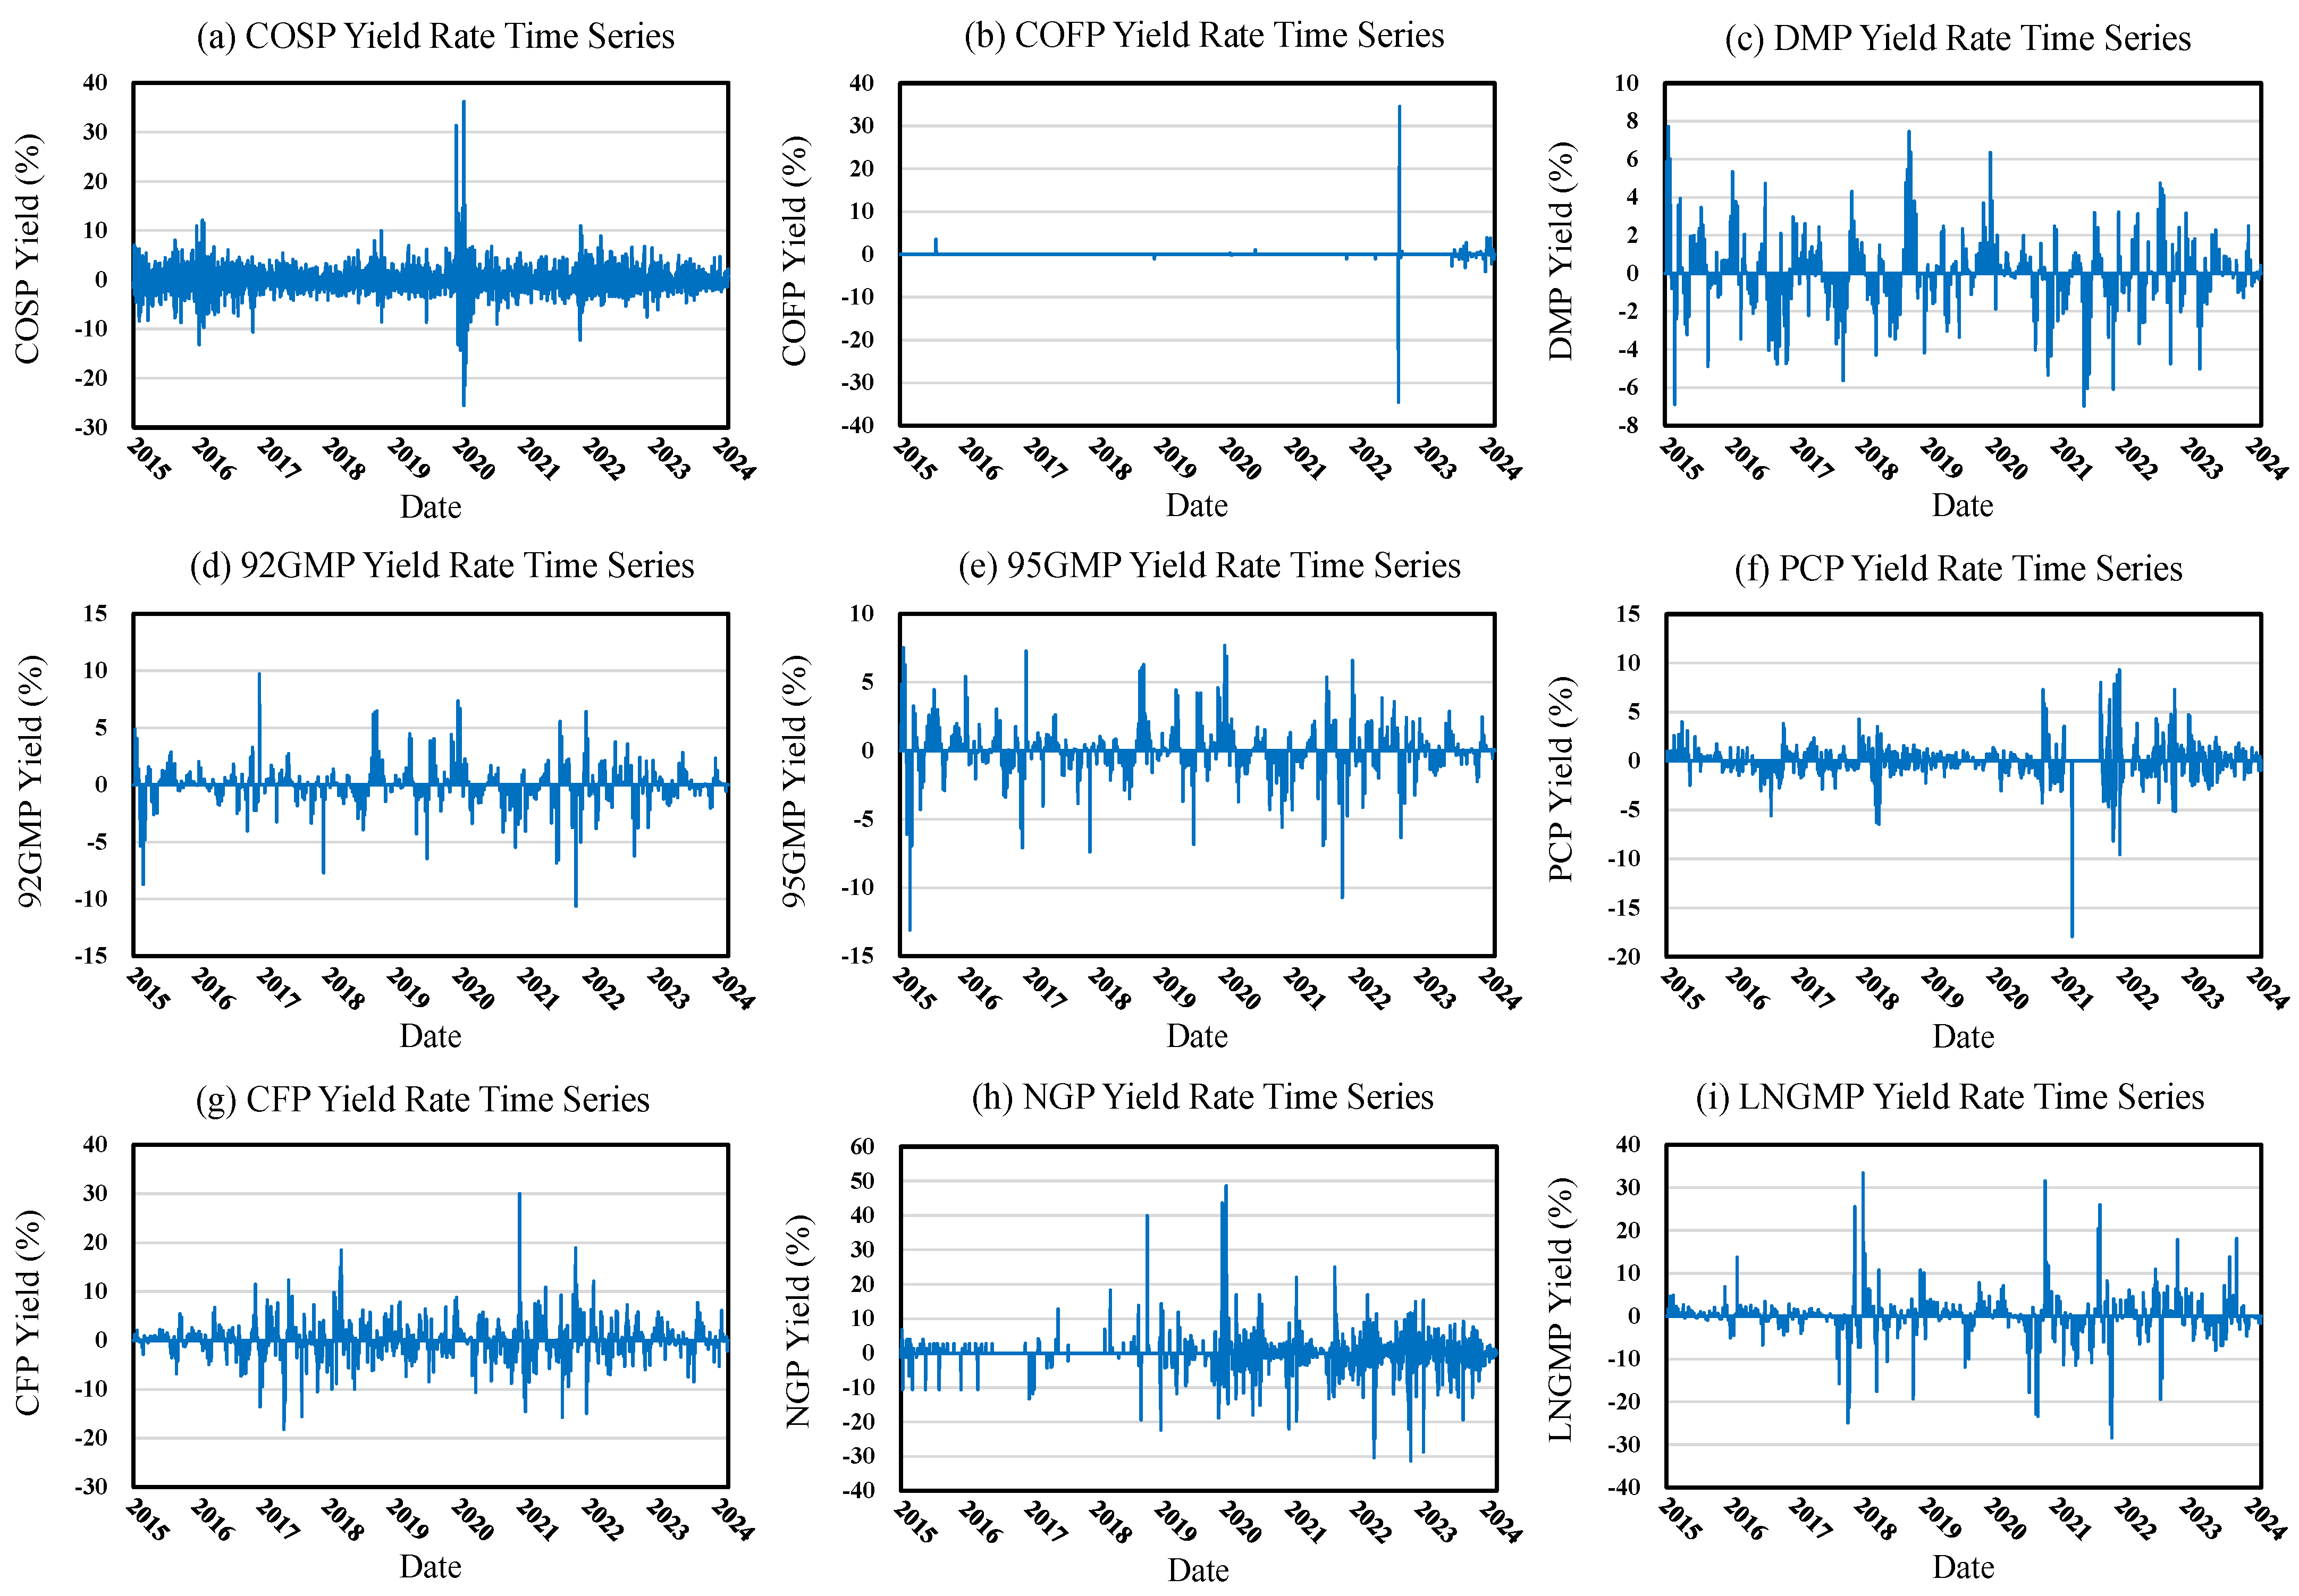
Figure 2 depicts the time–return series of nine energy supply chain price indices in China.
Figure 2a–e illustrate the volatility of the time–return series of China’s energy crude oil supply chain. Notably, the crude oil spot price exhibits more pronounced volatility around the midpoint of the time-series. This is strongly associated with the COVID-19 global health crisis. The research conducted by Sharif et al. [
6] offers robust empirical evidence regarding the consequence of the COVID-19 pandemic on the volatility of the energy commodity index. Conversely, the crude oil freight price demonstrates a high level of stability. This phenomenon reflects the well-established system and mature policies in China’s crude oil transportation market.
Figure 2b shows that the coastal crude oil freight price grew at an exceptionally high rate in 2022. Our analysis identifies three primary drivers for this increase: first, concentrated inventory-replenishing demand from domestic refineries following their operational resumption after adjustments to epidemic prevention policies; second, extreme weather conditions, particularly typhoons that caused port delays and closures in East and South China; and third, oil-hoarding behavior induced by high international oil prices. Additionally, year-end surges in international VLCC pricing levels to over USD 100,000 per day led to the diversion of some coastal shipping capacity. When combined with reduced turnover efficiency due to port epidemic controls, these factors further elevated the short-term coastal crude oil freight price. Data from the Shanghai Shipping Exchange indicate that the Coastal Crude Oil Freight Index (CTFI) rose from 1000 points in January to 1400 points by December.
Figure 2f,g illustrate the volatility of the time–return series of coal supply chain prices in China. As can be observed from
Figure 2f,g, the volatility of the coal market price increased significantly between 2021 and 2022, indicating the instability of the coal market price. The reasons for this instability can be attributed to the following factors. On the coal supply side, environmental protection regulations have compelled some coal mine supply enterprises to undergo rectification or shut down, impeding the release of production capacity. On the coal demand side, as China’s environmental protection policies have tightened, the development of high-energy-consuming enterprises has been restricted, resulting in a decrease in coal consumption demand. Consequently, the market balance has been thrown off-kilter due to the limitations on both the supply and demand sides. Consequently, coal prices have faced pressure, leading to heightened instability and volatility in the underlying returns.
Figure 2h,i, respectively, depict the volatility of the time-series returns of the natural gas price and the liquefied natural gas market price. By analyzing
Figure 2h,i, it is evident that compared with the earlier stages of the time-series, the volatility of the natural gas price and the liquefied natural gas market price has been more pronounced since 2018. The reason for this phenomenon can be attributed to the following factors. As China’s industrial structure undergoes in-depth adjustment and continuous upgrading, the demand for clean energy, such as natural gas, in emerging industries has gradually increased. Moreover, in industrial production and power generation, natural gas acts as a crucial alternative to coal. The unstable coal price makes the price advantage of natural gas more conspicuous, which exerts an important influence on the supply–demand relationship and price trend of the natural gas market.
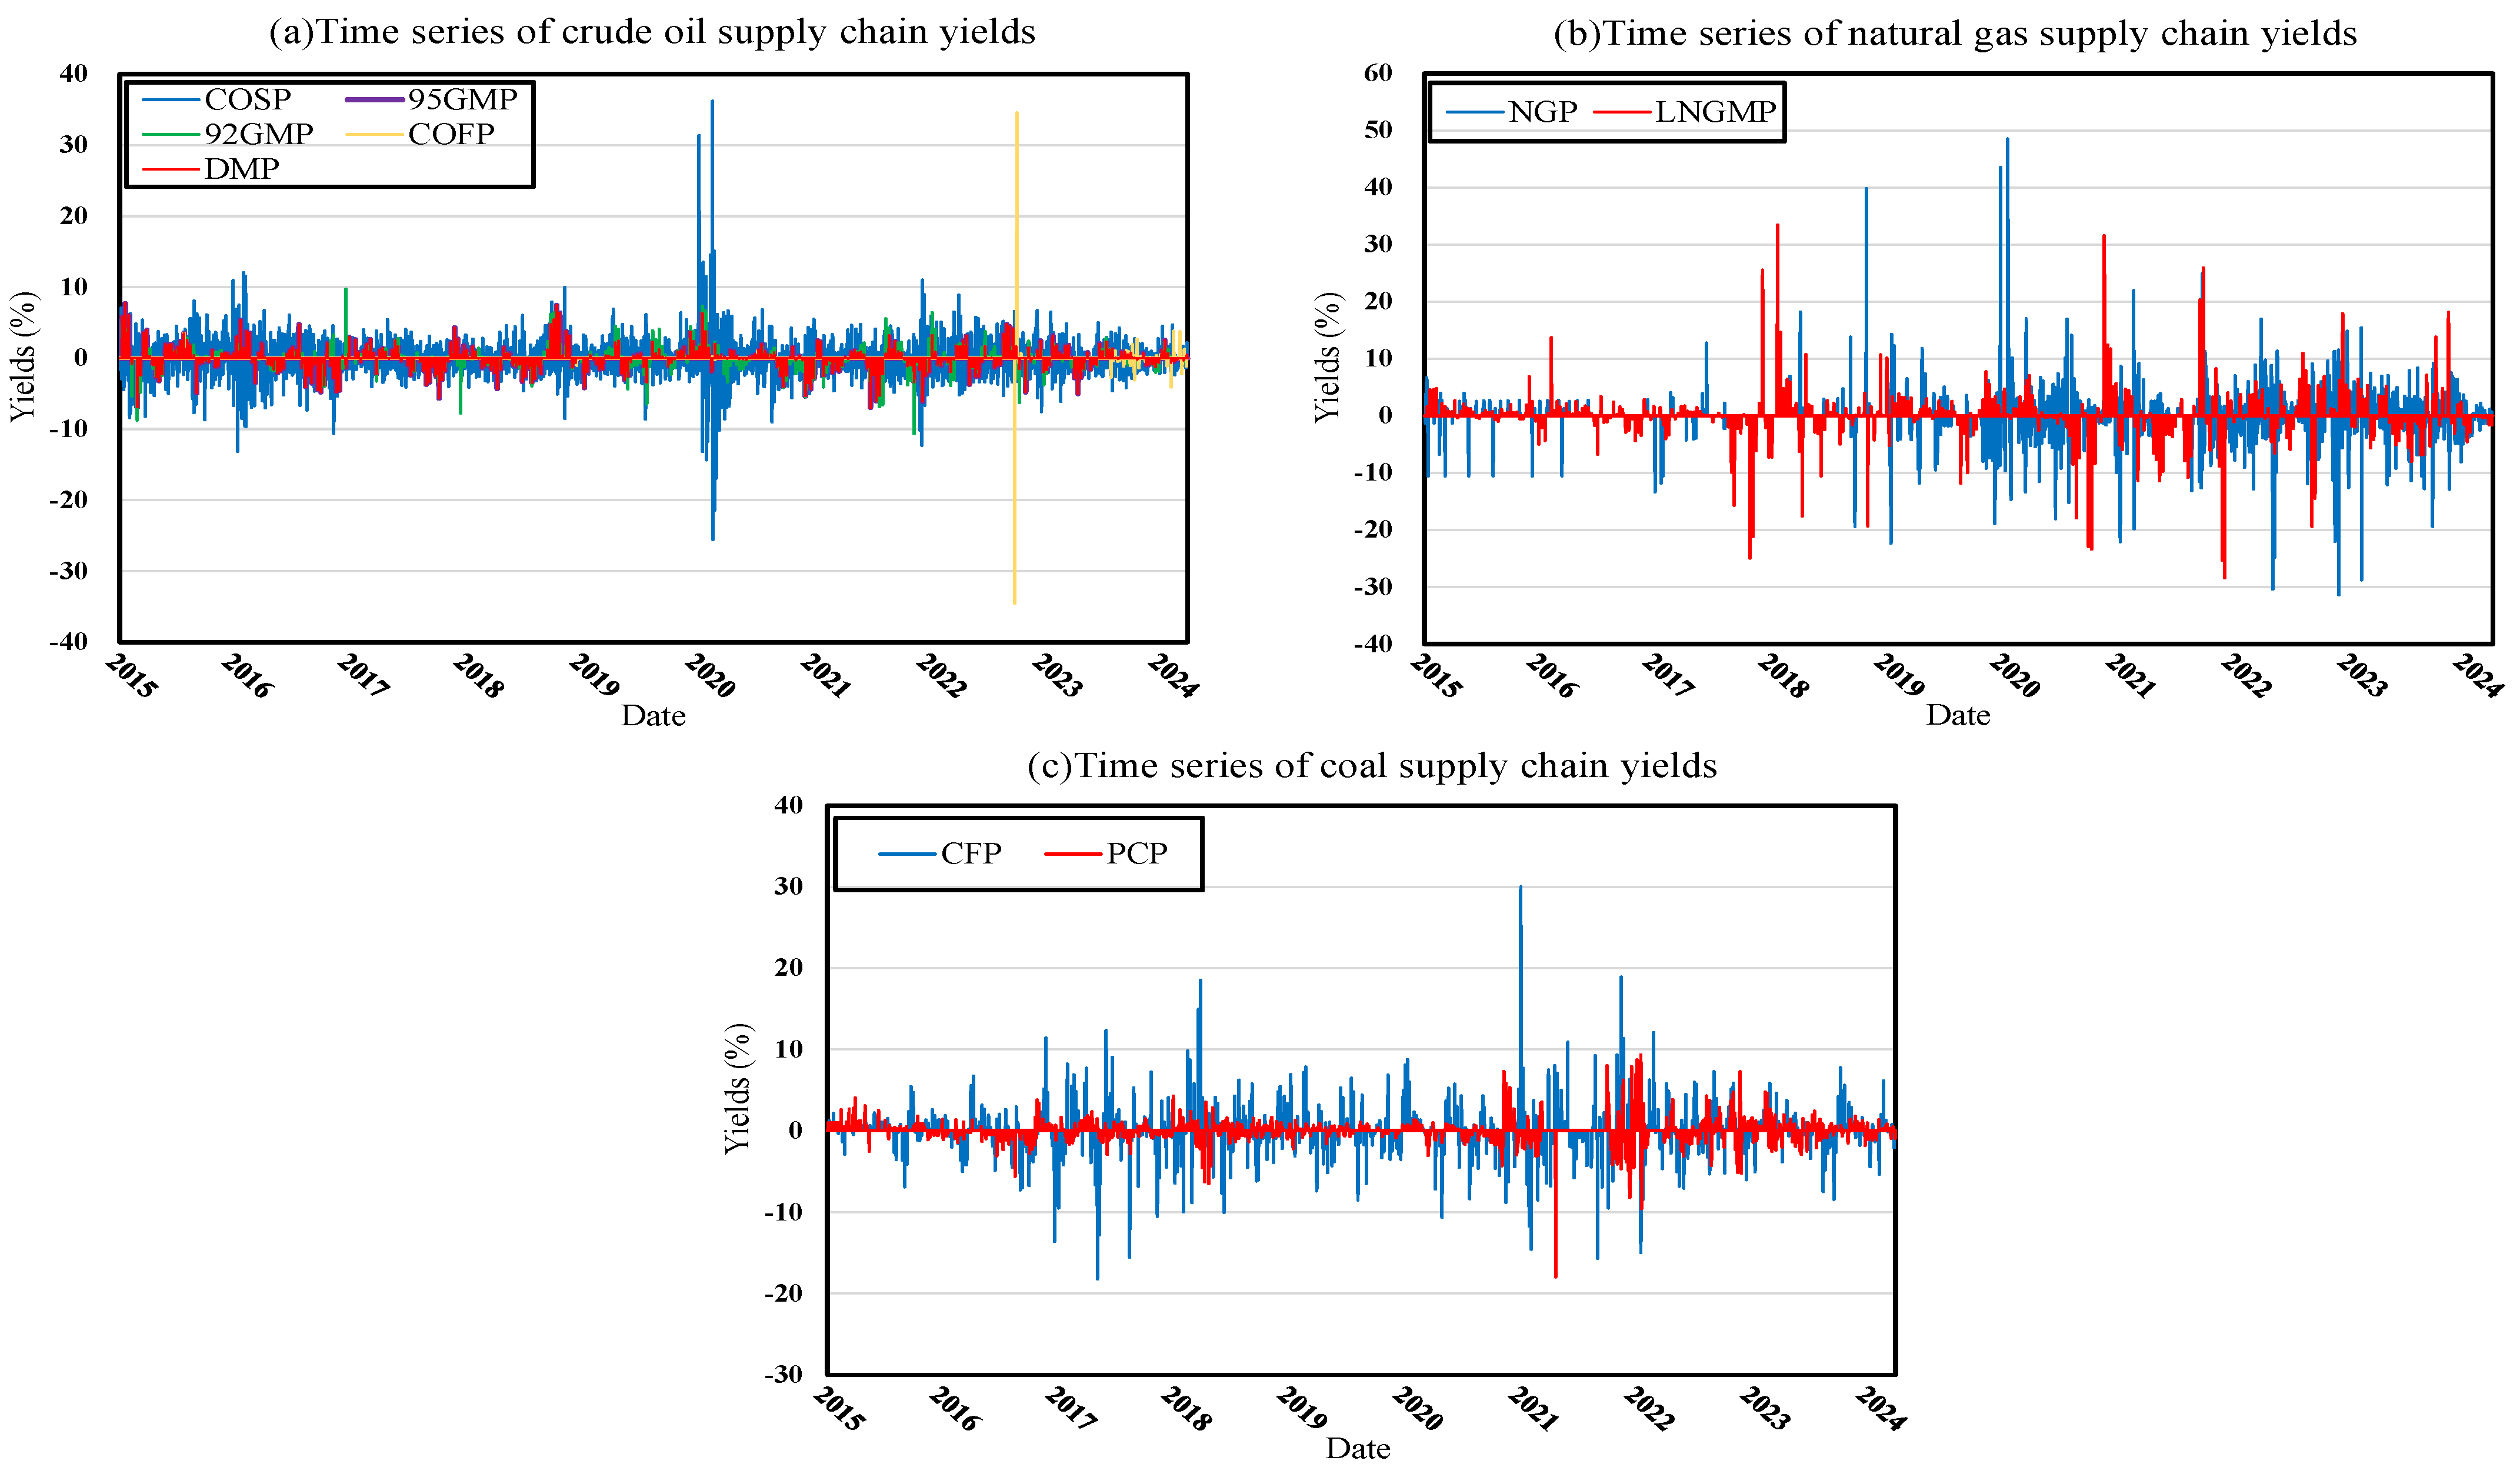
Figure 3 shows the comparison of the time return series of crude oil, coal, and natural gas in China. From
Figure 3, the correlation characteristics among the energy price series can be clearly observed. The specific analysis is as follows:
First, in China’s crude oil supply chain market, the Crude Oil Spot Price (COSP) in the upstream market exhibits synchronized volatility and correlation with the 92 Gasoline Market Price (92GMP) and 95 Gasoline Market Price (95GMP) in the downstream market. The underlying reasons for this phenomenon can be attributed to two primary factors: On the institutional level, China’s refined oil pricing mechanism is linked to international crude oil prices. According to the Petroleum Price Management Measures issued in 2016, the retail price ceiling of refined oil products follows a “10-working-day adjustment mechanism”. The domestic refined oil pricing formula is directly tied to international crude oil prices, creating a structured price transmission channel. From a cost perspective, crude oil costs account for over 70% of the total production costs of refining enterprises (as reported in Sinopec’s 2022 annual report), while refining technology costs (such as catalytic cracking efficiency) remain relatively rigid. Consequently, fluctuations in COSP can be rapidly transmitted to the downstream gasoline market (92GMP and 95GMP), leading to synchronized price movements. This synchronization reflects the combined effect of regulatory pricing mechanisms and market-driven cost transmission dynamics.
Second, in China’s coal supply chain, the power coal prices in the upstream market and the coal freight prices in the midstream market are somewhat correlated, and the price fluctuation is large and lagging. The reason for this is that coal is one of the major energy sources on which China’s economic advancement experiences a degree of dependence, and due to the remarkable changes in its provision, consumption, and expenditure, the prices across all segments of the supply chain system undergo substantial fluctuations. The implementation of stricter environmental protection policies has forced several coal mines to cease operations. This disruption has thrown off the equilibrium between supply and demand, resulting in substantial price fluctuations within the supply chain. In addition, during coal demand season, coal prices rose to drive increased demand for transportation, but the coastal coal transportation is mostly based on long-term contracts, and the contract period of the tariff is fixed. Under the combined effect of these factors, upstream power coal prices and midstream coal freight price showed a complex correlation with high volatility and obvious lag.
Third, the volatility of natural gas prices in the upstream market and the liquefied natural gas market prices in the midstream market is significant, with a lack of synchronization and high uncertainty. The reasons for this are evident at three levels: (1) The international environment level—China is more significantly affected by the fluctuations in the global natural gas marketplace. Factors such as the instability of international natural gas prices and geopolitical situations are conveyed into the Chinese market via the import route. (2) The energy structure level—China is in a period of energy transition, and natural gas, as a relatively clean energy, has seen its demand continue to climb. However, price uncertainty will be heightened due to a high level of reliance on foreign natural gas, as the expansion pace of domestic natural gas output struggles to keep up with the surge in market need. (3) The infrastructure development—Uneven natural gas infrastructure in China, with limited transportation and storage capacity in some areas, can also exacerbate price volatility in localized areas.
3.3. Mean Spillover Effect Analysis of the Model
In this section, to more accurately measure the average spillover effect, the dynamic spillover effect among different variables is gauged using the price dynamic correlation coefficient, as presented in
Table 3.
Table 3 presents a statistical description of the dynamic correlation coefficients among prices within the supply frameworks of China’s three major energy sources: crude oil, coal, and natural gas. As shown in
Table 3, there are differences in the dynamic correlations among energy prices across China’s energy supply chains. The specific analyses of these differences are as follows.
First, during the operation of the crude oil supply chain, the average value of the dynamic correlation coefficient between the upstream COSP and the midstream COFP is −0.0302. The range reaches 0.9106, reflecting substantial variation in their relationship. The reason is that geopolitical conflicts have disrupted the crude oil supply, driving up the international and Chinese crude oil spot prices, while the transportation market has reduced regional operations due to related risks. This has led to an oversupply of coastal transportation capacity, thus depressing the freight rates and forming a negative correlation. Moreover, affected by the rise in international oil prices, the Chinese crude oil spot price has also increased. However, since the global pandemic, China’s economic growth has slowed down in some stages, and the import volume and transportation demand have shown a fluctuating downward trend, resulting in a decline rather than an increase in freight rates, and thus forming a phased reverse change with the upstream crude oil spot price. This indicates that the spillover effect within the Chinese crude oil supply chain is deeply influenced by factors such as geopolitical conflicts and changes in the international crude oil market.
Second, in the coal supply chain market, the mean in the dynamic state of the correlation parameter between the upstream PCP and the midstream CFP is 0.0130. However, the range between the two is as high as 0.9209, suggesting significant uncertainty in price fluctuations between upstream power coal prices and midstream coastal coal transportation prices. A confluence of elements, including the balance between market supply and demand, global coal price levels, and the overarching macro-economic landscape, leads to this situation. It is in the natural gas provision network that the calculated average of the dynamic correlation parameter between the price of upstream NGP and the market LNGMP stands at 0.0026, which suggests that the correlation is rather weak. However, the range reaches 1.0324, the highest among all datasets, reflecting large price fluctuations and a lack of a stable linkage mechanism. The cause behind this phenomenon is that multiple intricate factors have an impact on China’s natural gas supply chain market, such as international gas supply, domestic pipeline transportation, storage and peak-shaving capacity, and seasonal consumption differences. These factors make it difficult to stabilize the correlation between upstream natural gas prices and midstream liquefied natural gas market prices.
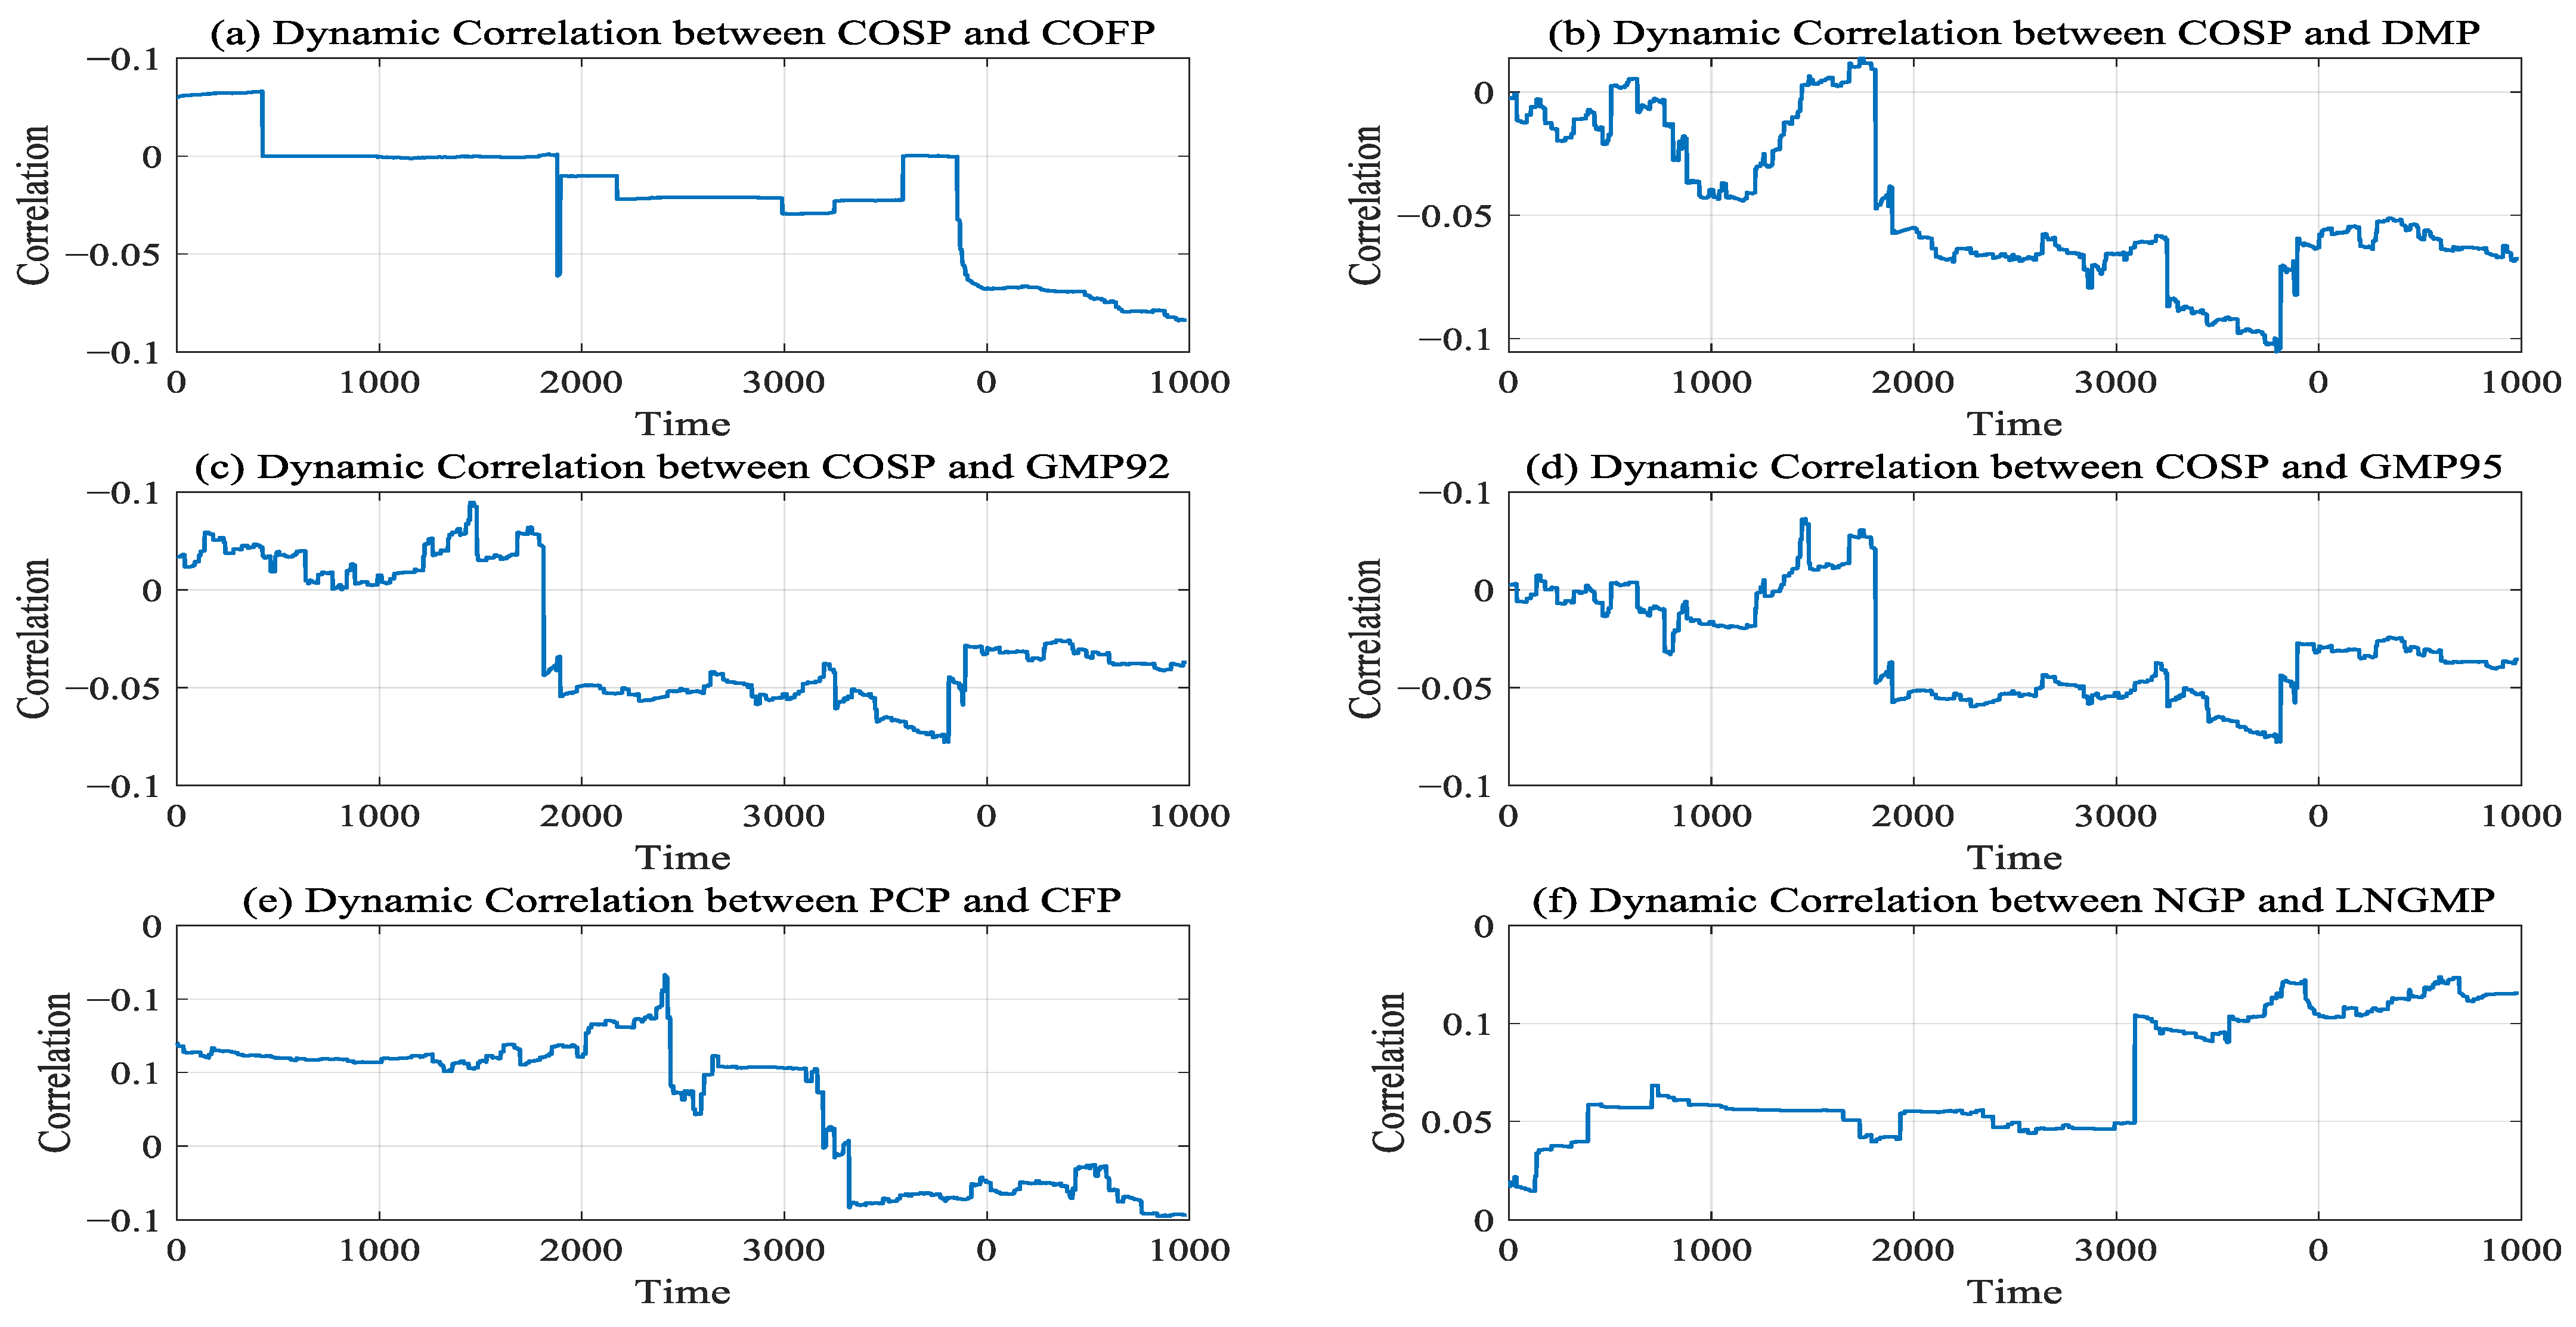
Figure 7 depicts the dynamic correlations among the prices of the three energy supply chains in China over time.
Table 4 presents the results of the statistical significance tests (
p-values) for the correlations shown in
Figure 7. This provides a solid statistical basis for the subsequent in-depth analysis of their change characteristics and underlying causes. The strength criteria for Spearman’s rank correlation coefficient are similar to those for Pearson’s correlation coefficient. Generally, the following ranges are used to interpret its strength: 0.00–0.19, extremely weak correlation; 0.20–0.39, weak correlation; 0.40–0.59, moderate correlation; 0.60–0.79, strong correlation; 0.80–1.00, very strong correlation. The following is an in-depth analysis of the change characteristics and underlying causes of the dynamic correlations of prices at each link around these three supply chains of crude oil, coal, and natural gas.
First, in the initial stage of the time-series of China’s crude oil supply chain, there is a dynamic correlation among the upstream COSP, the midstream COFP, the downstream DMP, the 92GMP, and the 95GMP. In a market environment characterized by relatively balanced crude oil supply and demand, stable policies, and the absence of major trade frictions, upstream price changes are rapidly transmitted to downstream sectors, which is consistent with the principles of market economics. However, in the middle stage of time-series analysis, the price correlation among various links in the crude oil supply chain gradually decreases. This phenomenon is closely associated with domestic and foreign policy adjustments, the China–US trade war, the Russia–Ukraine conflict, and the global COVID-19 pandemic [
37,
38]. Specifically, policy adjustments have modified supply–demand relationships and price formation mechanisms. Trade wars and military conflicts have increased price uncertainty, whereas the global pandemic significantly reduced energy demand and disrupted price transmission mechanisms. Collectively, these effects illustrate how external shocks destabilize China’s crude oil market. By the end of the time-series analysis, the correlation among variables gradually recovers and stabilizes. This recovery reflects the adaptation of market participants to the new policy environment and economic conditions after medium-term fluctuations.
Second, as shown in
Figure 7e, the correlation within the coal supply chain exhibits slight fluctuations in the initial period. China possesses abundant coal reserves and maintains a stable supply, with its coal market being relatively self-contained and largely insulated from international geopolitical volatility. In the middle stage of this time-series, the correlation suddenly rose to about 0.06 and then quickly turned into a negative correlation. This change can be attributed to China’s recent domestic policy reforms. In recent years, China has vigorously implemented policies on new energy and clean energy. For example, the Action Plan for Reaching Peak Carbon Emissions before 2030 has been introduced to guide the transformation of the energy consumption structure, resulting in a decline in the market demand for coal [
39,
40]. Meanwhile, Chinese coal production enterprises have adjusted their production plans in line with the “dual carbon” goals issued domestically, leading to the gradual withdrawal of some production capacities from the market. The reversal of the supply–demand relationship has caused the above-mentioned changes in the correlations among various links of the coal supply chain.
Third, as illustrated in
Figure 7f, the dynamic correlation between upstream NGP and midstream LNGMP evolved as follows: initially negative, it gradually stabilized at approximately 0.02, followed by a surge to a peak of around 0.05. This trend reflects China’s evolving natural gas policies and market dynamics. For example, the “Administrative Measures for the Pricing of Natural Gas Pipeline Transportation (Trial)” promulgated in 2016 marked the beginning of the market-oriented reform of natural gas. It allowed the prices of natural gas sources and sales to be determined by the market. Specifically, China’s 2015 market-oriented pricing reforms for natural gas triggered heightened volatility in upstream prices. However, midstream price adjustments lagged behind upstream fluctuations due to rigid regulatory controls and delayed market reactions, leading to a persistently low correlation coefficient (below 0.1) during this phase. By 2021, China had deepened its natural gas price liberalization reforms: government interventions were substantially scaled back, while market mechanisms played an increasingly dominant regulatory role. Furthermore, China’s natural gas import prices became more tightly coupled with international benchmarks as global energy market integration intensified. These developments collectively reshaped the correlation patterns within China’s natural gas supply chain.
3.4. Analysis of Volatility Spillovers in the Model
This paper captures and analyzes the volatility spillover correlation and timing variability among time-series with the help of the DGC-t-MSV model, and this part introduces the volatility persistence parameter to quantify the degree of influence of past volatility on current and future volatility.
Table 5 shows the simulated data estimates of price volatility spillovers among China’s crude oil, coal, and natural gas energy supply chains. A specific analysis of the relevant content is available.
The Chinese energy market is highly concentrated, and government regulation and policy changes have a significant impact on market fluctuations. The DGC-t-MSV model can dynamically capture the spillover effects of these exogenous shocks on price fluctuations. In addition, the price fluctuations in the Chinese energy market usually exhibit non-linear and non-normal characteristics. The DGC-t-MSV model uses the t-distribution to describe the residuals, which can better fit these data characteristics, thereby improving the applicability and accuracy of the model. The specific analysis is as follows.
First, there is a two-way volatility spillover effect between the upstream Crude Oil Spot Price (COSP) and the midstream coastal Crude Oil Freight Price (COFP), but the transmission process shows distinct asymmetry. Quantitative analysis shows that in terms of transmission intensity, the average spillover value from COSP to COFP (0.0251) is higher than that of COFP to COSP (0.0114), revealing that upstream price fluctuations have a stronger radiation effect on midstream transportation costs. In terms of volatility characteristics, the standard deviation of the COFP to COSP direction (0.0115) is 2.74 times that of the COSP to COFP direction (0.0042) (Monte Carlo error: 0.0081 > 0.0030), highlighting the high-frequency oscillation attribute when the midstream freight price impacts the upstream price. In terms of directional stability, the 97.5% quantile of COFP to COSP (−0.0006) is close to the zero-value threshold, while the corresponding quantile of COSP to COFP (−0.0211) falls deeply into the negative value range (95% confidence interval: −0.0223 to −0.0006), further confirming the obvious uncertainty of the former effect. The reason is that the supply–demand relationship in the upstream of China’s crude oil supply chain is more rigid than that in the midstream transportation market. The upstream COSP is affected by global supply–demand, geopolitics, and macro-regulation [
41]. The changes in these factors are relatively slow and predictable. However, the midstream coastal COFP is affected by micro-factors such as ship supply–demand, port congestion, and fuel prices, resulting in short term and violent oscillation characteristics of its price feedback to the upstream. Therefore, the upstream COSP has a more significant spillover effect on the midstream coastal COFP.
Second, in China’s downstream crude oil market, the Diesel Market Price (DMP), the 92 Gasoline Market Price (92GMP), and the 95 Gasoline Market Price (95GMP) all have positive volatility spillover effects on the midstream coastal crude oil freight price (COFP). However, the feedback from COFP to the downstream market shows a structural asymmetric suppression. The specific analysis is as follows: (1) Statistical fragility of the suppression effect: the 95% confidence intervals of COFP to 92GMP ([−0.0203, 0.0020]) and COFP to 95GMP ([−0.0202, 0.0061]) both cross zero, indicating that although the increase in freight prices briefly suppresses gasoline price fluctuations through the cost transmission channel (such as delaying the refineries’ price adjustment decisions), it does not form a continuous spillover path. (2) The reasons for the weak negative correlation between the two (for COFP to 92GMP) are as follows: regional market segmentation—the differentiation of inventories between coastal and inland refineries leads to an increase in transmission noise; policy smoothing effect—the national refined oil price adjustment mechanism (Chapter 4 “Improving the Energy Reserve System” of the “14th Five-Year Plan for a Modern Energy System”) weakens the intensity of price fluctuation transmission through the strategic reserve’s purchase and sale adjustment. (3) Structural amplification effect of downstream volatility: the standard deviation of the downstream prices’ response to COFP fluctuations increases significantly (DMP: 0.0187 → 92GMP: 0.0170 → 95GMP: 0.0262), which is consistent with the high-order volatility transmission model. These results verify hypothesis 1.
Third, in China’s coal market, the volatility spillover between upstream PCP and midstream CFP exhibits asymmetric directions (positive and negative). A 1% rise in PCP drives a 17.64% surge in CFP (median coefficient = 0.1764). Since the 97.5% confidence interval is [0.0148, 0.3380], this indicates that there is a transmission effect between the upstream PCP and the midstream CFP. Notably, this pathway carries the highest volatility risk in the entire dataset (standard deviation = 0.1701), indicating that freight prices are acutely sensitive to coal price fluctuations. Conversely, the reverse transmission (from CFP to PCP) is practically non-existent. This result verifies hypothesis 2. This phenomenon can be explained by two factors: first, the Chinese government actively stabilizes power coal prices to ensure the reliability of critical supplies (e.g., electricity), which isolates the upstream market from midstream fluctuations; second, China’s coal market is dominated by Long-Term Agreement (LTA) contracts. Concentrated supply and pre-negotiated LTA prices (fixed during the contract period) further diminish the prominence of midstream CFP impacts on upstream PCP [
42].
Fourth, in China’s natural gas supply chain, the average volatility spillover effect from upstream NGP to midstream LNGMP is 0.1465. A unidirectional and pronounced positive volatility spillover effect exists from upstream natural gas prices to midstream liquefied natural gas market prices. Specifically, a 1% increase in NGP drives a 14.65% rise in LNGMP (median coefficient = 0.1465; 97.5% confidence interval [0.0070, 0.2860]). Conversely, the negative spillover effect from midstream LNG market prices to upstream natural gas prices remains marginal. This result verifies hypothesis 3. Three factors explain this phenomenon: First, the price formation mechanism differs between the two markets: upstream NGP is policy-driven and cost-based, resulting in price rigidity, while midstream LNGMP is market-responsive and lacks reverse influence on upstream pricing. Second, China’s cost-plus pricing model directly transmits upstream NGP increases to midstream costs, amplifying the positive spillover from NGP to LNGMP. Third, natural gas import and supply plans are governed by long-term contracts and stability mandates. These pre-negotiated terms reinforce the dominance of upstream price dynamics over midstream LNGMP.


