Article

A Hybrid Framework for Photovoltaic Power Forecasting Using Shifted Windows Transformer-Based Spatiotemporal Feature Extraction

1
School of New Energy, North China Electric Power University, Beijing 102206, China
2
Institute of Science and Technology, China Three Gorges Corporation, Beijing 100038, China
3
Institute of Energy Power Innovation, North China Electric Power University, Beijing 102206, China
*
Author to whom correspondence should be addressed.
Energies 2025, 18(12), 3193; https://doi.org/10.3390/en18123193
Submission received: 20 May 2025 / Revised: 15 June 2025 / Accepted: 16 June 2025 / Published: 18 June 2025
(This article belongs to the Section B: Energy and Environment)

Abstract

:
Accurate photovoltaic (PV) power forecasting is essential to mitigating the security and stability challenges associated with PV integration into power grids. Ground-based sky images can quickly reveal cloud changes, and the spatiotemporal feature information extracted from these images can improve PV power forecasting. Therefore, this paper proposes a hybrid framework based on shifted windows Transformer (Swin Transformer), convolutional neural network, and long short-term memory network to comprehensively extract spatiotemporal feature information, including global spatial, local spatial, and temporal features, from ground-based sky images and PV power data. The mean absolute error and root mean squared error are reduced by 13.06% and 4.49% compared with ResNet-18. The experimental results indicate that the proposed framework demonstrates competitive predictive performance and generalization capability across different time horizons and weather conditions compared with benchmark frameworks.

1. Introduction

With increasing worries regarding energy shortages and global climate issues, the research and development of renewable energy have garnered significant global interest [1]. As a clean, safe, and sustainable energy source, solar energy is essential to meeting worldwide renewable energy demands, delivering substantial economic and environmental benefits. Currently, solar energy utilization technologies are primarily categorized into photovoltaics and solar thermal systems [2]. Among these, photovoltaics has quickly emerged as a leading technology. However, the inherent variability and intermittency of solar resources lead to fluctuating output from photovoltaic (PV) generation, which presents notable challenges to power grid security and stability [3]. These challenges include issues with voltage management, frequency stability, reverse power flow, and harmonic distortion. To address these grid-related challenges associated with PV integration, PV power forecasting models have increasingly emerged as a key research focus in solar energy [4]. Accurate and reliable PV power forecasting is essential to maximizing solar energy utilization, enhancing the economic performance of PV plants, and supporting efficient power market trading and grid operation scheduling [5].
The random fluctuations and intermittency of PV power arise from changing meteorological conditions [6]. PV power is influenced by multiple meteorological parameters, including irradiance, temperature, wind speed, and aerosol concentration [7,8]. Major fluctuations in PV power are primarily driven by cloud formation, movement, and dissipation [9]. This information can be obtained from both satellite imagery and ground-based sky images [
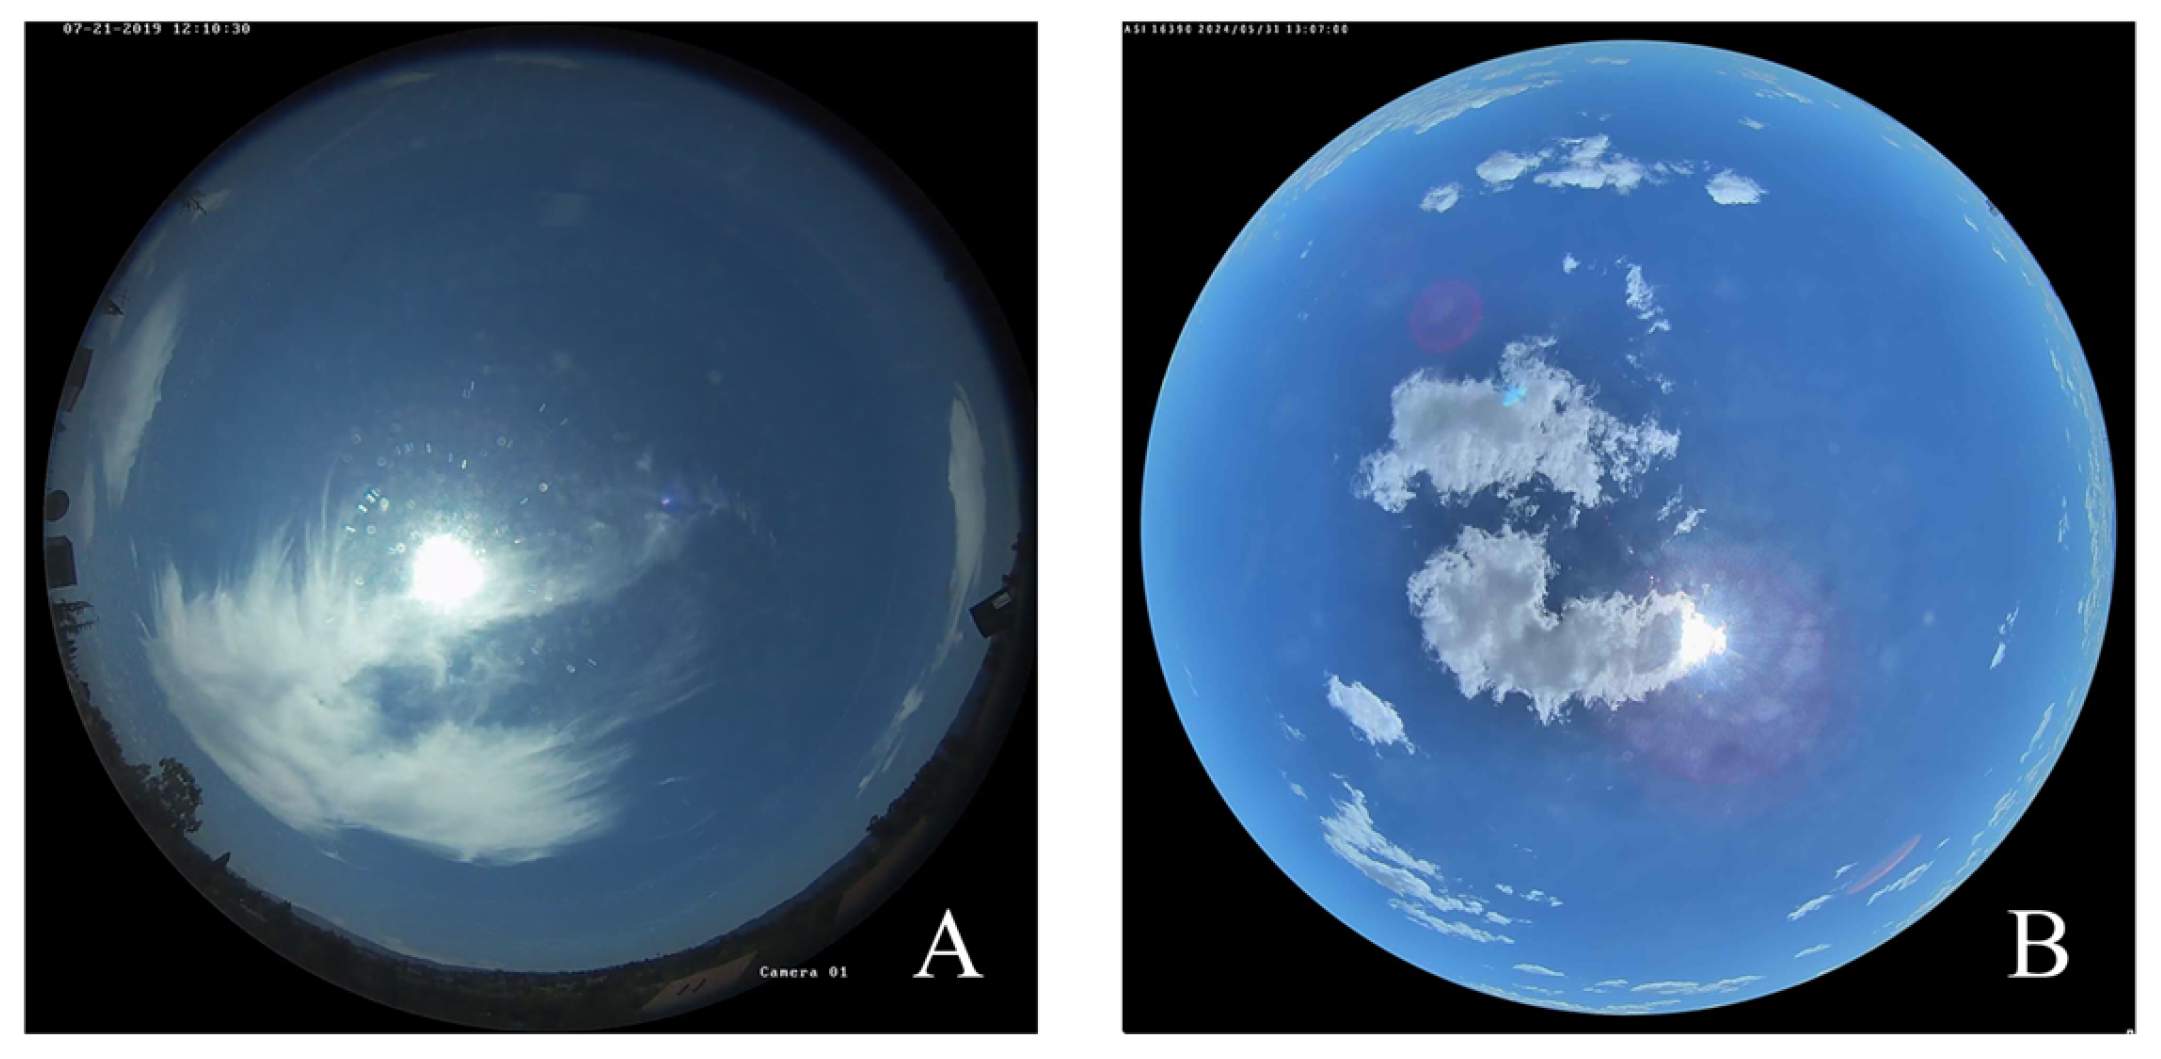
10]. Compared with the broad coverage provided by satellite images, ground-based sky images can quickly reveal cloud dynamics directly above the PV plant, offering crucial information for PV forecasting. Ground-based sky images provide detailed information about cloud spatial distribution, brightness, and shape [11]. Incorporating ground-based sky images into PV power forecasts can significantly improve predictive accuracy.
Currently, PV forecasting utilizing ground-based sky images is mainly divided into cloud motion vector (CMV) methods and deep learning approaches. CMV methods use sky images to predict the future distribution of clouds by accurately calculating key parameters, such as cloud matching [12], cloud cover index [13], and cloud motion displacement vectors [14,15]. These methods typically conduct PV forecasting through linear extrapolation [16]. Reference [17] utilized the Shi–Tomasi approach for detecting feature points and implemented Lucas–Kanade optical flow to monitor feature points throughout consecutive images. Subsequently, average cloud velocity and direction were determined through linear regression, and solar radiation was predicted using long short-term memory networks. Reference [18] proposed a two-stage cloud velocity estimation and classification framework that integrates algorithms for extracting and matching cloud image features, thereby enhancing the accuracy of PV power forecasts.
Deep learning methods are widely adopted for powerful nonlinear approximation capabilities and robust generalization abilities. Common deep learning architectures encompass convolutional neural networks (CNNs), recurrent neural networks (RNNs), long short-term memory (LSTM) networks, and gated recurrent units (GRUs) [19,20,21,22]. CNNs can effectively extract spatial features through local receptive fields and weight sharing, while RNNs and their variants are more adept at extracting temporal features [23]. Reference [24] employed residual networks (ResNets) and stacked sky images incorporating cloud motion spatiotemporal information to predict PV generation for the next 5 to 10 min without using additional time-series models. Reference [25] applied mathematical and physical methods to extract spatial features, which were then input into an LSTM model to estimate solar irradiance and predict PV power. However, the limited analysis of spatial or temporal features constrains the accuracy of these models. Three-dimensional convolutional neural networks (3D-CNNs) and convolutional LSTM (ConvLSTM) have been introduced to directly capture spatiotemporal features. Reference [26] developed two CNN-based architectures to process sky image sequences and suggested that traditional CNNs may not adequately capture temporal features. ConvLSTM incorporates convolutional operations within LSTM units for modeling. Reference [27] developed a ConvLSTM-based prediction model incorporating an attention mechanism within the decoder. This design fully utilizes the spatiotemporal correlations in regional photovoltaic generation to achieve rolling forecasts for regional PV power.
Owing to the pronounced volatility of PV power under changing meteorological conditions, using only a single model is insufficient to comprehensively capture the spatiotemporal feature information. To comprehensively extract the spatiotemporal feature information of sky images for PV power forecasting, CNN-LSTM architecture integrates a series of convolutional and LSTM layers, where the convolutional layers extract spatial features and input them to the LSTM network, which extracts complex features and captures irregular trends in the dataset [28]. Reference [29] introduced a dual-stream network combining CNNs and GRUs, which extract spatial and temporal features in parallel, followed by a self-attention mechanism to enhance forecasting performance. However, in deep learning methods, the exploration of spatial and temporal features within spatiotemporal feature information remains insufficient, indicating that further research is needed to enhance prediction performance.
The aforementioned studies primarily focus on extracting overall features from sky images and historical PV power. Insufficient spatiotemporal feature extraction impacts PV prediction performance. Spatial feature extraction is typically performed by CNNs through sliding window convolutions with small kernels. Under rapidly changing meteorological conditions, CNNs may only detect small-scale cloud movements and fail to capture large-scale cloud motion. Therefore, extracting both global and local features from spatial data is crucial to improving performance.
Transformers, known for their parallel computing capability and strong proficiency in modeling long-range dependencies, have demonstrated remarkable success in natural language processing [30]. Although Transformers have been applied to temporal feature extraction in PV forecasting, the potential of Vision Transformers for capturing global spatial features from sky images remains underexplored, especially in the extraction of deep detailed features at the edges of cloud masses. Therefore, introducing visual Transformers for the extraction of spatiotemporal feature would enhance the learning ability and generalizability of the framework.
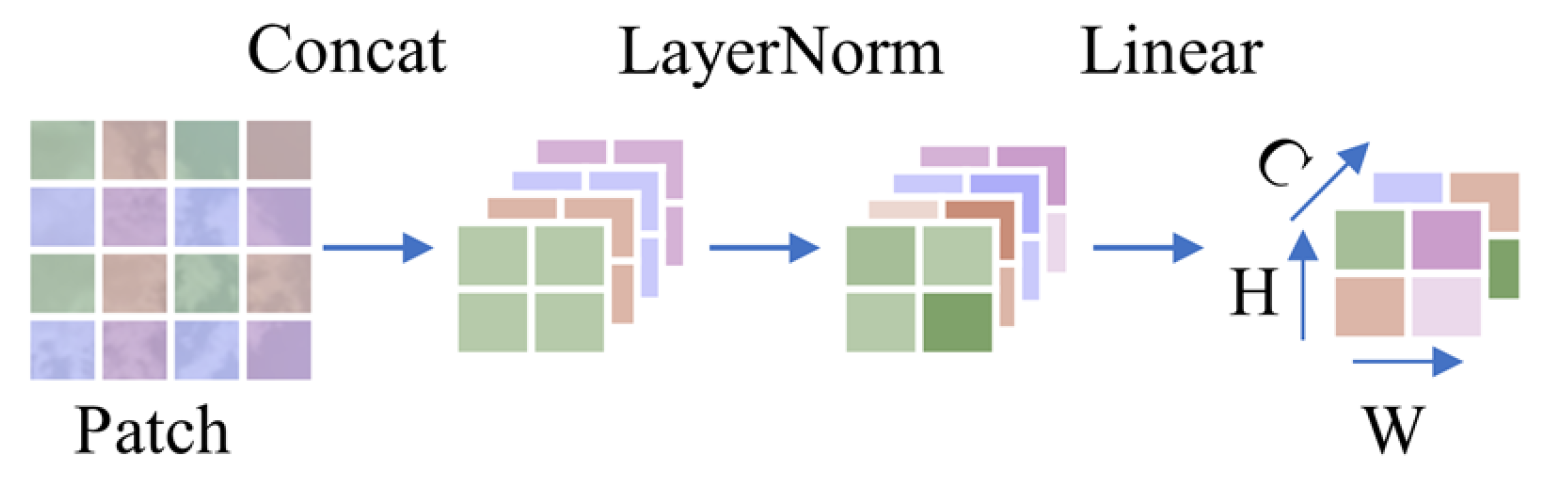
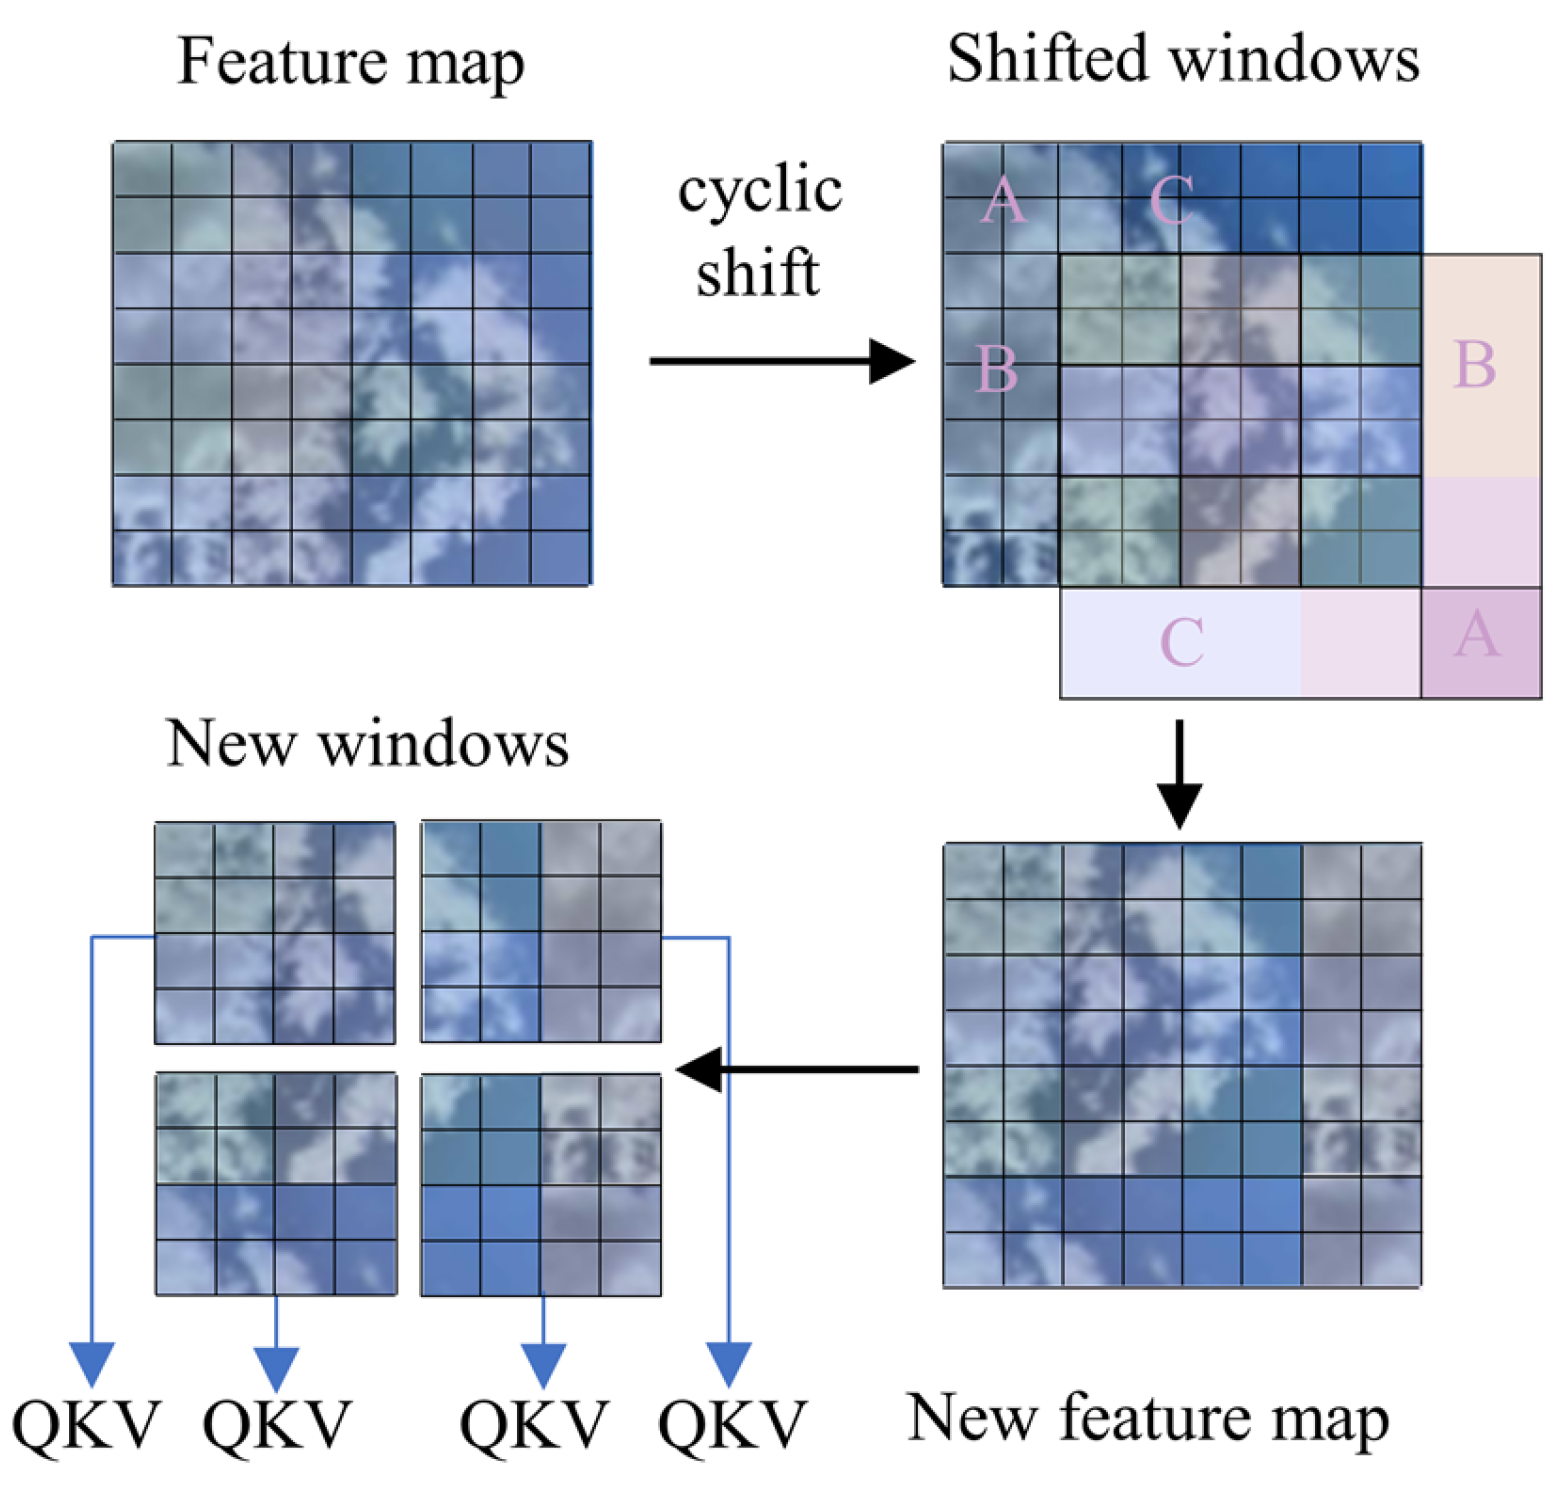
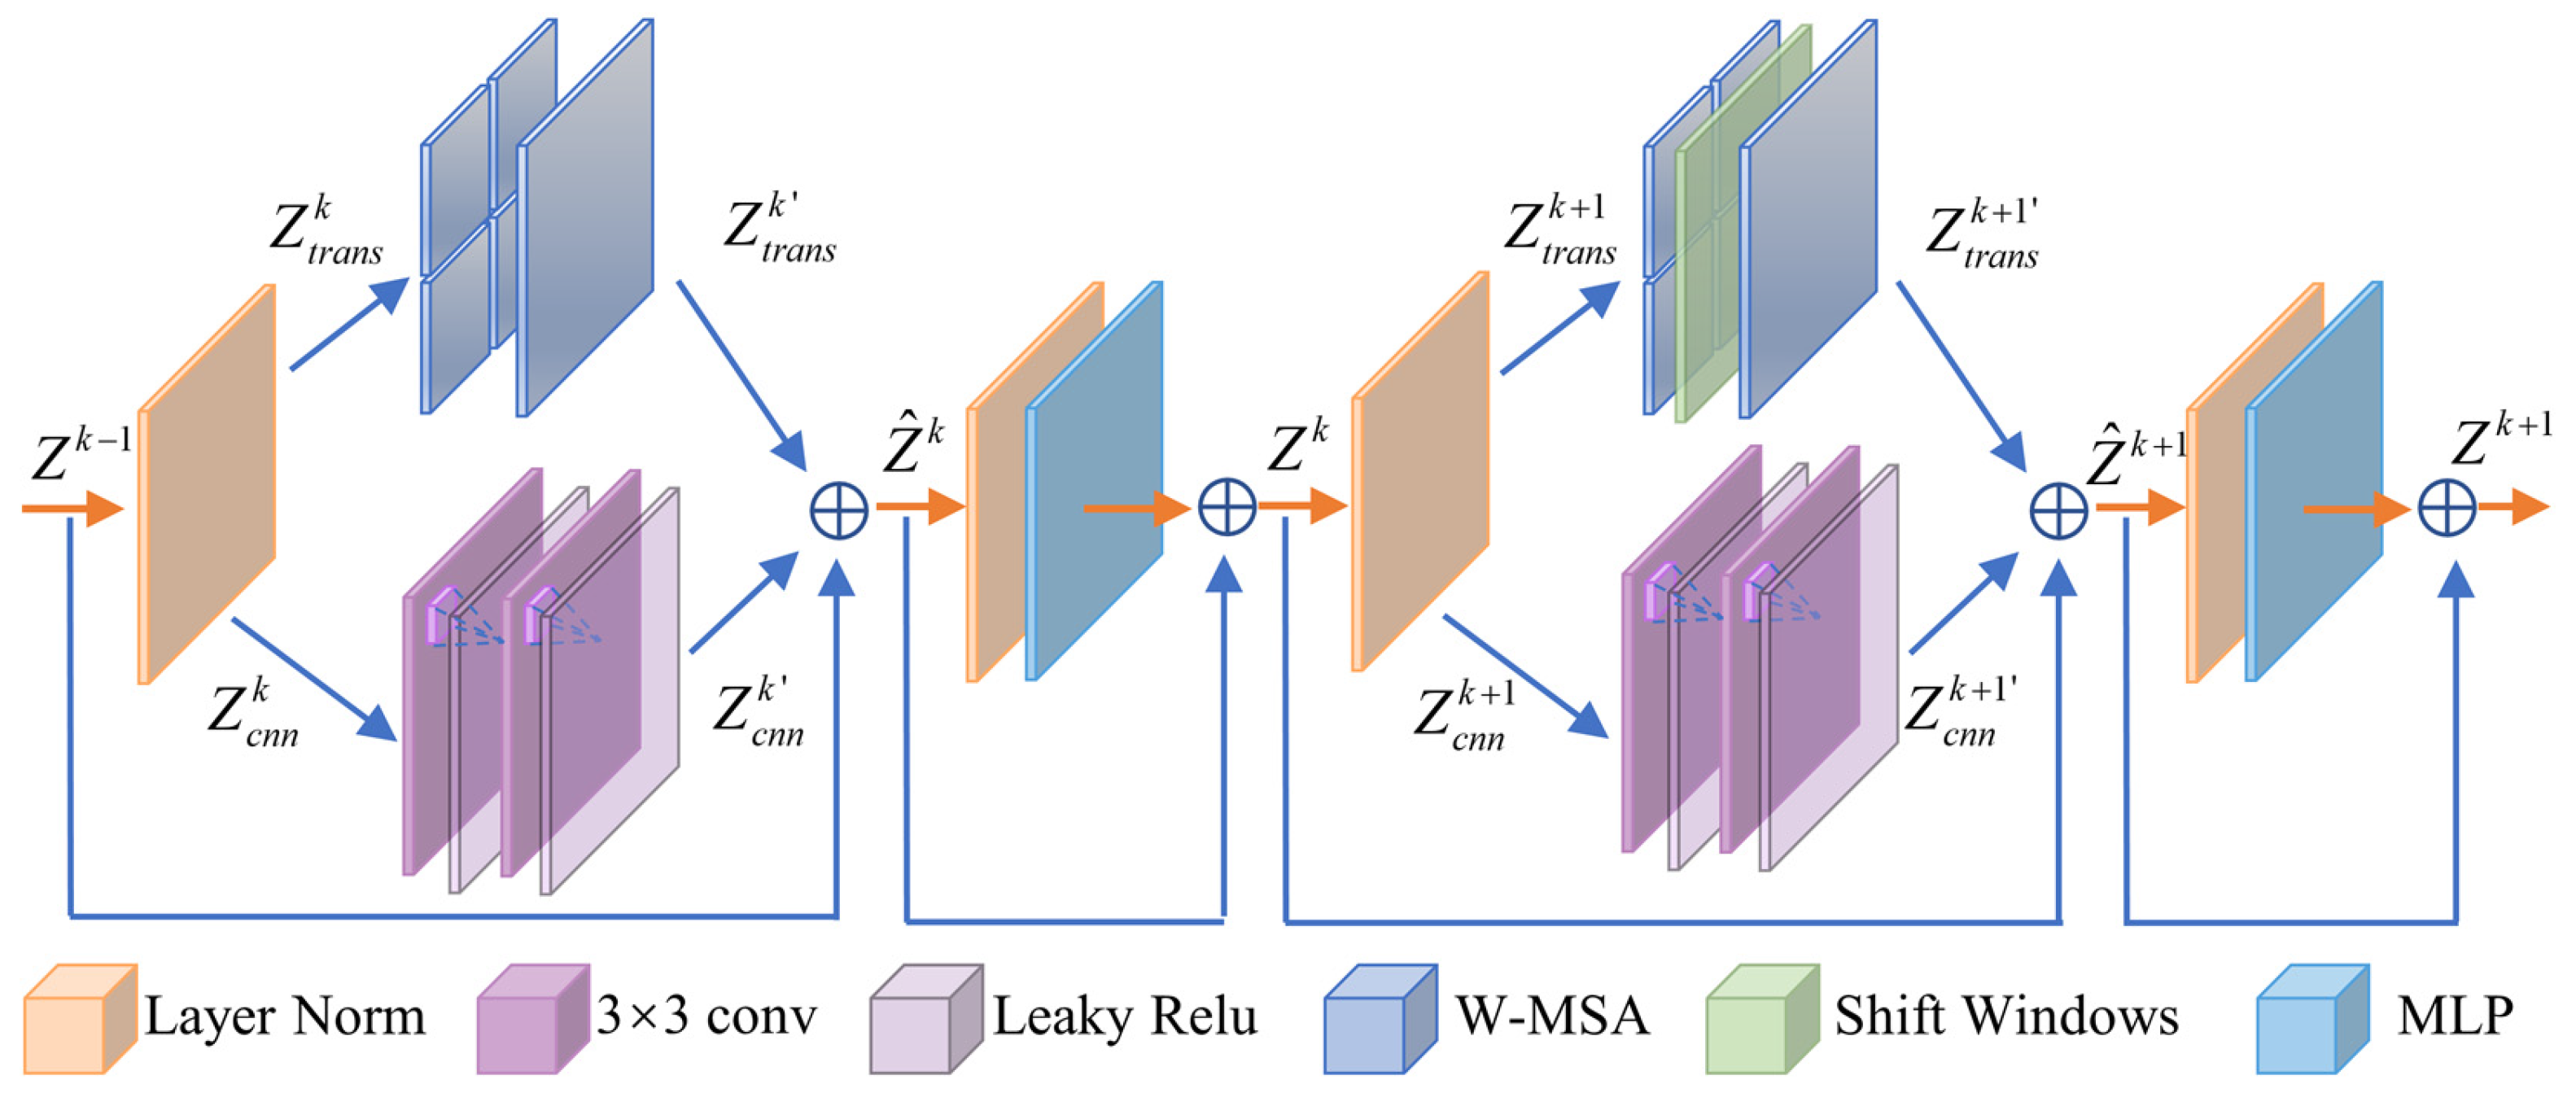
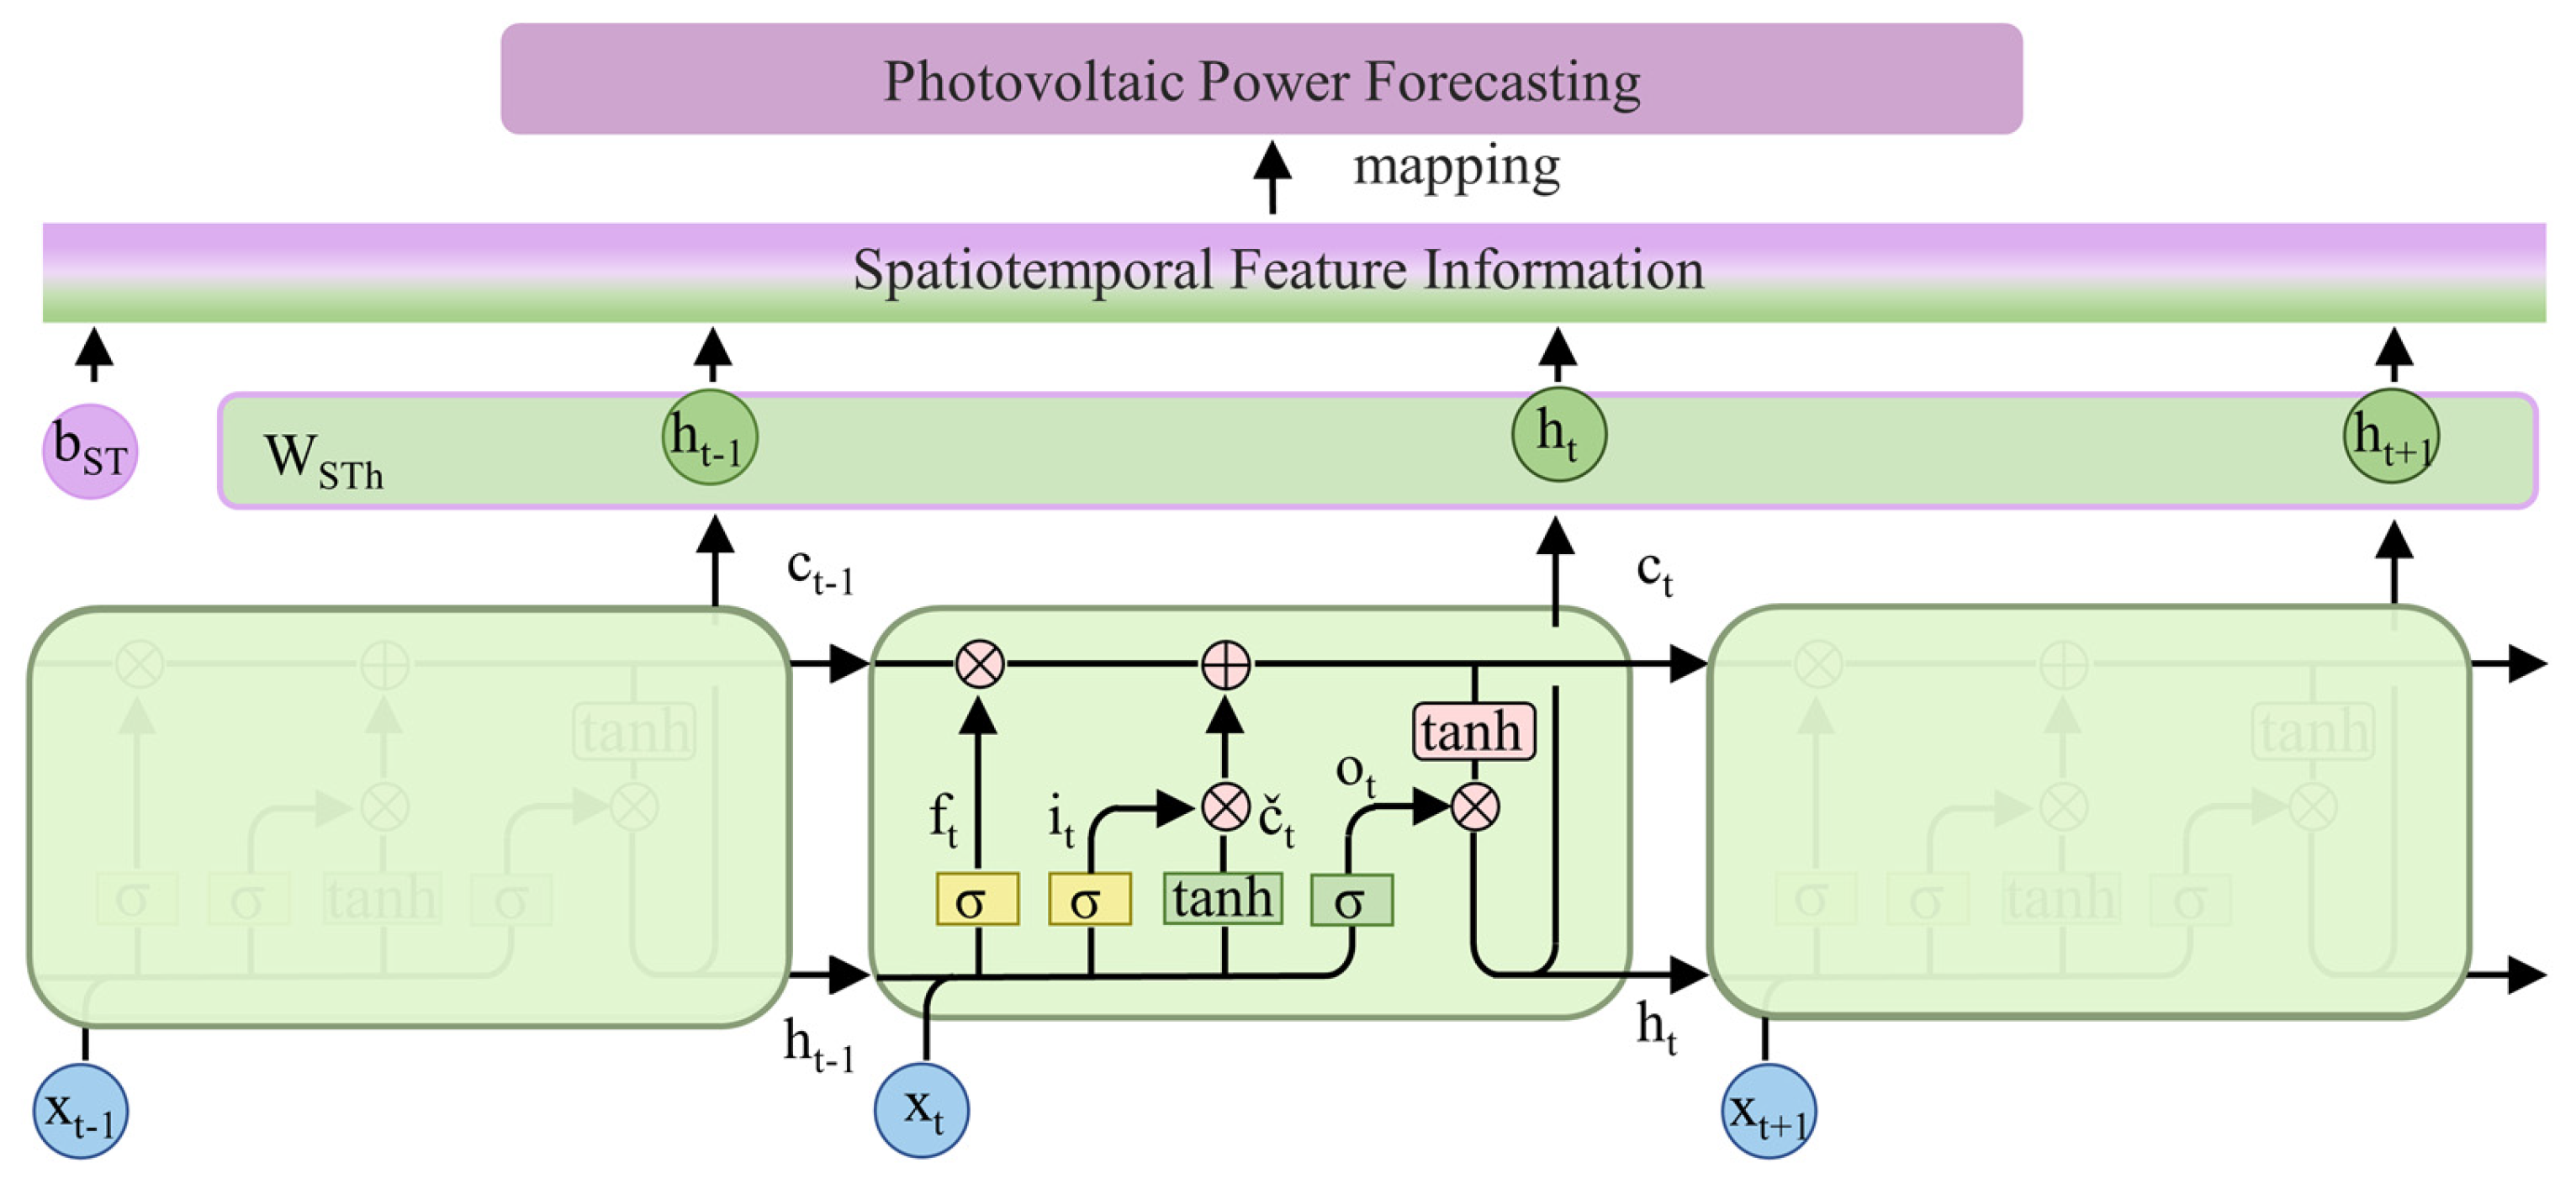
To address the limitations in existing approaches, this paper proposes a hybrid framework for spatiotemporal feature information extraction to improve forecasting accuracy. The proposed framework adopts a dual-stream backbone network with shifted windows Transformer (Swin Transformer) and a convolutional neural network (CNN) operating in parallel. First, the Swin Transformer–CNN backbone network extracts spatial features from ground-based sky image sequences, where Swin Transformer and the CNN capture global and local features in parallel and adaptively fuse them to form spatial features. Second, a long short-term memory network extracts temporal features from spatial feature sequences and historical PV power data, which are subsequently fused to construct comprehensive spatiotemporal feature information. Finally, this fused representation is mapped to PV power output for multi-step forecasting. The main contributions of this paper are summarized as follows:
  • A Swin Transformer–CNN–LSTM-based learning framework is proposed for image-driven PV power forecasting. The experimental results demonstrate that the proposed framework demonstrates strong performance across various prediction time horizons and weather conditions on benchmark datasets and exhibits good generalizability on lab datasets.
  • A spatial feature extraction module based on Swin Transformer and a CNN is designed to separately capture global and local spatial features from sky image sequences. These features are adaptively fused to form crucial spatial representations for accurate PV forecasting.
  • A spatiotemporal feature extraction module based on LSTM is developed to jointly learn temporal dynamics from both spatial feature sequences and PV power data, enabling the construction of rich spatiotemporal representations for forecasting.
The remainder of the paper is structured as follows: Section 2 details the methodology of the proposed framework. Section 3 presents the experiment and results. Section 4 presents the discussion. Section 5 concludes the paper.

2. Materials and Methods

This section provides an overview of the principles and components of the proposed framework; the prediction approach within the framework is formulated as follows:
P ^ L f = f P L x , I L x + 1 , θ P ^ L f = P ^ t + 1 , P ^ t + 2 , , P ^ t + L f P L x = P t L f + 1 , , P t 1 , P t I L x + 1 = I t L f + 1 , , I t 1 , I t , I t + 1
where P ^ L f represents the predicted PV power values with a dimension of L f , P L x denotes the sequence of historical PV power data with a length of L x , and I L x + 1 represents the sequences of RGB three-channel sky images with a length of L x + 1 . f and θ refer to the mapping function and the parameters used for model training, respectively. The framework is composed of two primary components, a spatial feature extraction module and temporal feature extraction with fusion, as shown in Figure 1. The first component extracts spatial features from sky images by using the Swin Transformer–CNN backbone network, where Swin Transformer captures global spatial features and the CNN captures local spatial features. The second component employs an LSTM network to capture temporal features from both the sequence of spatial features extracted from sky images and PV power data, followed by feature fusion. The resulting spatiotemporal feature information is used for the final PV power prediction.

2.1. Spatial Feature Extraction

2.1.1. Linear Embedding

Figure 2 illustrates the framework for extracting spatial features from sky images. Sky images are first processed through a patch partition module, which segments them into smaller patches. The patches are flattened in the channel-wise direction, and the channel data undergo a linear transformation in the linear embedding layer. To better capture the relationships between patches, relative positional encoding is embedded into each patch. The patches embedded with relative position encoding are input into the stage phase, where spatial features of sky images are extracted using an attention mechanism.

2.1.2. Patch Merging

In each stage (except for stage 1), a patch merging layer is employed to perform down-sampling on patches. As shown in Figure 3, pixels of similar colors within each patch are merged to generate four distinct feature maps. The feature maps are subsequently merged in the channel-wise direction and pass through layer normalization (LayerNorm) and a linear layer (Linear) to achieve normalization and linear transformation. After passing through the patch merging layer, the feature maps’ height and width are reduced by half, while the depth is doubled compared with the original patches. This process transforms the original patches into multi-channel feature maps, enabling parallel computation in the subsequent multi-head attention mechanism and reducing noise interference within the patches.

2.1.3. Shifted Windows Transformer

Scaled dot-product attention is a fundamental element of the Transformer model which enables us to effectively capture dependencies between any two patches in the sequence and integrate information globally. The scaled dot-product attention mechanism comprises three fundamental components, query (Q), key (K), and value (V) [31], with the corresponding computation being defined as follows:
Q = X W Q
K = X W K
V = X W V
where W Q , W K , and W V denote the weight matrices for query, key, and value. X denotes the patch embedded with relative positional information. The attention output vector is computed by performing the weighted sum of the value based on attention weights. The calculation formula is as follows:
Attention_Scores = Q K T d k
Attention_Weights = s o f t max Q K T d k
A t t e n t i o n ( Q , K , V ) = Attention_Weights · V
where d k represents the dimension of the key, the scaling factor 1 d k prevents the value from being too large, and s o f t max is a normalization function. The scaled dot-product attention process is provided in Figure 4.
To improve computational efficiency and generalizability, the proposed framework utilizes the multi-head self-attention (MSA) mechanism. Several independent heads simultaneously compute scaled dot-product attention. These outputs are then concatenated and subjected to a linear transformation to generate the final results. The multi-head attention process is shown in Figure 4. The relevant formulas are as follows:
h e a d i = A t t e n t i o n Q i , K i , V i
M u l t i h e a d Q , K , V = c o n c a t h e a d i , h e a d h · W O
where Q i , K i , and V i denote the query, key, and value of the i-th head; h represents the number of attention heads; c o n c a t denotes the concatenation operation; and W O is the output weight matrix, which reflects weights across each attention head.
The introduction of the windows multi-head self-attention (W-MSA) module aims to alleviate computational complexity and improve the model’s feature extraction capability. As illustrated in Figure 5, the conventional MSA module computes attention across all pixels of the entire feature map. In contrast, the W-MSA module partitions the feature map into several windows and then applies the multi-head self-attention operation independently to each window.
In the W-MSA module, MSA is restricted to each window, preventing information exchange between windows. The shifted windows multi-head self-attention (SW-MSA) module is introduced to enable cross-window feature interaction by shifting windows at the pixel level, thereby mitigating the limitations of W-MSA. Figure 6 demonstrates that the windows within feature map are shifted two pixels to the right and downward. To maintain consistency in window partitioning, the remaining part of the sliding window is filled with the original feature map beyond the sliding window. After the window shift, parts of regions B and C allow for information interaction between different windows in the vertical and horizontal directions. This process generates a new feature map and re-divides the windows, enabling cross-window MSA computation.

2.1.4. Swin Transformer–CNN Mixture Blocks

Figure 7 shows that the Swin Transformer–CNN mixture (STCM) blocks consist of layer normalization (LN), W-MSA, SW-MSA, multilayer perceptron (MLP), and the CNN. The stacked STCM blocks sequentially incorporate two module types: W-MSA and SW-MSA.
The Swin Transformer module proposed by Liu is used for image classification and achieves even better performance [32]. The primary distinction between the STCM module proposed in this paper and the Swin Transformer proposed by Liu is the integration of the CNN module in parallel at both ends of the (S)W-MSA module. This design allows for more comprehensive extraction of both global and local features from images [33]. In the first STCM module, the W-MSA module captures intra-window dependencies through windows multi-head self-attention, facilitating concentration on specific feature maps and extracting relevant information. The CNN module convolves the normalized feature maps to effectively capture local features. Subsequently, the result of the W-MSA and CNN fusion module is normalized through LN to stabilize and standardize the outputs of different samples. The MLP module performs multilayer nonlinear transformations to capture intricate patterns, enhancing the model’s adaptability and learning capability. The second STCM module follows a similar process, where the SW-MSA module captures inter-window dependencies. The LN and MLP modules are again applied for normalization and nonlinear relationship modeling. By stacking two consecutive STCM modules, this framework can comprehensively capture and integrate local, window, and global dependencies. Equations (10)–(17) detail the working mechanism of these two stacked consecutive STCM modules:
Z t r a n s k = W M S A L N Z k 1
Z c n n k = ϕ c o n v ϕ c o n v L N Z k 1
Z ^ k = α Z t r a n s k + 1 α Z c n n k + Z k 1
Z k = Z ^ k + M L P L N Z ^ k
Z t r a n s k + 1 = S W M S A L N Z k
Z c n n k + 1 = ϕ c o n v ϕ c o n v L N Z k
Z ^ k + 1 = β Z t r a n s k + 1 + 1 β Z c n n k + 1 + Z k
Z k + 1 = Z ^ k + 1 + M L P L N Z ^ k + 1
where Z t r a n s k , Z c n n k , Z ^ k , and Z k denote the output features of (S)W-MSA, the CNN, the (S)W-MSA and CNN fusion module, and the MLP module for block k. c o n v and ϕ represent the convolution operation and the leaky rectified linear unit activation function, respectively. Additionally, α and β are the weighting coefficients of Z t r a n s k and Z t r a n s k + 1 , respectively.

2.2. Temporal Feature Extraction and Fusion

Due to vanishing or exploding gradient issues when handling long sequences [34,35], RNNs struggle to effectively capture temporal feature relationships in long sequences. LSTM, a variant of the RNN, enables the network to selectively discard previous hidden states and replace them with new information through the use of memory units [36].
In the proposed framework, the LSTM network receives the spatial feature sequence extracted from sky images by the STCM blocks and the historical PV power sequence. The input to the LSTM network at time point t is represented as
x t = c o n c a t Z t , P t L x + 1 , P t L x + 2 , P t 1
where Z t represent the spatial feature from the STCM block at time point t and P t 1 denotes the historical PV power at time point t − 1. c o n c a t represents the concatenation operation. L x denotes the length of the time window, which helps prevent information leakage during training. As shown in Figure 8, an LSTM unit at time point t typically includes an input gate i t , a forget gate f t , an output gate o t , and a memory cell c t [35]. The corresponding calculations are presented as follows:
i t = σ W i x x t + W i h h t 1 + b i
f t = σ W f x x t + W f h h t 1 + b f
o t = σ W o x x t + W o h h t 1 + b o
c ^ t = φ W C x x t + W C h h t 1 + b C
c t = f t c t 1 + i t c ^ t
where σ and φ denote the sigmoid and hyperbolic tangent functions. W x and W h represent the weight matrices for the input and hidden states. b represents the corresponding bias vectors. By summing the weights of these hidden states, spatiotemporal feature information is extracted. These features are subsequently mapped to the PV power prediction via a fully connected layer. The specific calculations are as follows:
h t = o t φ c t
S T t = W S T h h t + b S T
P ^ t = ξ S T t
where h t and S T t denote the hidden state and spatiotemporal feature information at time point t. W S T h and b S T represent the weight matrix and the bias of the hidden state. ξ refers to a mapping operation of the fully connected layer. P ^ t denotes the PV power prediction.

3. Experiment and Results

3.1. Experimental Setting

This section outlines the experiment, conducted on a platform featuring an Intel Xeon 6330, 512 GB of RAM, and an NVIDIA A10 GPU. Python 3.9 and PyTorch 2.2.2 were used for implementation. For model training, the following hyperparameters were used: 50 epochs, a batch size of 128, and a learning rate of 0.001.

3.2. Data Sources

Dataset 1: This dataset contained quality-controlled sky images and PV power data collected at Stanford University (37.427° N, 22.174° W) in the USA from March 2017 to December 2019 [37]. The sky images captured with a 360-degree fisheye lens camera, have a temporal resolution of one minute, as shown in Figure 9A. PV power data were collected from a solar panel array with a rated capacity of 30.1 kW at a sampling frequency of one minute.
Dataset 2: This dataset contained sky images and PV power data collected at North China Electric Power University (39.921° N, 116.300° E) in China from March to August 2024. The sky images were captured using an ASI-16 all-sky imager (EKO, Tokyo, Japan), with a temporal resolution of one minute, as shown in Figure 9B. PV power data were recorded from a 10 kW solar panel array located approximately 140 m from the camera, with an azimuth of 196.00° and an inclination of 20.00°, with a sampling frequency of one second, as shown in Figure 10. Weather types were classified as sunny, cloudy, and overcast conditions based on the PV power curve and the amount of clouds in the sky images. The statistical shares of sunny, cloudy, and overcast days from March to August were 32%, 45%, and 23%, respectively.
After handling missing values and outliers, dataset 1 consisted of 76,423 samples, while dataset 2 contained 18,337 samples. To ensure effective training and robust validation, each dataset was split into training (80%), validation (10%), and test (10%) subsets, as shown in Table 1. Dataset 1 is primarily used for performance evaluation, while Dataset 2 is employed to assess the framework’s generalization capability.

3.3. Evaluation Metrics

The performance of the proposed framework was assessed using three commonly adopted metrics: mean absolute error (MAE), root mean squared error (RMSE), and the coefficient of determination (R2). These metrics are mathematically expressed as follows:
M A E = 1 N i = 1 N y ^ i y i
R M S E = 1 N i = 1 N y ^ i y i 2
R 2 = 1 i = 1 N y ^ y i 2 i = 1 N y ¯ y i 2
where N represents the sample size and y i , y ^ i , and y ¯ denote the actual PV power, the predicted PV power, and the mean of the actual PV power.

3.4. Benchmark Frameworks

Five deep learning frameworks were used as benchmarks for comparison: ResNet-18 [24], ConvLSTM [38], CNN-LSTM [28], Bi-level spatiotemporal network (BILST) [11], and ViT-GRU [39]. ResNet-18 is a framework with residual connections, batch normalization, and 3 × 3 convolutional filters. ConvLSTM incorporates convolutional operations into both input-to-state and state-to-state transitions, embedding convolution within the recurrent structure. CNN-LSTM combines CNN and LSTM layers, where the CNN extracts features that are fed into LSTM to capture complex patterns and trends. BILST is bi-level spatiotemporal network that utilizes attention-based modeling and residual structures. ViT-GRU combines Vision Transformer (ViT) for capturing spatial patterns from sky image sequences and GRUs for modeling temporal patterns from PV power data. Due to differences in datasets and training parameters, the benchmark frameworks are built based solely on the contributions provided by the authors in their work.

3.5. Results

3.5.1. Comparison of Different Horizons

According to the performance evaluation metrics, the comparison of different time horizons for the proposed framework and the benchmark frameworks mentioned in Section 3.3 are presented in Table 2. Considering the varying speeds of cloud movement under complex weather conditions [40], the prediction horizons are set to 5, 10, and 15 min. For the 5 min horizon, compared with ResNet-18, the MAE and RMSE of the proposed framework are reduced by 13.06% and 4.49%, and the R2 increases from 0.9490 to 0.9529. Compared with ConvLSTM, the MAE and RMSE of the proposed framework are reduced by 5.70% and 5.39%, and the R2 increases from 0.9476 to 0.9529. Compared with other complex frameworks, due to the insufficient extraction of spatiotemporal feature in other models, the proposed framework continues to demonstrate relatively superior performance.
As the prediction horizon lengthens, all frameworks face greater challenges in maintaining accuracy. As shown in Table 2, the MAE and RMSE of all frameworks increase as the prediction time horizon extends, while the R2 decreases correspondingly. The MAE (RMSE) of the proposed framework increases from 0.6755 (1.7146) kW at 5 min ahead to 1.0440 (2.3055) kW at 15 min ahead, and the R2 decreases from 0.9529 at 5 min ahead to 0.9138 at 15 min ahead. The proposed framework still demonstrates superior performance compared with the other five frameworks for the 10 min and 15 min prediction horizons. Figure 11 visualizes the radar plot comparing the evaluation metrics of all frameworks. With longer prediction horizons, the performance of ResNet-18 and ConvLSTM significantly decreases due to insufficient extraction of spatiotemporal features. Although CNN-LSTM, BILST, and ViT-GRU take spatiotemporal features into account, their respective framework structures constrain the information of these features to the local features, parallel features, and global features, resulting in significant discrepancies in the spatiotemporal feature information required for subsequent weather models over longer prediction time horizons. Therefore, the proposed framework comprehensively extracts spatiotemporal feature information that includes local and global features of sky images and PV power data, thereby maximizing its performance across different prediction time horizons.

3.5.2. Comparison of Different Weather Conditions

Apart from evaluating metrics across different prediction time horizons, the performance of all frameworks under various weather conditions is also assessed. Based on cloud cover and the clear sky index from ground-based sky images [41], the weather conditions are classified into three types: sunny, cloudy, and overcast. Table 3 summarizes the evaluation metrics of all frameworks across different weather conditions at a 5 min prediction horizon. Each framework performs well under sunny conditions, while the performance of the various benchmark frameworks differs under cloudy and overcast conditions. ConvLSTM demonstrates strong performance compared with other benchmark frameworks under sunny conditions. The BILST and ViT-GRU frameworks outperform the other benchmark frameworks under cloudy conditions, while the CNN-LSTM, BILST, and ViT-GRU frameworks show better performance than ResNet-18 and ConvLSTM. This reveals that cloud variations increase the difficulty of PV power forecasting and may indicate that a single model may struggle to capture cloud dynamics effectively. Additionally, the proposed framework demonstrates competitive performance under three weather conditions, with MAE and RMSE of 0.3102 (0.8497) kW and 0.9054 (2.0357) kW2 under cloudy (overcast) conditions, respectively. Table 4 shows the paired t-test performance comparing all the frames under different weather conditions. In the paired t-test, the absolute values of the t-statistics of the proposed framework under cloudy and overcast conditions are greater than those of other benchmarks, and the p-values remain in a small range, which implies that the proposed framework has competitive stability and robustness.
As illustrated in Figure 12, under sunny conditions, the scatter plot of the proposed framework’s output and PV actual power mainly falls on the fitting line. Under cloudy and overcast conditions, the distribution of the scatter points is mainly concentrated around the fitting line. These results demonstrate the superior predictive capability of the proposed framework. This is mainly because it can fully extract the potential key spatiotemporal feature information from sky image sequences and PV power data, thereby sustaining robust predictive performance under rapidly changing and complex cloudy or overcast weather conditions.
Figure 13, Figure 14 and Figure 15 present the prediction curves of all frameworks across different weather conditions. Under sunny conditions, all frameworks closely match the actual PV power. However, under cloudy and overcast conditions, other benchmark frameworks show varying levels of performance. Additionally, the proposed framework effectively reflects the direction of PV power changes in a timely manner, and the errors remains competitive enough compared with other benchmark frameworks.

4. Discussion

4.1. Interpretation of Spatiotemporal Feature Information

The proposed framework was rigorously validated for both accuracy and robustness in the previous sections. To further explore its working principles, attention mechanism heatmaps are introduced to visualize the spatiotemporal feature information. Figure 16 shows the original sky images and the corresponding spatiotemporal features extracted by the proposed framework. Specifically, the sequence of original images shows clouds moving toward the lower left from moment t-4 to moment t, partially obscuring the sun. In sky images, the pixels around the sun are close to white (255, 255, 255), and there can be a large difference between the cloud edges and the sky. The proposed framework performs fusion at the whole image, window level and convolution kernel range computation, so the proposed framework is able to pay more attention to the regions near the clouds and the sun. The attention heatmaps highlight the sun and surrounding clouds (red areas indicate higher attention scores), demonstrating that the proposed framework effectively captures cloud motion in ground-based sky images. Therefore, it efficiently utilizes spatiotemporal features from sky images and PV power data to enhance prediction performance.

4.2. Ablation Study

To highlight the importance of adequately extracting spatiotemporal feature information in PV power prediction accuracy, Table 5 presents an evaluation of each component’s contribution to the proposed framework. Using only a CNN for local features or only Swin Transformer for global features results in lower prediction performance compared with the dual-stream network combining both in parallel. This indicates that integrating local and global features enhances prediction accuracy. Compared with the proposed framework, removing only the CNN decreases framework performance by 23.59%, and removing only Swin Transformer decreases performance by 50.67%. Swin Transformer outperforms the CNN, suggesting that global features are more effective in improving accuracy. In comparison with the framework without LSTM, the proposed framework reduces the MAE (RMSE) from 0.5116 (1.3371) kW to 0.4170 (1.2924) kW and increases the R2 from 0.9714 to 0.9732. These results confirm the effectiveness of spatiotemporal feature information in PV power prediction, capturing the relationship between the sun, cloud patterns, and PV power more effectively than spatial features alone. Thus, each component of the proposed framework is crucial to enhanced performance.

4.3. Generalizability Analysis

The proposed framework was thoroughly evaluated in the previous sections and demonstrated strong performance on dataset 1. To assess its generalization ability and robustness, the framework’s performance was tested on dataset 2. Despite both datasets being located at similar latitudes, their climates differ significantly. Due to the smaller sample size and shorter data collection period of dataset 2, performance across all frameworks slightly decreased, as shown in Table 6. Hybrid frameworks like CNN-LSTM, BILST, and ViT-GRU, compared with single models like ResNet-18 and ConvLSTM, adapt better to new data, indicating stronger generalizability. BILST and ViT-GRU exhibit strong performance, but the proposed framework still maintained consistent prediction accuracy. This confirms that the proposed framework offers optimal performance and superior generalizability across diverse regions and climates.

4.4. Limitations and Future Works

The experimental results indicate that the proposed framework demonstrates robust predictive accuracy and generalization ability, but there are still some challenges to overcome. First, due to data collection limitations, the framework only extracts spatiotemporal feature information from sky image sequences and PV power data. Second, although attention mechanism heatmaps provide some visualization of the extracted features, its interpretability remains inferior to that of physical models. In addition, the performance and generalization capability of the framework are limited not only by the collection of data types and the interpretability of the model but also by the risk of overfitting the model, the imbalance of the various components in the dataset, and the limited geographic diversity of the datasets. Therefore, future research may integrate other available data (e.g., meteorological data, cloud coverage, cloud height, cloud transmittance, aerosol concentration, etc.) for multimodal learning to enhance prediction performance. To improve model interpretability, explainable models or interpretability modules could be incorporated into deep learning models, including visualization, descriptive statistics, feature engineering and selection, and model diagnostics [42,43,44]. Reference [45] provides the interpretable multi-source forecasting of electrical load and solar power generation through principal component analysis and state transfer matrix. Reference [46] combines PV generation, global horizontal irradiance, and infrared spectral images for multimodal learning using deep canonical correlation analysis. Understanding how the framework intuitively learns spatiotemporal feature information will also be a key focus of future work.

5. Conclusions

This paper proposes a Swin Transformer–CNN–LSTM network to fully extract spatiotemporal feature information from ground-based sky images and PV power data. Swin Transformer and the CNN extract global and local features in parallel from sky images and adaptively fuse them to form spatial features. The LSTM network is employed to extract temporal features from both spatial feature sequences and PV power data, which are then fused to form spatiotemporal feature information, which is subsequently mapped to PV power for multi-step forecasting. For the 5 min horizon, the MAE and RMSE of the proposed framework are reduced by 13.06% and 4.49% compared with ResNet-18. Compared with ConvLSTM, the MAE and RMSE of the proposed framework are reduced by 5.70% and 5.39%, and the R2 increases from 0.9476 to 0.9529. The proposed framework demonstrates competitive performance under three weather conditions, with MAE and RMSE of 0.3102 (0.8497) kW and 0.9054 (2.0357) kW2 under cloudy (overcast) conditions, respectively. The experimental results indicate that the proposed framework demonstrates competitive prediction performance compared with benchmark frameworks across different time horizons and weather conditions and exhibits excellent generalizability and robustness in generalizability experiments. Meanwhile, the visualization heatmaps of the spatiotemporal feature information highlight the sun and surrounding clouds and reveal that the proposed framework successfully captures the movement of clouds in ground-based sky images, enhancing PV forecasting performance. Additionally, the ablation study confirms the contribution of each component in the proposed framework to enhancing prediction performance. The generalizability analysis confirms that the proposed framework offers optimal performance and superior generalizability across diverse regions and climates.

Author Contributions

Conceptualization, J.S.; methodology, P.T.; software, Y.S.; validation, W.Z.; formal analysis, W.Z.; investigation, Q.W.; resources, L.Z.; data curation, L.Z.; writing—original draft preparation, P.T.; writing—review and editing, P.T.; visualization, Q.W.; supervision, L.Z.; project administration, Y.S.; funding acquisition, J.S. All authors have read and agreed to the published version of the manuscript.

Funding

This work was supported by China Three Gorges Corporation (No. 202103368).

Data Availability Statement

All data that support the findings of this study are available upon reasonable request.

Conflicts of Interest

Authors Ying Su and Qian Wang were employed by the company China Three Gorges Corporation. The remaining authors declare that the research was conducted in the absence of any commercial or financial relationships that could be construed as a potential conflict of interest.

Abbreviations

The following abbreviations are used in this manuscript:
PVphotovoltaic
Swinshifted windows
CNNconvolutional neural networks
ConvLSTMconvolutional LSTM
W-MSAwindows multi-head self-attention
SW-MSAshifted windows multi-head self-attention
STCMSwin Transformer–CNN mixture
LSTMlong short-term memory

References

  1. Kabir, E.; Kumar, P.; Kumar, S.; Adelodun, A.A.; Kim, K.H. Solar energy: Potential and future prospects. Renew. Sustain. Energy Rev. 2018, 82, 894–900. [Google Scholar] [CrossRef]
  2. Herrando, M.; Markides, C.N. Hybrid PV and solar-thermal systems for domestic heat and power provision in the UK: Techno-economic considerations. Appl. Energy 2016, 161, 512–532. [Google Scholar] [CrossRef]
  3. Shivashankar, S.; Mekhilef, S.; Mokhlis, H.; Karimi, M. Mitigating methods of power fluctuation of photovoltaic (PV) sources—A review. Renew. Sustain. Energy Rev. 2016, 59, 1170–1184. [Google Scholar] [CrossRef]
  4. Gupta, A.K.; Singh, R.K. A review of the state of the art in solar photovoltaic output power forecasting using data-driven models. Electr. Eng. 2024, 107, 4727–4770. [Google Scholar] [CrossRef]
  5. Pierro, M.; Perez, R.; Perez, M.; Prina, M.G.; Moser, D.; Cornaro, C. Italian protocol for massive solar integration: From solar imbalance regulation to firm 24/365 solar generation. Renew. Energy 2021, 169, 425–436. [Google Scholar] [CrossRef]
  6. Zepter, J.M.; Weibezahn, J. Unit commitment under imperfect foresight—The impact of stochastic photovoltaic generation. Appl. Energy 2019, 243, 336–349. [Google Scholar] [CrossRef]
  7. Niu, Y.; Su, Y.; Tang, P.; Wang, Q.; Sun, Y.; Song, J. Estimation of Solar Irradiance Under Cloudy Weather Based on Solar Radiation Model and Ground-Based Cloud Image. Energies 2025, 18, 757. [Google Scholar] [CrossRef]
  8. Yang, D.; Wang, W.; Gueymard, C.A.; Hong, T.; Kleissl, J.; Huang, J.; Perez, M.J.; Perez, R.; Bright, J.M.; Xia, X.A.; et al. A review of solar forecasting, its dependence on atmospheric sciences and implications for grid integration: Towards carbon neutrality. Renew. Sustain. Energy Rev. 2022, 161, 112348. [Google Scholar] [CrossRef]
  9. Kreuwel, F.P.M.; Knap, W.H.; Visser, L.R.; van Sark, W.G.J.H.M.; Vilà-Guerau de Arellano, J.; van Heerwaarden, C.C. Analysis of high frequency photovoltaic solar energy fluctuations. Sol. Energy 2020, 206, 381–389. [Google Scholar] [CrossRef]
  10. Scheck, L.; Weissmann, M.; Mayer, B. Efficient Methods to Account for Cloud-Top Inclination and Cloud Overlap in Synthetic Visible Satellite Images. J. Atmos. Ocean. Technol. 2018, 35, 665–685. [Google Scholar] [CrossRef]
  11. Zhang, R.; Ma, H.; Saha, T.K.; Zhou, X. Photovoltaic Nowcasting With Bi-Level Spatio-Temporal Analysis Incorporating Sky Images. IEEE Trans. Sustain. Energy 2021, 12, 1766–1776. [Google Scholar] [CrossRef]
  12. Hu, K.; Cao, S.; Wang, L.; Li, W.; Lv, M. A new ultra-short-term photovoltaic power prediction model based on ground-based cloud images. J. Clean. Prod. 2018, 200, 731–745. [Google Scholar] [CrossRef]
  13. Park, S.; Kim, Y.; Ferrier, N.J.; Collis, S.M.; Sankaran, R.; Beckman, P.H. Prediction of Solar Irradiance and Photovoltaic Solar Energy Product Based on Cloud Coverage Estimation Using Machine Learning Methods. Atmosphere 2021, 12, 395. [Google Scholar] [CrossRef]
  14. Paulescu, M.; Blaga, R.; Dughir, C.; Stefu, N.; Sabadus, A.; Calinoiu, D.; Badescu, V. Intra-hour PV power forecasting based on sky imagery. Energy 2023, 279, 128135. [Google Scholar] [CrossRef]
  15. Kamadinata, J.O.; Ken, T.L.; Suwa, T. Sky image-based solar irradiance prediction methodologies using artificial neural networks. Renew. Energy 2019, 134, 837–845. [Google Scholar] [CrossRef]
  16. Wang, F.; Zhen, Z.; Liu, C.; Mi, Z.; Hodge, B.-M.; Shafie-khah, M.; Catalão, J.P.S. Image phase shift invariance based cloud motion displacement vector calculation method for ultra-short-term solar PV power forecasting. Energy Convers. Manag. 2018, 157, 123–135. [Google Scholar] [CrossRef]
  17. Eşlik, A.H.; Akarslan, E.; Hocaoğlu, F.O. Short-term solar radiation forecasting with a novel image processing-based deep learning approach. Renew. Energy 2022, 200, 1490–1505. [Google Scholar] [CrossRef]
  18. Wang, Y.; Wang, X.; Hao, D.; Sang, Y.; Xue, H.; Mi, Y. Combined ultra-short-term prediction method of PV power considering ground-based cloud images and chaotic characteristics. Sol. Energy 2024, 274, 112597. [Google Scholar] [CrossRef]
  19. Barancsuk, L.; Groma, V.; Günter, D.; Osán, J.; Hartmann, B. Estimation of Solar Irradiance Using a Neural Network Based on the Combination of Sky Camera Images and Meteorological Data. Energies 2024, 17, 438. [Google Scholar] [CrossRef]
  20. Ren, X.; Zhang, F.; Sun, Y.; Liu, Y. A Novel Dual-Channel Temporal Convolutional Network for Photovoltaic Power Forecasting. Energies 2024, 17, 698. [Google Scholar] [CrossRef]
  21. Pei, J.; Dong, Y.; Guo, P.; Wu, T.; Hu, J. A Hybrid Dual Stream ProbSparse Self-Attention Network for spatial–temporal photovoltaic power forecasting. Energy 2024, 305, 132152. [Google Scholar] [CrossRef]
  22. Zhen, Z.; Liu, J.; Zhang, Z.; Wang, F.; Chai, H.; Yu, Y.; Lu, X.; Wang, T.; Lin, Y. Deep Learning Based Surface Irradiance Mapping Model for Solar PV Power Forecasting Using Sky Image. IEEE Trans. Ind. Appl. 2020, 56, 3385–3396. [Google Scholar] [CrossRef]
  23. Tian, C.; Yuan, Y.; Zhang, S.; Lin, C.W.; Zuo, W.; Zhang, D. Image super-resolution with an enhanced group convolutional neural network. Neural Netw. 2022, 153, 373–385. [Google Scholar] [CrossRef]
  24. Wen, H.; Du, Y.; Chen, X.; Lim, E.; Wen, H.; Jiang, L.; Xiang, W. Deep Learning Based Multistep Solar Forecasting for PV Ramp-Rate Control Using Sky Images. IEEE Trans. Ind. Inform. 2021, 17, 1397–1406. [Google Scholar] [CrossRef]
  25. Chu, T.-P.; Guo, J.-H.; Leu, Y.-G.; Chou, L.-F. Estimation of solar irradiance and solar power based on all-sky images. Sol. Energy 2023, 249, 495–506. [Google Scholar] [CrossRef]
  26. Feng, C.; Zhang, J.; Zhang, W.; Hodge, B.-M. Convolutional neural networks for intra-hour solar forecasting based on sky image sequences. Appl. Energy 2022, 310, 118438. [Google Scholar] [CrossRef]
  27. Gong, D.; Chen, N.; Ji, Q.; Tang, Y.; Zhou, Y. Multi-scale regional photovoltaic power generation forecasting method based on sequence coding reconstruction. Energy Rep. 2023, 9, 135–143. [Google Scholar] [CrossRef]
  28. Agga, A.; Abbou, A.; Labbadi, M.; El Houm, Y. Short-term self consumption PV plant power production forecasts based on hybrid CNN-LSTM, ConvLSTM models. Renew. Energy 2021, 177, 101–112. [Google Scholar] [CrossRef]
  29. Khan, Z.A.; Hussain, T.; Baik, S.W. Dual stream network with attention mechanism for photovoltaic power forecasting. Appl. Energy 2023, 338, 120916. [Google Scholar] [CrossRef]
  30. Zheng, W.; Lu, S.; Yang, Y.; Yin, Z.; Yin, L. Lightweight transformer image feature extraction network. PeerJ Comput. Sci. 2024, 10, e1755. [Google Scholar] [CrossRef]
  31. Ashish Vaswani, N.S.; Parmar, N.; Uszkoreit, J.; Jones, L.; Gomez, A.N.; Kaiser, Ł.; Polosukhin, I. Attention Is All You Need. In Proceedings of the 31st International Conference on Neural Information Processing Systems (NIPS’17), Long Beach, CA, USA, 4–9 December 2017; pp. 6000–6010. [Google Scholar]
  32. Liu, Z.; Lin, Y.; Cao, Y.; Hu, H.; Wei, Y.; Zhang, Z.; Lin, S.; Guo, B. Swin Transformer: Hierarchical Vision Transformer using Shifted Windows. In Proceedings of the 2021 IEEE/CVF International Conference on Computer Vision (ICCV), Montreal, QC, Canada, 10–17 October 2021; pp. 9992–10002. [Google Scholar]
  33. Xu, Y.; Wang, X.; Zhang, H.; Lin, H. SE-Swin: An improved Swin-Transfomer network of self-ensemble feature extraction framework for image retrieval. IET Image Process. 2023, 18, 13–21. [Google Scholar] [CrossRef]
  34. Gers, F.A.; Schmidhuber, J.; Cummins, F. Learning to forget: Continual prediction with LSTM. In Proceedings of the 1999 Ninth International Conference on Artificial Neural Networks ICANN 99. (Conf. Publ. No. 470), Edinburgh, UK, 7–10 September 1999; Volume 2, pp. 850–855. [Google Scholar]
  35. Hochreiter, S.; Schmidhuber, J. Long short-term memory. Neural Comput. 1997, 9, 1735–1780. [Google Scholar] [CrossRef] [PubMed]
  36. Shu, X.; Tang, J.; Qi, G.J.; Liu, W.; Yang, J. Hierarchical Long Short-Term Concurrent Memory for Human Interaction Recognition. IEEE Trans. Pattern Anal. Mach. Intell. 2021, 43, 1110–1118. [Google Scholar] [CrossRef] [PubMed]
  37. Nie, Y.; Li, X.; Scott, A.; Sun, Y.; Venugopal, V.; Brandt, A. SKIPP’D: A SKy Images and Photovoltaic Power Generation Dataset for short-term solar forecasting. Sol. Energy 2023, 255, 171–179. [Google Scholar] [CrossRef]
  38. Paletta, Q.; Arbod, G.; Lasenby, J. Benchmarking of deep learning irradiance forecasting models from sky images—An in-depth analysis. Sol. Energy 2021, 224, 855–867. [Google Scholar] [CrossRef]
  39. Xu, S.; Zhang, R.; Ma, H.; Ekanayake, C.; Cui, Y. On vision transformer for ultra-short-term forecasting of photovoltaic generation using sky images. Sol. Energy 2024, 267, 112203. [Google Scholar] [CrossRef]
  40. Rodríguez-Benítez, F.J.; López-Cuesta, M.; Arbizu-Barrena, C.; Fernández-León, M.M.; Pamos-Ureña, M.Á.; Tovar-Pescador, J.; Santos-Alamillos, F.J.; Pozo-Vázquez, D. Assessment of new solar radiation nowcasting methods based on sky-camera and satellite imagery. Appl. Energy 2021, 292, 116838. [Google Scholar] [CrossRef]
  41. Gao, M.; Li, J.; Hong, F.; Long, D. Day-ahead power forecasting in a large-scale photovoltaic plant based on weather classification using LSTM. Energy 2019, 187, 115838. [Google Scholar] [CrossRef]
  42. Zhou, H.; Zheng, P.; Dong, J.; Liu, J.; Nakanishi, Y. Interpretable feature selection and deep learning for short-term probabilistic PV power forecasting in buildings using local monitoring data. Appl. Energy 2024, 376, 124271. [Google Scholar] [CrossRef]
  43. Xiao, Z.; Gao, B.; Huang, X.; Chen, Z.; Li, C.; Tai, Y. An interpretable horizontal federated deep learning approach to improve short-term solar irradiance forecasting. J. Clean. Prod. 2024, 436, 140585. [Google Scholar] [CrossRef]
  44. Huang, S.; Zhou, Q.; Shen, J.; Zhou, H.; Yong, B. Multistage spatio-temporal attention network based on NODE for short-term PV power forecasting. Energy 2024, 290, 130308. [Google Scholar] [CrossRef]
  45. Wang, H.; Mao, L.; Zhang, H.; Wu, Q. Multi-prediction of electric load and photovoltaic solar power in grid-connected photovoltaic system using state transition method. Appl. Energy 2024, 353, 122138. [Google Scholar] [CrossRef]
  46. Wang, K.; Shan, S.; Dou, W.; Wei, H.; Zhang, K. A Robust Photovoltaic Power Forecasting Method Based on Multimodal Learning Using Satellite Images and Time Series. IEEE Trans. Sustain. Energy 2025, 16, 970–980. [Google Scholar] [CrossRef]
Figure 1. Illustration of proposed framework for PV power prediction.
Energies 18 03193 g001
Figure 2. The framework for extracting spatial features from sky images.
Energies 18 03193 g002
Figure 3. The framework of the patch merging layer.
Energies 18 03193 g003
Figure 4. Scaled dot-product attention and multinomial self-attention.
Energies 18 03193 g004
Figure 5. Processes of conventional MSA and W-MSA modules.
Energies 18 03193 g005
Figure 6. Process of shifted windows multi-head self-attention.
Energies 18 03193 g006
Figure 7. The composition of Swin Transformer–CNN mixture blocks.
Energies 18 03193 g007
Figure 8. The spatiotemporal feature information extraction framework based on the LSTM network.
Energies 18 03193 g008
Figure 9. Photos of ground-based sky images ((A) Sky image captured in Stanford at 12:10:30, 21 July 2019. (B) Sky image captured at North China Electric Power University at 13:07:00, 31 May 2024).
Energies 18 03193 g009
Figure 10. Photos of research equipment ((A) Distribution of the all-sky imager and the studied PV panel locations. (B) Installation environment of the all-sky imager. (C) Fisheye camera of the ASI-16 all-sky imager. (D) The studied PV panel).
Energies 18 03193 g010
Figure 11. Performance evaluation of all frameworks across various time horizons.
Energies 18 03193 g011
Figure 12. Results of proposed framework ((ac) the curve of actual PV power and model output and (df) the scatter statistics of actual power and the model output for sunny, cloudy, and overcast conditions, respectively).
Energies 18 03193 g012
Figure 13. Prediction curves for all frameworks under sunny conditions.
Energies 18 03193 g013
Figure 14. Prediction curves for all frameworks under cloudy conditions.
Energies 18 03193 g014
Figure 15. Prediction curves for all frameworks under overcast conditions.
Energies 18 03193 g015
Figure 16. Visualization of spatiotemporal feature information extracted from original sky images.
Energies 18 03193 g016
Table 1. Statistical details of dataset 1 and dataset 2 (unit: kW).
DatasetTraining SetValidation SetTest Set
MinMaxMeanStdMinMaxMeanStdMinMaxMeanStd
Dataset 1029.5811.438.61027.4211.488.29029.469.557.90
Dataset 209.923.412.8408.763.252.67010.694.473.14
Table 2. Comparison of all frameworks across different time horizons.
FrameworkMAERMSER2
5 min10 min15 min5 min10 min15 min5 min10 min15 min
ResNet-180.77701.09131.41211.79512.19002.50910.94900.92270.8979
ConvLSTM0.71631.06531.14431.81232.30362.44520.94760.91480.9034
CNN-LSTM0.81900.98231.71271.71732.10122.59400.95280.92890.8909
BILST0.75380.99991.26391.75922.16072.39660.95040.92480.9069
ViT-GRU0.82541.04111.14991.73002.13662.35390.95210.92650.9102
Proposed0.67550.94361.04401.71462.03732.30550.95290.93310.9138
Table 3. Comparison of all frameworks’ performance under diverse weather conditions.
FrameworkMAERMSER2
SunnyCloudyOvercastSunnyCloudyOvercastSunnyCloudyOvercast
ResNet-180.25430.57141.05830.33421.13642.14180.99820.98130.8969
ConvLSTM0.11210.36770.91220.13791.03692.15710.99920.98450.8955
CNN-LSTM0.35480.69150.97040.45201.22172.10320.99680.97840.8991
BILST0.14770.35950.89200.18040.93862.07800.99930.98720.9030
ViT-GRU0.31890.49710.94690.41960.97972.03640.99720.98610.9068
Proposed0.10800.31020.84970.13060.90542.03570.99970.98810.9069
Table 4. Comparison of paired t-test performance of all frames under different weather conditions.
FrameworkSunnyCloudyOvercast
t-Statisticp-Valuet-Statisticp-Valuet-Statisticp-Value
ResNet-18−13.62120.00121.67600.05450.22980.8119
ConvLSTM−17.45750.0010−1.58720.04361.08780.2767
CNN-LSTM26.26340.00113.01790.03650.26080.7942
BILST−45.69450.0008−2.42630.0189−3.32170.0045
ViT-GRU−47.72120.0006−6.96520.0096−2.22980.0118
Proposed−55.48980.0006−13.73350.0021−5.50250.0027
Table 5. Evaluation of each component’s contribution to the proposed framework.
FeatureFrameworkMAERMSER2Removal Ratio
Spatial featuresOnly CNN0.62831.41380.968023.59%
Only Swin Transformer0.51541.37070.969950.67%
Spatiotemporal featuresWithout LSTM0.51561.33710.971423.64%
Proposed0.41701.29240.9732---
Table 6. Performance comparison of different frameworks on dataset 2.
FrameworkMAERMSER2
ResNet-180.46290.68600.9526
ConvLSTM0.50150.78650.9378
CNN-LSTM0.41510.69630.9507
BILST0.30110.61840.9614
ViT-GRU0.39600.64980.9574
Proposed0.24150.59400.9644
Disclaimer/Publisher’s Note: The statements, opinions and data contained in all publications are solely those of the individual author(s) and contributor(s) and not of MDPI and/or the editor(s). MDPI and/or the editor(s) disclaim responsibility for any injury to people or property resulting from any ideas, methods, instructions or products referred to in the content.

