


Integrating Hybrid Energy Solutions into Expressway Infrastructure

Abstract
1. Introduction
2. Methodology for System Configuration
2.1. System Parameters for Renewable Hybrid Energy Configuration
2.2. Economic Evaluation Metrics
2.3. Environmental Indicators
3. Design Principles for Wind/Solar/Hydropower Scenario Configuration
3.1. Site Selection Principles
- (1)
- Solar Resource Classification:
- (2)
- Wind Resource Classification:
- (3)
- Hydropower Resource Classification:
- (4)
- Three-Dimensional Site Selection Principles
- (5)
- Additional Considerations:
3.2. Load Demand
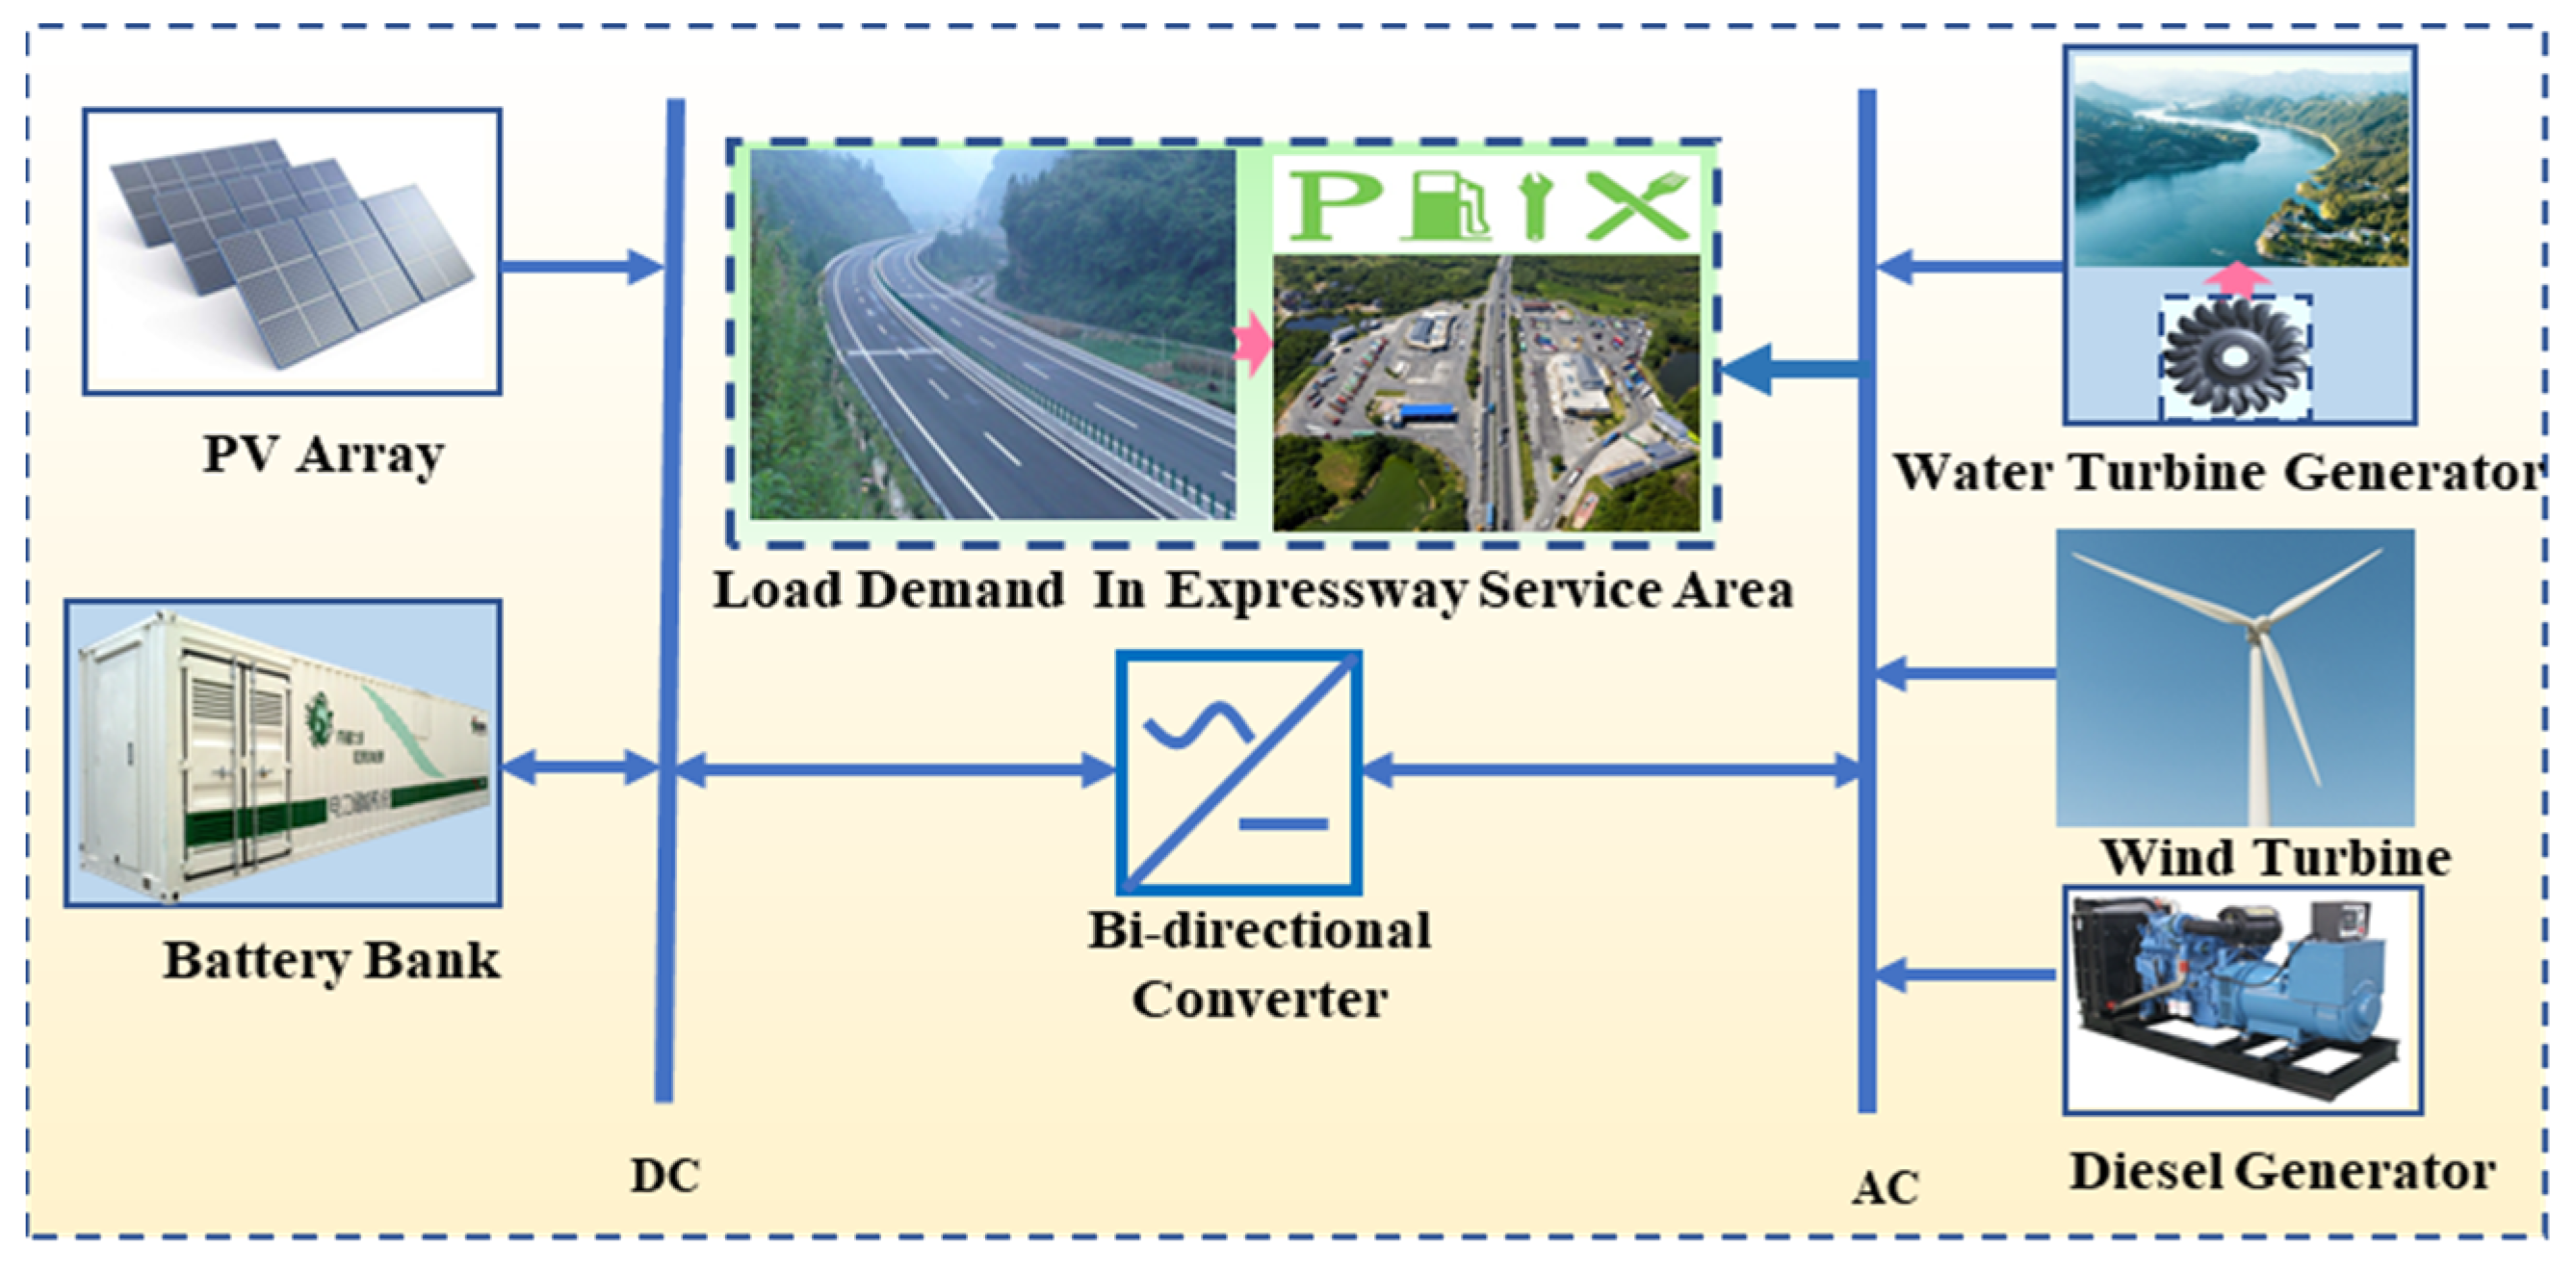
3.3. Design of the Wind/Solar/Hydropower Hybrid Energy System for Expressways
3.4. System Parameters for Renewable Energy Components
4. Results and Discussions
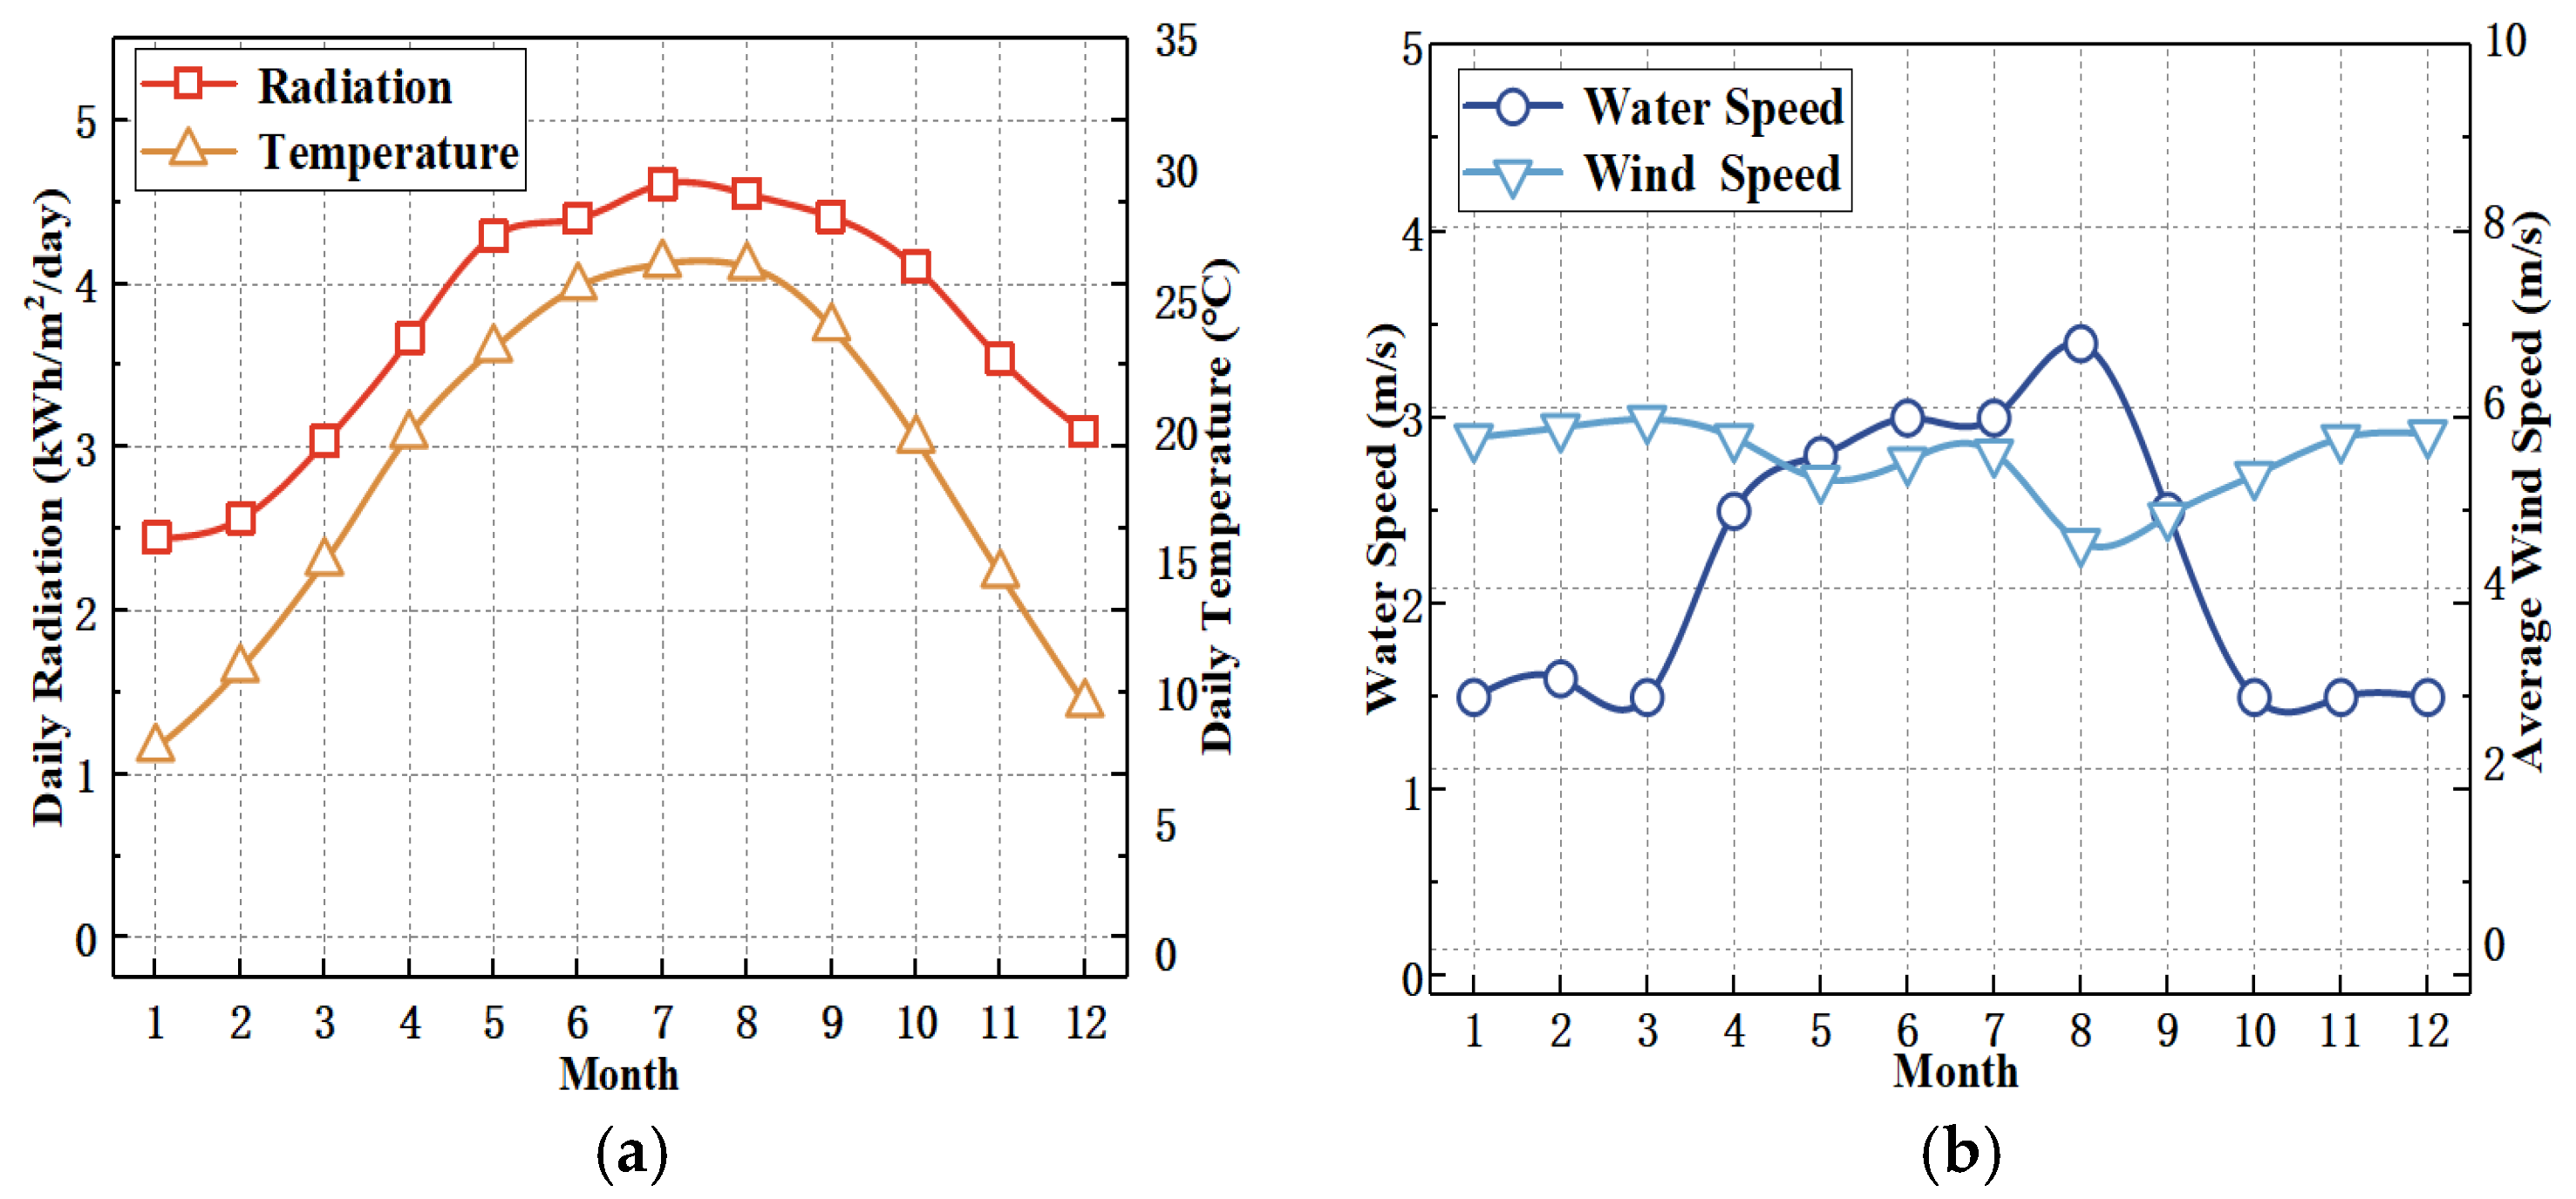
4.1. Assessment of Available Renewable Resources in the Wind/Solar/Hydropower Scenario
4.2. Analysis of Load Demand Data
4.3. Technical, Economic, and Environmental Analysis of the Hybrid Renewable Energy System
- (1)
- System Parameters for Renewable Energy Components
- (2)
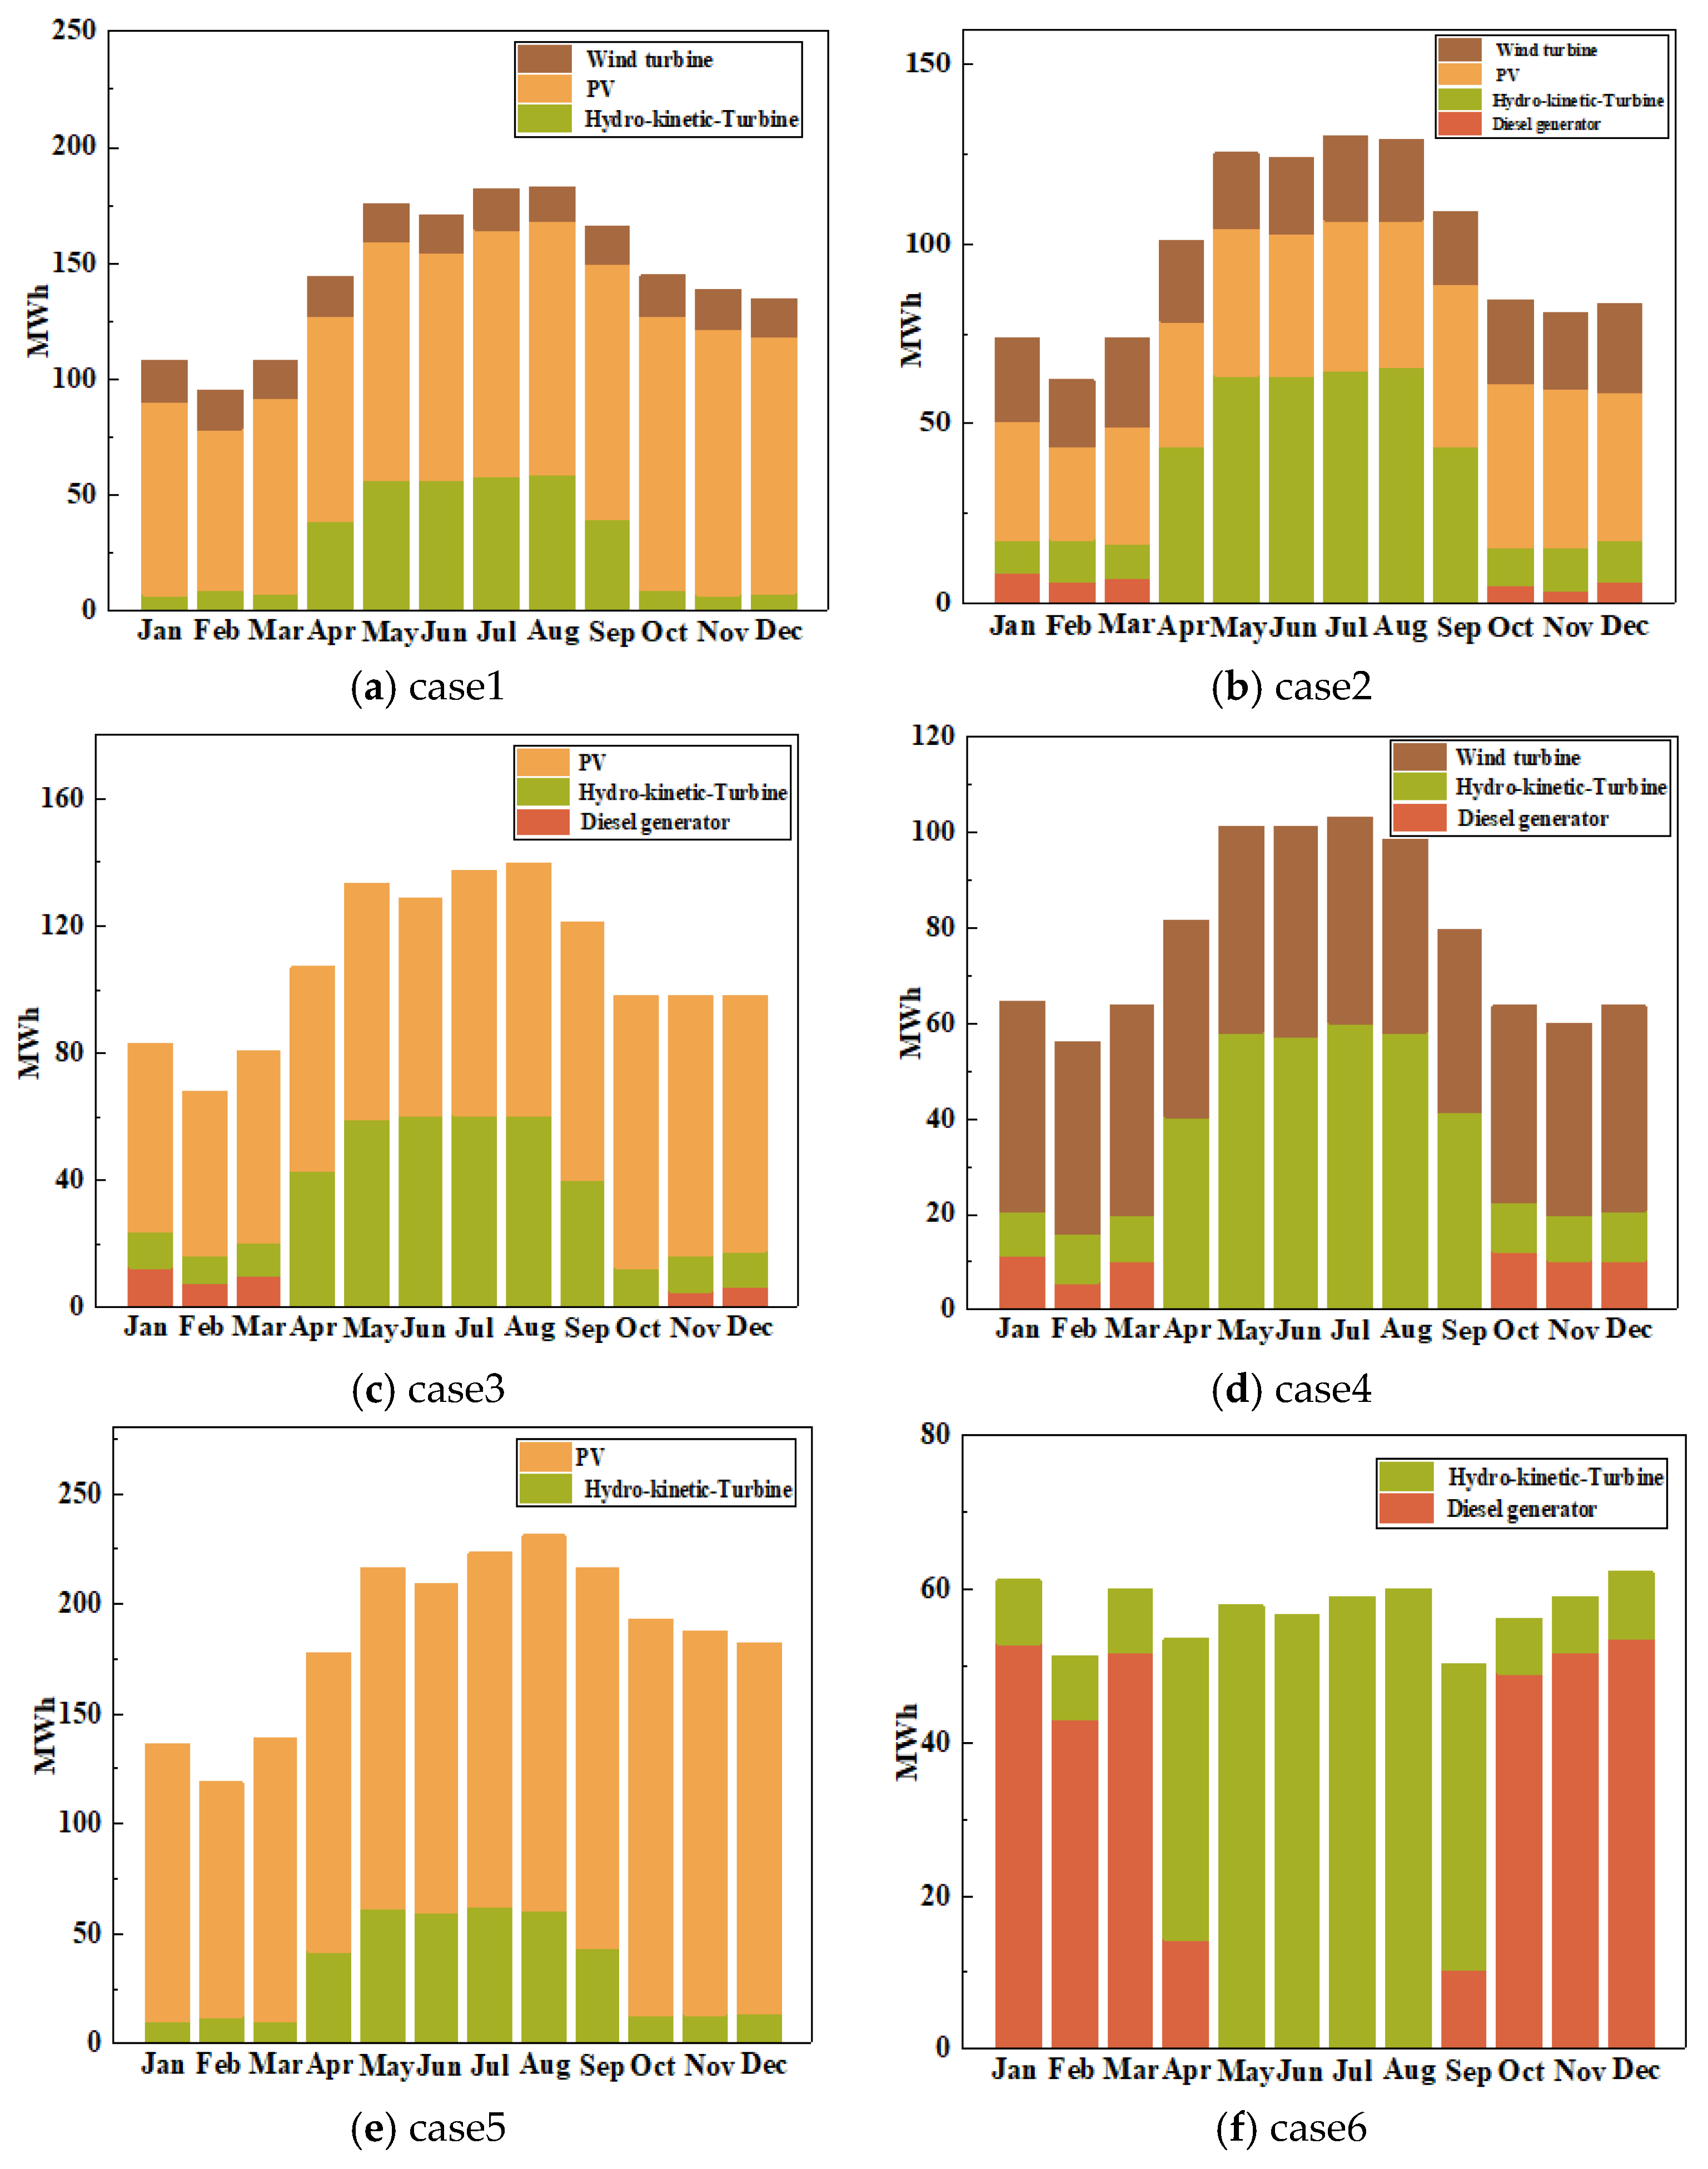
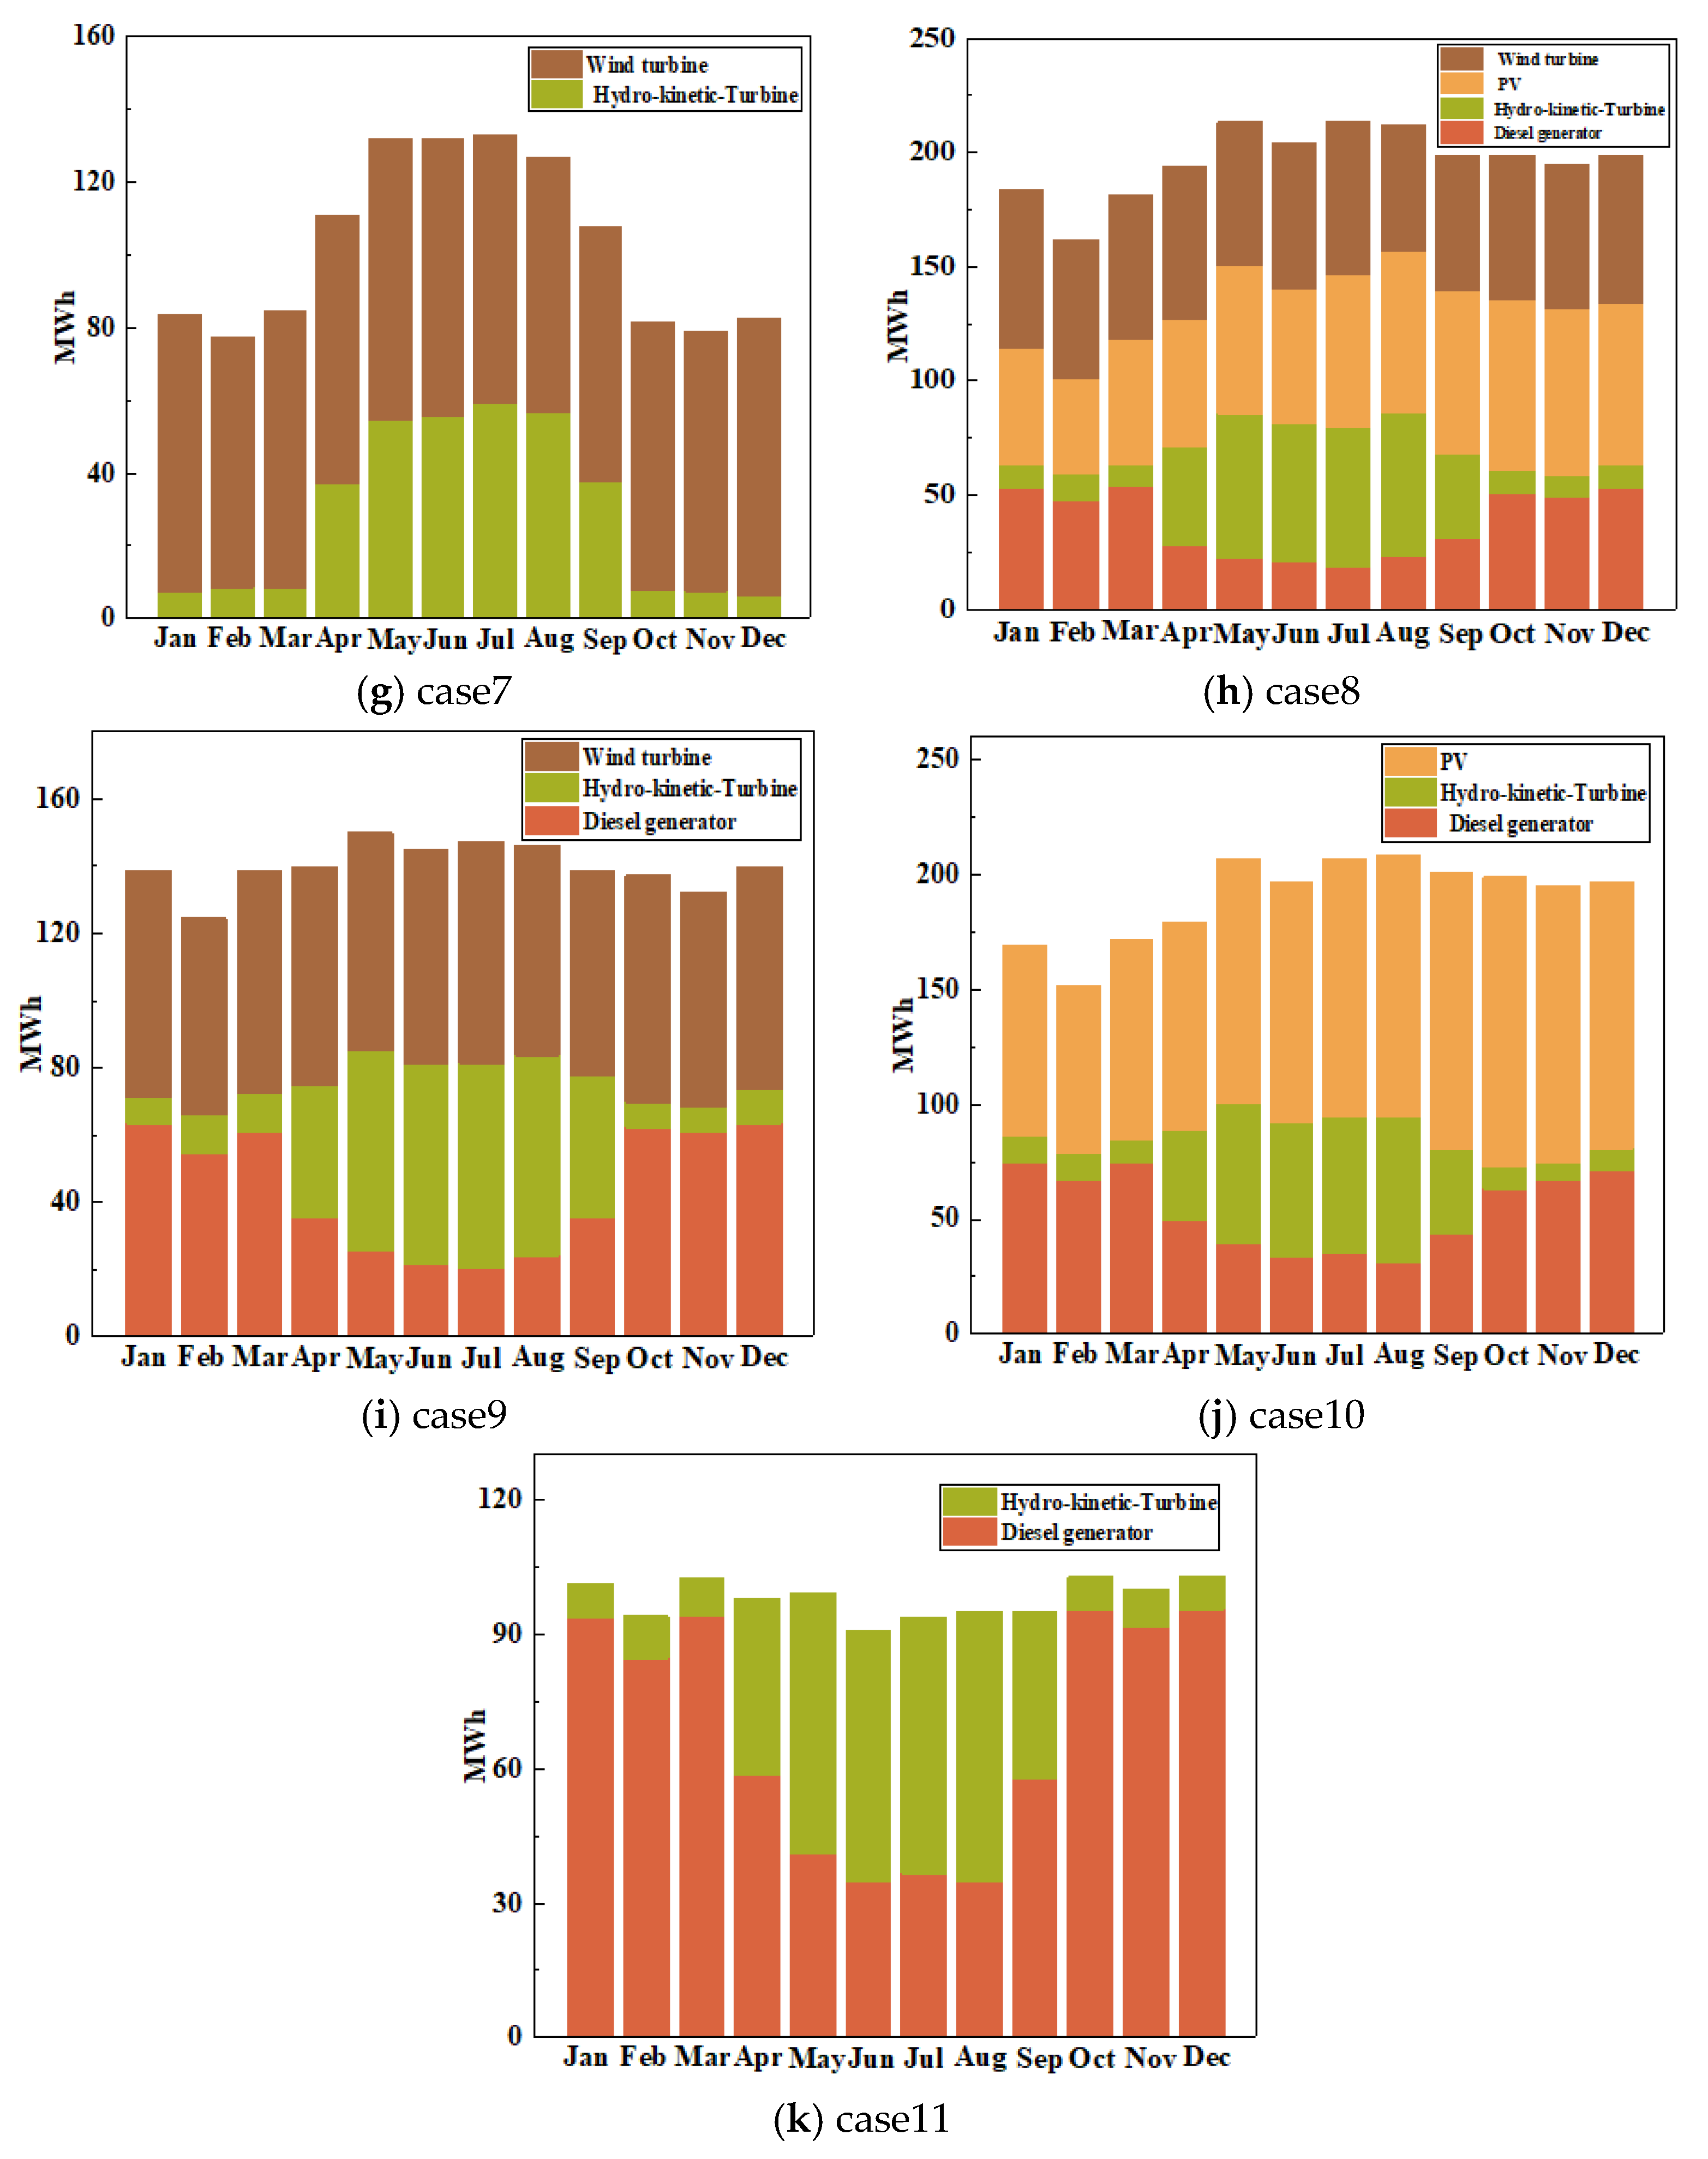
- Technical Analysis
- (3)
- Economic Analysis
- (4)
- Environmental Analysis
4.4. Selection of the Optimal Hybrid Renewable Energy Configuration
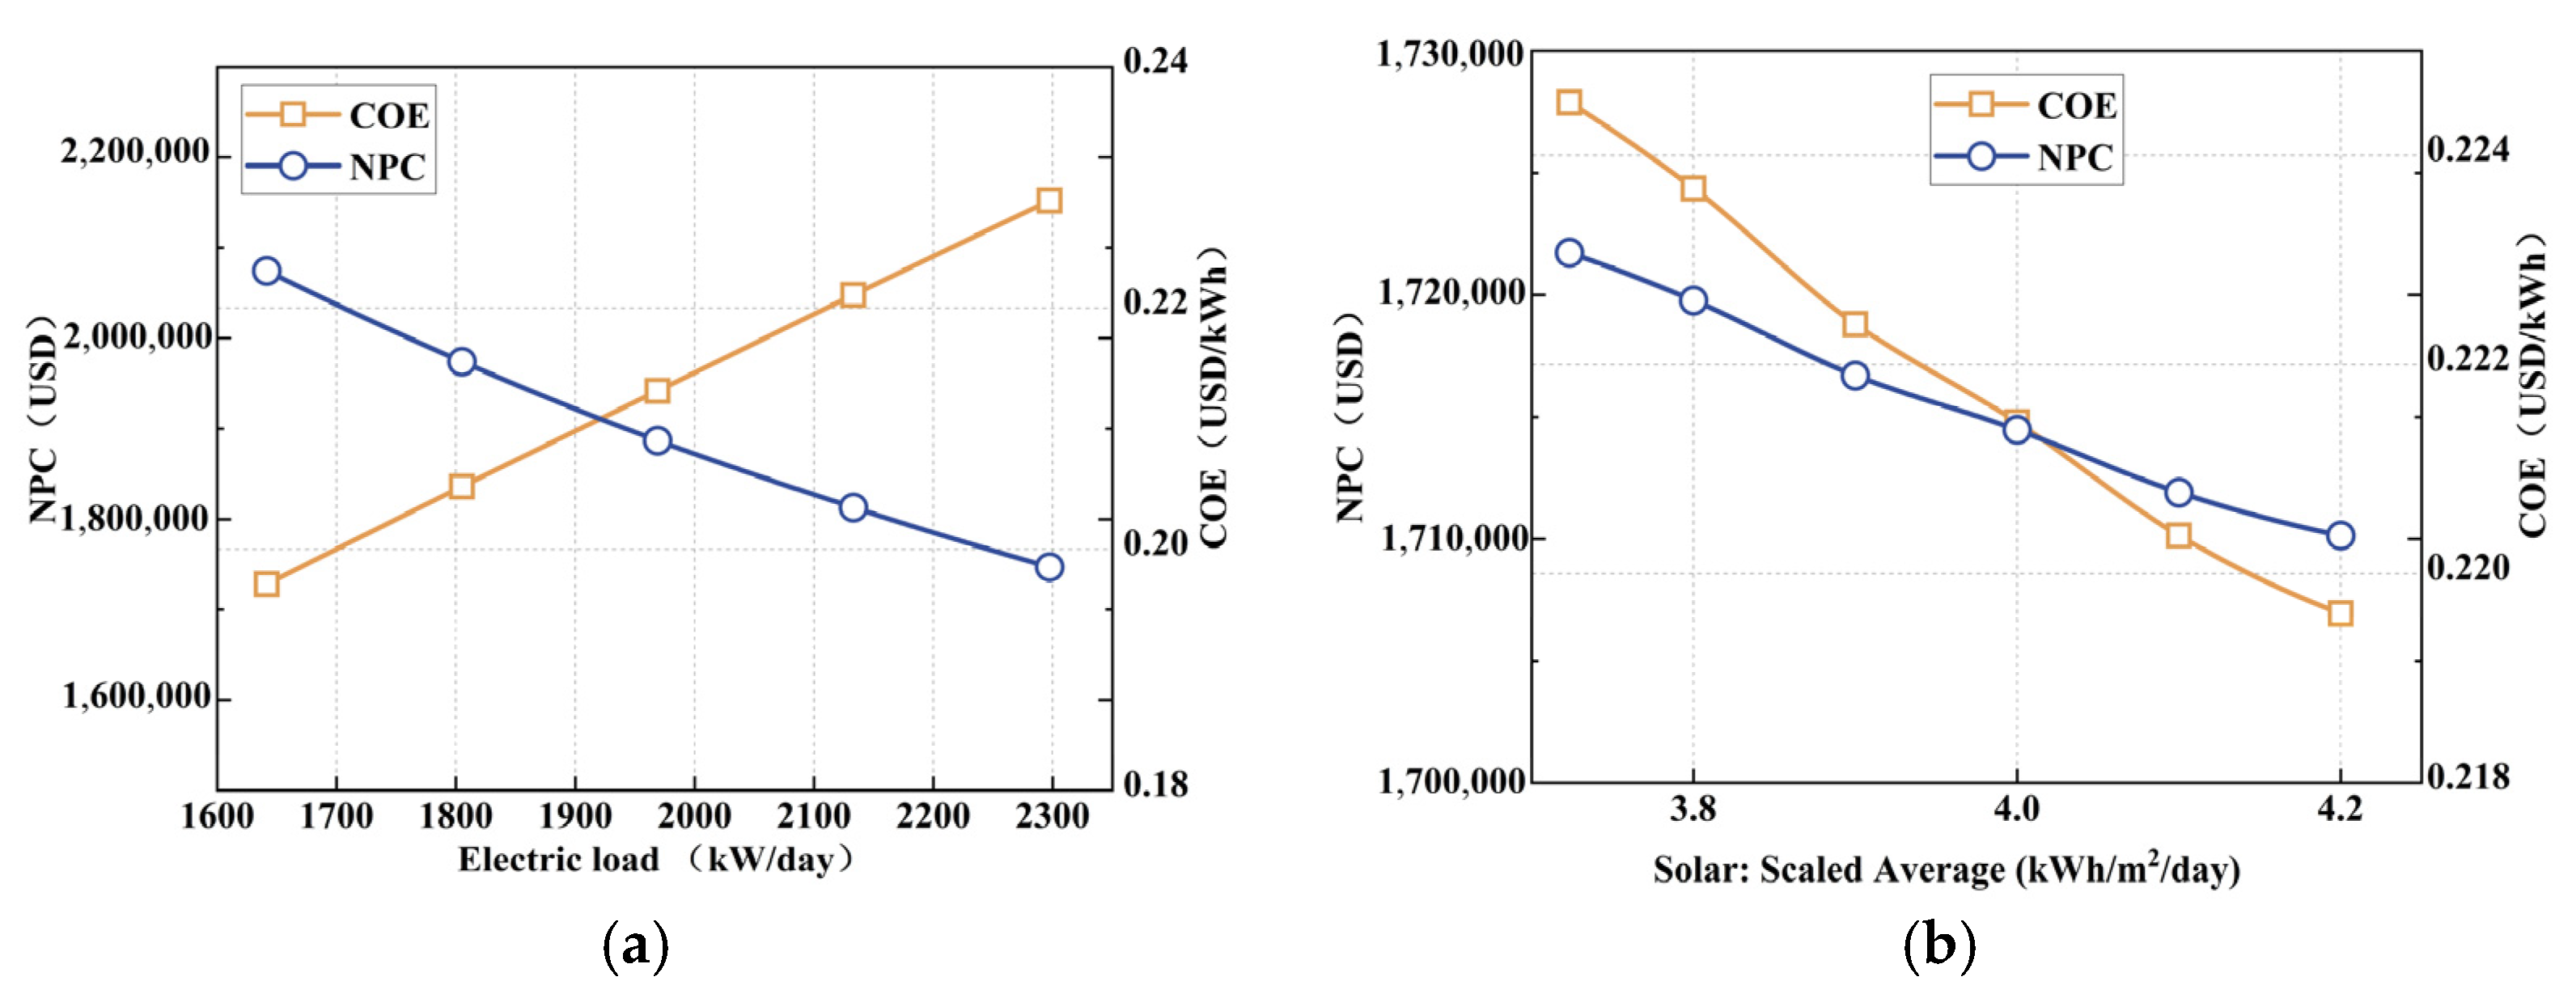
4.5. Sensitivity Analysis
- Sensitivity Analysis of Load Demand Growth:
- Sensitivity Analysis of Solar Irradiance Variability:
5. Conclusions
- (1)
- A scenario-based hybrid energy system design methodology was proposed for expressways under typical wind/solar/hydropower conditions.
- (2)
- To facilitate effective site selection, a three-dimensional evaluation framework was developed, which enables integrated assessment of wind, solar, and hydropower resource intensities across typical expressway scenarios. This framework allows for the identification of optimal deployment zones based on multi-resource synergies.
- (3)
- A southern China expressway service area was selected as a representative site for simulation-based analysis. The optimal configuration (case2) delivers an annual electricity output of 1,095,920 kWh, with 97% derived from renewable sources and only 3% from the diesel generator.
- (4)
- Sensitivity analysis reveals that increased load demand significantly raises NPC, while higher solar irradiance reduces both NPC and COE. These findings highlight the importance of accounting for future demand growth and climatic variability in the system design process to ensure cost-effectiveness and operational resilience.
Author Contributions
Funding
Data Availability Statement
Conflicts of Interest
Abbreviations
| PV | Photovoltaic |
| NPC | Net present cost |
| COE | Cost of energy |
| GIS | Geographic information system |
| CRF | Capital recovery factor |
| GHI | Global horizontal irradiation |
| O&M | Operation and maintenance |
References
- Wu, P.; Ji, L.; Shi, R.; Jia, L. Road Transportation and Energy Integration Strategy in China. Chin. J. Eng. Sci. 2022, 24, 163–172. [Google Scholar]
- Liu, Z.; Fei, T. Road PV production estimation at city scale: A predictive model towards feasible assessing regional energy generation from solar roads. J. Clean. Prod. 2021, 321, 129010. [Google Scholar] [CrossRef]
- Ferri, C.; Ziar, H.; Thien Tin, N.; van Lint, H.; Zeman, M.; Isabella, O. Mapping the photovoltaic potential of the roads including the effect of traffic. Renew. Energy 2022, 182, 427–442. [Google Scholar] [CrossRef]
- Duman, A.C.; Guler, O. Techno-economic analysis of off-grid photovoltaic LED road lighting systems: A case study for northern, central and southern regions of Turkey. Build. Environ. 2019, 156, 89–98. [Google Scholar] [CrossRef]
- Rehman, N.U.; Hijazi, M.; Uzair, M. Solar potential assessment of public bus routes for solar buses. Renew. Energy 2020, 156, 193–200. [Google Scholar] [CrossRef]
- Tian, W.; Song, B.; Mao, Z. Numerical investigation of wind turbines and turbine arrays on highways. Renew. Energy 2020, 147, 384–398. [Google Scholar] [CrossRef]
- Sundaram, A.; Almobasher, L.; Al-Eid, M.; Bazroon, M.; Abohasson, A. Implementation of a highway wind power generation using vertical axis wind turbine to automatically power a street lamp. Wind. Eng. 2021, 45, 1175–1192. [Google Scholar] [CrossRef]
- Chen, C.; Xu, T.-B.; Yazdani, A.; Sun, J.-Q. A high density piezoelectric energy harvesting device from highway traffic—System design and road test. Appl. Energy 2021, 299, 117331. [Google Scholar] [CrossRef]
- Jiang, W.; Xiao, J.; Yuan, D.; Lu, H.; Xu, S.; Huang, Y. Design and experiment of thermoelectric asphalt pavements with power-generation and temperature-reduction functions. Energy Build. 2018, 169, 39–47. [Google Scholar] [CrossRef]
- Azam, A.; Ahmed, A.; Hayat, N.; Ali, S.; Khan, A.S.; Murtaza, G.; Aslam, T. Design, fabrication, modelling and analyses of a movable speed bump-based mechanical energy harvester (MEH) for application on road. Energy 2021, 214, 118894. [Google Scholar] [CrossRef]
- Kotb, K.M.; Elkadeem, M.R.; Khalil, A.; Imam, S.M.; Hamada, M.A.; Sharshir, S.W.; Dan, A. A fuzzy decision-making model for optimal design of solar, wind, diesel-based RO desalination integrating flow-battery and pumped-hydro storage: Case study in Baltim, Egypt. Energy Convers. Manag. 2021, 235, 113962. [Google Scholar] [CrossRef]
- Vendoti, S.; Muralidhar, M.; Kiranmayi, R. Techno-economic analysis of off-grid solar/wind/biogas/biomass/fuel cell/battery system for electrification in a cluster of villages by HOMER software. Environ. Dev. Sustain. 2021, 23, 351–372. [Google Scholar] [CrossRef]
- Das, B.K.; Hasan, M.; Rashid, F. Optimal sizing of a grid-independent PV/diesel/pump-hydro hybrid system: A case study in Bangladesh. Sustain. Energy Technol. Assess. 2021, 44, 100997. [Google Scholar] [CrossRef]
- Azerefegn, T.M.; Bhandari, R.; Ramayya, A.V. Techno-economic analysis of grid-integrated PV/wind systems for electricity reliability enhancement in Ethiopian industrial park. Sustain. Cities Soc. 2020, 53, 101915. [Google Scholar] [CrossRef]
- Das, B.K.; Alotaibi, M.A.; Das, P.; Islam, M.S.; Das, S.K.; Hossain, M.A. Feasibility and techno-economic analysis of stand-alone and grid-connected PV/Wind/Diesel/Batt hybrid energy system: A case study. Energy Strategy Rev. 2021, 37, 100673. [Google Scholar] [CrossRef]
- Cano, A.; Arevalo, P.; Jurado, F. Energy analysis and techno-economic assessment of a hybrid PV/HKT/BAT system using biomass gasifier: Cuenca-Ecuador case study. Energy 2020, 202, 117727. [Google Scholar] [CrossRef]
- Li, J.; Liu, P.; Li, Z. Optimal design and techno-economic analysis of a solar-wind-biomass off-grid hybrid power system for remote rural electrification: A case study of west China. Energy 2020, 208, 118387. [Google Scholar] [CrossRef]
- Coban, H.H.; Rehman, A.; Mohamed, A. Technical and Economical Investigation of a Centralized and Decentralized Hybrid Renewable Energy System in Cadaado, Somalia. Processes 2022, 10, 667. [Google Scholar] [CrossRef]
- Jaszczur, M.; Hassan, Q.; Palej, P.; Abdulateef, J. Multi-Objective optimisation of a micro-grid hybrid power system for household application. Energy 2020, 202, 117738. [Google Scholar] [CrossRef]
- Nesamalar, J.J.D.; Suruthi, S.; Raja, S.C.; Tamilarasu, K. Techno-economic analysis of both on-grid and off-grid hybrid energy system with sensitivity analysis for an educational institution. Energy Convers. Manag. 2021, 239, 114188. [Google Scholar] [CrossRef]
- Toopshekan, A.; Youse, H.; Astaraei, F.R. Technical, economic, and performance analysis of a hybrid energy system using a novel dispatch strategy. Energy 2020, 213, 118850. [Google Scholar] [CrossRef]
- El-houari, H.; Allouhi, A.; Rehman, S.; Buker, M.S.; Kousksou, T.; Jamil, A.; El Amrani, B. Feasibility evaluation of a hybrid renewable power generation system for sustainable electricity supply in a Moroccan remote site. J. Clean. Prod. 2020, 277, 123534. [Google Scholar] [CrossRef]
- Jahangir, M.H.; Shahsavari, A.; Rad, M.A.V. Feasibility study of a zero emission PV/Wind turbine/Wave energy converter hybrid system for stand-alone power supply: A case study. J. Clean. Prod. 2020, 262, 121250. [Google Scholar] [CrossRef]
- Akhtari, M.R.; Shayegh, I.; Karimi, N. Techno-economic assessment and optimization of a hybrid renewable earth-air heat exchanger coupled with electric boiler, hydrogen, wind and PV configurations. Renew. Energy 2020, 148, 839–851. [Google Scholar] [CrossRef]
- Ramesh, M.; Saini, R.P. Dispatch strategies based performance analysis of a hybrid renewable energy system for a remote rural area in India. J. Clean. Prod. 2020, 259, 120697. [Google Scholar] [CrossRef]
- Oko, C.; EO, D.; NF, O. Design and economic analysis of a photovoltaic system-a case study. Int. J. Renew. Energy Dev. 2012, 1, 65–73. [Google Scholar] [CrossRef]
- China Meteorological Administration PaRD. Assessment Method for Solar Energy Resource; China Meteorological Administration PaRD: Beijing, China, 2019; p. 1. [Google Scholar]
- GB T18710; Methodology of Wind Energy Resource Assessment for Wind Farm. Standardization Administration of China: Beijing, China, 2002; p. 1.
- Islam, M.S.; Gupta, S.D.; Masum, M.S.; Raju, N.I.; Karim, S.A. Potentiality of Small-Scale Hydro Power Plant Using the Kinetic Energy of Flowing Water of Gumoti & Surma River of Bangladesh: An Energy Odyssey. Int. J. Renew. Energy Res. 2013, 3, 172–179. [Google Scholar]
- MJ Khan, M.I. JE Quaicoe, River current energy conversion systems: Progress, prospects and challenges. Renew. Sustain. Energy Rev. 2008, 12, 2177–2193. [Google Scholar] [CrossRef]
- Askari, I.B.; Ameri, M. Techno-economic Feasibility Analysis of Stand-alone Renewable Energy Systems (PV/bat, Wind/bat and Hybrid PV/wind/bat) in Kerman, Iran. Energy Sources Part B Econ. Plan. Policy 2012, 7, 45–60. [Google Scholar] [CrossRef]
- Uwineza, L.; Kim, H.-G.; Kim, C.K. Feasibility study of integrating the renewable energy system in Popova Island using the Monte Carlo model and HOMER. Energy Strategy Rev. 2021, 33, 100607. [Google Scholar] [CrossRef]
- El-houari, H.; Allouhi, A.; Salameh, T.; Kousksou, T.; Jamil, A.; El Amrani, B. Energy, Economic, Environment (3E) analysis of WT-PV-Battery autonomous hybrid power plants in climatically varying regions. Sustain. Energy Technol. Assess. 2021, 43, 100961. [Google Scholar] [CrossRef]
- Sharma, S.; Sood, Y.R.; Sharma, N.K.; Bajaj, M.; Zawbaa, H.M.; Turky, R.A.; Kamel, S. Modeling and sensitivity analysis of grid-connected hybrid green microgrid system. Ain Shams Eng. J. 2022, 13, 101679. [Google Scholar] [CrossRef]
- He, L.; Zhang, S.; Chen, Y.; Ren, L.; Li, J. Techno-economic potential of a renewable energy-based microgrid system for a sustainable large-scale residential community in Beijing, China. Renew. Sustain. Energy Rev. 2018, 93, 631–641. [Google Scholar] [CrossRef]
- Shiroudi, A.; Rashidi, R.; Gharehpetian, G.B.; Mousavifar, S.A.; Foroud, A.A. Case study: Simulation and optimization of photovoltaic-wind-battery hybrid energy system in Taleghan-Iran using HOMER software. J. Renew. Sustain. Energy 2012, 4, 053111. [Google Scholar] [CrossRef]
- Baruah, A.; Basu, M.; Amuley, D. Modeling of an autonomous hybrid renewable energy system for electrification of a township: A case study for Sikkim, India. Renew. Sustain. Energy Rev. 2021, 135, 110158. [Google Scholar] [CrossRef]


| Total Annual Radiation (kWh/m2/year) | Average Daily Radiation (kWh/m2/day) | Level Symbol |
|---|---|---|
| ≥1750 | ≥4.79 | A |
| 1400~1~750 | 3.83~4.79 | B |
| 1050~1400 | 2.87~3.83 | C |
| <1050 | <2.87 | D |
| Average Annual Wind Speed (m/s) | Level Type | Level Symbol |
|---|---|---|
| ≥6.0 | Rich area | A |
| 5.5~6.0 | moderately rich area | B |
| 5.0~5.5 | Usable area | C |
| <4.5 | Poor area | D |
| Average Annual Flow Rate (m/s) | Level Type | Level Symbol |
|---|---|---|
| ≥4 | Rich area | A |
| 3~4 | moderately rich area | B |
| 1~3 | Usable area | C |
| <1 | Poor area | D |
| Component Name | Cost (USD) | Replacement Cost (USD) | O&M (USD) | Model | Lifespan |
|---|---|---|---|---|---|
| Photovoltaic component [17] | 1000/kW | 950/kW | 10/year | Peimar SG200M5 (Italy) | 25 years |
| Diesel generator [31,32] | 750/kW | 750/kW | 1.34 (USD/op. h) | Generic 500kW Fixed Capacity Genset | 30,000 (h) |
| Battery component [33] | 1650 | 1650 | 15 | H2500(LiFePO4) | 12 years |
| Wind component [34] | 997 | 997 | 150 | Generic30kW | 20 years |
| Converter [35,36] | 300 | 300 | 0 | SG100k3 | 15 years |
| Hydrogen turbine [37] | 3174/kW | 3174/kW | 200/year | SMART Monofloat 5 kW (Germany) | 10 years |
| Case | Configuration Scheme |
|---|---|
| case1 | PV/wind/hydrokinetic turbine/battery |
| case2 | PV/wind/diesel generator/hydrokinetic turbine/battery |
| case3 | PV/diesel generator/hydrokinetic turbine/battery |
| case4 | Wind/diesel generator/hydrokinetic turbine/battery |
| case5 | PV/hydrokinetic turbine/battery |
| case6 | Diesel generator/hydrokinetic turbine/battery |
| case7 | Wind/hydrokinetic turbine/battery |
| case8 | PV/wind/diesel generator/hydrokinetic turbine |
| case9 | Wind/diesel generator/hydrokinetic turbine |
| case10 | PV/diesel generator/hydrokinetic turbine |
| case11 | Diesel generator/hydrokinetic turbine |
| Case | PV (kW) | Wind (kW) | Diesel (kW) | Battery (kWh) | Hydropower (kW) | Converter (kW) | NPC (USD) |
|---|---|---|---|---|---|---|---|
| case1 | 1019 | 6 | / | 298 | 16 | 156 | 1,709,752 |
| case2 | 382 | 7 | 500 | 180 | 16 | 126 | 1,727,891 |
| case3 | 757 | / | 500 | 232 | 16 | 140 | 1,844,395 |
| case4 | / | 14 | 500 | 141 | 16 | 151 | 1,964,615 |
| case5 | 1589 | / | / | 440 | 16 | 182 | 1,998,468 |
| case6 | / | / | 500 | 60 | 16 | 280 | 2,764,738 |
| case7 | / | 24 | / | 864 | 16 | 274 | 2,948,775 |
| case8 | 647 | 21 | 500 | / | 16 | 62 | 4,921,958 |
| case9 | / | 21 | 500 | / | 16 | / | 5,097,704 |
| case10 | 1095 | / | 500 | / | 16 | 77 | 5,705,797 |
| case11 | / | / | 500 | / | 16 | / | 6,350,174 |
| No. | NPC (USD) | COE (USD) | O&M (USD) | Renfrac (%) |
|---|---|---|---|---|
| case1 | 1,709,752 | 0.22 | 33,847.1 | 100.0 |
| case2 | 1,727,891 | 0.22 | 34,910.2 | 95.0 |
| case3 | 1,844,395 | 0.24 | 44,148.7 | 92.1 |
| case4 | 1,964,615 | 0.25 | 51,063.3 | 89.4 |
| case5 | 1,998,468 | 0.26 | 37,678.3 | 100.0 |
| case6 | 2,764,738 | 0.36 | 154,083.4 | 45.6 |
| case7 | 2,948,775 | 0.38 | 39,254.0 | 100.0 |
| case8 | 4,921,958 | 0.63 | 266,913.5 | 24.3 |
| case9 | 5,097,704 | 0.65 | 297,092.9 | 13.3 |
| case10 | 5,705,797 | 0.73 | 365,003.5 | 11.2 |
| case11 | 6,350,174 | 0.81 | 442,564.0 | 8.1 |
| No. | CO2 (kg/year) | CO (kg/year) | HC (kg/year) | PM (kg/year) | SO2 (kg/year) | NOx (kg/year) |
|---|---|---|---|---|---|---|
| case1 | 0 | 0 | 0 | 0 | 0 | 0 |
| case2 | 23,207 | 120 | 6.3 | 1.0 | 56.7 | 23.0 |
| case3 | 36,875 | 191 | 10.1 | 1.6 | 90.1 | 36.6 |
| case4 | 49,560 | 256 | 13.6 | 2.1 | 121.0 | 49.1 |
| case5 | 0 | 0 | 0 | 0 | 0 | 0 |
| case6 | 225,198 | 1165 | 61.8 | 9.9 | 550.0 | 223.0 |
| case7 | 0 | 0 | 0 | 0 | 0 | 0 |
| case8 | 356,791 | 1846 | 98.0 | 15.8 | 872.0 | 354.0 |
| case9 | 408,318 | 2112 | 112.0 | 18.1 | 998.0 | 405.0 |
| case10 | 505,283 | 2614 | 139.0 | 22.4 | 1235.0 | 501.0 |
| case11 | 630,856 | 3264 | 173.0 | 27.9 | 1542.0 | 626.0 |
| No. | Component | Annual Power Generation (kWh/yr) | Percentage |
|---|---|---|---|
| 1 | PV | 443,875 | 41% |
| 2 | Diesel generator | 29,500 | 3% |
| 3 | Wind turbines | 258,014 | 24% |
| 4 | Hydrokinetic Turbine | 364,531 | 32% |
| Total | 1,095,920 | 100% | |
| Name | Variable Value |
|---|---|
| Load demand (kWh/day) | 1805, 1969, 2133, 2297.4 |
| Solar radiation (kWh/m2) | 3.72, 3.8, 3.9, 4.0, 4.1, 4.2 |
Disclaimer/Publisher’s Note: The statements, opinions and data contained in all publications are solely those of the individual author(s) and contributor(s) and not of MDPI and/or the editor(s). MDPI and/or the editor(s) disclaim responsibility for any injury to people or property resulting from any ideas, methods, instructions or products referred to in the content. |
© 2025 by the authors. Licensee MDPI, Basel, Switzerland. This article is an open access article distributed under the terms and conditions of the Creative Commons Attribution (CC BY) license (https://creativecommons.org/licenses/by/4.0/).
Share and Cite
Yao, M.; Wang, Z.; Zhang, S.; Chu, Z.; Zhang, Y.; Zhang, S.; Han, W. Integrating Hybrid Energy Solutions into Expressway Infrastructure. Energies 2025, 18, 3186. https://doi.org/10.3390/en18123186
Yao M, Wang Z, Zhang S, Chu Z, Zhang Y, Zhang S, Han W. Integrating Hybrid Energy Solutions into Expressway Infrastructure. Energies. 2025; 18(12):3186. https://doi.org/10.3390/en18123186
Chicago/Turabian StyleYao, Muqing, Zunbiao Wang, Song Zhang, Zhufa Chu, Yufei Zhang, Shuo Zhang, and Wenkai Han. 2025. "Integrating Hybrid Energy Solutions into Expressway Infrastructure" Energies 18, no. 12: 3186. https://doi.org/10.3390/en18123186
APA StyleYao, M., Wang, Z., Zhang, S., Chu, Z., Zhang, Y., Zhang, S., & Han, W. (2025). Integrating Hybrid Energy Solutions into Expressway Infrastructure. Energies, 18(12), 3186. https://doi.org/10.3390/en18123186