Article

Study on the Characteristics of High-Temperature and High-Pressure Spray Flash Evaporation for Zero-Liquid Discharge of Desulfurization Wastewater

School of Energy Power and Mechanical Engineering, North China Electric Power University, Beijing 102206, China
*
Author to whom correspondence should be addressed.
Energies 2025, 18(12), 3180; https://doi.org/10.3390/en18123180
Submission received: 17 April 2025 / Revised: 30 May 2025 / Accepted: 9 June 2025 / Published: 17 June 2025
(This article belongs to the Section J1: Heat and Mass Transfer)

Abstract

:
Zero-liquid discharge (ZLD) of desulfurization wastewater from coal-fired power plants is a critical challenge in the thermal power industry. Flash evaporation technology provides an efficient method for wastewater concentration and the recovery of high-quality freshwater resources. In this study, numerical simulations of the high-temperature and high-pressure spray flash evaporation process within a flash tank were conducted using the Discrete Phase Model (DPM) and a self-developed heat and mass transfer model for superheated droplets under depressurization conditions. The effects of feedwater temperature, pressure, nozzle spray angle, and mass flow rate on spray flash evaporation characteristics were systematically analyzed. Key findings reveal that (1) feedwater temperature is the dominant factor, with the vaporization rate significantly increasing from 19.78% to 55.88% as temperature rises from 240 °C to 360 °C; (2) higher pressure reduces equilibrium time (flash evaporation is complete within 6 ms) but shows negligible impact on final vaporization efficiency (stabilized at 33.93%); (3) increasing the spray angle provides limited improvement to water recovery efficiency (<1%); (4) an optimal mass flow rate exists (0.2 t/h), achieving a peak vaporization rate of 42.6% due to balanced evaporation space utilization. This work provides valuable insights for industrial applications in desulfurization wastewater treatment.

1. Introduction

The limestone–gypsum wet flue gas desulfurization (FGD) technology has been widely adopted due to its remarkable desulfurization performance, characterized by rapid reaction rates and high desulfurization efficiency, making it particularly suitable for flue gas desulfurization in large-scale coal-fired power units [1,2]. So far, no alternative desulfurization method has been proven capable of replacing this technology. Consequently, the recovery and treatment of wastewater generated during the operation of FGD systems to achieve zero-liquid discharge (ZLD) has become a critical requirement for meeting environmental regulations. A variety of ZLD treatment technologies for FGD wastewater have been developed both domestically and internationally [3], with the technical processes generally comprising three main stages: pretreatment, concentration, and solidification. The pretreatment stage primarily involves technologies such as two-stage clarification and softening, as well as filtration; the concentration stage employs methods such as membrane concentration [4] and electrodialysis; and the solidification stage typically includes multi-effect distillation (MED) [5] and flue gas spray evaporation [6]. However, the existing ZLD technologies for wastewater treatment are generally associated with high capital investment and operating costs, posing significant challenges for widespread application. Therefore, the development of novel wastewater treatment technologies and the integration of efficient, cost-effective ZLD process routes have become key research priorities.
Flash evaporation is the process in which a liquid rapidly depressurizes below its saturation vapor pressure, causing the liquid to become superheated and instantly undergo boiling and vaporization [7]. High-temperature and high-pressure flash evaporation for water recovery and concentration involves increasing the pressure of saline wastewater to levels significantly higher than atmospheric pressure while heating it to just below the saturation temperature corresponding to that pressure. The saline wastewater is then atomized into fine droplets using a pressure-swirl atomizing nozzle and sprayed into an expansion evaporator with an internal pressure at atmospheric level. In the flash chamber, the high-temperature, high-pressure saline droplets release heat to the environment and evaporate. The resulting water vapor exits from the top of the flash chamber and enters a condenser for condensation, while the non-evaporated droplets settle at the bottom of the flash chamber, achieving water recovery and concentration. Although research on flash evaporation technology began relatively early both domestically and internationally, the study of flash evaporation remains in the exploratory stage due to the highly complex flow and phase transition processes of the liquid–gas two-phase flow during flash evaporation. Current research primarily focuses on theoretical analysis and macroscopic investigations, with limited studies on the flash evaporation mechanism of highly superheated liquids under atmospheric conditions. Therefore, advancing the study of flash evaporation of high-temperature and high-pressure liquids is very important.
Currently, research on flash evaporation technology focuses primarily on three forms: droplet flash evaporation, pool flash evaporation, and spray flash evaporation. Spray flash evaporation utilizes atomizing nozzles to break liquid into fine droplets, which significantly increases the specific surface area of the liquid in contact with the surrounding environment, thereby enhancing the flash evaporation process. Spray flash evaporation is characterized by its intense evaporation, high vaporization rate, low energy consumption, and resistance to scaling during evaporation and desalination, making it widely studied in the field of seawater desalination. Flash evaporation technology applications are diverse, playing a crucial role in the drying processes of the pharmaceutical industry [8], quality control and concentration in the food processing industry (such as deaeration in UHT milk processing [9]), material separation and sterilization in chemical processes, the cooling of high-temperature parts in aerospace vehicles [10], and large-scale seawater desalination [11].
O. Miyatake [12,13] conducted early experiments on spray flash evaporation by injecting superheated water with an initial temperature of 40–80 °C downward through nozzles of different inner diameters, analyzing the effects of various parameters on the flash evaporation characteristics of the superheated jet, and deriving an empirical correlation for the temperature variation along the jet centerline within the experimental range. However, Uehara et al. [14] found in their experiments involving superheated jets at an initial temperature of 30 °C that Miyatake’s empirical formula was not applicable for feedwater temperatures below 40 °C. Sami Mutair et al. [15] studied the flash evaporation of superheated jets injected upward, analyzing the effects of flow velocity, initial temperature, superheat, and nozzle diameter on the flash evaporation process. They concluded that the primary factors limiting the evaporation rate of flash jets were jet velocity and nozzle diameter, as higher jet velocities and larger nozzle diameters increased the inertial force of the jet at the nozzle outlet. This inertial force suppresses jet breakup, thereby increasing evaporation time and reducing flash evaporation efficiency. While Miyatake previously investigated the relationship between jet centerline temperature and residence time, Mutair [16] further studied the relationship between jet centerline temperature and the distance from the nozzle outlet. They found that in all their flow experiments, the temperature decay curves of superheated jet centerlines exhibited a similar shape, following an exponentially decaying Boltzmann S-curve. This led to the development of an exponential decay curve model to predict the flash evaporation termination location based on the relationship between the dimensionless centerline temperature and the nozzle outlet distance. Q. Chen et al. [17] incorporated a pressure-swirl atomizing nozzle into their superheated jet flash evaporation experiments and found that higher jet velocities reduced the average droplet size during the flash evaporation process. They attributed this to increased hydrodynamic instability at higher velocities, which provided greater kinetic energy for jet breakup. This conclusion differs from that of Mutair et al., likely due to differences in the nozzle types and jet injection directions used in the two experiments. Duan et al. [18] conducted numerical simulations to investigate the effect of superheat (ranging from 77 °C to 231 °C) on the disappearance length of flash jets, finding that the disappearance length decreased with increasing superheat. Their simulation results were validated by the experiments of Simoes-Moreira et al. [19], who injected high-pressure liquid isooctane through a conical nozzle with an inner diameter of 0.31 mm into a low-pressure flash chamber. They observed that flash evaporation occurred in the form of evaporation waves on the liquid core surface, and by analyzing images of the liquid core inside the flash chamber, they inferred that no phase transition or nucleation occurred in the liquid jet at the nozzle exit cross-section. Farshid Fathinia et al. [20] conducted experiments in which low-temperature liquid within the range of 60–80 °C was injected through an orifice nozzle into a depressurized chamber, leading to superheating and subsequent flash evaporation. Their findings revealed that the dimensionless temperature ( θ e m p ) is closely correlated with the evaporation rate, with higher degrees of superheat and greater inlet flow rates significantly enhancing the evaporation rate.
Despite advancements in flash evaporation research, existing studies predominantly investigate low-superheat liquids (e.g., 30–80 °C) under vacuum conditions, leaving a critical gap in understanding high-temperature (>200 °C) and high-pressure (>10 MPa) processes relevant to industrial wastewater treatment. Moreover, traditional Discrete Phase Models (DPMs) fail to accurately simulate superheated droplet evaporation due to their reliance on surface-driven heat transfer mechanisms. This study aims to
(1)
Develop a heat and mass transfer mathematical model tailored for superheated spray flash evaporation under high-temperature and high-pressure conditions, addressing the limitations of traditional DPMs;
(2)
Investigate the mechanisms of heat and mass transfer during the flash evaporation of desulfurization wastewater via numerical simulation;
(3)
Analyze the effects of critical parameters (e.g., feedwater temperature, pressure, spray angle, and mass flow rate) on evaporation efficiency;
(4)
Provide theoretical guidance for optimizing zero-liquid discharge (ZLD) processes in industrial applications.

2. Mathematical Models

The high-temperature and high-pressure spray flash evaporation process was numerically simulated and analyzed using FLUENT 15.0 software. The simulation employed the Euler–Lagrange method [21], where the atomized droplets were treated as the discrete phase, and their motion, heat transfer, and mass transfer processes were solved in the Lagrangian coordinate system. Meanwhile, the surrounding vapor was treated as the continuous phase, and its flow and heat transfer processes were solved in the Eulerian coordinate system. The models used in the simulation include the DPM [22], the k-ε turbulence model, the buoyancy model, and the species transport model.

2.1. Fundamental Governing Equations

The high-temperature and high-pressure spray flash evaporation process adheres to the fundamental physical laws of mass conservation, energy conservation, and momentum conservation. The corresponding fundamental governing equations are as follows:
Mass Conservation Equation:
ρ t + d i v ( ρ u ) = 0
Momentum Conservation Equation:
δ F = δ m d v d t ρ d u d t = ρ F x p x + μ u 2 x 2 + u 2 y 2 + u 2 z 2 + s u ρ d v d t = ρ F y p y + μ v 2 x 2 + v 2 y 2 + v 2 z 2 + s v ρ d w d t = ρ F z p z + μ w 2 x 2 + w 2 y 2 + w 2 z 2 + s w
d N d t = N t + u N x + v N y + w N z
In Equation (3), N can be replaced by u , v , and w . In Equation (2), F x , F y , and F z represent the unit mass forces acting on the control volume in three respective directions, while s x , s y , and s z are part of the generalized source terms, which are all equal to 0 for incompressible fluids with constant viscosity.
Energy Conservation Equation:
ρ c t τ = x λ t x + y λ t y + z λ t z + φ
In Equation (4), ρ , t , τ , λ , c , and φ represent the density, temperature, time, thermal conductivity, specific heat capacity, and the heat generated per unit time and per unit volume within the control element, respectively.

2.2. The Discrete Phase Model

In the DPM, the first phase is represented by the continuous phase, while the second phase consists of spherical particles dispersed within the continuous phase. The motion of particles in the continuous phase can be determined using either uncoupled or coupled calculations. When the influence of the discrete phase on the flow field of the continuous phase is negligible, uncoupled calculations can be employed to simulate particle trajectories. However, in the case of spray flash evaporation, where mass, momentum, and energy exchanges occur between the phases, the motion and evaporation of discrete liquid droplets significantly affect the surrounding continuous phase flow field. Consequently, a coupled calculation approach is required to accurately resolve the phenomena, as illustrated in Figure 1.

2.2.1. Equation of Droplet Motion Trajectory

The motion trajectory of discrete phase particles is closely related to the forces acting on them. By integrating the force balance equation of the particles over time, the motion trajectory of the particles can be obtained. The forces acting on droplet particles in the gas phase field are illustrated in Figure 2.
In the figure, F b , F d , and g correspond to the buoyancy force, drag force, and gravitational acceleration acting on the droplet, respectively. The force balance equation for the droplet can be expressed as follows:
d u p d t = F d ( u u p ) + F b g ( ρ p ρ ) ρ p
In the equation:
u —continuous phase velocity;
u p —discrete phase particle velocity;
ρ —continuous phase density;
ρ p —discrete phase particle density.
To facilitate representation, the equations is reorganized into the general form shown below:
d u p d t = 1 τ p ( u u p ) + a
In the equation:
τ p —the integration time step used for calculating the particle motion trajectory;
a —the acceleration of the droplet under the combined action of buoyancy and gravity.
Due to the fact that the implicit Euler method and the trapezoidal interpolation method take into account most of the force variations acting on the particles, they have a broader applicability and higher effectiveness. Therefore, these two solution methods are more suitable for simulating the motion trajectories of discrete phase particles. By applying the implicit Euler method and the trapezoidal interpolation method to discretize and solve Equation (6), the trajectory and velocity of the particle at its next position can be obtained:
Implicit Euler method:
u p n + 1 = u p n + Δ t ( a + u n τ p ) 1 + Δ t τ p
Trapezoidal method:
u p n + 1 = u p n ( 1 1 2 Δ t τ p ) + Δ t τ p ( u n + 1 2 Δ t u p n · u n ) + Δ t a n 1 + 1 2 Δ t τ p
For the implicit and trapezoidal methods, the new particle position is obtained using the trapezoidal discretization of Equation (6), which is expressed as follows:
x p n + 1 = x p n + 1 2 Δ t ( u p n + u p n + 1 )

2.2.2. Mathematical Model for Heat and Mass Transfer in Flash Evaporation of Superheated Droplets

The droplet evaporation model incorporated in Fluent is primarily developed based on Spalding’s evaporation theory, in which the dimensionless mass transfer number B m is defined as:
B m = Y i , s Y i , 1 Y i , s
In the equation:
Y i , s —the saturated vapor mass fraction at the droplet surface;
Y i , —the vapor mass fraction in the surrounding environment.
As shown in Equation (10), the traditional droplet evaporation model assumes that the primary driving force for droplet evaporation arises from the vapor concentration difference between the droplet surface and the surrounding environment. However, for the flash evaporation of superheated droplets, the degree of superheat becomes the dominant driving factor. During the process from the onset of flash evaporation to equilibrium, the droplet surface remains in a constant state of evaporation, with the vapor mass fraction at the surface always equal to 1. If the built-in evaporation model in Fluent is applied under these conditions, the value of B m approaches infinity, implying that the droplet would evaporate instantaneously, which is clearly inconsistent with the actual physical behavior. The traditional droplet evaporation model assumes that the droplet temperature is lower than the ambient temperature and that evaporation occurs by absorbing heat from the surrounding environment. However, in the flash evaporation process, the energy required for evaporation is not derived from external heat input but is supplied by the droplet’s own superheat energy, providing the latent heat for vaporization. Therefore, before simulating the spray flash evaporation process, a new droplet evaporation model must be developed and implemented into Fluent to replace the default evaporation model.
The flash evaporation process occurs at an extremely rapid rate, completing within a very short period of time. To investigate the heat and mass transfer mechanisms during this process, a single droplet is selected for model development. Accordingly, the following fundamental assumptions are made:
(1)
The droplet maintains a spherical shape throughout the flash evaporation process;
(2)
The droplet is divided into an interior and an outer surface, with the temperature gradient assumed to exist only in the radial direction perpendicular to the spherical surface;
(3)
Flash evaporation occurs exclusively at the surface of the spherical droplet, and the surface temperature is assumed to remain constant at the saturation temperature corresponding to the working pressure of the expansion chamber;
(4)
No heat exchange occurs between the spherical droplet and the surrounding environment;
(5)
Both the vapor phase and liquid phase resulting from flash evaporation are in a saturated state;
(6)
The pressure inside the expansion chamber is constant and maintained at the working pressure.
Based on the above assumptions, it can be inferred that the spherical droplet transfers heat from its interior to the exterior along the radial direction perpendicular to the spherical surface. During the flash evaporation process, the droplet’s internal temperature continuously decreases, while the liquid at the outer surface absorbs heat and undergoes vaporization, leading to a continuous reduction in the overall droplet diameter. This process can be expressed mathematically as follows: considering a droplet with an initial mass m, over the time interval from t to t + d t , the droplet’s mass decreases by d m , and its temperature changes by d T i . The heat transfer equation is then established as:
h f g d m = 4 π r p 2 α s ( T p T v ) d t
In the equation:
h f g —the latent heat of vaporization under the current conditions, assumed to be constant;
r p —the radius of the spherical droplet;
T p —the temperature at the center of the spherical droplet;
T v —the saturation temperature corresponding to the working pressure of the expansion chamber;
α s —the overall heat transfer coefficient calculated at the outer surface of the droplet.
The expression for the flash evaporation rate of the spherical droplet [23] can be derived from Equation (11):
m e v = d m d t = 4 π r p 2 α s ( T p T v ) h f g
In the equation:
m ev —the rate of mass change of the spherical droplet.
α s can be obtained through the correlation proposed by Adachi [24], where Δ T represents the degree of superheat of the droplet.
α s = 0.76 Δ T 0.26   ( 0 Δ T < 5 ) 0.027 Δ T 2.33   ( 5 Δ T < 25 ) 13.8 Δ T 0.39   ( Δ T 25 )
The relationship describing the variation in droplet mass over time can be expressed by the following equation, where the negative sign on the right-hand side indicates the continuous reduction in droplet mass during the flash evaporation process:
d m p d t = m e v
In the equation: m p —the mass of the spherical droplet.
By integrating with respect to time t , the following expression can be obtained:
m p = m e v t + m p 0
In the equation: m p 0 —the initial mass of the spherical droplet.
The relationship between droplet mass and diameter yields the variation in droplet diameter with respect to mass:
m p = ρ p · 4 3 π r p 3 = ρ p · 1 6 π d p 3
d p = 6 m p π ρ p 1 / 3
In the equation: d p —the diameter of the spherical droplet;
ρ p —the density of the liquid.
Substituting Equations (12) and (15) into Equation (17) and simplifying, the following expression is obtained:
π 6 ρ p d p 3 + π α s T p T v h f g t d p 2 m p 0 = 0
By differentiating Equation (18) with respect to t , the expression for the variation in the droplet diameter with time is derived as:
d d p d t = 2 π α s ( T p T v ) π ρ p d p h f g + 4 π α s ( T p T v ) t
Based on the principle that the variation in the droplet surface temperature depends on the amount of internal energy transferred outward, the following expression for the temporal variation in the droplet surface temperature is established:
d T s d t = A p α s ( T p T s ) c p ρ p V p = 6 α s c p ρ p d p ( T p T s )
In the equation:
c p —the specific heat capacity of the liquid at constant pressure;
A p —the surface area of a spherical droplet;
V p —the volume of a spherical droplet;
T s —the surface temperature of a spherical droplet.
The present model is established based on the assumptions of constant droplet surface temperature, spherical droplet morphology, and pure water conditions, making it suitable for simulating the flash evaporation of highly superheated small droplets. However, the following limitations should be noted in practical applications: (1) for large droplets or low superheat conditions, thermal conduction delays may cause surface temperature fluctuations; (2) for saline wastewater, additional considerations including boiling point elevation and salt crust resistance are required; (3) radiative heat transfer and droplet breakup effects may become non-negligible under extreme conditions. Future work will focus on enhancing the model’s adaptability to these scenarios.

2.2.3. Atomization Model

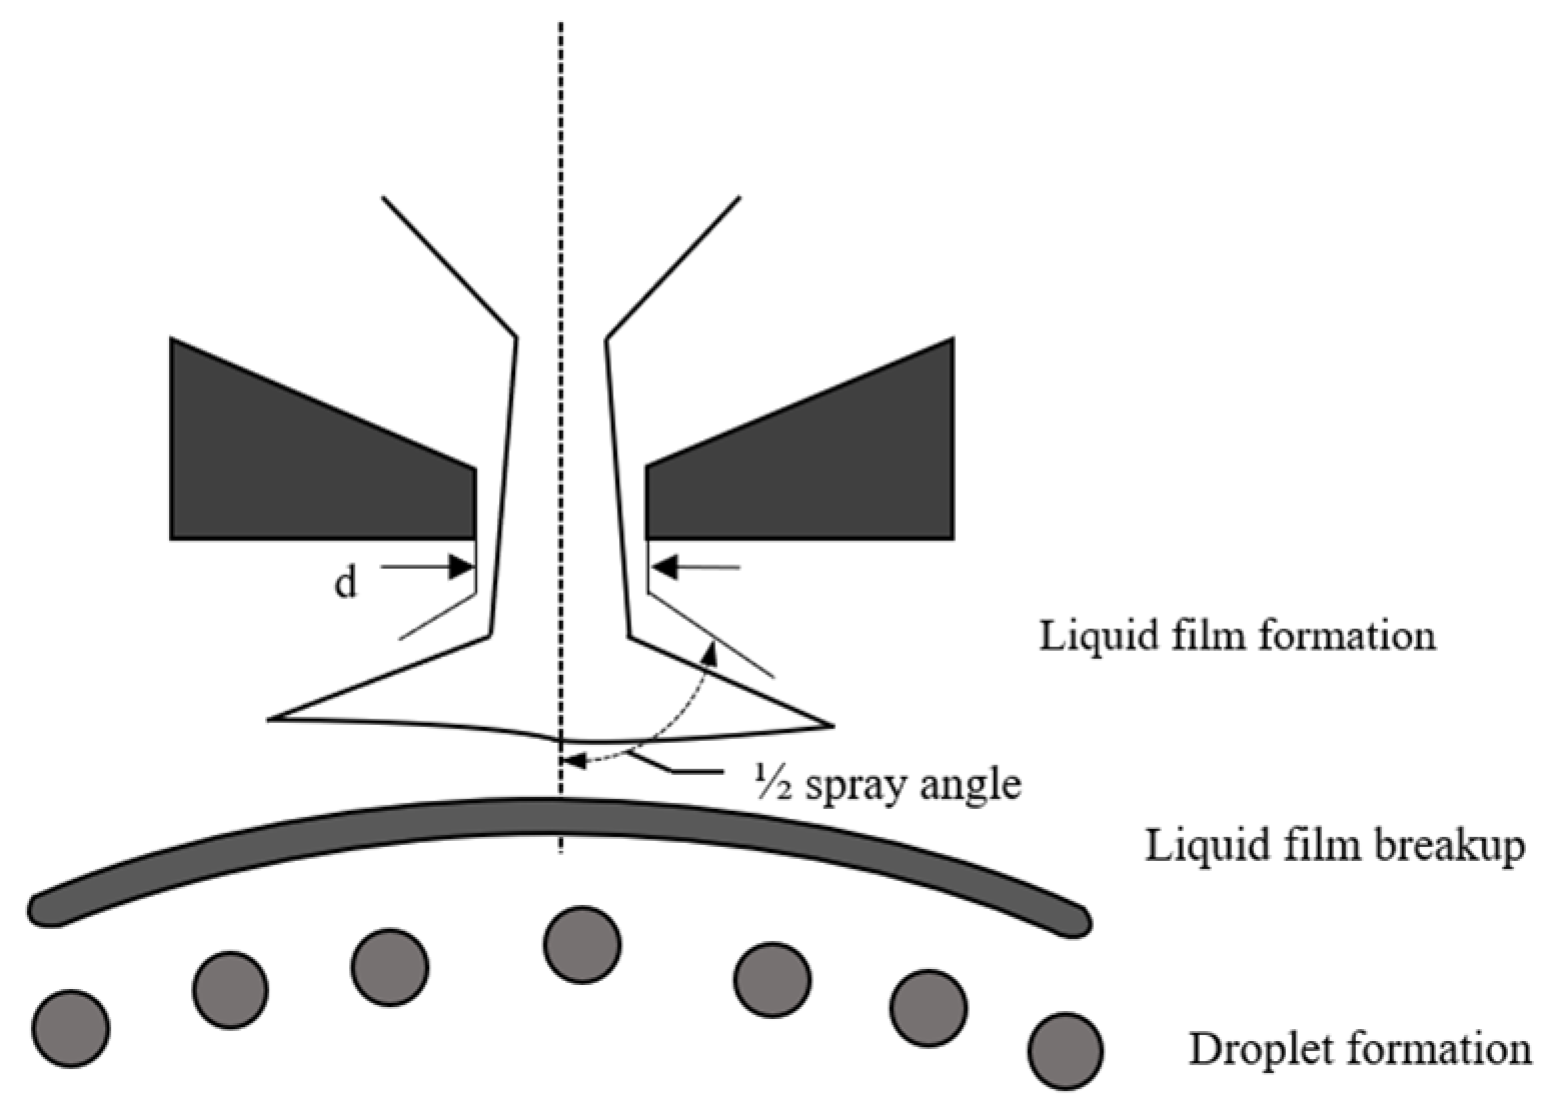
During the simulation process, a pressure-swirl atomizing nozzle was employed, which features internal swirl vanes. High-pressure water flows through these swirl vanes, inducing rotational acceleration. This process causes the liquid to be pressed against the inner wall of the nozzle. Upon exiting the nozzle, the liquid forms a thin liquid film while generating a hollow core region at the nozzle’s center. Due to the relatively high tangential velocity retained by the liquid film upon exiting the nozzle, centrifugal forces lead to the formation of a specific cone angle. Simultaneously, the high-speed liquid film interacts with the surrounding air, generating intense entrainment effects. These interactions result in the fragmentation of the liquid film into droplets, achieving the atomization process [25] as illustrated in Figure 3.

3. Mesh Generation and Boundary Conditions

The flash tank was modeled and meshed using Gambit 2.4.6 software. The tank was divided into three regions: the steam outlet zone, the flash vaporization zone, and the bottom waste liquid zone. To simplify the meshing process, unstructured meshes were applied to the steam outlet and bottom waste liquid zones, while structured meshes were employed in the flash vaporization zone due to the complexity of the physical processes occurring in this region. This strategy ensured high simulation accuracy, reduced convergence difficulty, and shortened computational time. The dimensions of the flash tank are provided in Figure 4a, with a cylinder inner diameter of 0.8 m, a cylinder height of 1 m, and a head short semi-axis length of 0.2 m. The overall mesh distribution of the flash tank is shown in Figure 4b, consisting of a total of 619,082 cells. During the iterative computation process, the residuals of this mesh were maintained below 1 × 10⁻⁴.
The spray flash evaporation process was simulated using transient calculations, with a time step size of 0.0001 s. The SIMPLEC algorithm was employed to couple pressure and velocity, and the pressure correction under-relaxation factor was set to 1.0. A UDF based on the established droplet evaporation model was implemented in FLUENT to describe the heat and mass transfer during the flash evaporation of atomized droplets. This UDF was designated as the sole mechanism for thermal and mass exchange in the spray flash evaporation process. The inlet boundary was defined at the nozzle outlet, with the nozzle being a pressure-swirl type, having an inner diameter of 1 mm. The working fluid was water, and the evaporation process produced water vapor. Atomization angle, outlet temperature, pressure, and flow rate were specified according to the various simulation conditions. The specific parameters are shown in Table 1:
The initial pressure and temperature inside the flash tank were set to 0.1 MPa and 300 K, respectively. The outlet boundary of the model was defined as the steam outlet at the top of the flash tank. For the vapor phase, the outlet was set as a pressure outlet with a pressure of 0.1 MPa, while for the discrete phase, the outlet was defined as an escape boundary. The wall boundary conditions in the flash vaporization region were specified as adiabatic for the vapor phase and reflective for the discrete phase, with the tangential coefficient set to 1 and the normal coefficient set to 0.

4. Results and Discussion

4.1. The Evolution of the Temperature Field Inside the Flash Tank

The flow field evolution inside the expansion flash tank was analyzed under representative operating conditions, with feedwater temperature set to 300 °C and pressure to 10 MPa, an atomization angle of 80°, and a flow rate of 0.3 t/h.
To illustrate the temperature field variation during the wastewater expansion and evaporation process, a longitudinal section of the flash tank was selected for analysis. Figure 5 presents the temporal evolution of the temperature field of the vapor phase within the longitudinal section during the spray flash evaporation process, with the scale unit in Kelvin. As observed in Figure 5, the temperature field of the continuous phase gradually increases during the spray process and approaches a steady state in the later stages of flash evaporation. This behavior can be attributed to the fact that, in the early stages of spray flash evaporation, the temperature near the nozzle is relatively low, and the superheated droplets begin to evaporate immediately after exiting the nozzle. However, as high-temperature droplets are continuously injected, the heat carried by these droplets raises the temperature of the continuous phase near the nozzle outlet, thereby deteriorating the heat transfer conditions and causing an expansion of the affected region. In the later stages of flash evaporation, a dynamic equilibrium is reached where the number of high-temperature droplets entering the flash tank equals the number of evaporated and extinguished droplets within the same period. At this point, the evaporation process within the flash tank stabilizes, and the region of the continuous phase temperature field ceases to expand further. Additionally, two localized high-temperature zones, with temperatures around 500 K, appear on both sides of the hollow conical spray region formed by the atomizing nozzle. This phenomenon occurs because the high-speed flow of superheated droplets induces vortices in the continuous phase flow field outside the cone, which entrain high-temperature superheated droplets from the outer surface of the cone, forming additional high-temperature zones.
Figure 6 depicts the motion trajectories and heat transfer characteristics of superheated spray droplets inside the flash tank at t = 0.0012 s, t = 0.0038 s, and t = 0.007 s. To more closely replicate the actual atomization effect of the nozzle, the simulation of the discrete phase was conducted by employing the Rosin–Rammler (R-R) particle size distribution model, initializing 30 different droplet sizes of superheated liquid, which were injected in the form of a swirling spray. Combining the observations from Figure 7, it can be seen that within a very short time after the droplets exit the nozzle (approximately 0.006 s), their temperatures decrease to the saturation temperature corresponding to the pressure inside the flash tank (373 K) and thus lose their ability to release superheat. This indicates that the evaporation process of the superheated spray primarily occurs near the nozzle outlet. This conclusion is consistent with the findings in Figure 5, where the influence of the discrete phase on the temperature field of the continuous phase is predominantly concentrated in the region near the nozzle.
In Figure 6, a “tearing” phenomenon is observed at the conical surface’s trailing end during the middle and later stages of flash evaporation, whereas this phenomenon is absent in the front and middle sections of the atomized conical spray. Combining this observation with Figure 8, it is evident that the higher droplet velocity in the front and middle sections of the conical spray causes the disruptive effects of micro-explosions on the conical surface to be delayed. In contrast, at the trailing end of the cone, where the droplet velocity is significantly lower, the previously delayed micro-explosion effects are fully released. This leads to the pronounced “tearing” observed at the trailing end of the conical spray.

4.2. The Effect of Feedwater Temperature

Under the conditions of a constant feedwater mass flow rate of 0.3 t/h, a pressure of 25 MPa, and a spray duration of 15 ms, numerical simulations were conducted to investigate the variation patterns of droplet temperature, droplet velocity, and the average droplet mass within the flash tank as a function of spray time. The average droplet mass is calculated using the following equation:
m ¯ = Q n
In the equation:
Q —the mass flow rate of the feedwater, kg/s;
n —the number of droplet particles injected into the flash tank through the nozzle.
When the spray duration is the same, the number of droplets, n, remains constant. Therefore, for operating conditions with the same spray duration, the variation in the average droplet mass can be used to reflect the flash evaporation amount under those conditions.
As shown in Figure 9, the flash evaporation process occurs within an extremely short duration, with the droplet temperature inside the flash tank dropping to the saturation temperature corresponding to ambient pressure within 6 ms. With an increase in feedwater temperature, the time required for the droplet temperature to decrease slightly increases; however, the increment is minimal.
This numerical simulation conclusion is highly consistent with published experimental research results, particularly with the experimental observations of Mutair et al. [15] on superheated water jets, thereby providing strong evidence for the accuracy of the custom heat and mass transfer model used in this study. In their experiments, Mutair et al. explicitly stated that an increase in the degree of superheat significantly accelerates the flash evaporation process and directly defined it as “the driving force that controls the intensity of flash evaporation.” Their research also found that a higher degree of superheat leads to a significant reduction in the height of the jet’s inflection point, where intense breakup occurs, which implies that droplets can atomize earlier and more violently, thus providing a larger surface area for evaporation. Therefore, the trend of increasing vaporization rate with rising temperature simulated in this study is in complete agreement with the physical laws observed in experiments.
As shown in Figure 10, for droplets with the same average mass, higher feedwater temperatures result in greater flash evaporation amounts, with vaporization ratios of 19.78%, 38.02%, and 55.88% observed at feedwater temperatures of 240 °C, 300 °C, and 360 °C, respectively. The droplet mass reduction rate increases with rising temperature, which can be attributed to the fact that, under constant flash evaporation pressure, a higher feedwater temperature corresponds to a higher degree of superheat. Superheat is the primary driving force for the flash evaporation process, and droplets with higher superheat exhibit greater instability in low-pressure environments, making them more prone to evaporation. This observation is consistent with published results where a higher initial temperature difference was found to promote bubble growth and improve spray atomization, leading to smaller droplet diameters [17]. Both findings confirm that a greater degree of superheat intensifies the flash evaporation process.
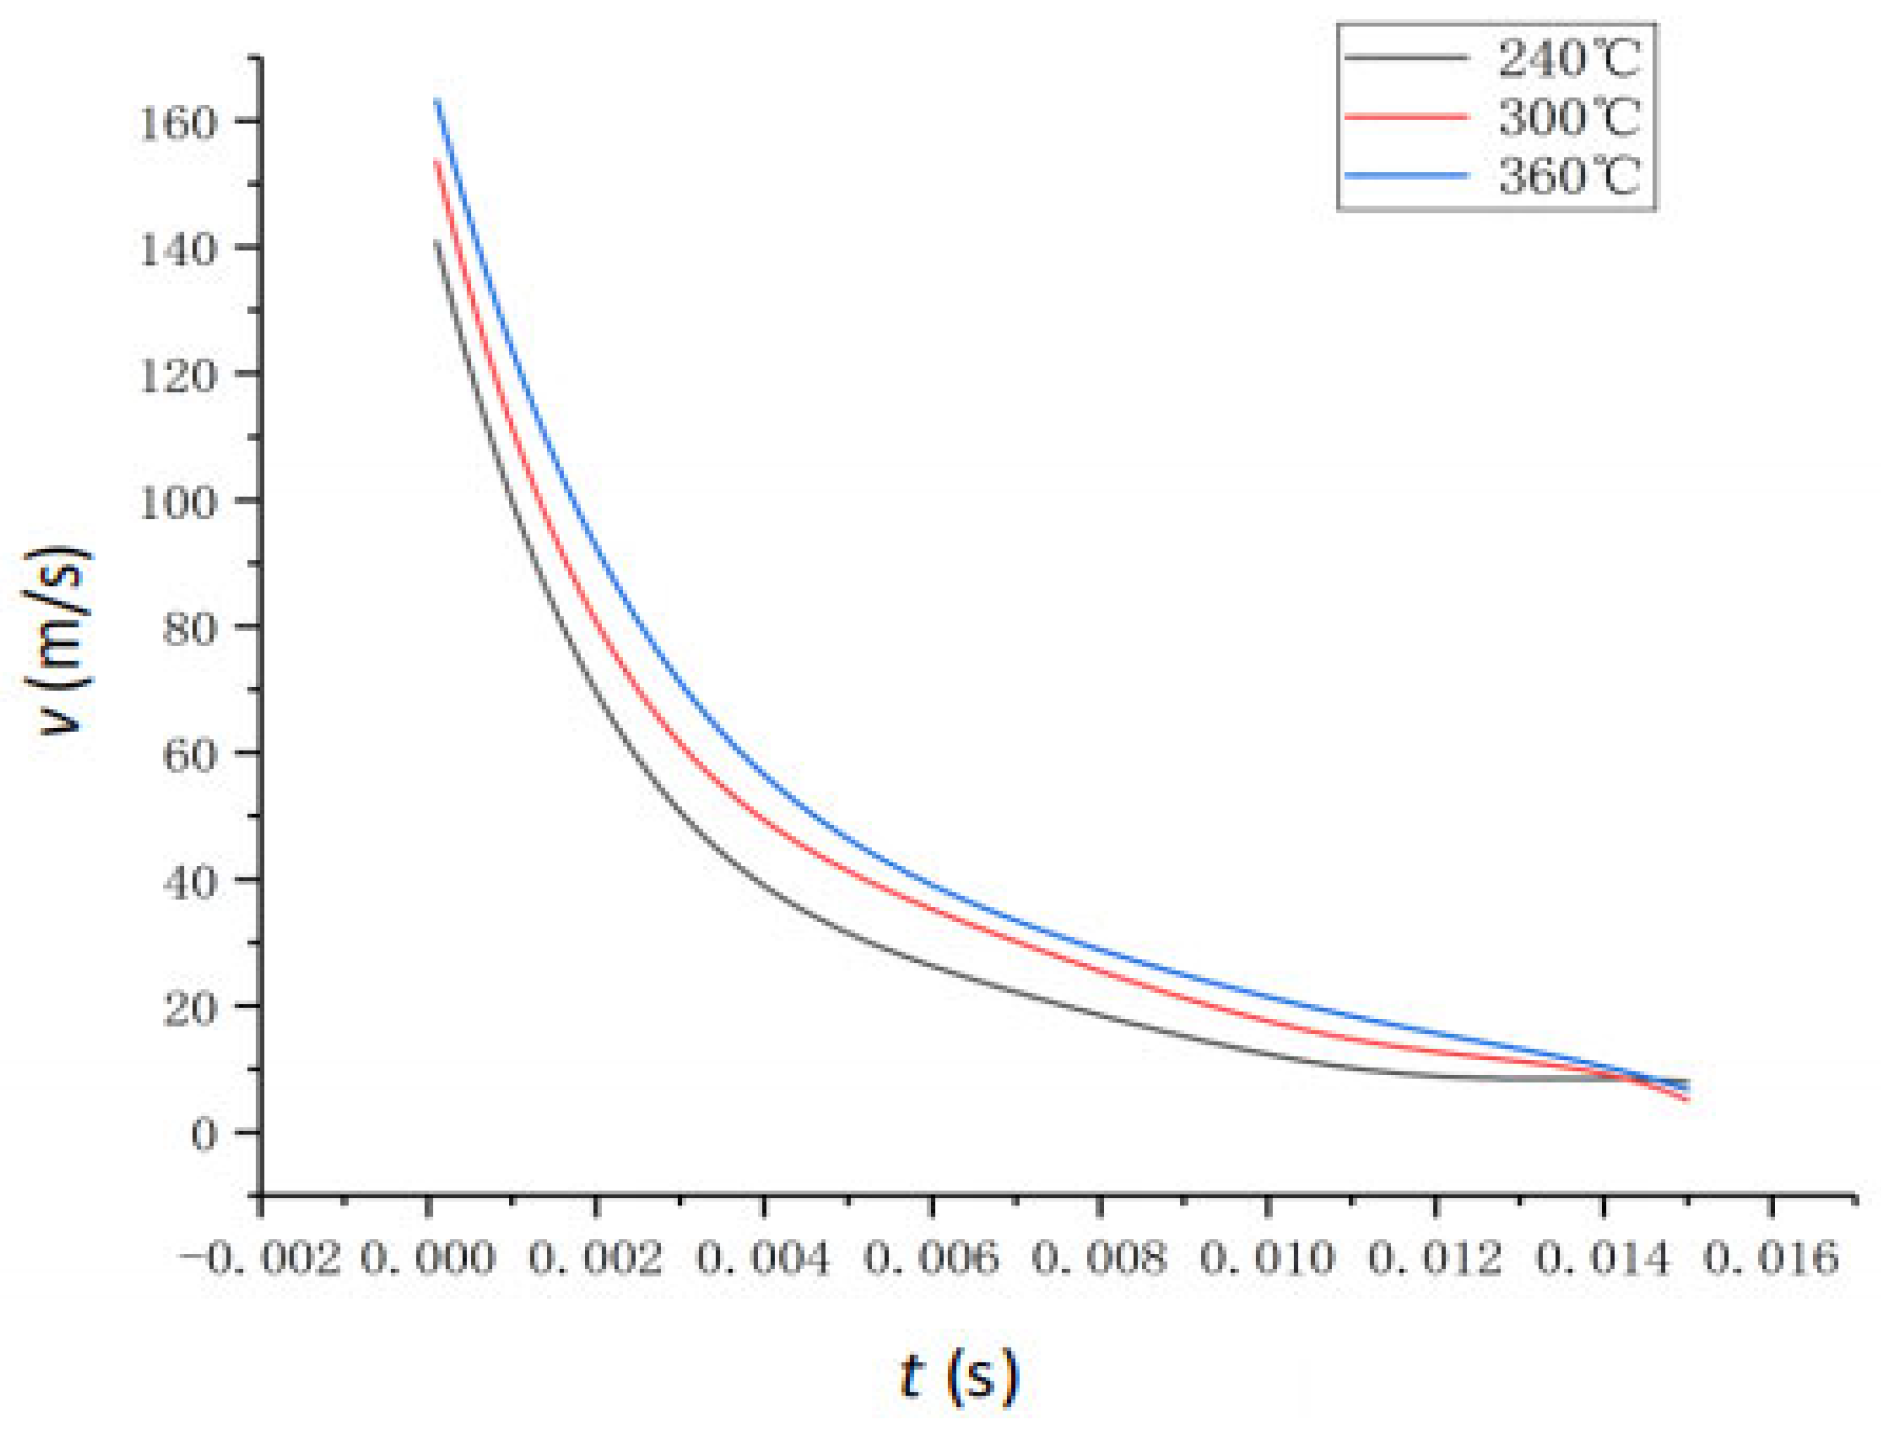
Figure 11 presents the simulation results of the variation in droplet velocity over time. As shown in the figure, during the initial and final stages of flash evaporation, the velocity reduction rates of droplets are nearly identical under different feedwater temperatures. However, during the mid-stage of flash evaporation (approx. between 1 and 6 ms), significant differences in the velocity reduction rates are observed. This is because, in the initial and final stages, the droplets themselves do not generate vapor. In contrast, during the mid-stage of flash evaporation, droplets with higher degrees of superheat exhibit faster evaporation rates, leading to a higher vapor generation rate at the droplet surface. The velocity of the vapor flow, which is opposite to the direction of the droplet motion, is relatively higher. Consequently, droplets with higher superheat experience a more pronounced deceleration effect from the surrounding vapor during this period.

4.3. The Effect of Feedwater Pressure

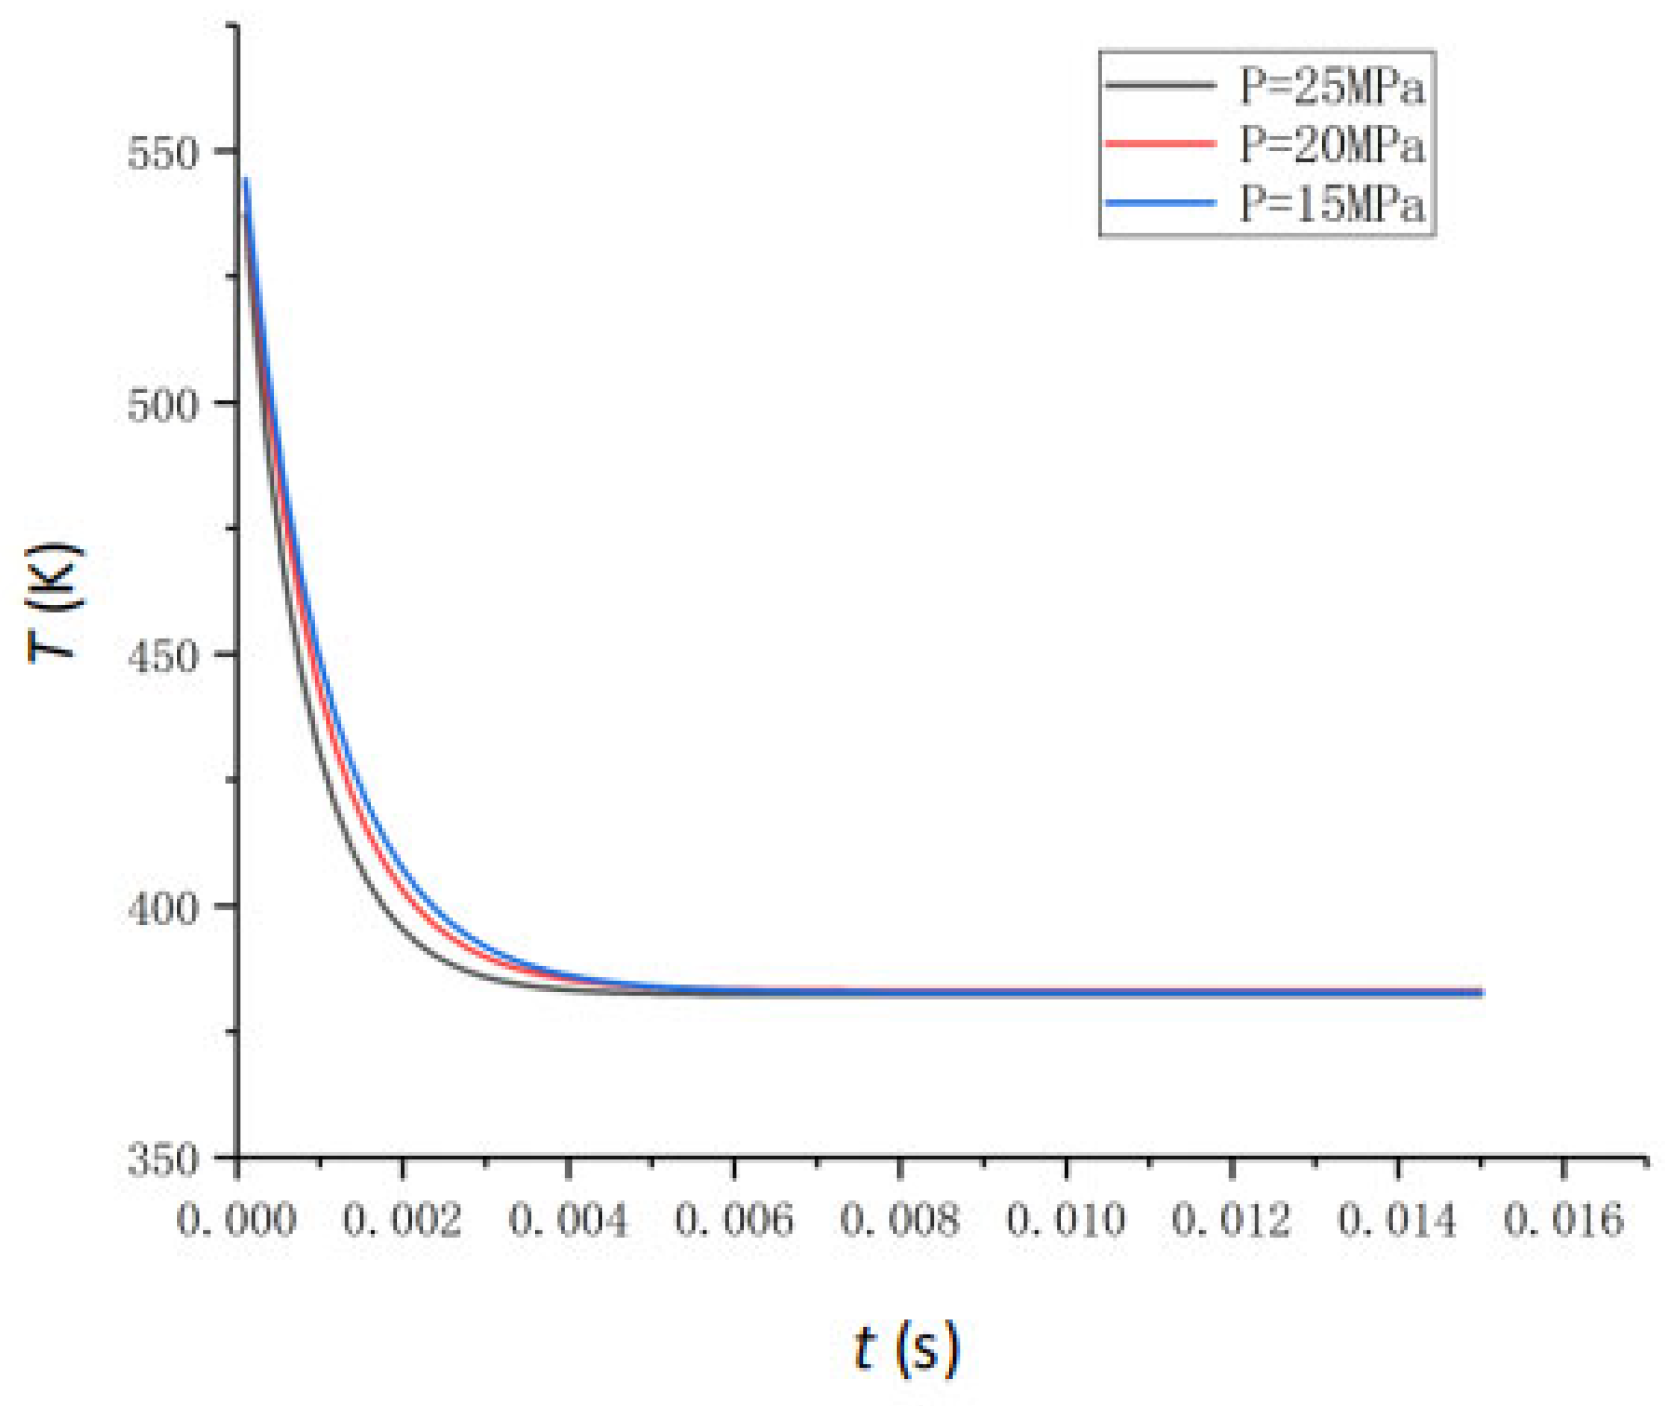
Under constant conditions including a feedwater temperature of 300 °C, a spray angle of 80°, a mass flow rate of 0.3 t/h, and a spray duration of 15 ms, simulations were conducted by varying the feedwater pressure. Figure 12 shows the simulated results of atomized droplet temperature variation over time under different feedwater pressures. As seen in Figure, the temperature of the superheated atomized droplets drops to the saturation temperature corresponding to the flash chamber pressure (373 K) within 6 ms and then remains constant. At this point, the superheat of the atomized droplets becomes zero, eliminating the driving force for further flash evaporation, and the process stops. Additionally, the higher the pressure, the earlier the flash evaporation stops.
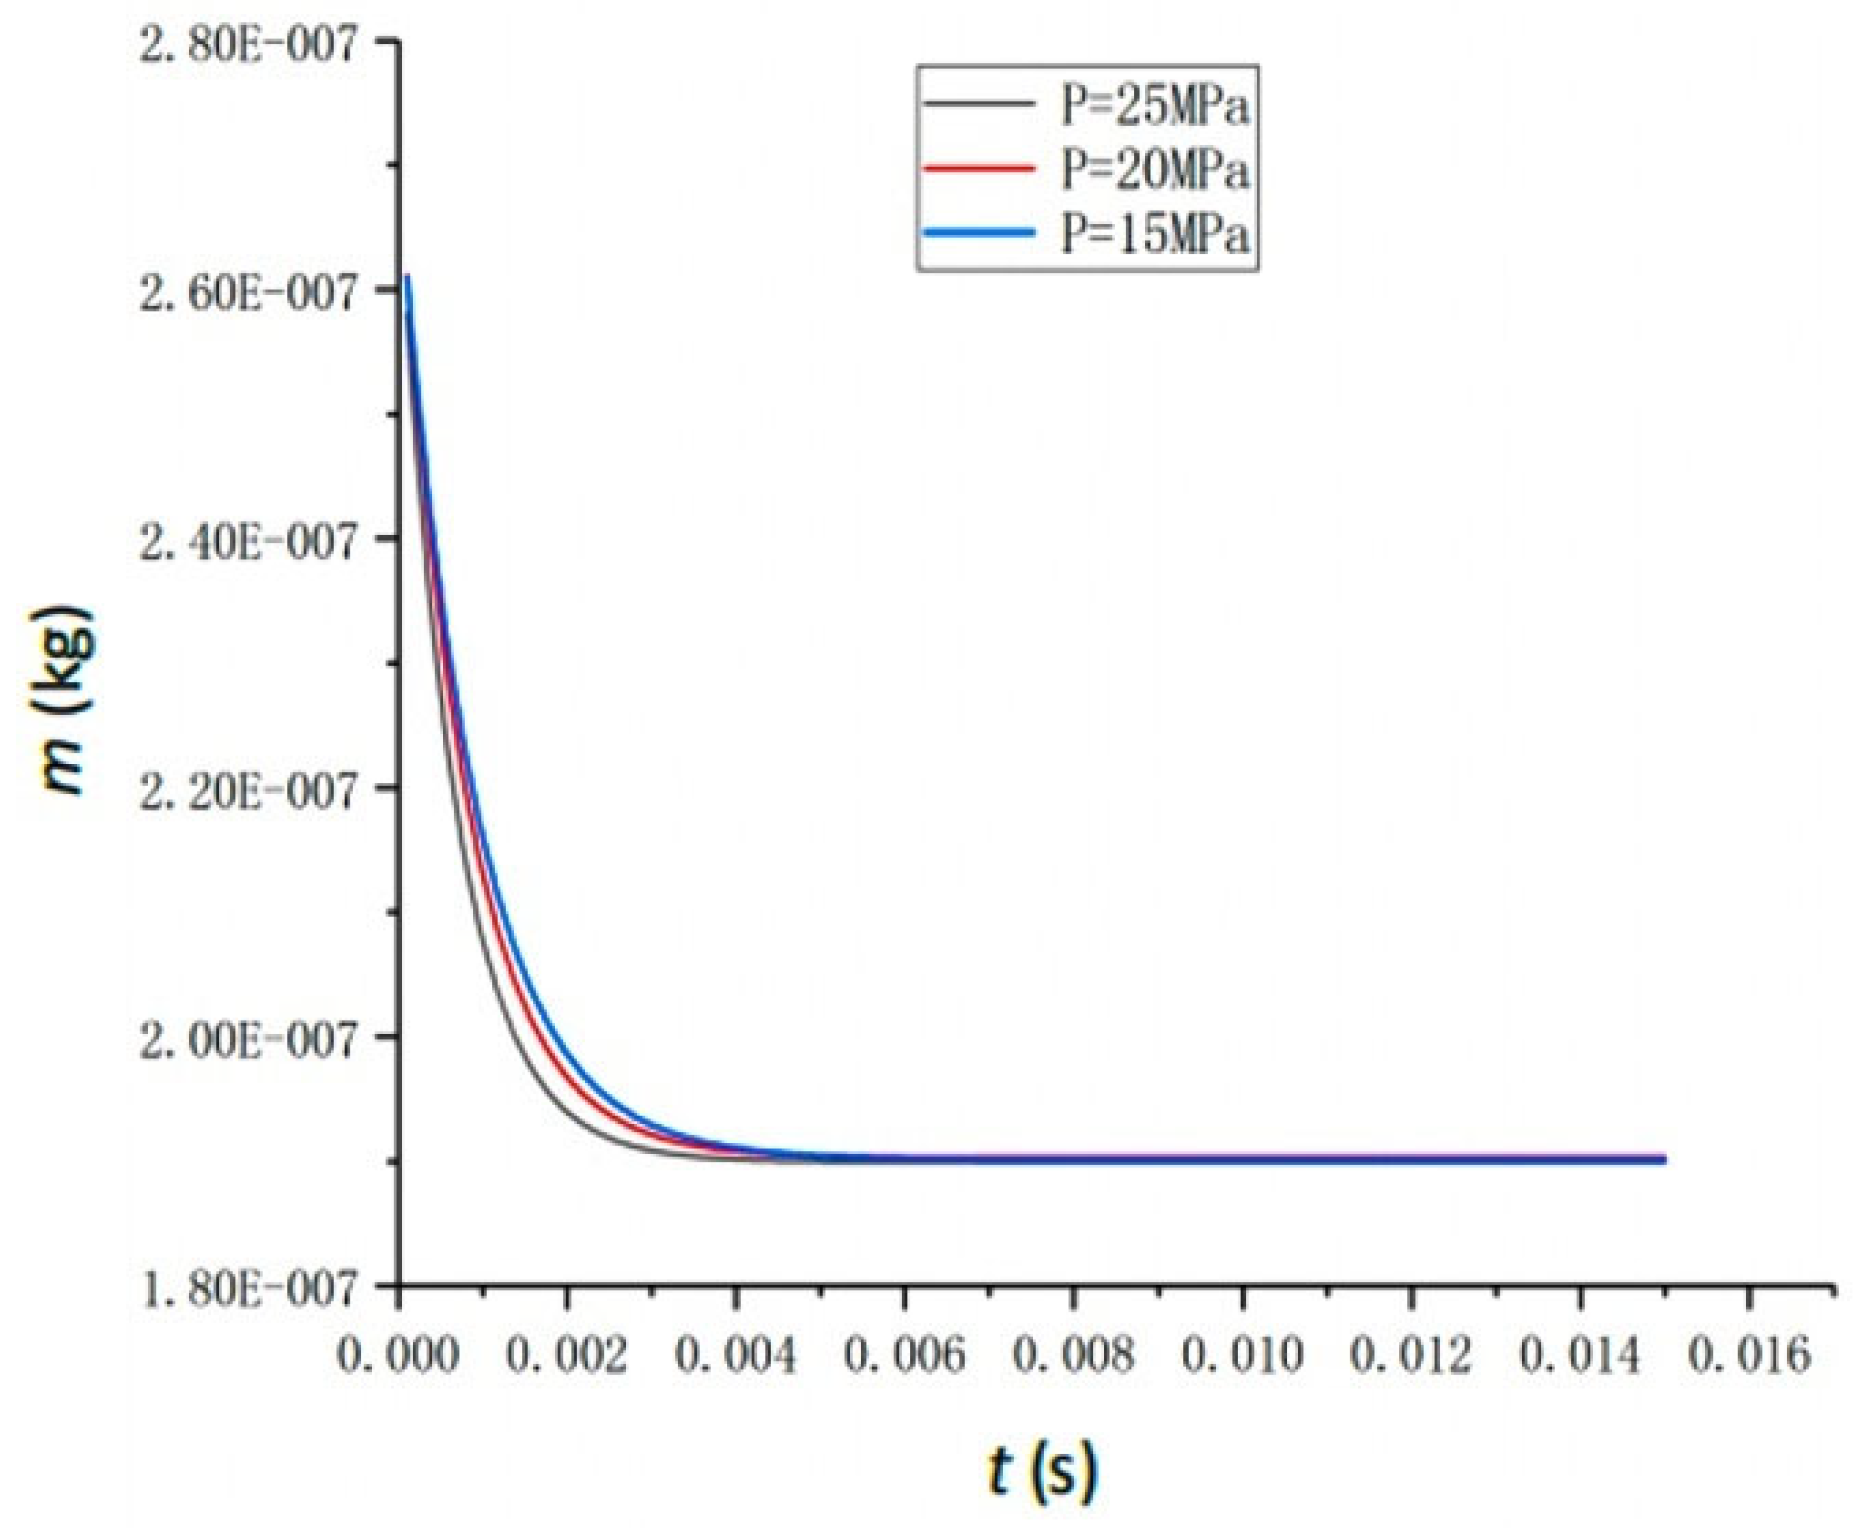
Figure 13 shows the simulation results of the variation in the average mass of atomized droplets over time under different feedwater pressures, with other parameters remaining constant. As seen in Figure 13, the higher the pressure, the faster the rate of decrease in the average mass of the droplets. However, the final reduction in the average mass of the droplets is the same under different pressures.
A comprehensive comparison of Figure 12 and Figure 13 reveals that increasing the feedwater pressure can, to some extent, shorten the time required for the flash evaporation process to reach equilibrium. However, it has no impact on the final flash evaporation water extraction efficiency. Under the simulated conditions (T0 = 300 °C; P0 = 25~15 MPa), the final vaporization rate of the atomized droplets during flash evaporation is consistently 33.93%.

4.4. The Effect of Nozzle Atomization Angle

Under constant parameters including a feedwater temperature of 300 °C, a feedwater pressure of 25 MPa, and a mass flow rate of 0.3 t/h, simulations were conducted by varying the nozzle spray angle. Figure 14 illustrates the simulated velocity vector field of the continuous phase and the flow field of the dispersed phase near the nozzle under different atomization angles. As shown in Figure 14, a larger initial spray cone angle enables the spray to achieve full coverage within the flash tank at an earlier position. The steam velocity near the nozzle outlet increases with the atomization cone angle, which can be attributed to the higher accumulation of highly superheated liquid in this region as the cone angle expands, leading to an increased steam generation rate and a stronger driving force for local flow. Additionally, a larger atomization cone angle enhances the entrainment effect on droplets near the nozzle, increasing their residence time within the flash tank. While an expanded spray cone angle improves droplet coverage, its contribution to the thoroughness of the flash evaporation process is relatively minor. Furthermore, smaller droplets at the edges of a large cone angle spray may be carried upward by the airflow, potentially contaminating the steam at the flash tank outlet and causing salt deposition on the tank walls. Therefore, in practical applications, it is sufficient to ensure that droplets have adequate evaporation time within the flash tank, and excessively large atomization cone angles are unnecessary.
Figure 15 presents the simulated results of the variation in the average mass of atomized droplets over time under different atomization angles. From Figure 14 and Figure 15, it can be observed that the final flash evaporation rate achieved under different atomization angles is identical to that shown in Figure 13. This indicates that altering the nozzle atomization angle has minimal impact on the variation in droplet velocity and average droplet mass within the flash tank. The primary reason for this is that the main flash evaporation process occurs near the nozzle outlet. Although, in theory, a larger atomization angle could allow atomized droplets to achieve greater coverage in the low-pressure environment, providing a larger heat transfer surface, in practice, droplets with sufficient flash evaporation potential are concentrated near the nozzle outlet. Hence, the advantage of large-angle atomizing nozzles is not evident in high-temperature and high-pressure spray flash evaporation processes.

4.5. The Effect of Mass Flow Rate

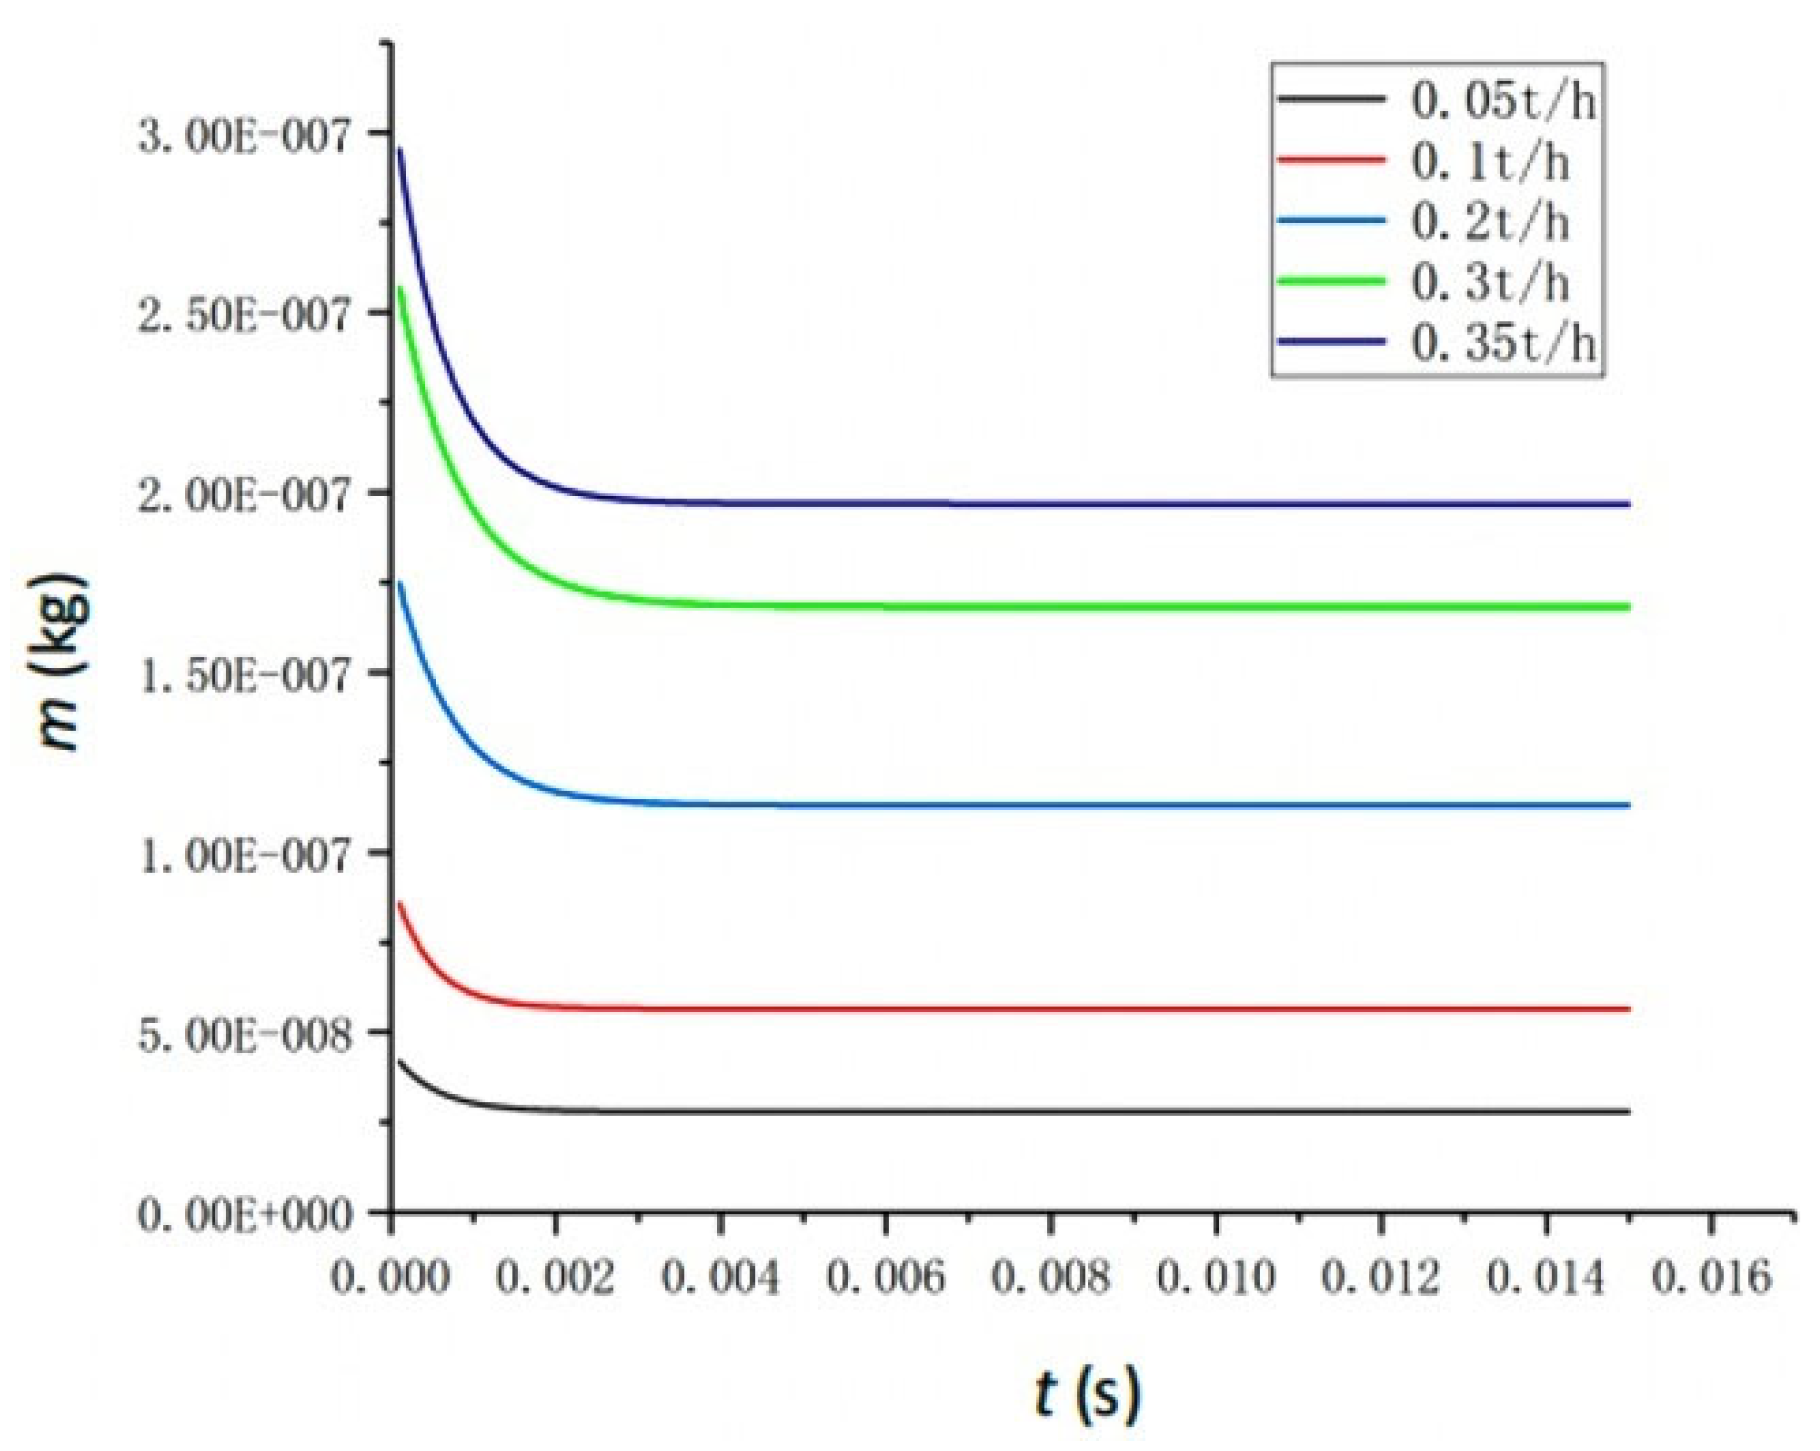
To reflect the overall variation in droplet mass within the flash tank over time, the average droplet mass method is employed. For operating conditions with the same spray duration, the initial average droplet mass increases with an increase in the feedwater mass flow rate. Under constant parameters including a feedwater temperature of 300 °C, a feedwater pressure of 25 MPa, and a nozzle spray angle of 80°, simulations were conducted by varying the feedwater flow rate.
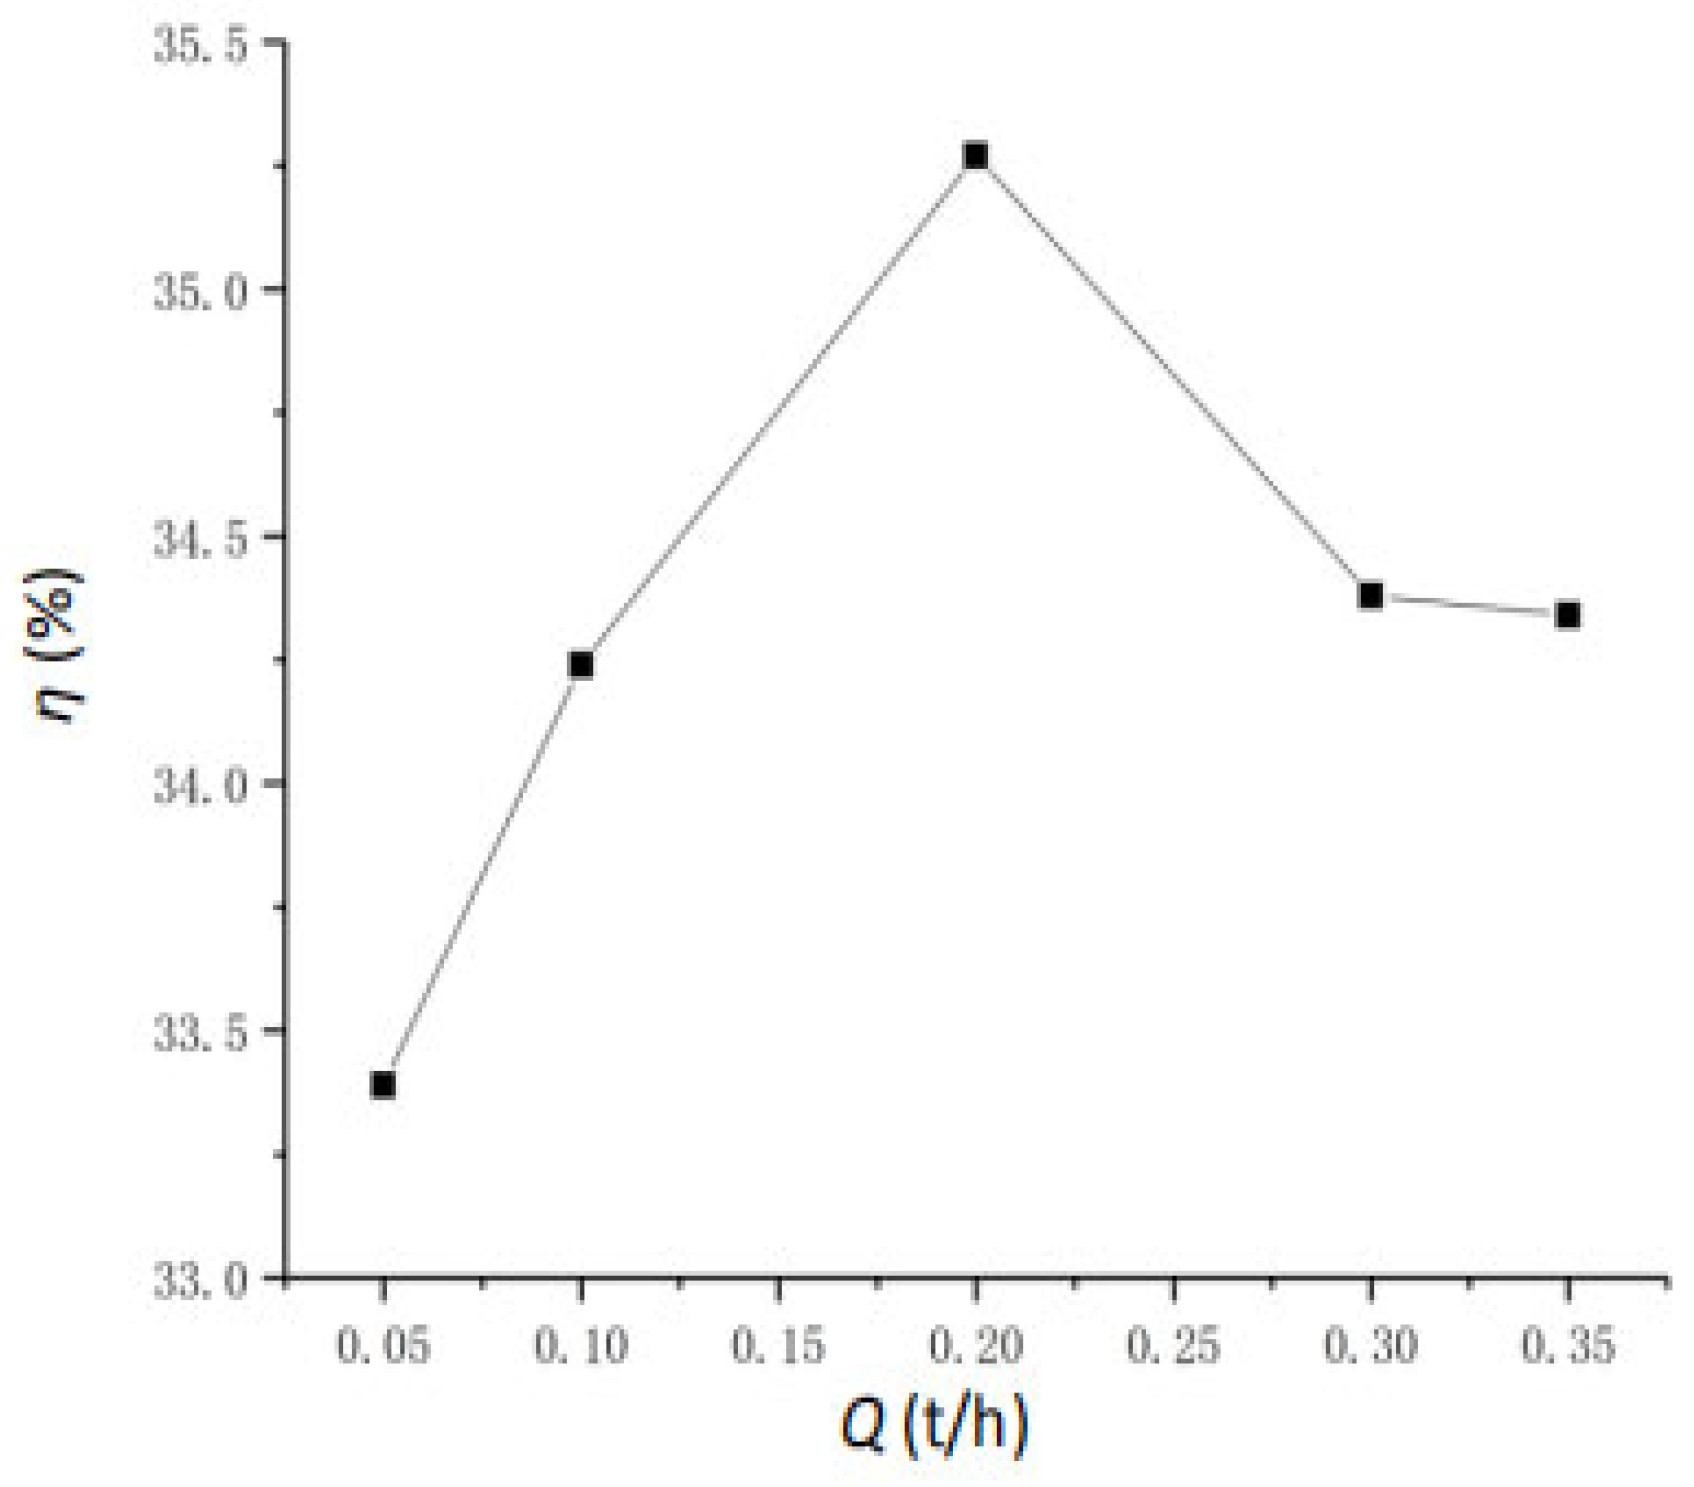
Figure 16 presents the simulated results of the variation in average droplet mass over time under different feedwater flow rates. As shown in the figure, an increase in mass flow rate prolongs the time required for flash evaporation to stabilize, and the flash evaporation rate (vaporization rate) differs under varying flow rate conditions. When the feedwater mass flow rate ranges from 0.05 to 0.2 t/h, the vaporization rate increases with the flow rate. However, when the mass flow rate exceeds 0.2 t/h, the vaporization rate decreases with further increases in flow rate, as illustrated in Figure 17. This phenomenon occurs because the volume of the flash tank is fixed. Excessive liquid mass injected into the tank per unit time reduces the space available for steam release. Additionally, an excessive number of droplets deteriorates the heat transfer conditions between individual droplets and the surrounding environment, hindering the evaporation process.

5. Conclusions

This study reveals the mechanisms of heat and mass transfer during the high-temperature and high-pressure water spray flash evaporation process, as well as the influence of various parameters on the flash evaporation process:
(1)
Rapid Droplet Evaporation Driven by Internal Boiling: Superheated droplets (240–360 °C, 1–25 MPa) in a low-pressure (0.1 MPa) environment evaporate rapidly, reaching equilibrium in approximately 6 ms. Vaporization rates significantly increase with temperature, from 19.78% (240 °C) to 55.88% (360 °C). VOF simulations show that this process is dominated by internal boiling and droplet fragmentation, with internal bubble formation, expansion, and subsequent micro-explosions.
(2)
Key Parameter Impacts on Vaporization Rate: Feedwater temperature is the primary determinant of the vaporization rate. While increased feedwater pressure accelerates the process to equilibrium, it negligibly affects final water extraction efficiency (stable at ~33.93% for 300 °C feedwater across various pressures). The atomization angle shows minimal impact (<1% change) on the vaporization rate. An optimal feedwater flow rate of 0.2 t/h yields a peak vaporization rate of 42.6%; higher rates decrease efficiency due to fixed space limitations.
The proposed technology offers an efficient solution for the ZLD of desulfurization wastewater, particularly for high-salinity and scaling-prone wastewater. Practical application requires optimizing feedwater temperature with available waste heat and using corrosion-resistant materials. Future research will focus on experimental validation with saline wastewater and economic analysis of coupling this technology with other ZLD processes.

Author Contributions

L.Z.: Conceptualization; Methodology; Software; Formal Analysis; Writing—Original Draft; Visualization. Z.L.: Conceptualization; Methodology; Supervision; Validation; Writing—Review and Editing; Project Administration. All authors have read and agreed to the published version of the manuscript.

Funding

This work was supported by the National Key R&D Program subproject (2018YFB0604303-01).

Data Availability Statement

The data that support the findings of this study are available from the corresponding author upon reasonable request.

Conflicts of Interest

The funders had no role in the design of the study; in the collection, analyses, or interpretation of data; in the writing of the manuscript; or in the decision to publish the results.

Abbreviations

The following abbreviations are used in this manuscript:
θ e m p dimensionless temperature
κ turbulent kinetic energy
ε turbulent dissipation rate
ρ density
ttemperature
τ time
λ thermal conductivity
c specific heat capacity
φ the heat generated per unit time and per unit volume within the control element
B m dimensionless mass transfer number
Y i , s the saturated vapor mass fraction at the droplet surface
Y i , the vapor mass fraction in the surrounding environment
m mass
t time
F b buoyancy force
F d drag force
g gravitational acceleration
h f g the latent heat of vaporization under the current conditions
r p the radius of the spherical droplet
α s the overall heat transfer coefficient calculated at the outer surface of the droplet
T temperature
d p the diameter of the spherical droplet
A p the surface area of a spherical droplet
V p the volume of a spherical droplet
m ¯ the average droplet mass
Q the mass flow rate of the feedwater
n the number of droplet particles injected into the flash tank through the nozzle
Ppressure
ZLDzero-liquid discharge
DPMdiscrete phase model
FGDflue gas desulfurization
MEDmulti-effect distillation
UDFuser-defined function

References

  1. Li, Y.; Li, X.; Wang, L.; Li, Y. Limestone-gypsum wet flue gas desulfurization based on Cyber-Physical System. In Proceedings of the 2019 Chinese Control And Decision Conference (CCDC), Nanchang, China, 3–5 June 2019; pp. 473–477. [Google Scholar] [CrossRef]
  2. Kang, Q.; Yuan, Y. Diagnosis and Traceability Analysis of Slurry Foaming of Limestone-Gypsum Wet Flue-Gas Desulfurization (WFGD) System. Water Air Soil Pollut. 2023, 234, 108. [Google Scholar] [CrossRef]
  3. Xu, F.; Zhao, S.; Li, B.; Li, H.; Ling, Z.; Zhang, G.; Liu, M. Current status of zero liquid discharge technology for desulfurization wastewater. Water 2024, 16, 900. [Google Scholar] [CrossRef]
  4. Shanmuganathan, S.; Johir, M.A.H.; Listowski, A.; Vigneswaran, S.; Kandasamy, J. Sustainable processes for treatment of waste water reverse osmosis concentrate to achieve zero waste discharge: A detailed study in water reclamation plant. Procedia Environ. Sci. 2016, 35, 930–939. [Google Scholar] [CrossRef]
  5. Aly, S.; Manzoor, H.; Simson, S.; Abotaleb, A.; Lawler, J.; Mabrouk, A.N. Pilot testing of a novel Multi Effect Distillation (MED) technology for seawater desalination. Desalination 2021, 519, 115221. [Google Scholar] [CrossRef]
  6. Deng, J.-J.; Pan, L.-M.; Chen, D.-Q.; Dong, Y.-Q.; Wang, C.-M.; Liu, H.; Kang, M.-Q. Numerical simulation and field test study of desulfurization wastewater evaporation treatment through flue gas. Water Sci. Technol. 2014, 70, 1285–1291. [Google Scholar] [CrossRef] [PubMed]
  7. Mansour, A.; Müller, N. A review of flash evaporation phenomena and resulting shock waves. Exp. Therm. Fluid Sci. 2019, 107, 146–168. [Google Scholar] [CrossRef]
  8. Mujumdar, A.S.; Alterman, D.S. Drying in the pharmaceutical and biotechnology fields. In Handbook of Downstream Processing; Springer: Dordrecht, The Netherlands, 1997; pp. 235–260. [Google Scholar] [CrossRef]
  9. Jiang, S.; Luo, W.; Peng, Q.; Wu, Z.; Li, H.; Li, H.; Yu, J. Effects of flash evaporation conditions on the quality of UHT milk by changing the dissolved oxygen content in milk. Foods 2022, 11, 2371. [Google Scholar] [CrossRef]
  10. Ma, W.; Zhai, S.; Zhang, P.; Xian, Y.; Zhang, L.; Shi, R.; Sheng, J.; Liu, B.; Wu, Z. Research progresses of flash evaporation in aerospace applications. Int. J. Aerosp. Eng. 2018, 2018, 3686802. [Google Scholar] [CrossRef]
  11. Goto, S.; Yamamoto, Y.; Sugi, T.; Yasunaga, T.; Ikegami, Y.; Nakamura, M. Construction of simulation model for spray flash desalination system. Electr. Eng. Jpn. 2010, 170, 9–17. [Google Scholar] [CrossRef]
  12. Miyatake, O.; Tomimura, T.; Ide, Y.; Fujii, T. An experimental study of spray flash evaporation. Desalination 1981, 36, 113–128. [Google Scholar] [CrossRef]
  13. Miyatake, O.; Tomimura, T.; Ide, Y.; Yuda, M.; Fujii, T. Effect of liquid temperature on spray flash evaporation. Desalination 1981, 37, 351–366. [Google Scholar] [CrossRef]
  14. Uehara, H. Experimental study of spray flash evaporation for desalination and otec. In Proceedings of the Joint Solar Engineering Conference, Washington, DC, USA, 4–8 April 1993; ASME: New York, NY, USA, 1993. [Google Scholar]
  15. Mutair, S.; Ikegami, Y. Experimental study on flash evaporation from superheated water jets: Influencing factors and formulation of correlation. Int. J. Heat Mass Transf. 2009, 52, 5643–5651. [Google Scholar] [CrossRef]
  16. Mutair, S.; Ikegami, Y. Experimental investigation on the characteristics of flash evaporation from superheated water jets for desalination. Desalination 2010, 251, 103–111. [Google Scholar] [CrossRef]
  17. Chen, Q.K.J.M.; Li, Y.; Chua, K.J. Experimental and mathematical study of the spray flash evaporation phenomena. Appl. Therm. Eng. 2018, 130, 598–610. [Google Scholar] [CrossRef]
  18. Duan, R.Q.; Jiang, S.Y.; Koshizuka, S.; Oka, Y.; Yamaguchi, A. Direct simulation of flashing liquid jets using the MPS method. Int. J. Heat Mass Transf. 2006, 49, 402–405. [Google Scholar] [CrossRef]
  19. Simões-Moreira, J.R.; Vieira, M.M.; Angelo, E. Highly expanded flashing liquid jets. J. Thermophys. Heat Transf. 2002, 16, 415–424. [Google Scholar] [CrossRef]
  20. Fathinia, F.; Al-Abdeli, Y.M.; Khiadani, M. Evaporation rates and temperature distributions in fine droplet flash evaporation sprays. Int. J. Therm. Sci. 2019, 145, 106037. [Google Scholar] [CrossRef]
  21. Price, C.; Hamzehloo, A.; Aleiferis, P.; Richardson, D. Numerical modelling of droplet breakup for flash-boiling fuel spray predictions. Int. J. Multiph. Flow 2020, 125, 103183. [Google Scholar] [CrossRef]
  22. Zahari, N.M.; Zawawi, M.H.; Sidek, L.M.; Mohamad, D.; Itam, Z.; Ramli, M.Z.; Syamsir, A.; Abas, A.; Rashid, M. Introduction of discrete phase model (DPM) in fluid flow: A review. AIP Conf. Proc. 2018, 2030, 040008. [Google Scholar] [CrossRef]
  23. Owen, O.I.; Jalil, J.M. Heterogeneous Flashing in Water Drops. Int. J. Multiph. Flow 1991, 17, 653–660. [Google Scholar] [CrossRef]
  24. Adachi, A.A.M.; McDonell, V.G.; Tanaka, D.; Senda, J.; Fujimoto, H. Characterization of Fuel Vapor Concentration Inside a Flash Boiling Spray; SAE Technical Paper 970871; SAE International: Warrendale, PA, USA, 1997. [Google Scholar] [CrossRef]
  25. Wang, G.C.; Lu, S.; Li, M.; Zhang, Y.; Sa, Z.; Liu, J.; Wang, H.; Wang, S. Study on the dust removal and temperature reduction coupling performances of magnetized water spray. Environ. Sci. Pollut. Res. 2022, 29, 6151–6165. [Google Scholar] [CrossRef] [PubMed]
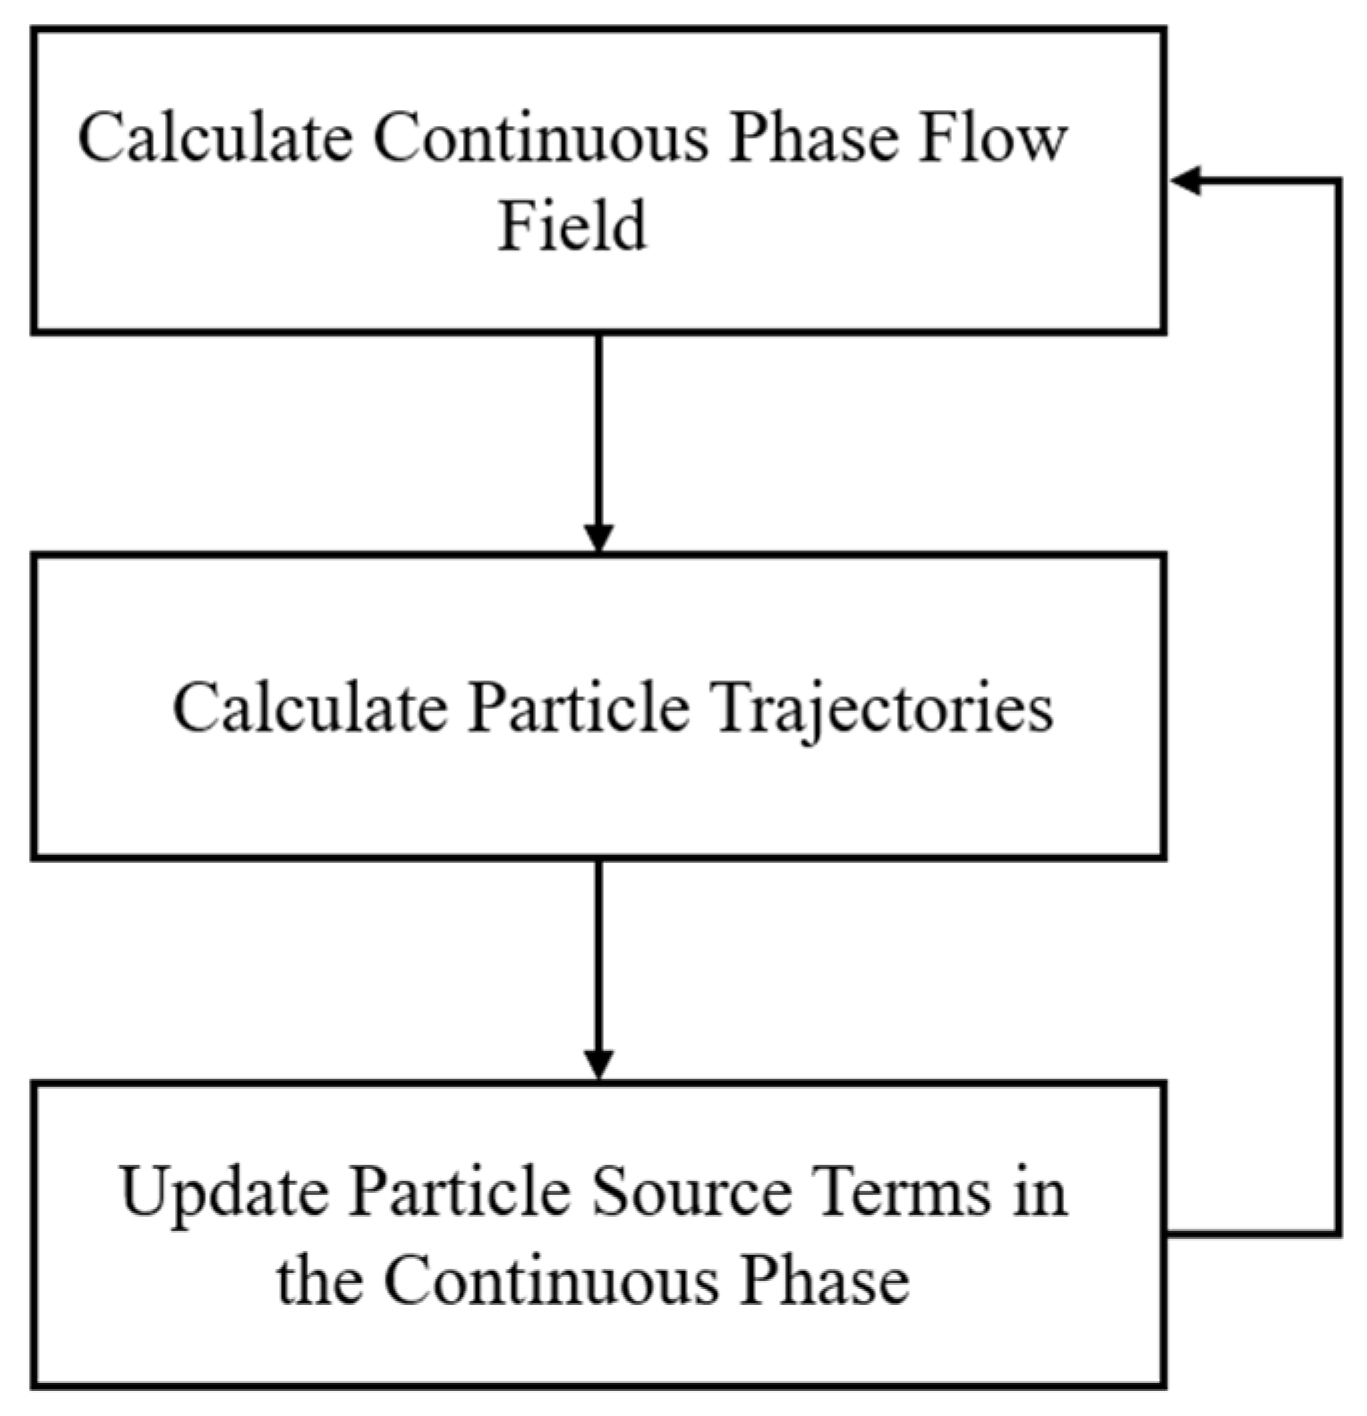
Figure 1. Interphase coupling calculation process.
Energies 18 03180 g001
Figure 2. Force diagram of droplet particles in the gas phase field.
Energies 18 03180 g002
Figure 3. Spray morphology and atomization process of the swirl atomizing nozzle.
Energies 18 03180 g003
Figure 4. (a) Schematic diagram of the dimensions of the vertical flash tank. (b) Mesh structure of the expansion evaporator.
Energies 18 03180 g004
Figure 5. Evolution of the continuous phase temperature field inside the flash tank. (a) t = 0.0001 s; (b) t = 0.0075 s; (c) t = 0.015 s.
Energies 18 03180 g005
Figure 6. Evolution of the discrete phase temperature field inside the flash tank. (a) t = 0.0012 s; (b) t = 0.0038 s; (c) t = 0.007 s.
Energies 18 03180 g006
Figure 7. Temporal variation in droplet temperature for different particle sizes inside the flash tank.
Energies 18 03180 g007
Figure 8. Temporal variation in droplet velocity for different particle sizes inside the flash tank.
Energies 18 03180 g008
Figure 9. The temperature of atomized droplets varies with the spray duration.
Energies 18 03180 g009
Figure 10. The variation in the average mass of atomized droplets over time.
Energies 18 03180 g010
Figure 11. The variation in the velocity of atomized droplets with spray duration.
Energies 18 03180 g011
Figure 12. The variation in droplet temperature over time under different initial pressures (P0).
Energies 18 03180 g012
Figure 13. The variation in the average droplet mass over time under different initial pressures (P0).
Energies 18 03180 g013
Figure 14. Velocity vector field of the continuous phase and flow field of the dispersed phase near the nozzle under different atomization angles.
Energies 18 03180 g014
Figure 15. Variation in average mass of atomized droplets over time under different atomization angles.
Energies 18 03180 g015
Figure 16. Variation in average droplet mass over time under different flow rates.
Energies 18 03180 g016
Figure 17. Variation in vaporization rate with feedwater mass flow rate under different flow conditions.
Energies 18 03180 g017
Table 1. Operating conditions for the simulation cases.
ModelFeedwater Temperature (°C)Feedwater Pressure (MPa)Nozzle Atomization Angle (°)Mass Flow Rate
(t/h)
130010800.3
224025800.3
330025800.3
436025800.3
530015800.3
630020800.3
730025600.3
8300251000.3
930025800.05
1030025800.1
1130025800.2
1230025800.35
Disclaimer/Publisher’s Note: The statements, opinions and data contained in all publications are solely those of the individual author(s) and contributor(s) and not of MDPI and/or the editor(s). MDPI and/or the editor(s) disclaim responsibility for any injury to people or property resulting from any ideas, methods, instructions or products referred to in the content.