
The Use of Renewable Energy Sources in the Food Industry and the Reduction of CO2 Emissions: A Case Study of a Simulated PV Installation


Abstract
1. Introduction
- How did the change in the type of PV module affect the energy yields from the installation?
- To what extent can the designed installation meet the energy demand of the technological process in question?
- Does the use of BF bring measurable benefits in the context of increasing energy production and are these differences significant enough to justify their selection?
2. Materials and Methods
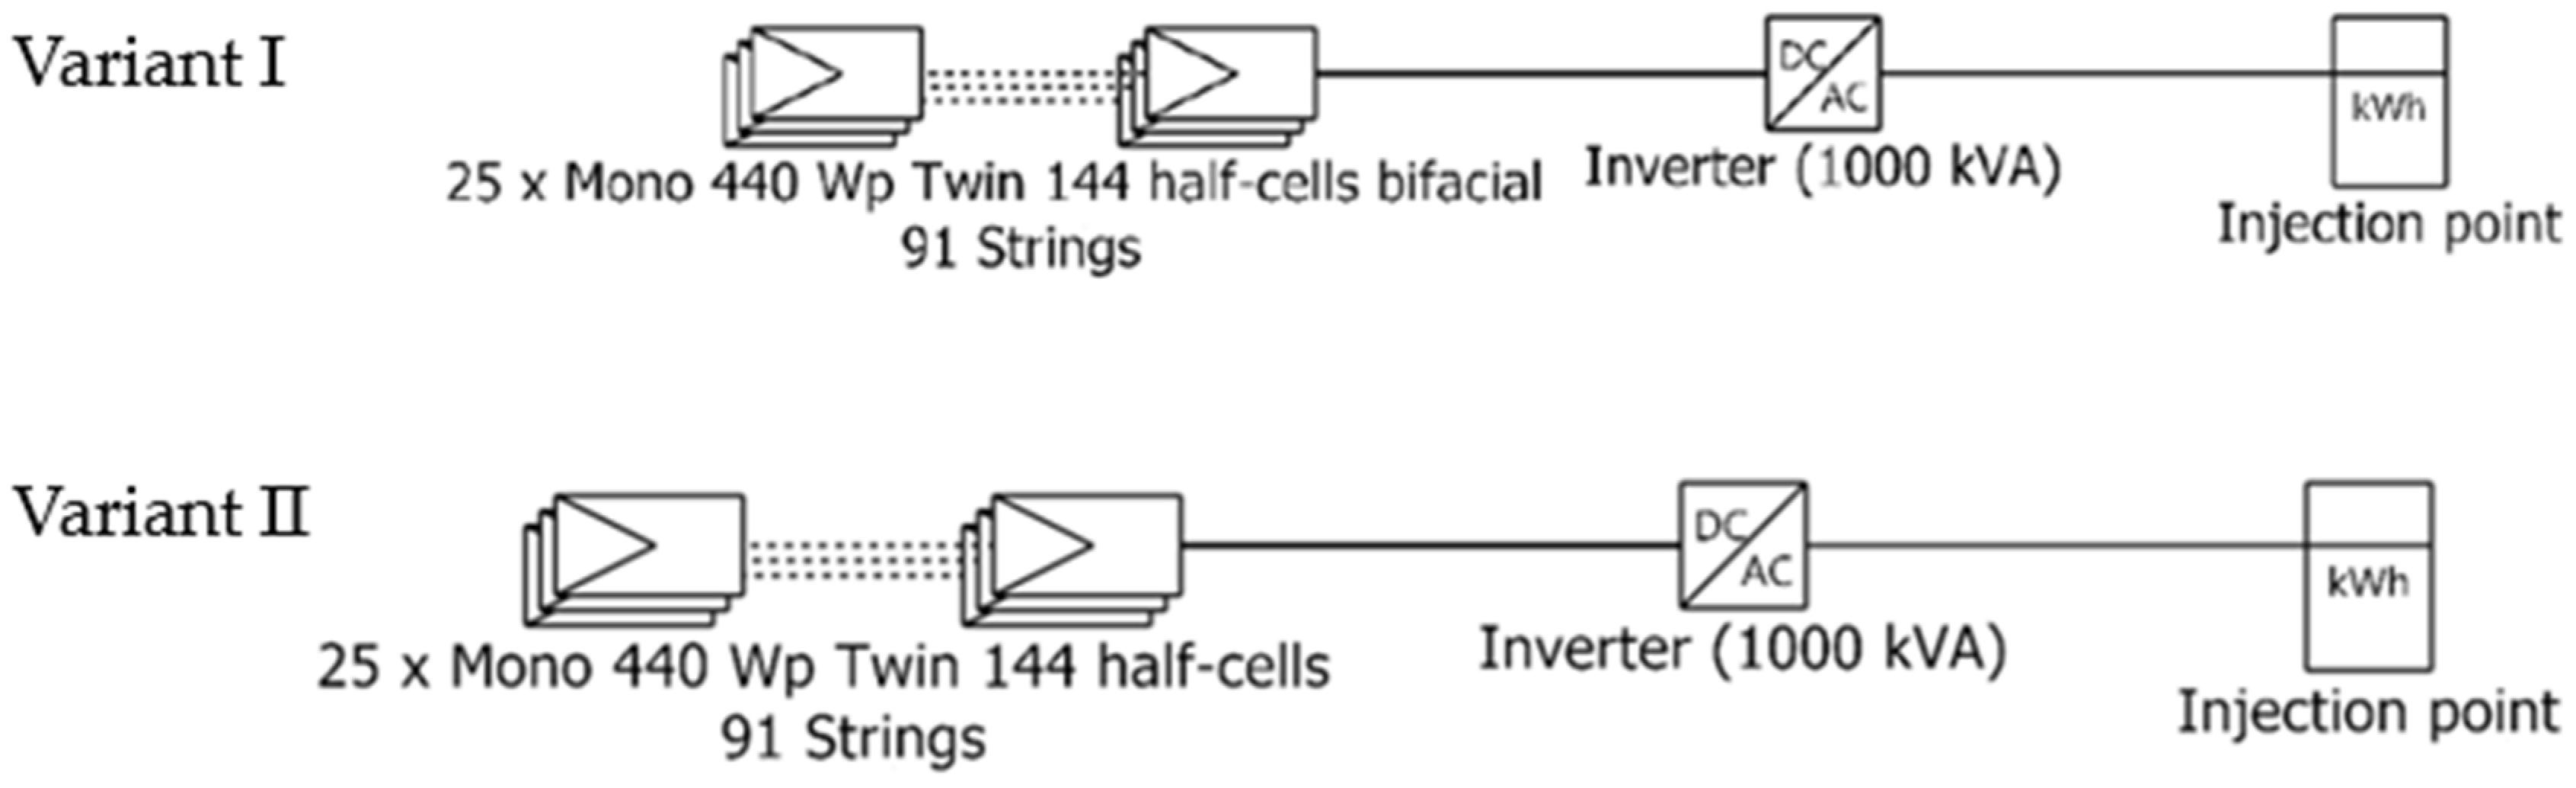
2.1. Design of Two Variants of a 1 MW Photovoltaic Farm
2.2. Environmental Analysis: Carbon Footprint Determination
3. Results and Discussion
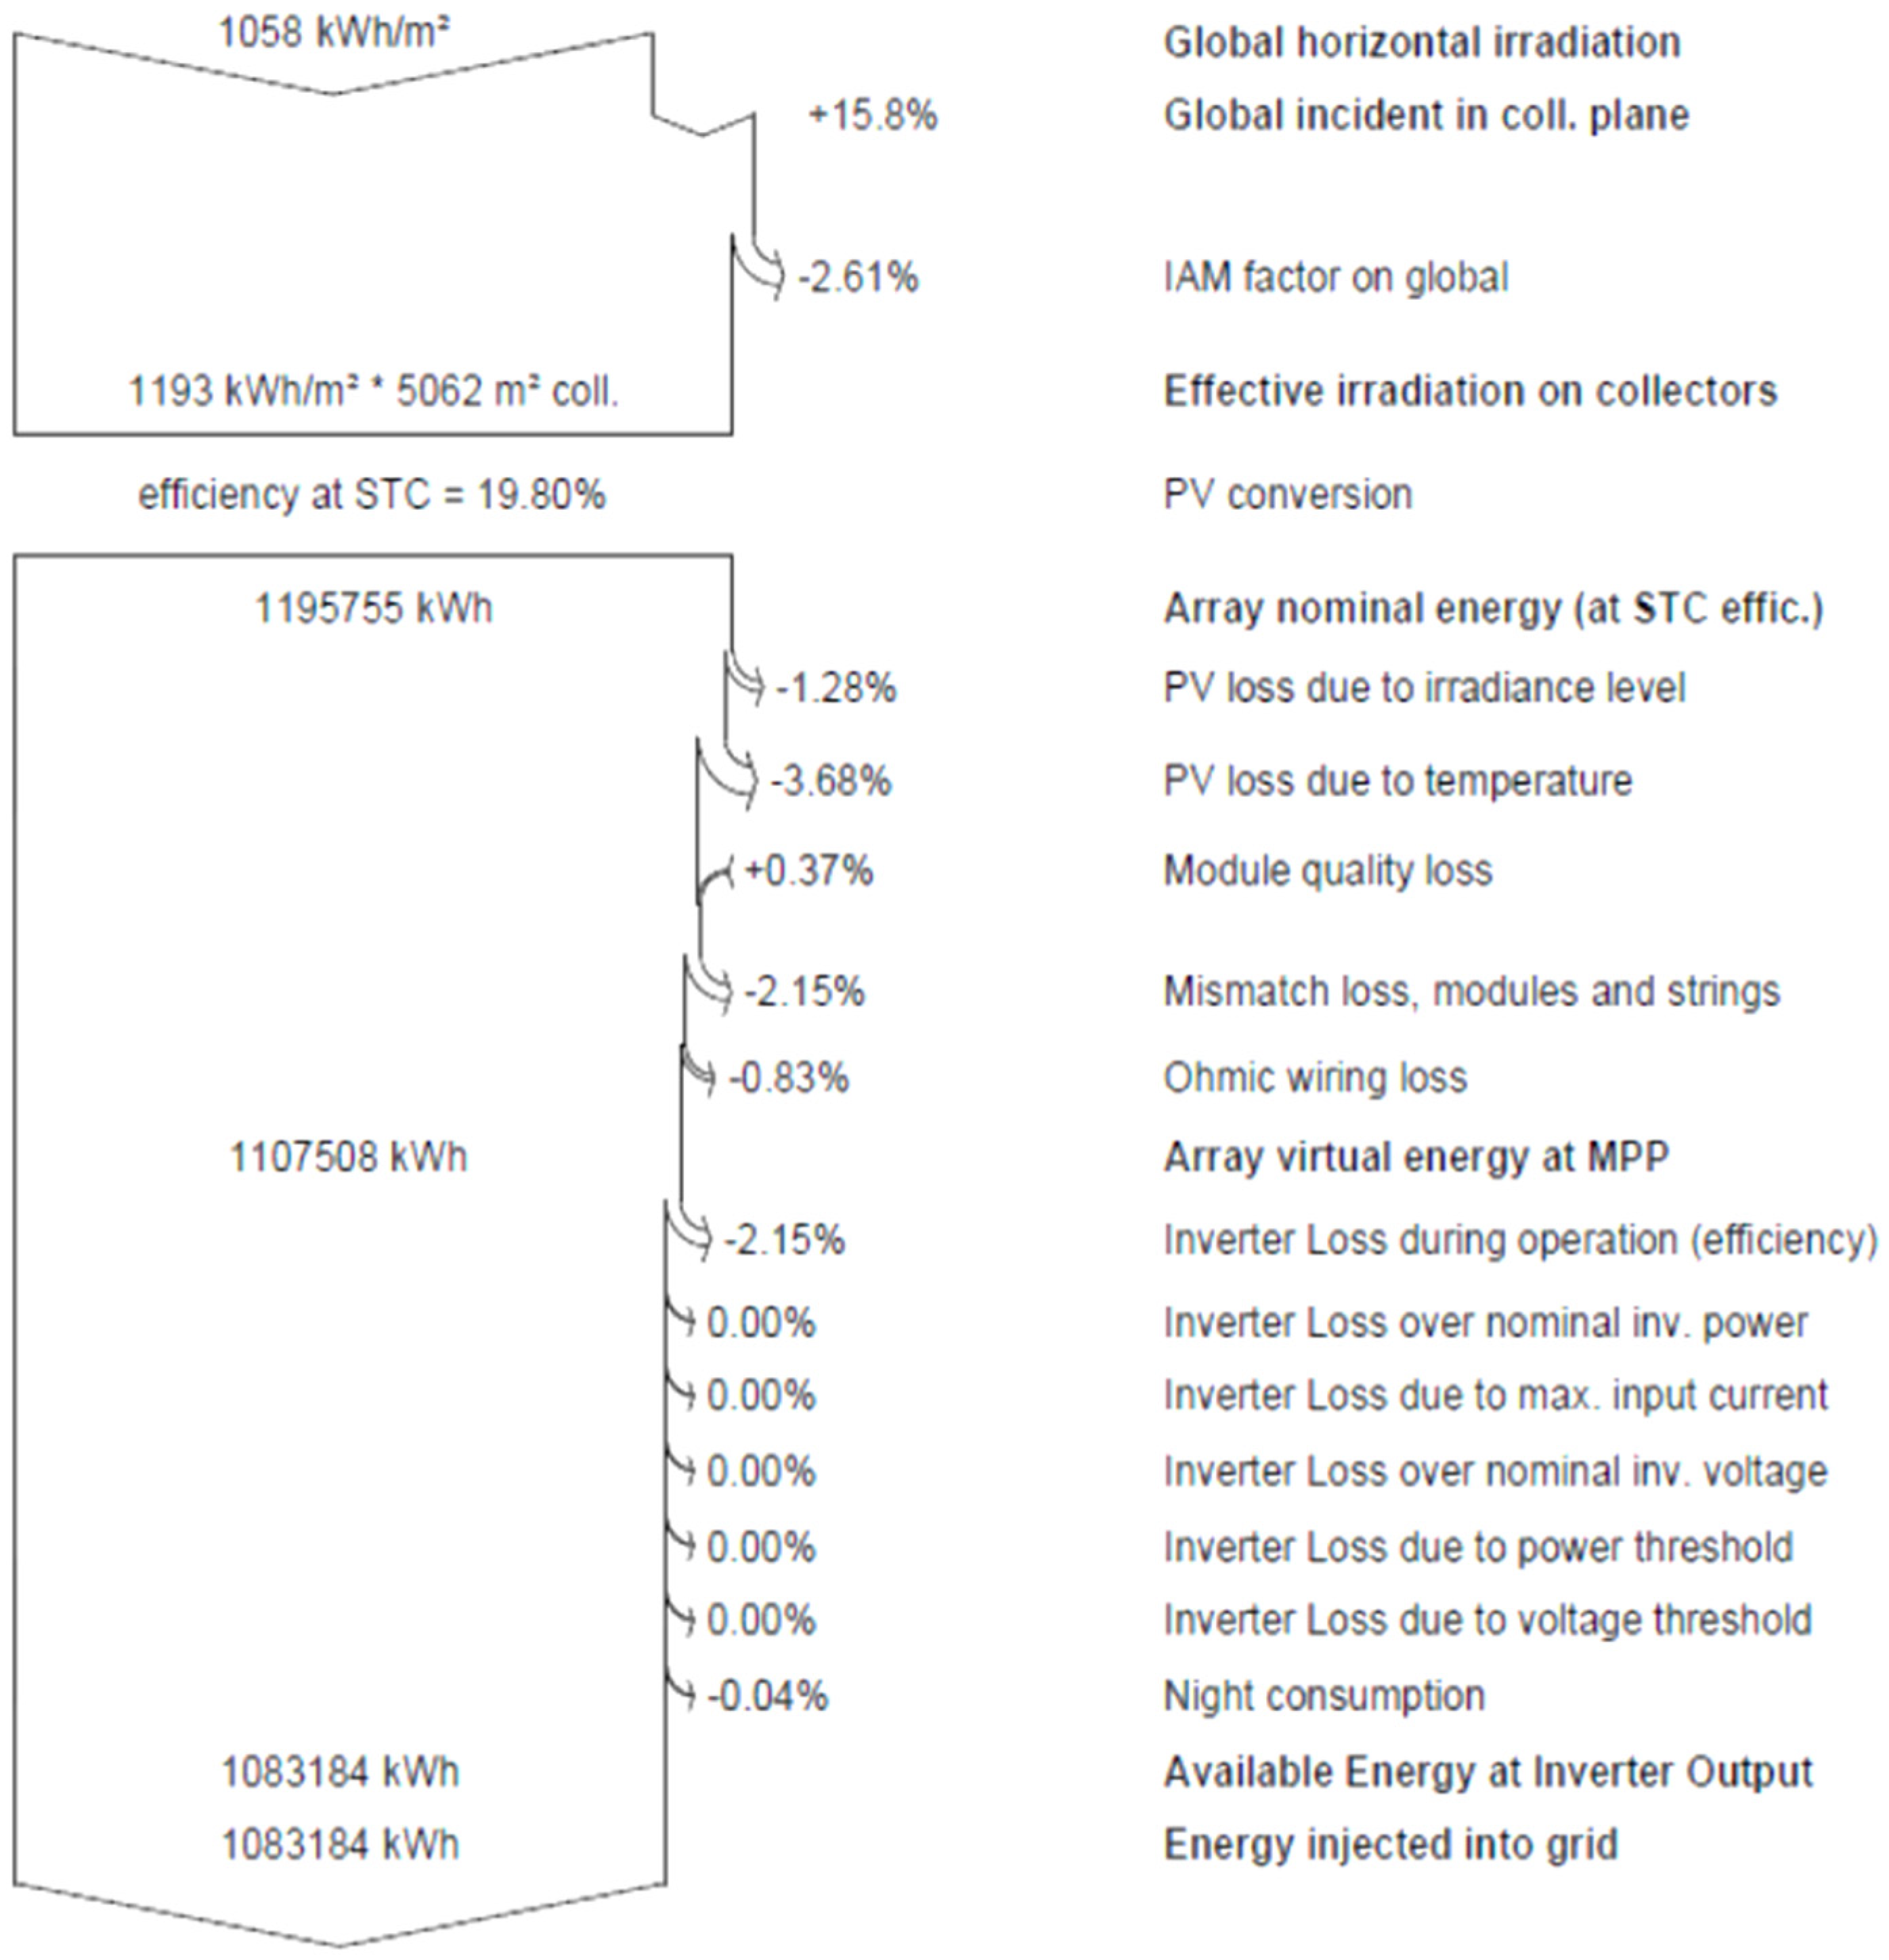
3.1. Analysis of Designed Variants of a Photovoltaic Farm
3.2. Carbon Footprint of Individual Variants of the Analyzed Technological Process
4. Conclusions
- The designed PV farm can cover the annual energy demand of the tested process (608,000 kWh/year) and can additionally power other processes carried out within a given enterprise.
- The use of BF in the simulation allowed for an increase in potential yields by approx. 8%.
- In times of small price differences between monofacial and bifacial modules, the use of BF has a significant advantage in the analyzed case.
- Except for January and December, the proposed installation equipped with BF is sufficient to support the remaining processes conducted within the enterprise.
- The analysis of energy coverage showed that the simulated farm is not able to cover the energy demand of the process throughout the year in only two months of the year.
- Changing the power source to a photovoltaic installation causes a decrease in the carbon footprint of the process in question by over 50%.
- Supplying the shrinking stage with gas does not significantly affect the amount of carbon dioxide emissions; in the case of methane and nitrogen oxide emissions, it increases emissions by 2–5% compared to the variant powered by energy from the national energy mix.
- Supplying the mass packaging process with energy obtained from a PV installation reduces the emission of carbon dioxide, methane and nitrogen oxides by approx. 80% compared to traditional sources.
Author Contributions
Funding
Institutional Review Board Statement
Informed Consent Statement
Data Availability Statement
Conflicts of Interest
References
- Mannheim, V.; Avató, J.L. Examining the Carbon Footprint of Conferences with an Emphasis on Energy Consumption and Catering. Energies 2025, 18, 321. [Google Scholar] [CrossRef]
- Naresh Kumar, S.; Chakabarti, B. Energy and carbon footprint of food industry. In Energy Footprints of the Food and Textile Sectors; Springer: Singapore, 2019; pp. 19–44. [Google Scholar]
- Elsisi, M.; Tran, M.Q.; Mahmoud, K.; Lehtonen, M.; Darwish, M.M. Deep learning-based industry 4.0 and internet of things towards effective energy management for smart buildings. Sensors 2021, 21, 1038. [Google Scholar] [CrossRef] [PubMed]
- García-Quevedo, J.; Jové-Llopis, E. Environmental policies and energy efficiency investments. An industry-level analysis. Energy Policy 2021, 156, 112461. [Google Scholar] [CrossRef]
- Bogdanov, D.; Gulagi, A.; Fasihi, M.; Breyer, C. Full energy sector transition towards 100% renewable energy supply: Integrating power, heat, transport and industry sectors including desalination. Appl. Energy 2021, 283, 116273. [Google Scholar] [CrossRef]
- Dominković, D.F.; Bačeković, I.; Pedersen, A.S.; Krajačić, G. The future of transportation in sustainable energy systems: Opportunities and barriers in a clean energy transition. Renew. Sustain. Energy Rev. 2018, 82, 1823–1838. [Google Scholar] [CrossRef]
- Seabra, B.; Pereira, P.F.; Corvacho, H.; Pires, C.; Ramos, N.M. Low energy renovation of social housing: Recommendations on monitoring and renewable energies use. Sustainability 2021, 13, 2718. [Google Scholar] [CrossRef]
- Rabbi, M.F.; Popp, J.; Máté, D.; Kovács, S. Energy security and energy transition to achieve carbon neutrality. Energies 2022, 15, 8126. [Google Scholar] [CrossRef]
- Orłowska, J.; Suchacka, M.; Trembaczowski, Ł.; Ulewicz, R. Social Aspects of Establishing Energy Cooperatives. Energies 2024, 17, 5709. [Google Scholar] [CrossRef]
- Gabrielyan, B.; Markosyan, A.; Almastyan, N.; Madoyan, D. Energy efficiency in household sector. Prod. Eng. Arch. 2024, 30, 136–144. [Google Scholar] [CrossRef]
- Muneer, T.; Gul, M.S.; Alam, M. Modelling of a Large Solar PV Facility: England’s Mallard Solar Farm Case Study. Energies 2022, 15, 8609. [Google Scholar] [CrossRef]
- Buri, Z.; Sipos, C.; Szűcs, E.; Máté, D. Smart and Sustainable Energy Consumption: A Bibliometric Review and Visualization. Energies 2024, 17, 3336. [Google Scholar] [CrossRef]
- Mannheim, V.; Nehéz, K.; Brbhan, S.; Bencs, P. Primary energy resources and environmental impacts of various heating systems based on life cycle assessment. Energies 2023, 16, 6995. [Google Scholar] [CrossRef]
- Bień, J.; Bień, B. Rapid assessment of solar PV micro-system energy generation in Poland based on freely pvlib-python library. Prod. Eng. Arch. 2024, 30, 326–332. [Google Scholar] [CrossRef]
- Walichnowska, P.; Mroziński, A.; Idzikowski, A. The impact of selected parameters on the efficiency of PV installations-simulation test of the 1 mw PV farm in the PVSYST program. Syst. Saf. Hum.-Tech. Facil.-Environ. 2022, 4, 179–185. [Google Scholar] [CrossRef]
- Yakubu, R.O.; Ankoh, M.T.; Mensah, L.D.; Quansah, D.A.; Adaramola, M.S. Predicting the potential energy yield of bifacial solar PV systems in low-latitude region. Energies 2022, 15, 8510. [Google Scholar] [CrossRef]
- Ali, M.F.; Sarker, N.K.; Hossain, M.A.; Alam, M.S.; Sanvi, A.H.; Syam Sifat, S.I. Techno-economic feasibility study of a 1.5 MW grid-connected solar power plant in Bangladesh. Designs 2023, 7, 140. [Google Scholar] [CrossRef]
- Średziński, P.; Świętochowska, M.; Świętochowski, K.; Gwoździej-Mazur, J. Analysis of the Use of the PV Installation in the Power Supply of the Water Pumping Station. Energies 2022, 15, 9536. [Google Scholar] [CrossRef]
- Smiles, M.J.; Law, A.M.; Urwick, A.N.; Thomas, L.; Irvine, L.A.D.; Pilot, M.T.; Bowman, A.R.; Walker, A.B. Next steps in the footprint project: A feasibility study of installing solar panels on Bath Abbey. Energy Sci. Eng. 2022, 10, 892–902. [Google Scholar] [CrossRef]
- Anang, N.; Azman, S.S.N.; Muda, W.M.W.; Dagang, A.N.; Daud, M.Z. Performance analysis of a grid-connected rooftop solar PV system in Kuala Terengganu, Malaysia. Energy Build. 2021, 248, 111182. [Google Scholar] [CrossRef]
- Elbadawi, M.; Basit, A.W.; Gaisford, S. Energy consumption and carbon footprint of 3D printing in pharmaceutical manufacture. Int. J. Pharm. 2023, 639, 122926. [Google Scholar] [CrossRef]
- Sousa, V.; Bogas, J.A. Comparison of energy consumption and carbon emissions from clinker and recycled cement production. J. Clean. Prod. 2021, 306, 127277. [Google Scholar] [CrossRef]
- Walichnowska, P.; Flizikowski, J.; Tomporowski, A.; Opielak, M.; Cieślik, W. The Environmental Analysis of the Post-Use Management Scenarios of the Heat-Shrinkable Film. Polymers 2025, 17, 690. [Google Scholar] [CrossRef] [PubMed]
- Walichnowska, P.; Kruszelnicka, W.; Piasecka, I.; Flizikowski, J.; Tomporowski, A.; Mazurkiewicz, A.; Valle, J.M.M.; Opielak, M.; Polishchuk, O. Analysis of the Impact of the Post-Consumer Film Waste Scenario and the Source of Electricity on the Harmfulness of the Mass Packaging Process. Polymers 2024, 16, 3467. [Google Scholar] [CrossRef] [PubMed]
- Chwieduk, D. Solar Energy Use for Thermal Application in Poland. Pol. J. Environ. Stud. 2010, 19, 473–477. [Google Scholar]
- Matin, N.S.; Flanagan, W.P. Life cycle assessment of amine-based versus ammonia-based post combustion CO2 capture in coal-fired power plants. Int. J. Greenh. Gas Control 2022, 113, 103535. [Google Scholar] [CrossRef]
- Polverini, D.; Espinosa, N.; Eynard, U.; Leccisi, E.; Ardente, F.; Mathieux, F. Assessing the carbon footprint of photovoltaic modules through the EU Ecodesign Directive. Sol. Energy 2023, 257, 1–9. [Google Scholar] [CrossRef]
- Hayibo, K.S.; Petsiuk, A.; Mayville, P.; Brown, L.; Pearce, J.M. Monofacial vs bifacial solar photovoltaic systems in snowy environments. Renew. Energy 2022, 193, 657–668. [Google Scholar] [CrossRef]
- Olczak, P.; Olek, M.; Matuszewska, D.; Dyczko, A.; Mania, T. Monofacial and Bifacial Micro PV Installation as Element of Energy Transition—The Case of Poland. Energies 2021, 14, 499. [Google Scholar] [CrossRef]
- Allahverdinejad, B.; Ajami, A.; Banaei, M.R. Design and implementation of a solar power optimizer for module level power electronics application. IET Power Electron. 2024, 17, 2531–2548. [Google Scholar] [CrossRef]
- Vitelli, M. On the necessity of joint adoption of both distributed maximum power point tracking and central maximum power point tracking in PV systems. Prog. Photovolt. Res. Appl. 2014, 22, 283–299. [Google Scholar] [CrossRef]
- de Souza Silva, J.L.; Moreira, H.S.; dos Reis, M.V.G.; dos Santos Barros, T.A.; Villalva, M.G. Theoretical and behavioral analysis of power optimizers for grid-connected photovoltaic systems. Energy Rep. 2022, 8, 10154–10167. [Google Scholar] [CrossRef]
- Shukla, A.; Kant, K.; Sharma, A.; Biwole, P. Cooling methodologies of photovoltaic module for enhancing electrical efficiency: A review. Sol. Energy Mater. Sol. Cells 2017, 160, 275–286. [Google Scholar] [CrossRef]
- Duan, H.B.; Zhang, G.P.; Zhu, L.; Fan, Y.; Wang, S.Y. How will diffusion of PV solar contribute to China׳ s emissions-peaking and climate responses? Renew. Sustain. Energy Rev. 2016, 53, 1076–1085. [Google Scholar] [CrossRef]
- Hamed, T.A.; Alshare, A. Environmental impact of solar and wind energy-a review. J. Sustain. Dev. Energy Water Environ. Syst. 2022, 10, 1090387. [Google Scholar] [CrossRef]
- Osman, A.I.; Chen, L.; Yang, M.; Msigwa, G.; Farghali, M.; Fawzy, S.; Rooney, D.W. Cost, environmental impact, and resilience of renewable energy under a changing climate: A review. Environ. Chem. Lett. 2023, 21, 741–764. [Google Scholar] [CrossRef]
- Alsema, E. Chapter IV-2—Energy Payback Time and CO2 Emissions of PV Systems. Practical Handbook of Photovoltaics, 2nd ed.; Academic Press: Cambridge, MA, USA, 2012; pp. 1097–1117. [Google Scholar]
- Guo, X.; Dong, Y.; Ren, D. CO2 emission reduction effect of photovoltaic industry through 2060 in China. Energy 2023, 269, 126692. [Google Scholar] [CrossRef]
- Maka, A.O.; Alabid, J.M. Solar energy technology and its roles in sustainable development. Clean Energy 2022, 6, 476–483. [Google Scholar] [CrossRef]
- Fischer, J. Comparing Wind and Solar Energy Impacts on the Environment: A LCA Approach Using openLCA Platform. 2021. Available online: https://digitalcommons.bryant.edu/cgi/viewcontent.cgi?article=1025&context=honors_science (accessed on 10 March 2025).
- Divya, A.; Adish, T.; Kaustubh, P.; Zade, P.S. Review on recycling of solar modules/panels. Sol. Energy Mater. Sol. Cells 2023, 253, 112151. [Google Scholar] [CrossRef]
- Gönen, Ç.; Kaplanoğlu, E. Environmental and economic evaluation of solar panel wastes recycling. Waste Manag. Res. 2019, 37, 412–418. [Google Scholar] [CrossRef]
- Sawicka-Chudy, P.; Rybak-Wilusz, E.; Sibiński, M.; Cholewa, M.; Pawełek, R. An analysis of the electricity supply at a public building utilizing photovoltaic systems and a microturbine. Zesz. Nauk. Inst. Gospod. Surowcami Miner. 2018, 47–62. [Google Scholar] [CrossRef]
- Baouche, F.Z.; Abderezzak, B.; Ladmi, A.; Arbaoui, K.; Suciu, G.; Mihaltan, T.C.; Raboaca, M.S.; Hudișteanu, S.V.; Țurcanu, F.E. Design and simulation of a solar tracking system for PV. Appl. Sci. 2022, 12, 9682. [Google Scholar] [CrossRef]


| System Configuration | ||
|---|---|---|
| Type of variant | Variant I | Variant II |
| Type of module | Monofacial | Bifacial |
| Power of installation | 1 MW | |
| Module orientation | South | |
| Angle | 25° | |
| Number of modules | 2275 | |
| Nominal power of module | 440 Wp | |
| Connection of modules | 91 strings × 25 in series | |
| Amount of inverter | 1 | |
| Power of inverter | 1000 kW | |
| Horizontal Global Irradiation [kWh/m2/mth] | Horizontal Diffuse Irradiation [kWh/m2/mth] | Temperature [°C] | Wind Velocity [m/s] | |
|---|---|---|---|---|
| January | 18.6 | 13.7 | −2.0 | 2.89 |
| February | 35.5 | 22.5 | −0.8 | 2.79 |
| March | 78.8 | 45.8 | 3.2 | 2.80 |
| April | 123.1 | 61.7 | 8.9 | 2.70 |
| May | 158.3 | 78.2 | 14.4 | 2.50 |
| June | 161.8 | 81.0 | 17.3 | 2.50 |
| July | 159.1 | 84.4 | 20.0 | 2.40 |
| August | 139.8 | 73.4 | 19.3 | 2.20 |
| September | 94.2 | 42.4 | 13.9 | 2.30 |
| October | 54.3 | 34.2 | 8.9 | 2.39 |
| November | 20.8 | 13.6 | 4.5 | 2.71 |
| December | 13.4 | 9.7 | 0.5 | 2.80 |
| Year | 1057.7 | 560.6 | 9.0 | 2.60 |
| Parameter/Type of Variant | Variant A | Variant B | Variant C |
|---|---|---|---|
| Source of energy | Emix | Gas + Emix | PV installation |
| Energy [kWh] | 678 | 881.4 | 678 |
| rLDPE for film [kg] | 315 | ||
| rPET for bottles [kg] | 2400 | ||
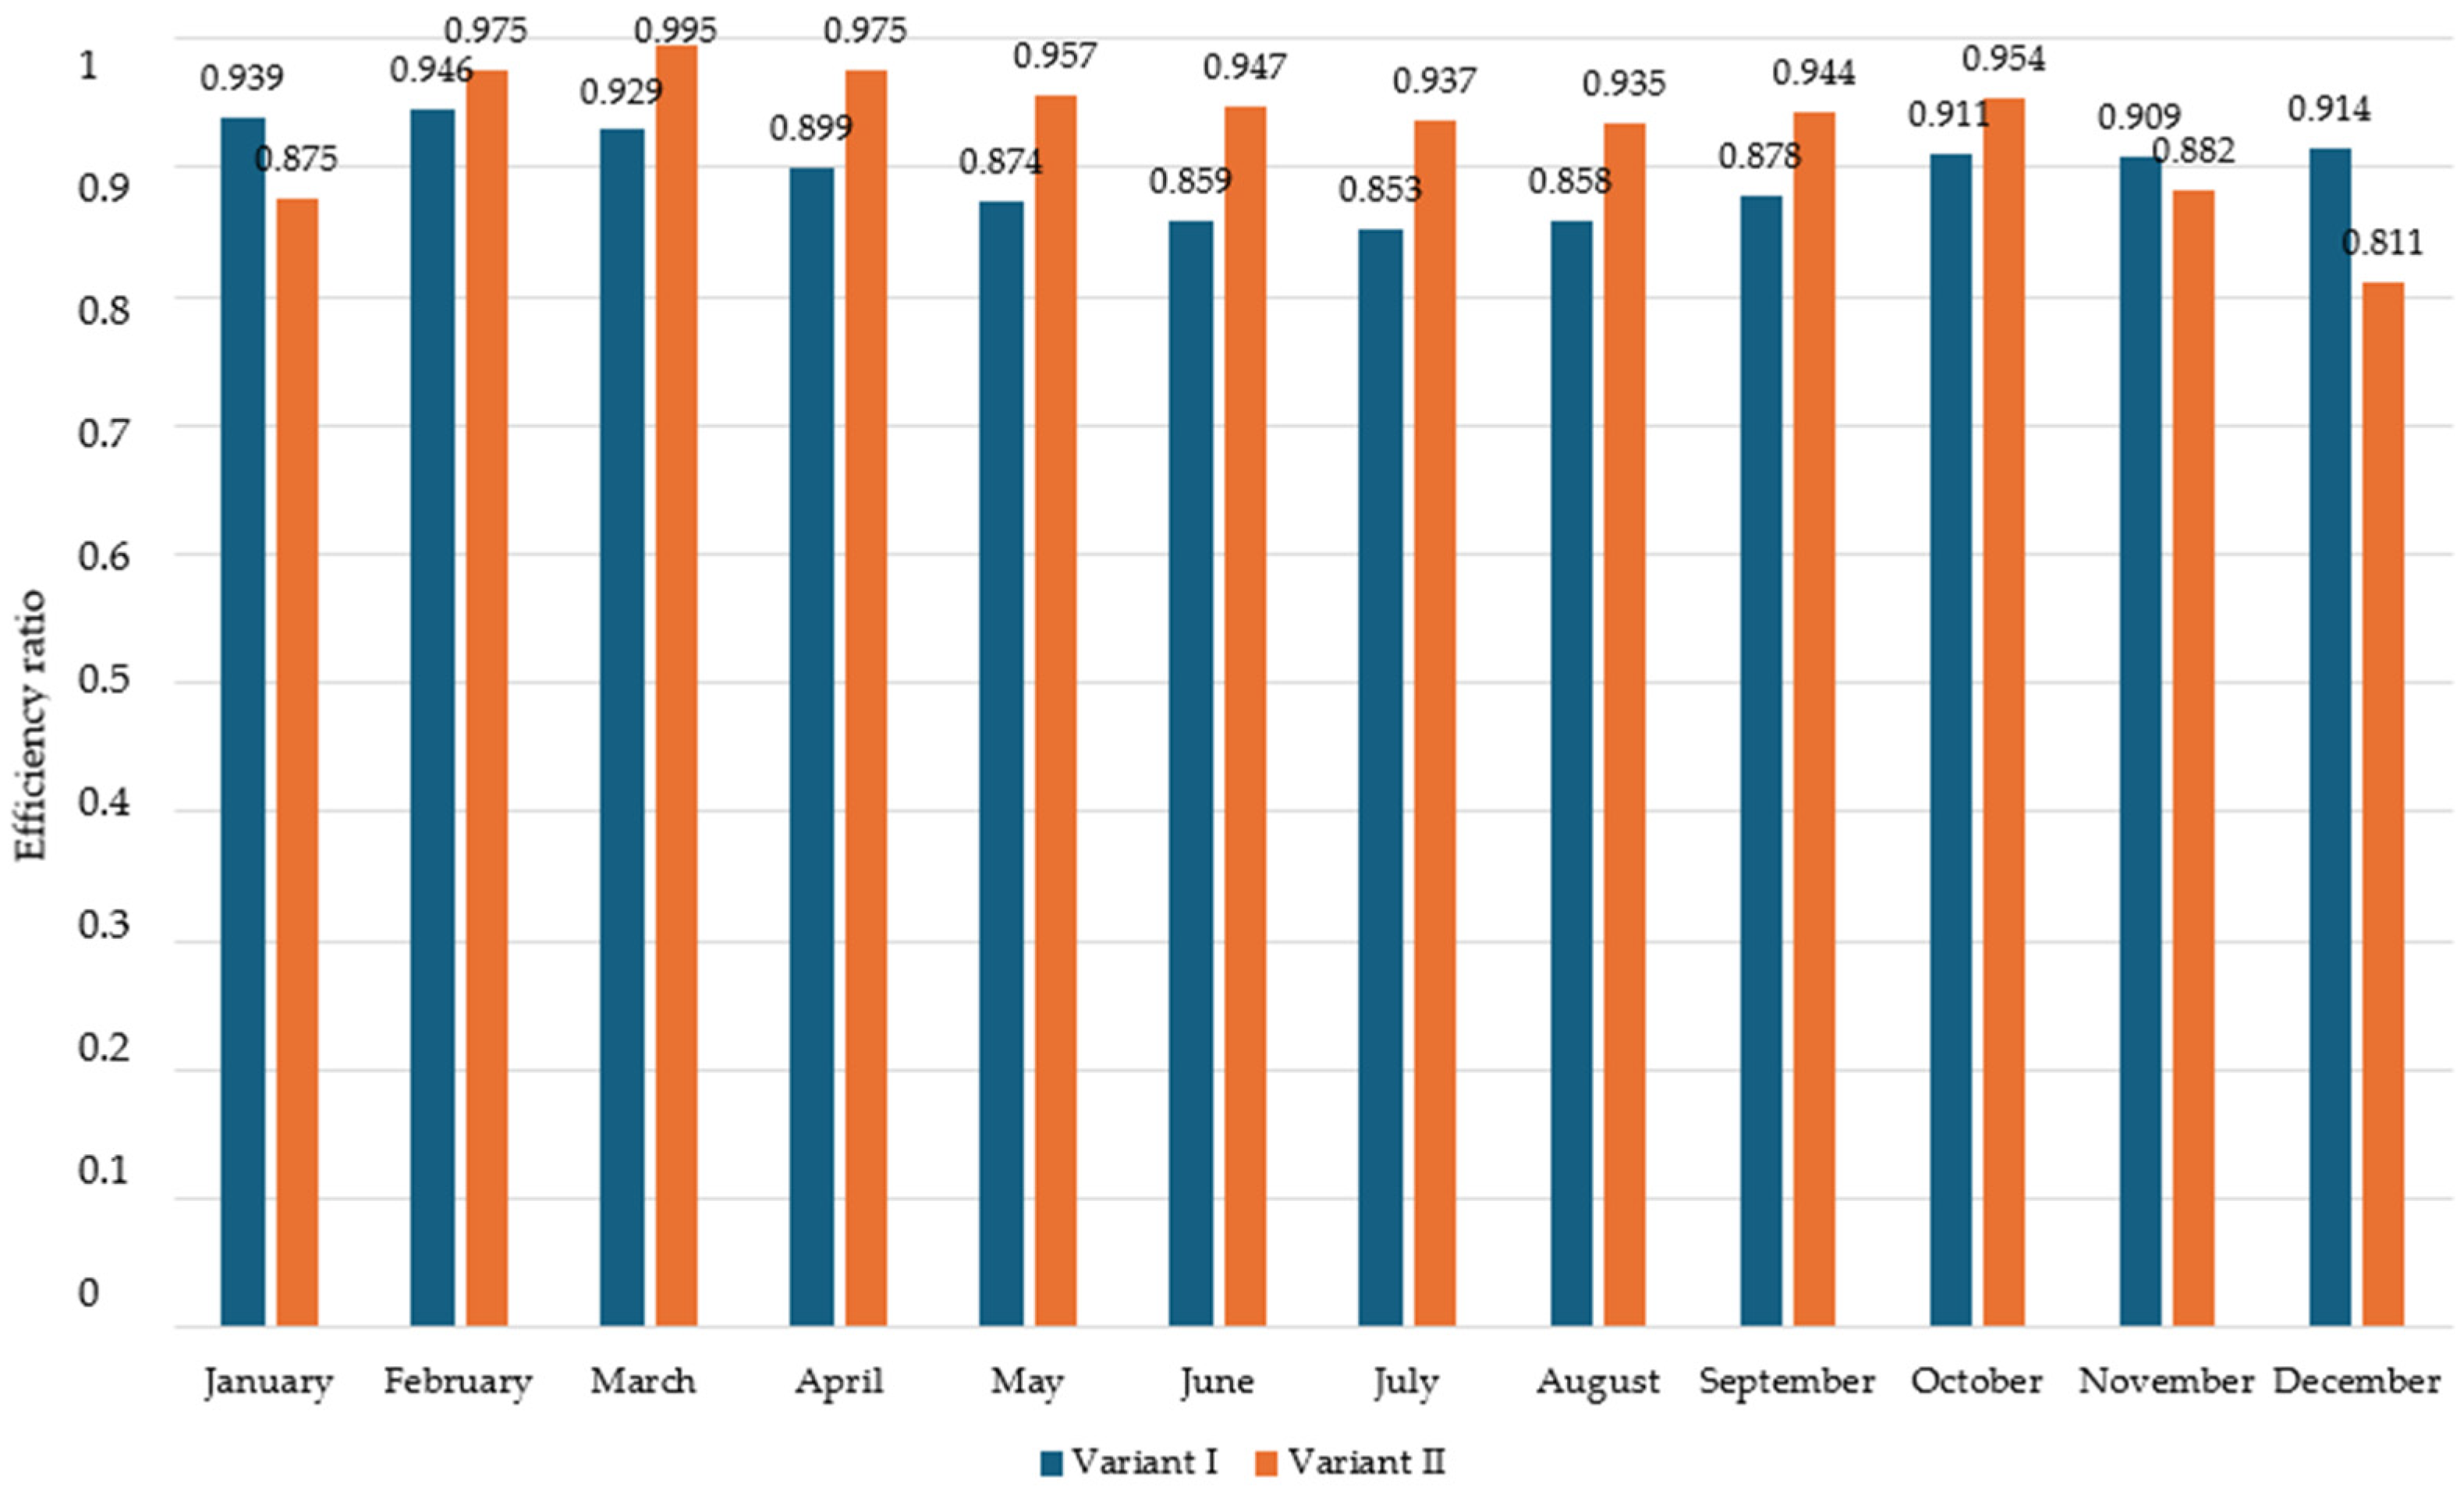
| Month | Energy Injected into the Grid [kWh] | Percentage Difference Variant I vs. Variant II | |
|---|---|---|---|
| Variant I | Variant II | % | |
| January | 27,347 | 25,482 | −6.82 |
| February | 48,348 | 49,838 | +3.08 |
| March | 93,779 | 100,417 | +7.08 |
| April | 129,677 | 140,630 | +8.45 |
| May | 145,987 | 159,850 | +9.50 |
| June | 140,510 | 155,051 | +10.35 |
| July | 140,742 | 154,561 | +9.82 |
| August | 133,320 | 145,216 | +8.92 |
| September | 105,683 | 113,627 | +7.52 |
| October | 67,801 | 70,948 | +4.64 |
| November | 29,573 | 28,713 | −2.91 |
| December | 20,417 | 18,101 | −11.34 |
| Year | 1,083,184 | 1,162,434 | +7.32 |
| Month | Energy Consumption by the Process [kWh] | Energy Production by Simulated System PV with BF [kWh] | Energy Coverage [%] |
|---|---|---|---|
| January | 31,107 | 25,482 | 81.92 |
| February | 49,230 | 49,838 | 101.24 |
| March | 43,325 | 100,417 | 231.78 |
| April | 66,374 | 140,630 | 211.88 |
| May | 76,253 | 159,850 | 209.63 |
| June | 68,541 | 155,051 | 226.22 |
| July | 48,052 | 154,561 | 321.65 |
| August | 51,710 | 145,216 | 280.83 |
| September | 66,596 | 113,627 | 170.62 |
| October | 51,376 | 70,948 | 138.10 |
| November | 19,720 | 28,713 | 145.60 |
| December | 38,132 | 18,101 | 47.47 |
| Emission | Unit | Variant A | Variant B | Variant C |
|---|---|---|---|---|
| Carbon dioxide | kg/FU | 16.7 | 16.7 | 1.94 |
| Methane | kg/FU | 1.55 | 1.57 | 0.487 |
| Nitrogen oxides | kg/FU | 2.58 | 2.73 | 1.31 |
| Total | kg/FU | 20.83 | 21.0 | 3.74 |
Disclaimer/Publisher’s Note: The statements, opinions and data contained in all publications are solely those of the individual author(s) and contributor(s) and not of MDPI and/or the editor(s). MDPI and/or the editor(s) disclaim responsibility for any injury to people or property resulting from any ideas, methods, instructions or products referred to in the content. |
© 2025 by the authors. Licensee MDPI, Basel, Switzerland. This article is an open access article distributed under the terms and conditions of the Creative Commons Attribution (CC BY) license (https://creativecommons.org/licenses/by/4.0/).
Share and Cite
Walichnowska, P.; Zawada, M.; Idzikowski, A. The Use of Renewable Energy Sources in the Food Industry and the Reduction of CO2 Emissions: A Case Study of a Simulated PV Installation. Energies 2025, 18, 3155. https://doi.org/10.3390/en18123155
Walichnowska P, Zawada M, Idzikowski A. The Use of Renewable Energy Sources in the Food Industry and the Reduction of CO2 Emissions: A Case Study of a Simulated PV Installation. Energies. 2025; 18(12):3155. https://doi.org/10.3390/en18123155
Chicago/Turabian StyleWalichnowska, Patrycja, Marcin Zawada, and Adam Idzikowski. 2025. "The Use of Renewable Energy Sources in the Food Industry and the Reduction of CO2 Emissions: A Case Study of a Simulated PV Installation" Energies 18, no. 12: 3155. https://doi.org/10.3390/en18123155
APA StyleWalichnowska, P., Zawada, M., & Idzikowski, A. (2025). The Use of Renewable Energy Sources in the Food Industry and the Reduction of CO2 Emissions: A Case Study of a Simulated PV Installation. Energies, 18(12), 3155. https://doi.org/10.3390/en18123155