Article

Investigating Light Hydrocarbon Pipeline Leaks: A Comprehensive Study on Diffusion Patterns and Energy Safety Implications

1
Tubular Goods Research Institute, China National Petroleum Corporation & State Key Laboratory of Oil and Gas Equipment, Xi’an 710077, China
2
School of Civil Aviation, Northwestern Polytechnical University, Xi’an 710072, China
3
Tarim Oilfield Company, PetroChina Company Limited, Korla 841000, China
4
China National Petroleum Corporation Tuha Oilfield Branch, Tuha, Hami 839009, China
5
Shaanxi Society for Environmental Sciences, Xi’an 710060, China
6
Petroleum Engineering School, Southwest Petroleum University, Chengdu 610500, China
*
Author to whom correspondence should be addressed.
Energies 2025, 18(12), 3151; https://doi.org/10.3390/en18123151
Submission received: 16 April 2025 / Revised: 9 June 2025 / Accepted: 12 June 2025 / Published: 16 June 2025
(This article belongs to the Special Issue Advances in the Development of Geoenergy: 2nd Edition)

Abstract

Light hydrocarbon fuels are widely utilized in industrial production and transportation due to their high calorific value and clean combustion characteristics. Compared to traditional oil tanker transportation, pipelines not only reduce transportation costs but also minimize environmental impact. To understand the leakage and diffusion law of light hydrocarbon pipelines, this paper takes light hydrocarbon pipelines as the research object, establishes the conceptual model of the process of light hydrocarbon leakage and diffusion, divides the four major processes of leakage and diffusion, analyzes the relevant theory, and deduces a formula. The numerical model of pipeline–air–soil leakage and diffusion was established to analyze the whole process of light hydrocarbon leakage and diffusion. The diffusion behavior of individual hydrocarbon components is examined, along with a comparative analysis between multi-component and single-component leakage scenarios. Simulation results reveal that the leakage process comprises three stages: an initial rapid diffusion phase, a transitional phase where a stable region begins to form, and a final stage where the diffusion pattern stabilizes around 800 s. C3 and C5 exhibit the largest diffusion ranges among gaseous and liquid hydrocarbons, respectively. In multi-component systems, the vaporization sequence suppresses the overall diffusion range compared to single-component cases, though gas-phase hydrocarbons tend to accumulate near the leakage source. Understanding the leakage and diffusion behavior of light hydrocarbon pipelines is crucial for energy security. By accurately modeling these processes, we can determine the impact zones of potential pipeline failures and establish appropriate safety buffers. This proactive approach not only safeguards human life and the environment but also ensures the reliable and uninterrupted delivery of energy resources. Consequently, such research is instrumental in fortifying the resilience and dependability of energy infrastructure.

1. Introduction

Light hydrocarbons (C2–C8) are typically by-products of natural gas purification, crude oil stabilization, and petroleum refining. With the rapid development of the petrochemical industry and the global shift toward lightweight raw materials, light hydrocarbons are playing an increasingly important role in the chemical industry. Pipeline transportation is the primary mode for delivering light hydrocarbons. However, such pipelines are characterized by variable compositions, complex operational environments, and low mechanical strength. In the Daqing Oilfield alone, over 800,000 tons of mixed light hydrocarbons are transported downstream annually. With growing oilfield urbanization, it has become increasingly common for pipelines to pass through major urban areas or near critical national infrastructure, raising growing concerns over the safety of light hydrocarbon pipelines [1].
Current research on light hydrocarbon pipelines primarily focuses on three aspects: leakage monitoring technologies [2,3], safety assessments [4,5], and network optimization strategies [6,7]. For leakage monitoring, Yuanlin Yue [2] utilized intelligent acoustic wave detection systems for real-time monitoring and hazard localization. Jian Wang [3] implemented a SCADA-based system using negative pressure wave technology. In terms of safety, Wang Jingwen [4] conducted field tests and economic evaluations for anti-theft and leakage detection technologies. Dai Zhong [1] determined safety distances in accordance with pipeline safety codes. Regarding network optimization, Yuanqiao Liang [5] evaluated dew point safety under different mixing ratios and proposed optimized dispatch strategies, while Qiu et al. [6] developed a multi-scenario, multi-objective model to address transport inefficiencies. However, research on the diffusion mechanisms and influencing factors of light hydrocarbon leakage remains limited. Current studies largely draw upon diffusion models for oil and gas pipelines, lacking specific frameworks tailored to the unique properties of light hydrocarbons. The diffusion process is more complex due to the coexistence of gas and liquid phases, complicating accurate prediction.
Studies on leakage diffusion generally fall into two categories: experimental investigations and numerical simulations. Siyu Du et al. [7] developed an experimental setup to test leakage under varying structural conditions. Wei-Ye Cao et al. [8] used humidity sensors to quantitatively monitor buried pipeline leakage. Hongjun Zhu et al. [9] carried out numerical simulation of leakage diffusion of a natural gas pipeline containing hydrogen sulfide in flat area for the leakage of natural gas in pipelines. Fanxi Bu et al. [10] investigated methane transport in soil-building systems via numerical modeling. Mingfu Fu et al. [11] used FLUENT to analyze the spatial and temporal evolution of leakage in tunnel-buried pipelines.
Theoretical studies of two-phase diffusion mainly address the modeling of phase transport and interfacial dynamics. Marchioli et al. [12] studied the dispersed-phase (consisting of particles, liquid droplets, and bubbles) phase transport law and interphase interaction. Xuewen Cao et al. [13] used a two-fluid model to establish a mathematical model of a gas–liquid two-phase flow leakage system, and simulated and analyzed the leakage law of a gas–liquid two-phase flow pipeline under the laminar and segmented plugging flow type. Simon et al. [14] studied the turbulence modulation of interfacial and fluid–particle flow by analytical and numerical methods.
Despite progress, significant technical gaps remain in modeling light hydrocarbon pipeline leaks. Existing studies are often superficial and lack operational depth. Therefore, this study employs numerical simulation to comprehensively investigate the leakage and diffusion characteristics of light hydrocarbon pipelines. It also analyzes key influencing factors to provide theoretical support for safe pipeline operation and guidance for accident prediction and emergency response.

2. Light Hydrocarbon Pipeline Leakage Dispersion Model

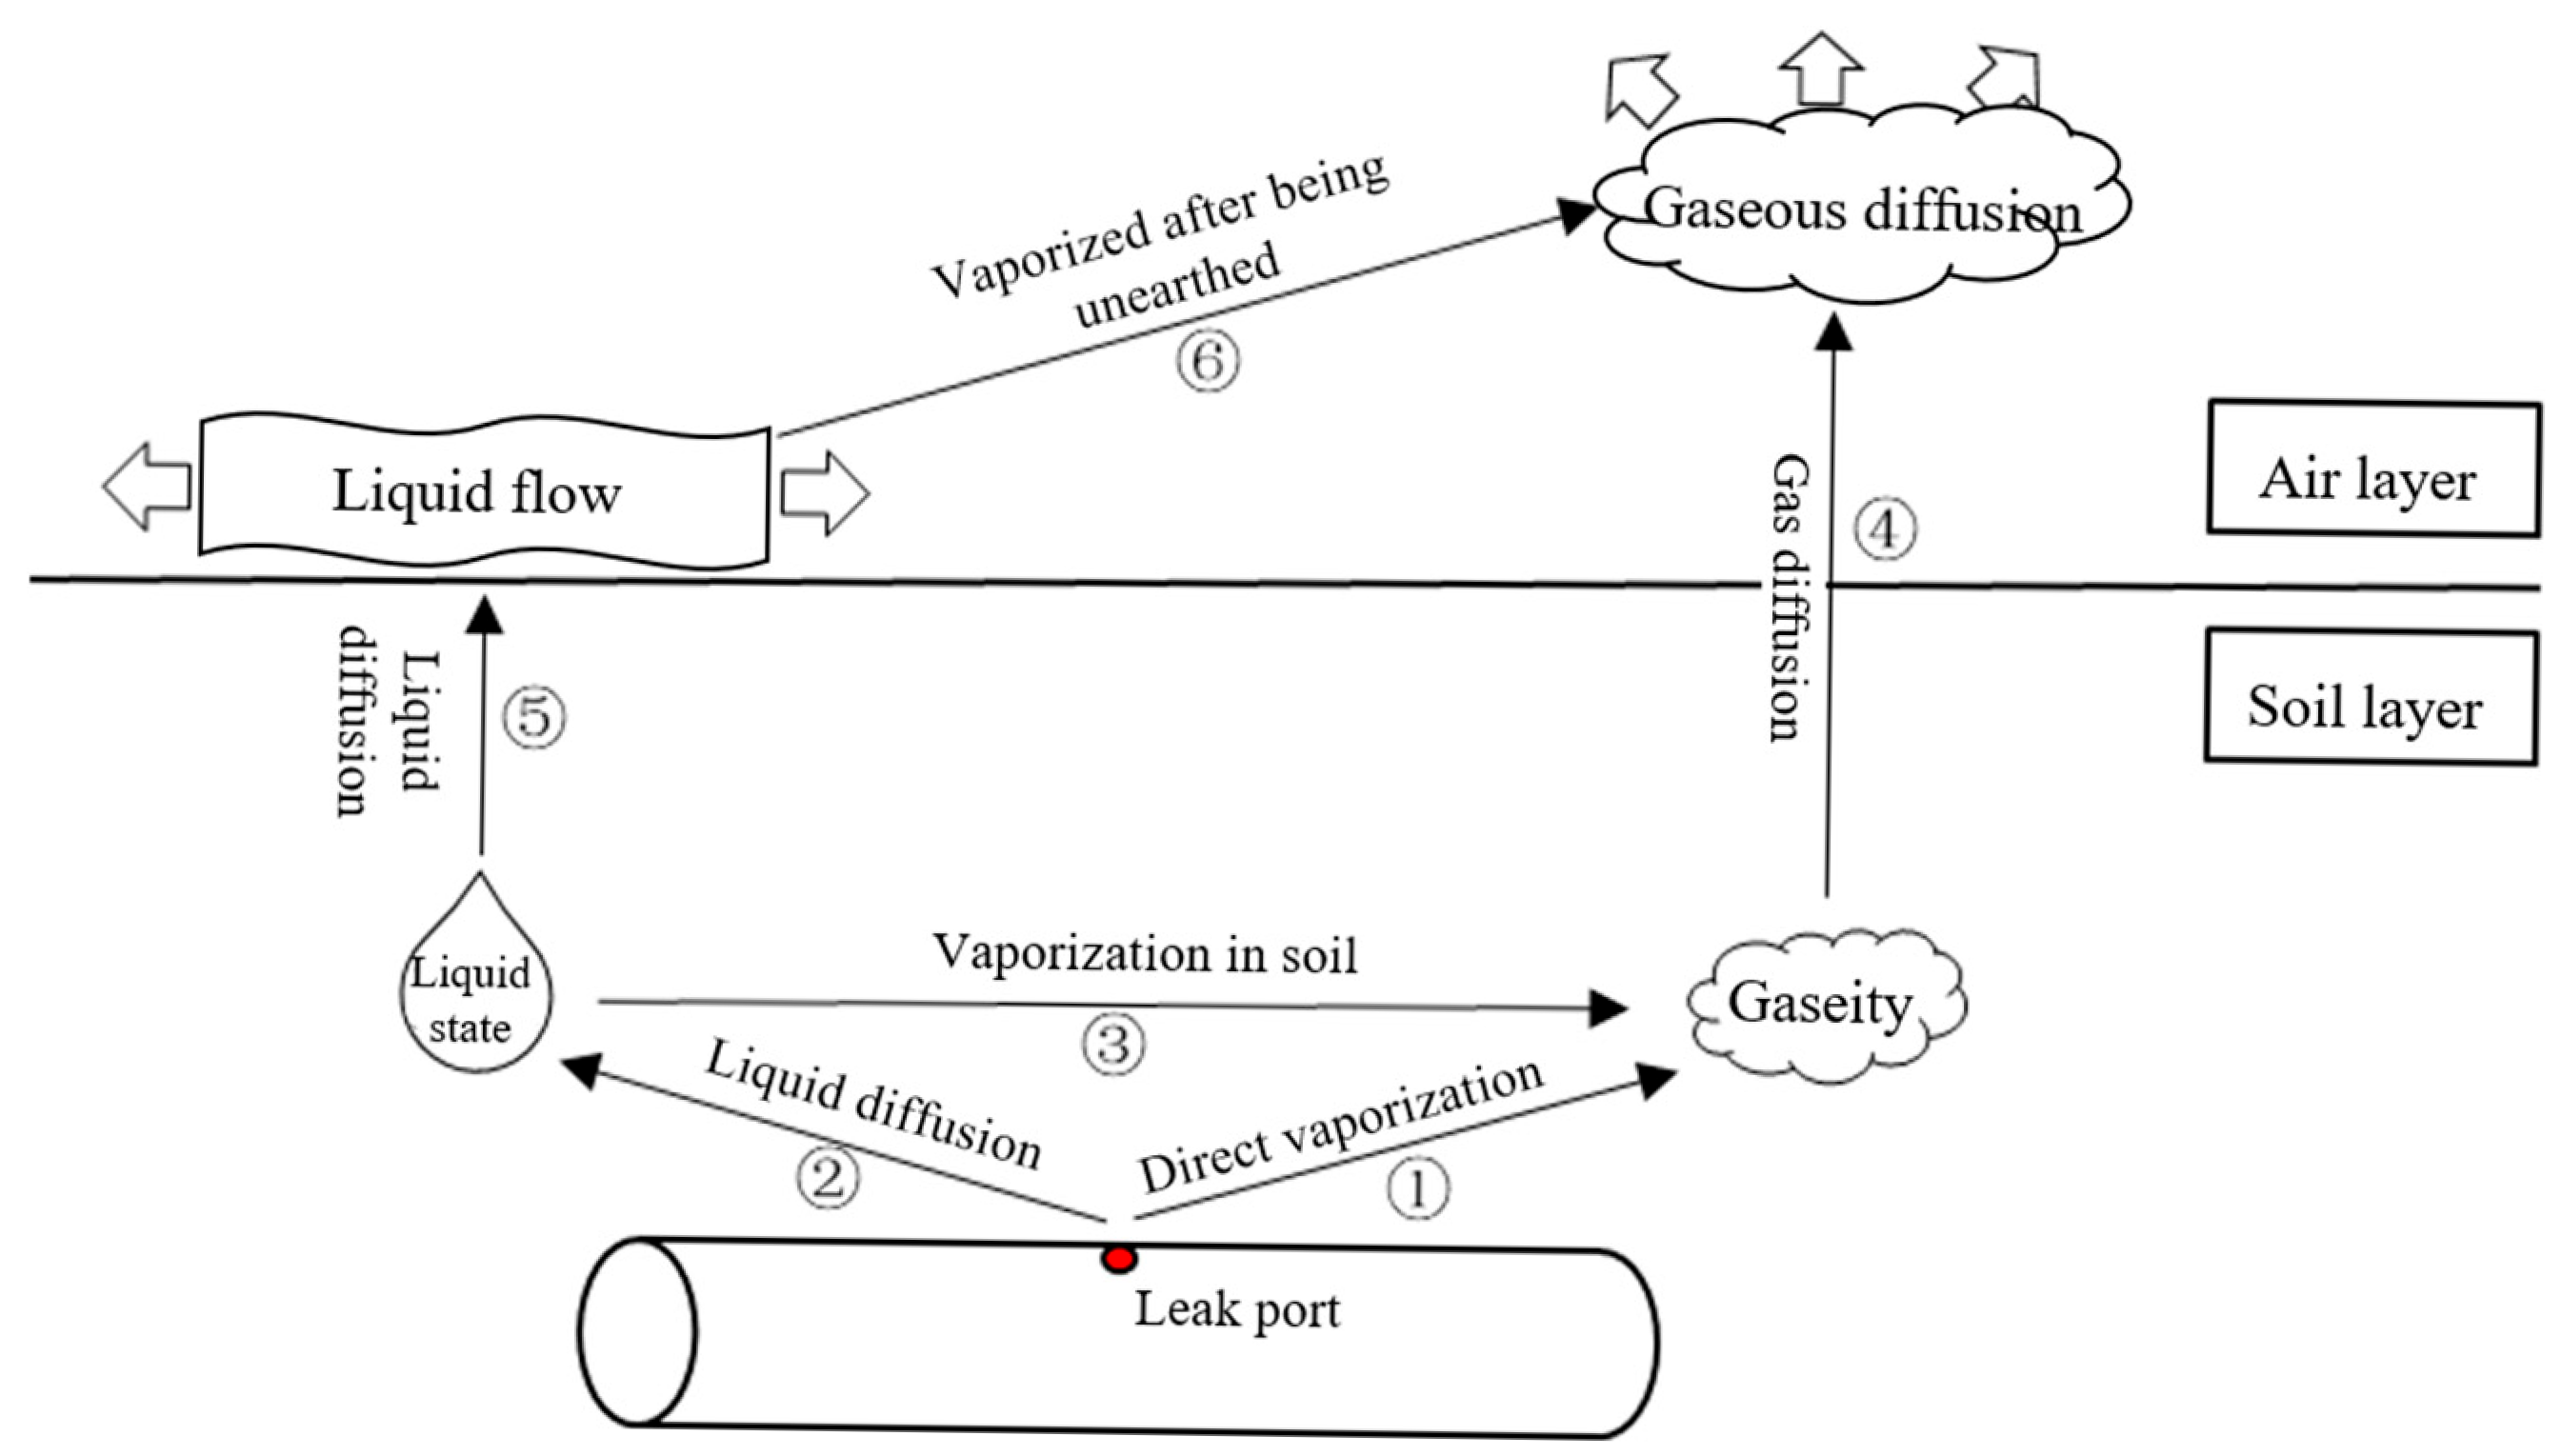
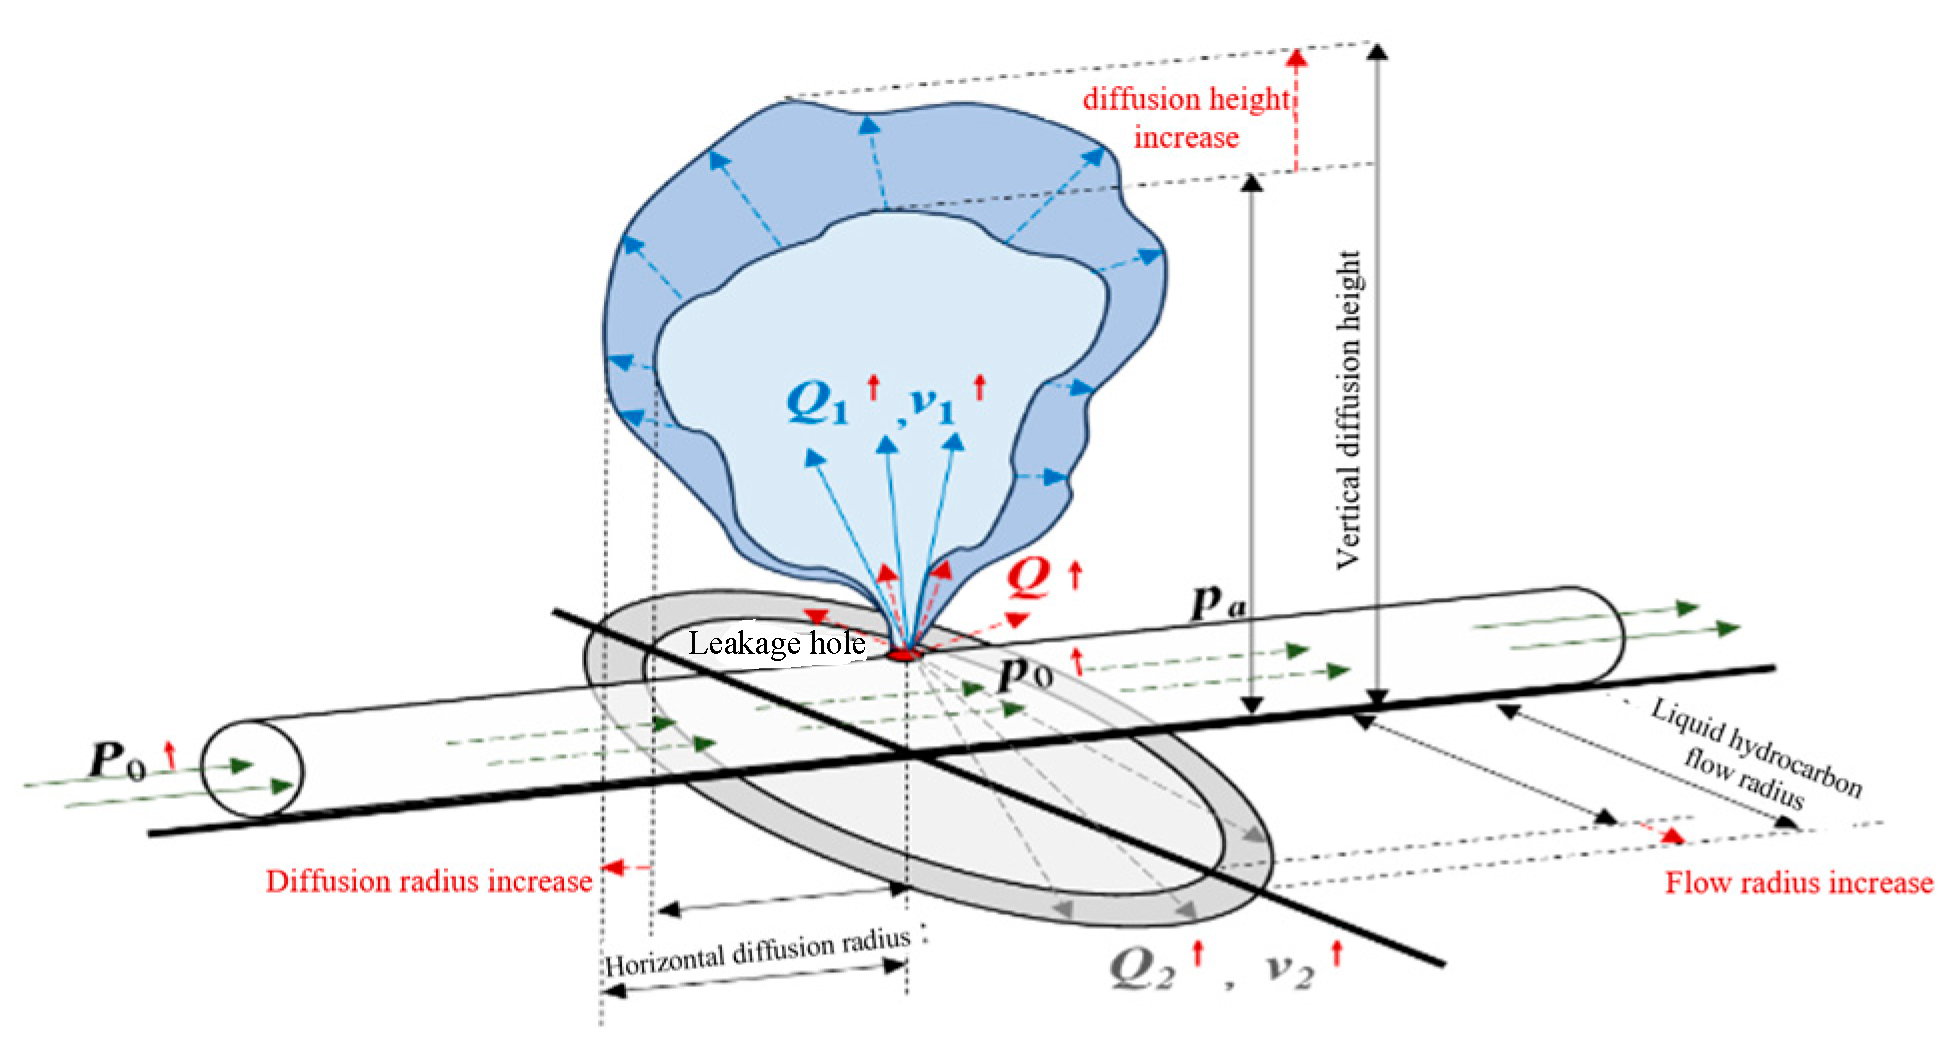
2.1. Conceptual Model of the Light Hydrocarbon Leakage Dispersion Process

Based on the analysis of energy, force, and phase transition during the light hydrocarbon leakage process, a conceptual model is developed, as illustrated in Figure 1.
In developing this conceptual model, several simplifying assumptions were made to facilitate simulation and interpretation. The model treats the leaked light hydrocarbons as a homogeneous multiphase mixture, assuming that gas and liquid phases are uniformly mixed. However, in practical scenarios, phase heterogeneity—including differences in droplet or bubble sizes, spatial distribution, and interphase interactions—may lead to non-uniform diffusion behavior, especially under turbulent or transient conditions. Moreover, the model assumes constant leakage pressure and isothermal conditions throughout the simulation. In reality, leakage pressure may decrease over time, and ambient or subsurface temperature variations could significantly affect phase behavior and diffusion dynamics. These simplifications were necessary for computational efficiency but may limit the model’s accuracy in replicating real-world leakage scenarios. Future work should consider incorporating non-homogeneous multiphase flow models, temperature sensitivity analysis, and dynamic pressure boundary conditions to improve simulation fidelity and practical relevance.
Process I (①→④): When the pipeline ruptures due to perforation, the internal pressure difference causes light hydrocarbons to gain initial kinetic energy and be ejected at high speed from the orifice. Affected by temperature and pressure, lighter hydrocarbon components vaporize rapidly and diffuse first through the soil in the gas phase and then continue dispersing into the atmosphere.
Process II (②→③→④): After leakage, heavier components slowly diffuse in liquid form within the soil. Although their gasification ability is limited, some light hydrocarbons may still undergo vaporization under the influence of temperature and pressure, diffusing through soil pores into the atmosphere in the gas phase.
Process III (②→⑤→⑥): Liquid light hydrocarbons gradually diffuse through the soil, permeating soil pores and migrating toward the surface. Some unvaporized components may be released into the atmosphere and vaporize directly upon exposure, forming gaseous diffusion.
Process IV (②→⑤): The mixed components gradually leak and spread on the ground in liquid form, accumulating and dispersing over the surface.
In these four scenarios of light hydrocarbon leakage, the final dispersion behavior consists of gaseous diffusion in the atmosphere and liquid flow on the ground, with the latter being constrained by soil properties. To model the most severe leakage conditions, this study focuses on exposed pipelines and excludes the effects of phase changes at the orifice or flow within the pipeline. The primary focus is on gaseous diffusion into the atmosphere and surface-level liquid spreading.

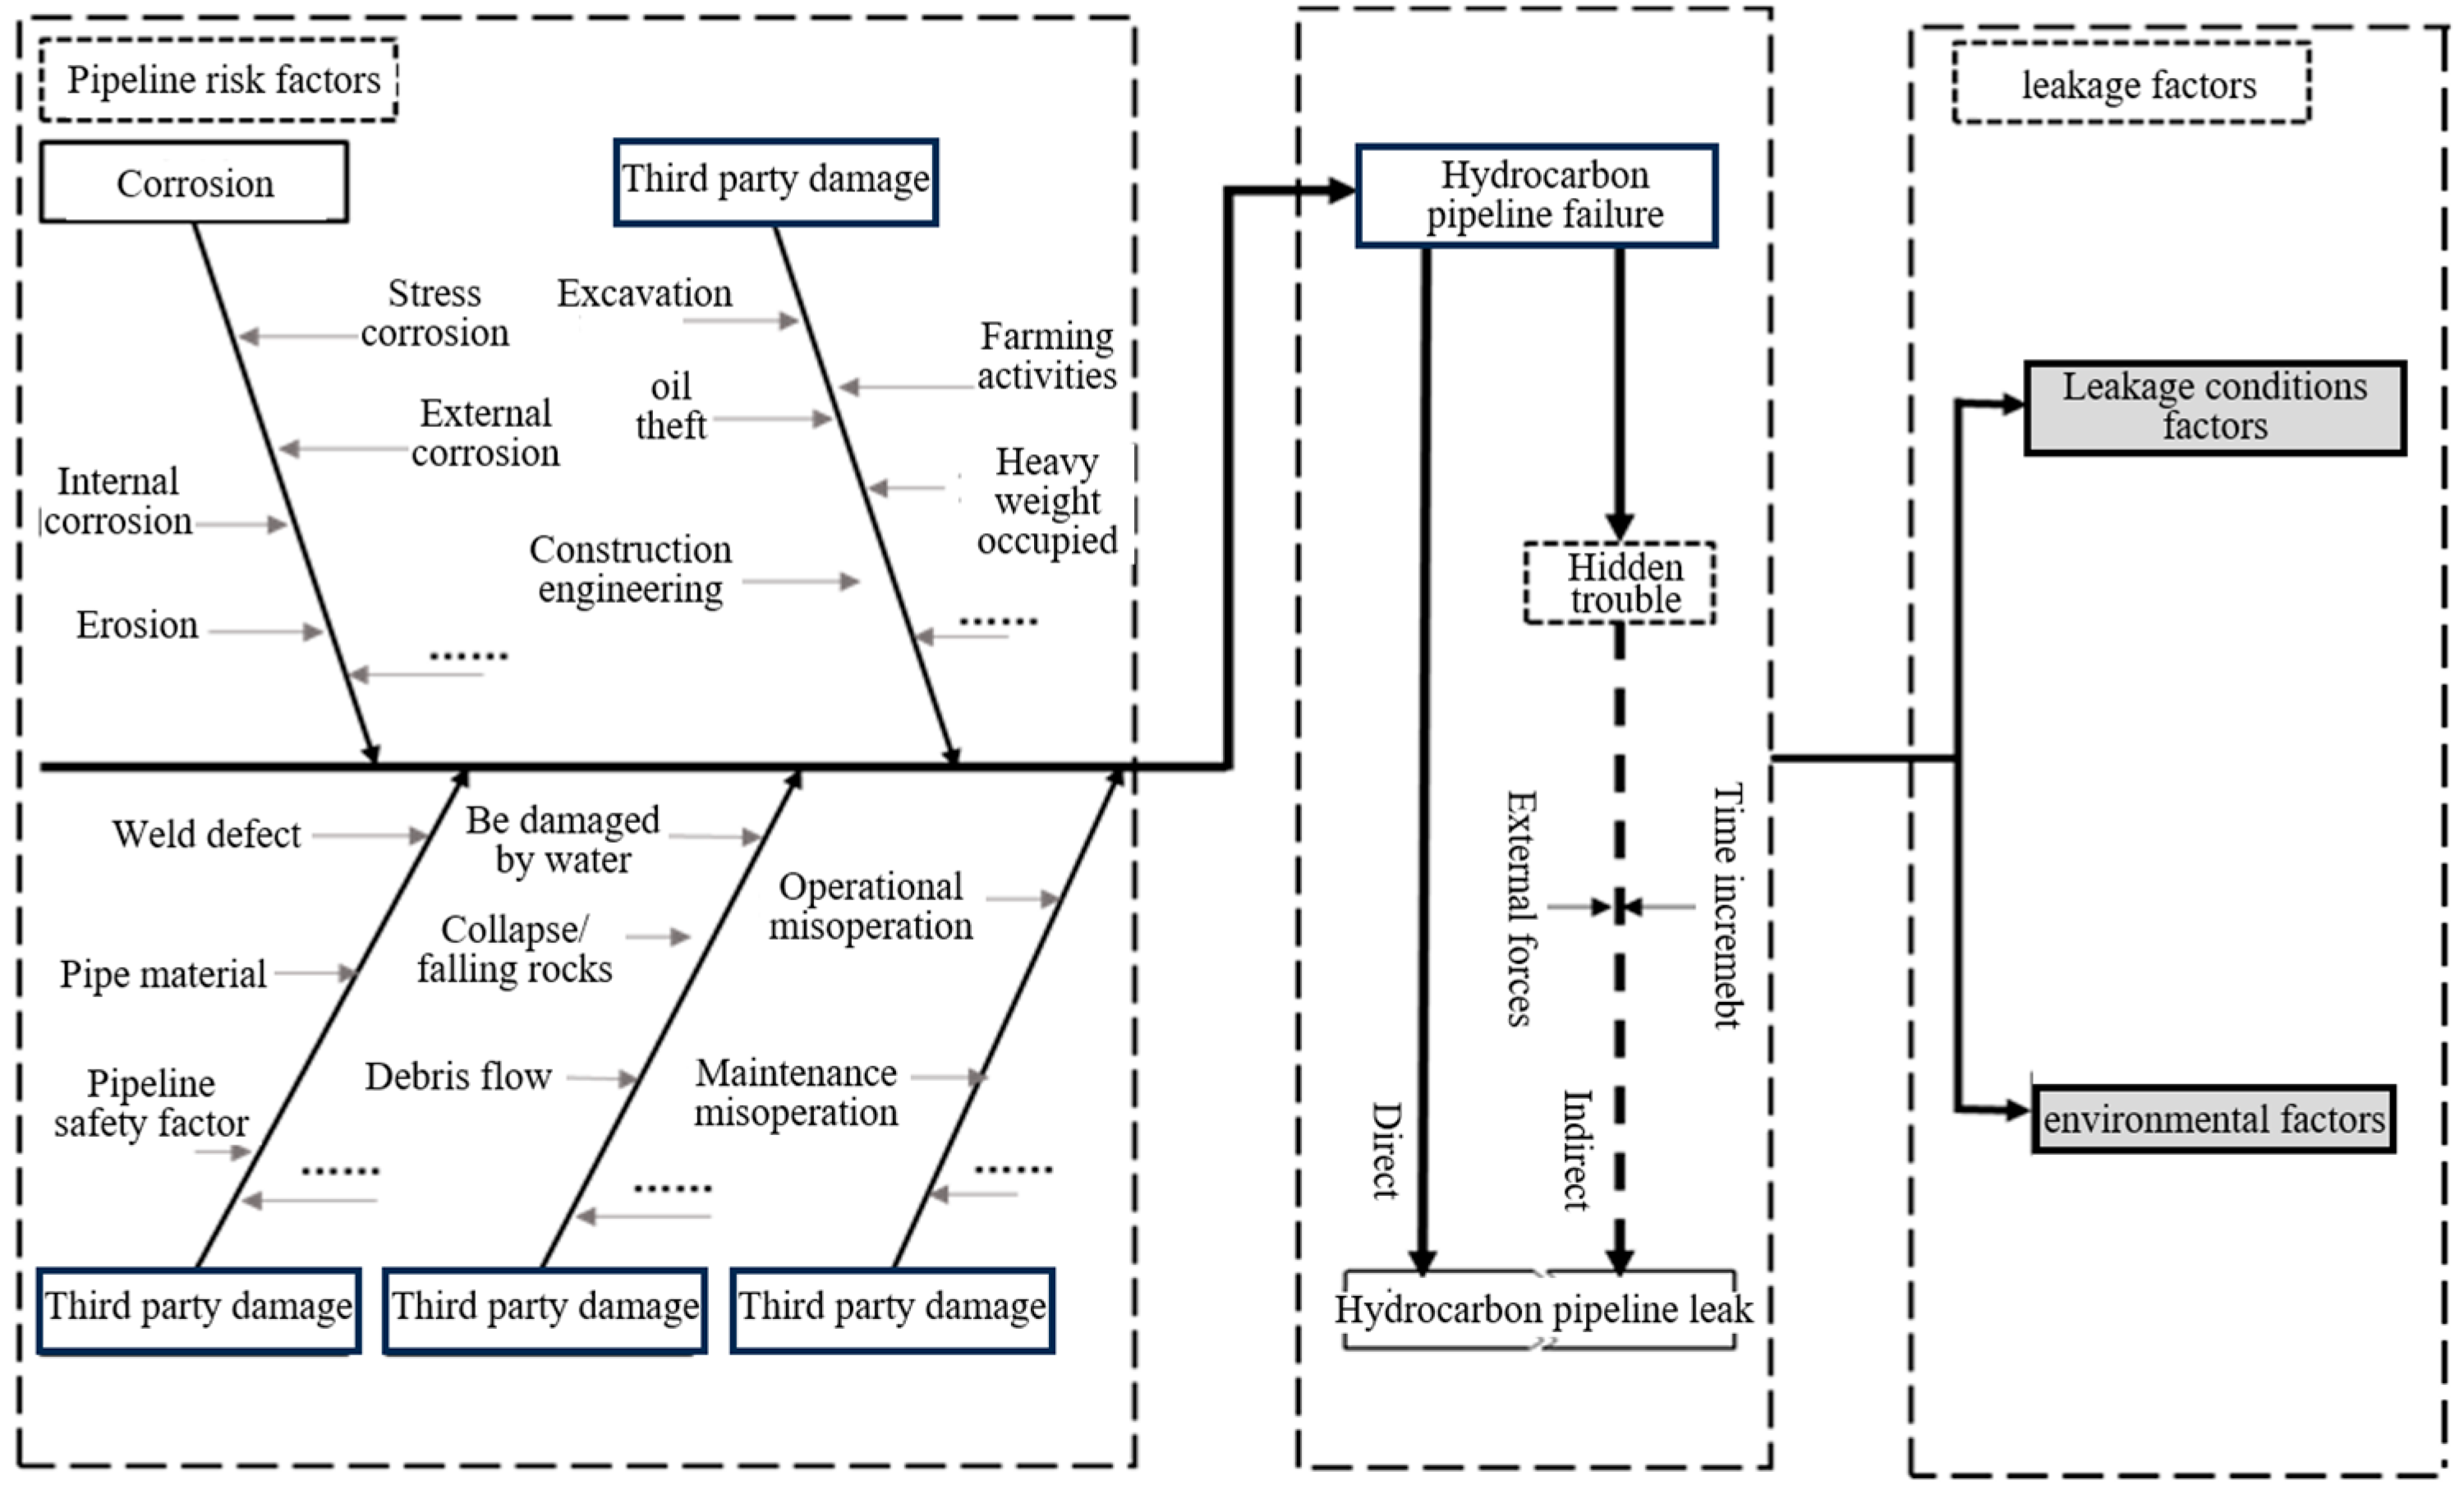
2.2. Analysis of Failure Modes and Factors of Light Hydrocarbon Pipelines

The U.S. PHMSA Pipeline Failure Classification Standard categorizes pipeline failure factors into seven major groups comprising 37 specific items, as shown in Table 1. These categories include corrosion, excavation damage, mishandling, material/welding/equipment failure, damage caused by natural forces, other external damage, and other causes [15].
The distribution of station light hydrocarbon pipelines involved in natural gas purification and crude oil stabilization is highly complex. Due to uncertainty in internal and external pipeline conditions and staggered pipeline layouts, potential failures are often difficult to detect. The natural environment of long-distance light hydrocarbon pipelines is also complicated by geographic and climatic variability. These pipelines frequently traverse urban areas and pass near populated communities, which further complicates the surrounding social environment and increases the potential consequences of pipeline failures.
According to statistical analysis of pipeline accidents in recent years in various countries, as shown in Figure 2 and Figure 3, combined with the actual situation of pipelines in China and the conditions of production and operation of light hydrocarbon pipelines, and with reference to the “Guidelines for Risk Evaluation of Oil and Gas Transmission Pipelines” [16], the risk factors for light hydrocarbon pipeline failure factors are classified into third-party damage, corrosion, mishandling, pipeline defects, and natural disasters.
Certain pipeline failure scenarios can directly cause perforation or rupture, leading to immediate leakage. Other failures may initially pose minimal impact or exist only as latent risks, yet they can still compromise pipeline integrity, eventually resulting in possible leakage, as illustrated in Figure 4. Based on the specific failure scenarios, the factors influencing light hydrocarbon pipeline leakage can be categorized as internal or external. Specifically, internal factors relate to pipeline conditions such as component ratio, conveying pressure, and orifice direction, while external factors refer to environmental conditions such as ambient wind speed.

2.3. Mathematical Modeling

2.3.1. Basic Equations of Fluid Mechanics

In light hydrocarbon pipelines, both the leaked material and the leakage process involve multiphase flow. These processes are governed by the continuity, momentum, and energy equations for multiphase systems, derived from fundamental fluid mechanics.
The continuity equation for the hydrocarbon mixture is expressed in terms of its density and mass-averaged velocity as follows [17]:
( ρ m ) t + ρ m v m = 0
where ρ m and v m are the mixture density and mass average velocity, respectively [18]:
ρ m = k = 1 n α k ρ k
v m = k = 1 n α k ρ k v k ρ m
where αk is volume fraction of light hydrocarbons of item k.
The mixed hydrocarbon momentum equations are obtained by summing all phase individual momentum equations:
ρ v m t + ρ m v m v m = p + [ μ m ( v m + v m T ) ] + ρ m g + F ( k = 1 n α k ρ k v d r , k v d r , k )
where μm is the mixture viscosity and v d r , k is the drift velocity of the subphase k:
μ m = k = 1 n α k μ k
v d r , k = v k v m

2.3.2. Turbulence Modeling

Light hydrocarbon pipeline leakage belongs to turbulent flow, and the standard k-ε model is more consistent with the simulation of turbulent flow in pipeline leakage. The model is based on two transport equations, which are more effective for turbulent flow with a high Reynolds number, Re. The two equations, consisting of the turbulent kinetic energy equation k and the turbulent energy dissipation equation ε, are calculated as follows [19]:
(1) k (turbulent kinetic energy) equation:
( ρ k ) t = x μ + μ i σ X i k x i + G k + G b ρ ε Y M
(2) ε (turbulent energy dissipation) equation:
ρ ( ε ) t = x i μ + μ i μ k ε x i + C 1 ε k ( G k + C 3 G b ) C 2 ρ ε 2 k
where μ is fluid viscosity; μ i is turbulent viscosity, μ i = ρ C μ k 2 / ε ; σ k is the turbulent Prandtl number; G b is buoyancy, which produces a turbulent kinetic energy term; G k is the mean velocity gradient, generating a turbulent kinetic energy term; Y M is the dissipation term due to fluctuating expansion of compressible turbulence; and C 1 , C 2 , and C 3 are empirical constants taken as 1.4, 1.9, and 1.

2.3.3. Modeling of Porous Media

The light hydrocarbon pipeline leakage model includes a soil layer and an air layer, in which the soil layer is considered to be set as a porous medium model. The spatial regions of the model’s soil and air layers are divided into Part-air and Part-soil, respectively, and the unit region condition of Part-soil is defined as a porous medium, and the porosity, viscous drag coefficient, and inertial drag coefficient are set. In the porous medium setting, two important resistance coefficients, viscous resistance and inertial resistance, need to be set, while the soil particle diameter and soil porosity are the key factors affecting the resistance coefficient, and the specific empirical formulas are shown as follows [20]:
Viscous drag coefficient:
C n = 150 D p 2 ( 1 ε 2 ) ε 2
Inertial drag coefficient:
C g = 3.5 D p ( 1 ε ) ε 3
where D p is the diameter of soil particles, and ε is soil porosity.

2.4. Physical Modeling

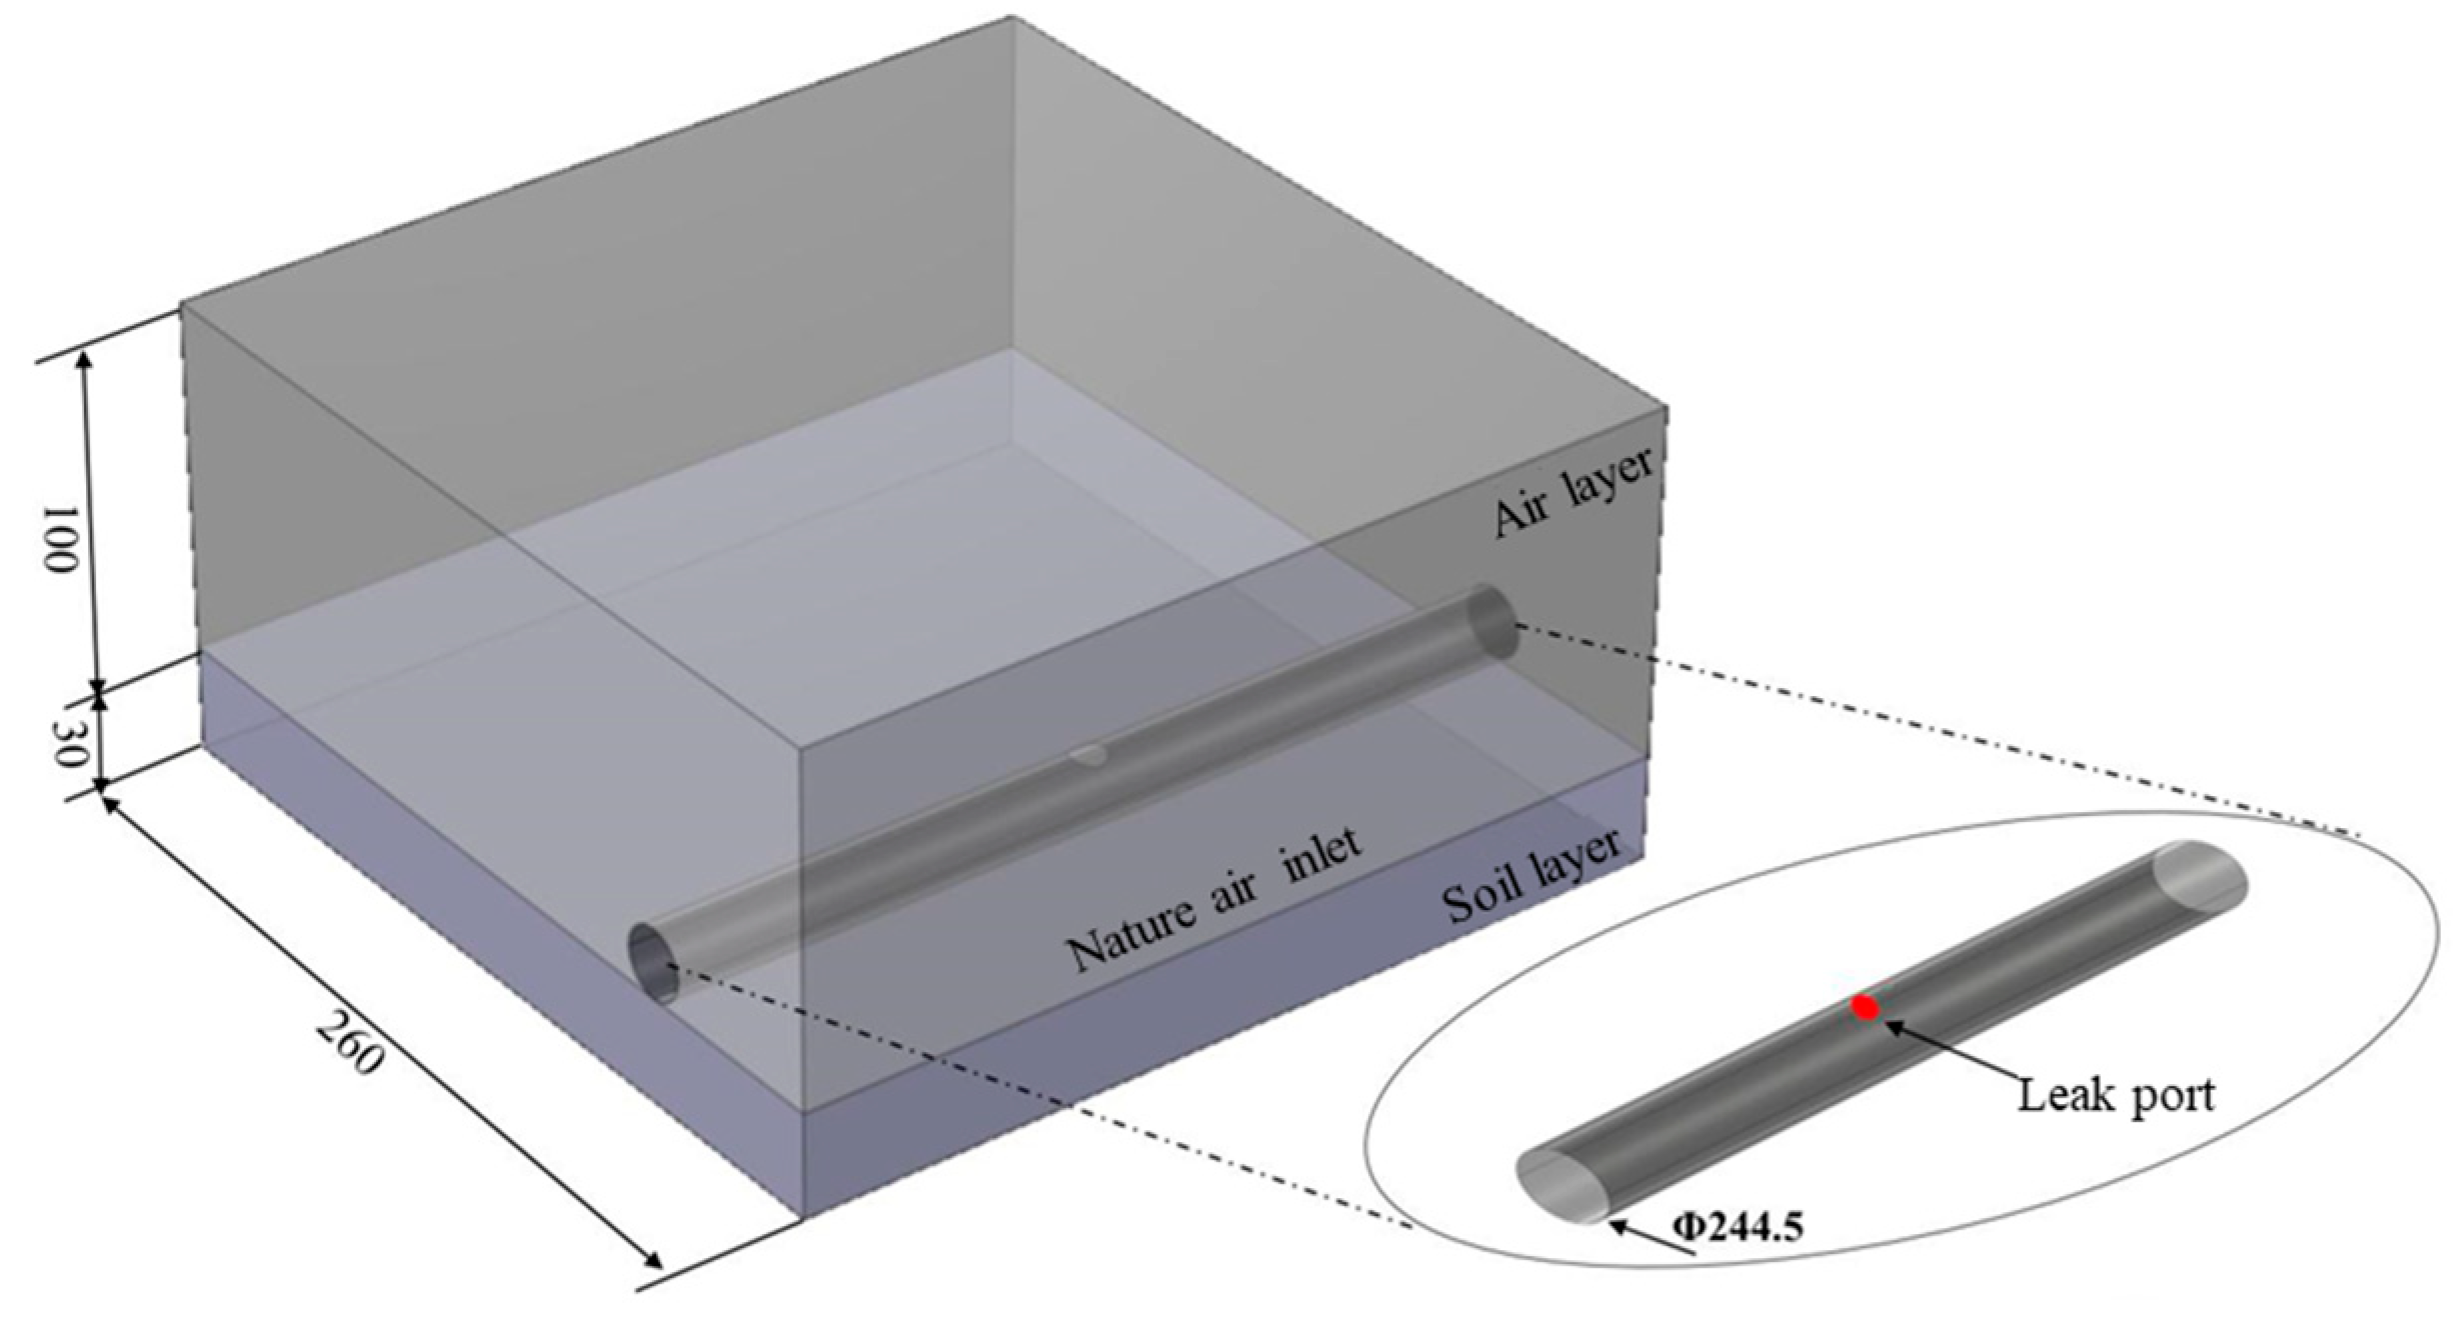
2.4.1. Geometric Configuration

A large-scale “atmosphere–pipeline–soil” leakage model for light hydrocarbons is established, taking the area in front of the pipeline as the research perspective. The model measures 260 m in length and 130 m in width. The upper 100 m represents the atmosphere, while the lower 30 m corresponds to the soil layer. The pipeline is placed 60 m from the left boundary, with a diameter of 244.5 mm and a wall thickness of 10 mm. The leakage orifice is located at the top of the pipeline and has a diameter of 20 mm. The left boundary of the atmosphere is set as the natural wind inlet, while the right and upper boundaries serve as diffusion outlets. The light hydrocarbon pipeline leakage diffusion model is illustrated in Figure 5.

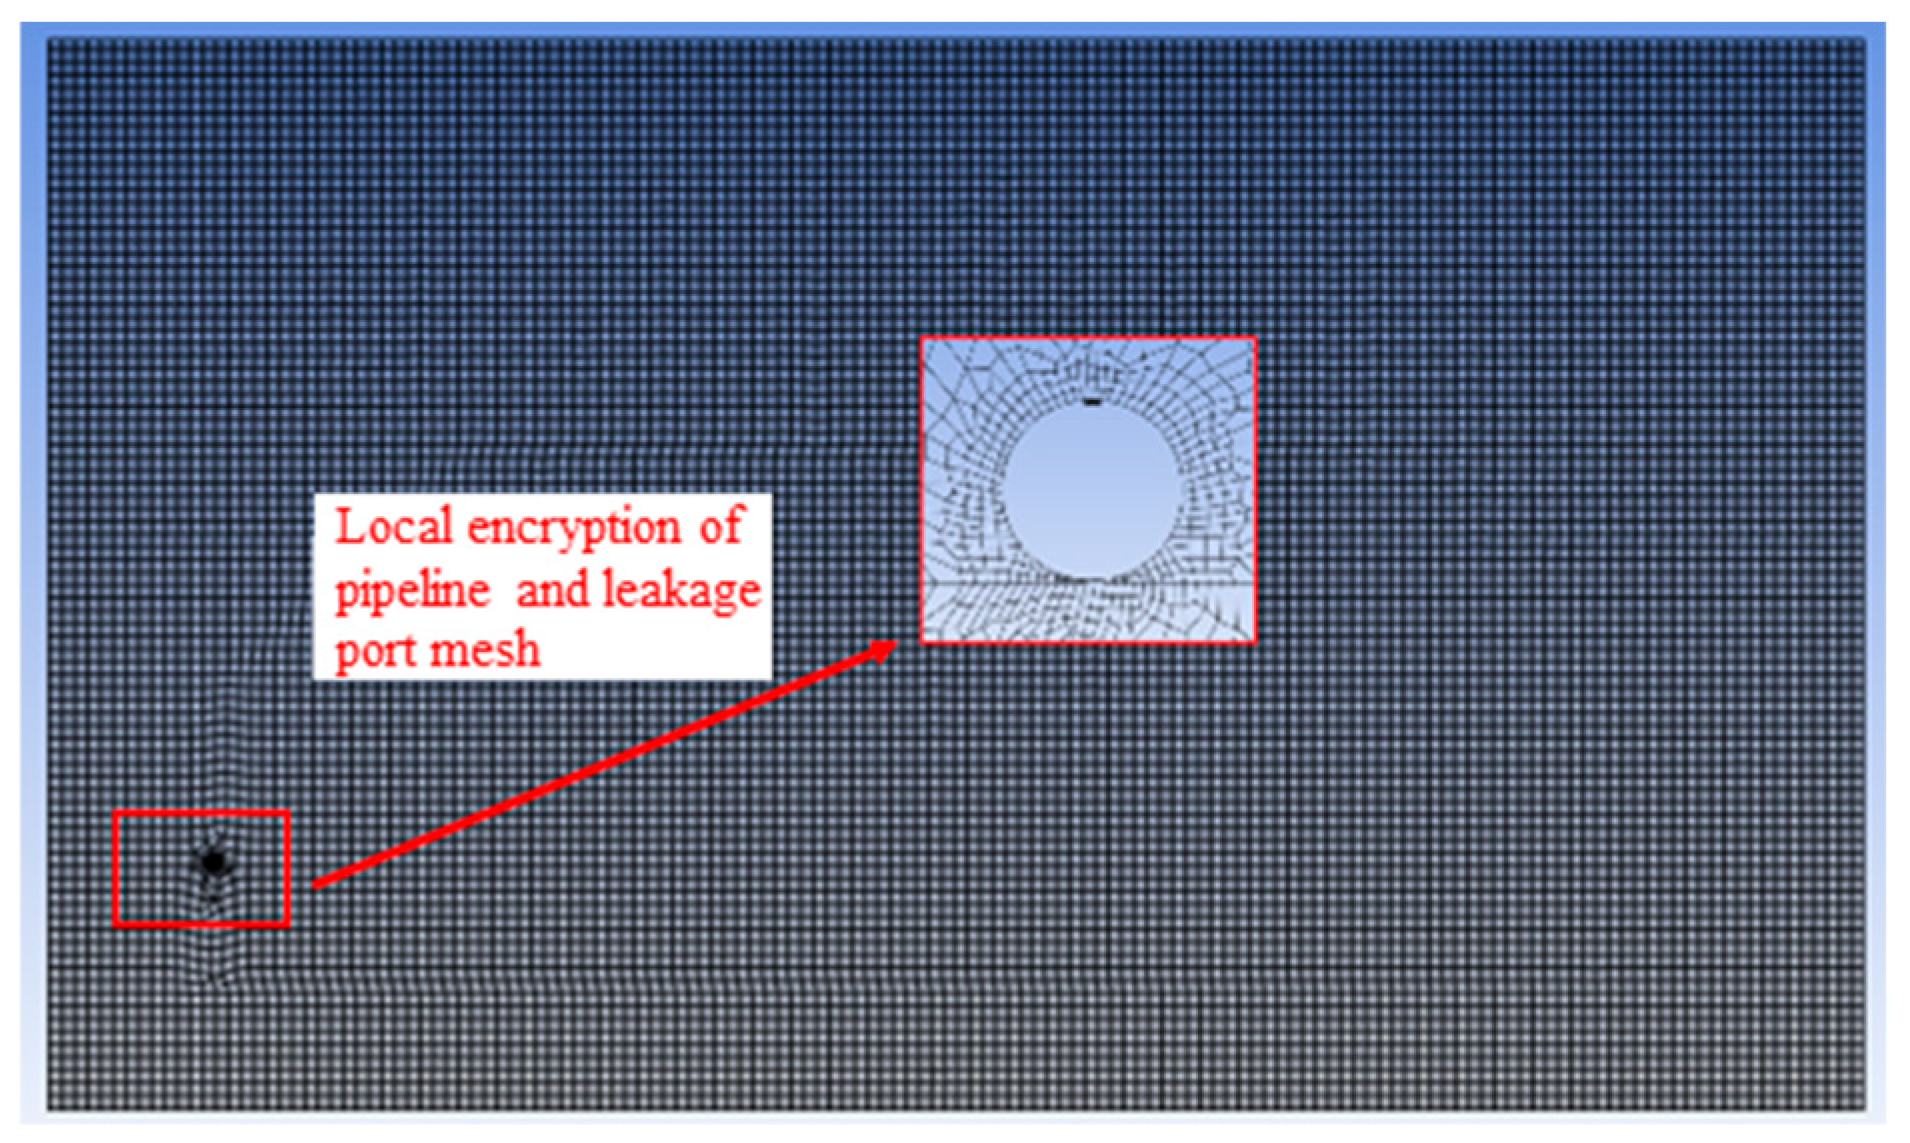
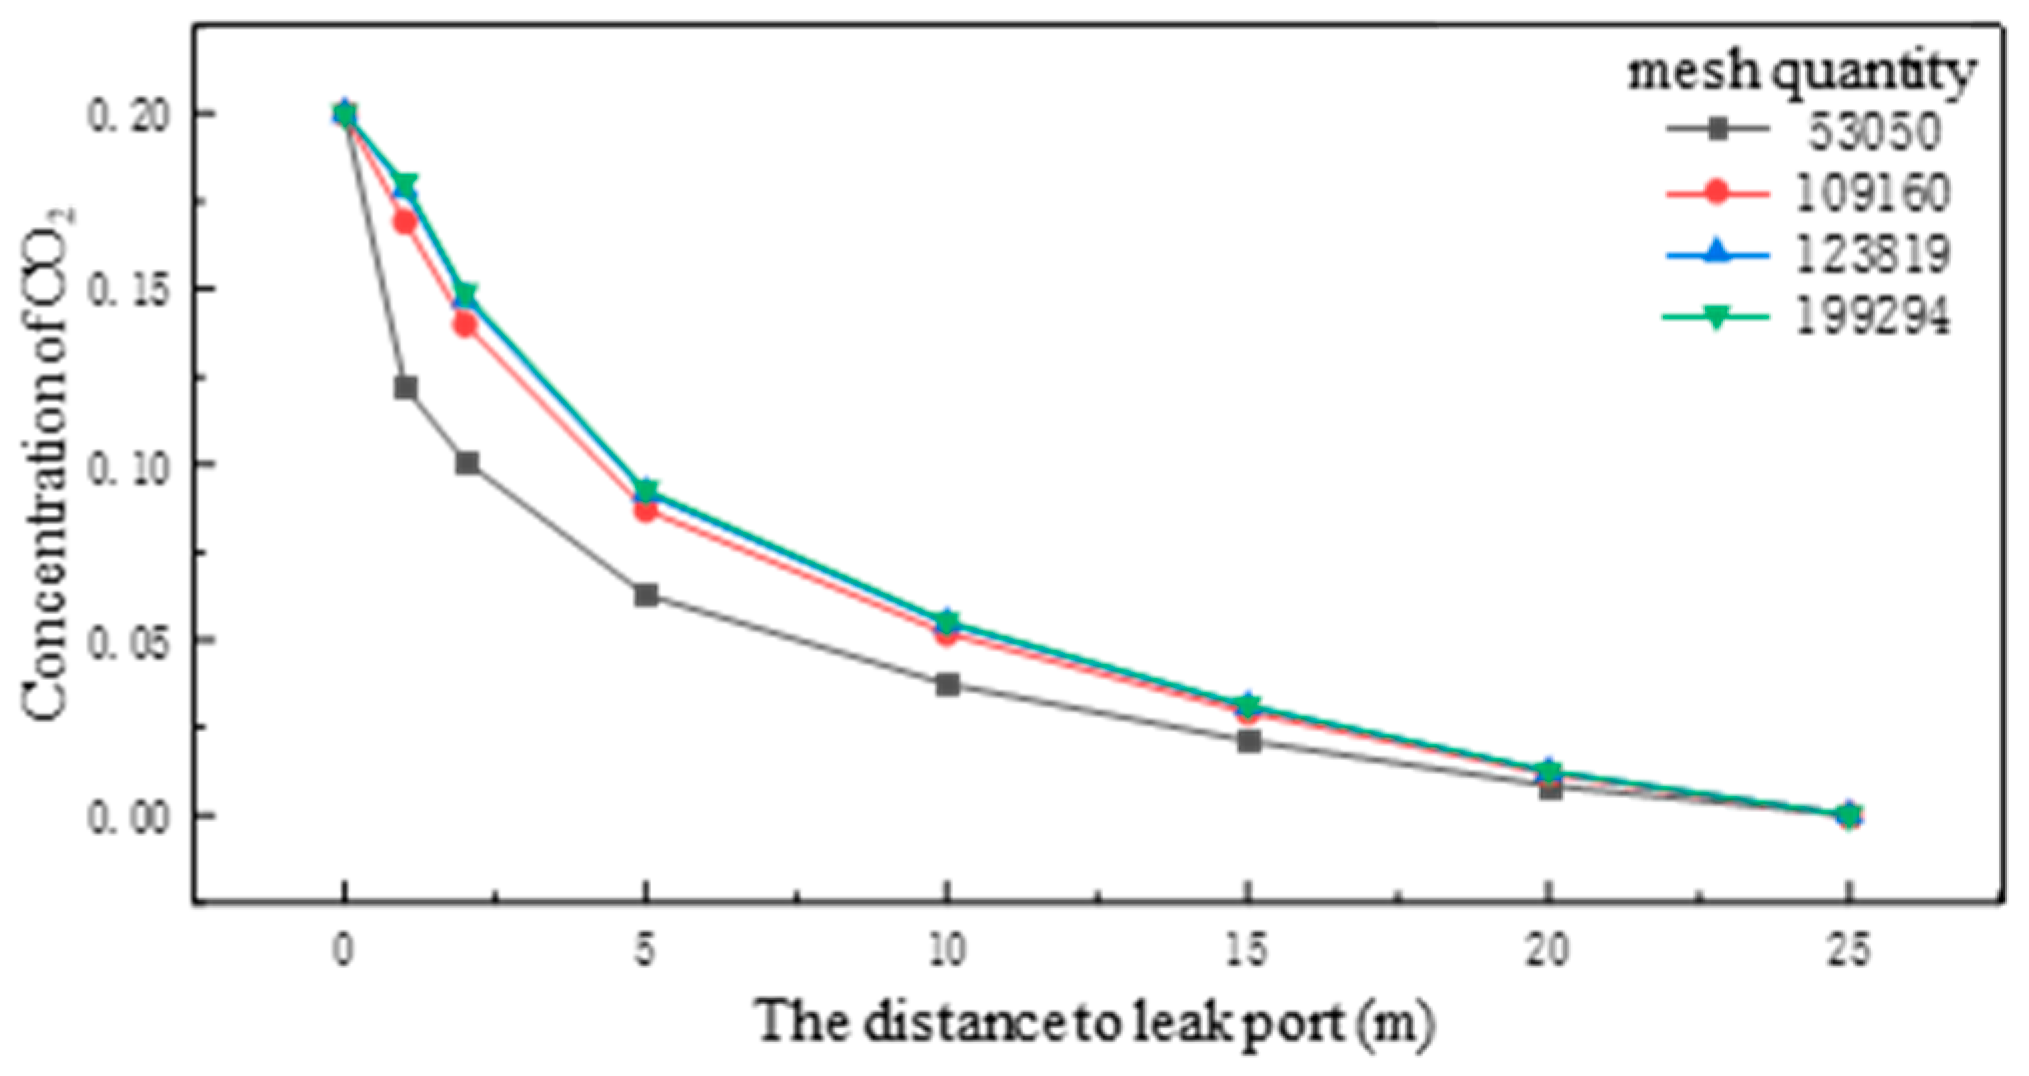
2.4.2. Grid Segmentation and Irrelevance Verification

In this paper, on the basis of Workbench, the geometric model is built by Spaceclaim, and meshing is performed by Meshing, as shown in Figure 6. The small hole leakage orifice and pipe size are much smaller than the overall size, so the pipe wall and orifice are used for local mesh encryption, so as to ensure the accuracy of the numerical simulation and reduce the amount of calculation.
The cell size of the grid and grid encryption multiples are adjusted to generate a total of four grid number of 53,050, 109,160, 123,819, and 199,294, as shown in Figure 7. The grid quality is more than 0.8, and the grid simulation uses a leakage of 800 s after the leakage of the mouth above the C2 concentration. When the number of grids is 123,819 and 199,294 when the concentration is very close, through the grid irrelevance verification and calculation of accurate reduction of the amount of calculation, the number of grids is set to 123,819.

2.4.3. Boundary Conditions and Model Solving Setup

(1)
Boundary condition setting
To ensure accurate and convergent results, all boundary conditions must be defined based on the specific boundaries of the computational model.
(a)
Pipeline: The leakage port is defined as a pressure inlet. The outer wall of the pipeline is treated as a non-slip stationary wall. The component boundary condition is set such that the mass fraction or mass flux of light hydrocarbons at the outer wall is zero, preventing inflow through the pipe wall.
(b)
Atmosphere: The left boundary is defined as a velocity inlet representing the natural wind, while the top and right boundaries are set as pressure outlets at atmospheric pressure.
(c)
Soil: The perimeter and bottom of the soil domain are defined as symmetry boundaries, and the top surface (ground) is defined as an internal interface.
(2)
Multiphase flow model setup
The mixture model is a simplified multiphase flow approach that represents all phases as a single pseudo-fluid while allowing relative velocity (slip) between phases. It assumes phase coupling over short spatial scales, making it suitable for simulating multiphase flows with moderate phase interactions and velocity differences.

2.4.4. Verification of Simulation Accuracy

To ensure the accuracy of the model, experimental data from completed pipeline leakage tests [16] are used for verification. The simulated pipeline medium is set to match that used in the experiment, and the basic operating conditions are summarized in Table 2. By comparing the simulation results with the experimental data, the error is found to remain within an acceptable range.

3. Analysis of the Whole Process of Light Hydrocarbon Pipeline Leakage Diffusion

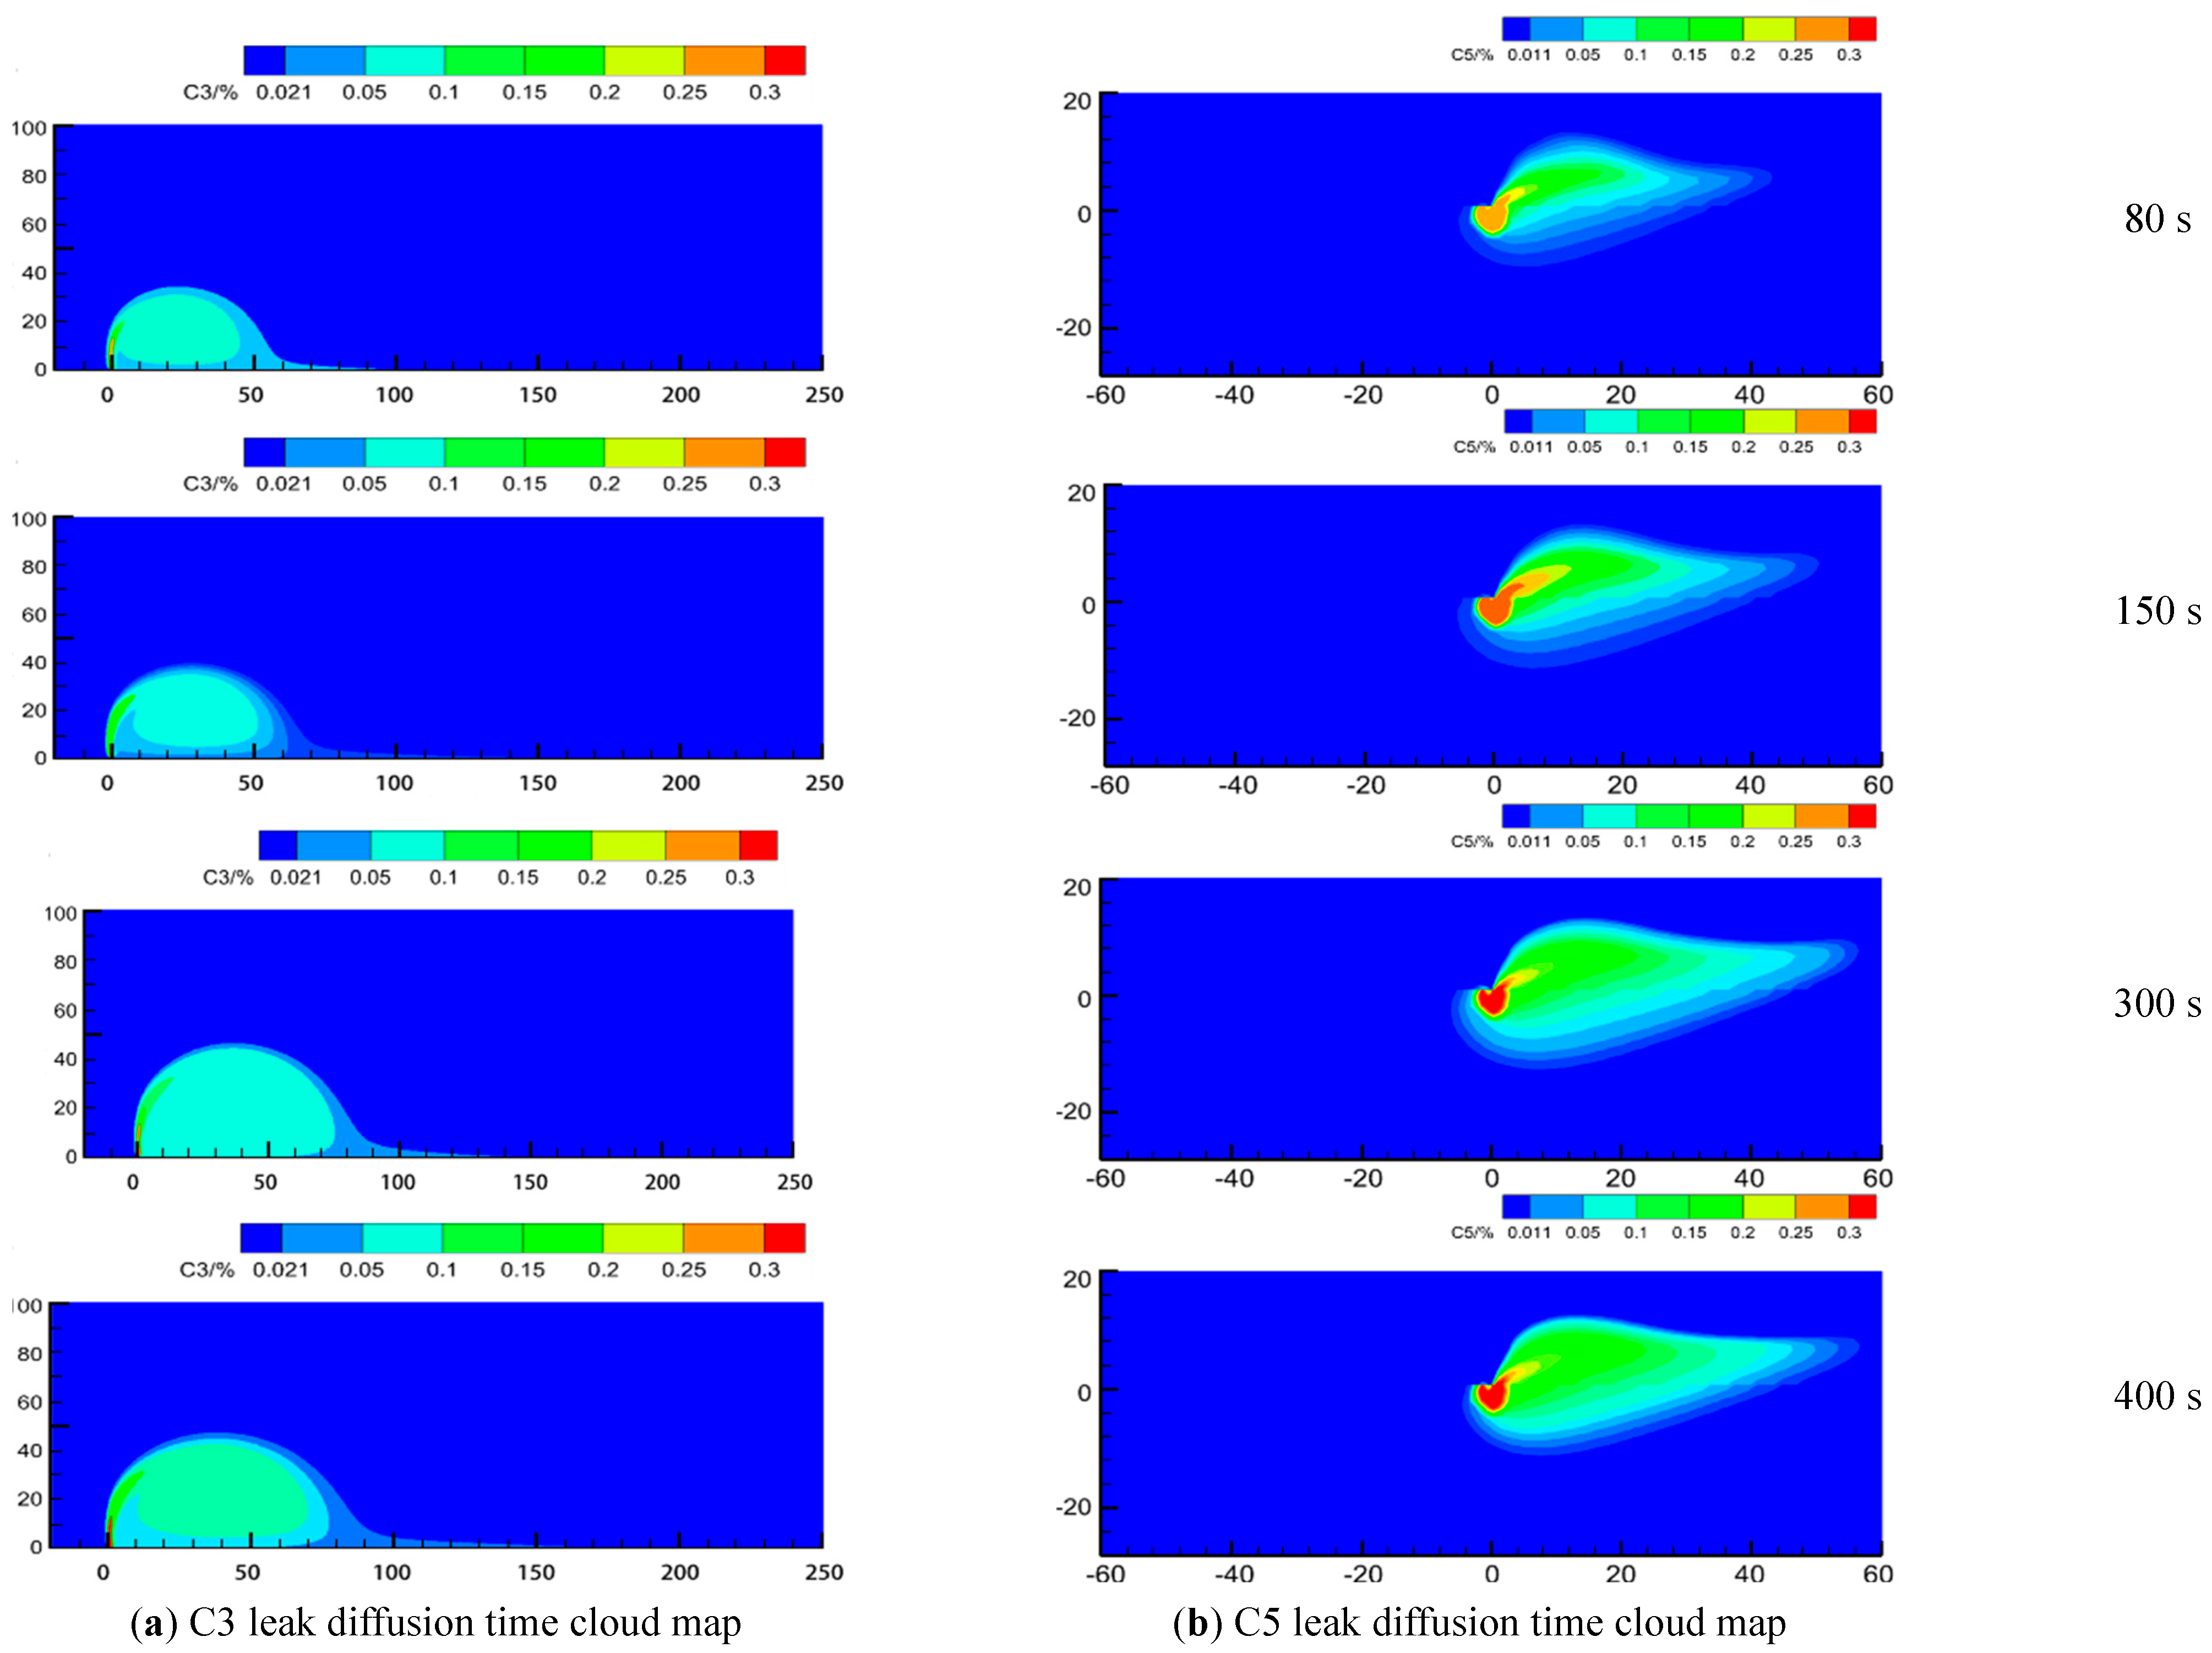
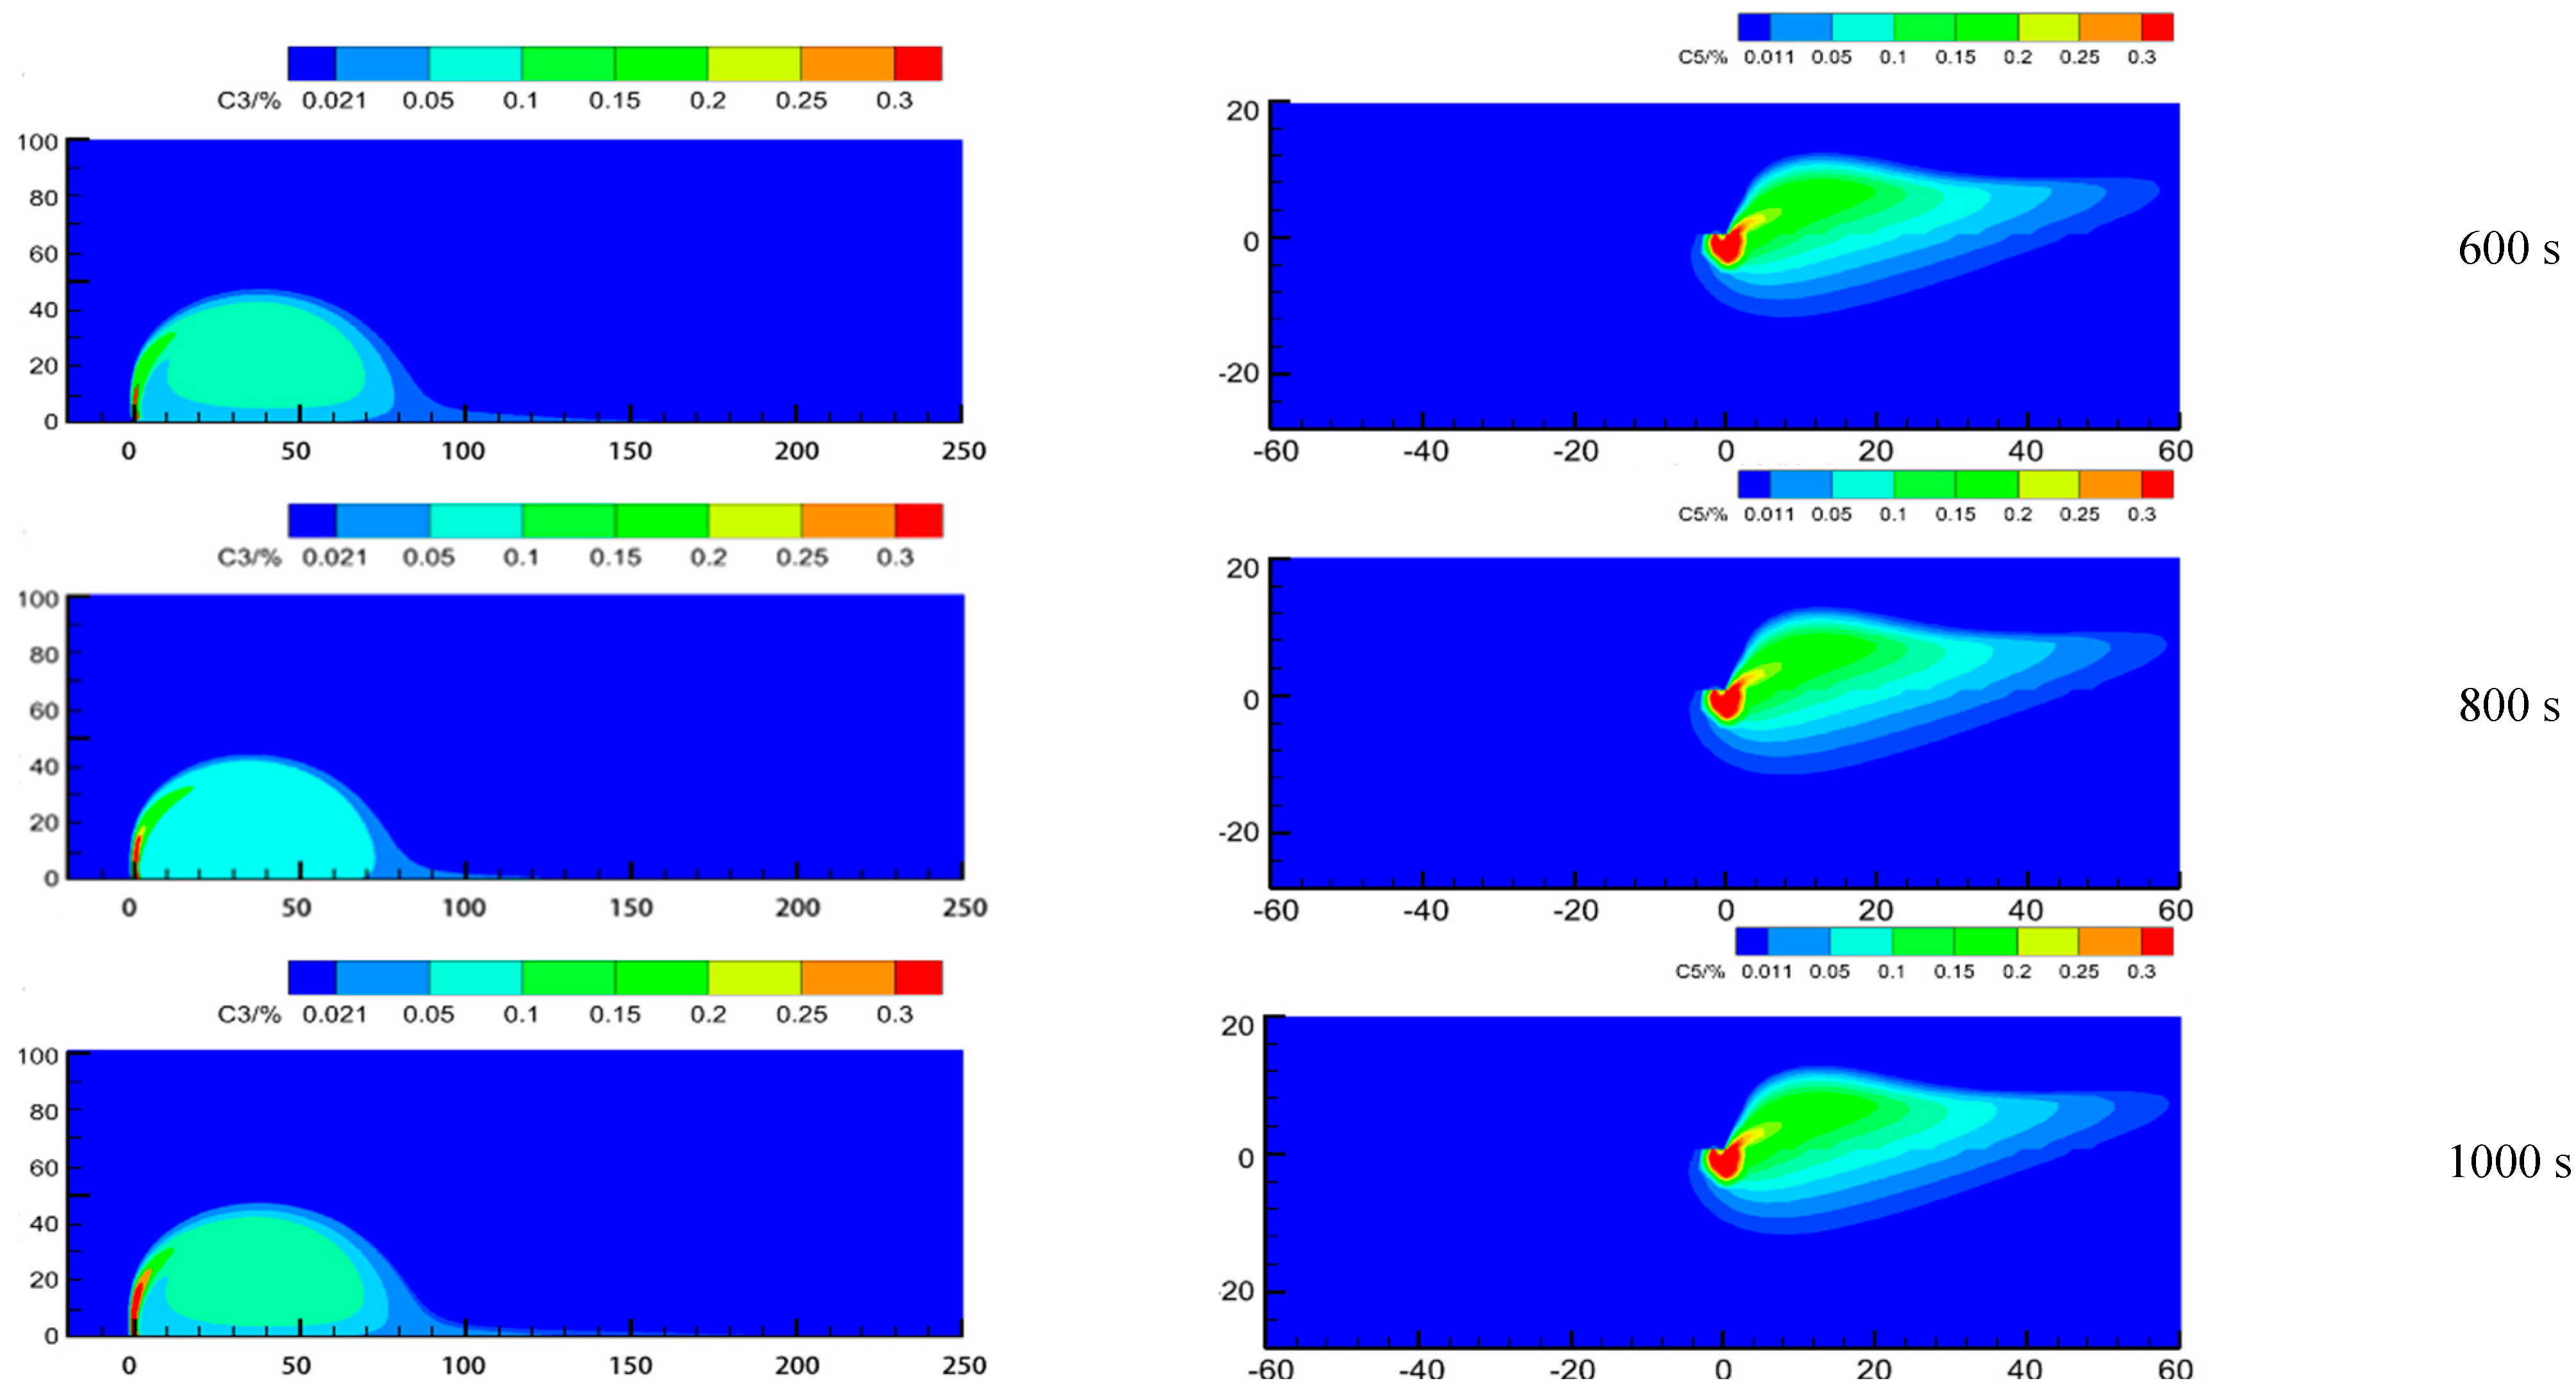
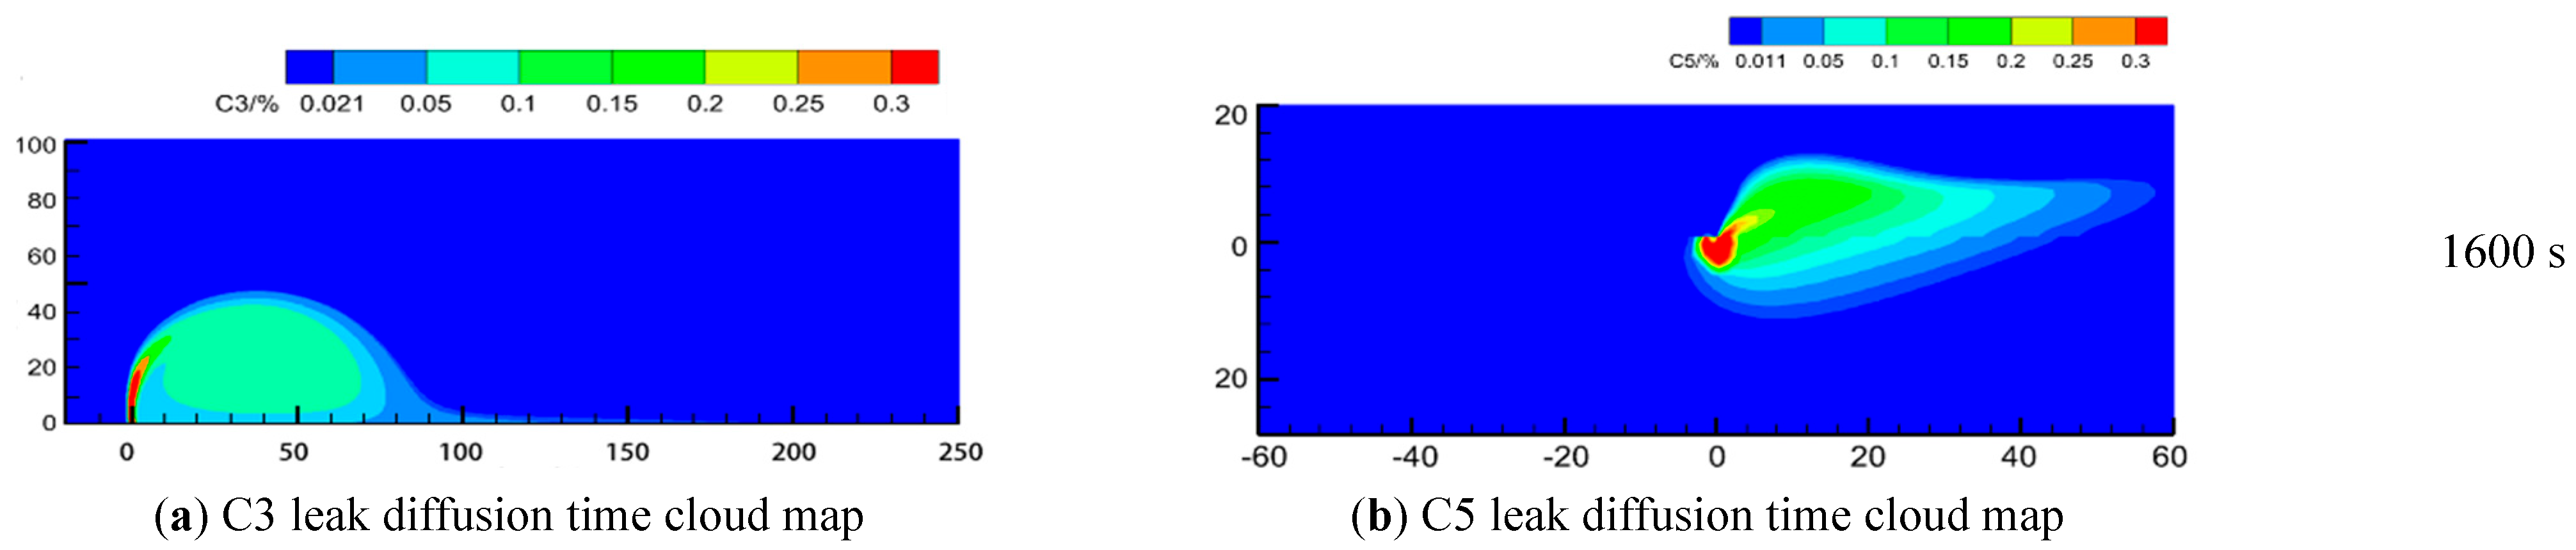
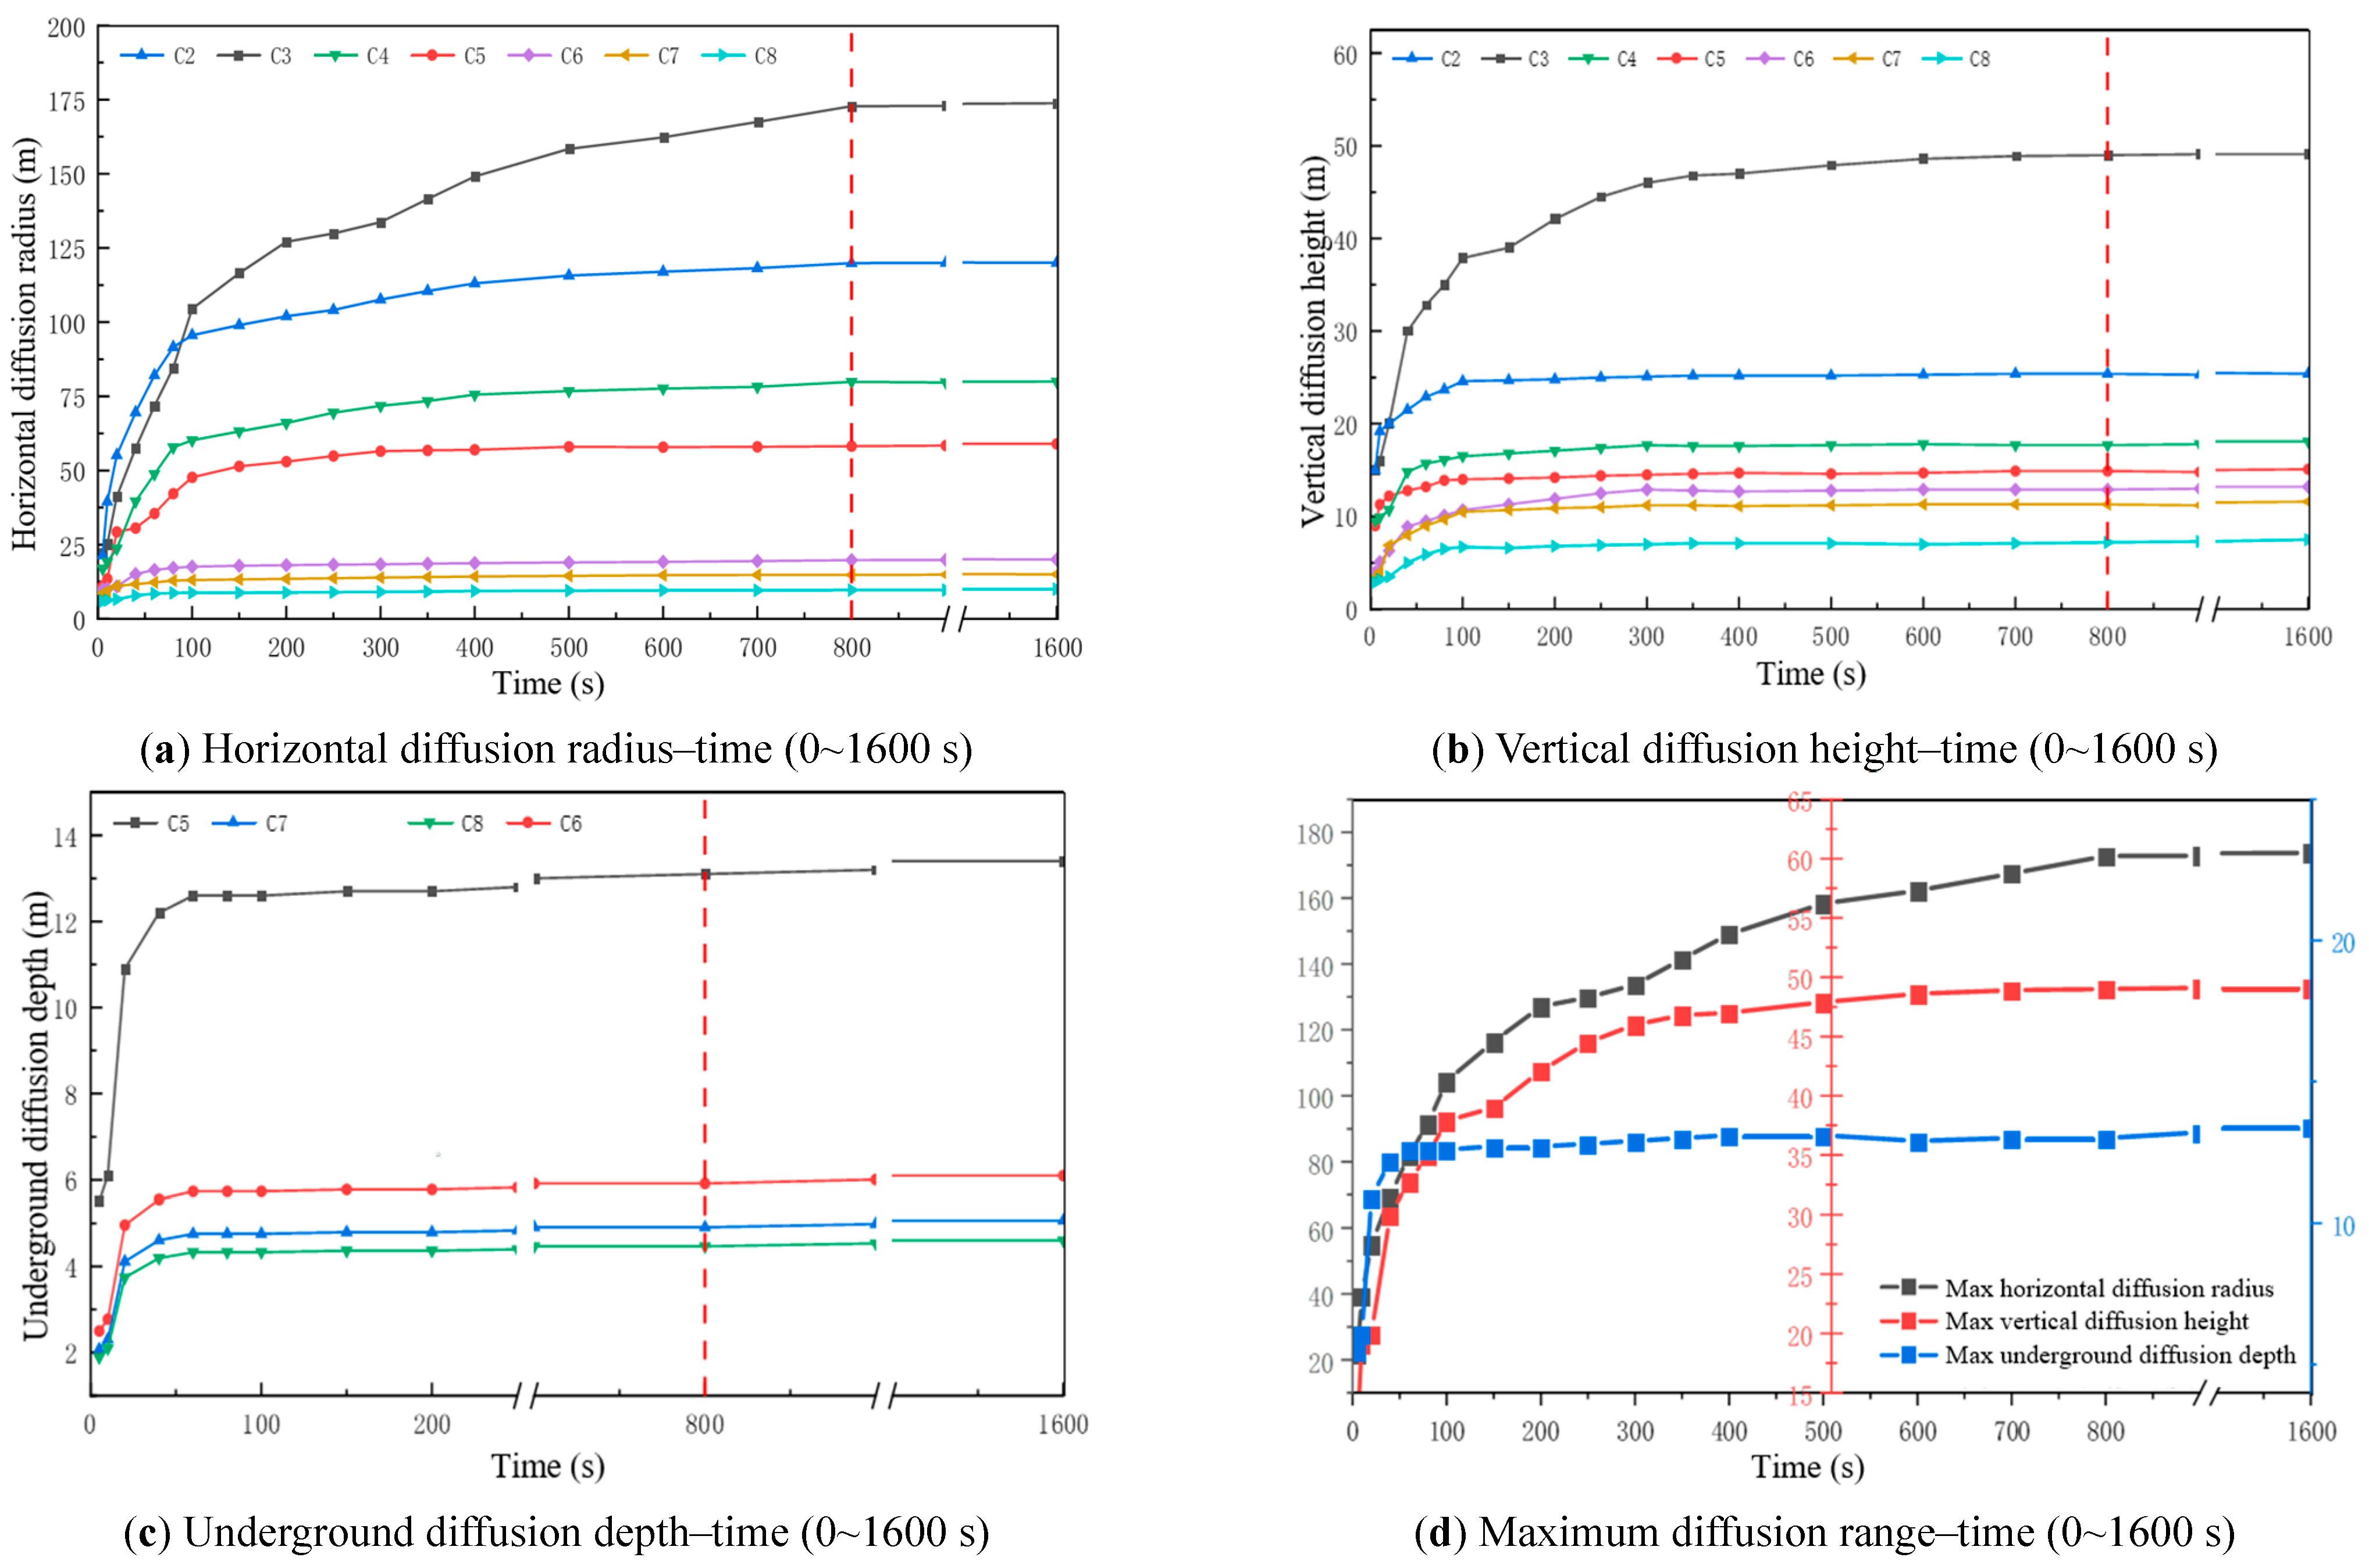
3.1. Numerical Simulation of the Whole Process of Light Hydrocarbon Pipeline Leakage

Light hydrocarbon pipeline leakage is simulated according to the parameters shown in Table 3 below, and based on the explosion limit of light hydrocarbons, the concentration of light hydrocarbons of concern is set as the lower explosion limit, as shown in Table 4.
The soil parameters used in the model, including porosity, particle diameter, and permeability coefficients, are derived from geotechnical survey data of the actual laying environment of a light hydrocarbon pipeline in an oilfield. These parameters reflect typical soil conditions encountered in buried pipeline engineering in arid sedimentary basins, ensuring the representativeness and engineering relevance of the simulation environment.
From the simulation results, the leakage diffusion is categorized into pre (5~40 s), mid (80~400 s), and post (600~1600 s), and some components are selected to be displayed as shown in Figure 8 (pre), Figure 9 (mid), and Figure 10 (post).
Pre-leakage: After the leakage, light-component hydrocarbons (C2–C4) rapidly vaporize and are ejected from the orifice, with their direction influenced by the wind. As the leakage continues, the diffusion range increases, especially in the horizontal direction. In contrast, the diffusion range of heavy-component hydrocarbons (C5–C8) shows less variation in the early stage. These components form cone-shaped plumes in the air due to wind effects and gradually fall toward the ground under gravity, continuing to spread both on and below the surface.
Middle stage: The diffusion range of gaseous hydrocarbons gradually increases, with pronounced aggregation and high-concentration zones forming near the leakage port. However, the diffusion rate noticeably slows down between 300 and 400 s, and the vertical diffusion height changes little. Liquid hydrocarbons primarily exhibit horizontal spreading and downward seepage, with horizontal diffusion being more prominent. The overall diffusion pattern remains essentially stable during this stage.
Late stage: After approximately 800 s, the horizontal diffusion radius, vertical diffusion height, and underground penetration depth all stabilize, indicating that the leakage has reached a steady state. This trend is illustrated in Figure 11, which depicts the temporal variation of diffusion metrics for all components.
Analysis:
(1)
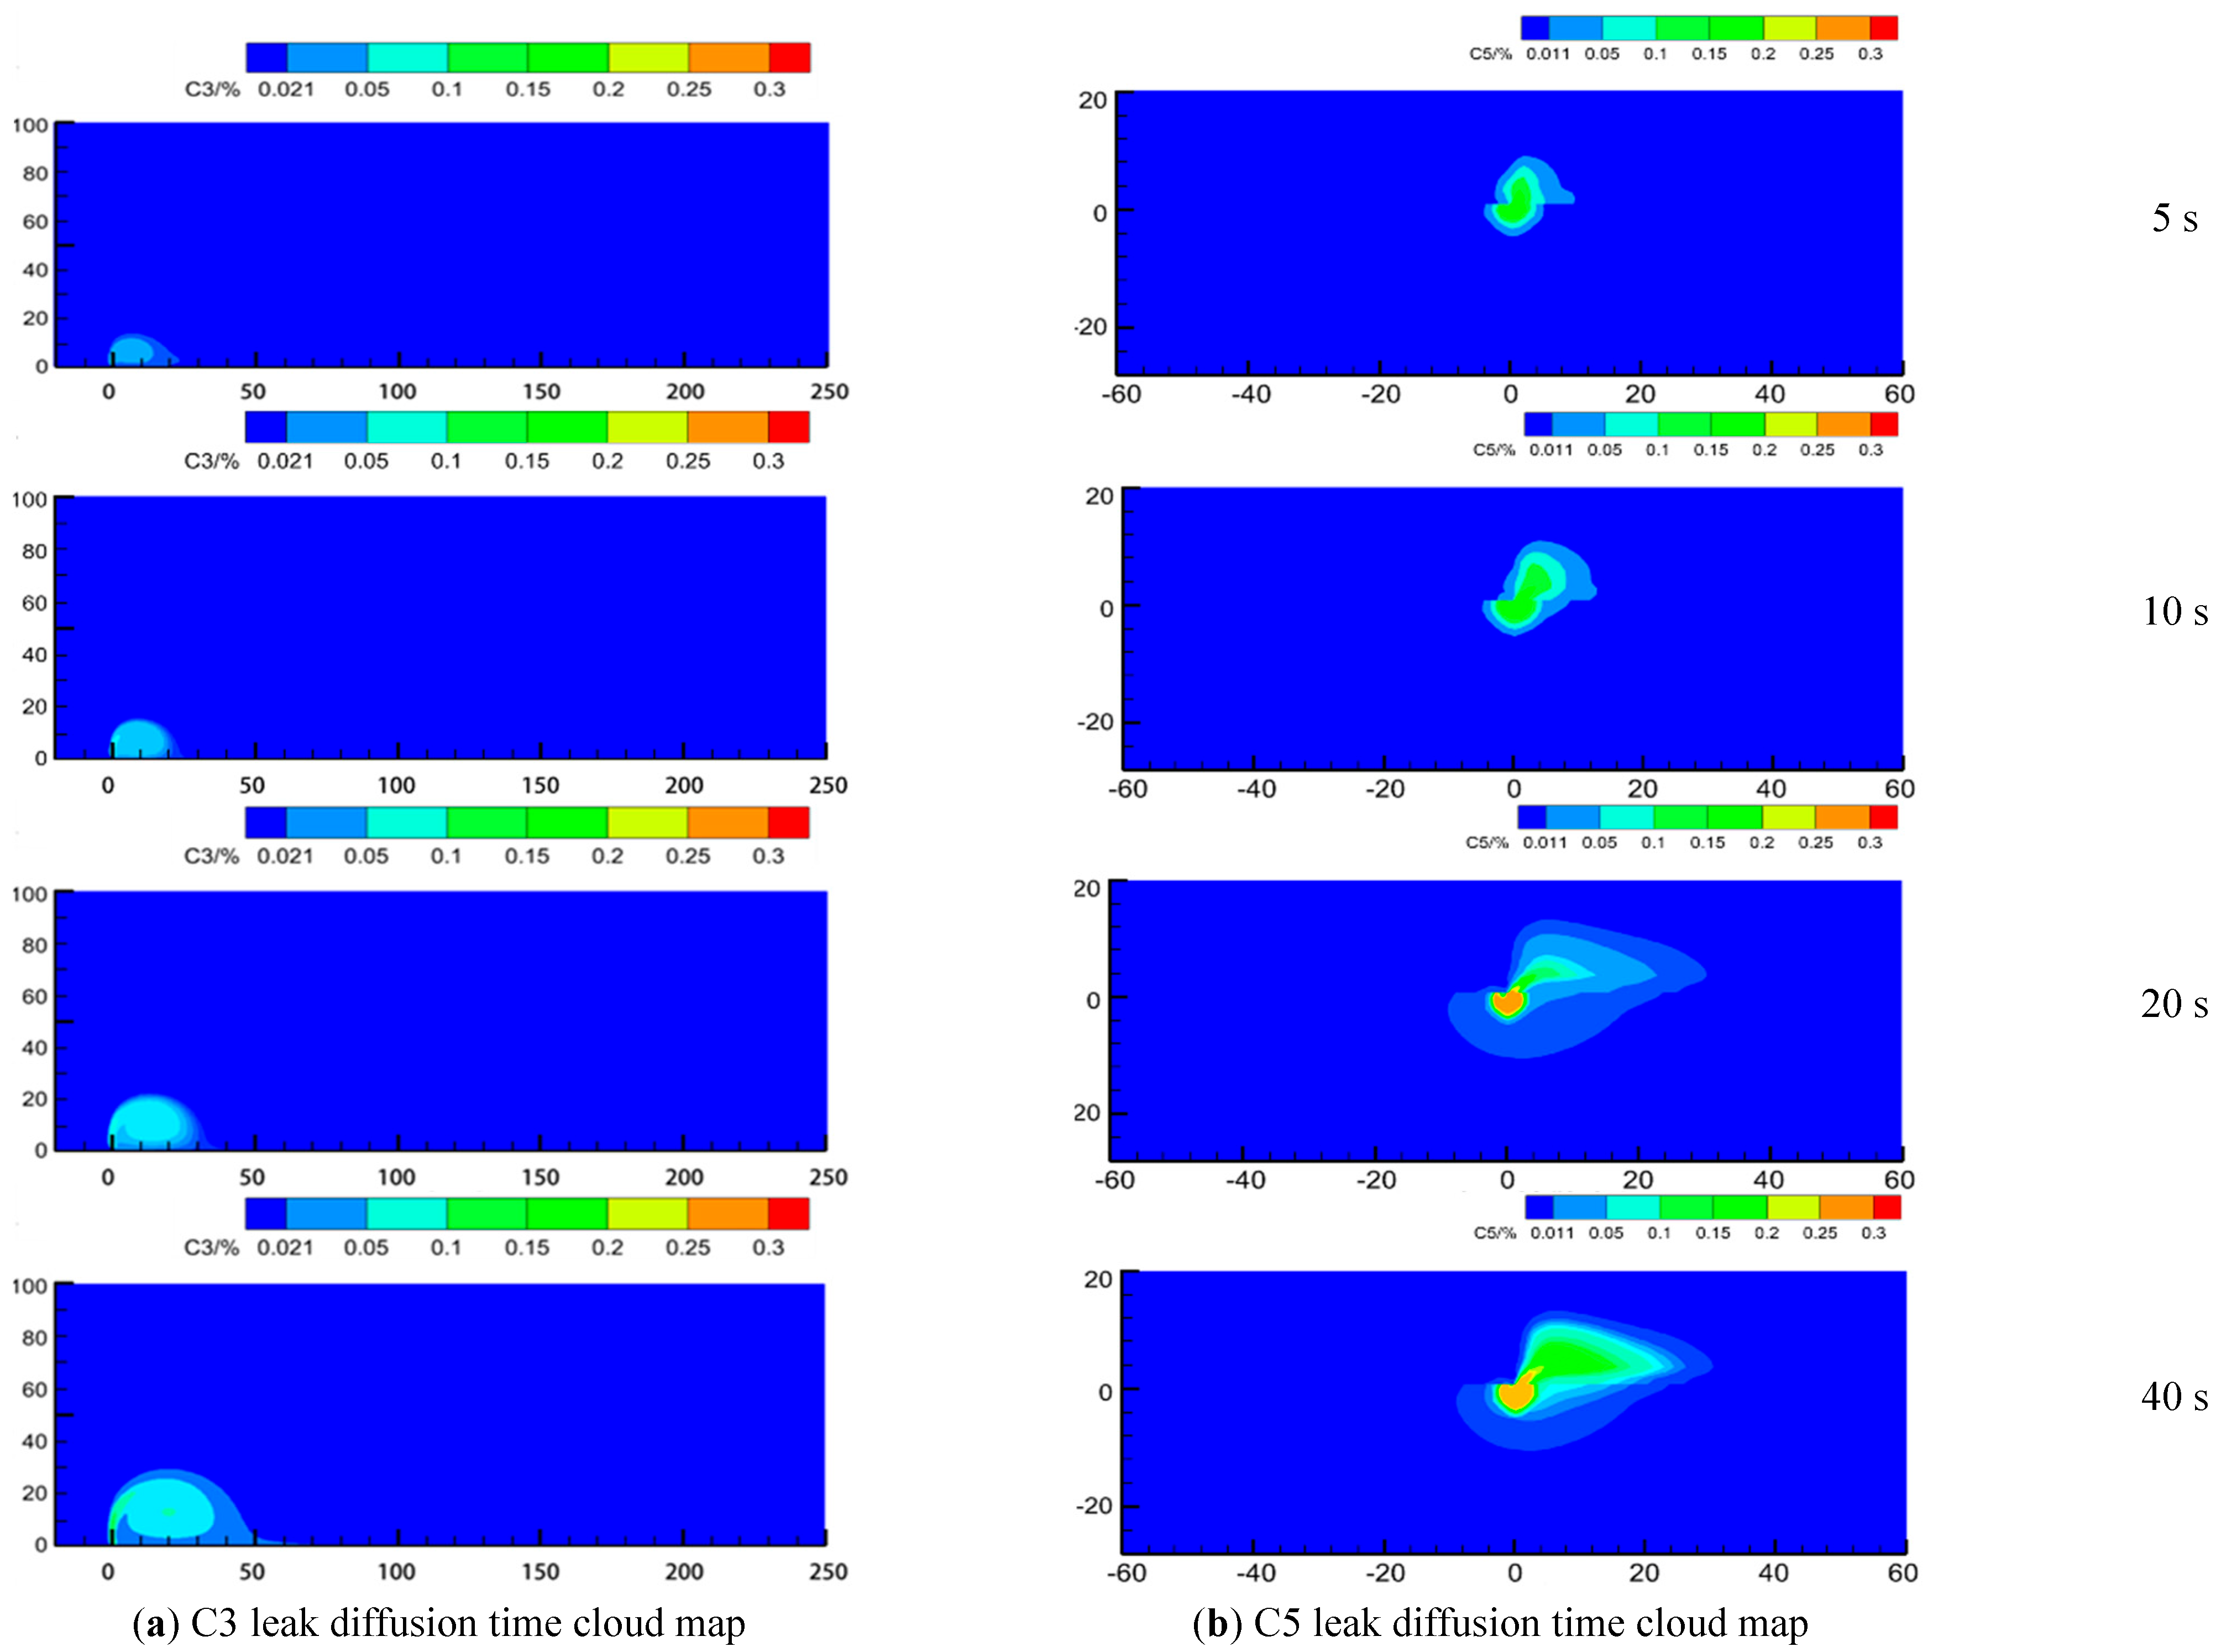
The horizontal radius, vertical height, and underground depth of diffusion all stabilize after 800 s, showing rapid early expansion followed by gradual slowing. Liquid hydrocarbons tend to stabilize earlier than gaseous ones, and heavier components stabilize more quickly.
(2)
In the early stage, light components diffuse more rapidly than heavy ones. C2 shows a faster initial rate than C3, but due to the higher proportion of C3 in the mixture, its overall diffusion range eventually exceeds that of C2.
(3)
C5, as the lightest and most abundant liquid hydrocarbon, exhibits the largest overall diffusion range. As a result, the diffusion behaviors of C3 and C5 are particularly critical for understanding the leakage and dispersion patterns of light hydrocarbons.

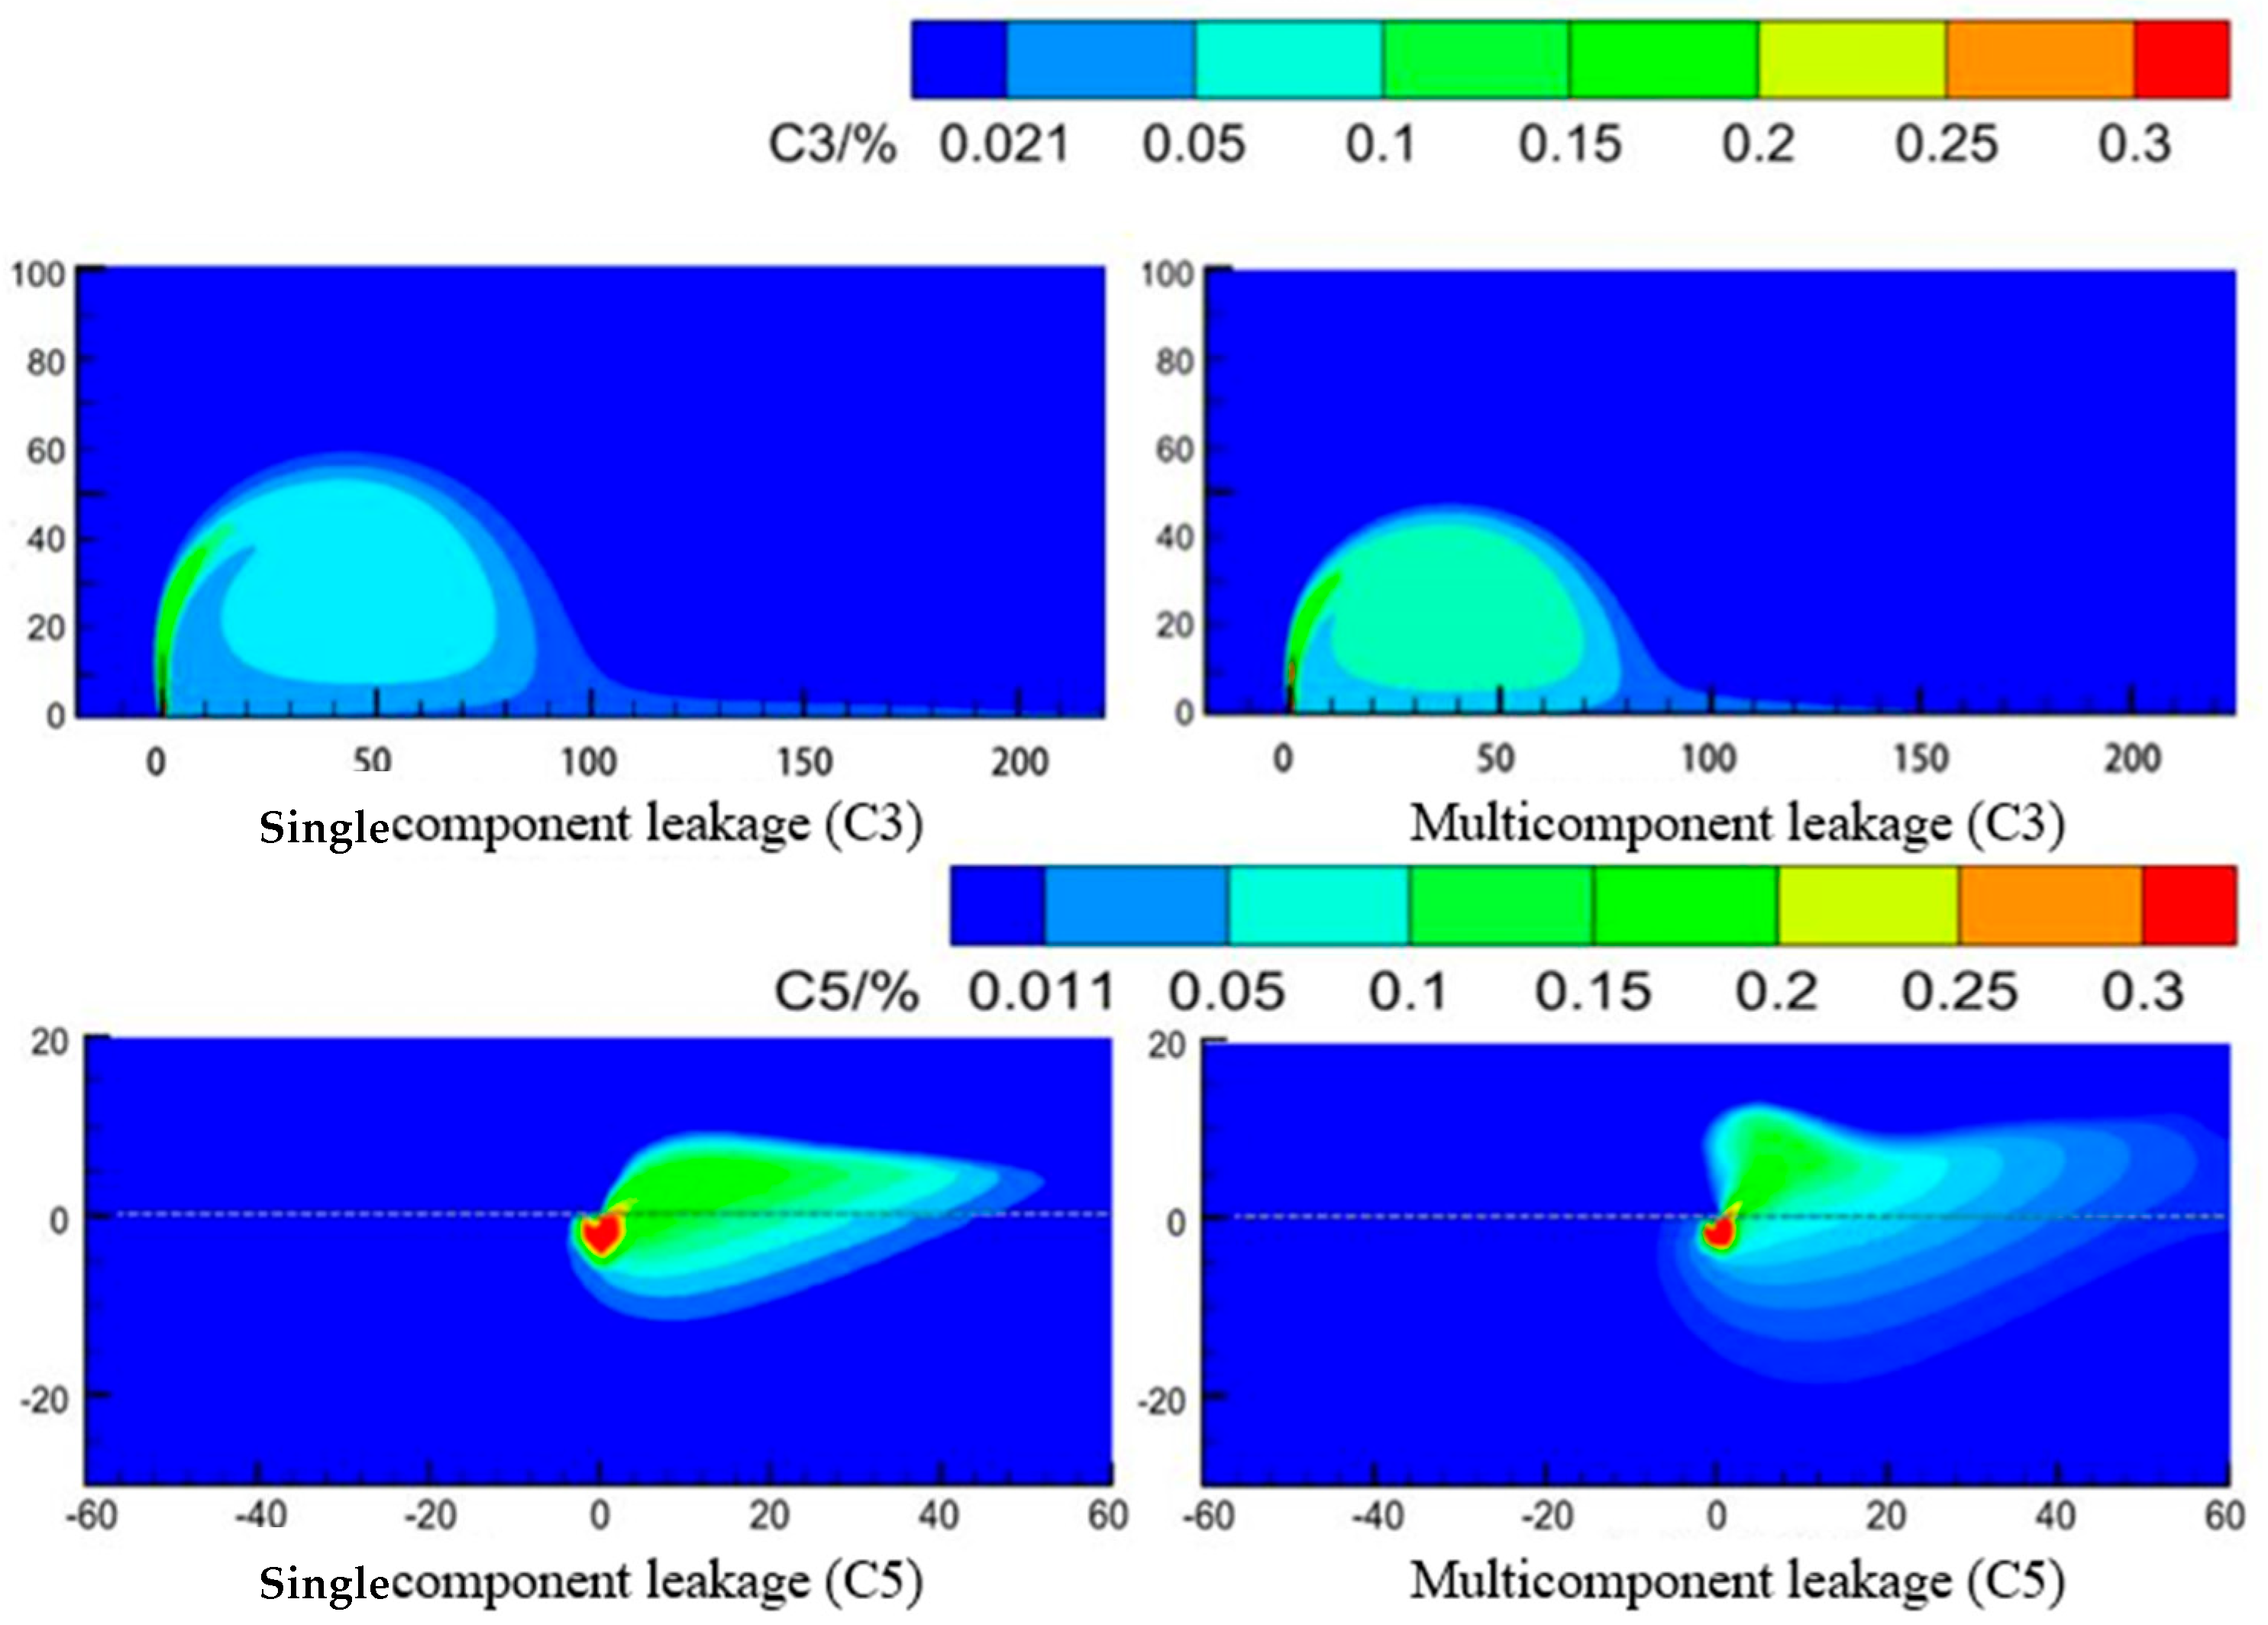
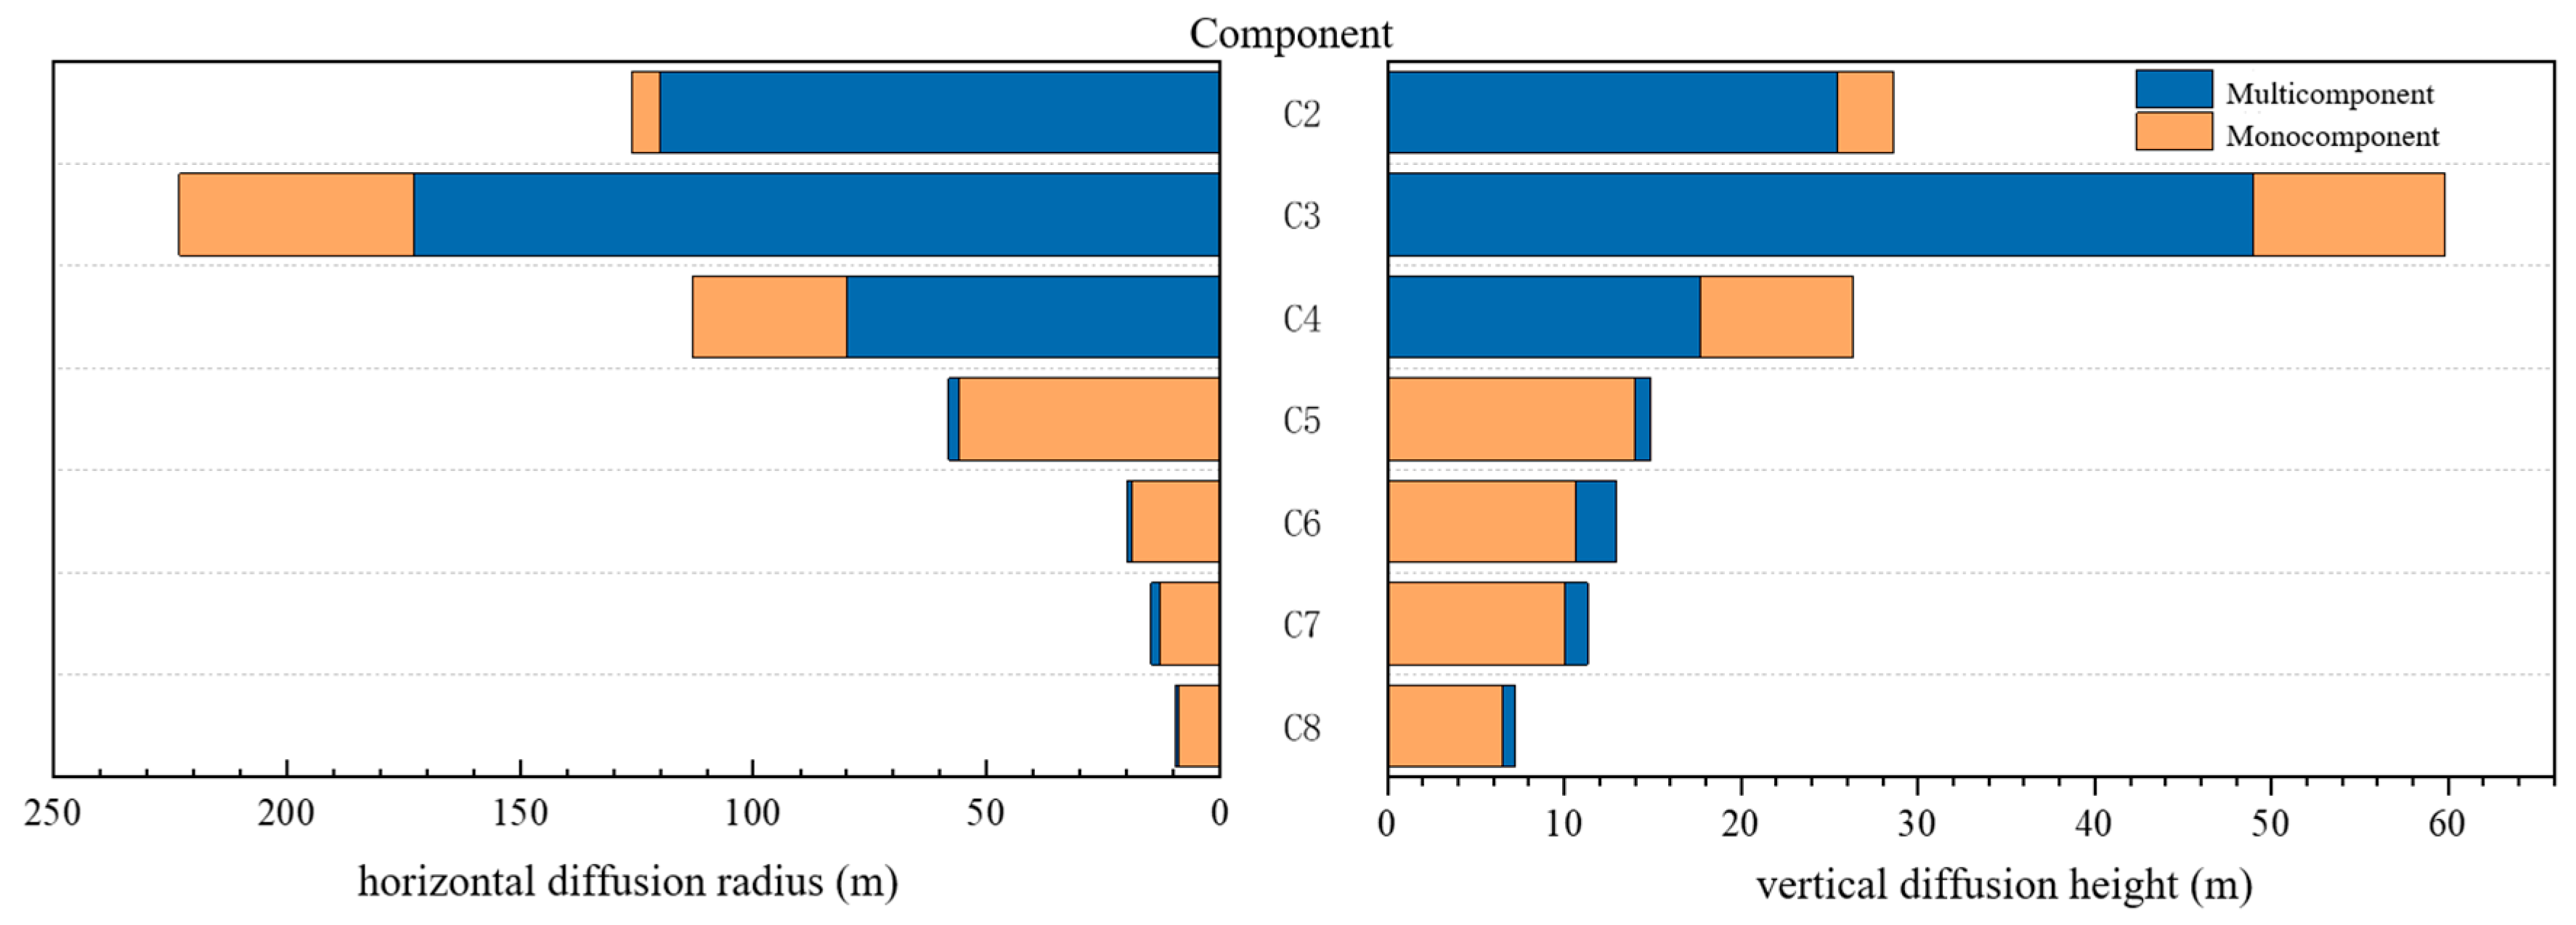
3.2. Comparative Analysis of Multi-Component Leakage Versus Single-Component Leakage

In light hydrocarbon pipeline transportation medium for multi-component light hydrocarbon mixtures (mainly C2~C8), mixed light hydrocarbon leakage by the influence of the contained light hydrocarbons has a leakage diffusion law that is different from single-component light hydrocarbon leakage. The multi-component light hydrocarbon leakage simulation conditions are set to be consistent with the conditions of the benchmark group, while simulating the same mass flow rate as the single-component light hydrocarbon leakage. The light hydrocarbon pipeline leakage diffusion time is set to 800 s, through the study of changes in the diffusion range of the various components of light hydrocarbons, to analyze the differences between multi-component and single-component light hydrocarbon leakage. In addition, the appropriate area of the diffusion map of C3 and C5 is set as shown in Figure 12.
As shown in the figure, under identical leakage conditions, the diffusion of C3 in the multi-component scenario is somewhat suppressed compared to single-component leakage, with both the horizontal diffusion radius and vertical diffusion height being smaller than in the single-component case. However, the concentration near the orifice is higher in the multi-component case. In contrast, the diffusion range of C5 is enhanced in the multi-component scenario compared to the single-component case. Both the horizontal and vertical diffusion extents are greater under multi-component conditions. Figure 13 presents the comparative statistics for horizontal and vertical diffusion ranges.
Analyzing the above graph shows the following:
(1)
When the light hydrocarbon flow rate is controlled to be the same, the diffusion patterns of individual components differ between multi-component and single-component leakage, and the trends are not always consistent.
(2)
The diffusion range of C2–C4 is greater in the single-component case, and the difference between single- and multi-component scenarios is particularly notable for C3 and C4. Gaseous diffusion dominates after C2–C4 leakage. However, in the multi-component case, lighter components inhibit the gasification of heavier ones, making the difference in diffusion range more pronounced.
(3)
For C5–C8, the diffusion range is greater under multi-component conditions. These components mainly spread as liquid hydrocarbons after leakage, and the presence of gaseous components carries them further, resulting in a slightly larger diffusion range.
(4)
Although the diffusion range of C2–C4 is larger in the single-component case, the presence of other components in multi-component leakage can inhibit their gasification, leading to higher concentrations near the leakage orifice. This increases the risk of poisoning and asphyxiation and may also elevate fire and explosion hazards.

4. Influence of Different Factors on the Dispersion Pattern of Light Hydrocarbon Leakage

The main factors influencing the diffusion of light hydrocarbon leakage include component ratio, transport pressure, leakage aperture, pipeline temperature, orifice direction, pipeline diameter, pipeline wall thickness, ambient wind speed, ambient temperature, ground slope, and soil properties. This study focuses on the diffusion range and diffusion rate to identify the leakage dispersion patterns and to provide a theoretical basis for predicting pipeline safety risks.
Table 5 presents the baseline values for these variables. Based on these key factors and the real-world operating and environmental conditions of the pipeline, representative parameter values are selected to analyze their effects on the leakage behavior of buried light hydrocarbon pipelines.

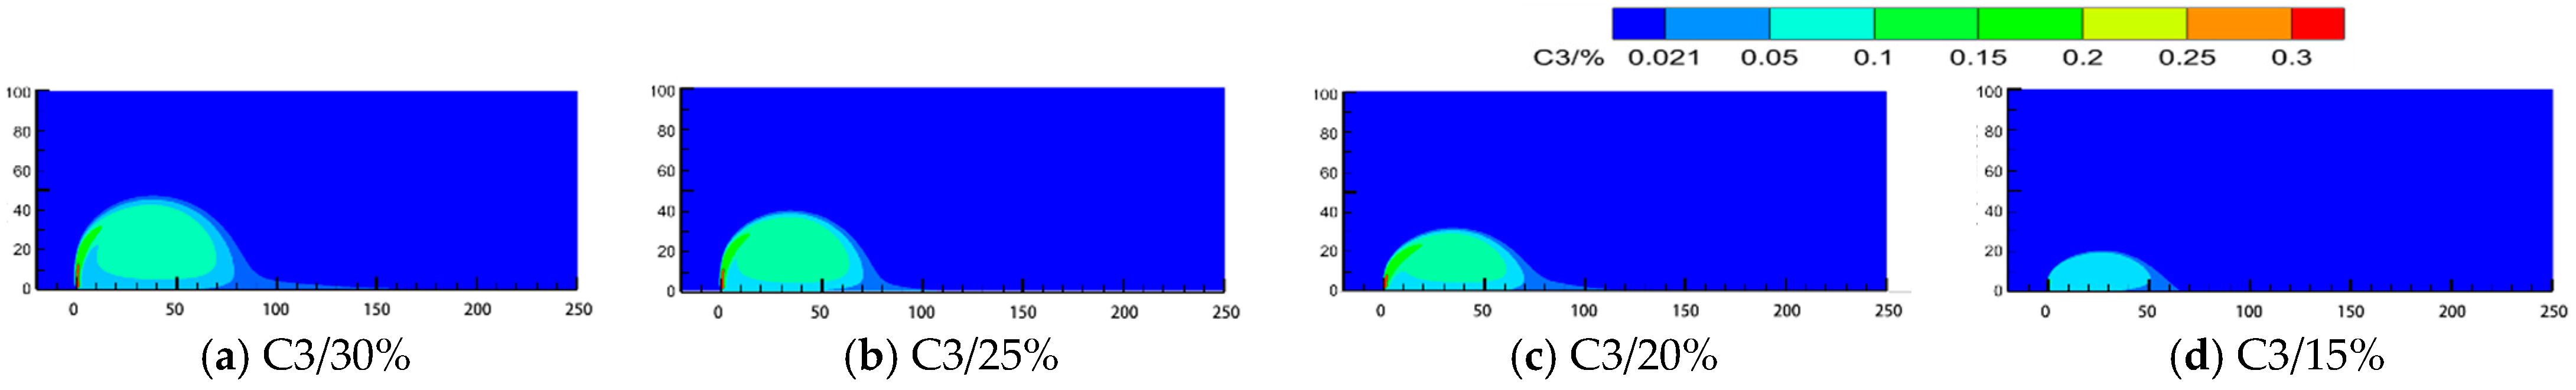
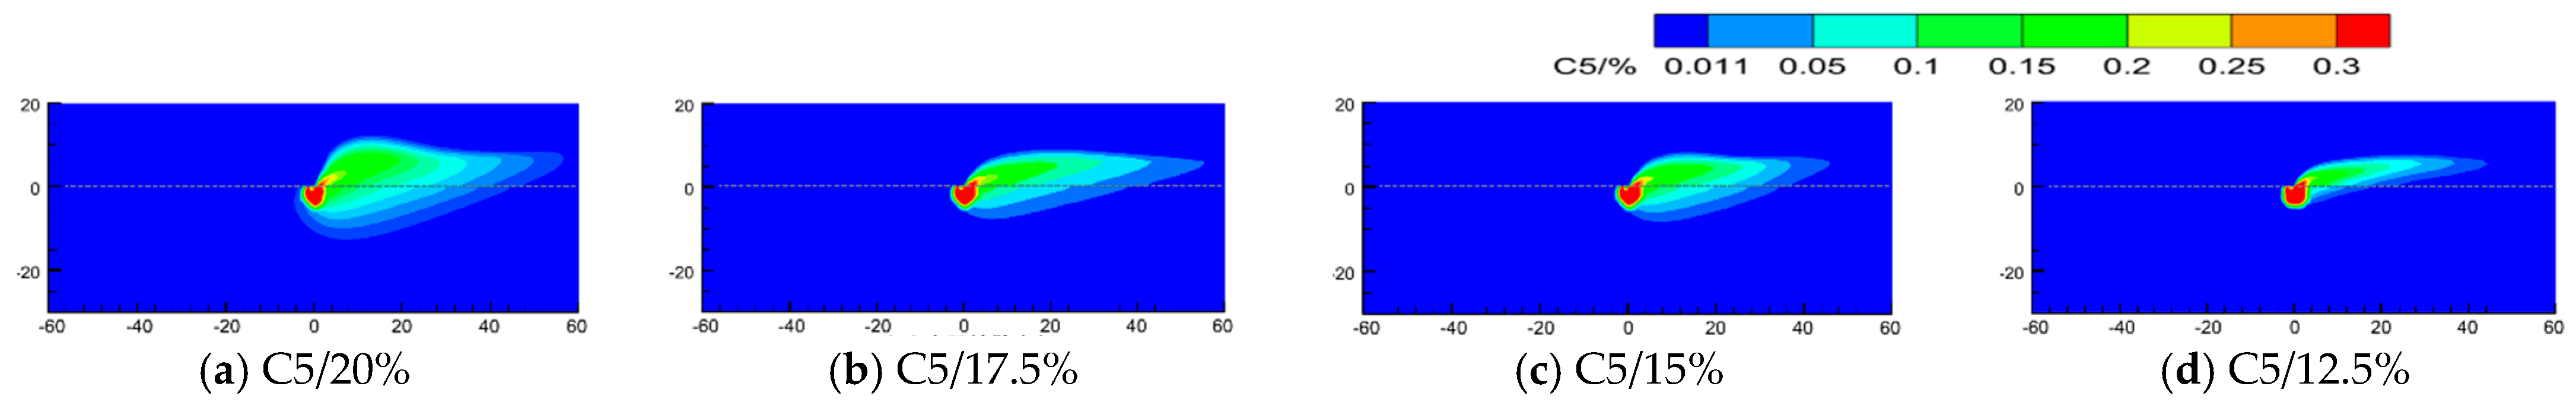
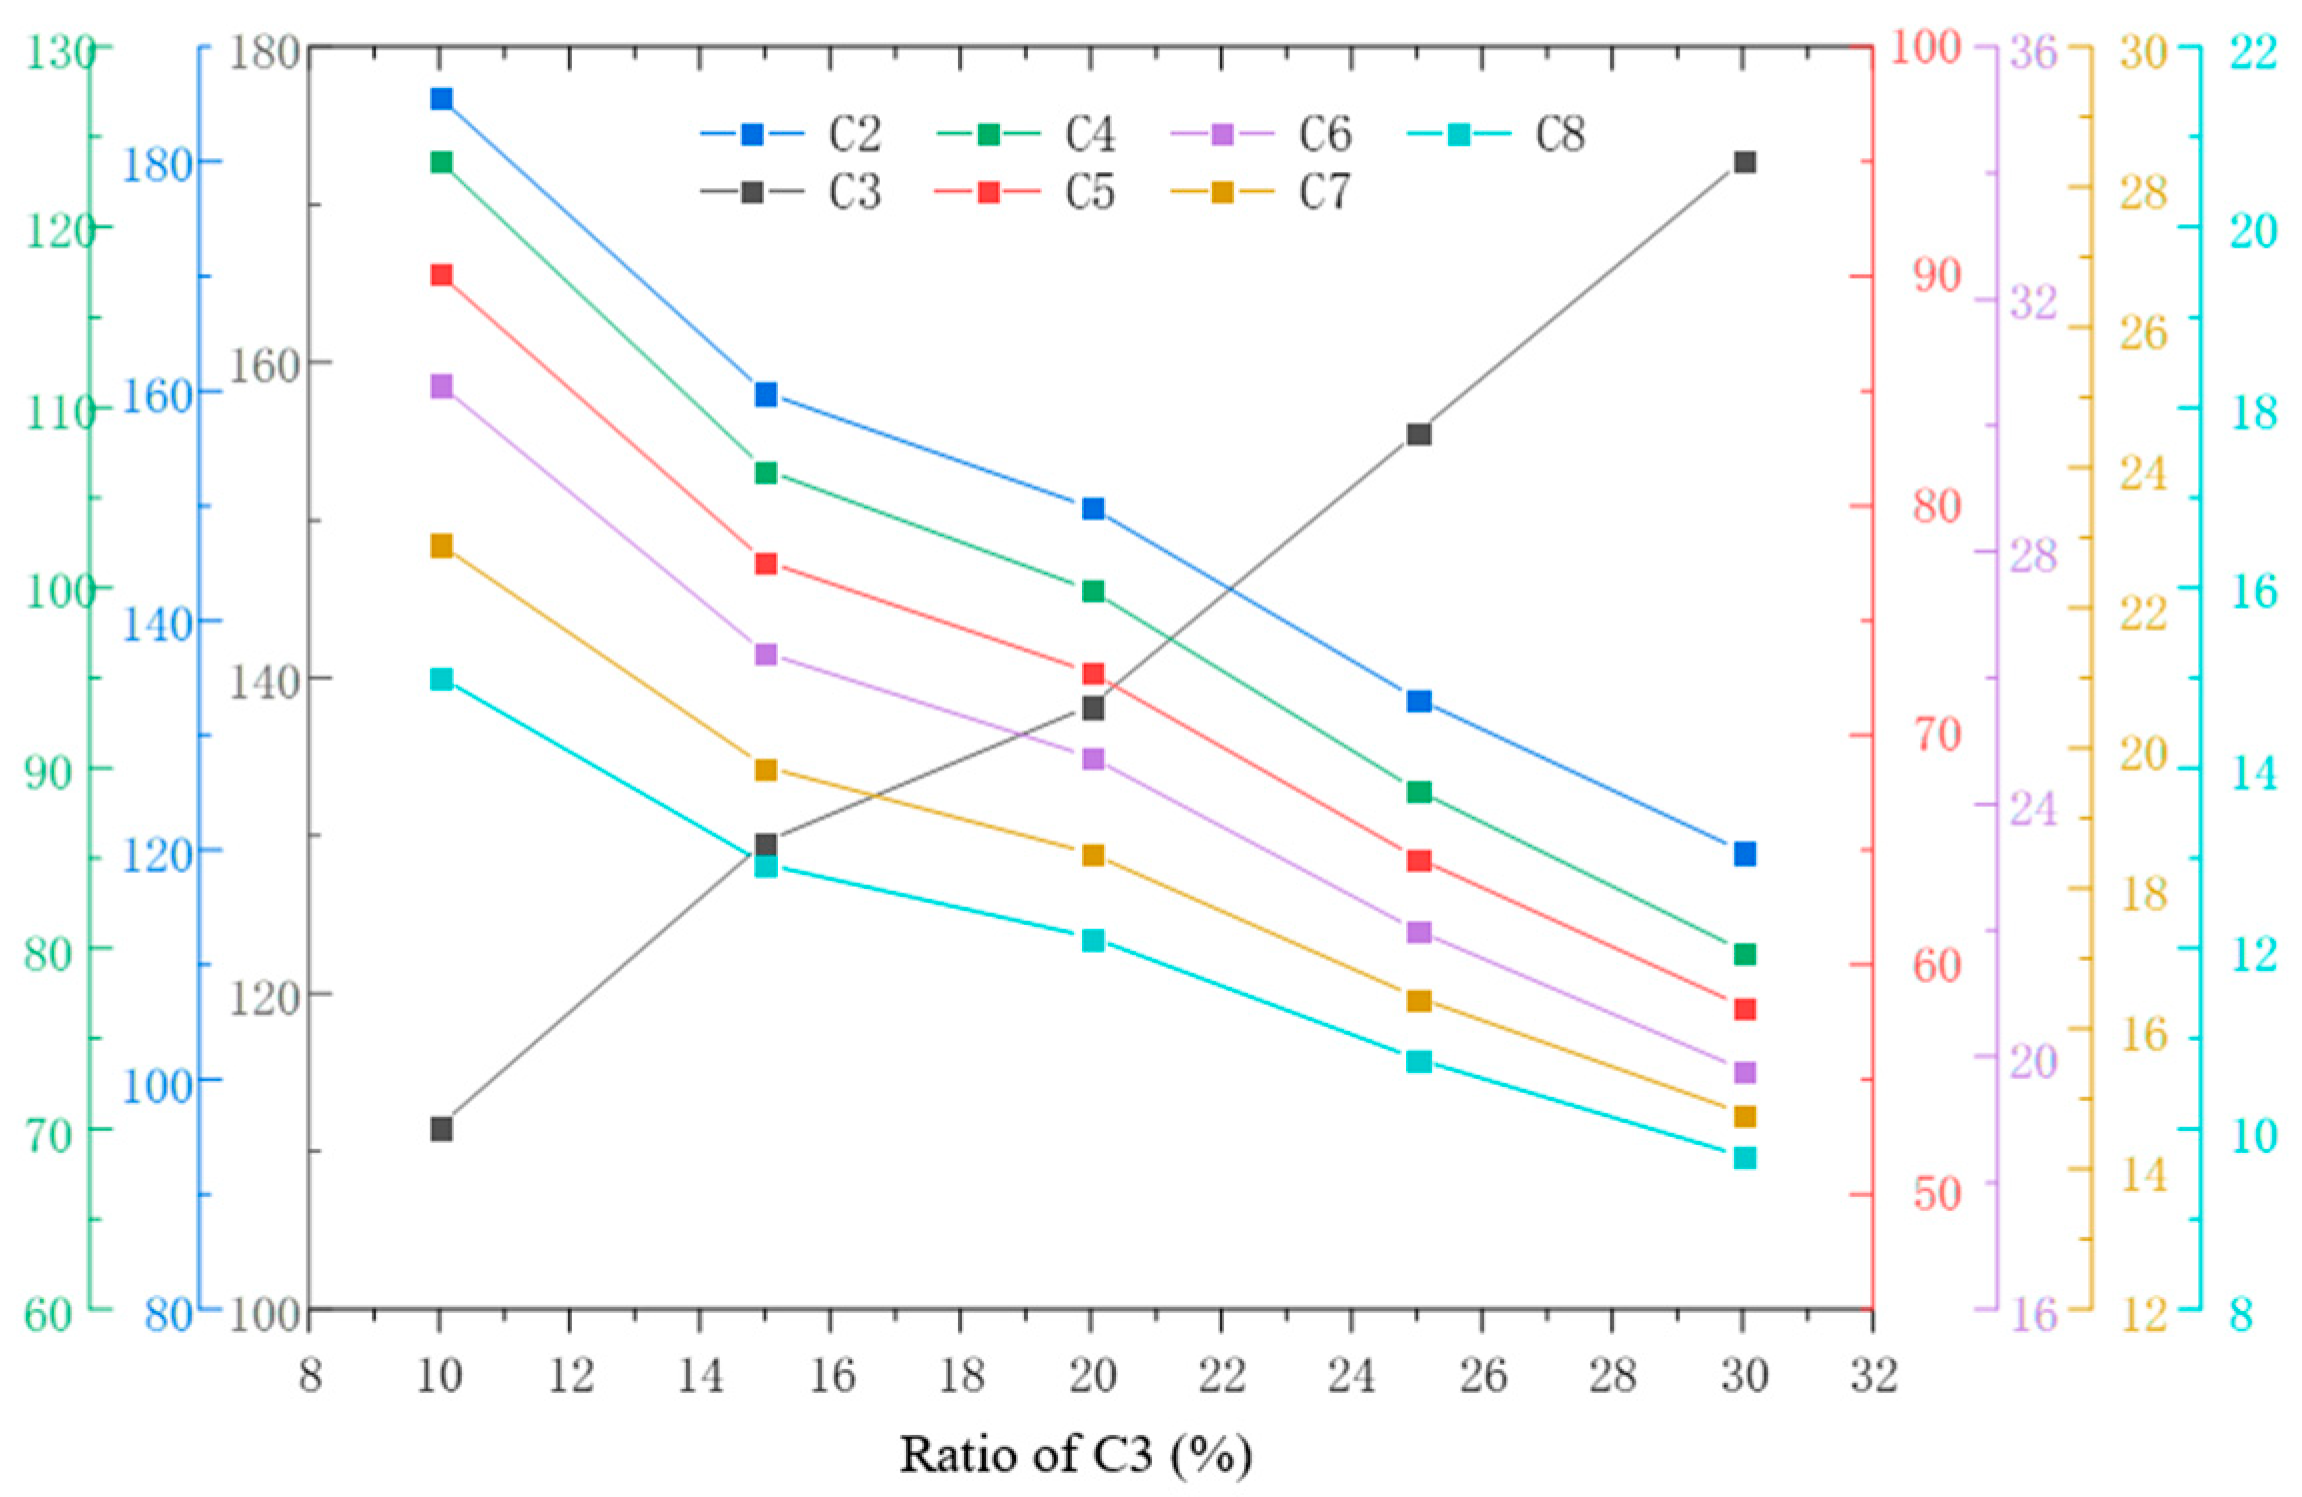
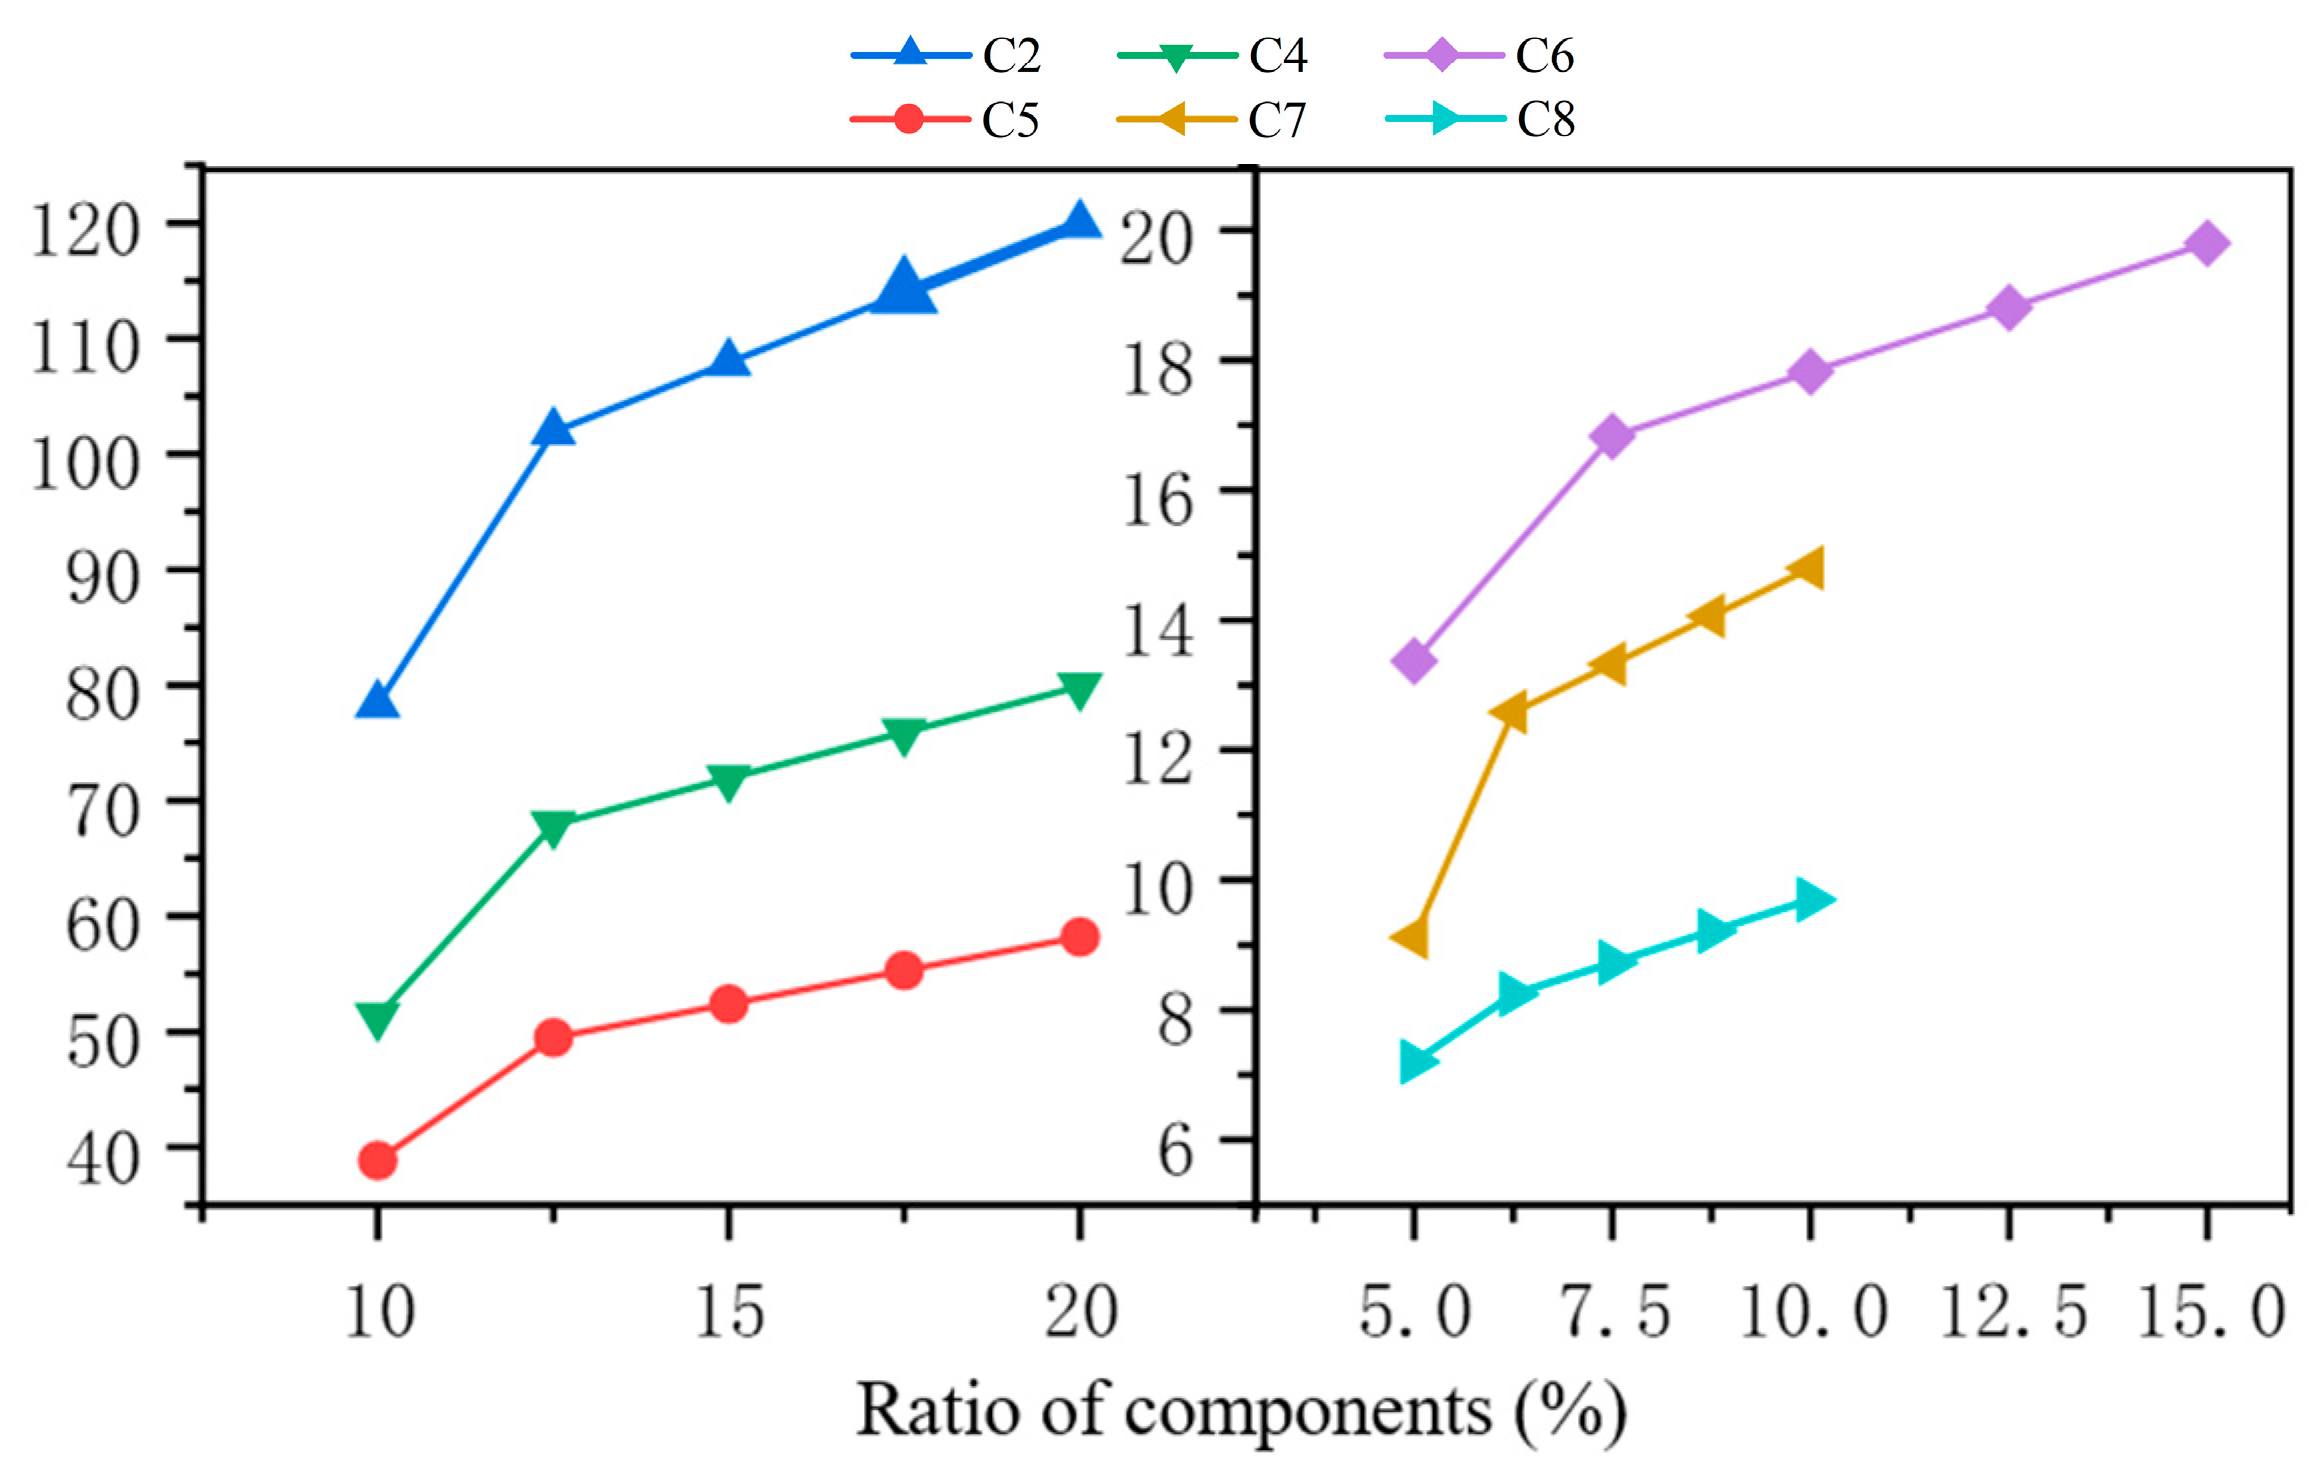
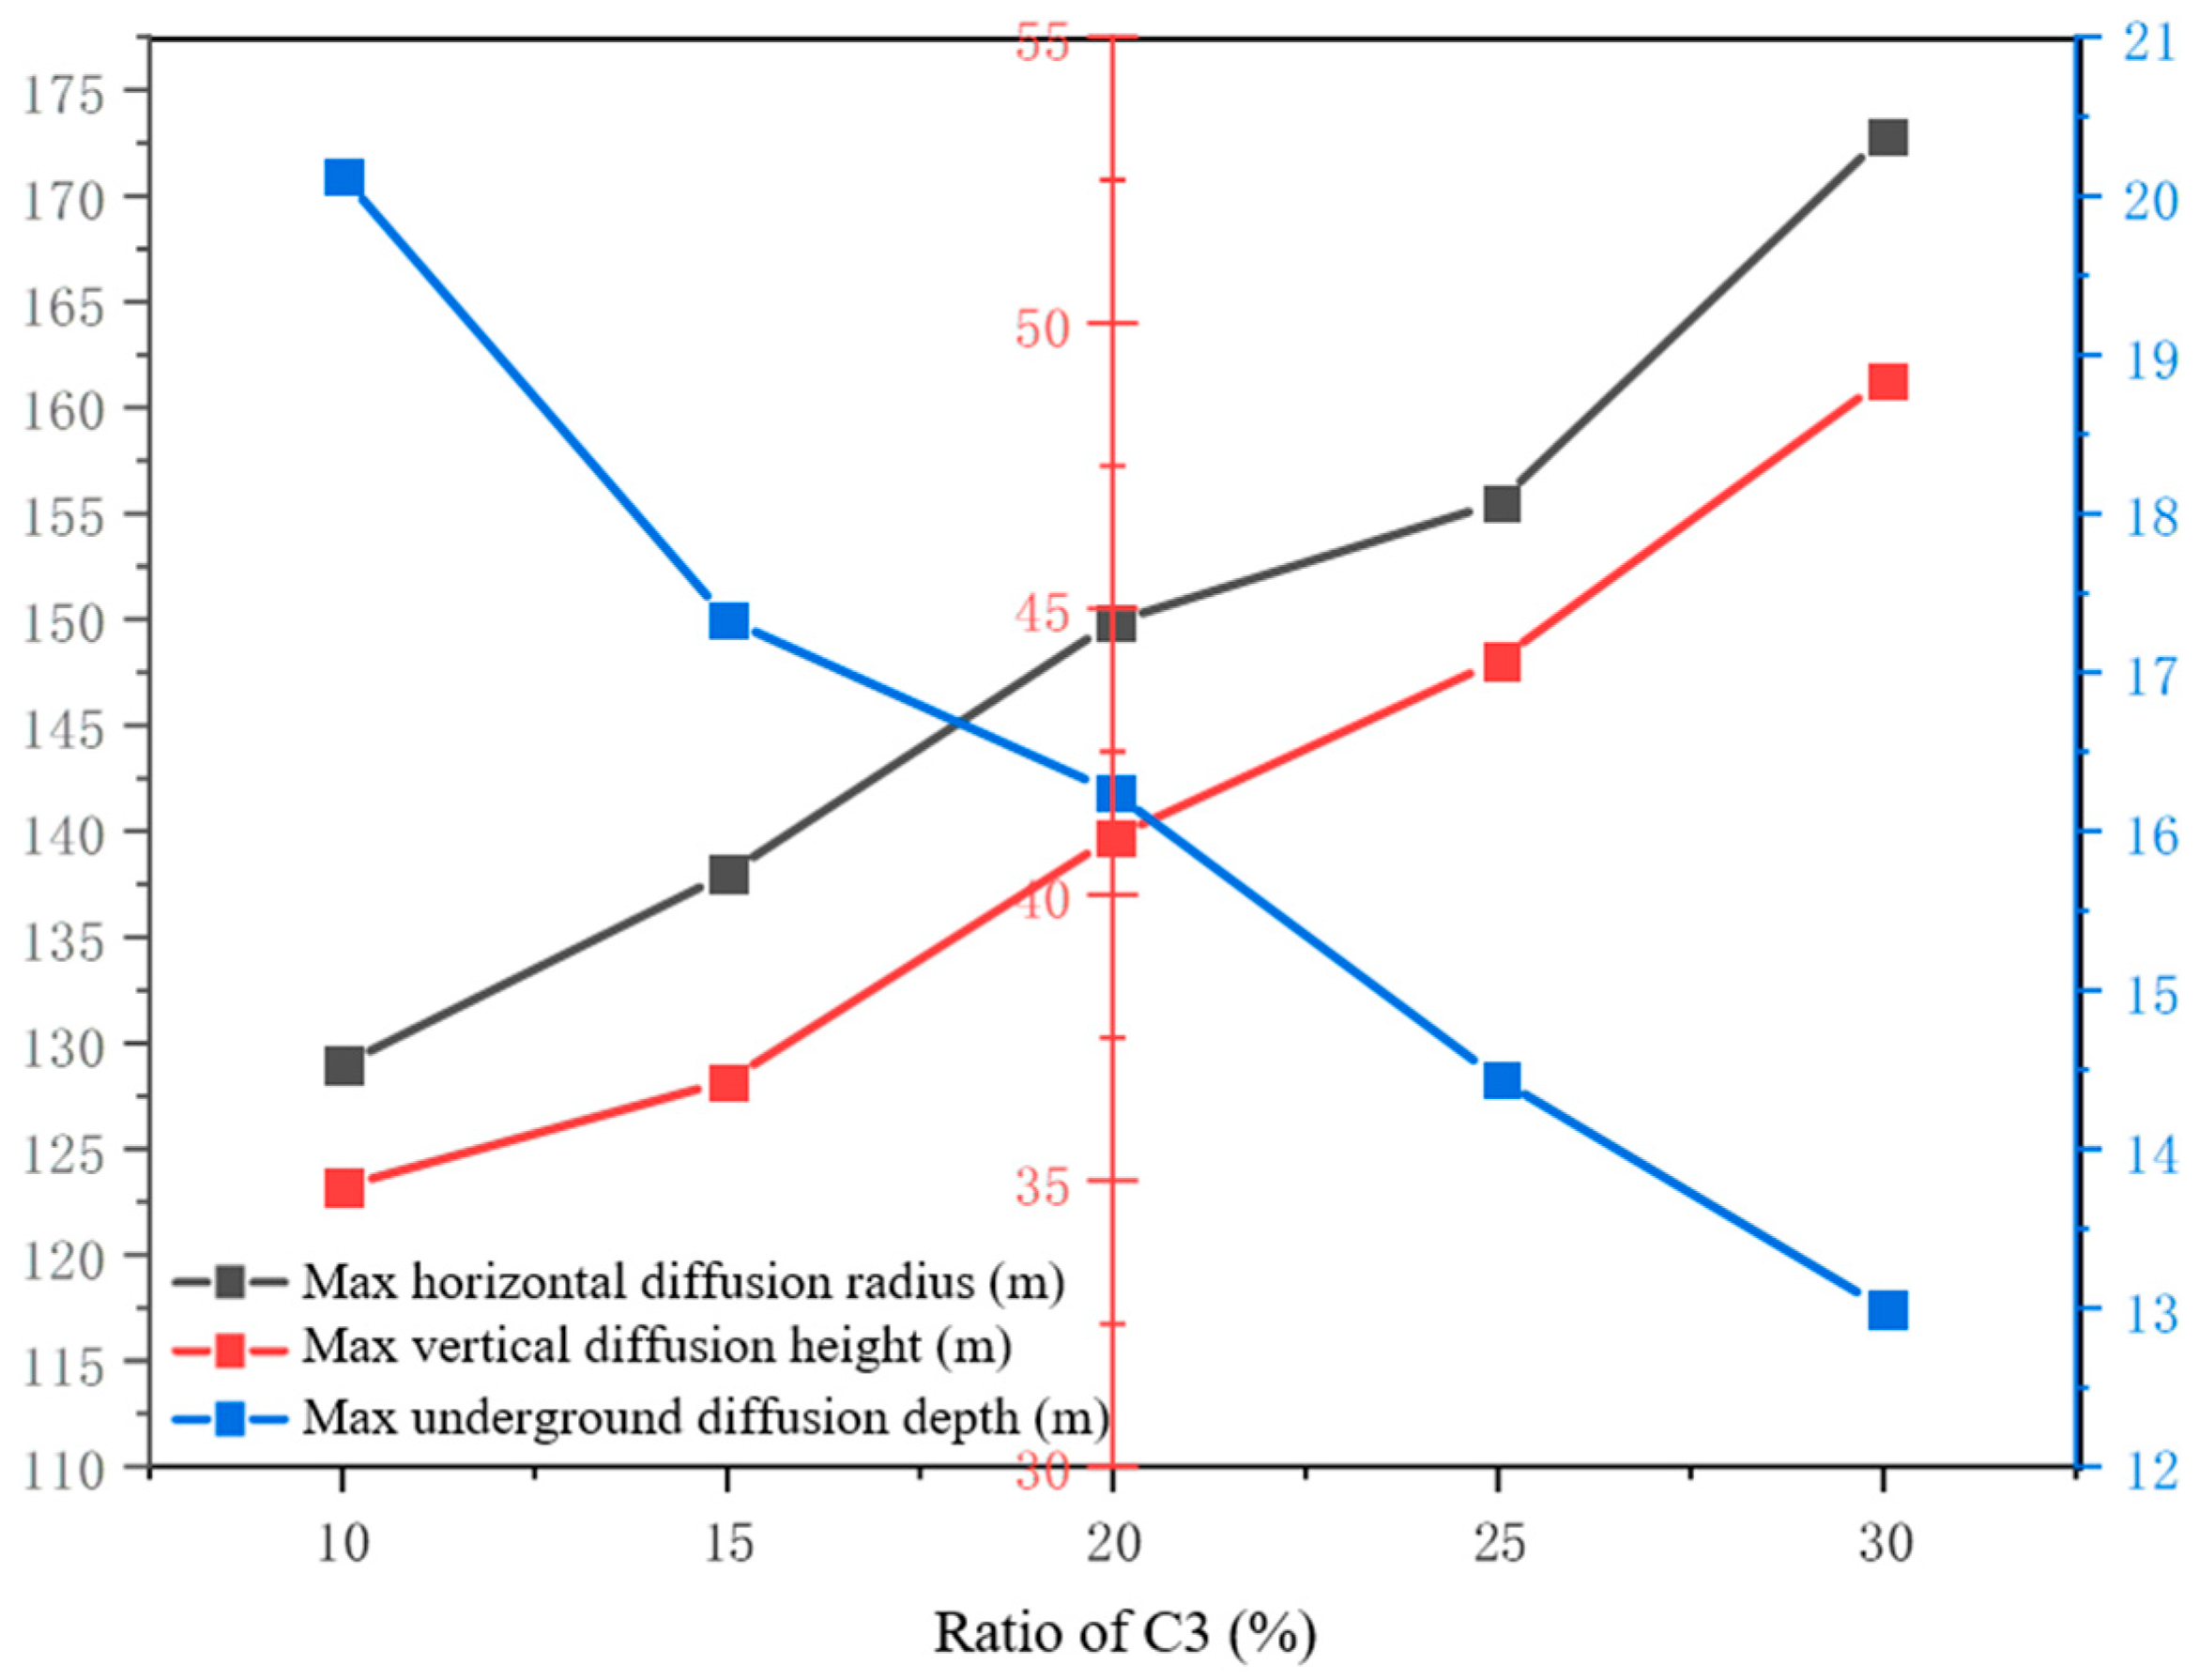
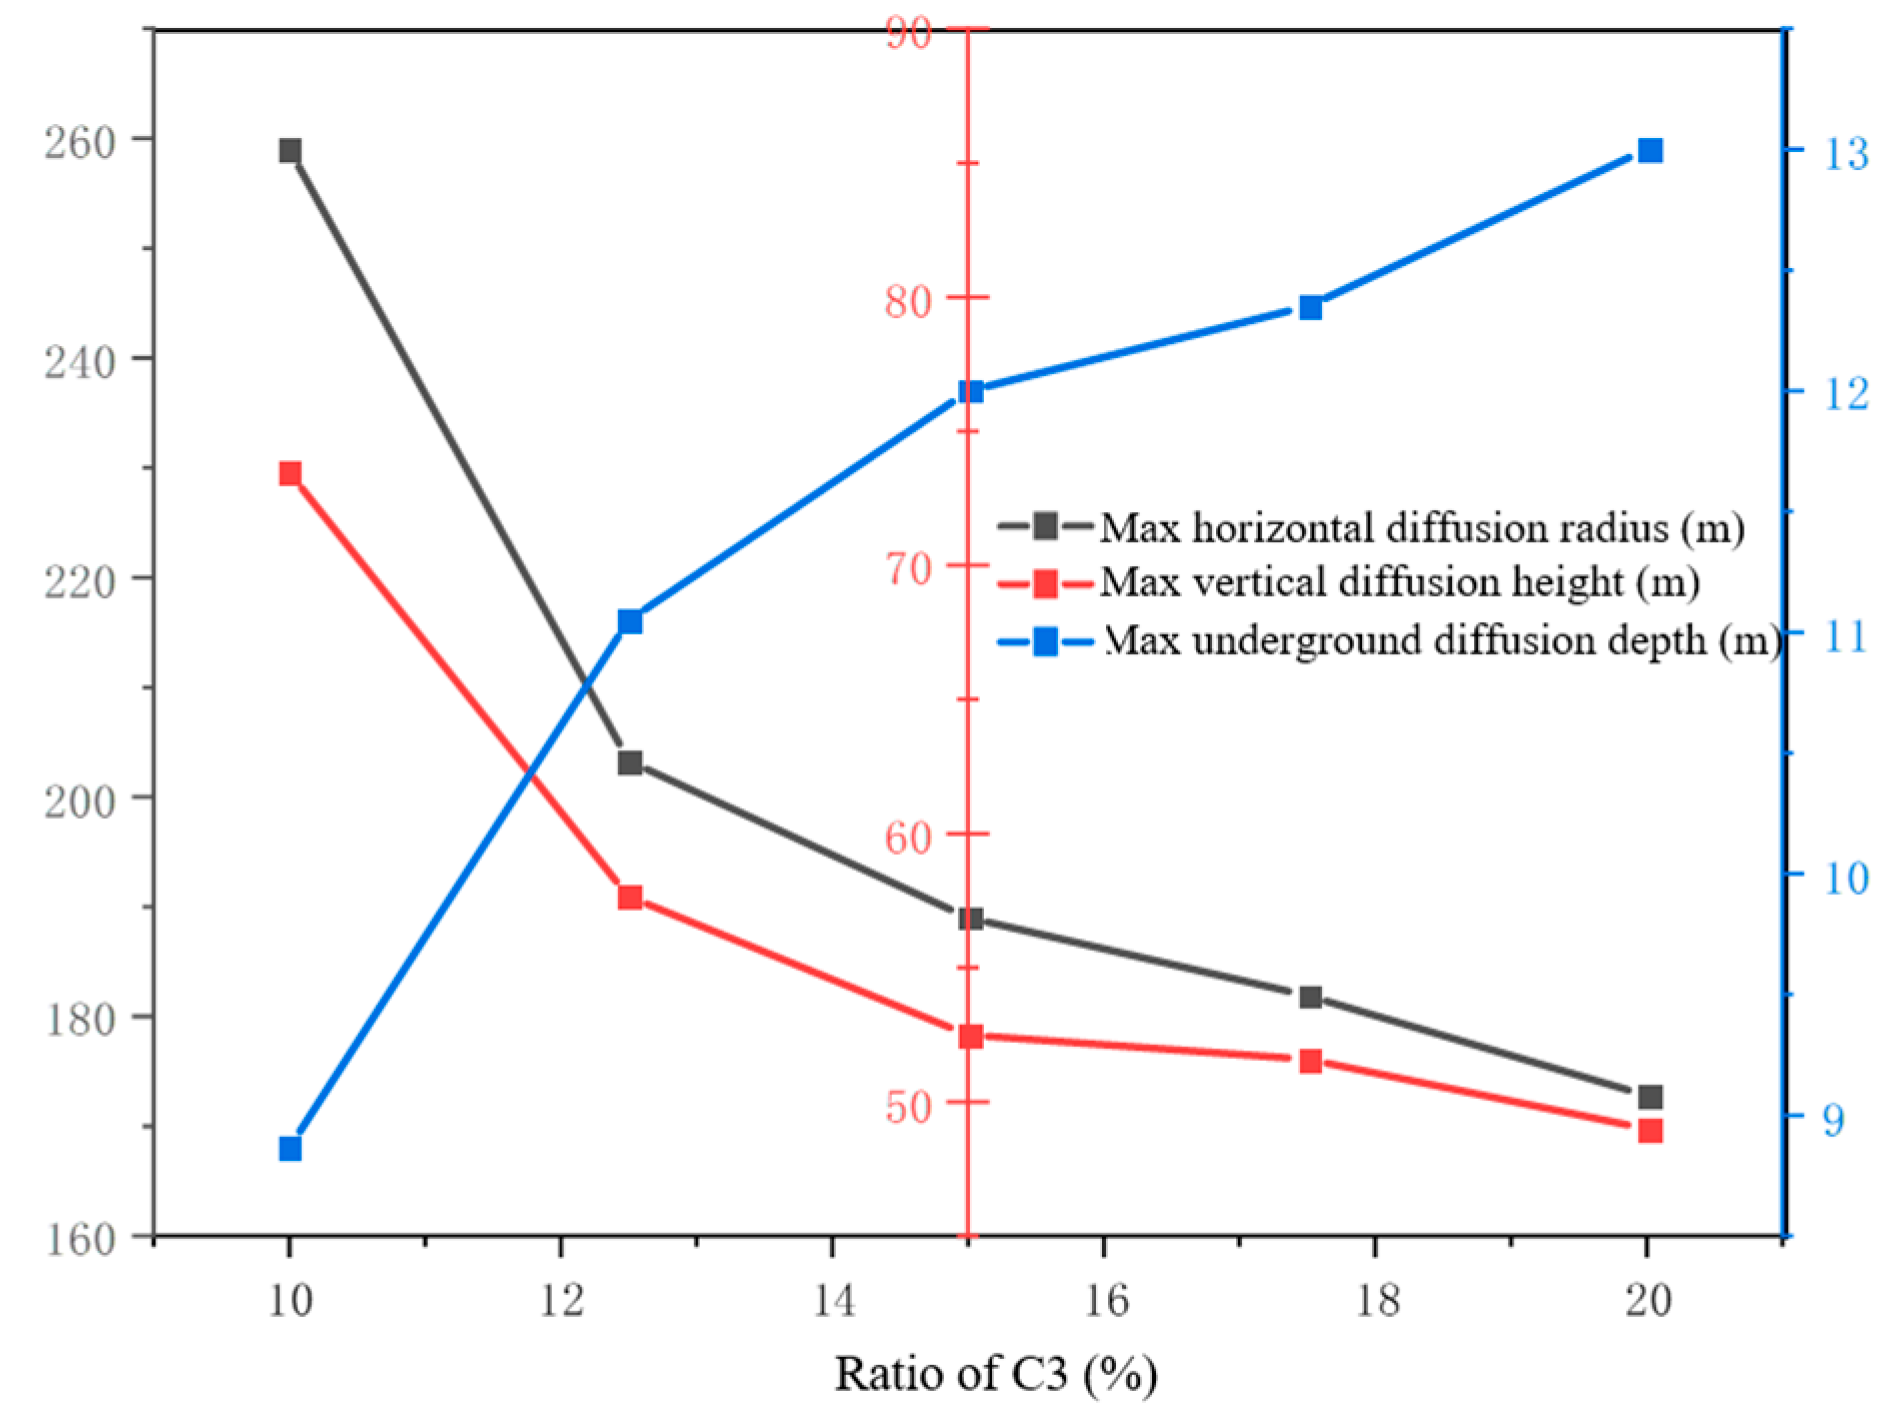
4.1. Component Ratios

Due to variations in production and processing, the composition of light hydrocarbon mixtures transported through pipelines is often inconsistent. To investigate how the component ratio affects the leakage diffusion of buried light hydrocarbon pipelines, five groups of simulation experiments were conducted, varying the proportion of individual components while keeping the others constant. Representative diffusion cloud maps of C3 and C5 were selected for visualization, as shown in Figure 14 and Figure 15.
As shown in the diffusion cloud diagrams, when the component proportion decreases, the diffusion range of gaseous hydrocarbon C3 also decreases significantly, with a notably large magnitude of change. The diffusion of C3 is more sensitive to changes in component ratio than that of liquid hydrocarbon C5.
A total of 35 simulation cases are summarized and illustrated in Figure 16, Figure 17, Figure 18 and Figure 19. Based on the trend curves and data, the following patterns are identified:
(1)
As the proportion of C3 increases, both the maximum horizontal diffusion radius of C3 and the overall diffusion range increase. Meanwhile, the horizontal diffusion ranges of the other components decrease, indicating that C3 content has a strong influence on the overall diffusion behavior.
(2)
The horizontal diffusion range of each component increases as its proportion increases, but the increase is more pronounced for gaseous hydrocarbons (C2–C4) than for liquid ones (C5–C8).
(3)
With increasing C3 content, the horizontal diffusion radius and vertical diffusion height increase, while underground diffusion depth decreases. In contrast, increasing the proportion of C5 yields the opposite trend. A higher proportion of light components leads to more intense aboveground diffusion, whereas a higher proportion of heavy components promotes deeper subsurface migration.

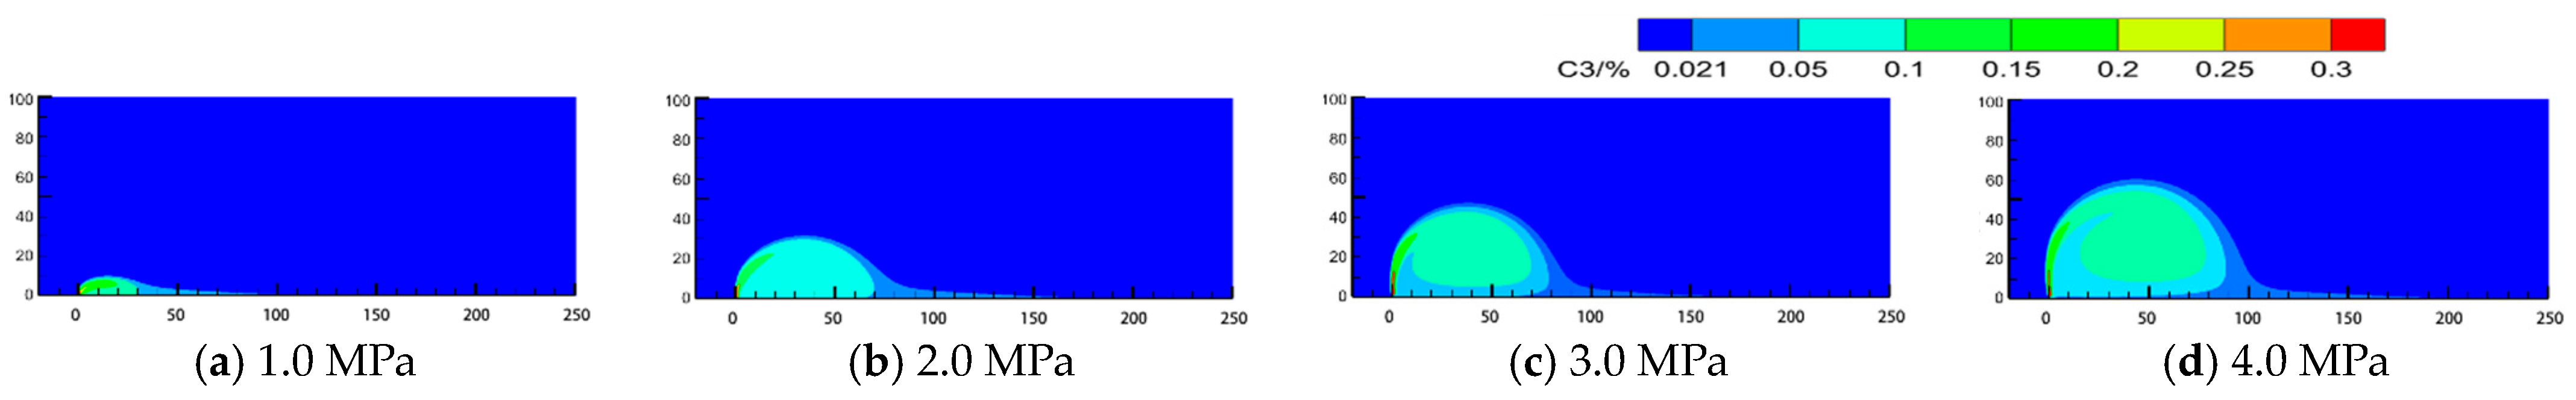
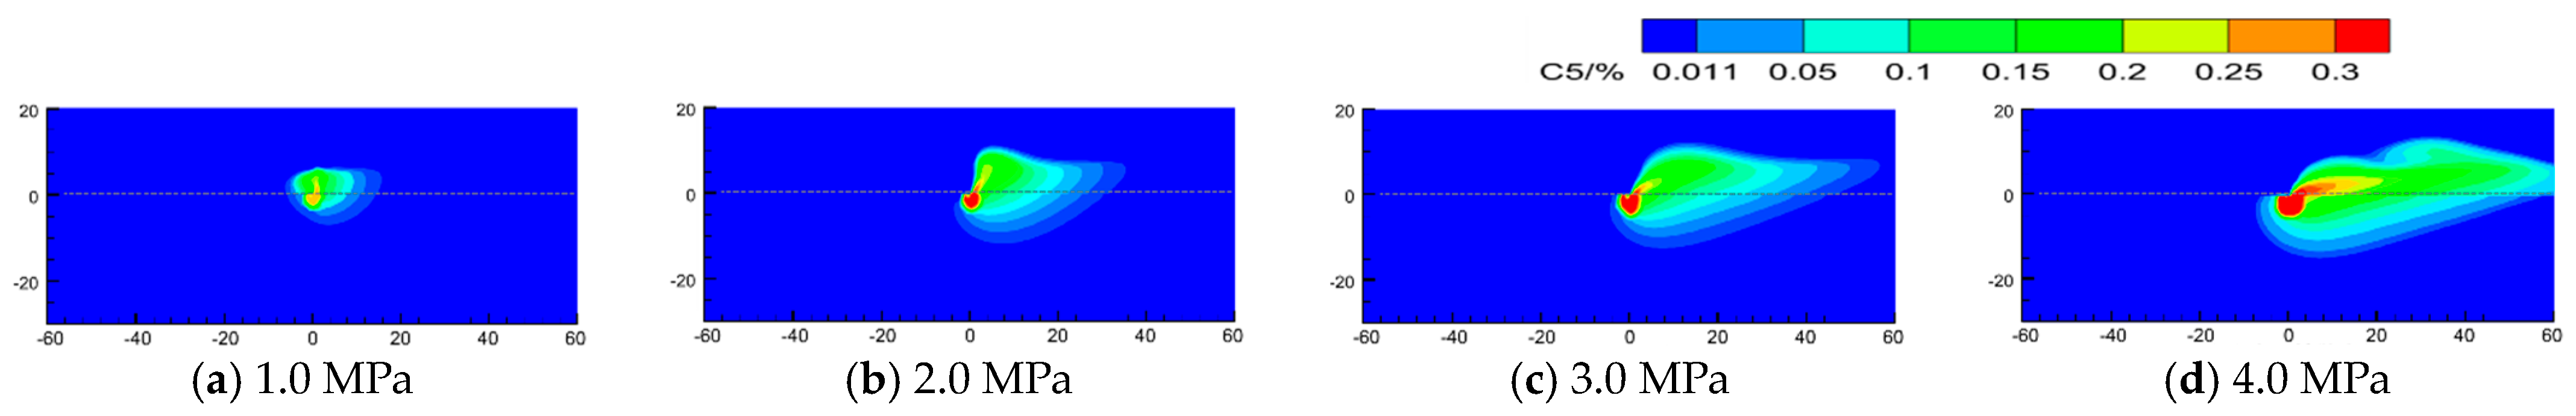
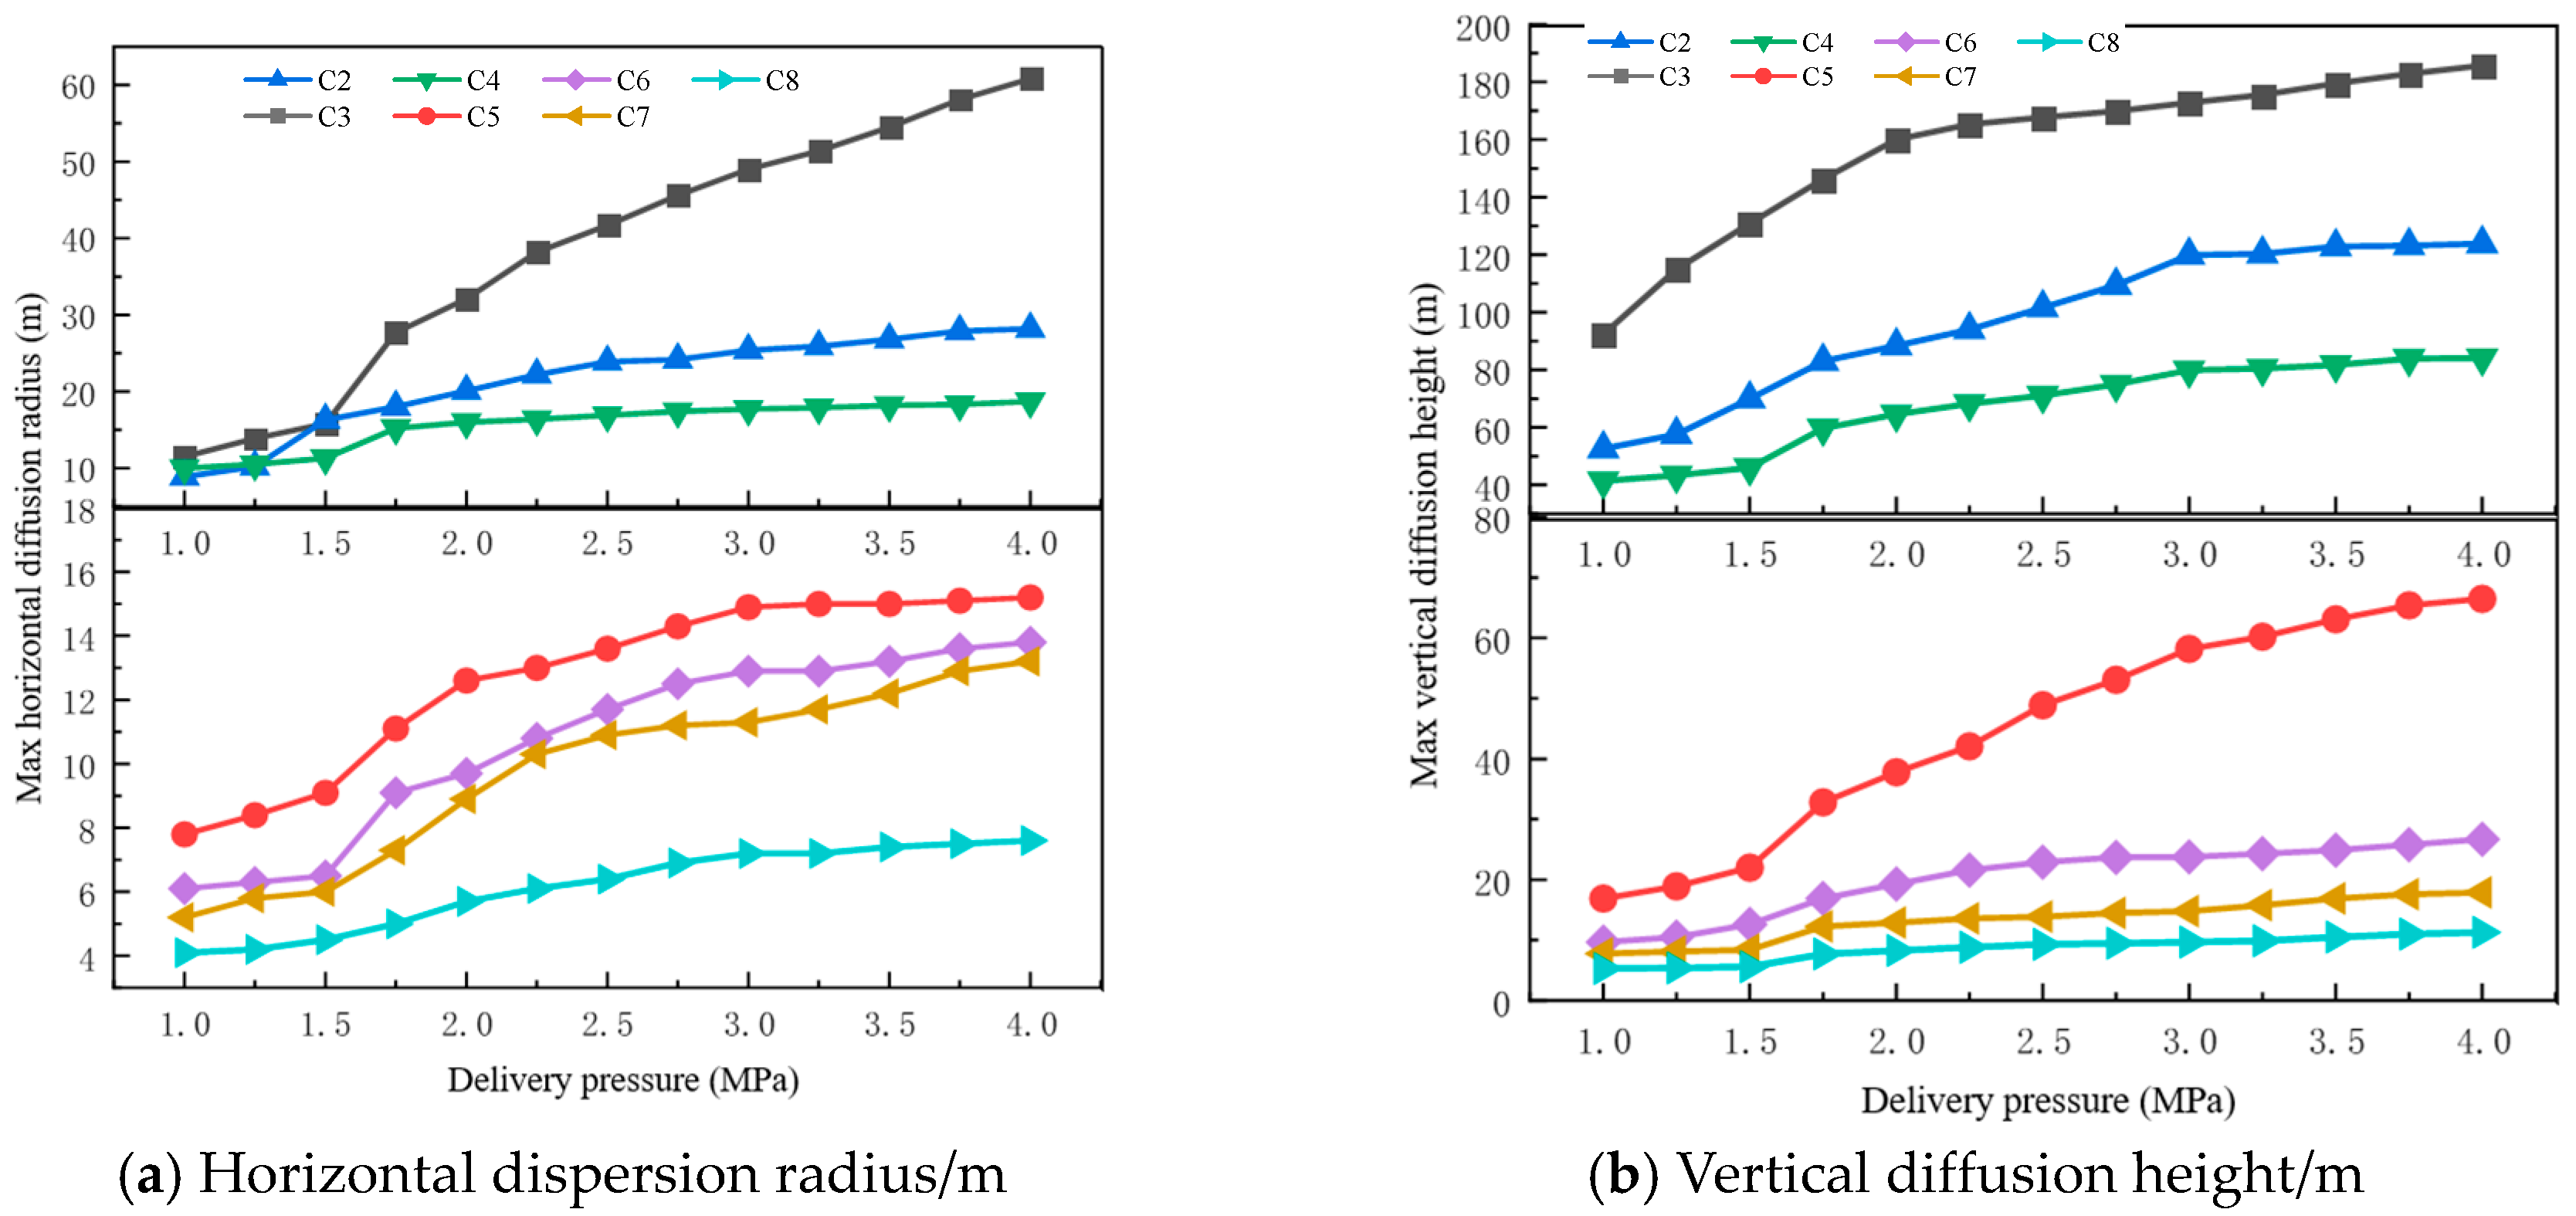
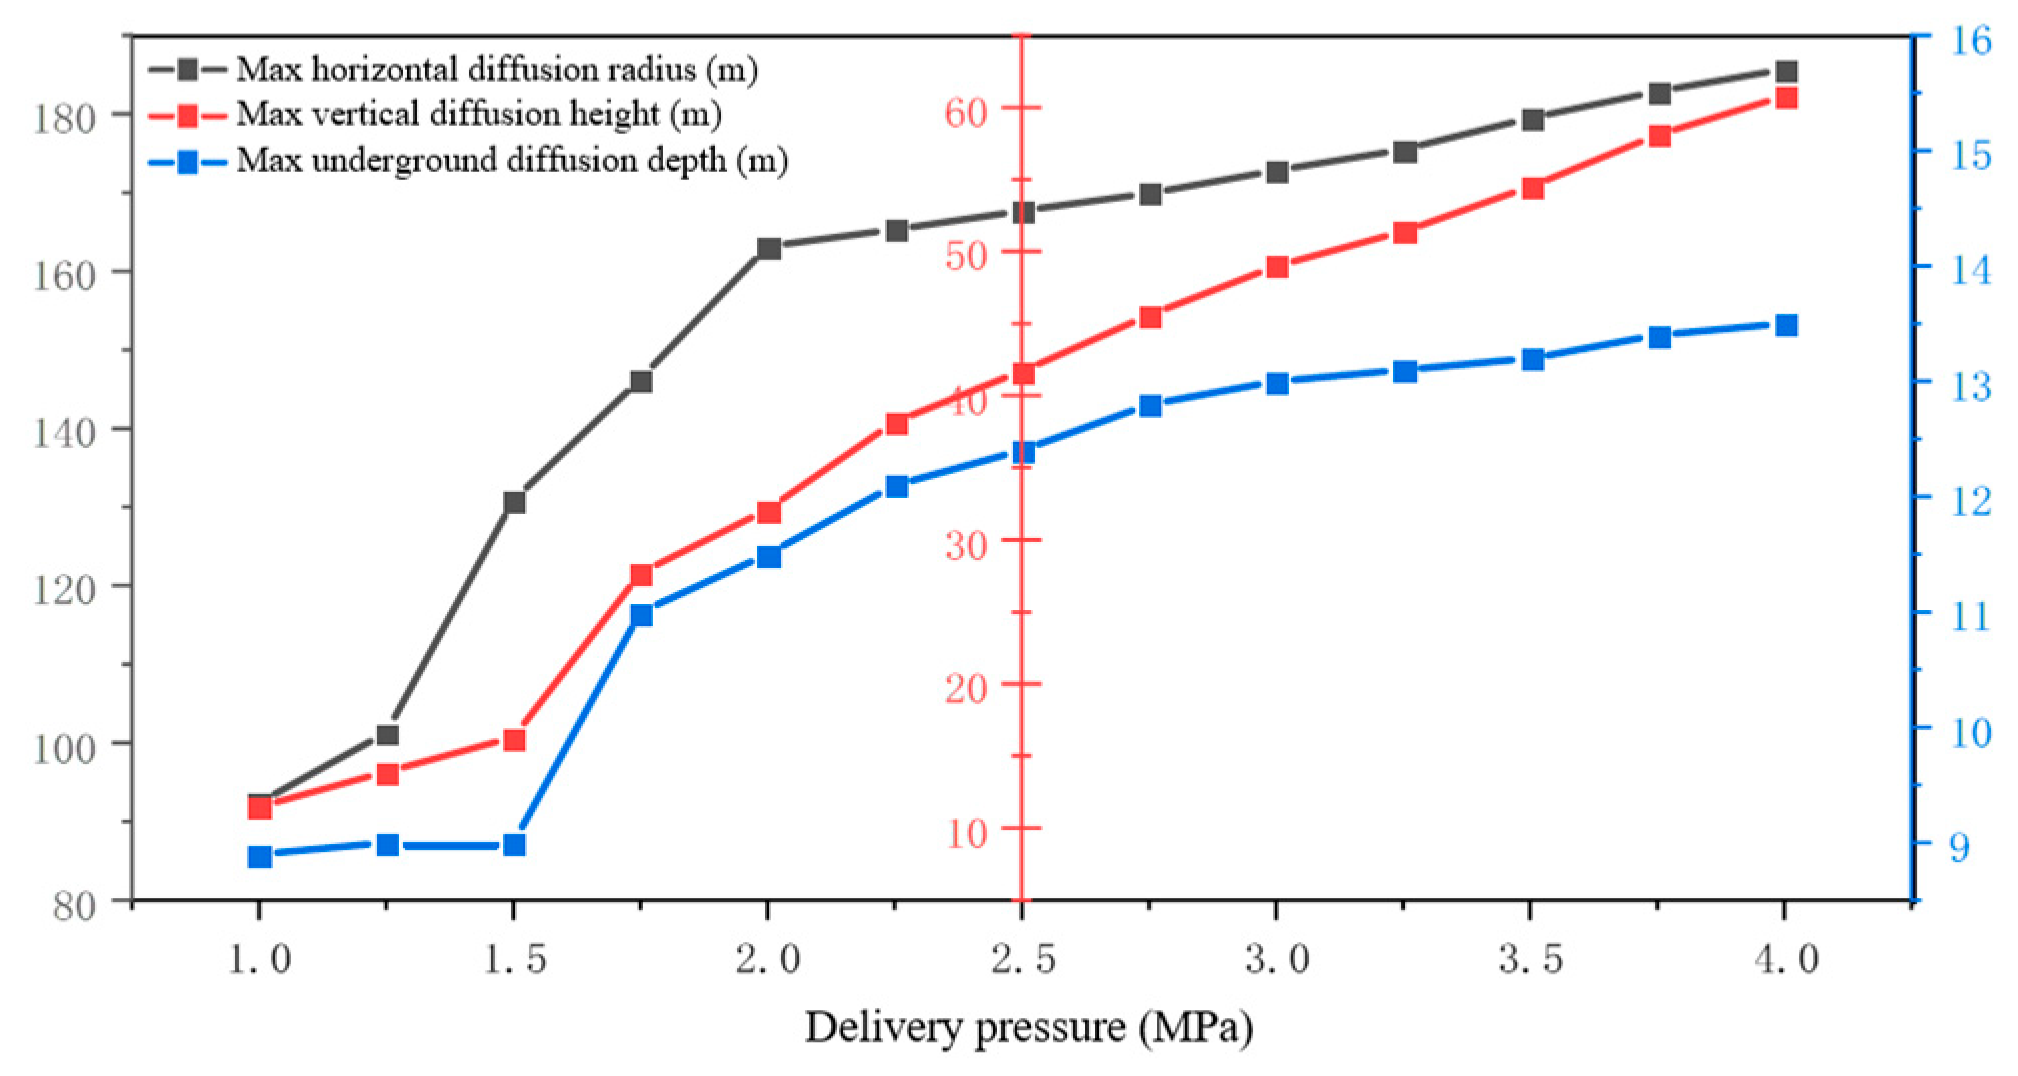
4.2. Operating Pressure

The operating pressure of light hydrocarbon pipelines varies along their length due to transportation dynamics and fluctuating operational demands. Based on actual operating conditions, the pipeline pressure was varied from 1.0 to 4.0 MPa in increments of 0.25 MPa, resulting in 13 simulation scenarios under different pressure settings. Representative diffusion cloud maps for C3 and C5 under selected pressure conditions are shown in Figure 20 and Figure 21.
As shown in the diffusion cloud diagrams, the diffusion range of light hydrocarbon leakage increases significantly with rising transportation pressure. The horizontal spread of gaseous hydrocarbons at a given height expands noticeably in high-concentration zones, and the aggregation of gaseous hydrocarbons becomes more pronounced. The diffusion of liquid hydrocarbons also increases, though to a lesser extent. Higher pipeline pressure results in faster leakage rates, leading to greater leakage volumes and enhanced accumulation near the leakage point. Given the high proportion of gaseous components in the mixture, hydrocarbon aggregation is especially prominent.
The 13 simulated operating conditions are summarized in Figure 22 and Figure 23, with additional insights from Figure 24. The following patterns are observed:
(1)
As pipeline pressure increases, the maximum diffusion range of light hydrocarbons—as well as the horizontal diffusion radius, vertical diffusion height, and underground penetration depth of each component—expands significantly. Consequently, the overall hazardous area increases.
(2)
For C3, both the horizontal diffusion radius and vertical diffusion height increase with pressure. However, the marginal effect of increasing pressure gradually diminishes at higher levels.
(3)
Pipeline pressure has a greater impact on gaseous hydrocarbons than on liquid ones. Among liquid hydrocarbons, C5 exhibits the most notable increase in diffusion range under higher pressure.
(4)
Higher pipeline pressure leads to increased leakage volume, which elevates local concentrations of light hydrocarbons. Given that the diffusion area of interest is defined by the lower explosive limit, greater concentrations result in a broader hazardous zone and more pronounced hydrocarbon aggregation.
Therefore, in the operation and management of light hydrocarbon pipelines, high-pressure segments require special attention. Once a leak occurs, the diffusion range and risk area increase significantly compared to low-pressure segments. Pipeline operators should align pressure management strategies with delivery schedules and real-time operational conditions to mitigate the associated risks.

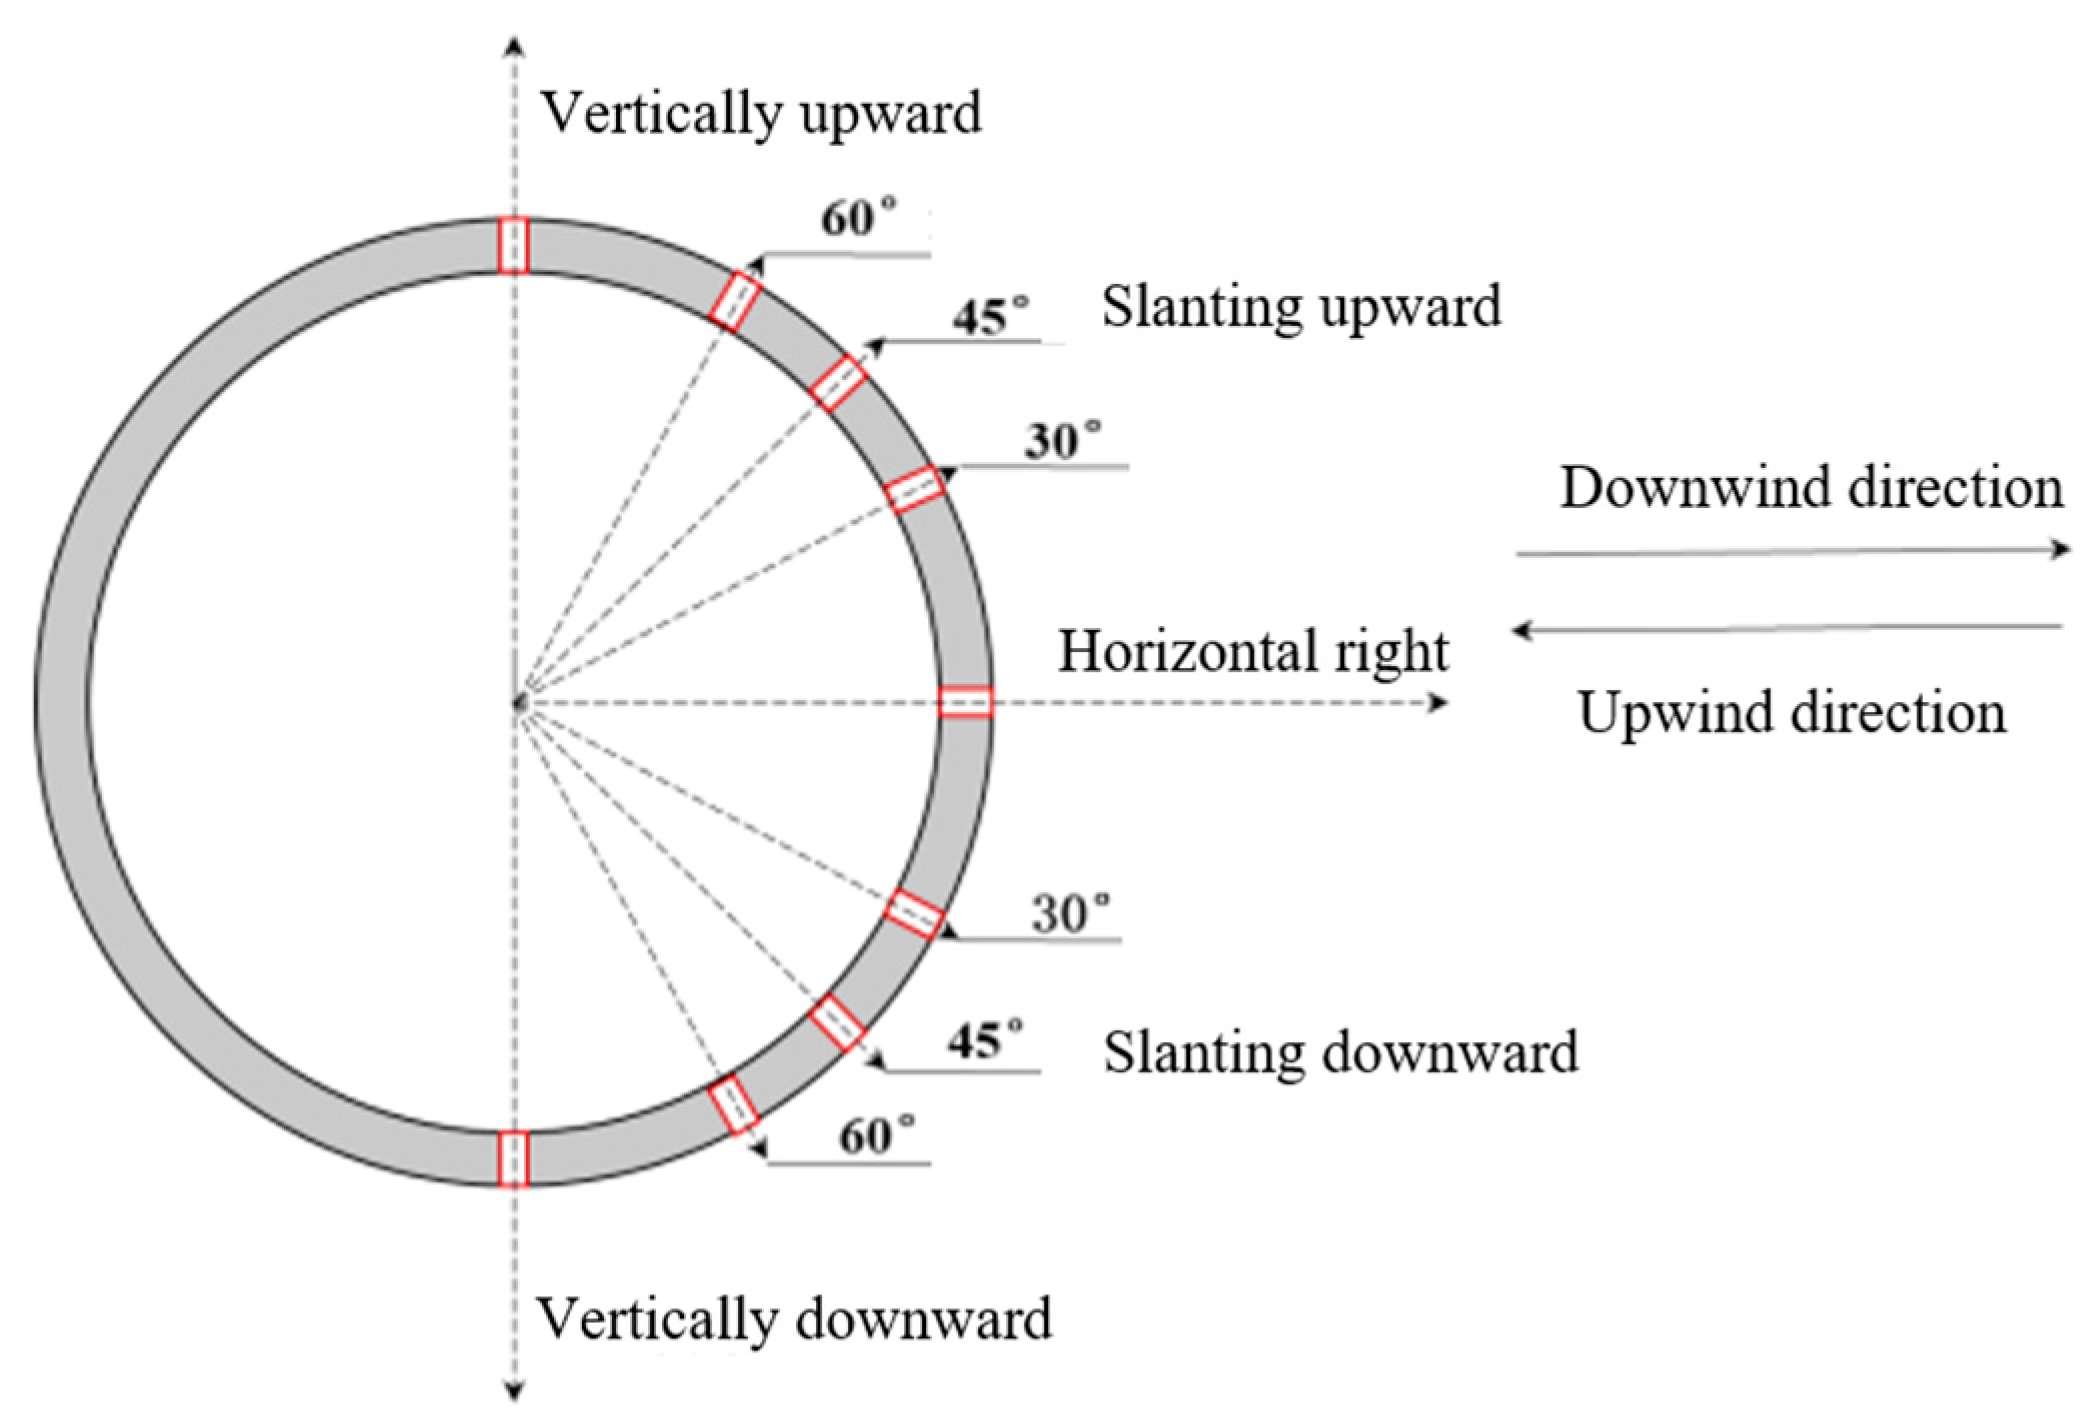
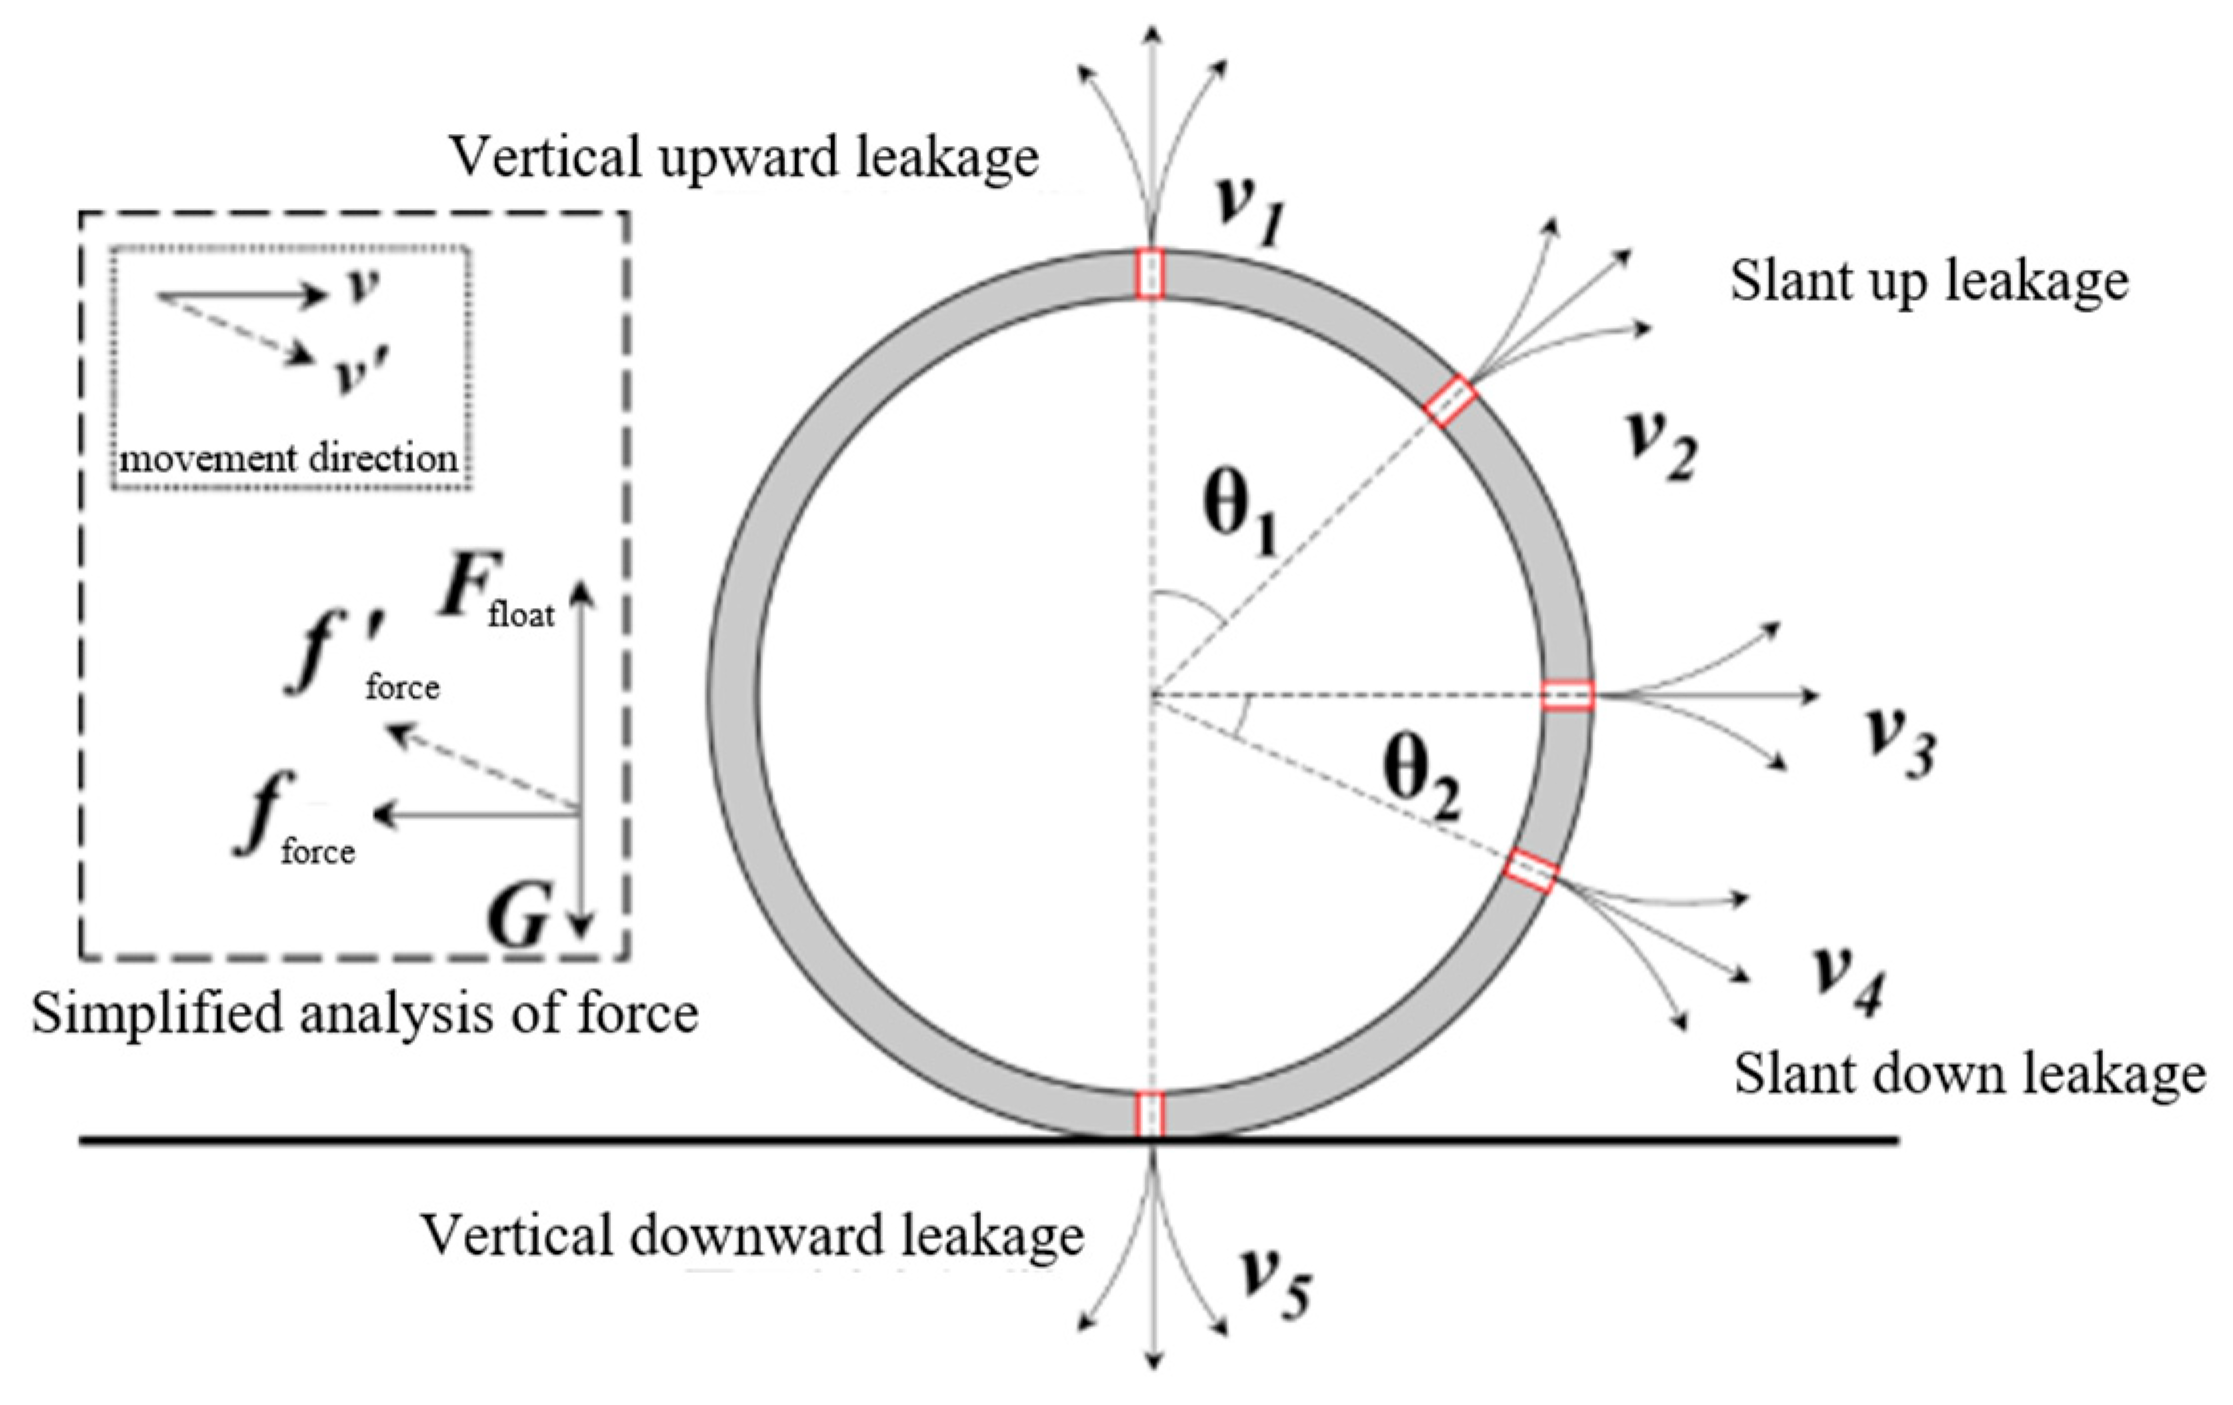
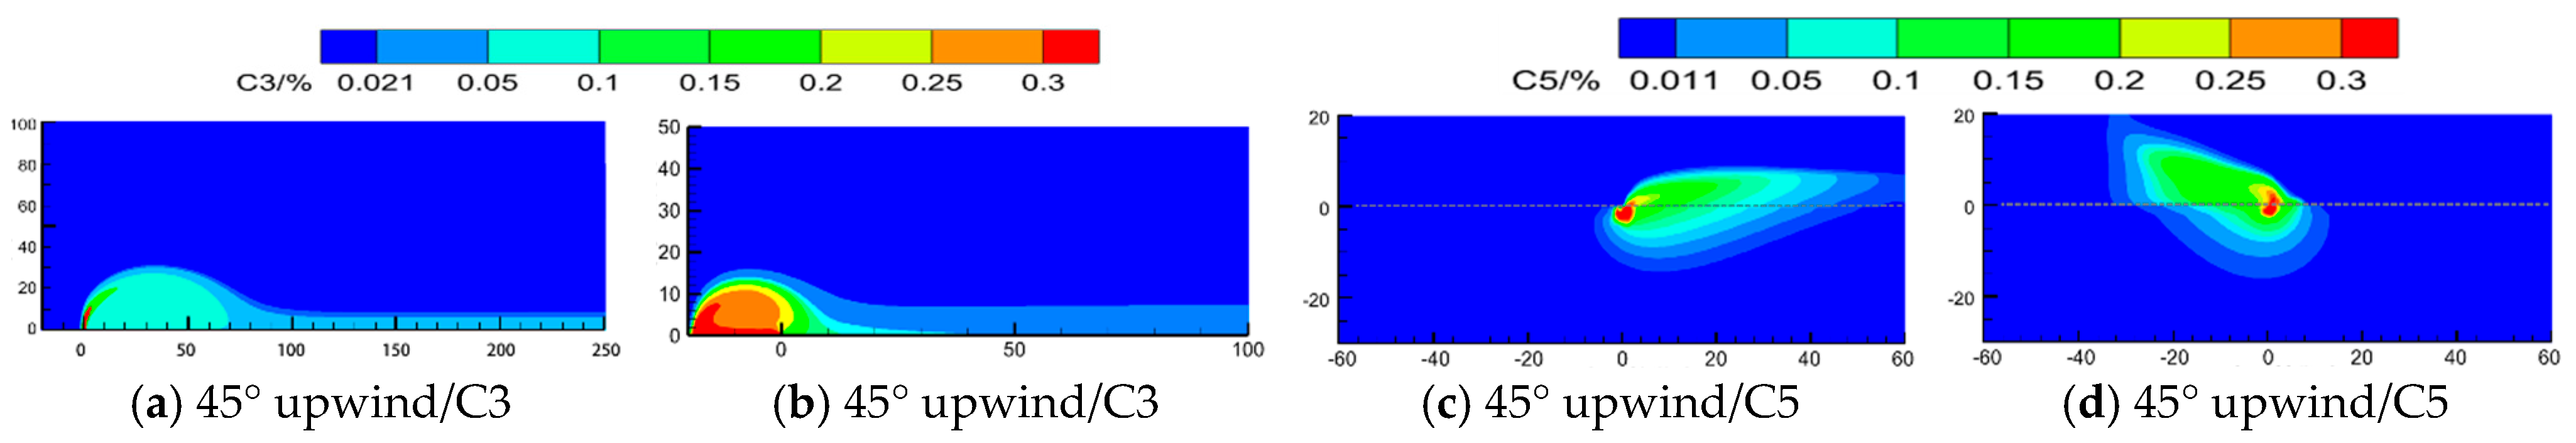
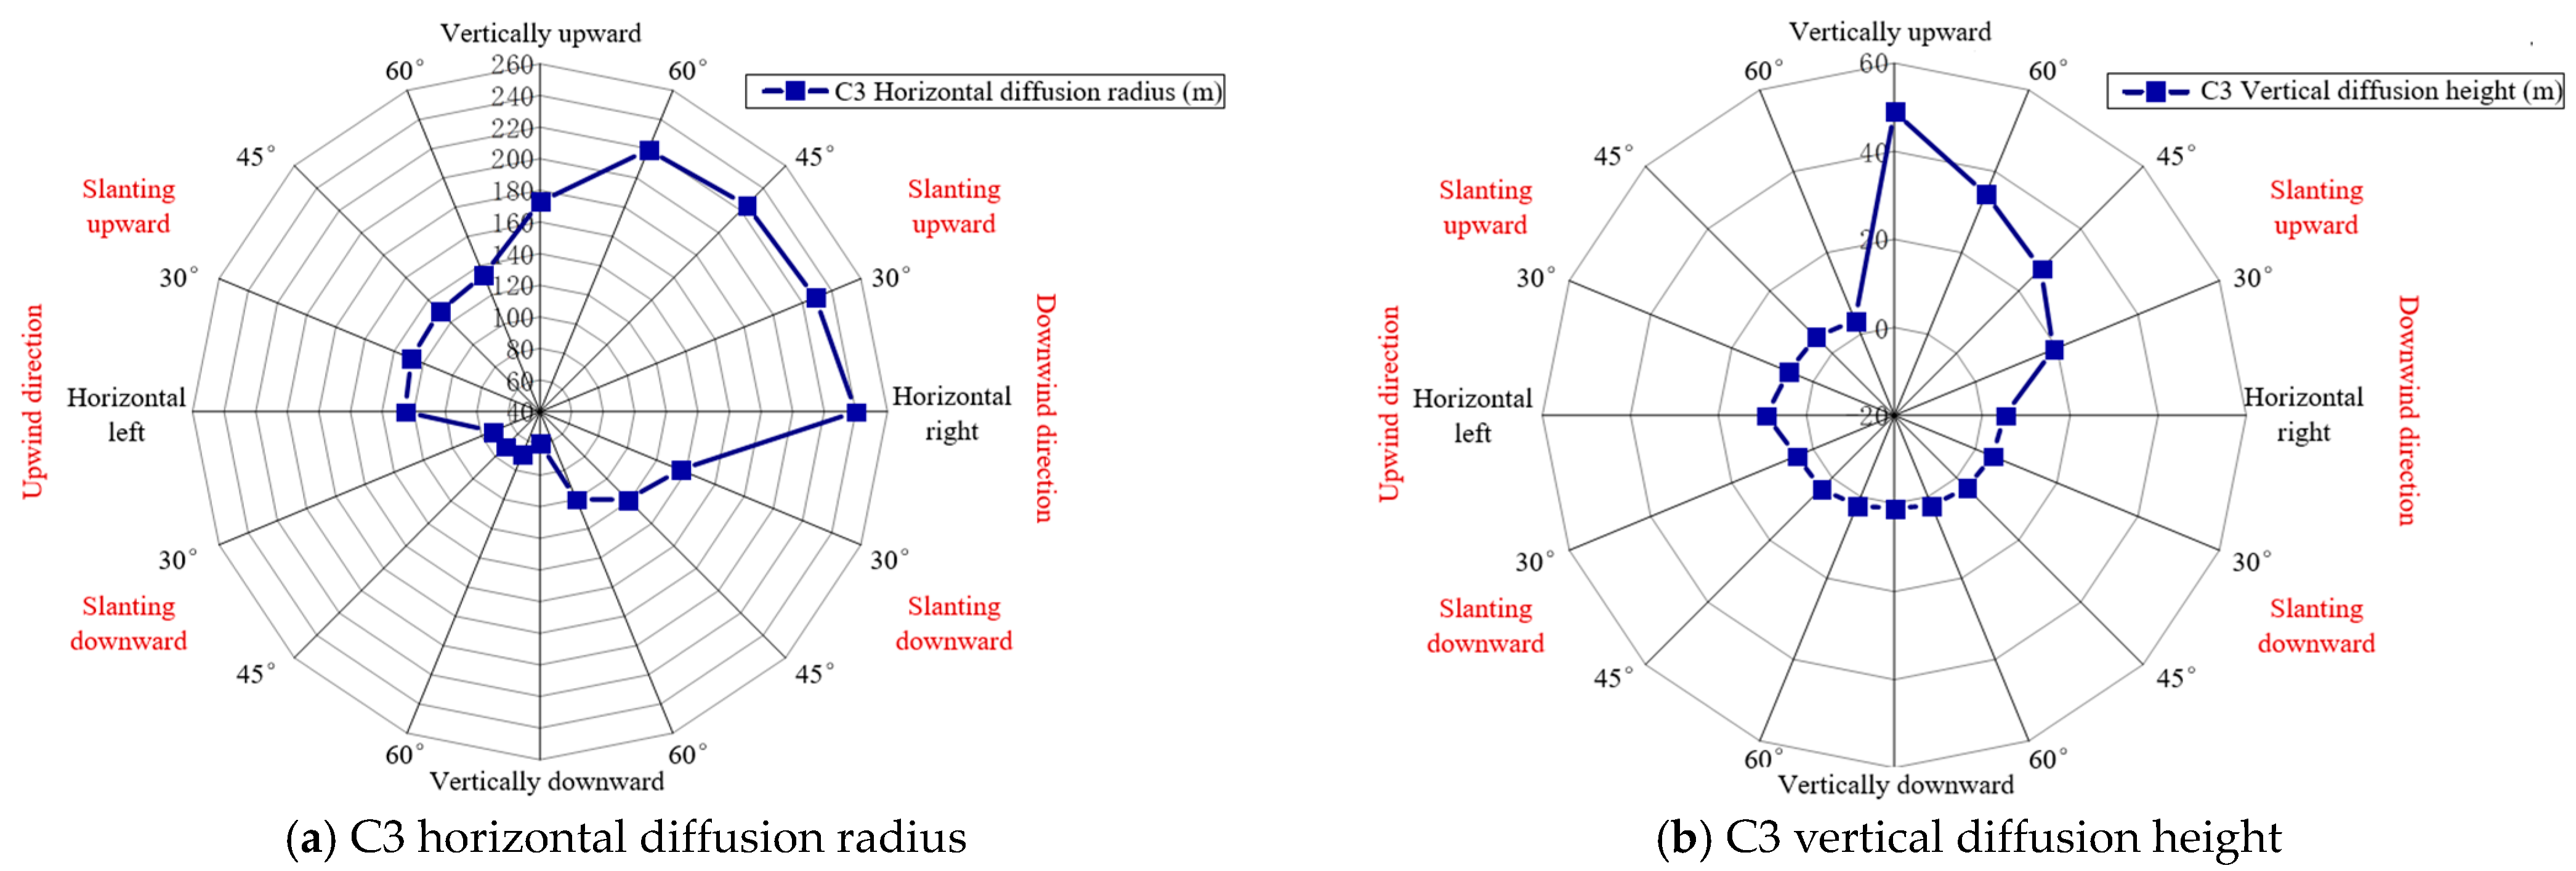
4.3. Orifice Orientation

Pipeline perforations caused by corrosion or third-party interference may occur at random locations along the pipeline, directly affecting the direction of light hydrocarbon leakage at the orifice. According to actual operating conditions, different orifice orientations were considered, as illustrated in Figure 25. These orientations influence the initial velocity vector of the leaked gas, and the resulting leakage profiles are shown schematically in Figure 26. A total of 16 simulation cases were conducted under varying orifice directions. Representative diffusion cloud maps for C3 and C5 are presented in Figure 27.
As shown in the diffusion diagrams, changes in orifice orientation significantly alter the leakage plume shape and distribution. For example, when the leakage direction is upward and aligned with the wind (windward–upward), the horizontal diffusion radius increases substantially, particularly for smaller inclination angles, while the vertical diffusion height decreases. Conversely, when the leakage is upward but against the wind or with larger inclination angles, the horizontal spread decreases and the vertical diffusion height is similarly reduced.
Figure 28 summarizes the horizontal and vertical diffusion extents for C3 under different orifice directions. From the data, the following observations can be made:
(1)
The horizontal diffusion radius is primarily affected by the wind direction and the initial horizontal velocity of the leaked gas. Upward-facing orifices aligned with the wind direction promote horizontal dispersion. Downward-facing orifices, on the other hand, experience greater resistance from the soil, resulting in reduced horizontal spread. When the orifice is oriented directly windward, the horizontal diffusion radius is further reduced due to the opposing wind force, although gas accumulation near the orifice may still occur.
(2)
The vertical diffusion height is largely influenced by the vertical component of the initial leakage velocity. Orifices oriented upward produce greater vertical dispersion, with the highest vertical diffusion observed at horizontally upward orientations. Downward orientations, constrained by soil resistance, exhibit significantly reduced vertical dispersion.
(3)
Interaction with resistance: The kinetic energy of the escaping hydrocarbons is consumed by resistive forces, which oppose the direction of motion. When the orifice is oriented non-vertically, a horizontal velocity component is introduced, enhancing lateral diffusion. However, diagonal downward orientations result in greater soil resistance, limiting diffusion compared to upward angles. The greatest horizontal spread is observed when the orifice is oriented horizontally to the right, while vertical downward orientations lead to the smallest overall diffusion range due to maximum resistance from the soil.

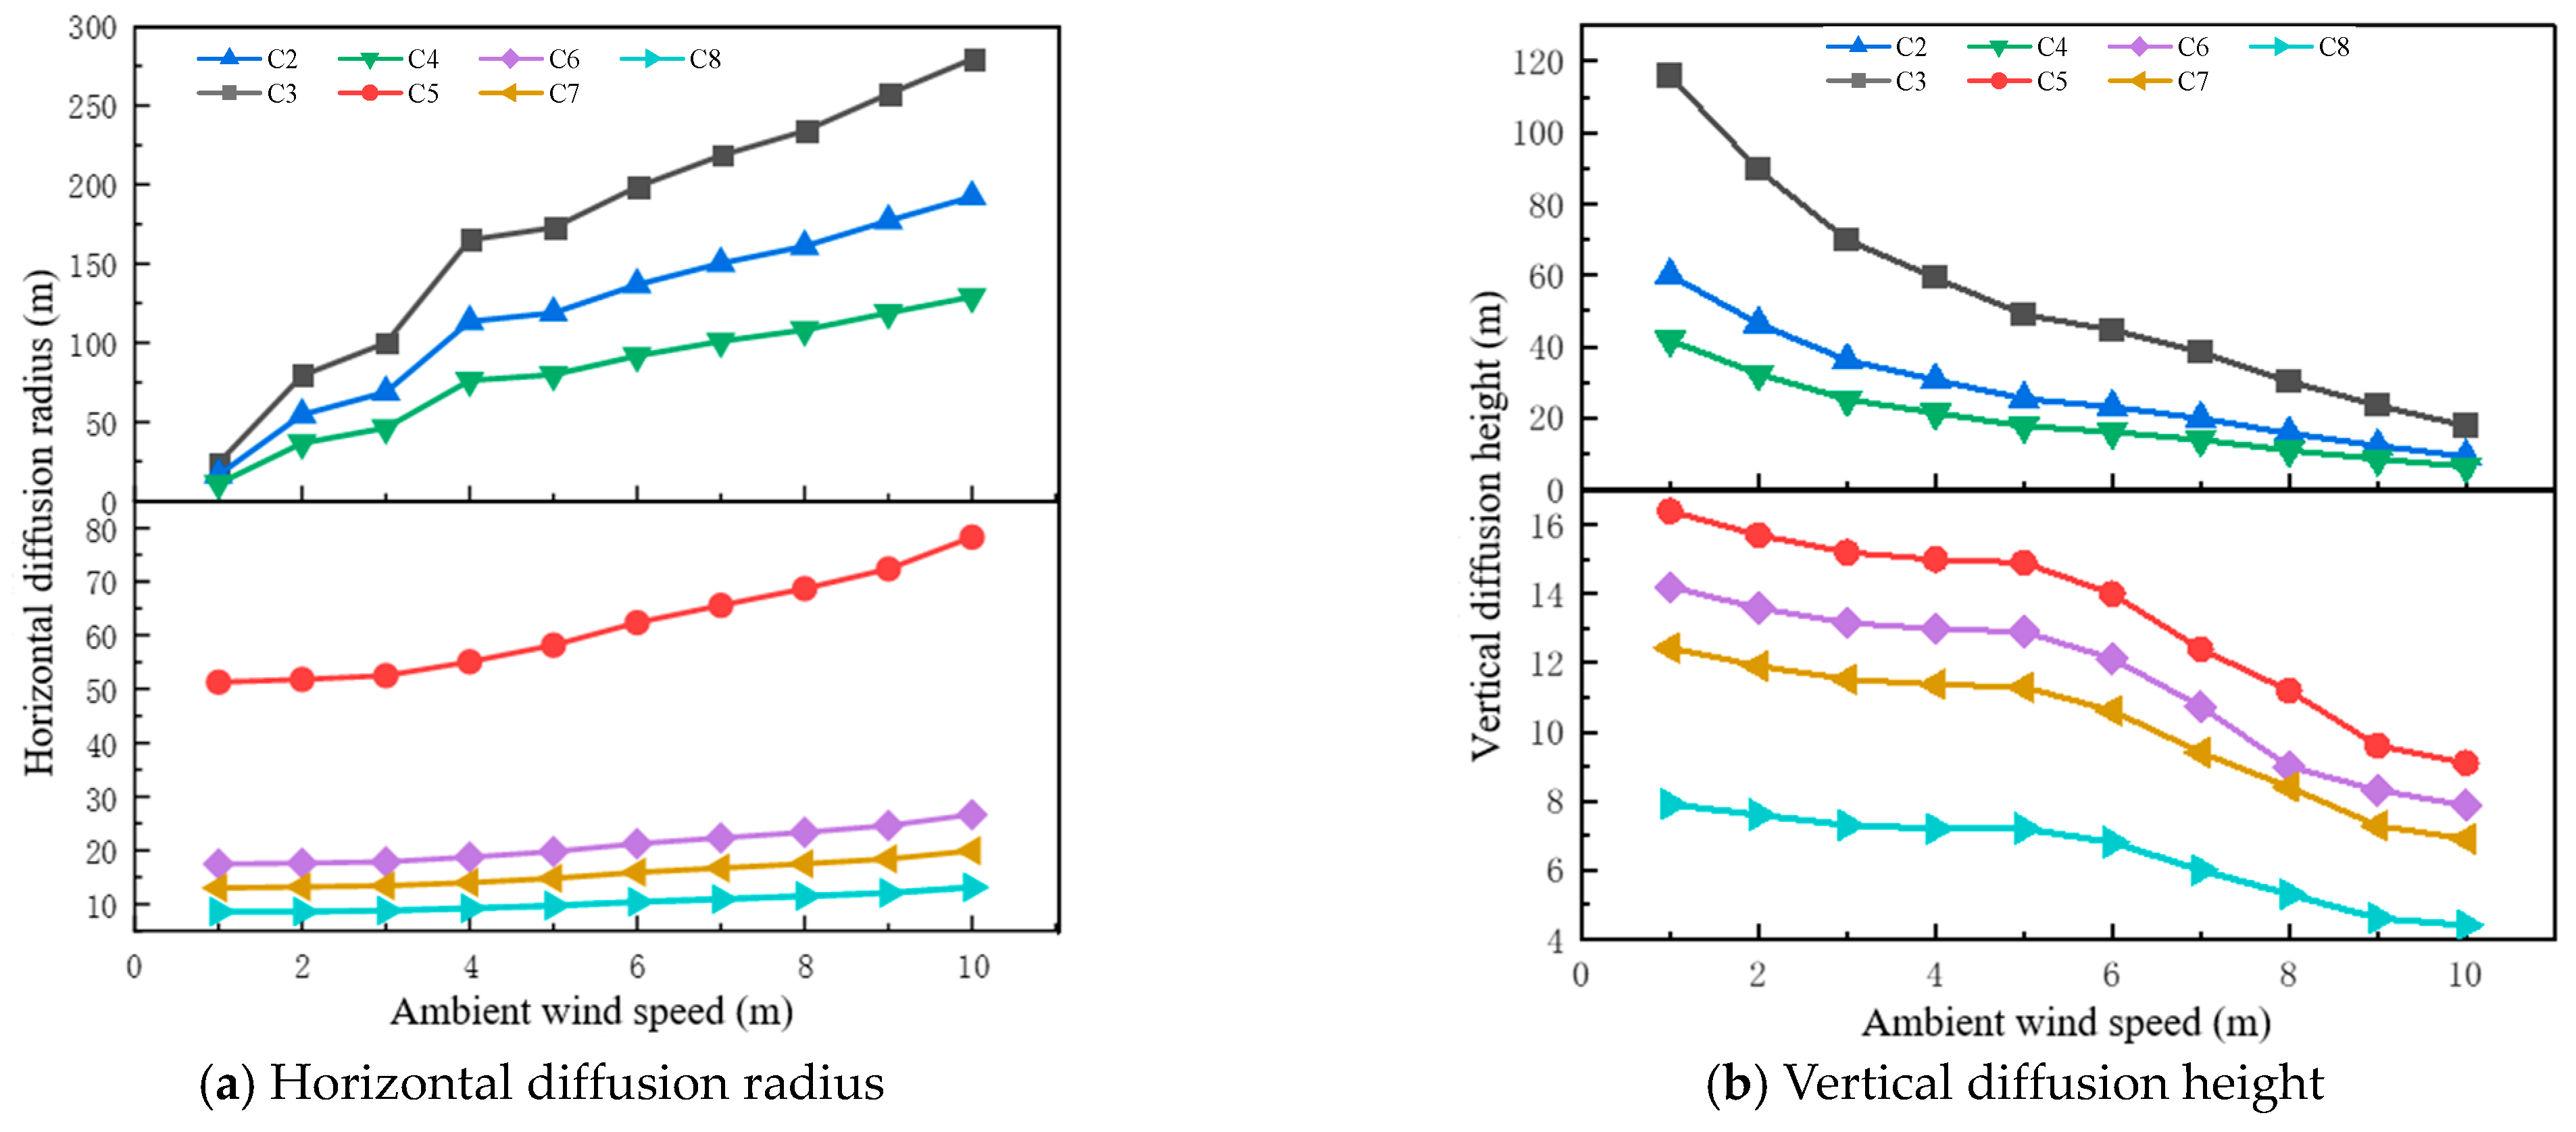
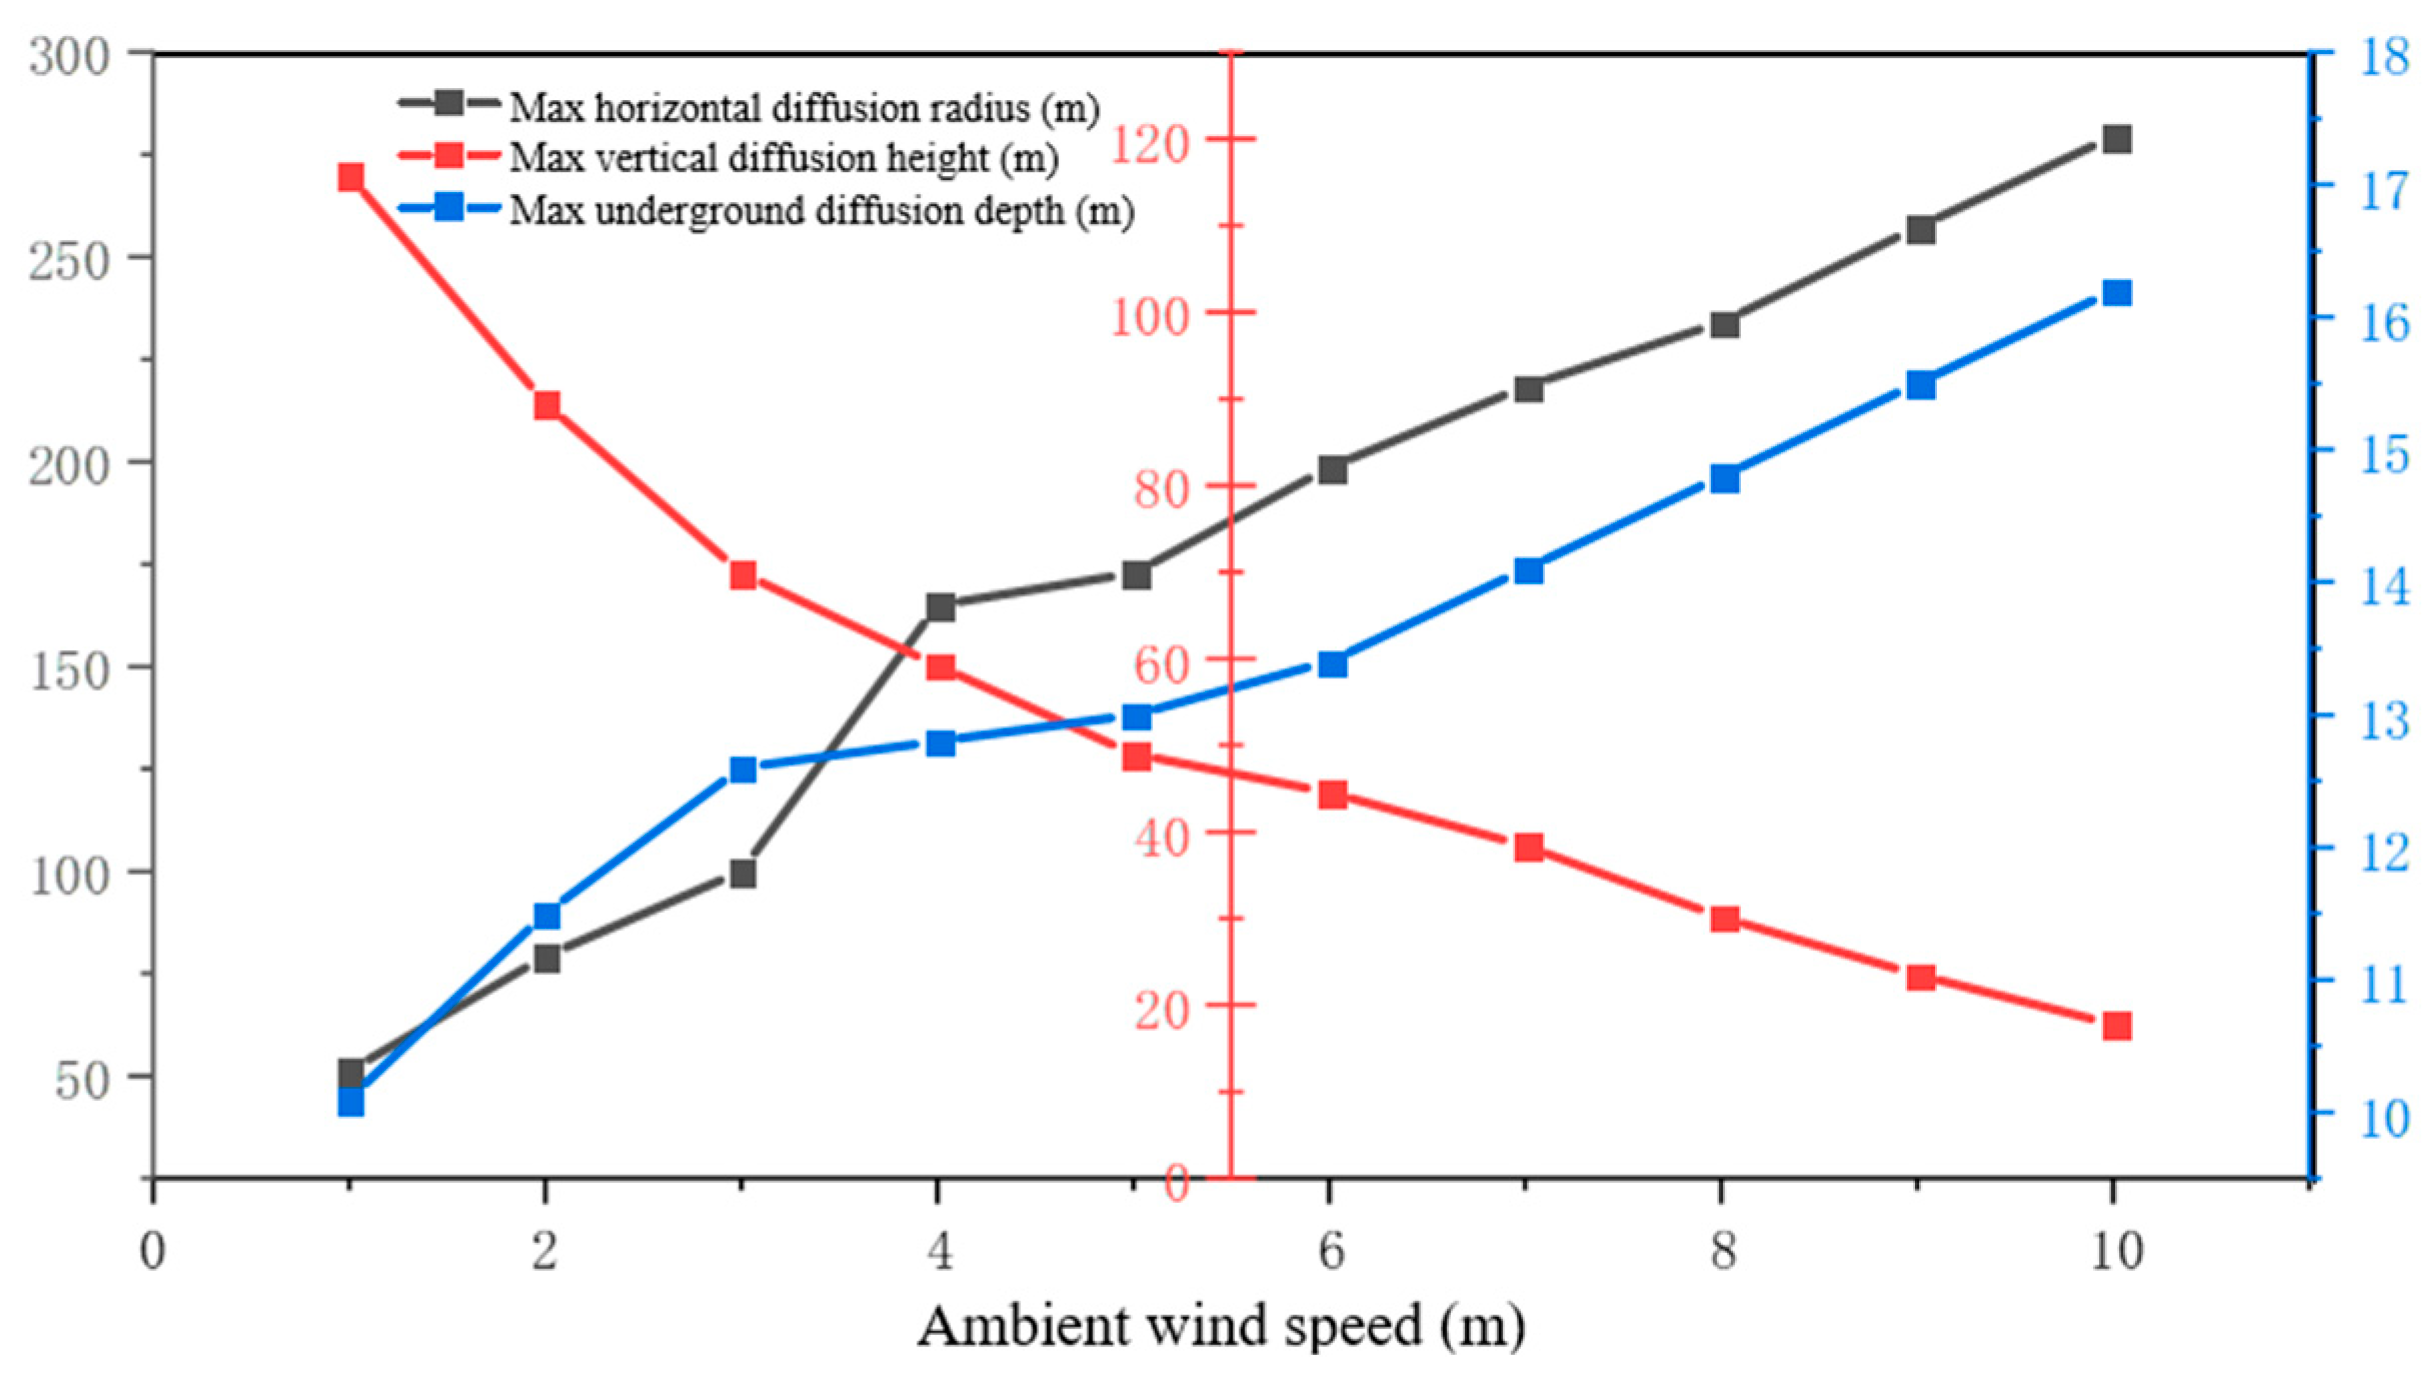
4.4. Ambient Wind Speed

Ambient wind passively alters the diffusion behavior of gaseous hydrocarbons, with wind speed being the most critical influencing factor. Based on actual operating conditions, nine simulation scenarios were conducted with wind speeds ranging from 1 to 10 m/s. Representative diffusion cloud maps of C3 and C5 at wind speeds of 1, 5, 8, and 10 m/s are shown in Figure 29 and Figure 30.
As illustrated in the cloud diagrams, increased wind speed significantly enhances the horizontal diffusion distance while reducing vertical dispersion. Additionally, notable hydrocarbon accumulation is observed on the leeward side of the leakage port.
Figure 31 and Figure 32 summarize the diffusion behavior under varying wind speeds. The following patterns are observed:
(1)
Horizontal Diffusion: As wind speed increases, the horizontal diffusion radius expands significantly. For instance, C3 increases from 24.0 m to 279.4 m. However, the rate of increase gradually diminishes at higher wind speeds due to growing aerodynamic resistance. C5 shows a more modest increase, from 51.3 m to 78.3 m, indicating that gaseous hydrocarbons are more sensitive to wind speed than liquid ones.
(2)
Vertical Diffusion: In contrast, the vertical diffusion height decreases with rising wind speed. For C3, it drops from 115.8 m to 17.8 m, although the rate of decline slows at higher speeds. Since vertical diffusion is evaluated at the lower explosive limit of light hydrocarbons, faster dispersion caused by higher wind speeds leads to a smaller vertical range at the critical concentration threshold.
(3)
According to the potential impact radius (PIR) for natural gas transmission pipelines in high consequence areas, the impact radius under the given conditions is approximately 41.9 m. However, when the transported medium is light hydrocarbons, the impact radius is influenced by factors such as component composition and environmental conditions. In particular, the presence of wind can significantly increase the diffusion range. Therefore, for light hydrocarbon pipelines, it is advisable to determine the impact radius based on both environmental factors and the composition of the transported medium.

5. Conclusions

This study focuses on exposed light hydrocarbon pipelines and establishes a numerical model to simulate the full diffusion process of leakage. The analysis covers long-term leakage behavior, compares single- and multi-component diffusion patterns, and evaluates the influence of key variables using a control variable approach. The main findings are summarized as follows:
(1)
The diffusion of light hydrocarbon leakage exhibits a clear temporal evolution. Initially, the leaked hydrocarbons rapidly disperse, and the primary shape of the diffusion cloud quickly forms. As time progresses, the diffusion range continues to expand, with three main pathways observed: horizontal spreading, vertical upward dispersion, and downward seepage into the subsurface. Gaseous components primarily contribute to horizontal dispersion, while liquid hydrocarbons begin to stabilize within a confined area. Over time, the rate of diffusion gradually slows, and by approximately 800 s after leakage onset, the overall diffusion boundaries reach a relatively stable state. Among the various components, C3 demonstrates the widest gaseous diffusion range, while C5 exhibits the most extensive liquid-phase spread, making them key indicators in assessing leakage severity.
(2)
In multi-component systems, vaporization and diffusion follow a sequential order. The vaporization of gaseous components is inhibited by heavier components, resulting in a smaller diffusion range than single-component cases. However, the presence of gas-phase components promotes the spread of liquid hydrocarbons through a carrier effect. Gas accumulation near the leakage point is more prominent under multi-component conditions.
(3)
Changes in component proportion affect the diffusion behavior. As the proportion of C3 or C4 increases, their individual diffusion ranges expand, while those of other components may decrease. No consistent pattern was observed for the maximum diffusion range, suggesting a nonlinear interaction dominated by the ratio of C2 to C3.
(4)
An increase in pipeline pressure significantly expands the diffusion range and leakage volume. The diffusion extent is positively correlated with internal pressure.
(5)
Orifice orientation significantly affects diffusion geometry. Upward and wind-aligned leakage increases horizontal spread and subsurface penetration but reduces vertical height. Downward orientations experience greater soil resistance, limiting horizontal and vertical diffusion while deepening underground penetration. The effects become more pronounced at smaller or larger inclination angles, depending on the wind–leakage alignment.
(6)
Ambient wind speed enhances horizontal dispersion but suppresses vertical and subsurface diffusion. As wind speed increases, light hydrocarbons spread further horizontally but aggregate less, reducing the potential for localized high-concentration zones.

Author Contributions

Conceptualization, X.Y.; Software, H.L.; Validation, B.D. and H.L.; Formal analysis, Y.D.; Investigation, S.Z., Y.D., H.L. and L.C.; Resources, X.X. and L.C.; Data curation, X.X., Y.D., X.H., B.D. and H.L.; Writing—original draft, S.Z., X.X., B.D., X.Y. and L.C.; Writing—review & editing, X.H.; Supervision, X.Y. All authors have read and agreed to the published version of the manuscript.

Funding

This research was funded by CNPC grant number 2023YQX10604.

Data Availability Statement

The original contributions presented in the study are included in the article, further inquiries can be directed to the corresponding author.

Conflicts of Interest

Shuxin Zhang was employed by the Tubular Goods Research Institute, China National Petroleum Corporation & State Key Laboratory of Oil and Gas Equipment. Xiaohui Xia, Yufa Deng, Xiaochun Han and Banghui Deng were employed by the Tarim Oilfield Company, PetroChina Company Limited. Huituan Liu was employed by the China National Petroleum Corporation Tuha Oilfield Branch. The remaining authors declare that the research was conducted in the absence of any commercial or financial relationships that could be construed as a potential conflict of interest.

References

  1. Dai, Z. Discussion on the safety distance of oilfield light hydrocarbon transportation pipeline. Electron. Mag. Baike Forum 2021, 5, 471. [Google Scholar] [CrossRef]
  2. Yue, Y. DOLPHIN-based leakage monitoring for liquefied light hydrocarbon pipelines. Smart Fact. 2016, 1, 86–89. [Google Scholar]
  3. Wang, J. Application of negative pressure wave technology to detect leakage of light hydrocarbon pipeline. Oil Gas. Field Surf. Eng. 2007, 6, 15–16. [Google Scholar]
  4. Wang, J.; Li, X.; Sun, K. Field test of anti-theft monitoring technology for negative pressure wave leakage of light hydrocarbon pipeline. Pet. New Energy 2004, 15, 38–39. [Google Scholar] [CrossRef]
  5. Liang, Y. Research on Transportation Function and Safety of Mixed-Air Light hydrocarbon Gas Pipeline Network. Master’s Thesis, Xi’an Shiyou University, Xi’an, China, 2021. [Google Scholar]
  6. Qiu, R.; Zhang, H.; Gao, X.; Zhou, X.; Guo, Z.; Liao, Q.; Liang, Y. A multi-scenario and multi-objective scheduling optimization model for liquefied light hydrocarbon pipeline system. Chem. Eng. Res. Des. 2019, 141, 566–579. [Google Scholar] [CrossRef]
  7. Du, S.; Xue, S.; Zheng, C. Design of leakage monitoring experimental System for urban Gas Transmission and Distribution pipelines. Lab. Res. Explor. 2019, 39, 66–70. [Google Scholar]
  8. Cao, W.; Yang, D.; Li, X.; Jia, J. A method for monitoring buried pipeline leakage based on SH wave. Press. Vessel. 2023, 40, 16–20, 37. [Google Scholar] [CrossRef]
  9. Zhu, H.; Lin, Y.; Ma, C. Simulation of leakage and diffusion in gathering and transportation pipelines containing hydrogen sulfide in flat area. J. Southwest. Pet. Univ. 2009, 31, 156–160. [Google Scholar] [CrossRef]
  10. Bu, F.; Liu, Y.; Chen, S.; Wu, J.; Guan, B.; Zhang, N.; Lin, X.; Liu, L.; Cheng, T.; Shi, Z. Real scenario analysis of buried natural gas pipeline leakage based on soil-atmosphere coupling. Int. J. Press. Vessel. Pip. 2022, 199, 104713. [Google Scholar] [CrossRef]
  11. Fu, M.; Huang, Y.; Zhang, M.; Zhang, J.; Yang, J.; Yang, M.; Zou, B.; Kou, J.; Liu, J.; Yao, W.; et al. Numerical simulation of leakage and diffusion characteristics of buried natural gas pipeline in tunnel. J. Saf. Environ. 2024, 24, 1105–1113. [Google Scholar]
  12. Marchioli, C.; Zhao, L. Dispersed multiphase flows: Advances in measuring, simulation and modeling. Acta Mech. Sin. 2022, 38, 1–3. [Google Scholar] [CrossRef] [PubMed]
  13. Cao, X.; Wang, Q. Simulation of leakage law in gas-liquid two-phase flow pipeline. Oil Gas. Storage Transp. 2017, 36, 969–975. [Google Scholar] [CrossRef]
  14. Schneiderbauer, S.; Saeedipour, M. The impact of interphase forces on the modulation of turbulence in multiphase flows. Acta Mech. Sin. 2022, 38, 1–11. [Google Scholar] [CrossRef]
  15. Yan, D.; Jian, S.; Xiao-lin, W.; Lei, S. Study on Methods for Classifying Oil & Gas Pipeline Incidents. China Saf. Sci. J. 2013, 23, 109–115. [Google Scholar] [CrossRef]
  16. SY/T 6859-2020; Guidelines for Risk Evaluation of Oil and Gas Transmission Pipelines. Petroleum Industry Press: Beijing, China, 2020.
  17. Xiao, C.; Lu, Z.; Yao, S.; Yan, L.; Wang, J. A CFD computational model for high-pressure liquid CO2 decompression. IOP Conf. Ser. Earth Environ. Sci. 2021, 675, 012205. [Google Scholar] [CrossRef]
  18. Taheri, A.A.; Maboudi, A.; Khavasi, E.; Taghilou, M. Thermal analysis of disk-type transformer winding immersed in nanofluids using mixture and Eulerian–Lagrangian approach. J. Braz. Soc. Mech. Sci. Eng. 2022, 44, 1–13. [Google Scholar] [CrossRef]
  19. Wang, J.; Yan, Y.; Li, J. Numerical simulation of methane spreading in porous media after leaking from an underground pipe. Int. J. Numer. Methods Heat. Fluid Flow. 2020, 31, 367–390. [Google Scholar] [CrossRef]
  20. Chu, F.; Zhang, Y.; Lin, Q.; Zhou, X.; Guo, C. Two-Stream Numerical Simulation of a New Type Drum Dryer. J. Appl. Math. Phys. 2019, 07, 1606–1624. [Google Scholar] [CrossRef]
Figure 1. Conceptual diagram of the leakage diffusion process in light hydrocarbon pipelines.
Energies 18 03151 g001
Figure 2. Statistical chart of pipeline failure classification.
Energies 18 03151 g002
Figure 3. Proportion of pipeline failure causes (China).
Energies 18 03151 g003
Figure 4. Light hydrocarbon pipeline failure leakage factors map.
Energies 18 03151 g004
Figure 5. Light hydrocarbon pipeline leakage diffusion model.
Energies 18 03151 g005
Figure 6. Local grid encryption diagram.
Energies 18 03151 g006
Figure 7. Grid independence verification.
Energies 18 03151 g007
Figure 8. Cloud diagram of C3 and C5 leakage diffusion time in the early stage of leakage.
Energies 18 03151 g008
Figure 9. Cloud diagram of C3 and C5 leakage diffusion time in the middle stage of leakage.
Energies 18 03151 g009
Figure 10. Cloud diagram of C3 and C5 leakage diffusion time in the late stage of leakage.
Energies 18 03151 g010aEnergies 18 03151 g010b
Figure 11. Light hydrocarbon pipeline leakage diffusion process range variation (0~1600 s).
Energies 18 03151 g011
Figure 12. C3/C5 diffusion comparison diagram of multi-component/single-component light hydrocarbon leakage.
Energies 18 03151 g012
Figure 13. Single-component and multi-component diffusion range comparison chart.
Energies 18 03151 g013
Figure 14. C3 leakage diffusion cloud at different component ratios (15%~30%).
Energies 18 03151 g014
Figure 15. C5 leakage diffusion cloud at different component ratios (12.5%~20%).
Energies 18 03151 g015
Figure 16. Horizontal diffusion radius of each component with different C3 fractions.
Energies 18 03151 g016
Figure 17. Horizontal diffusion radius of each component at different ratios.
Energies 18 03151 g017
Figure 18. Overall maximum horizontal diffusion radius for different C3 ratios.
Energies 18 03151 g018
Figure 19. Overall maximum horizontal diffusion radius for different C5 ratios.
Energies 18 03151 g019
Figure 20. C3 leakage diffusion cloud at different delivery pressures.
Energies 18 03151 g020
Figure 21. C5 leakage diffusion cloud at different delivery pressures.
Energies 18 03151 g021
Figure 22. Spreading range of light hydrocarbon leakage as influenced by conveyor pressure.
Energies 18 03151 g022
Figure 23. Maximum diffusion range with varying delivery pressure.
Energies 18 03151 g023
Figure 24. Schematic diagram of conveyor pressure affecting leakage spreading.
Energies 18 03151 g024
Figure 25. Leakage orifice orientation.
Energies 18 03151 g025
Figure 26. Schematic diagram of the influence of orifice direction on leakage spreading.
Energies 18 03151 g026
Figure 27. C3/C5 leakage diffusion cloud with different orifice orientations.
Energies 18 03151 g027
Figure 28. Spreading range of light hydrocarbon leakage as influenced by orifice direction.
Energies 18 03151 g028
Figure 29. C3 leakage diffusion cloud at different ambient wind speeds.
Energies 18 03151 g029
Figure 30. C5 leakage diffusion cloud under different ambient wind speeds.
Energies 18 03151 g030
Figure 31. Light hydrocarbon diffusion distance at different ambient wind speeds.
Energies 18 03151 g031
Figure 32. Maximum diffusion range with varying ambient wind speeds.
Energies 18 03151 g032
Table 1. Pipe failure classification.
Major CategoriesRepresentative Failure Factors
Corrosion (chemical degradation)Internal corrosion, external corrosion, and unknown type
Excavation damageOperator/contractor excavation, third-party excavation, and unknown type
MishandlingOperator/contractor operator error, incorrect installation, other incorrect operation, and unknown type
Material/welding/equipment failurePipe body, pipe welds, mechanical fits, joint/component failures, control/rescue equipment failures, coupling failures, assembly issues, and unknown types
Natural forcesEarth movement, flooding, lightning, temperature extremes, wind, and unknown type
Other external damageFire/explosion, continued excavation activities, mechanical damage, vandalism, and unknown
Other causesMixed causes and unknown causes
Table 2. Error comparison between simulated and experimental values.
Serial No.Pipeline Pressure (MPa)Pipe Temperature (K)Leakage Aperture (mm)Orifice ShapeTotal Mass Flow Rate (Experimental) (kg/s)Total Mass Flow Rate (Simulated) (kg/s)Error
(%)
12.1229051Round hole9.510.248.39
22.25291.5535Round hole4.85.067.82
31.16286.9551Round hole6.05.446.50
42.18286.4515Rectangular hole1.351.449.31
Table 3. Parameters of the whole leakage process.
Parameter NameUnitRetrieve a ValueParameter NameUnitRetrieve a Value
Light hydrocarbon fraction%C210Pipe diameter/wall thicknessmm244.5 mm/10 mm
C330Operating pressureMPa3.0
C420Leakage aperturemm20
C520Orifice direction Vertically
C610Soil properties Porosity0.3
C75mmParticle diameter0.25
C85m−1Inertial drag6.56 × 105
Pipe temperature°C25m−2Viscous drag3.38 × 1011
Environmental temperature°C25Ambient air velocitym/s5.0
Table 4. Light hydrocarbon concentration setting table.
Light HydrocarbonC2C3C4C5C6C7C8
Concentration of concern3.0%2.2%1.8%1.1%1.2%1.1%1.0%
Table 5. Variable conditions of the benchmark group of the simulation experiment.
Parameter NameUnitRetrieve a ValueParameter NameUnitRetrieve a Value
Light hydrocarbon fraction%C210Pipe diameter/wall thicknessmm244.5 mm/10 mm
C330Operating pressureMPa3.0
C420Leakage aperturemm20
C520Orifice direction Vertically
C610Soil properties Porosity0.3
C75mmParticle diameter0.25
C85m−1Inertial drag6.56 × 105
Pipe temperature°C25m−2Viscous drag3.38 × 1011
Environmental temperature°C25Ambient air velocitym/s5.0
Disclaimer/Publisher’s Note: The statements, opinions and data contained in all publications are solely those of the individual author(s) and contributor(s) and not of MDPI and/or the editor(s). MDPI and/or the editor(s) disclaim responsibility for any injury to people or property resulting from any ideas, methods, instructions or products referred to in the content.

