Article

Comprehensive Experimental Study of Steam Flooding for Offshore Heavy Oil Recovery After Water Flooding

1
CNOOC Key Laboratory of Offshore Heavy Oil Thermal Recovery, Tianjin 300459, China
2
Tianjin Branch of CNOOC Ltd., Tianjin 300452, China
3
School of Petroleum Engineering, China University of Petroleum (East China), Qingdao 266580, China
*
Author to whom correspondence should be addressed.
Energies 2025, 18(12), 3140; https://doi.org/10.3390/en18123140
Submission received: 17 April 2025 / Revised: 8 June 2025 / Accepted: 11 June 2025 / Published: 15 June 2025
(This article belongs to the Section H: Geo-Energy)

Abstract

:
The objective of this study is to investigate the feasibility of steam flooding (SF) as an alternative method for offshore heavy oil reservoirs after water flooding (WF). A series of experiments was performed by using specially designed one-dimensional (1-D) and three-dimensional (3-D) experimental systems to prove the feasibility of SF and to study the effects of the timing of SF, the steam injection rate, and the addition of chemical agents (the nitrogen foams and displacing agents) on the performance of SF after WF. The results showed that, for offshore heavy oil reservoirs after WF processes, the SF process is a viable enhanced oil recovery method, which should start as early as possible if the economic conditions permit. It is extremely important to choose an appropriate steam injection rate for SF after the WF process. Compared with the pure SF process, the final oil recovery of the SF process with the addition of the nitrogen foam or the displacing agent increased by 12.83% and 7.58% in the 1-D experiments, respectively. The nitrogen foam and displacing agent have synergistic effects on the performance of the SF after WF processes. The final oil recovery of the SF process with the addition of the two chemical agents at the steam injection rate of 10 mL/min was 37.64%, which was 5.47% higher than that of the pure SF process in the 3-D experiments.

1. Introduction

Unconventional petroleum reserves, particularly offshore hydrocarbons, play a pivotal role in securing long-term energy stability and supply reliability [1,2]. Offshore reserves are approximately 22 billion tons, accounting for 24% of the total reserves in the world [3,4,5,6,7]. Bohai Bay Oilfield, the largest offshore oilfield in China, has approximately 2.3 billion tons of heavy oil, indicating a great potential for development [8,9,10]. Heavy oil in Bohai Bay Oilfield is usually developed by water flooding (WF), beneficial from the economic point of view [11,12]. However, the final oil recovery of WF processes was generally less than 5%, leaving high residual oil saturation. Therefore, enhanced oil recovery (EOR) methods are required to obtain the remaining oil [13,14,15,16].
At present, there are many EOR methods for developing heavy oil, such as cyclic steam stimulation (CSS), steam flooding (SF), and steam-assisted gravity drainage (SAGD) [17,18,19,20]. For instance, the CSS method was implemented in many heavy oil reservoirs in the Southern part of the Sultanate of Oman [17]. In addition, SAGD has become the preferred in situ technology for developing heavy oil, especially in the Athabasca area, Canada. More than 10 commercial SAGD projects operate in the Athabasca area, Canada [18]. In Liaohe Oilfield, China, the production of heavy oil is 552 × 104 t/y, in which CSS, SF, SAGD, and the other methods account for 58.7%, 14.1%, 19.6%, and 7.6%, respectively [19]. In the Russkoye oil field, hot water flooding is the main technology and shows good performance [20].
Based on the geological conditions of the Bohai Bay Oilfield and the on-site circumstances, SF was selected as the EOR method for enhancing heavy oil recovery due to its principal mechanisms, such as the distillation effect of steam, thermal expansion of fluids and minerals, and reduction in viscosity of heavy oil under reservoir conditions [21,22,23,24,25]. Many experiments, numerical simulations, and field operations have been performed to investigate SF processes. Especially, Pang et al. conducted one-dimensional steam flooding experiments to analyze the performance of steam flooding and found that the ultimate oil recovery was 41.5% [26]. Zhang et al. evaluated three thermal strategies (SF, hot WF, and multi-component thermal fluid flooding) by reservoir simulations and showed that SF was more effective for intermediate and higher viscosity heavy oil [27]. Zhang et al. reported successful field tests of SF in the Liaohe oilfield, China [28]. In the tests, 176,000 tons of oil was produced in total after the SF process. The oil/steam ratio was 0.19, and oil recovery reached 35%. Shandrygin et al. reported that SF was the most effective thermal methods used in Russia and was carried out in more than ten oilfields, such as Usinskoe, Okha and Katangli [29].
Although the aforementioned findings indicate that SF can effectively recover heavy oil, the steam override and steam channeling easily result in early steam breakthrough and, subsequently, low sweep efficiency of steam in heavy oil reservoirs [30,31,32,33]. However, the SF performance can be effectively improved through the addition of chemical agents, such as nitrogen foams and displacing agents. For instance, Lyu et al. performed a series of micromodel experiments on the SF process with the addition of nitrogen foam [34]. It was shown that nitrogen foams could improve sweep efficiency and displace the residual heavy oil. Wang et al. found that the final oil recovery of the SF process with the addition of nitrogen foam was 39.7% higher than that of the pure SF process [35]. Bagheri et al. found that steam-foam is a promising EOR technology, which can be used to improve the performance of traditional steam flooding [36]. Pratama et al. performed SF experiments and revealed that more than 80% of residual oil was recovered after SF with the addition of a displacing agent, indicating a favorable oil recovery performance [37].
Although many experiments and numerical simulations have been conducted to evaluate the performance of SF processes, most studies focus on onshore heavy oil reservoirs after primary production rather than offshore after the WF process. Therefore, the feasibility of enhancing offshore heavy oil recovery by SF after WF needs to be comprehensively evaluated. Furthermore, the effects of operational parameters and the addition of chemical agents, such as nitrogen foams and displacing agents, on the performance of SF after WF are still not clear.
The objective of this study is to investigate the feasibility of the SF process as an EOR method for offshore heavy oil reservoirs after WF processes. A series of experiments were performed by using specially designed one-dimensional (1-D) and three-dimensional (3-D) experimental systems to prove the feasibility of the SF process and to study the effects of the timing of SF, the steam injection rate, and the chemical agents (nitrogen foam and displacing agent) on the performance of SF after WF. To the best of our knowledge, there has not previously been any comprehensively experimental investigation of SF processes for offshore heavy oil reservoirs after WF processes.

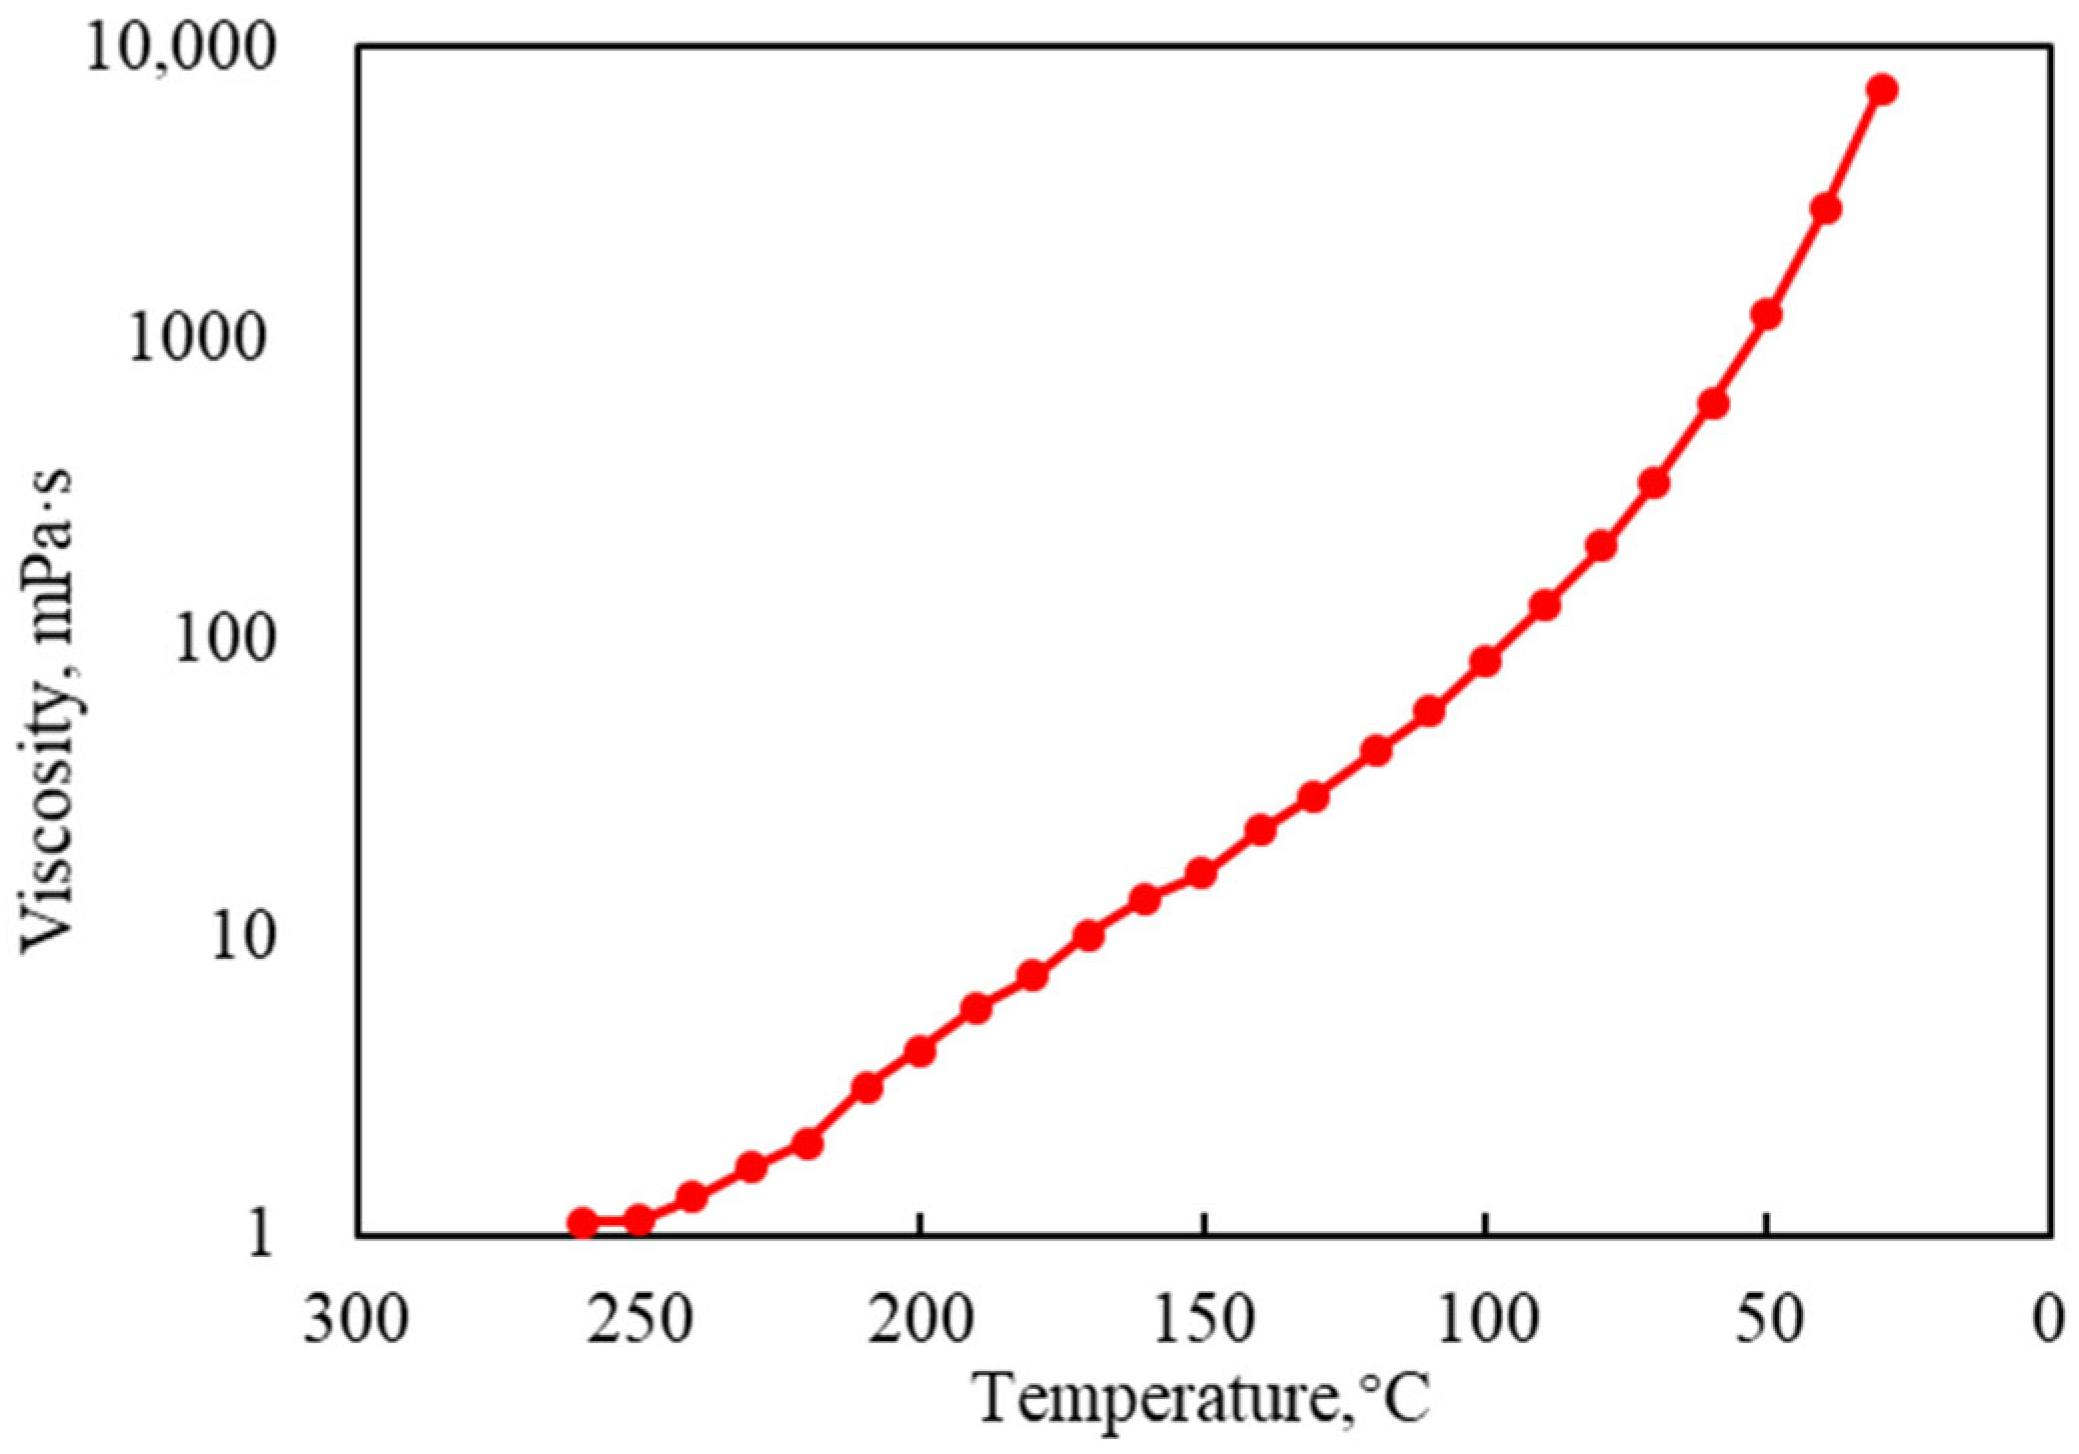
2. Experimental Materials

The heavy oil sample was obtained from the Bohai Bay Oilfield, China and then cleaned by using a centrifuge to remove brine and sands. The viscosity of the heavy oil sample were measured by a rotational rheometer at different temperatures, as shown in Figure 1. It can be seen from Figure 1 that the heavy oil has a viscosity of 9126.65 mPa·s and a density of 963 kg/m3 at a temperature of 25 °C. The brine was also obtained from the Bohai Bay Oilfield, Bohai Bay, China, and the ion composition of the brine used in the experiments is shown in Table 1. A mixture of a sulfonate surfactant sodium α-olefin (α-AOS) and silica nanoparticles was used as a foaming agent to generate foams, and a displacing agent composed of sulfonate surfactant SLB and anionic–nonionic surfactant CY was used to improve oil displacement efficiency during the SF process. The aforementioned injection agents were sourced from the Qingdao Tengyue Jinrui Technology Co., Ltd., Qingdao, China. For all the experiments in this study, the concentration of the foaming agent and the displacing agent was kept at 1.0 wt%. Nitrogen with a purity of 99.99% was co-injected with the foaming agent to form nitrogen foams during the SF processes. Silica sands (grain size of 100–200 μm) as porous media were employed to pack the reservoir models. To simulate the upper and lower caps of offshore heavy oil reservoirs, compacted clay was used to fill the top and bottom layers of the 3-D reservoir model. Silica sands and compacted clay were obtained from the Luoyang Bailian Environmental Technology Co., Ltd., Luoyang, China.

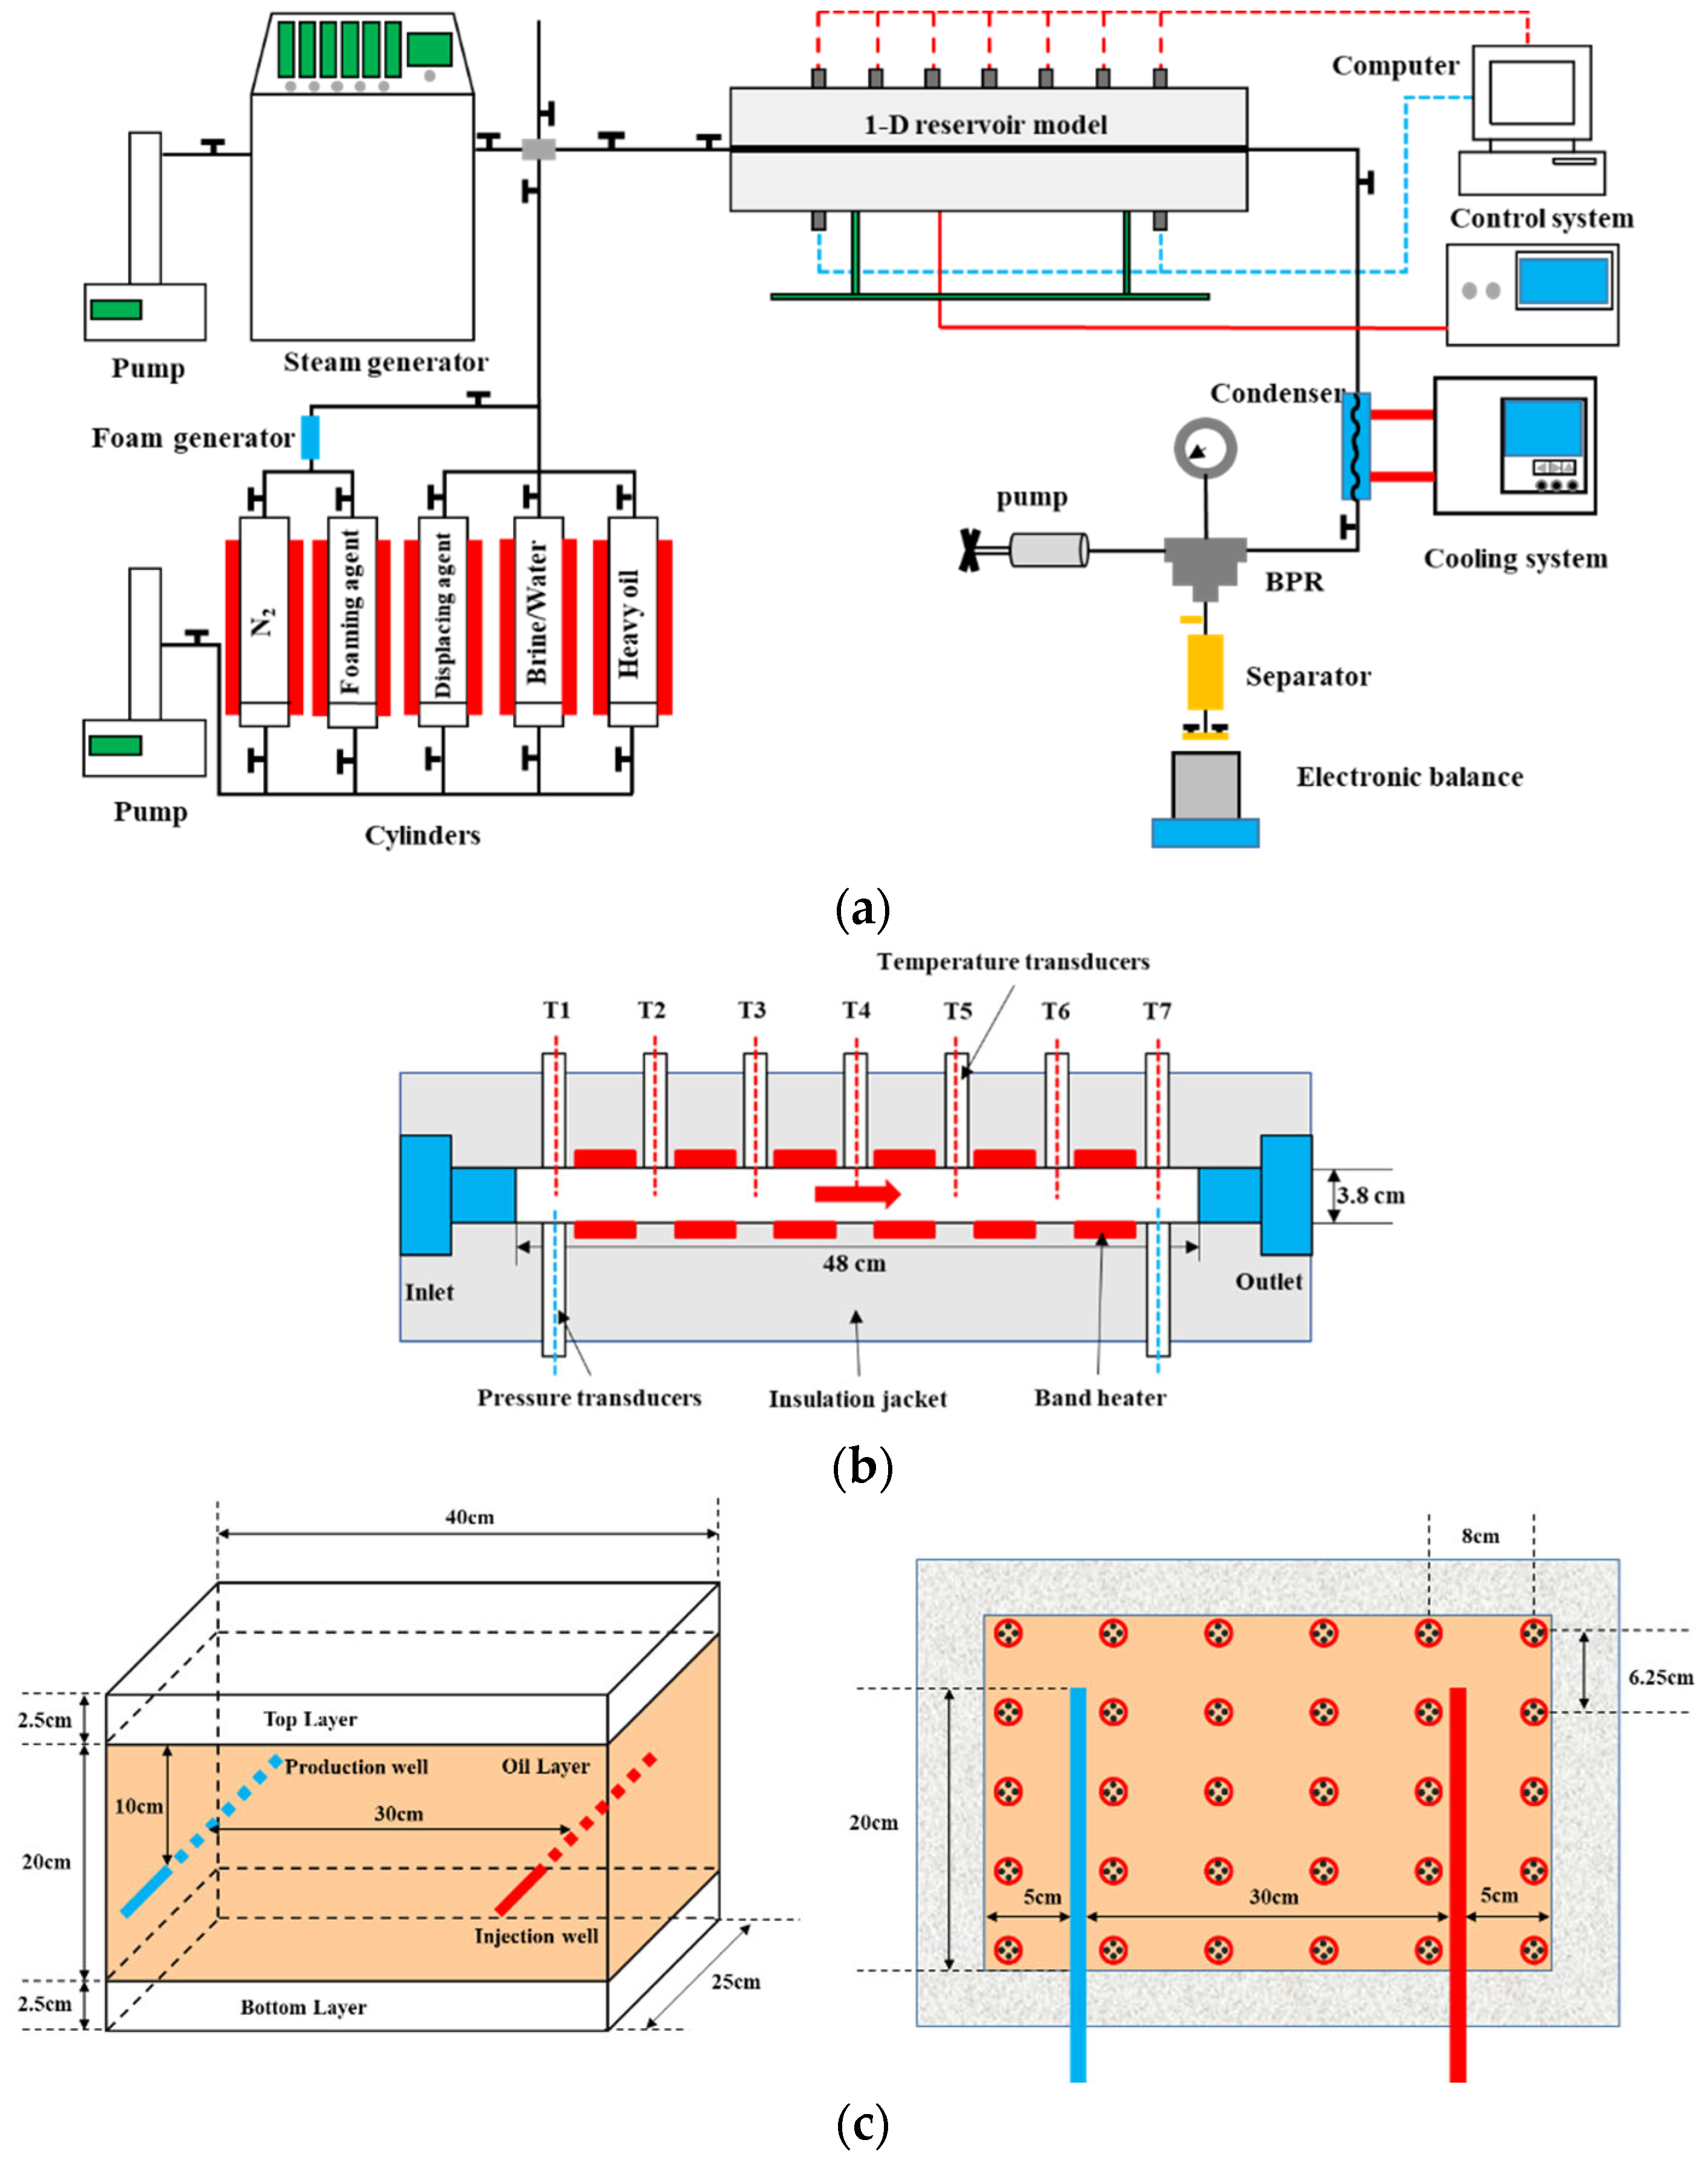
3. Experimental Apparatus

The schematic diagram of the 1-D experimental system is illustrated in Figure 2a. A steam generator controlled by a pump was used to generate a maximum of 450 °C steam. The other pump connected five cylinders to inject the fluids (heavy oil, brine, displacing agent, foaming agent, and nitrogen) into a 1-D reservoir model. It is noteworthy that the nitrogen and foaming agents flow through a foam generator at the same time to generate the nitrogen foam.
As shown in Figure 2b, the specially designed 1-D reservoir model is 48 cm long with a 3.8 cm inner diameter. Seven temperature transducers were located throughout the model and two pressure transducers were mounted on both ends of the 1-D reservoir model. A computer continuously recorded the temperatures and pressures during the experimental processes. Six band heaters controlled by a control system were used to preheat the model to the reservoir temperature and an insulation jacket was used to reduce the heat loss during the SF process.
A backpressure regulator (BPR) controlled by a pump was used to maintain the pressure of the 1-D reservoir model. The temperature of the produced fluids was decreased by a condenser and a cooling system to avoid damage to the BPR. A separator and an electronic balance were used to measure the mass of the produced water and oil. All pipelines were covered in heating tapes that prevented that loss during the SF process.
During the 3-D experiments of SF after WF, a 3-D reservoir model was used in the experimental system instead of the 1-D reservoir model in Figure 2c. The 3-D reservoir model was specially designed for offshore heavy oil reservoirs with horizontal wells. Compacted clay was used to simulate the upper and lower caps of the offshore reservoir. To develop offshore heavy oil reservoirs economically and efficiently, horizontal wells with large well spaces are commonly used in the Bohai Bay Oilfield. Therefore, two horizontal wells were fabricated and symmetrically installed into the 3-D reservoir model. The distance between the horizontal wells was set at 30 cm, as shown in Figure 2c. A total of 120 temperature transducers in four layers and two pressure transducers were used to measure the temperature distributions and the pressures of the horizontal wells, respectively.

4. Experimental Procedures

4.1. 1-D Experiments

Before the commencement of each experiment, the 1-D reservoir model was packed with silica sand and then installed in the insulation jacket. Thereafter, the compressed nitrogen was injected into the whole experimental system to conduct a leakage test. After the 1-D reservoir model was heated to the reservoir temperature (56 °C) and the pressure of the 1-D reservoir model was set at the reservoir pressure of 12 MPa, the brine was injected into the model to determine the porosity and permeability of the 1-D reservoir model by substance conservation and Darcy’s law. Then, the heavy oil was injected into the 1-D reservoir model to saturate the model and measure the initial oil saturation.
After the 1-D reservoir model was aged for 6 h, the brine was injected into it at an injection rate of 5 mL/min to simulate the WF process until the water cut reached the desired value. Then, steam at a temperature of 340 °C together with the nitrogen foam or displacing agent was injected into the 1-D reservoir model at a constant injection rate. The experiment was finished when the water cut reached 95%. During the aforementioned process, the temperature distributions, pressures, and mass of produced oil and water were recorded continuously.
In total, seven experiments were conducted to investigate the effects of the timing of SF, the steam injection rate, and chemical agents (the nitrogen foam or displacing agent) on the performance of SF after WF. The experimental parameters in each experiment are summarized in Table 2.

4.2. 3-D Experiments

After the 3-D reservoir model was cleaned up thoroughly, the horizontal injection and production wells, pressure transducers, and thermocouples were installed in the assigned locations in the 3-D reservoir model in Figure 2c. Then, the 3-D reservoir model was filled with the silica sands and clay and the leakage test was carried out. Thereafter the model was placed in the oven for more than 48 h until the temperature of each thermocouple in the model reached the reservoir temperature of 56 °C. The brine was injected into the 3-D reservoir model to determine its porosity and permeability. Finally, the heavy oil was injected from multiple inlets in different directions to better saturate the 3-D reservoir model and determine the initial oil saturation.
Subsequently, Experiments 8–11 were conducted following the aforementioned procedures for the 1-D experiments to further investigate the effects of the steam injection rate and chemical agents on the performance of SF after WF. It is noted that Experiments 8 and 9 are SF after the WF process with different steam injection rates and without adding the chemical agents. However, in Experiments 10 and 11, 0.1 PV (pore volume) of nitrogen foam and 0.1 PV displacing agent were successively injected into the 3-D reservoir model after the WF process. Then, the steam was injected with different injection rates until the water cut reached 95%. The specific experimental parameters for the four experiments are summarized in Table 2.

5. Results and Discussion

5.1. 1-D Experiments

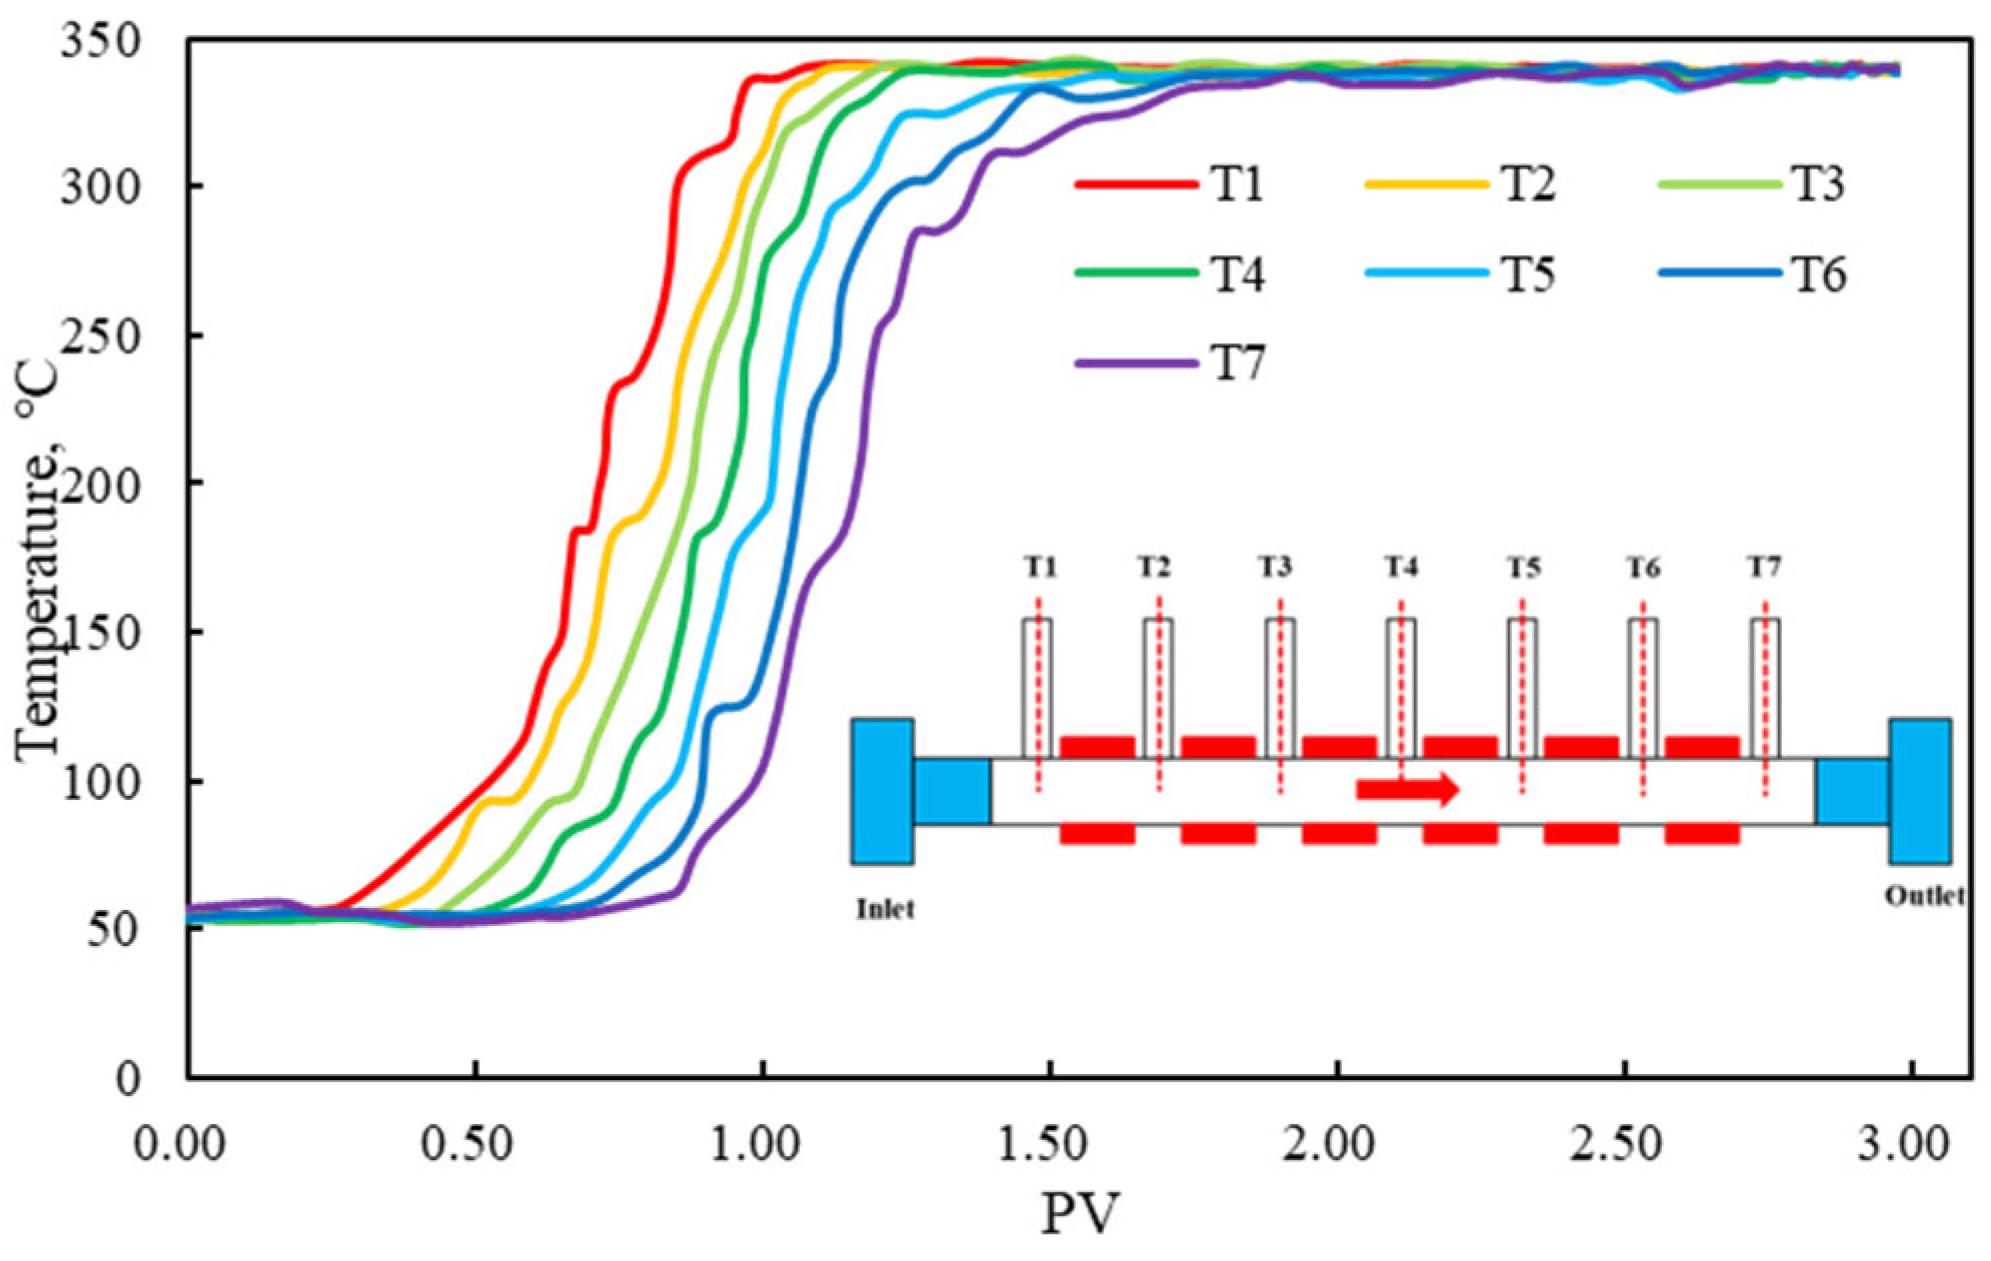
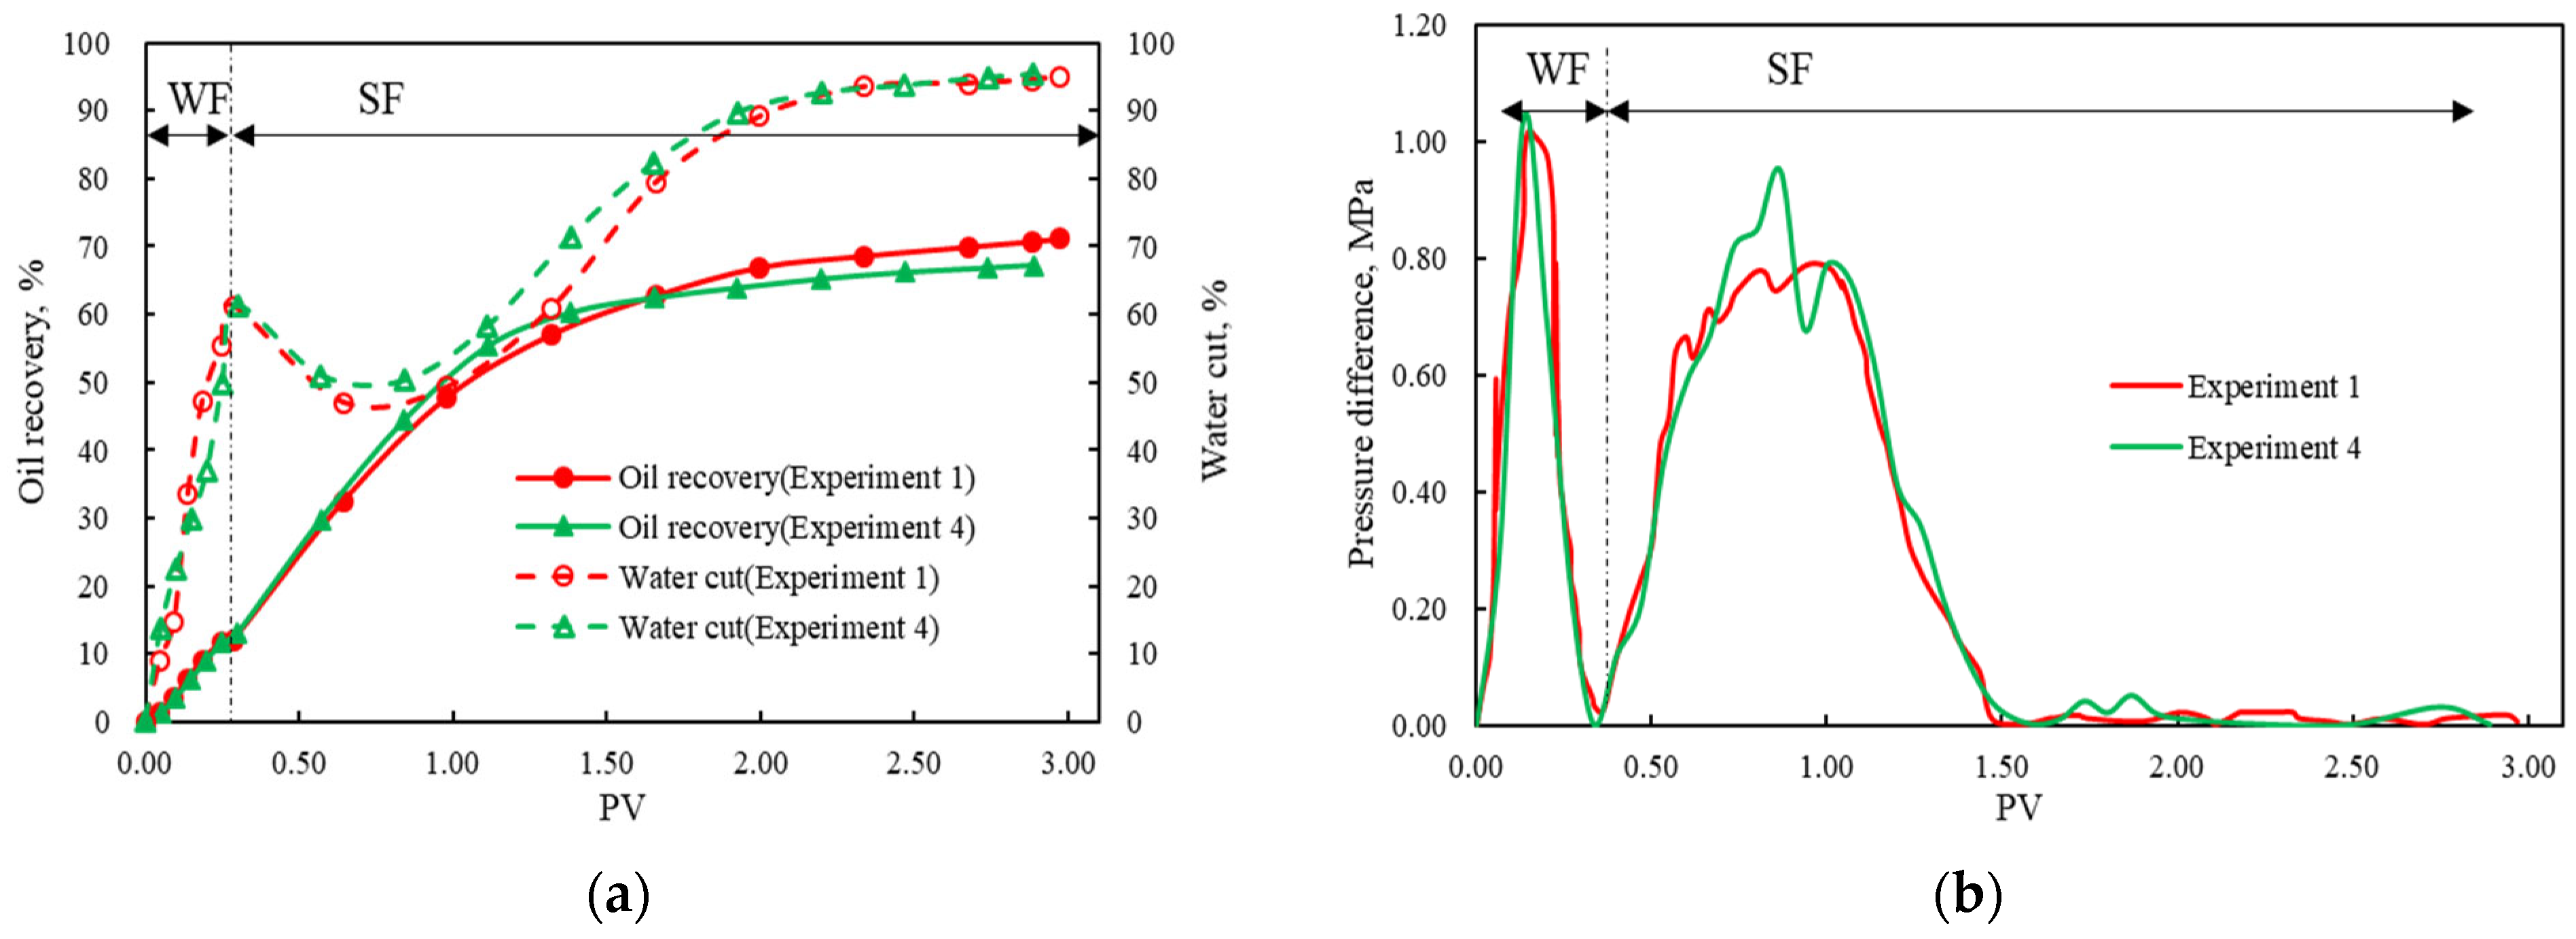
5.1.1. Characterization of the SF After WF in the 1-D Reservoir Model

To characterize the SF after the WF process, an in-depth analysis was conducted in Experiment 1. For Experiment 1, the brine was injected into the 1-D reservoir model at an injection rate of 5 mL/min to simulate the WF process until the water cut reached 60% (Table 2). Then, steam at a temperature of 340 °C was injected into the 1-D reservoir model at an injection rate of 5 mL/min. The experiment was finished when the water cut reached 95%. The measured pressures, production data, and temperature distributions are shown in Figure 3 and Figure 4. The flooding process can be characterized into two stages, WF and SF. During the WF stage (0–0.28 PV), the water first flowed into the 1-D model, resulting in a great driving force around the model inlet. Therefore, the pressure difference increased rapidly to the maximum value of 1.02 MPa at 0.15 PV. Then, water channeling gradually formed due to the continuous water injection, resulting in a sharp reduction of pressure difference (Figure 3a), a slow increase in oil recovery, and a rapid increase in water cut (Figure 3b).
In the early stage of the SF process (0.29–0.96 PV), the steam began to be injected into the 1-D reservoir model, and the temperature of all the temperature transducers rapidly increased (Figure 4). Therefore, it is inferred that the oil viscosity decreased markedly with the injection of the high-temperature steam [38,39], which led to a great increase in oil recovery and pressure difference, as well as a large reduction in water cut (Figure 3). It is noted that the maximum pressure difference of SF is lower than that of WF due to the higher oil mobility during the SF process.
In the middle stage of the SF (0.97–1.47 PV), the temperatures of T1–T4 reached the injection temperature of 340 °C, and the temperatures of T5–T7 rose persistently (Figure 4). Furthermore, the pressure difference sharply decreased as the steam was injected continuously. The results indicated that the steam front advanced constantly and approximately reached the model outlet. Therefore, the water cut sharply increased and the oil recovery slowly increased in this stage (Figure 3b). After the steam front had completely reached the model outlet (1.48–2.97 PV), all the temperature transducers arrived at a temperature of 340 °C (Figure 4), indicating that stable steam channeling was formed. Therefore, the pressure difference was constant, and the oil recovery and water cut rose slowly compared with the previous stages (Figure 3a).

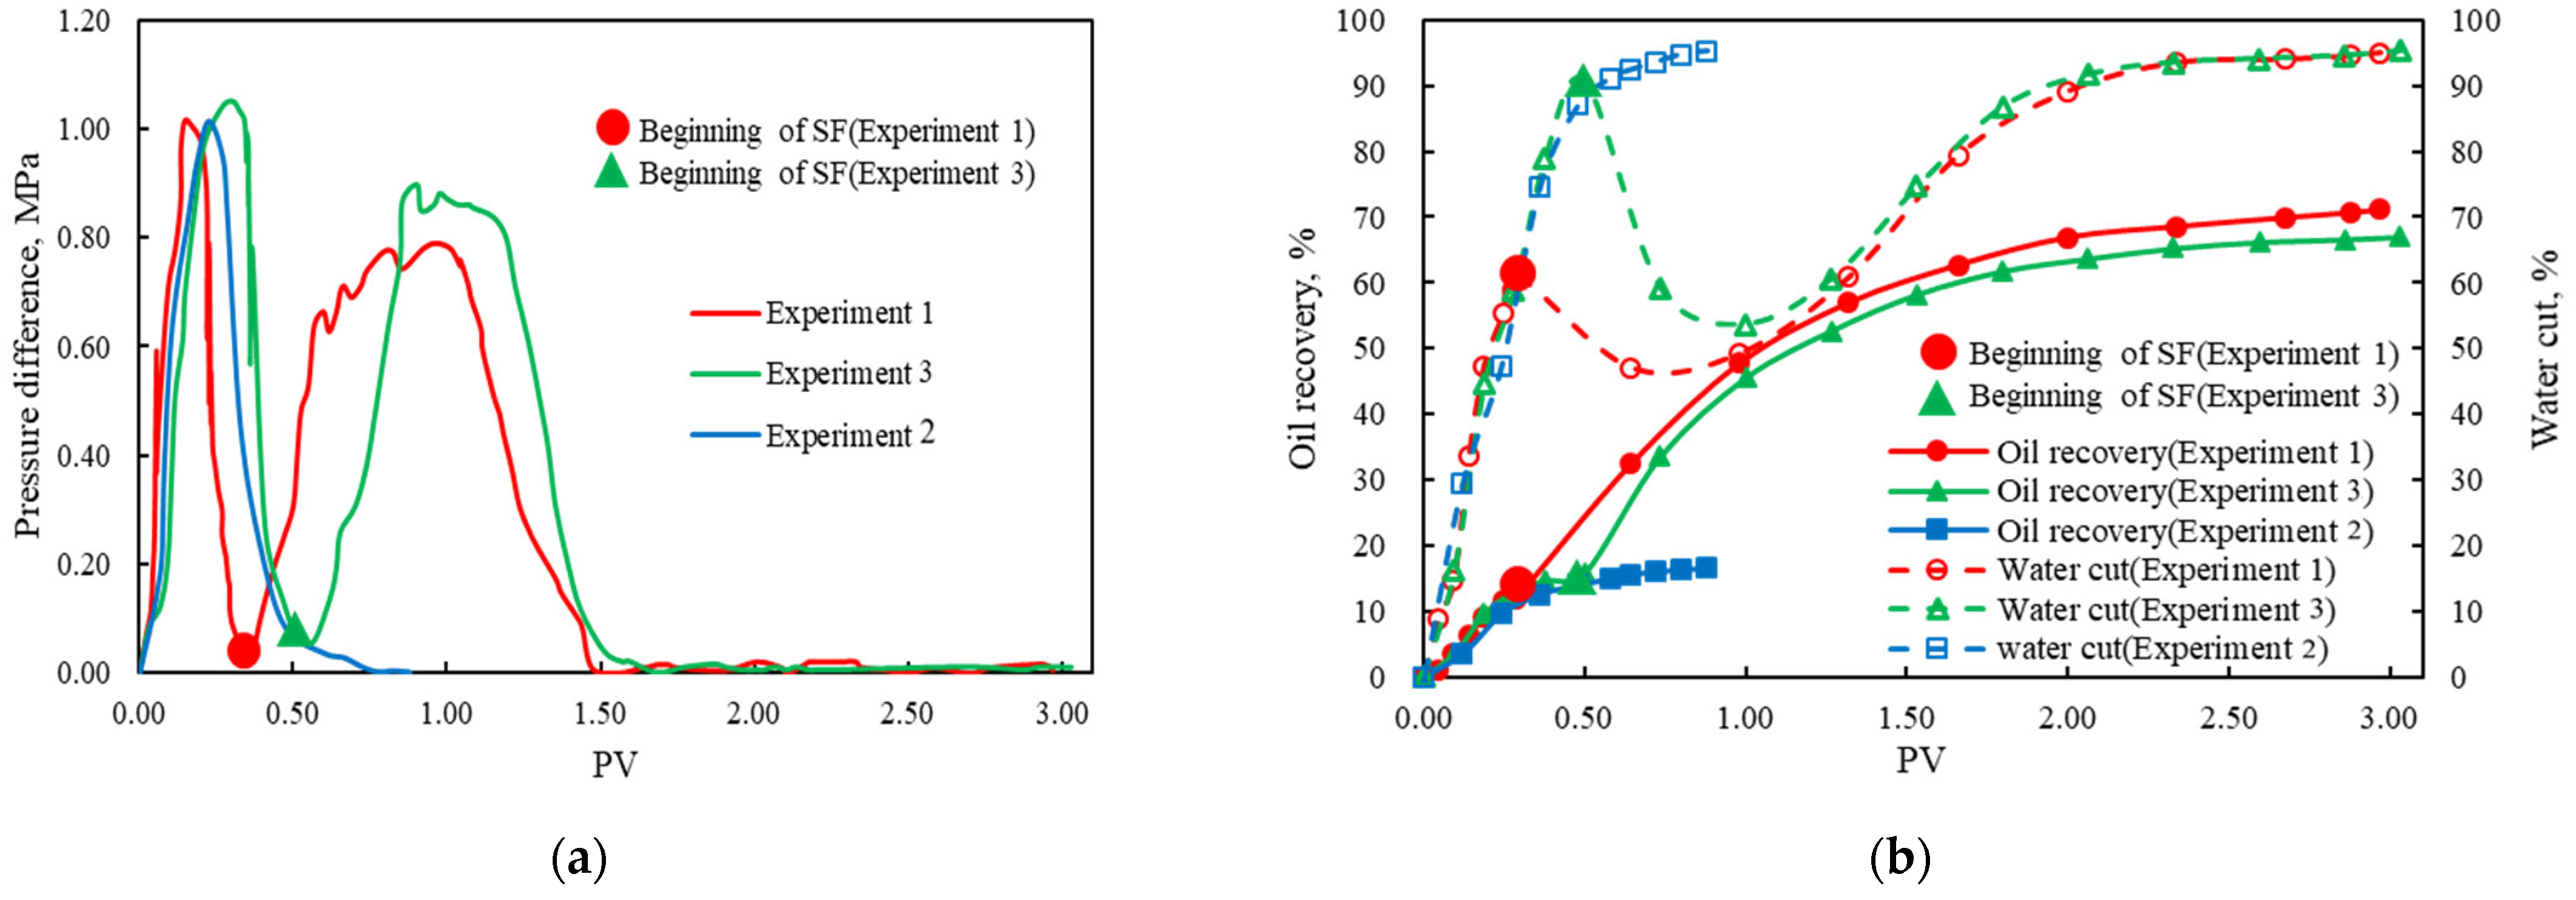
5.1.2. Feasibility of the SF After the WF Process

To investigate the feasibility of SF after the WF process, Experiments 1–3 were conducted. Experiment 2 is a WF process and Experiments 1 and 3 include SF after the WF process, in which the SF was performed when the water cut of WF was 60% and 90%, respectively. As shown in Figure 3, the oil recovery of the WF process in Experiments 2 is 16.64%, and the oil recovery of the SF processes in Experiments 1 and 3 was 71.13% and 67.01%, respectively, an increase of 54.49% and 50.37% compared with that of Experiment 2.
In addition, it can be seen from Figure 3 that the water cut curve of Experiments 1 and 3 shows a “concave” trend, indicating that the SF process can effectively reduce the water cut of the WF process. In conclusion, compared with the WF, the SF can effectively enhance oil recovery and decrease the water cut. Therefore, SF is a viable enhanced oil recovery method for offshore heavy oil reservoirs after the WF process.
It is noted that the practical applications of SF processes in offshore heavy oil reservoirs faces many challenges. From an economic standpoint, the utilization of SF processes would result in high requirements for steam generator, injection, and production systems, which would considerably increase the investment. In addition, steam generation is more energy intensive (relative to conventional WF processes), adding a substantial cost to the project. This problem is amplified by a more significant creation and emission of greenhouse gases (GHG), resulting in an environmental impact. In sum, incremental facility costs, energy consumption, and GHG emissions are the main challenges associated with SF processes compared with the conventional WF processes for offshore heavy oil reservoirs. Therefore, in a future study, the performance of SF will be compared with these of the other commonly used EOR methods (e.g., SAGD, CSS, and cyclic steam flooding). The feasibility of SF after the WF process will be further investigated by reservoir numerical simulations and actual applications in offshore heavy oil reservoirs, which will consider the economic factors.

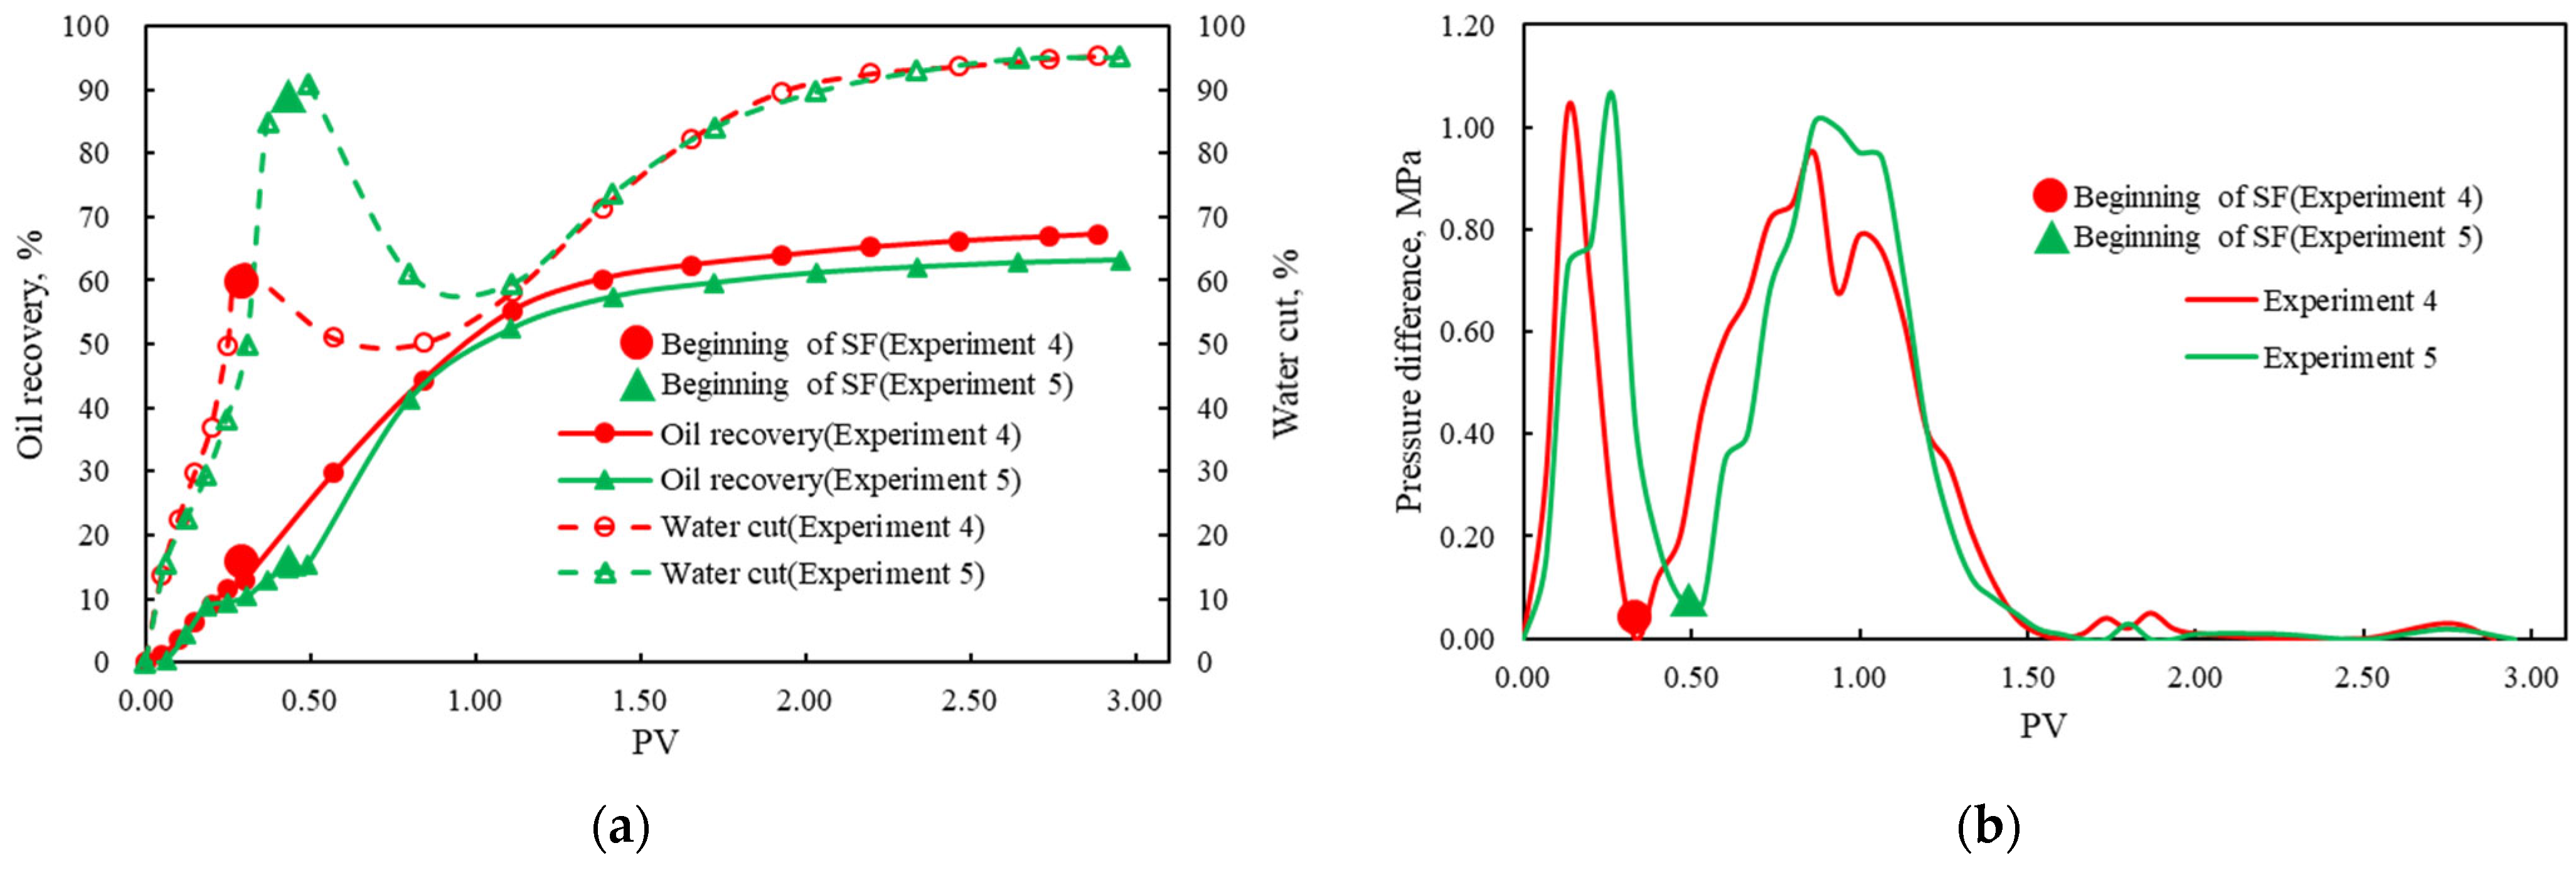
5.1.3. Effect of the Timing of SF

To investigate the effect of the timing of SF, Experiments 1 and 3 were conducted, in which the SF was performed when the water cut of WF was 60% and 90%, respectively. The effect of timing on the performance of SF is shown in Table 2 and Figure 3. It is indicated that the oil recoveries of the WF process in Experiments 1 and 3 are 12.00% and 15.83%, respectively. The final oil recoveries were 71.13% and 67.01%, which increased by 59.13% and 51.18% after the SF processes, respectively. In addition, the water cut largely decreased to minimum values of 47.01% and 53.69%, respectively, during the SF processes. The aforementioned experiment results showed that steam injection at the two different water cuts can improve oil recovery after the WF process in each case.
The results from Table 2 and Figure 3 also show that, compared to Experiment 3, the final oil recovery of Experiment 1 correspondingly increased by 4.12% and the water cut of Experiment 1 obviously became lower (Figure 3b). In addition, the time for the large pressure difference in Experiment 1 was longer (Figure 3a), indicating that the breakthrough time of Experiment 1 occurred later. Therefore, it can be concluded that the earlier that SF started, the better the performance of offshore heavy oil reservoirs after WF processes was. The results contribute to the fact that, when the SF started earlier, the residual oil saturation after the WF process was high, and the water channeling had not yet formed, which was beneficial for the subsequent SF process.
Similarly, in Experiments 4 and 5, the SF processes were also performed when the water cuts of WF were 60% and 90%, respectively. However, the steam injection rates in Experiments 4 and 5 were 10 mL/min, which is twice those of Experiments 1 and 3. As shown in Figure 5 and Table 2, the final oil recovery of Experiment 4 is 67.25%, which was 4.04% higher than that of Experiment 5 (63.21%). In addition, Experiment 4 shows a lower water cut in Figure 5a and a longer time for the large pressure difference in Figure 5b compared with those of Experiment 5. The results of Experiments 4 and 5 are consistent with these of Experiments 1 and 3. Therefore, for offshore heavy oil reservoirs after the WF process, SF should be conducted as early as possible if the economic conditions permit.

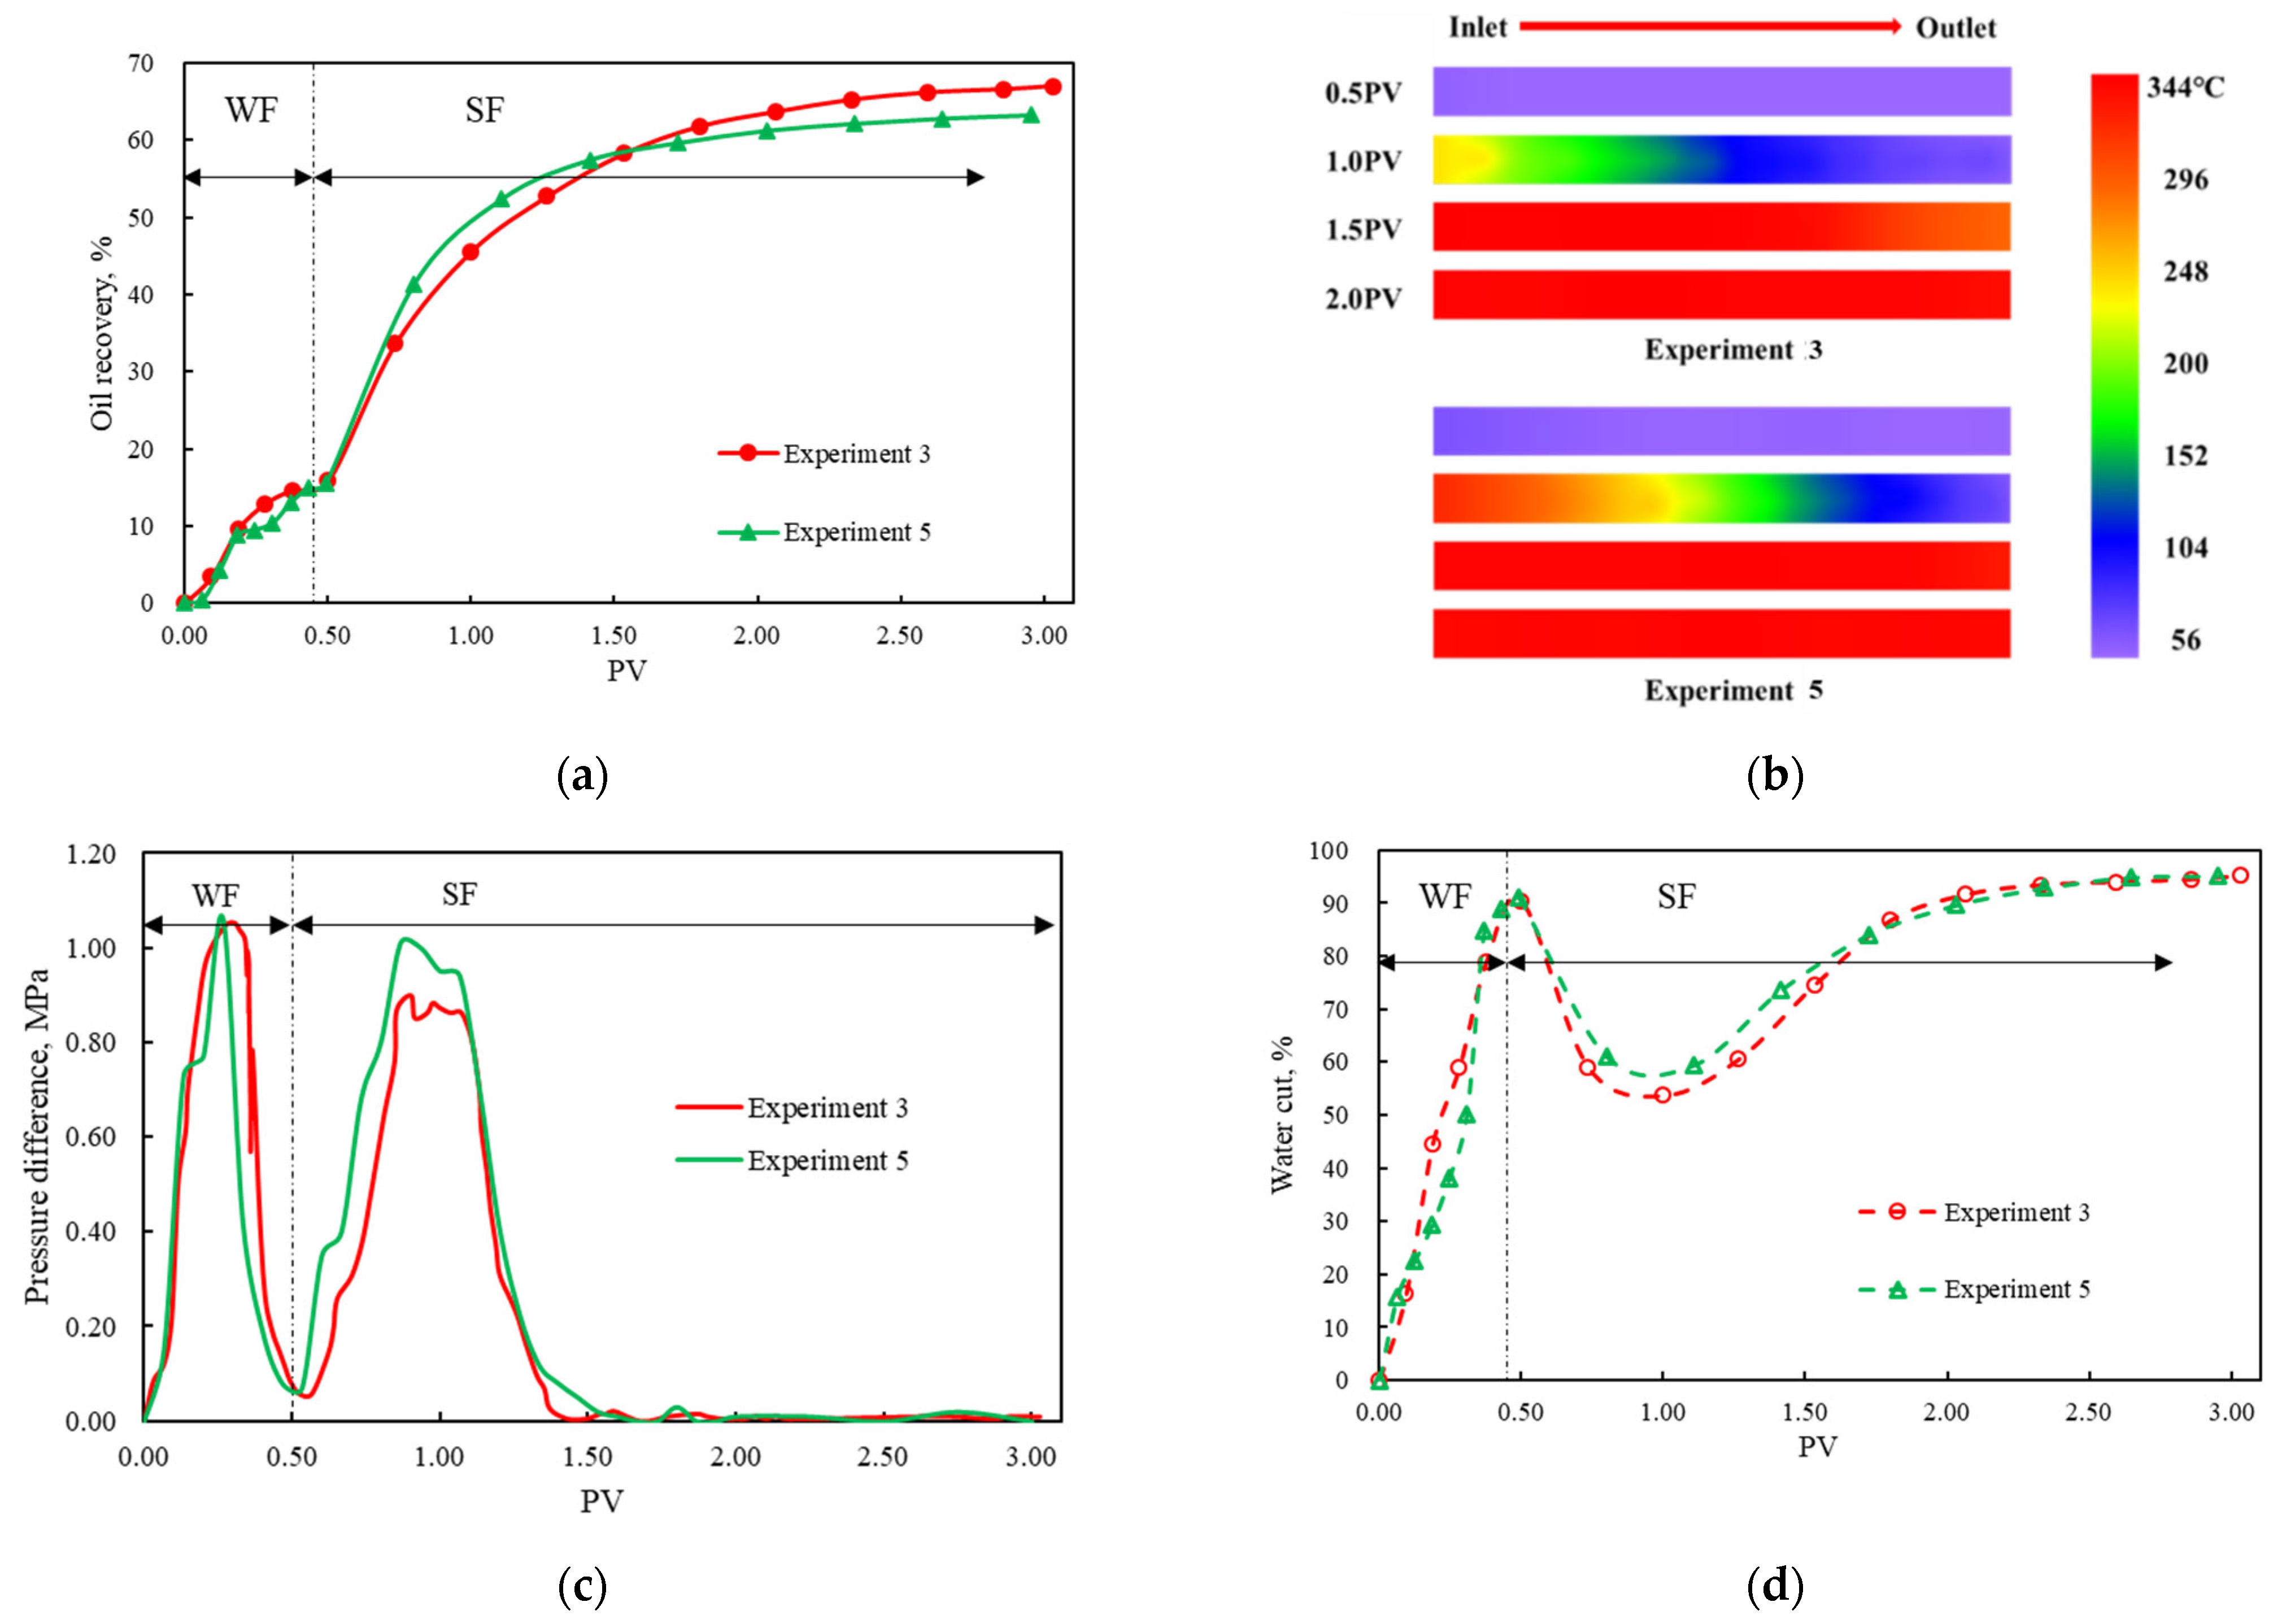
5.1.4. Effect of the Steam Injection Rate

Experiments 1 and 4 were conducted with steam injection rates of 5 mL/min and 10 mL/min, respectively, but the other operational parameters were the same. The results in Table 2 and Figure 6 show that, at the beginning of SF (0.3–1.65 PV), Experiment 4 had a higher oil recovery compared with Experiment 1. The reason for the better performance of SF at a higher injection rate was the more efficient heat transfer between steam and oil and a larger driving force. In addition, a higher steam injection rate increased the volume of steam available for heavy oil, resulting in a higher degree of heavy oil upgrading. Therefore, the viscosity of the heavy oil was lower and the mobility was higher in Experiment 4 compared with those in Experiment 1. However, a higher steam injection rate in Experiment 4 resulted in a faster steam breakthrough, which can be evidenced by the shorter time for the large pressure difference in Figure 6b. Therefore, Experiment 1 had a lower water cut and higher final oil recovery of 71.13%, 3.88% higher than Experiment 4.
Similarly, the effect of the steam injection rate also can be investigated by comparing the performance of Experiments 3 and 5, in which the SF started when the water cut was 90% during the WF process. As shown in Figure 7, during the early stage of the SF process, Experiment 5 had a higher oil recovery than Experiment 3 due to the higher steam injection rate. However, the excessively high injection rate in Experiment 5 resulted in a faster steam breakthrough, which can be evidenced by the faster movement of the thermal front at the same PV of injected steam in Figure 7b and a shorter time for the large pressure difference in Figure 7c. Therefore, Experiment 3 demonstrated a higher final oil recovery in Figure 7a and a lower water cut in Figure 7d than those of Experiment 5. For the experiments under different timings of SF (water cut of 60% and 90%, respectively), SF with a lower steam injection rate performs better. Therefore, the steam injection rate should not be too high for SF processes in offshore heavy oil reservoirs after WF processes.

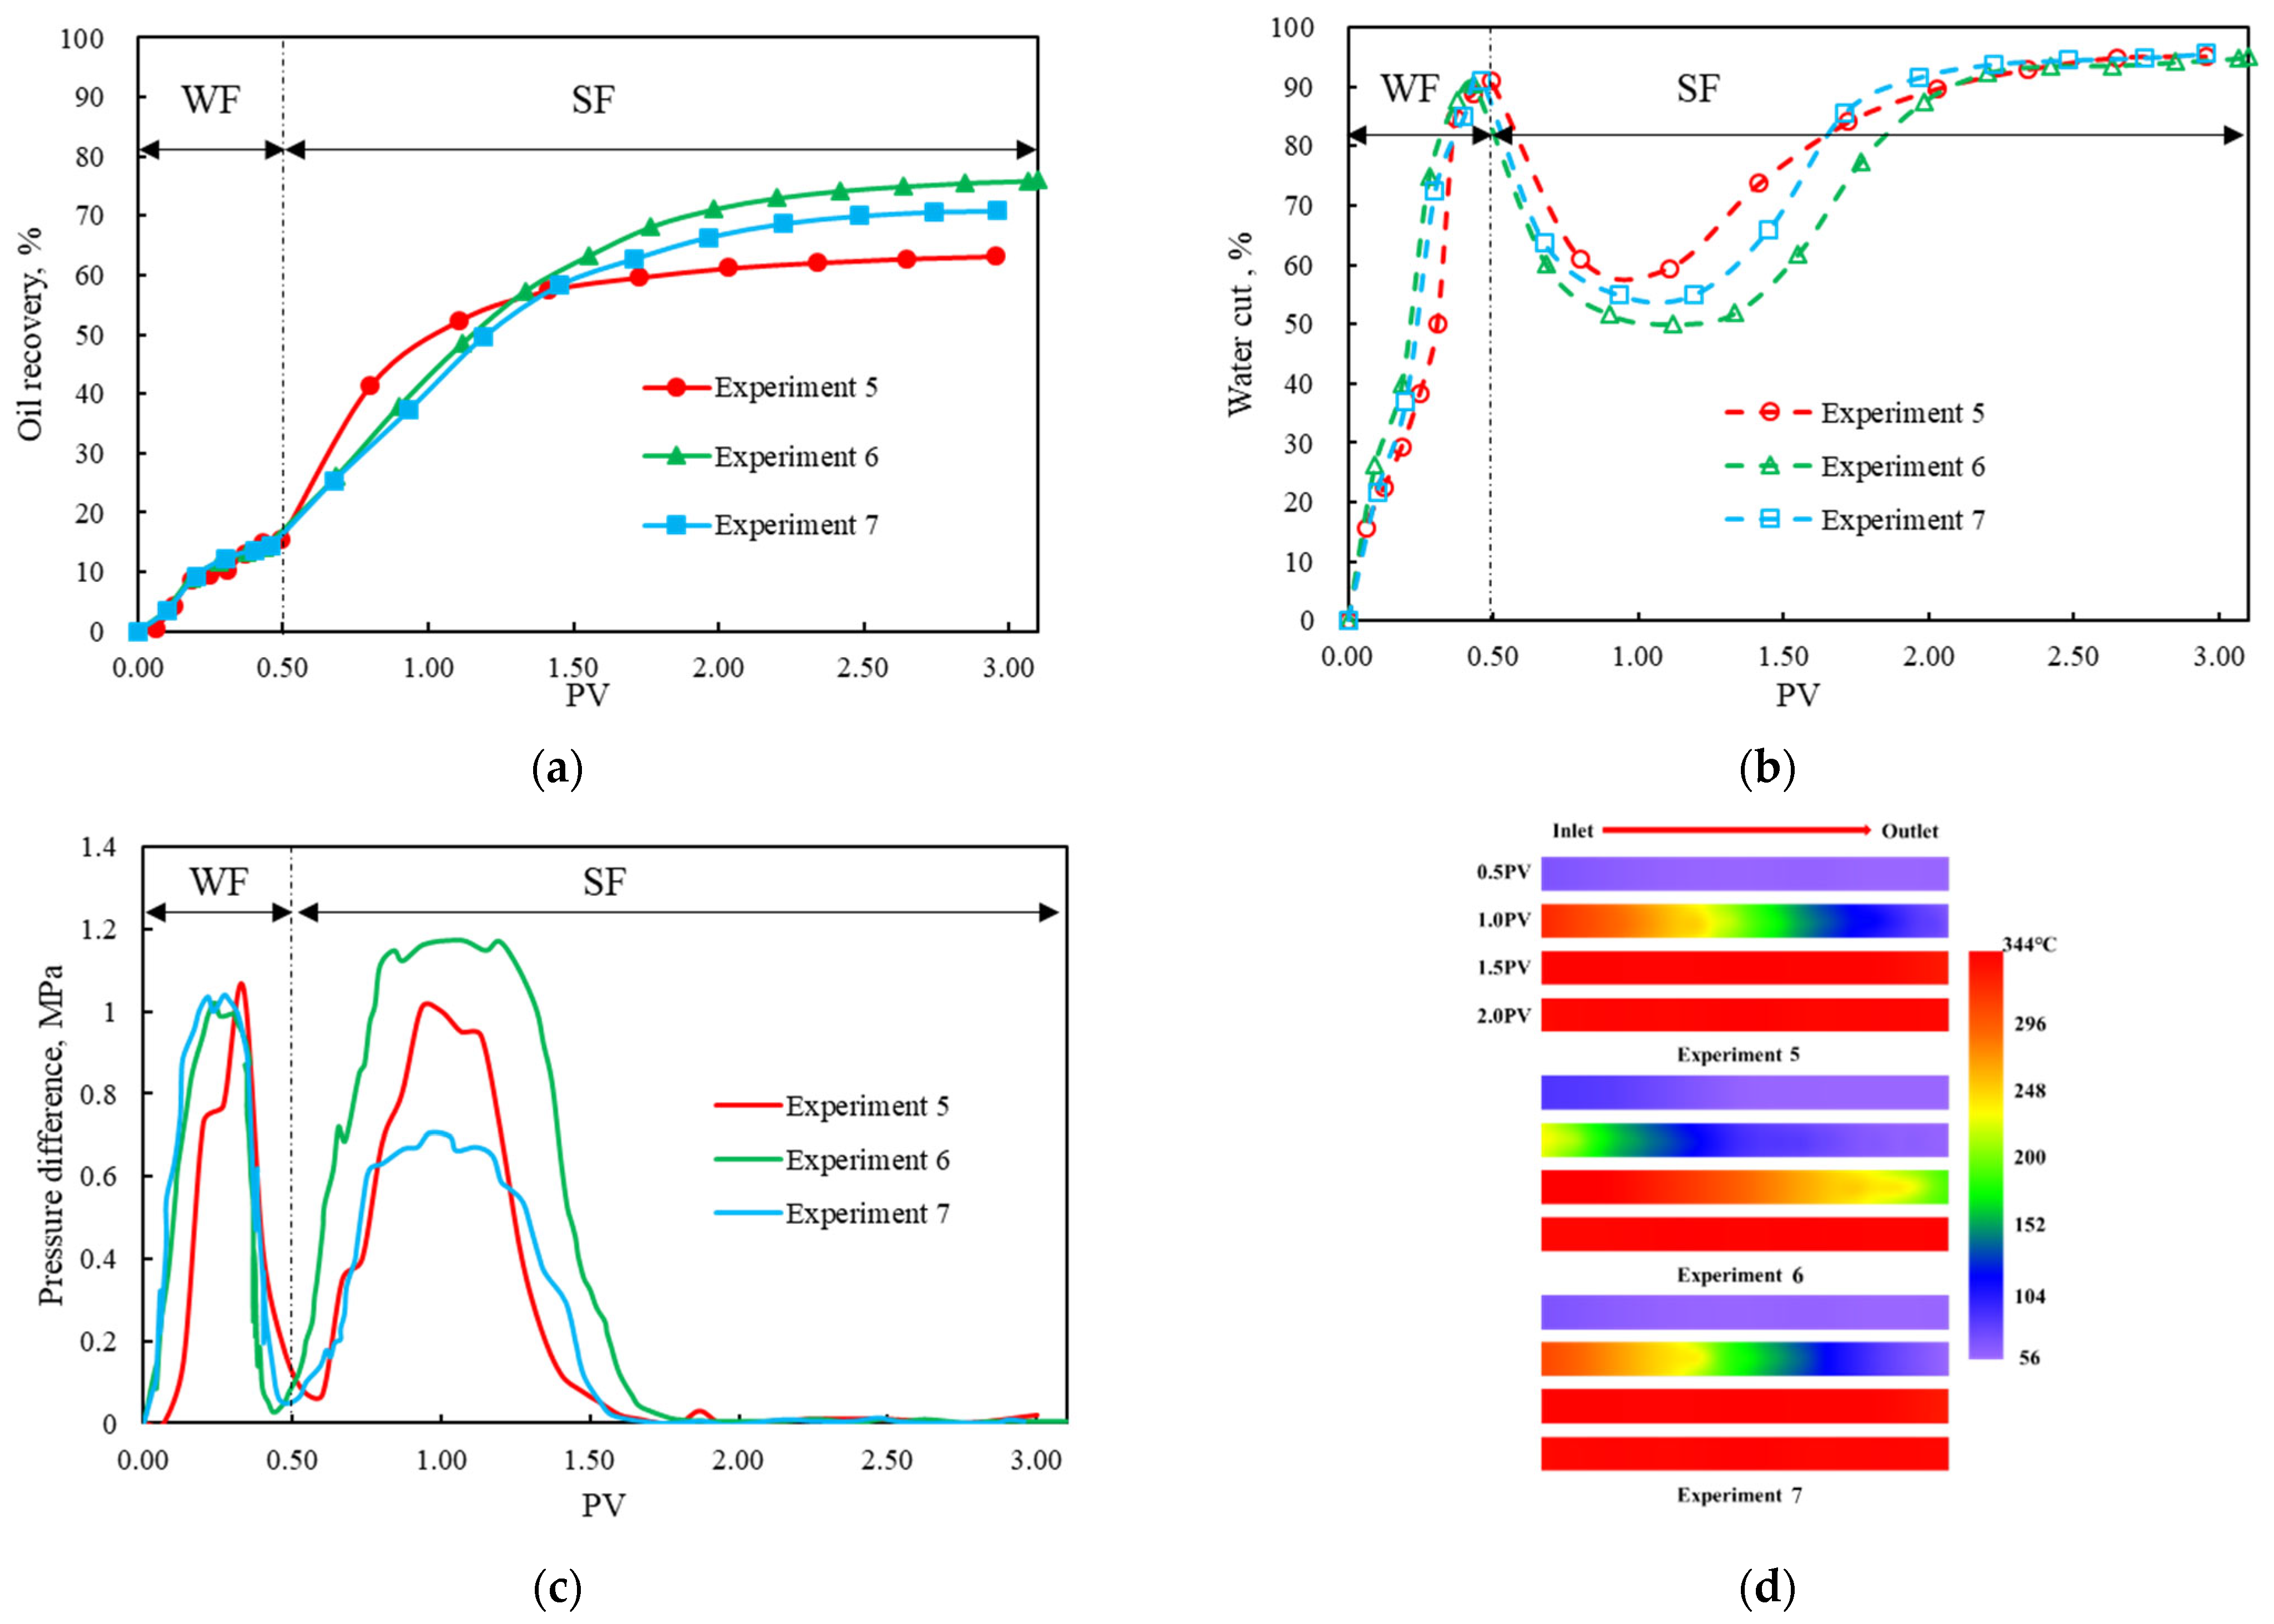
5.1.5. Effect of the Chemical Agents

Experiments 5, 6, and 7 were employed to determine the effects of the chemical agents on the performance of SF. Experiment 5 consisted of pure SF without the addition of the chemical agents. Experiments 6 and 7 were SF with the addition of nitrogen foam and displacing agent, respectively. The other operational parameters of Experiments 5, 6, and 7 were the same, as shown in Table 2.
As shown in Figure 8, the addition of chemical agents had a significant effect on the performance of the SF process. A comparison of Experiments 5 and 6 showed that the SF process with the addition of nitrogen foam had a higher final oil recovery (Figure 8a), a lower water cut (Figure 8b), a higher pressure difference, and a longer time for large pressure difference (Figure 8c). For example, the final oil recovery increased from 63.21% to 76.04% and water cut decreased rapidly from 90.54% to 50.07% as the nitrogen foam was injected. In addition, the temperature distributions presented in Figure 8d indicate that the steam front of Experiment 6 moved more slowly than that of Experiment 5. The aforementioned results are attributed to the fact that the addition of nitrogen foam selectively blocked the water channeling, with high permeability formed in the previous WF process, resulting in the delayed occurrence of steam breakthrough. Furthermore, the foaming agent as a surfactant reduced the oil–water interfacial tension, resulting in the increased final oil recovery.
Figure 8 also shows a comparison between Experiments 5 and 7, indicating that the addition of the displacing agent in the injected steam led to a higher final oil recovery, a lower water cut, and a longer duration of high pressure difference. To be more specific, the final oil recovery of Experiments 5 reached 63.21%, with a maximum reduction of water cut of 30.53%. For Experiment 7, the final oil recovery reached 70.79%, with a maximum reduction of water cut of 35.97%. In addition, the addition of the displacing agent delayed the movement of the thermal front (Figure 8d) and the steam breakthrough during the SF process. The better performance of Experiment 7 compared to Experiment 5 points to the importance of the displacing agent in the SF process because the displacing agent, composed of two surfactants, altered the wettability of sand surface from oil-wet to water-wet and increased the displacement efficiency by emulsification and IFT reduction and, in turn, improved the performance of the SF process [40,41].
In conclusion, for 1-D experiments, both the injection of nitrogen foam and displacing agent yielded encouraging results in the performance of the SF process. Therefore, the synergistic effect of the nitrogen foam and displacing agent were studied in the follow-up 3-D experiments.

5.2. 3-D Experiments

5.2.1. Characterization of the SF After WF in the 3-D Reservoir Model

Because the previous experiments were performed in the 1-D reservoir model, the effects of some important factors, such as the well type, sweep efficiency, and gravity, on SF after WF processes are not considered in the experiments. Therefore, 3-D experiments are needed to further identify the characteristics of SF after WF processes.
Experiment 8 was selected as an example for further analysis of the characterization of the SF after WF processes. As shown in Figure 9, in the early stage of the WF process (0–171 min), the oil recovery rapidly reached 16.18% and the water cut presented an obvious ascent trend (Figure 9a). In addition, the pressure difference largely increased from 0 MPa to the maximum value of 0.32 MPa (Figure 9b). However, the large difference between the water and oil mobility resulted in the formation of water channeling in the later stage of the WF process (171–885 min). This was evidenced by the significant decrease in the pressure difference in Figure 9b. Therefore, the oil recovery increased by only 11.24% and the water cut rose slowly in this stage (Figure 9a). During the follow-up SF process (885–1292 min), the oil recovery increased and the water cut decreased sharply from 91.67% to 59.44% (Figure 9a). The possible explanations for the better performance of SF are that, as the high-temperature steam was continuously injected from the injection well into the model, the thermal front gradually advanced to the horizontal production well, resulting in an increase in temperature and heavy oil mobility. However, due to the stable water channel formed in the WF process, steam breakthrough rapidly occurred after 30 min of steam injection (the differential pressure dropped significantly, as shown in Figure 9b). Thus, the water cut increased gradually up to 95% at 1292 min (Figure 9a). Compared with the WF process, the final oil recovery increased by 4.25% after the SF process and the production time extended to 161 min when the water cut reached approximately 90% again. Therefore, the SF process is a viable method for offshore heavy oil reservoirs after the WF process.
The characteristics of temperature distributions during the SF process are presented in Figure 10. The temperature distributions can reflect the swept areas of steam in the 3-D reservoir model. After 1 h of the SF process, the steam chamber quickly expands from the horizontal injection well to the production well and steam channeling mainly occurs along the heels of the two wells (Figure 10b). In addition, because of the density difference between the steam and heavy oil, the injected steam overrode, resulting in a high temperature in the upper part of the 3-D reservoir model (Figure 10b). After 3 h of the SF process, the model temperature increased significantly and the steam chamber constantly extended in the 3-D reservoir model. It is noted that there is no significant increase in the temperature near the toe of the production well, even after 3 h of the SF process, due to the steam channeling between the heels of the two horizontal wells. Therefore, a large amount of residual oil was distributed near the toe of the horizontal production well in which the injected steam was not effectively swept.

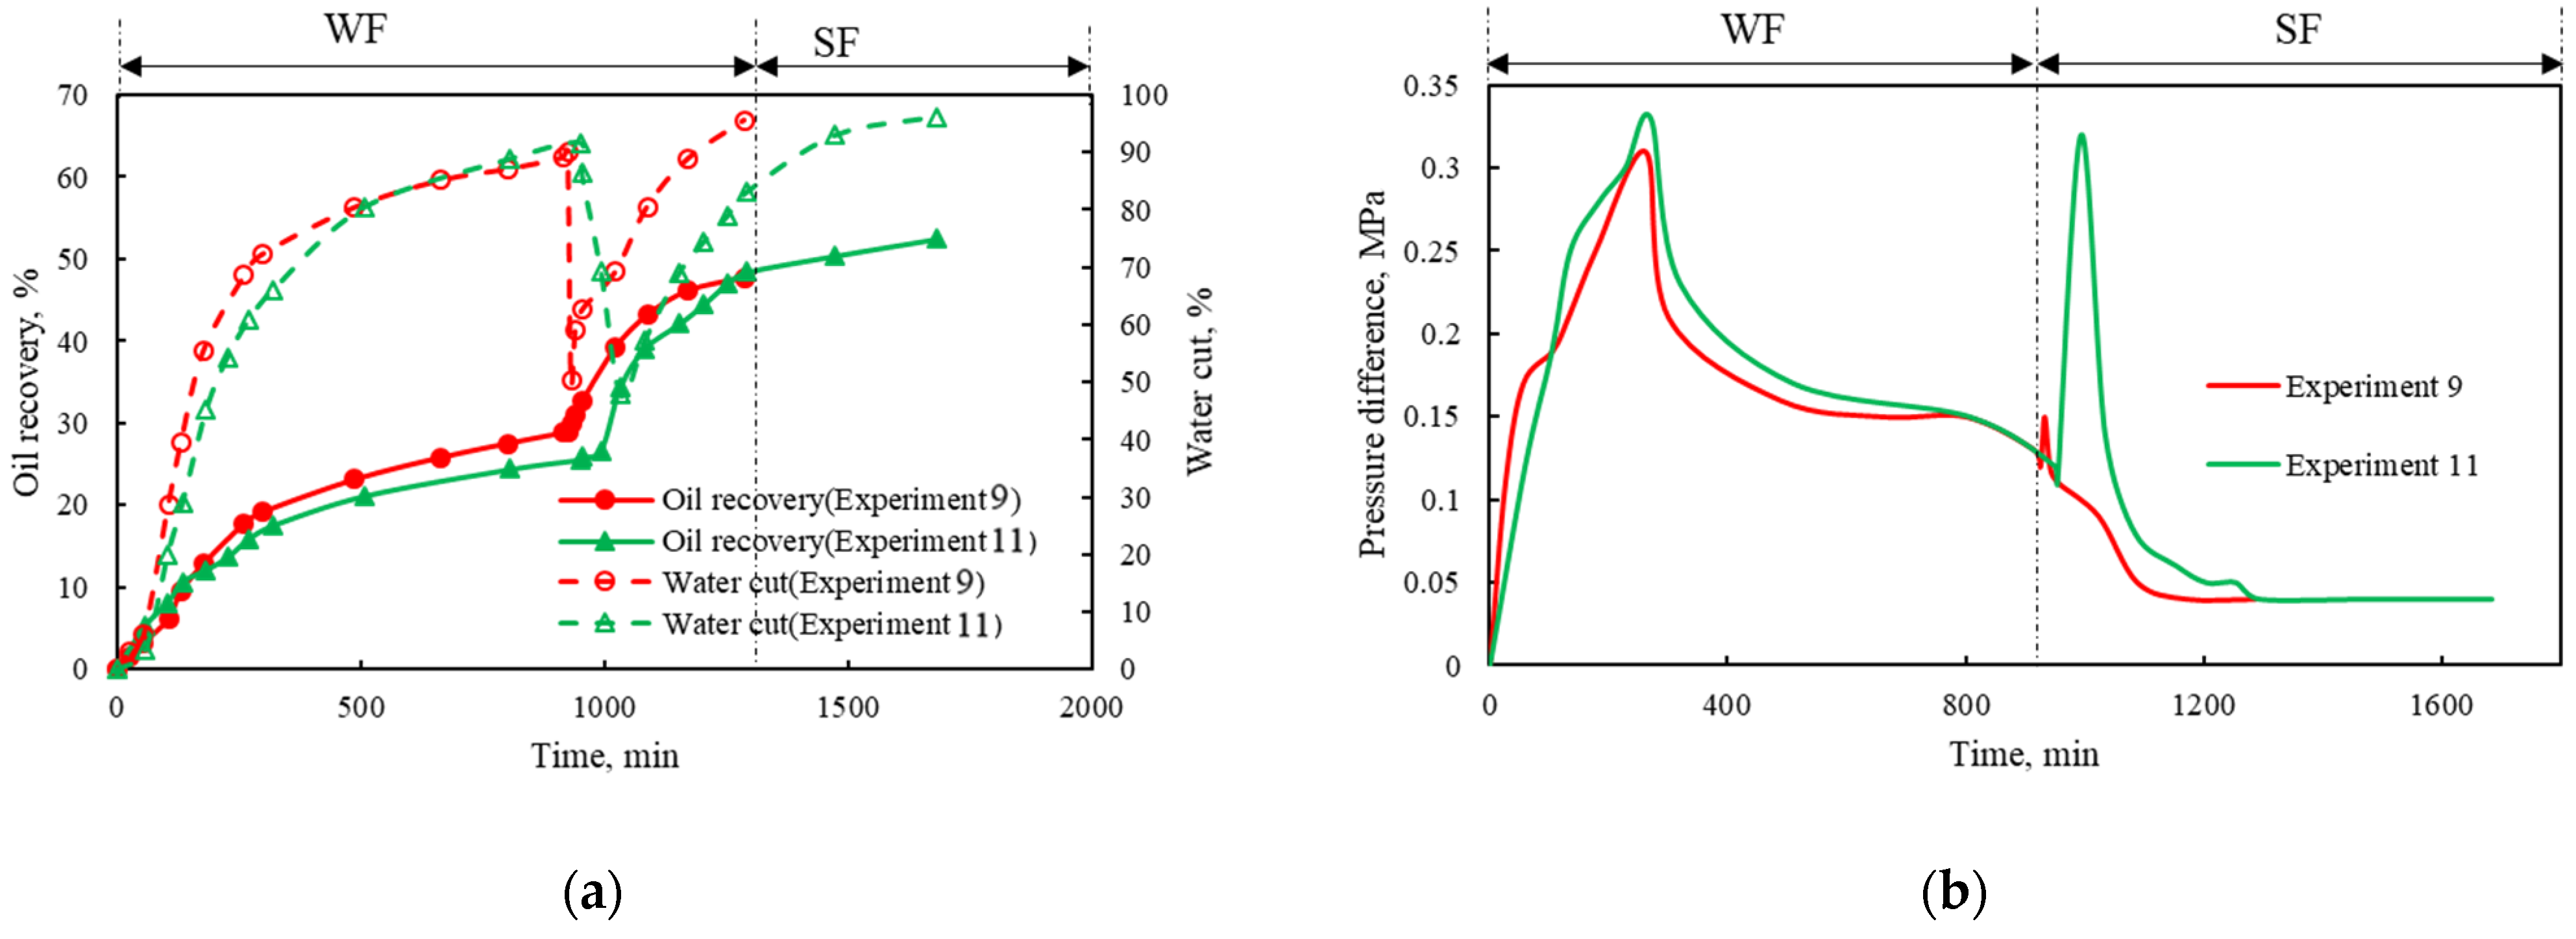
5.2.2. Effect of the Steam Injection Rate

To further investigate the effects of the steam injection rate on the performance of SF after WF, Experiments 8 and 9 were carried out with a steam injection rate of 10 mL/min and 30 mL/min, respectively. The results of Experiments 8 and 9 are presented in Figure 9. As shown in Figure 9a, the final oil recoveries of Experiments 8 and 9 were 32.17% and 47.74%, respectively. The results indicated that the final oil recovery was enhanced with the increase in steam injection rate in the 3-D reservoir model. In addition, a higher steam injection rate results in a larger maximum reduction of water cut (Figure 9a) and a higher maximum pressure difference (Figure 9b). Therefore, increasing the steam injection rate is beneficial for improving the performance of SF after WF process in the 3-D reservoir model.
The reason is that increasing the steam injection rate resulted in a high sweep efficiency, a delayed steam breakthrough, and a higher reservoir temperature. This point can also be proved by comparing the temperature distributions of Experiments 8 and 9. As shown in Figure 10, when the steam injection rate was 10 mL/min (Experiment 8), the swept area of steam was mainly around the heels of the injection and production wells. However, when the steam was 30 mL/min (Experiment 9), the swept area of steam was obviously enlarged to the toe of the injection well in horizontal profile. The steam breakthrough occurred later when the steam injection rate was 30 mL/min. In addition, the SF process with a higher injection rate led to a higher temperature in the steam chamber.
The aforementioned experimental results in the 3-D reservoir model were different from those in the 1-D reservoir model. For 1-D experiments, the SF process with a lower steam injection rate has better performance. However, the performance of the SF process was enhanced with the increase in steam injection rate in the 3-D experiments. The inconsistent results may result from the different experimental models and operational parameters. Comprehensively considering the results of 1-D and 3-D experiments, we can conclude that it is extremely important to choose an appropriate steam injection rate for SF after the WF process.

5.2.3. Effect of Chemical Agents

According to the results of the 1-D experiments (Experiments 5, 6, and 7), the SF processes with the addition of the nitrogen foam or displacing agent both yield better performance than the pure SF process. Thus, it is necessary to further study the synergistic effect of the nitrogen foam and displacing agent on the performance of the SF process in the 3-D reservoir model. As presented in Table 2, Experiment 10 followed the same operating conditions as those of Experiment 8, except that a nitrogen foam slug and a displacing agent slug were injected in turn before the steam injection.
The experimental results of the pure SF and SF with the addition of chemical agents, as shown in Figure 11 and Figure 12, show that the final oil recovery of Experiment 10 was 37.64%, which was 5.47% higher than that of Experiment 8. Meanwhile, the maximum reduction of water cut in Experiment 10 was 39.02%, 6.79% larger than that of Experiment 8. In addition, after the nitrogen foam slug and displacing agent slug were injected into the 3-D reservoir model, the pressure difference sharply increased to 0.26 MPa, which was 0.13 MPa higher than in Experiment 8 (Figure 11b). On the one hand, the injected nitrogen foam was distributed uniformly in the water channeling, which decreased the steam mobility. Therefore, the nitrogen foam effectively delayed the steam breakthrough and improved the injection profile to increase the sweep efficiency of steam. On the other hand, the injected displacing agent altered the wettability of sand surface from oil-wet to water-wet and increased the displacement efficiency by emulsification and IFT reduction. Therefore, adding those two chemical agents can effectively improve the performance of SF after the WF process.
Figure 10a and Figure 12a show the temperature distributions of Experiments 8 and 10, respectively. Compared to Experiment 8 (pure SF process), the steam chamber of Experiment 10 expanded more effectively in the entire model. Due to the low specific gravity of nitrogen, the injected nitrogen mainly occupied the upper part of the 3-D reservoir model, resulting in high pressure in the upper part of the 3-D reservoir model. Thus, the injected steam moved to the lower part of the model and the steam override was effectively restrained. Moreover, the nitrogen with a low thermal conductivity decreased the heat loss during the SF process and greatly increased the bottom-hole pressure, leading to a higher saturation temperature for the steam. In addition, due to the blocking effect of the nitrogen foam, the steam was forced to move to the toe of the horizontal production well in the horizontal profile, thereby increasing the sweep efficiency of steam and hindering the steam breakthrough. These points were demonstrated by the longer production time and higher final oil recovery of Experiments 10 (Figure 11a).
Similarly, the effects of the addition of chemical agents can also be investigated by comparing the performance of Experiments 9 and 11, in which the steam injection rates were 30 mL/min. As shown in Figure 13, Experiment 11 has a longer production time, a higher oil recovery, a lower water cut, and a longer duration of high pressure difference than those of Experiment 9. In addition, it can be observed from Figure 10c and Figure 12c that the steam chamber was larger and the temperature was higher in Experiment 11 because of the addition of the nitrogen foam and displacing agent. The results of Experiments 9 and 11 were consistent with those of Experiments 8 and 10. In conclusion, adding the two chemical agents can improve the performance of the SF after the WF process. Taking into account the efficiency of the experiments, only the effects of the steam injection rate and chemical agents were investigated in this study. More experiments and reservoir numerical simulations will be conducted to further investigate the effects of the other operational parameters with more values in the future.

6. Conclusions

Based on the results of 1-D and 3-D experiments, compared with WF, SF can effectively enhance oil recovery and decrease the water cut and pressure difference. Therefore, SF is a viable enhanced oil recovery method for offshore heavy oil reservoirs after WF processes.
  • For offshore heavy oil reservoirs after WF processes, the SF processes should start as early as possible if the economic conditions permit. When the SF started earlier, the residual oil saturation after the WF process was high, and the water channeling was not yet formed, which was beneficial for the subsequent SF process.
  • For 1-D experiments, the SF process with a lower steam injection rate has better performance. However, the performance of the SF process was enhanced with the increase in steam injection rate in the 3-D experiments. The inconsistent results may result from the different experimental models and operational parameters. Comprehensively considering the results of 1-D and 3-D experiments, it can be concluded that it is extremely important to choose an appropriate steam injection rate for SF after WF processes.
  • For 1-D experiments, the final oil recovery increased from 63.21% to 76.04% and the water cut decreased rapidly from 90.54% to 50.07% as the nitrogen foam was injected. The addition of nitrogen foam selectively blocked the water channeling, with high permeability formed in the previous WF process, resulting in the delayed occurrence of steam breakthrough. Furthermore, the foaming agent as a surfactant reduced the oil–water interfacial tension, resulting in increased final oil recovery.
  • For 1-D experiments, the addition of the displacing agent in the injected steam improved the performance of the SF process (s higher final oil recovery, a lower water cut, and a longer time for the large pressure difference) because the displacing agent in the SF process altered the wettability of sand surface from oil-wet to water-wet and increased the displacement efficiency by emulsification and IFT reduction and, in turn, improved the performance of the SF process.
  • The nitrogen foam and displacing agent had synergistic effects on the performance of the SF after the WF processes. Compared with the pure SF process, the SF process with the addition of the nitrogen foam and displacing agent had a higher final oil recovery, a higher maximum reduction of water cut, a larger pressure difference, a larger steam chamber, and a higher reservoir temperature in the 3-D experiments.
The practical applications of SF processes in offshore heavy oil reservoirs also faces many challenges, such as incremental facility costs, energy consumption, and GHG emissions. Therefore, in a future study, the feasibility of the SF after the WF process will also be further investigated by reservoir numerical simulations and actual applications in offshore heavy oil reservoirs, which will consider the economic factors.

Author Contributions

Conceptualization, W.Z. and Y.L.; Methodology, J.Z., Y.Z. and Q.W.; Validation, W.Z.; Investigation, Z.W.; Resources, Y.L.; Writing—original draft preparation, W.Z. and Y.Z.; Writing—review and editing, X.S.; Supervision, X.S. All authors have read and agreed to the published version of the manuscript.

Funding

This research was funded by the open fund project of CNOOC Key Laboratory of Offshore Heavy Oil Thermal Recovery (No. CCL2024TJT0NST1334).

Data Availability Statement

The original contributions presented in the study are included in the article; further inquiries can be directed to the corresponding authors.

Conflicts of Interest

Authors Wei Zhang, Yigang Liu, Jian Zou, Qiuxia Wang and Zhiyuan Wang were employed by the CNOOC Key Laboratory of Offshore Heavy Oil Thermal Recovery. The remaining authors declare that the research was conducted in the absence of any commercial or financial relationships that could be construed as potential conflicts of interest.

References

  1. Li, Q.; Li, Q.C.; Cao, H.Q.; Wu, J.J.; Wang, F.L.; Wang, Y.L. The crack propagation behaviour of CO2 fracturing fluid in unconventional low permeability reservoirs: Factor analysis and mechanism revelation. Processes 2025, 13, 159. [Google Scholar] [CrossRef]
  2. Li, Q.C.; Li, Q.; Wu, J.J.; Li, X.Z.; Li, H.B.; Cheng, Y.F. Wellhead stability during development process of hydrate reservoir in the northern south china sea: Evolution and mechanism. Processes 2025, 13, 40. [Google Scholar] [CrossRef]
  3. Kang, X.D.; Zhang, J. Surfactant Polymer (SP) Flooding Pilot Test on Offshore Heavy Oil Field in Bohai Bay, China. In Proceedings of the SPE Enhanced Oil Recovery Conference (SPE), Kuala Lumpur, Malaysia, 2–4 July 2013. [Google Scholar]
  4. Hein, F.J. Geology of bitumen and heavy oil: An overview. J. Pet. Sci. Eng. 2017, 154, 551–563. [Google Scholar] [CrossRef]
  5. Huang, S.J.; Cao, M.; Cheng, L.S. Experimental study on the mechanism of enhanced oil recovery by multi-thermal fluid in offshore heavy oil. Int. J. Heat Mass Transf. 2018, 122, 1074–1084. [Google Scholar] [CrossRef]
  6. Zhao, Q.Y.; Guo, L.J.; Wang, Y.C.; Jin, H.; Chen, L.; Huang, Z.J. Enhanced oil recovery and in situ upgrading of heavy oil by supercritical water injection. Energy Fuels 2020, 34, 360–367. [Google Scholar] [CrossRef]
  7. Zheng, W.; Tan, X.H.; Jiang, W.D.; Xie, H.J.; Pei, H.H. Investigation of nanoclay-surfactant-stabilized foam for improving oil recovery of steam flooding in offshore heavy oil reservoirs. ACS Omega 2021, 6, 22709–22716. [Google Scholar] [CrossRef] [PubMed]
  8. Sun, X.F.; Zhang, Y.Y.; Chen, H.J.; Duan, X.W.; Hu, W.T.; Zhang, X.S. Feasibility of Thermal Oil Recovery Processes in Offshore Heavy Oil Reservoirs: Simulations and Experiments. In Proceedings of the Offshore Technology Conference Asia (OTC), Kuala Lumpur, Malaysia, 22–25 March 2016. [Google Scholar]
  9. Li, Y.L.; Su, Y.C.; Yang, W.; Meng, P.; Wang, L.L. Research and Practice of Chemical Flooding on Offshore Heavy Oilfield in Bohai Bay of China. In Proceedings of the Offshore Technology Conference Asia (OTC), Kuala Lumpur, Malaysia, 27 October 2020. [Google Scholar]
  10. Dadlani, H.; Jain, G.; Saikia, S. Heavy Oil Polymer Pilot with Active Bottom Water Drive—A Success Story. In Proceedings of the SPE/IATMI Asia Pacific Oil & Gas Conference and Exhibition, Virtual, 4 October 2021. [Google Scholar]
  11. Zhong, L.; Dong, Z.; Hou, J.; Li, Y.; Sun, Y.; Zhao, L.; Lu, W.; Qin, F. Investigation on Principles of Enhanced Offshore Heavy Oil Recovery by Coinjection of Steam with Flue Gas. In Proceedings of the SPE Enhanced Oil Recovery Conference (SPE), Kuala Lumpur, Malaysia, 2–4 July 2013. [Google Scholar]
  12. Liu, Y.; Zou, J.; Meng, X.; Zhong, L.; Wang, Q.; Zhang, W.; Zhou, F.; Han, X. Progress in Bohai Offshore Heavy Oil Thermal Recovery. In Proceedings of the Offshore Technology Conference Asia (OTC), Kuala Lumpur, Malaysia, 22 March 2016. [Google Scholar]
  13. Sun, Y.T.; Zhao, L.C.; Lin, T.; Liu, H.T.; Sun, Y.P.; Zhong, L.G.; Dong, Z.X.; Hou, J.R.; Li, Y.Q. Case Study: Thermal Enhance Bohai Offshore Heavy Oil Recovery by Co-Stimulation of Steam and Gases. In Proceedings of the SPE Heavy Oil Conference-Canada, Calgary, AB, Canada, 11–13 June 2013. [Google Scholar]
  14. Liu, Y.G.; Zou, J.; Meng, X.H.; Han, X.D.; Sun, Y.T.; Zhang, W.; Zhou, F.Y.; Fang, J.C. Treatment Technology of Steam Breakthrough for Offshore Heavy Oil Reservoirs Developed by Huff and Puff with Multi-Component Thermal Fluid. In Proceedings of the SPE Asia Pacific Enhanced Oil Recovery Conference, Kuala Lumpur, Malaysia, 11–13 August 2015. [Google Scholar]
  15. Qin, W.T.; Luo, P.Y.; Wojtanowicz, A.K. Improving Oil Recovery in Offshore Heavy Oil Underlain by Large Aquifer. In Proceedings of the SPE Improved Oil Recovery Conference, Tulsa, OK, USA, 11–13 April 2016. [Google Scholar]
  16. Kukharova, T.; Maltsev, P.; Novozhilov, I. Development of a control system for pressure distribution during gas production in a structurally complex field. Appl. Syst. Innov. 2025, 8, 51. [Google Scholar] [CrossRef]
  17. Skoczylas, P.; Sawafi, M.; Salem, B.A.; Al Jabri, S.; Zadjali, A.; Ponomarenko, R. Successful Application of All-Metal PCP in CSS and Steam Flood to Unlock Hard-To-Recover Oil Resources. In Proceedings of the SPE Artificial Lift Conference and Exhibition—Americas, The Woodlands, TX, USA, 19 August 2024. [Google Scholar]
  18. Jimenez, J. The Field Performance of SAGD Projects in Canada. In Proceedings of the International Petroleum Technology Conference, Kuala Lumpur, Malaysia, 3–5 December 2008. [Google Scholar]
  19. Liu, J.F.; Wu, X.M.; Sun, S.G.; Hao, L. The Application of Complex Displacement in Cyclic Steam Stimulation CSS & Steam Flooding SF Development in Liaohe Oilfield: A Field Performance Study. In Proceedings of the SPE Canadian Energy Technology Conference, Calgary, AB, Canada, 11–13 March 2022. [Google Scholar]
  20. Aksenov, M.; Lachugin, D.; Nukhaev, M.; Rymarenko, K.; Telkov, V.; Gaidukov, L.; Vologodskiy, K.; Khramov, D. Specifics and Challenges of Heavy Oil Production in Northen Siberia Illustration Based on Biggest Heavy Oil Project in Russia. In Proceedings of the SPE Heavy Oil Conference-Canada, Calgary, AB, Canada, 11–13 June 2013. [Google Scholar]
  21. Agarwal, A.; Kovscek, A.R. Producer Well Temperature Control and Optimal Oil Production During a Steamflood. In Proceedings of the SPE Western Regional Meeting, Bakersfield, CA, USA, 23–27 April 2017. [Google Scholar]
  22. Yuan, Z.; Liu, P.C.; Zhang, S.F.; Li, X.L.; Shi, L.X.; Jin, R.F. Experimental study and numerical simulation of nitrogen-assisted SAGD in developing heavy oil reservoirs. J. Pet. Sci. Eng. 2018, 162, 325–332. [Google Scholar] [CrossRef]
  23. Dong, X.H.; Liu, H.Q.; Chen, Z.X.; Wu, K.L.; Lu, N.; Zhang, Q.C. Enhanced oil recovery techniques for heavy oil and oilsands reservoirs after steam injection. Appl. Energy 2019, 239, 1190–1211. [Google Scholar] [CrossRef]
  24. Sun, X.F.; Cai, J.M.; Li, X.Y.; Zheng, W.; Wang, T.C.; Zhang, Y.Y. Experimental investigation of a novel method for heavy oil recovery using supercritical multithermal fluid flooding. Appl. Therm. Eng. 2021, 185, 116330. [Google Scholar] [CrossRef]
  25. Sun, X.F.; Wei, C.K.; Zhang, Q.Q.; Cai, J.M.; Wang, X.; Wang, Y.; Zhang, Y.Y. Development of a generalized experimental methodology for investigating the role of steam quality on steamflooding performance. SPE J. 2023, 28, 401–414. [Google Scholar] [CrossRef]
  26. Pang, Z.X.; Qi, P.; Zhang, F.Y.; Ge, T.T.; Liu, H.Q. The experimental analysis of the role of flue gas injection for horizontal well steam flooding. J. Energy Resour. Technol. 2018, 140, 102902. [Google Scholar] [CrossRef]
  27. Zhang, Y.Y.; Chen, H.J.; Sun, X.F.; Duan, X.W.; Hu, W.T.; Zhang, X.S. Optimization of thermal recovery strategies for offshore heavy oil reservoirs in Bohai Bay, China. Pet. Sci. Technol. 2016, 34, 139–144. [Google Scholar] [CrossRef]
  28. Zhang, S.L.; Zhang, Y.T.; Wang, S.H.; Liu, S.Q.; Li, X.L.; Li, S.L. Status of Heavy-Oil Development in China. In Proceedings of the SPE International Thermal Operations and Heavy Oil Symposium, Calgary, AB, Canada, 1–3 November 2005. [Google Scholar]
  29. Shandrygin, A.N.; Lutfullin, A. Current Status of Enhanced Recovery Techniques in the Fields of Russia. In Proceedings of the SPE Annual Technical Conference and Exhibition, Denver, CO, USA, 21–24 September 2008. [Google Scholar]
  30. Pang, Z.X.; Liu, H.Q.; Zhu, L. A laboratory study of enhancing heavy oil recovery with steam flooding by adding nitrogen foams. J. Pet. Sci. Eng. 2015, 128, 184–193. [Google Scholar] [CrossRef]
  31. Wu, Z.B.; Liu, H.Q.; Pang, Z.X.; Wu, C.; Gao, M. Pore-scale experiment on blocking characteristics and EOR mechanisms of nitrogen foam for heavy oil: A 2D visualized study. Energy Fuels 2016, 30, 9106–9113. [Google Scholar] [CrossRef]
  32. Pu, W.F.; Gao, H.; Li, Y.B.; Luo, Q. Performance and mechanisms of enhanced oil recovery via CO2 assisted steam flooding technique in high heterogeneity heavy oil reservoir: Pvt and 3D experimental studies. Pet. Sci. Technol. 2020, 38, 823–835. [Google Scholar] [CrossRef]
  33. Lu, T.; Xu, Z.T.; Ban, X.C.; Peng, D.L.; Li, Z.M. Effect of flue gas on steam chamber expansion in steamflooding. SPE J. 2022, 27, 399–409. [Google Scholar] [CrossRef]
  34. Lyu, X.C.; Liu, H.Q.; Pang, Z.X.; Sun, Z.X. Visualized study of thermochemistry assisted steam flooding to improve oil recovery in heavy oil reservoir with glass micromodels. Fuel 2018, 218, 118–126. [Google Scholar] [CrossRef]
  35. Wang, Y.W.; Liu, H.Q.; Zhang, Q.C.; Chen, Z.X.; Wang, J.; Dong, X.H.; Chen, F.X. Pore-scale experimental study on eor mechanisms of combining thermal and chemical flooding in heavy oil reservoirs. J. Pet. Sci. Eng. 2020, 185, 106649. [Google Scholar] [CrossRef]
  36. Bagheri, S.R.; Clark, H.P. Steam-Foam Technology as an Option to Improve Steam Drive Efficiency. In Proceedings of the SPE Kuwait Oil and Gas Show and Conference, Mishref, Kuwait, 11–14 October 2015. [Google Scholar]
  37. Pratama, R.A.; Babadagli, T. Tertiary-recovery improvement of steam injection using chemical additives: Pore-scale understanding of challenges and solutions through visual experiments. SPE J. 2021, 26, 1552–1571. [Google Scholar] [CrossRef]
  38. Feng, G.Q.; Li, Y.; Yang, Z.D. Performance evaluation of nitrogen-assisted steam flooding process in heavy oil reservoir via numerical simulation. J. Pet. Sci. Eng. 2020, 189, 106954. [Google Scholar] [CrossRef]
  39. Liu, P.; Zhang, Y.J.; Liu, P.C.; Zhou, Y.; Qi, Z.Y.; Shi, L.X.; Xi, C.F.; Zhang, Z.Y.; Wang, C.; Hua, D.D. Experimental and numerical investigation on extra-heavy oil recovery by steam injection using vertical injector -horizontal producer. J. Pet. Sci. Eng. 2021, 205, 108945. [Google Scholar] [CrossRef]
  40. Wang, C.; Zhong, L.G.; Cao, Z.J.; Liu, Y.G.; Zou, J.; Wang, Q.X. Synergistic collaboration between a viscosity reducer and a surfactant for in situ emulsion formation to enhance heavy-oil recovery. Energy Fuels 2020, 34, 95–102. [Google Scholar] [CrossRef]
  41. Liu, J.B.; Zhong, L.G.; Lyu, C.H.; Liu, Y.G.; Zhang, S.J. W/O emulsions generated by heavy oil in porous medium and its effect on re-emulsification. Fuel 2022, 310, 122344. [Google Scholar] [CrossRef]
Figure 1. Viscosity of the heavy oil samples at different temperatures.
Energies 18 03140 g001
Figure 2. (a) Schematic diagram of the 1-D experimental system; (b) interior structure of the 1-D reservoir model; (c) 3-D reservoir model.
Energies 18 03140 g002
Figure 3. Comparison of the results of Experiments 1, 2 and 3: (a) Pressure difference; (b) Water cut and oil recovery.
Energies 18 03140 g003
Figure 4. Variation in temperatures along the 1-D reservoir model versus PV of injected steam during the SF process.
Energies 18 03140 g004
Figure 5. Comparison of the results of Experiments 4 and 5: (a) Water cut and oil recovery; (b) Pressure difference.
Energies 18 03140 g005
Figure 6. Comparison of the results of Experiments 1 and 4: (a) Water cut and oil recovery; (b) Pressure difference.
Energies 18 03140 g006
Figure 7. Comparison of the results of Experiments 3 and 5: (a) Oil recovery; (b) Temperature distribution; (c) Pressure difference; (d) Water cut.
Energies 18 03140 g007
Figure 8. Comparison of the results of Experiments 5, 6, and 7: (a) Oil recovery; (b) Water cut; (c) Pressure difference; (d) Temperature distribution.
Energies 18 03140 g008
Figure 9. Comparison of the results of Experiments 8 and 9: (a) Water cut and oil recovery; (b) Pressure difference.
Energies 18 03140 g009
Figure 10. Comparison of temperature distribution of Experiments 8 and 9 at different times: (a) Experiment 8; (b) Experiment 9; (c) Schematic of temperature profiles in the 3-D reservoir model.
Energies 18 03140 g010
Figure 11. Comparison of the results of Experiments 8 and 10: (a) Oil recovery and water cut; (b) Pressure difference.
Energies 18 03140 g011
Figure 12. Comparison of temperature distribution of Experiments 10 and 11 at different times: (a) Experiment 10; (b) Experiment 11; (c) Schematic of temperature profiles in the 3-D reservoir model.
Energies 18 03140 g012
Figure 13. Comparison of the results of Experiments 9 and 11: (a) Water cut and oil recovery; (b) Pressure difference.
Energies 18 03140 g013
Table 1. Ion composition of brine used in the experiments.
Ion ContentSalinity, mg/L
K++Na+2746.46
Mg2+43.29
Ca2+429.26
Cl−14974.34
SO42−46.18
HCO3189.77
CO32−0
I0.25
Br15.02
Fe2+0.03
Fe3+0.07
Table 2. Summary of the parameters of the1-D experiments and 3-D experiments.
Experiment No.1234567891011
Model type 1-D1-D1-D1-D1-D1-D1-D3-D3-D3-D3-D
Permeability, mD20902050203021502080201020702594250225402523
Porosity, %56.0255.2356.2455.9855.9856.0256.2435.8835.1634.9034.55
Initial oil saturation, %94.8894.3995.2295.0294.8994.8895.2281.8383.4886.8185.98
Timing of SF (water cut), %60 906090909090909090
Brine injection rate, mL/min555555510101010
Steam injection rate, mL/min5/51010101010301030
Steam injection temperature, °C340/340340340340340340340340340
The type of chemical agents /////Foaming agentDisplacing agent//Foaming agent, Displacing agentFoaming agent, Displacing agent
Slug size of chemical agents, PV/////0.51.5//0.1, 0.10.1, 0.1
The concentration of chemical agents, wt.%/////11//11
Final oil recovery, %71.13167.0167.2563.2176.0470.7932.1747.7437.6452.50
Disclaimer/Publisher’s Note: The statements, opinions and data contained in all publications are solely those of the individual author(s) and contributor(s) and not of MDPI and/or the editor(s). MDPI and/or the editor(s) disclaim responsibility for any injury to people or property resulting from any ideas, methods, instructions or products referred to in the content.

