
Research on Different Energy Transition Pathway Analysis and Low-Carbon Electricity Development: A Case Study of an Energy System in Inner Mongolia


Abstract
1. Introduction
2. Methodology
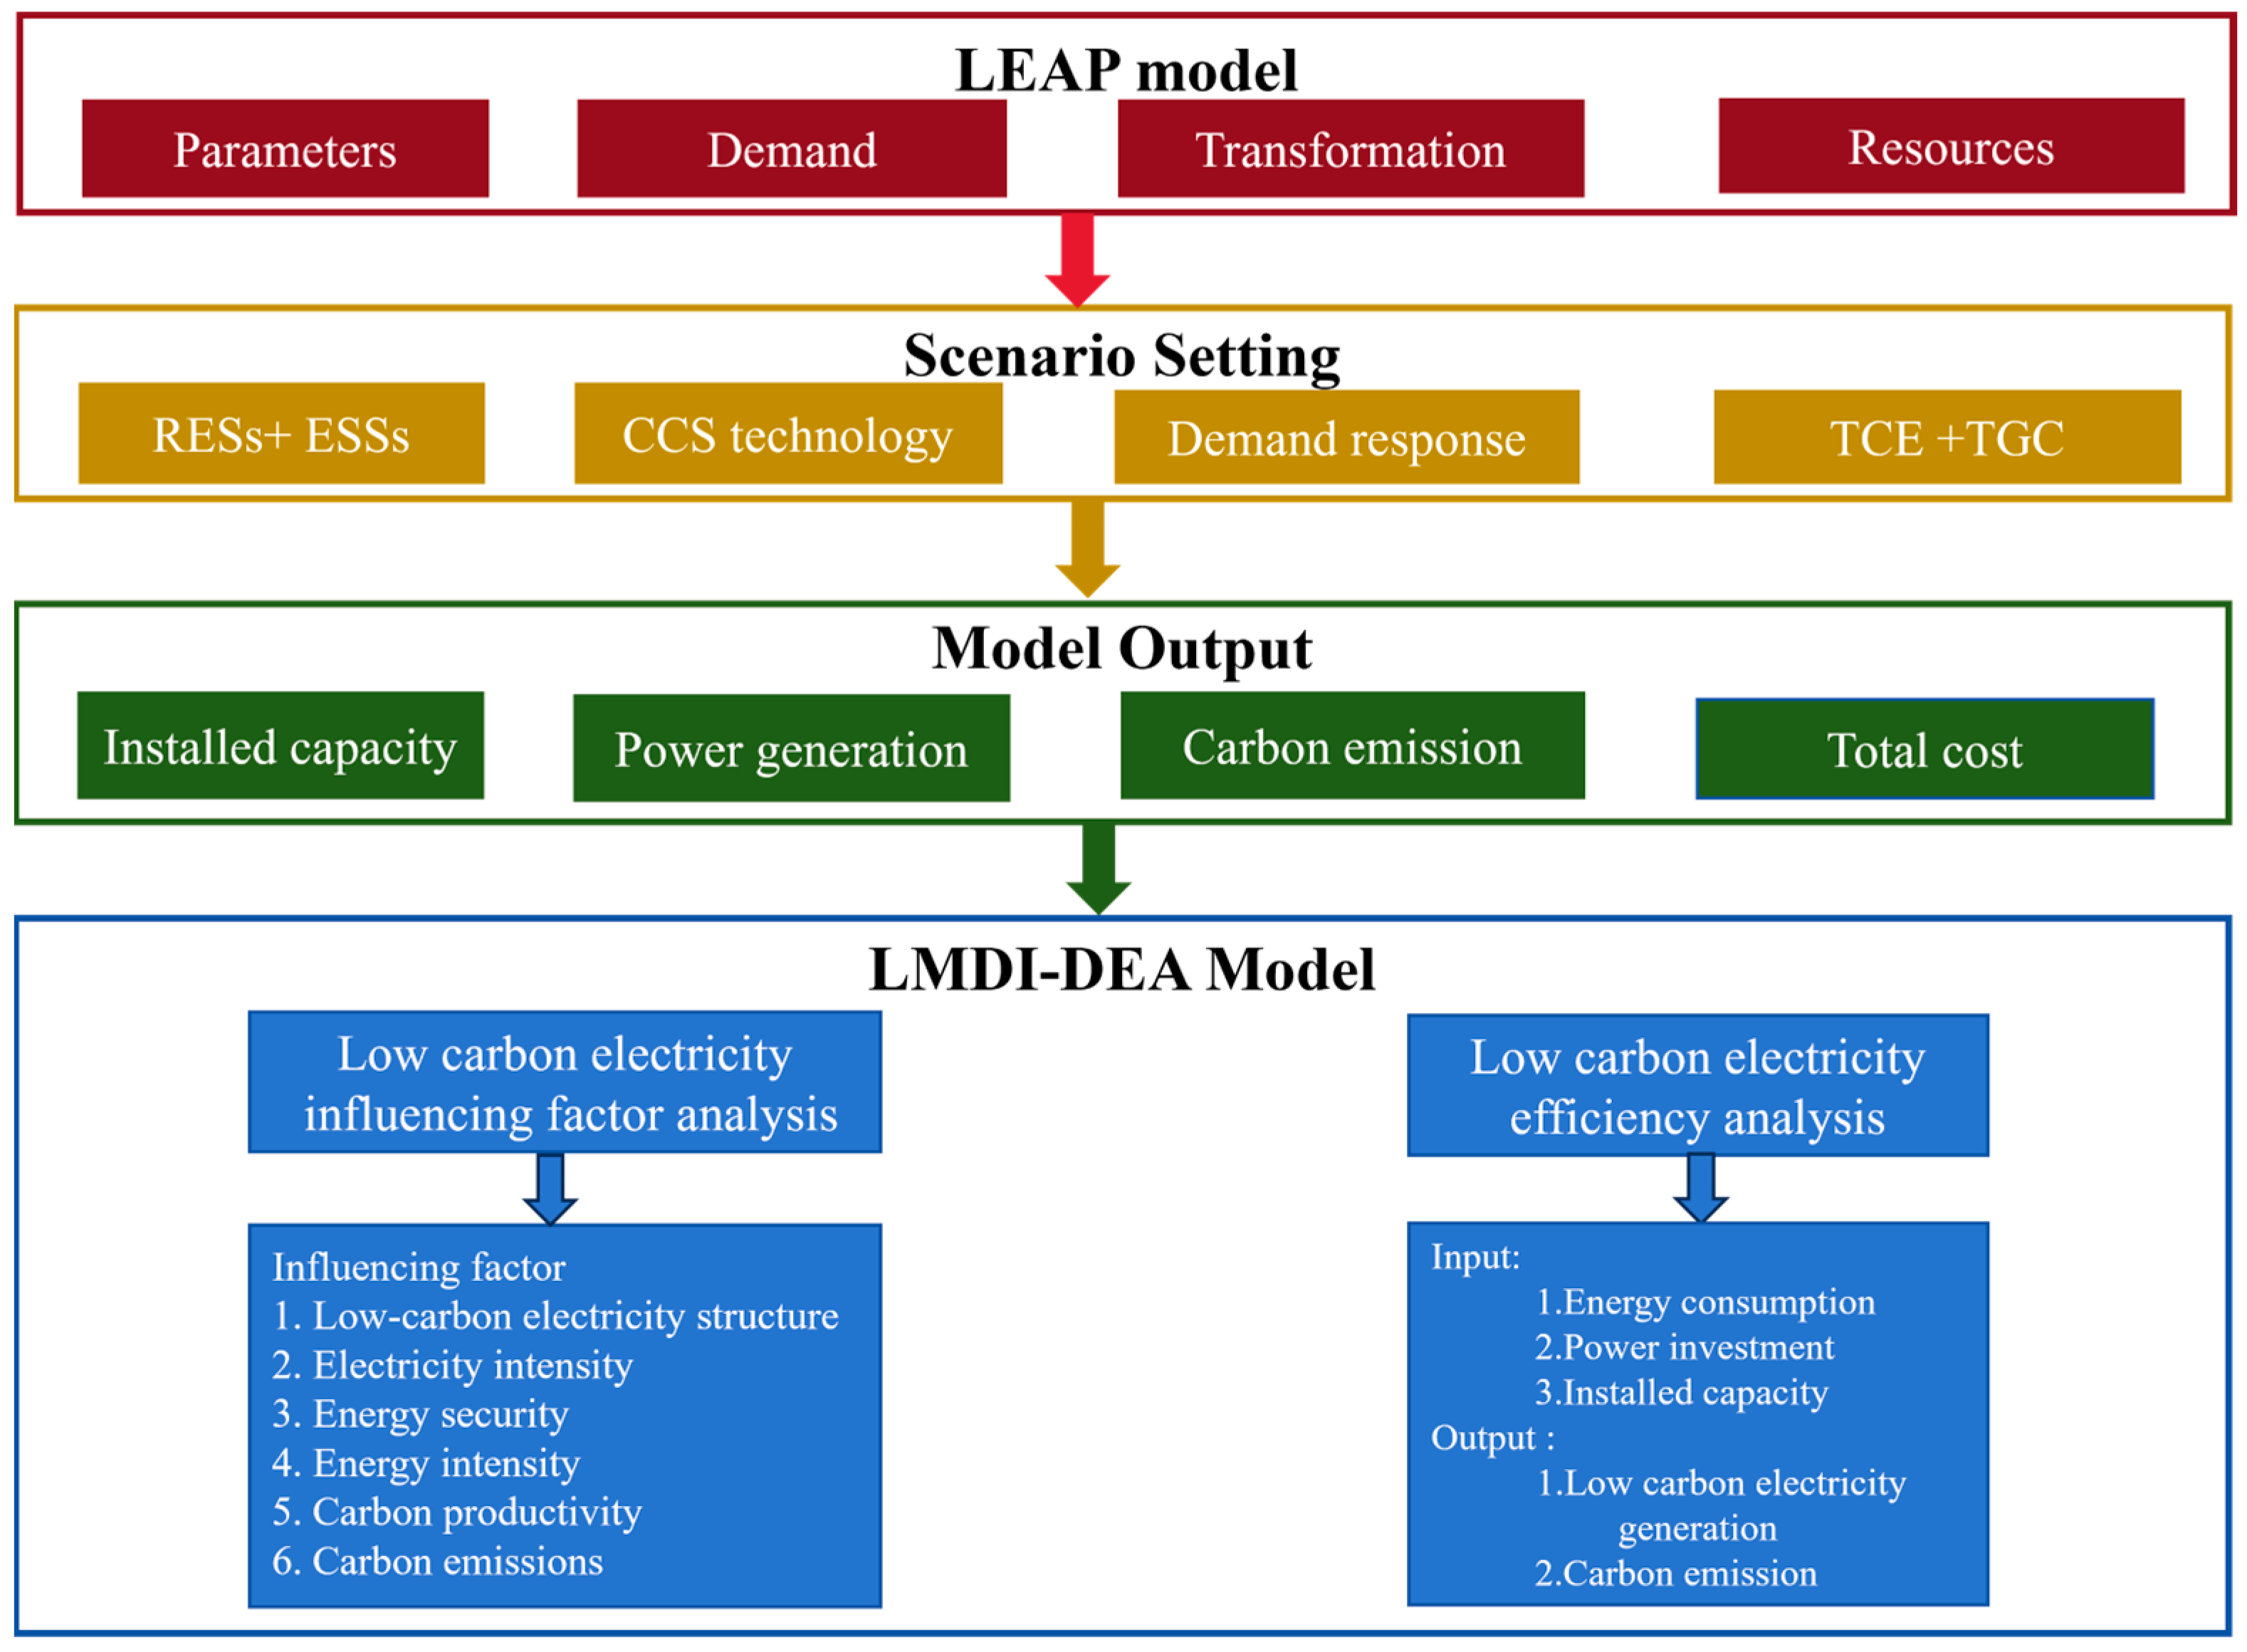
2.1. Analysis Framework
2.2. LEAP Model
- (a)
- Energy demand
- (b)
- Carbon emissions from energy
- (c)
- Cost analysis
2.3. LMDI Model
2.4. SBM-DEA Model
3. Study Area and Scenario Setting
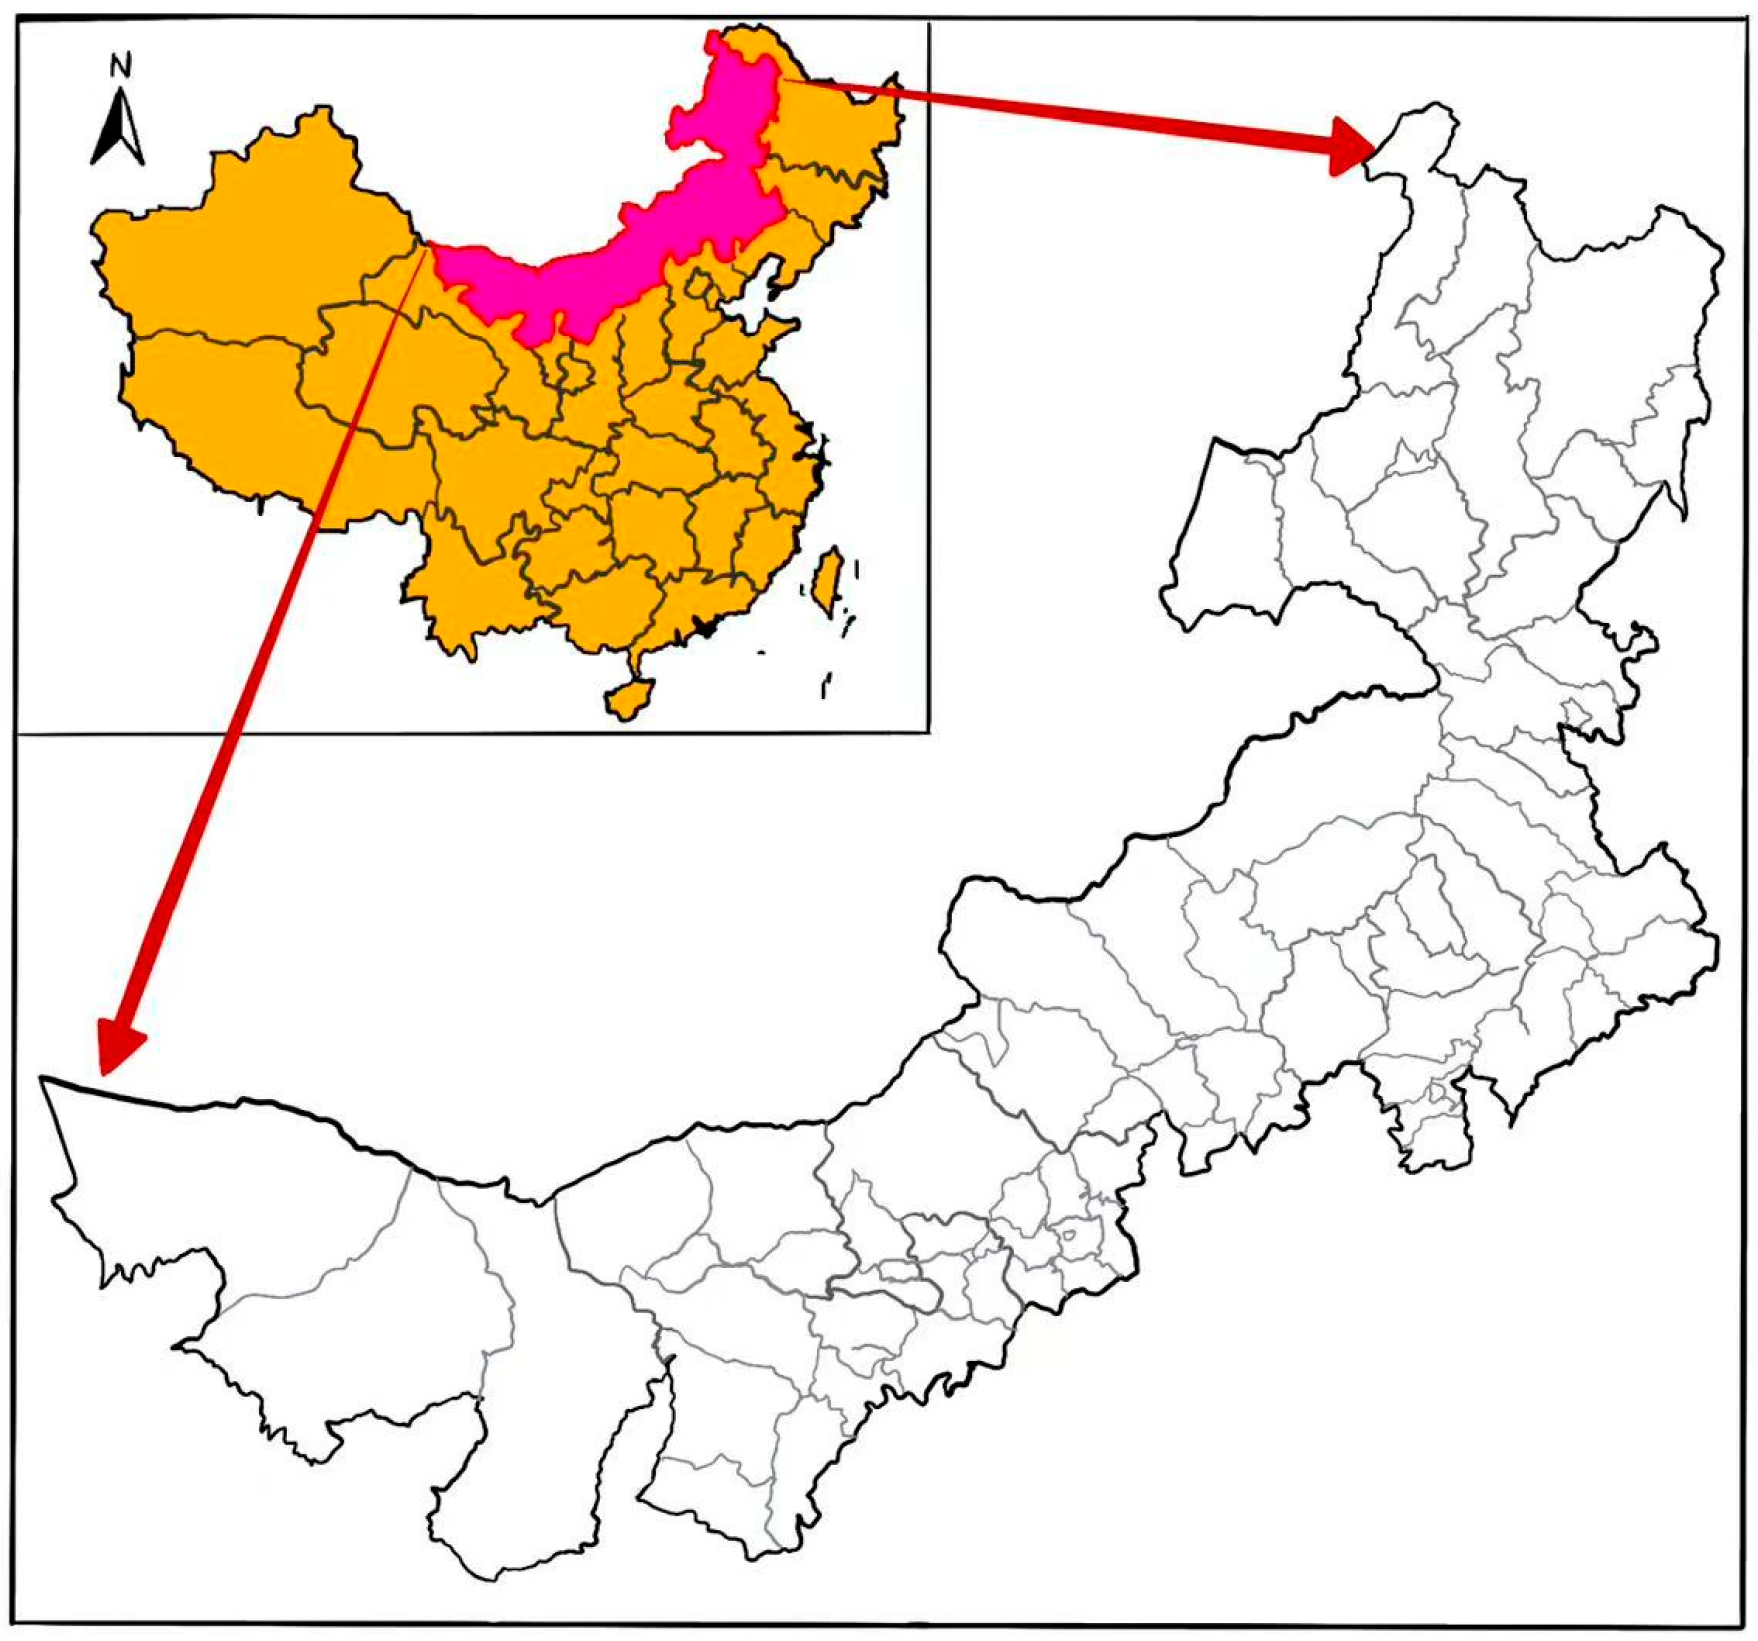
3.1. Study Area Overview
3.2. Scenario Setting
3.2.1. Developing Renewable Energy and Storage System Scenario
3.2.2. Developing CCS Technology Scenarios
3.2.3. Developing Demand Response Scenarios
3.2.4. Developing TCE and TGC Market
3.3. Data Sources
4. Results and Discussion
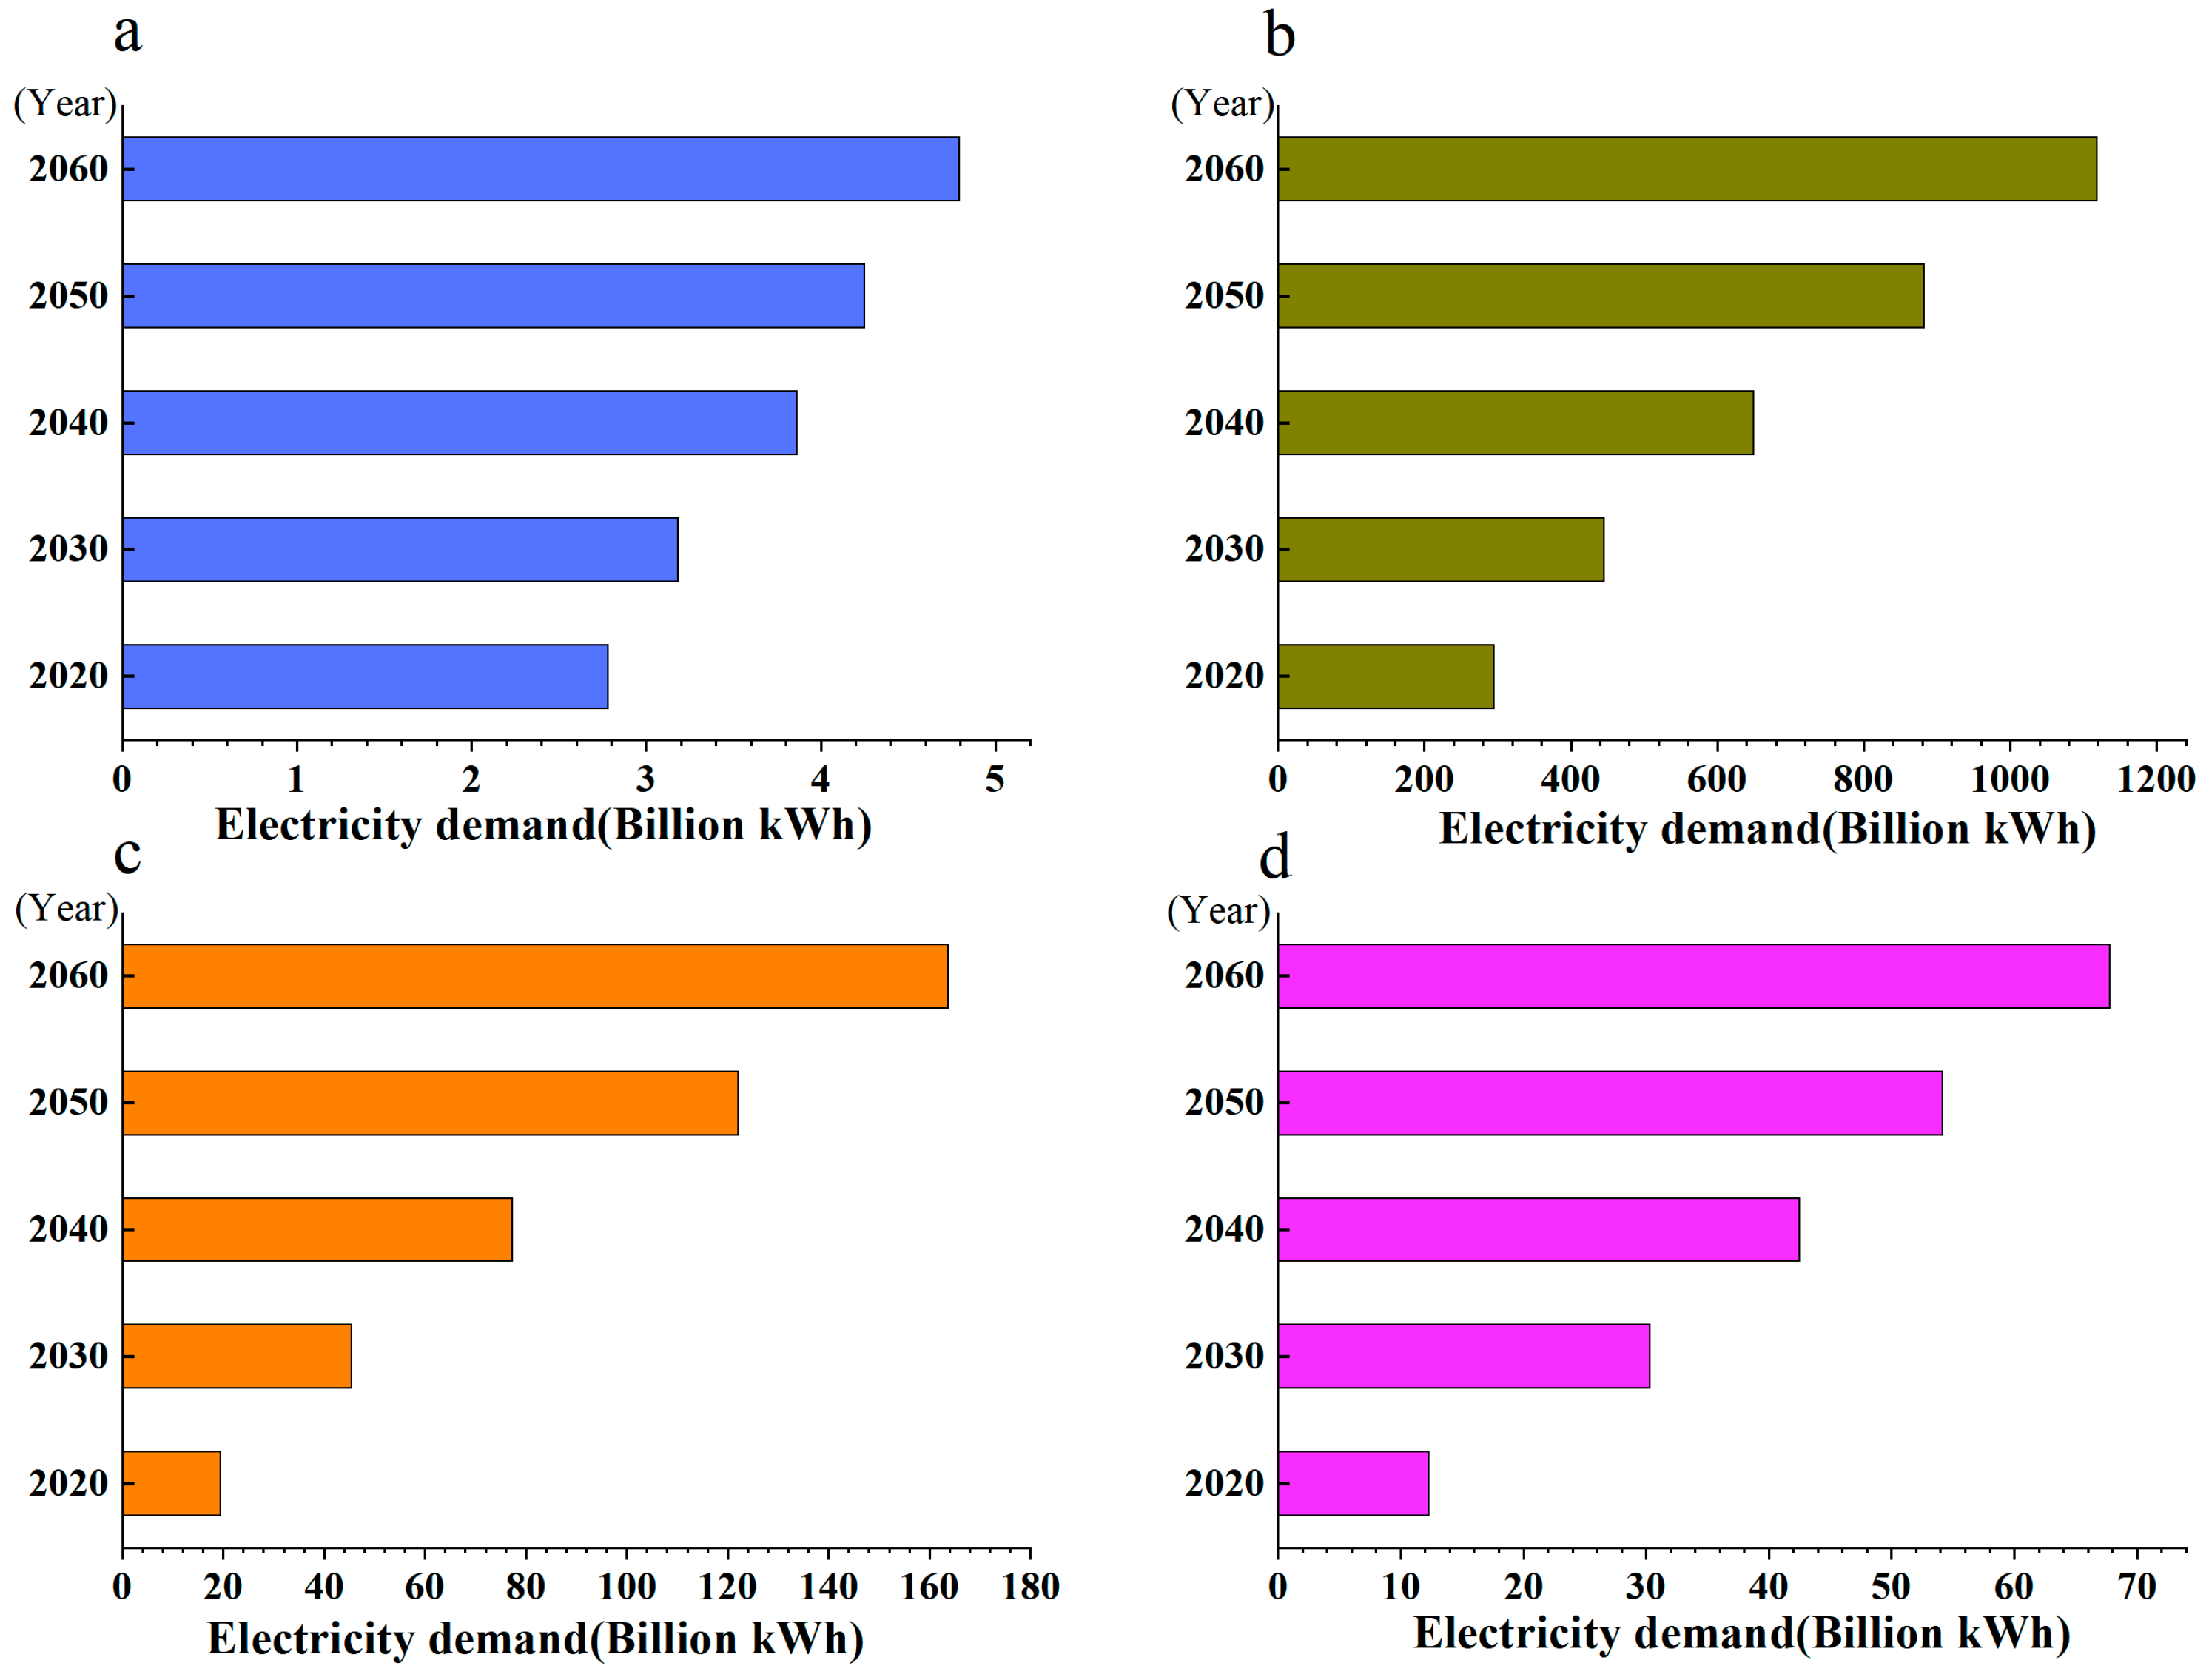
4.1. Total Electricity Demand Analysis
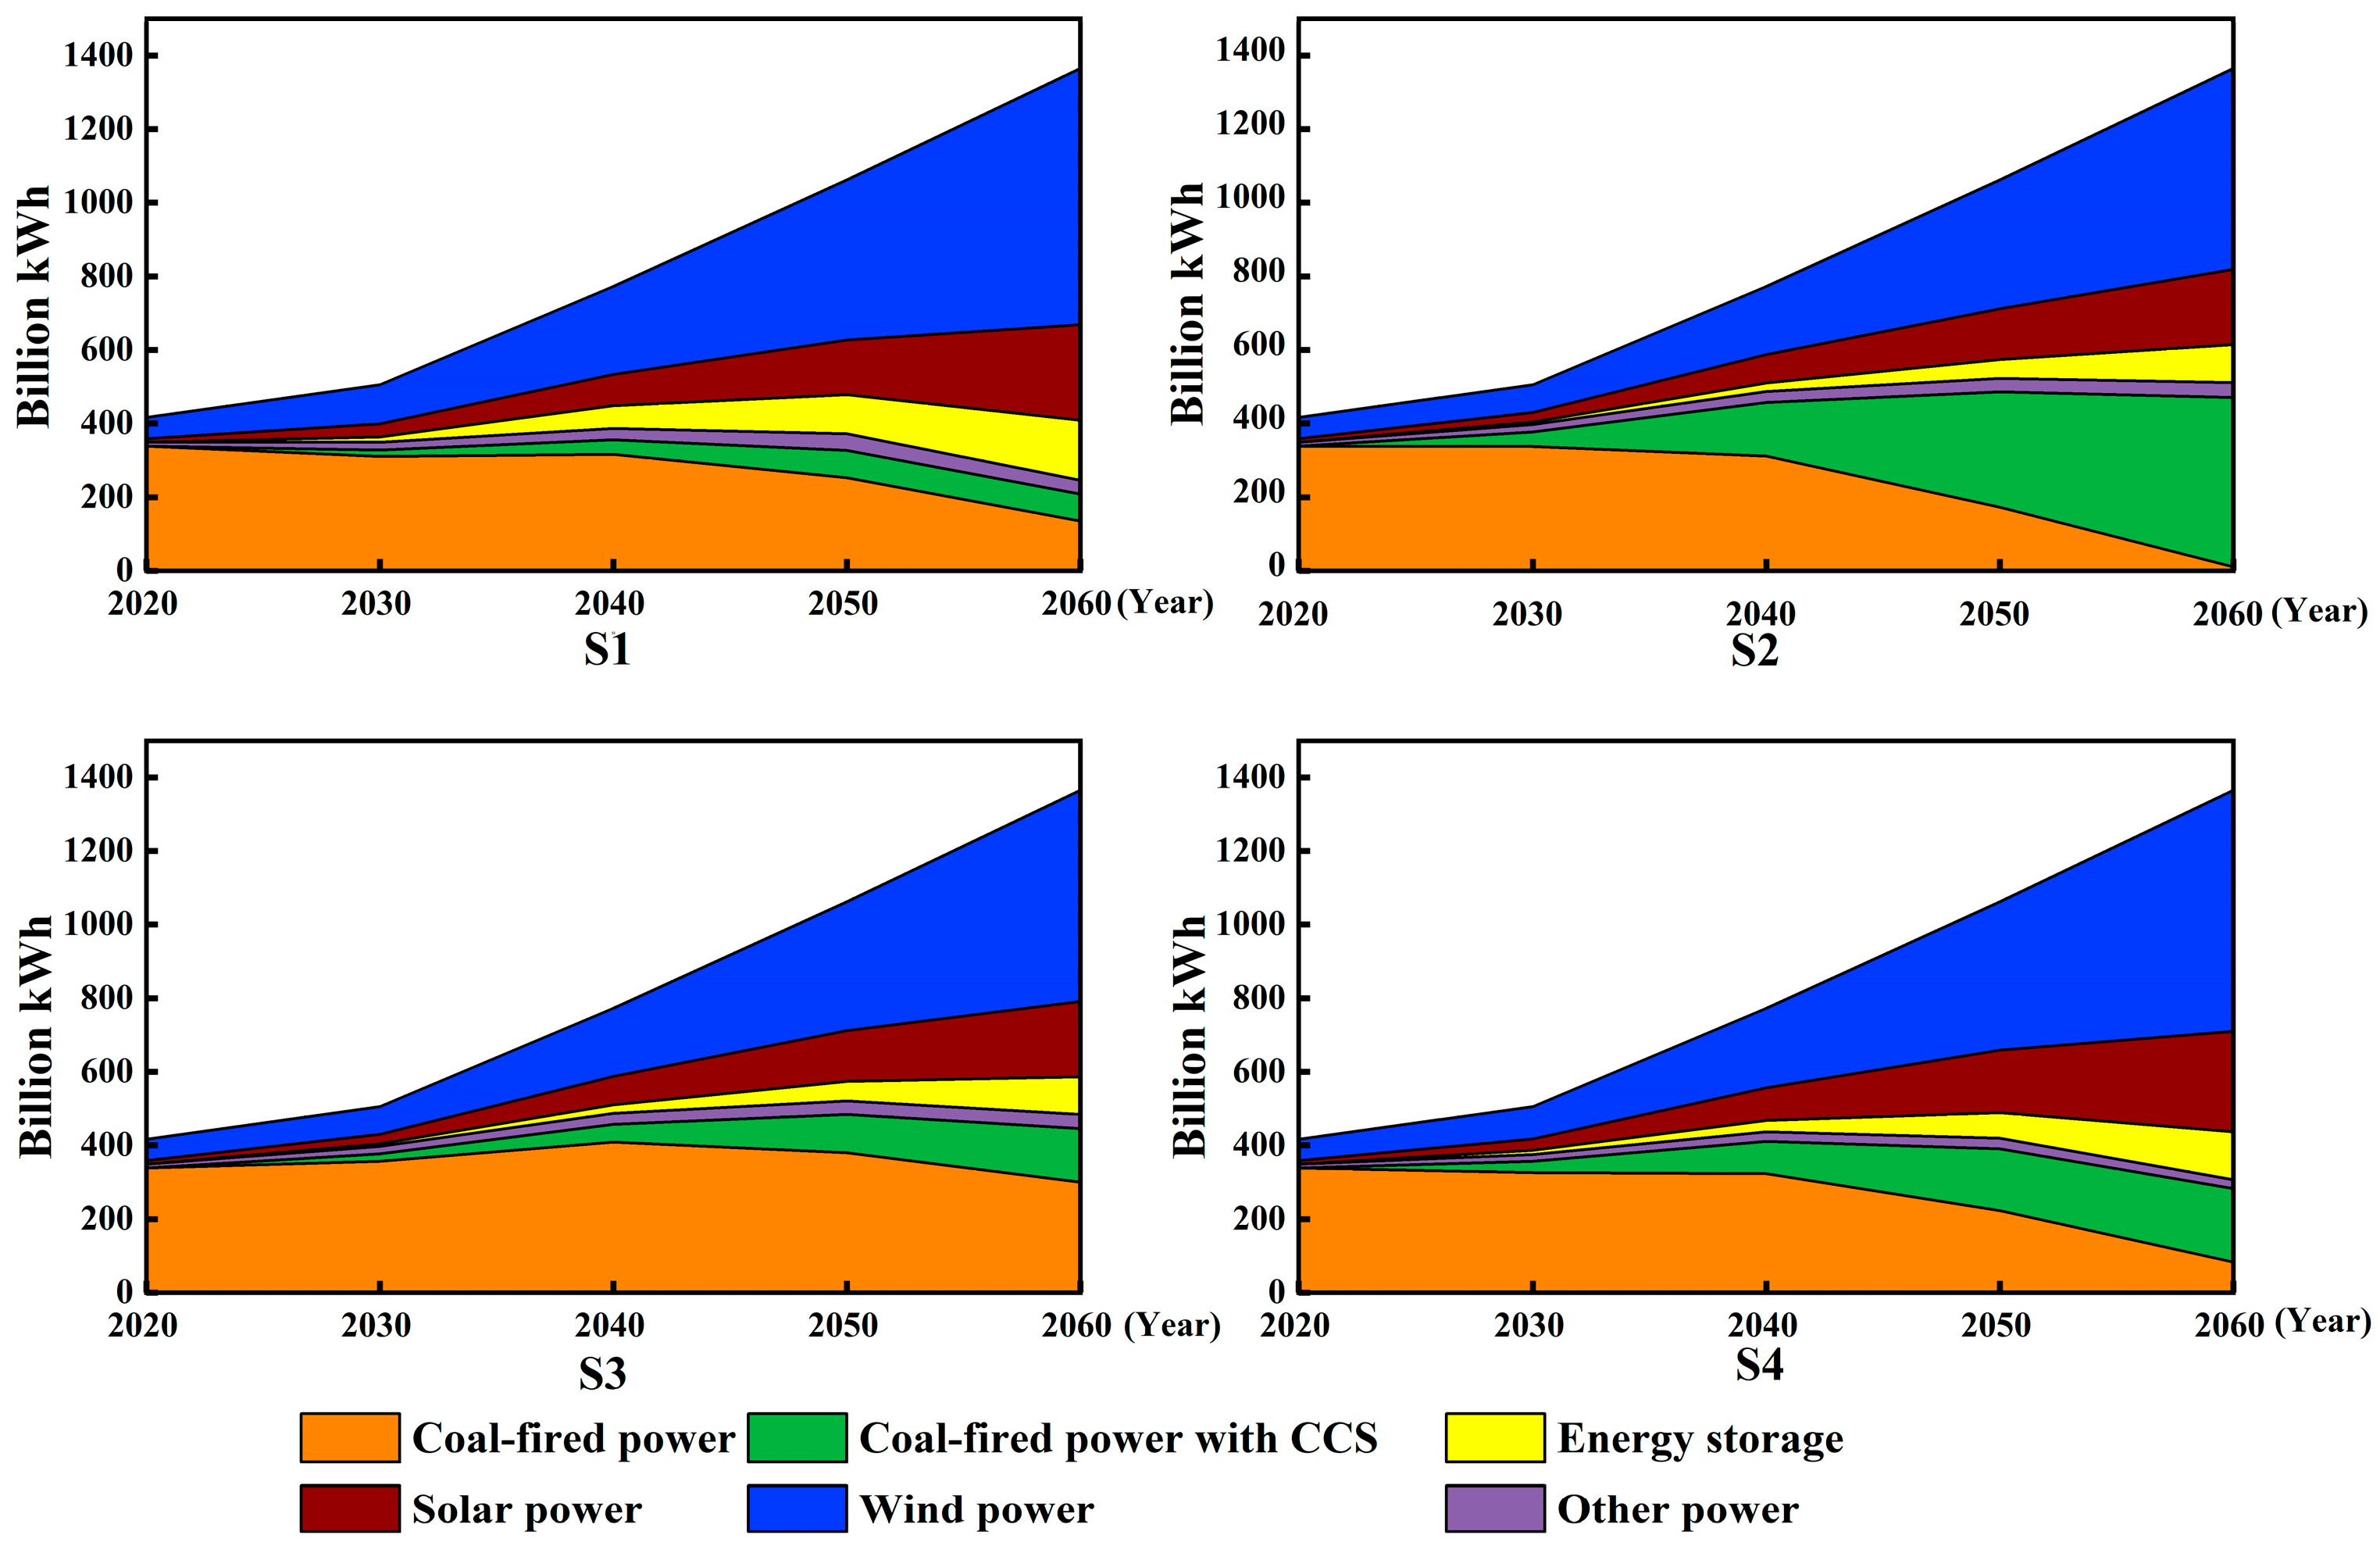
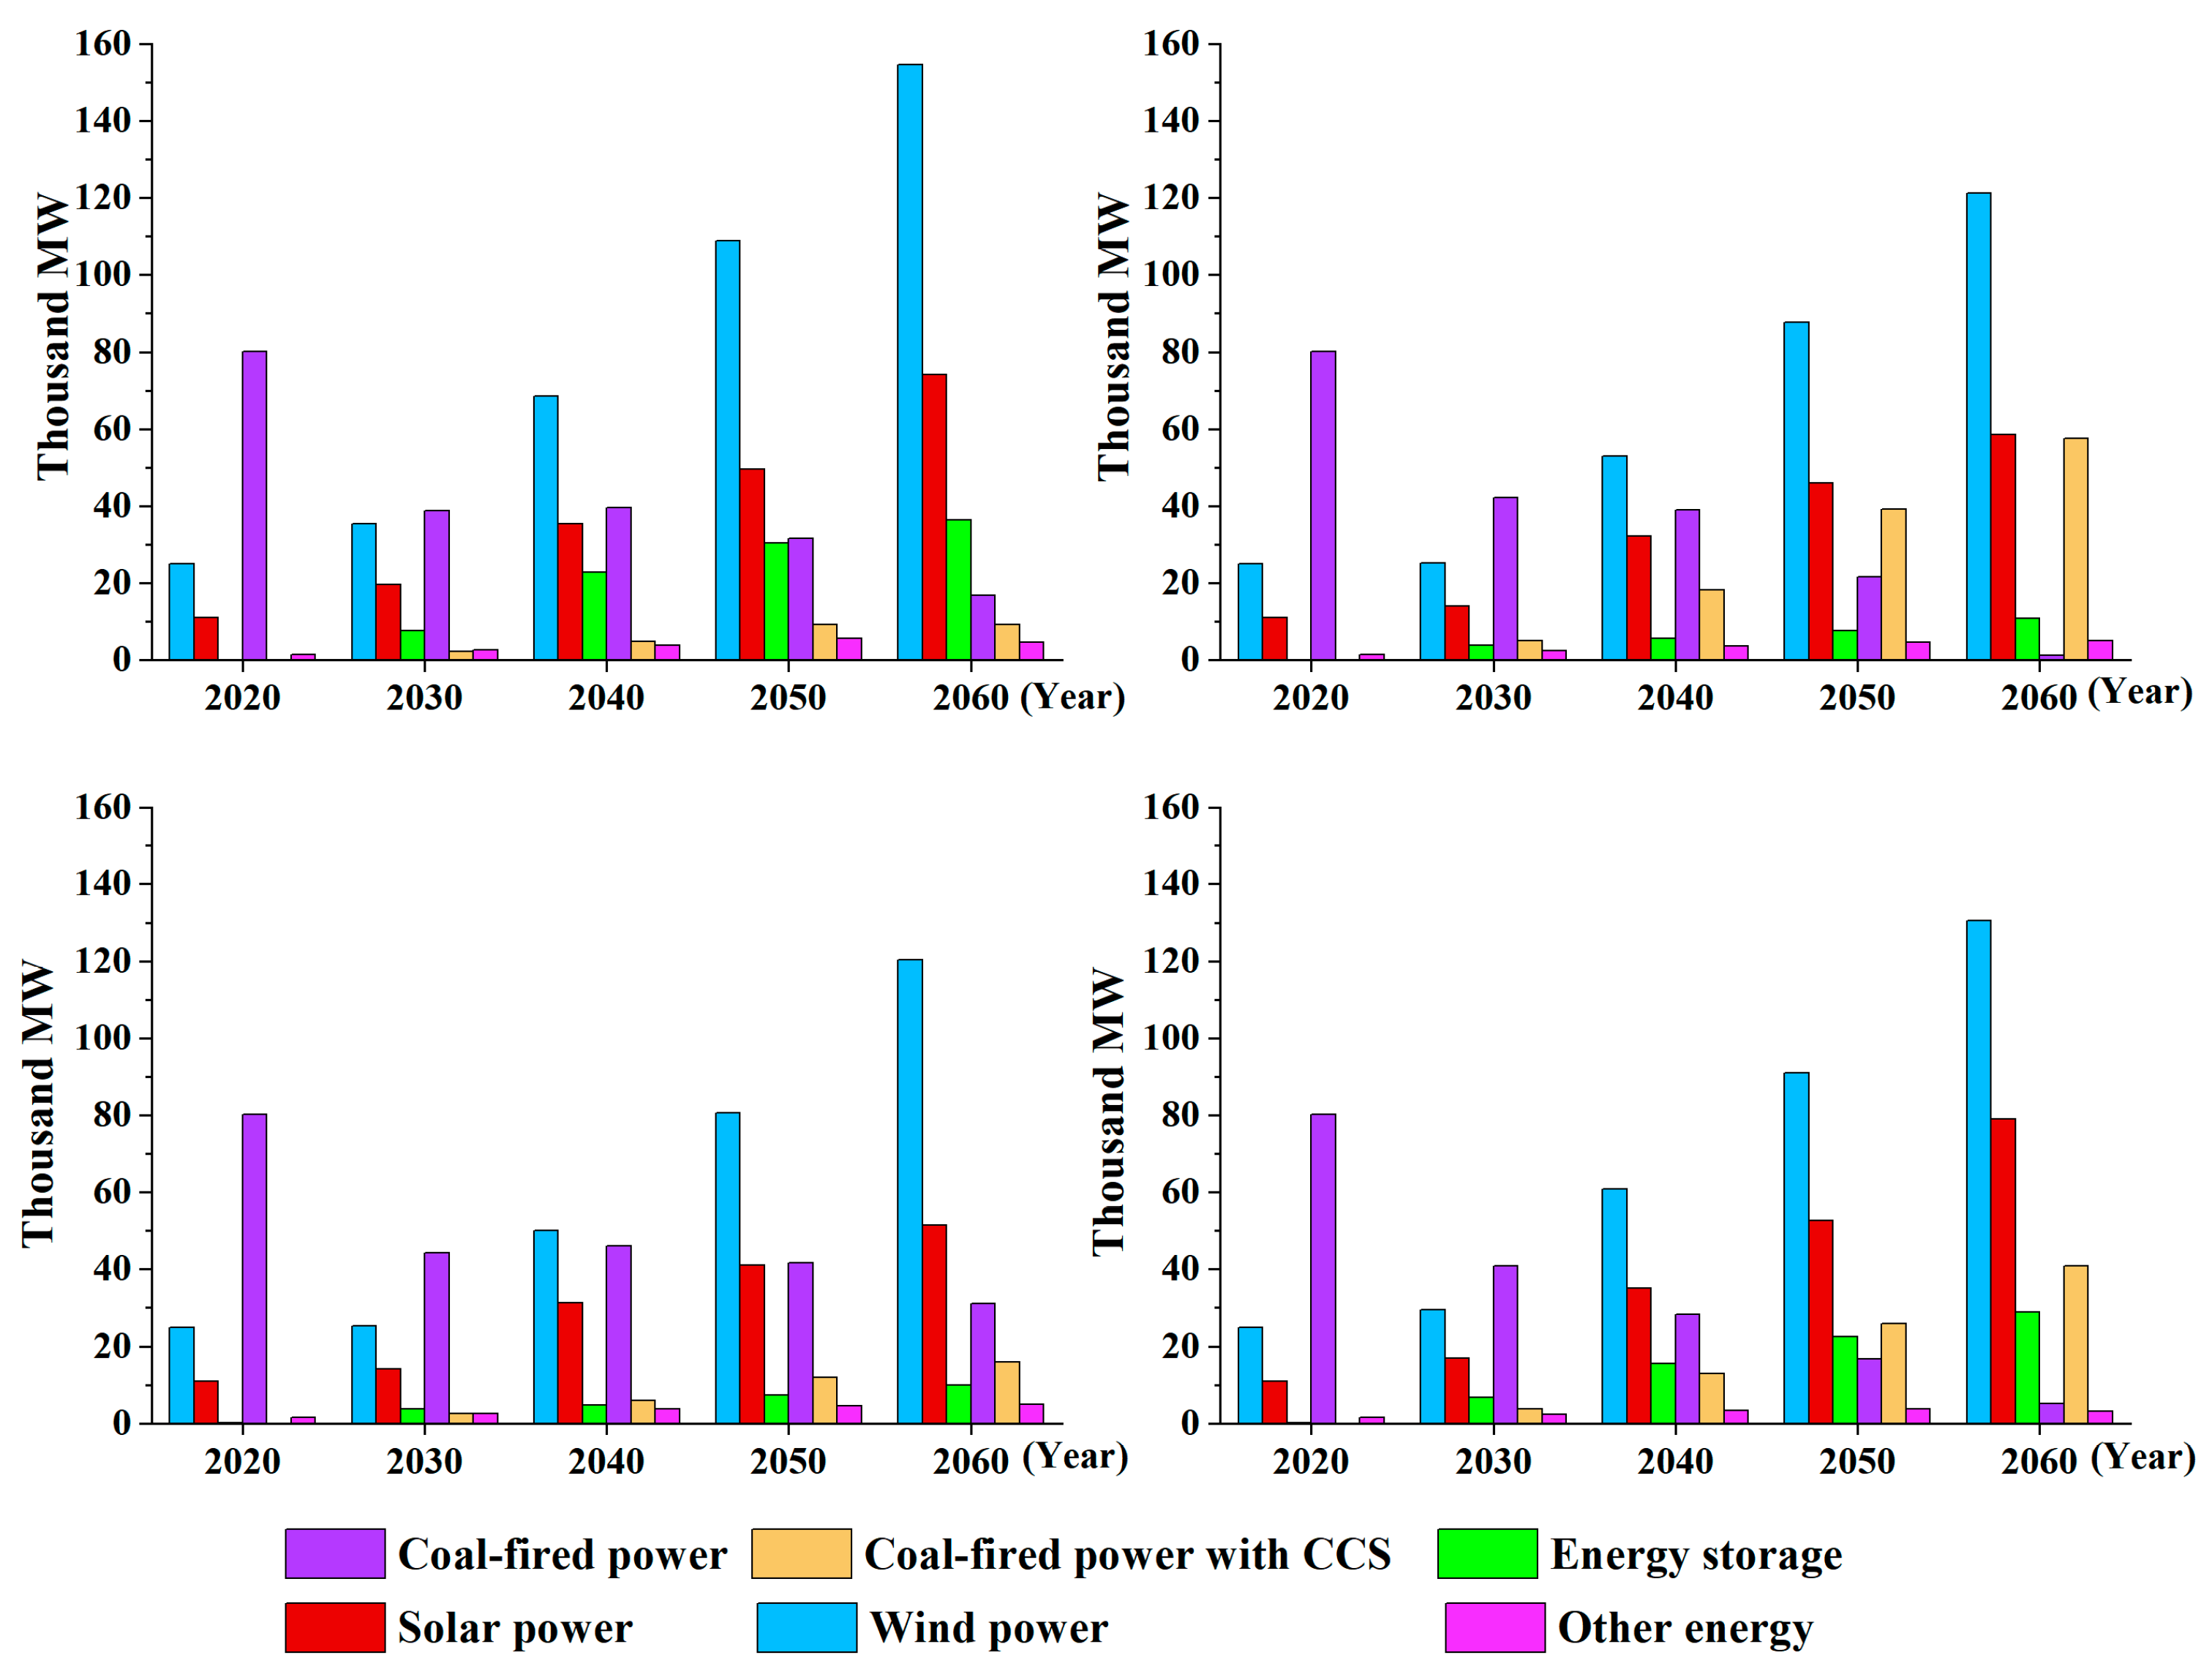
4.2. Power Generation and Installed Capacity Analysis
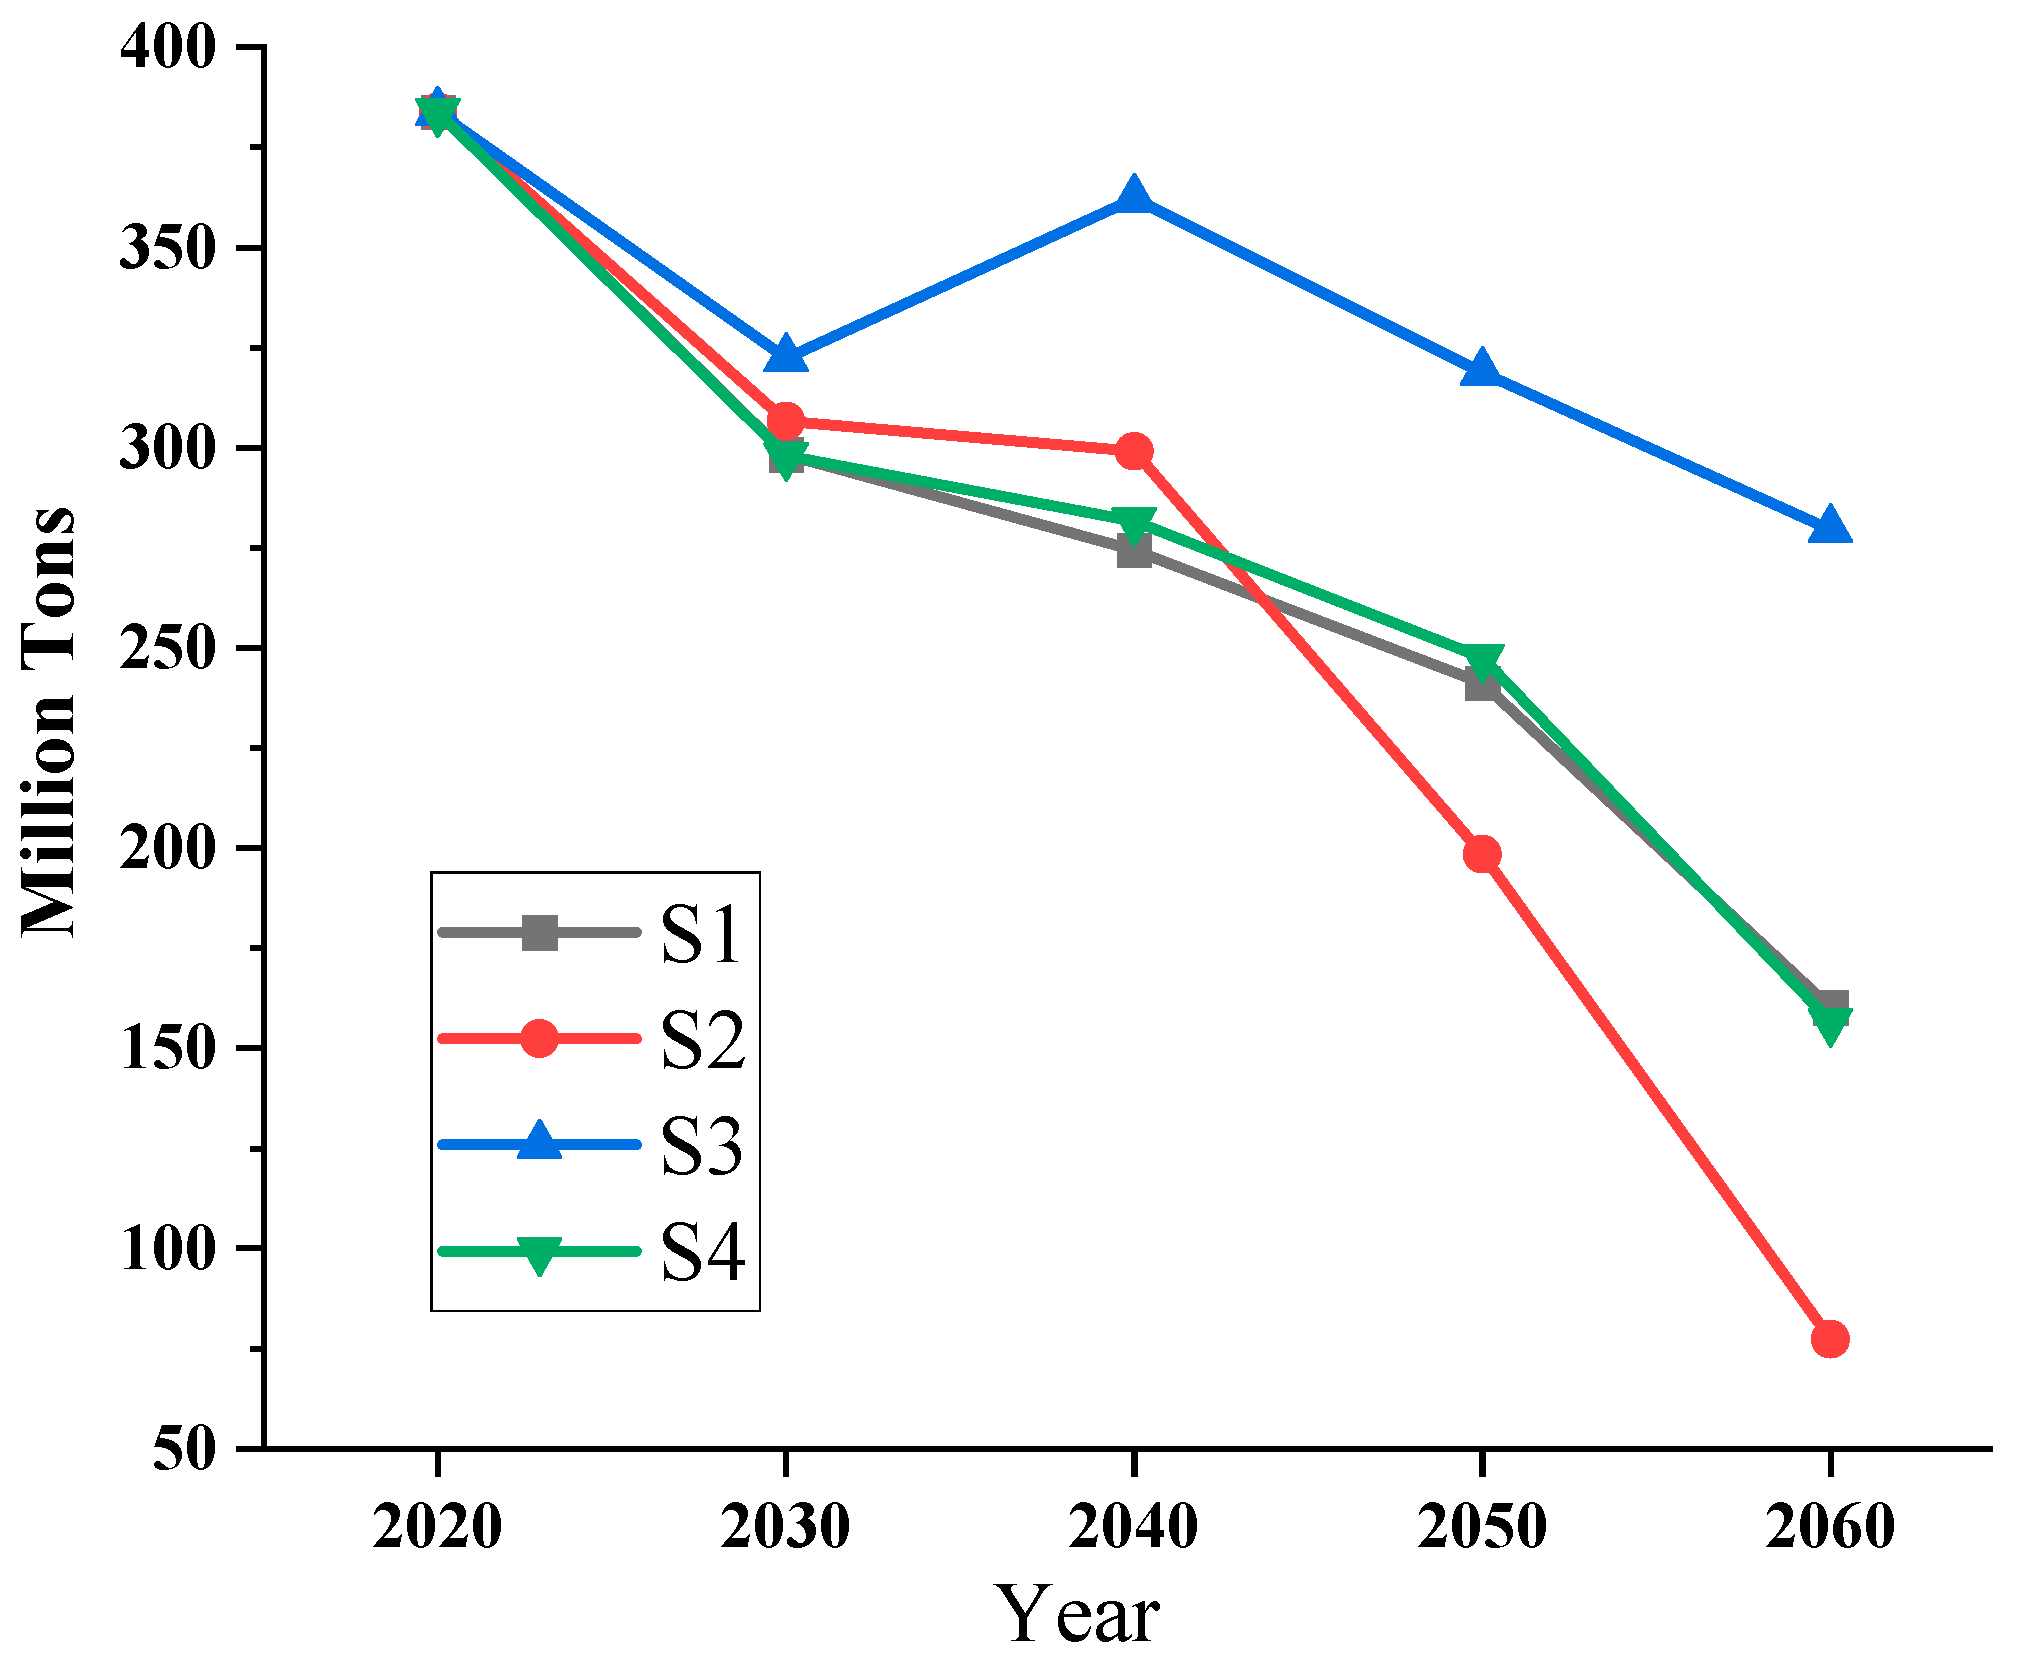
4.3. Carbon Emission Analysis
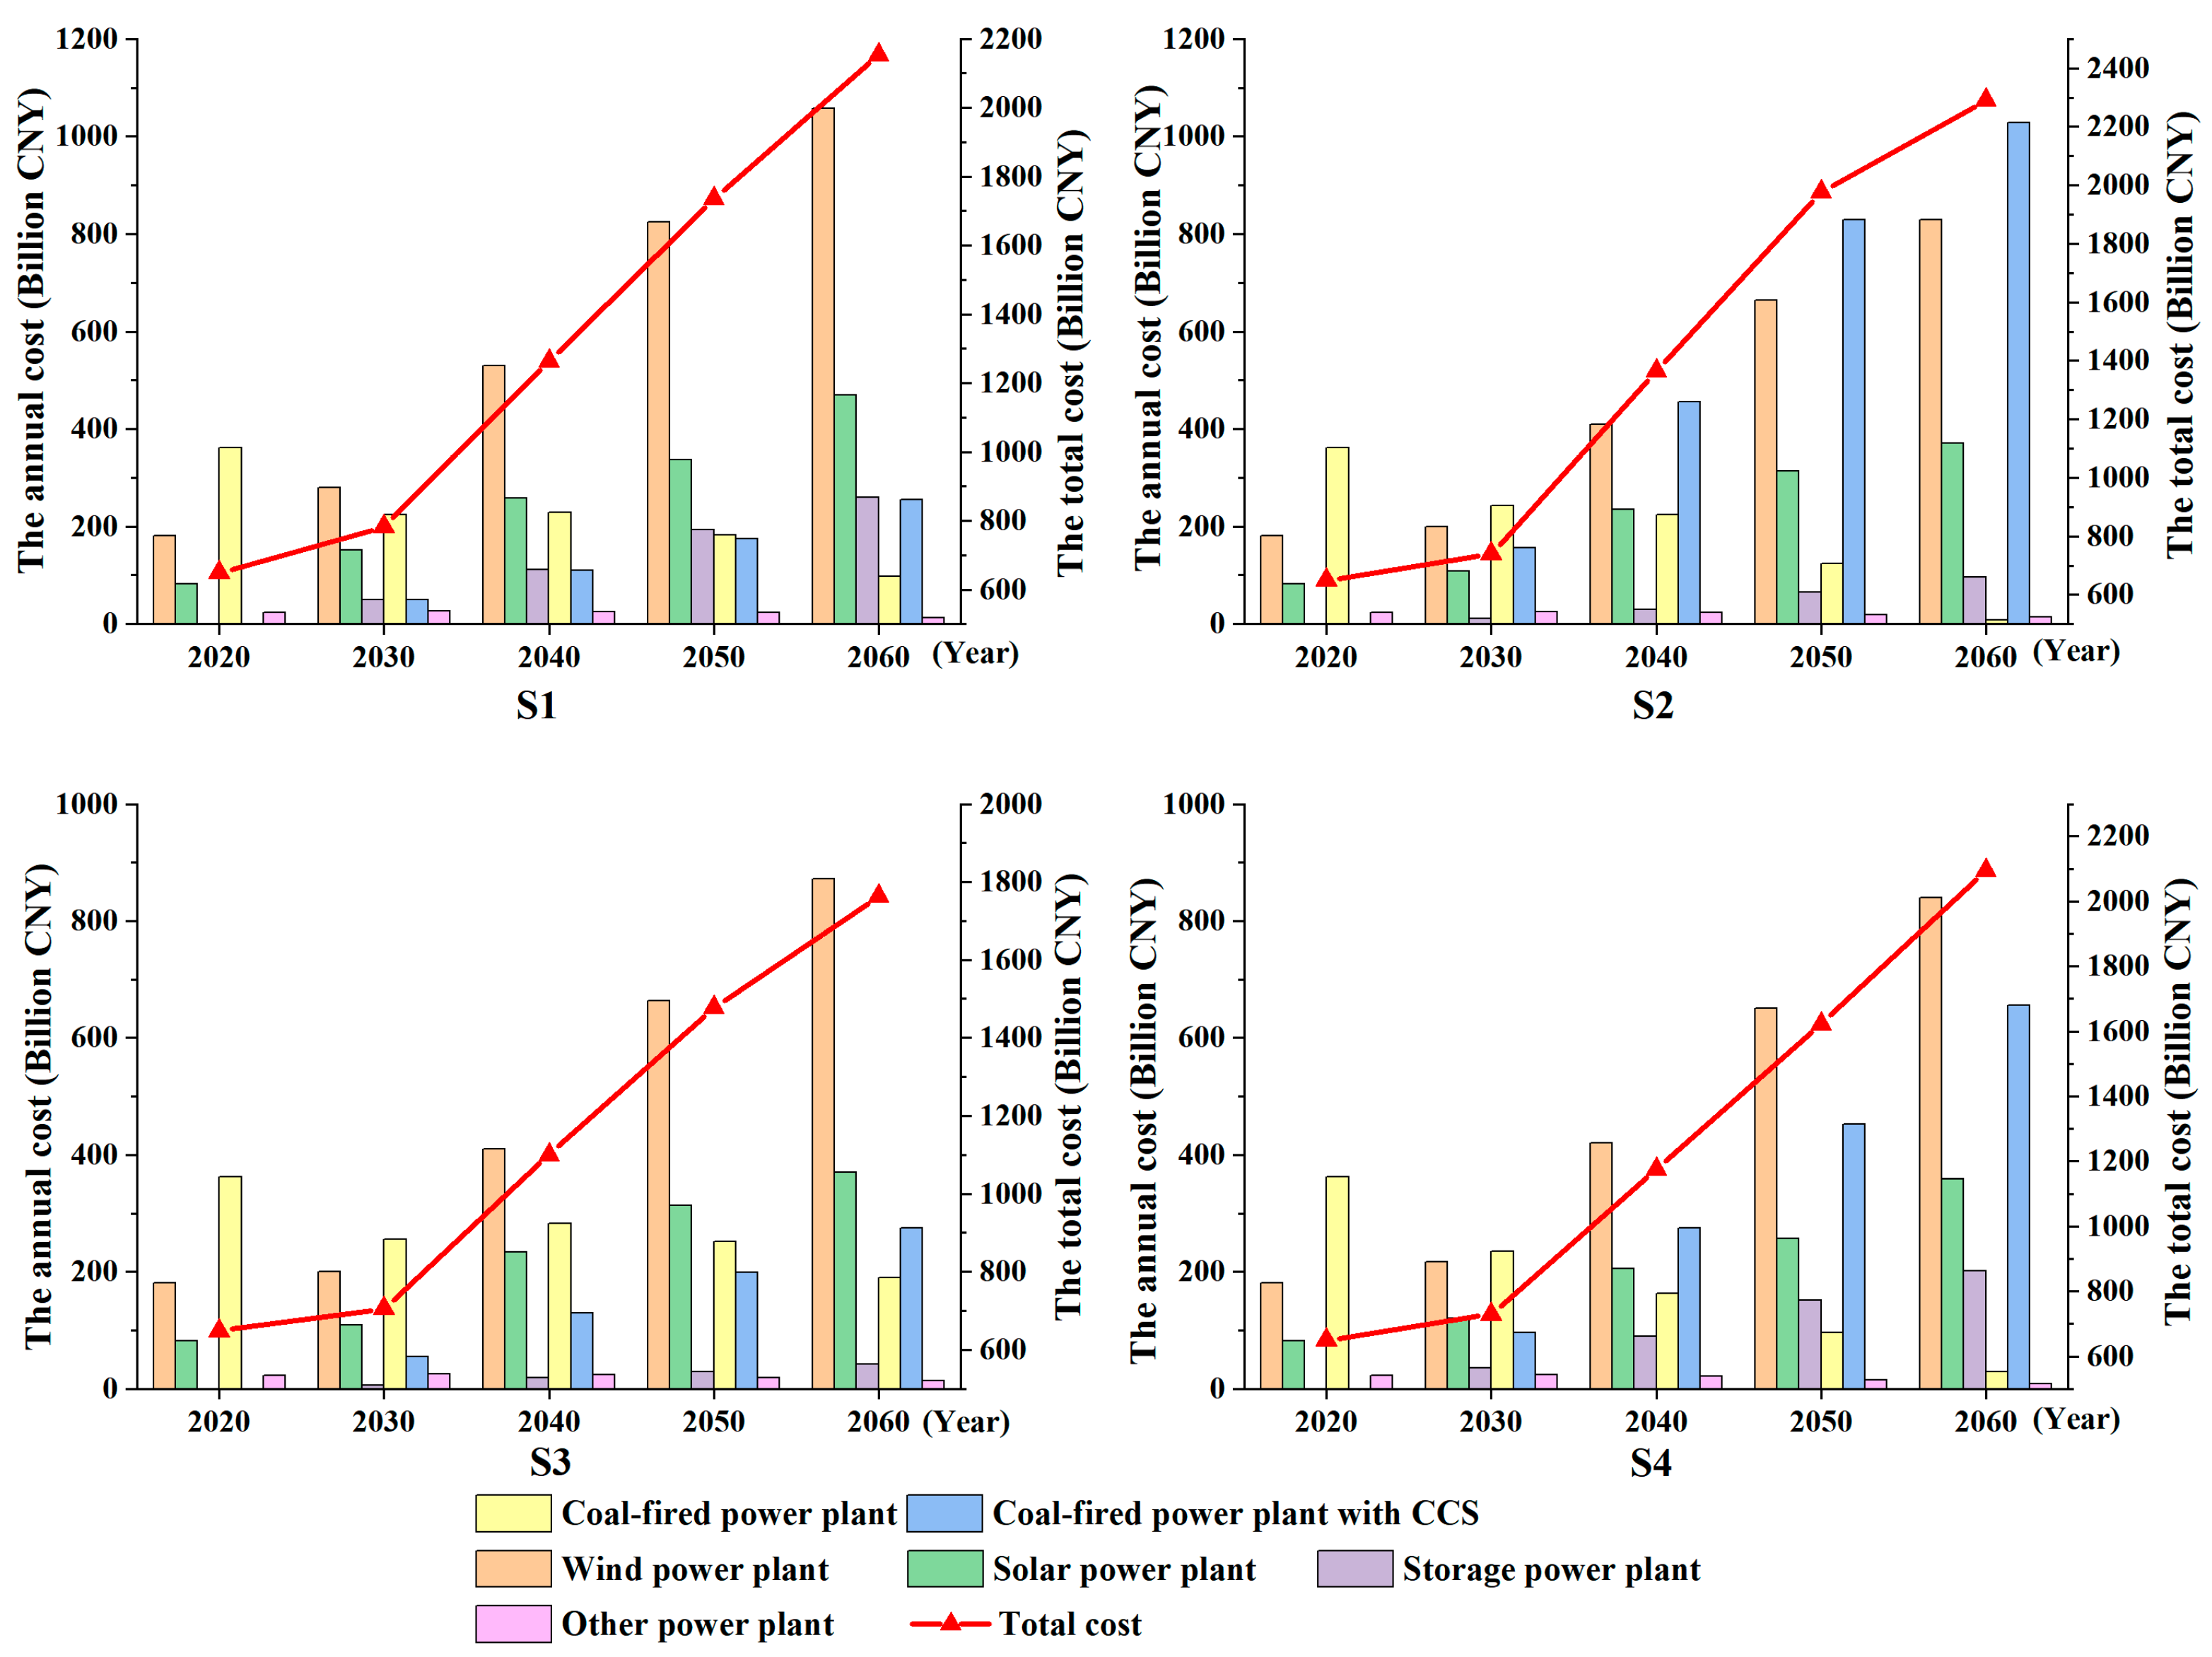
4.4. Total Power System Cost Analysis
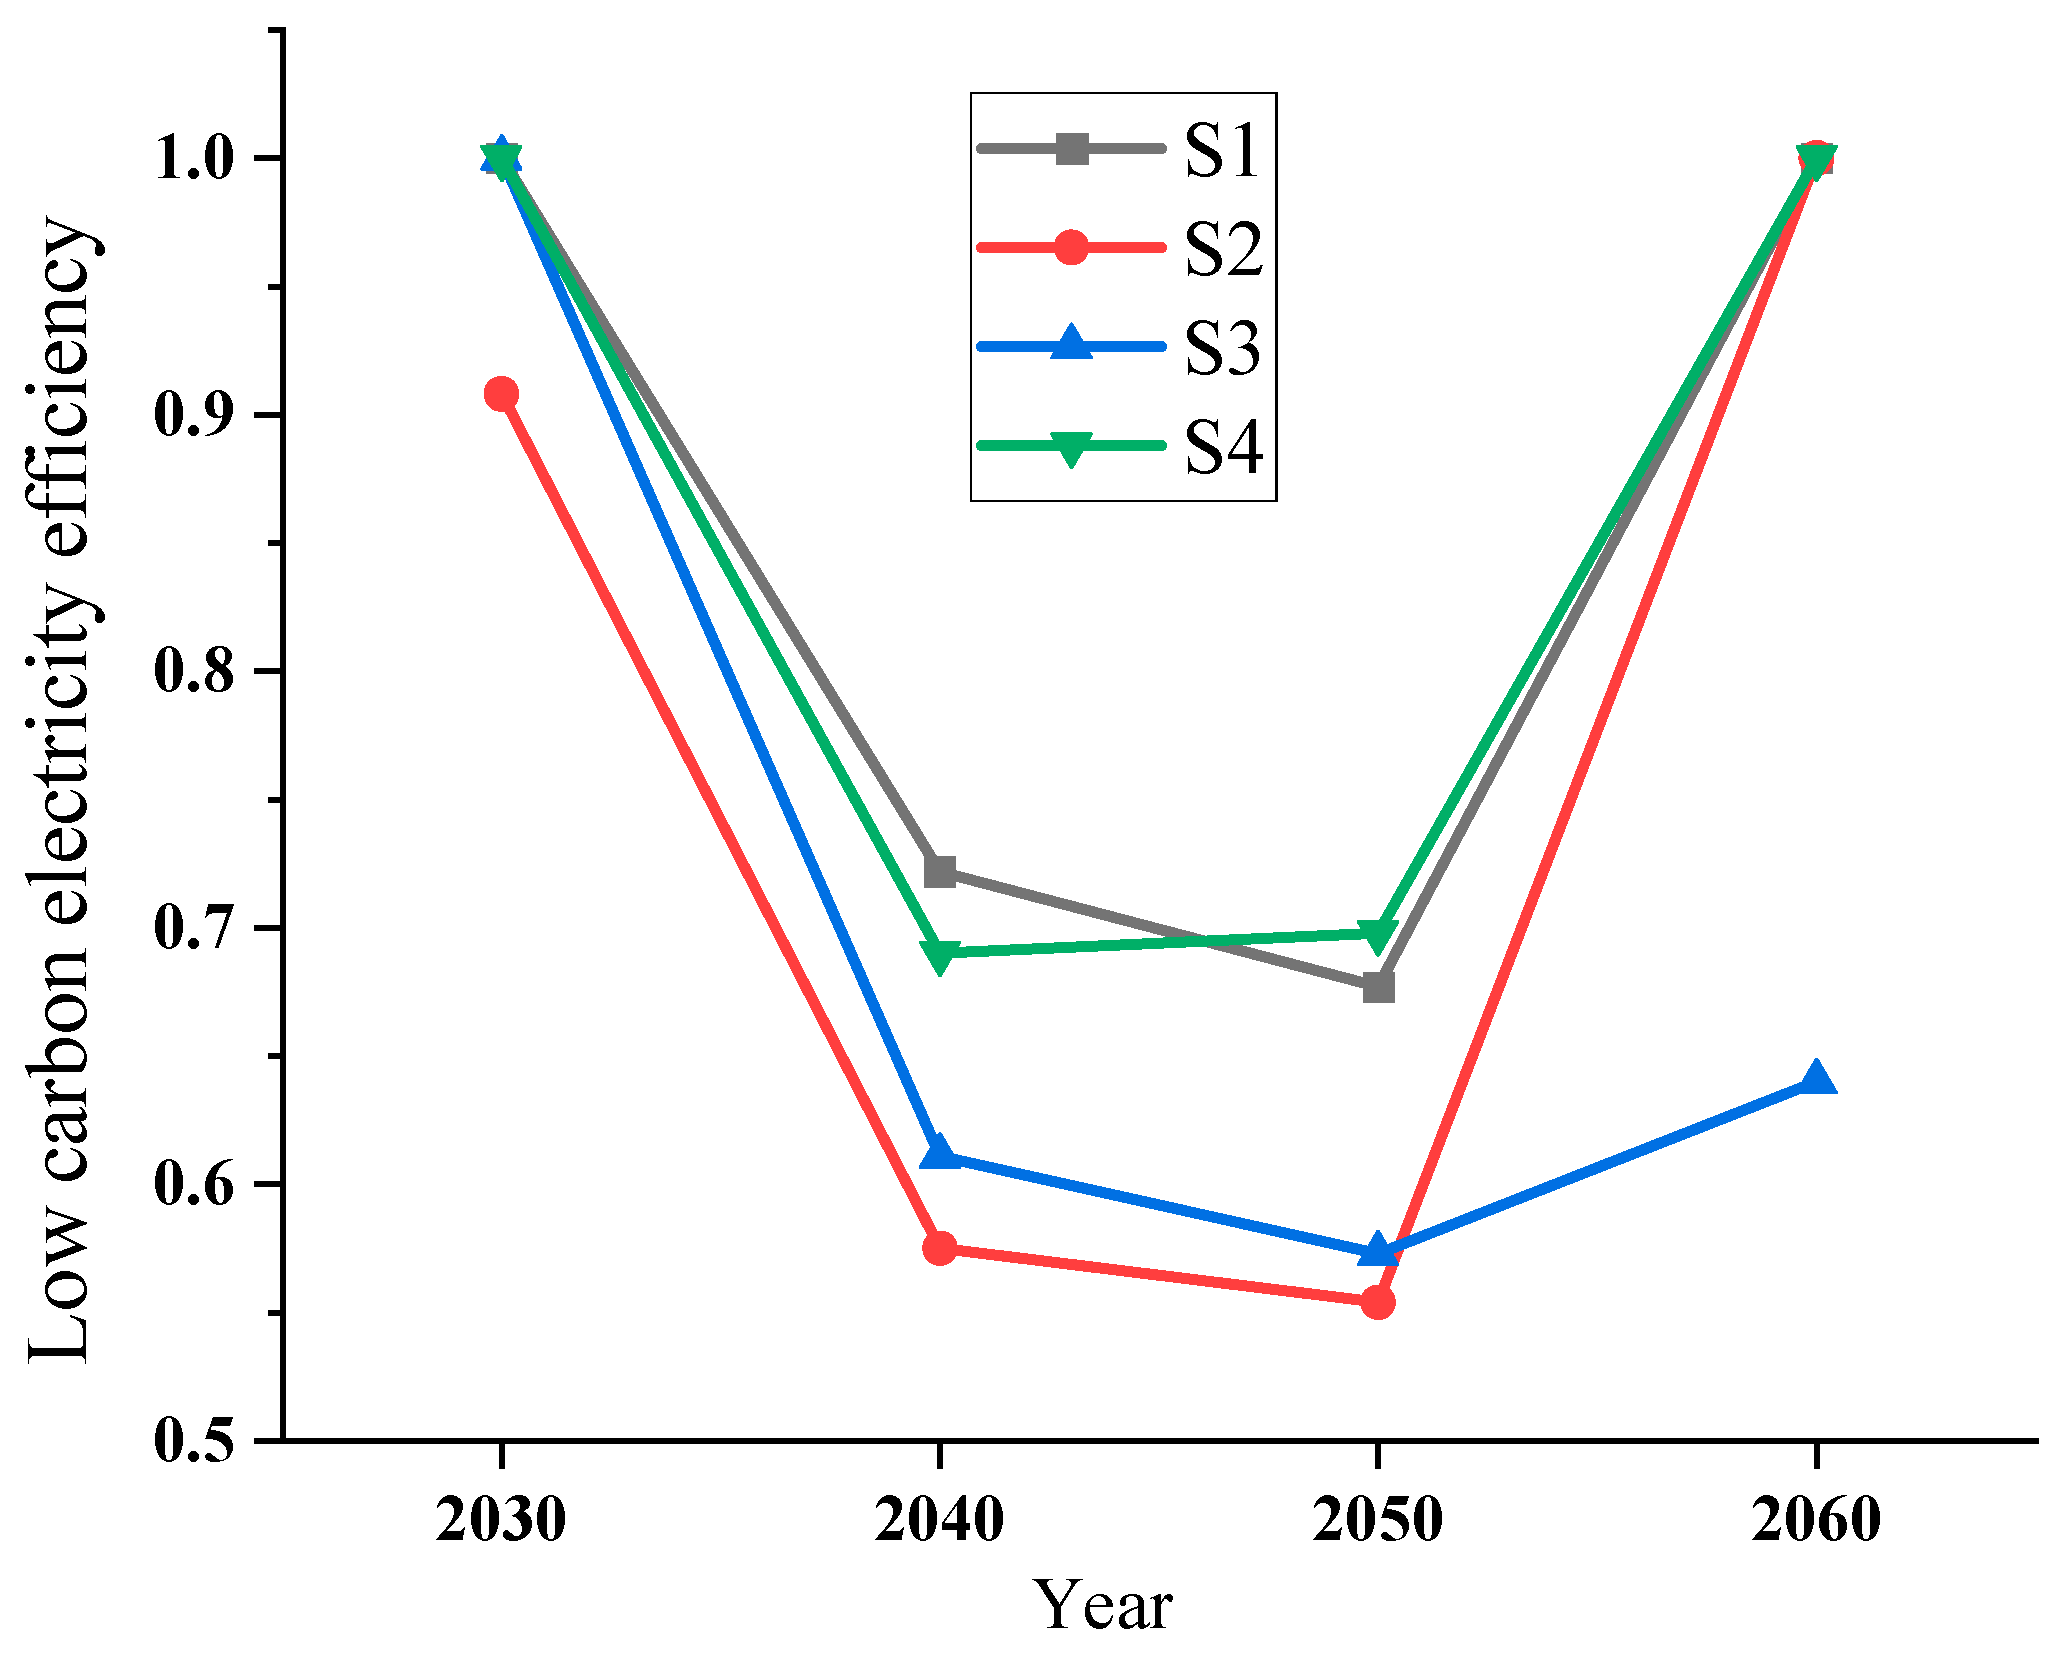
4.5. Low-Carbon Electricity Efficiency
4.6. Low-Carbon Electricity Influencing Factors Analysis
5. Conclusions, Policy Implications, and Future Work
5.1. Conclusions
- (1)
- Regarding carbon emissions in the energy system, the contribution of carbon reduction in the energy system for each scenario is in the order of CCS technology scenarios > renewable energy and energy storage > TCE and TGC > demand response. According to the total cost comparison among different scenarios, combined with the carbon reduction potential, Inner Mongolia should focus on the synergistic effect of “renewable energy and storage system” and “TCE and TGC” in the short term. On the one hand, it has rich wind energy and solar energy resources; on the other hand, carbon prices and green electricity certification can increase the benefits of low-carbon electricity in reducing carbon emissions in the power system. With the decline in the cost of low-carbon electricity technology, Inner Mongolia should aim to achieve major decarbonization and the goal of being carbon-neutral by 2060. The deployment of CCS technology should be accelerated in the medium and long term because coal-fired power is still dominant in this region, and it is difficult to retire in the short term. Although the high share of renewable energy meets most of the electricity demand, coal-fired power is responsible for ensuring peak load regulation capacity and grid stability. In addition, the auxiliary role of demand response should be strengthened. It not only has the lowest cost but also prevents overcapacity and abandonment in solar and wind power.
- (2)
- Regarding influencing factors in low-carbon electricity, the low-carbon electricity structure, carbon productivity, energy intensity, and carbon emission are the most critical. The low-carbon electricity structure and carbon productivity are the main positive drivers in the growth of low-carbon electricity; the energy intensity and carbon emission are the main negative constraints, and electricity intensity and energy security have lower impacts. As the cost of low-carbon technology continues to decline, it will be deployed on a large scale to significantly reduce total carbon emissions. Under the cost constraints, the Inner Mongolia region should coordinate the development of both carbon emission reduction and the installed capacity of low-carbon electricity. From the perspective of power generation effectiveness in low-carbon electricity, the low-carbon electricity generation efficiency in each scenario is ranked as follows: renewable energy and energy storage are the highest, the TCE and TGC are second, and demand response is the lowest. In the process of improving efficiency, it is essential to balance the dynamic relationship between energy production and consumption and optimize the configuration of the installed capacity of different types of power generation. This is because Inner Mongolia has abundant fossil fuels and CFPPs, meaning that it would be difficult to retire all coal-fired power units in the long term.
5.2. Policy Implications
5.2.1. Strengthening Low-Carbon Electricity Trading System
5.2.2. Focus on the Development of Storage Systems and CCS Retrofitting Technology
5.2.3. Strengthen Public Awareness of Energy Saving
5.3. Future Work
Author Contributions
Funding
Data Availability Statement
Conflicts of Interest
Abbreviations
| LMDI | Logarithmic Mean Divisia Index |
| SBM-DEA | Slack-Based Measure-Data Envelopment Analysis |
| CFPPs | Coal-fired power plants |
| TCE | Tradable carbon emission |
| TGC | Tradable green certification |
| LEAP | Low Emissions Analysis Platform |
| CCS | Carbon capture and storage |
| CCUS | Carbon capture, storage, and utilization |
| OM | Operation and maintenance |
| GDP | Gross domestic product |
| DMUs | Decision-making units |
| CNY | Chinese yuan |
Appendix A

| Items | Cost | Unit | 2020 | 2030 | 2040 | 2050 | 2060 |
|---|---|---|---|---|---|---|---|
| Wind power | Investment cost | CNY/kW | 8149 | 7608 | 7456 | 7302 | 6580 |
| Fixed OM cost | CNY/kW | 310 | 290 | 270 | 250 | 230 | |
| Variable OM cost | CNY/kWh | 0.087 | 0.079 | 0.071 | 0.063 | 0.055 | |
| Solar power | Investment cost | CNY/kW | 8000 | 7527 | 7082 | 6619 | 6160 |
| Fixed OM cost | CNY/kW | 216 | 206.00 | 196 | 186 | 176 | |
| Variable OM cost | CNY/kWh | 0.060 | 0.051 | 0.043 | 0.036 | 0.030 | |
| Coal-fired power | Investment cost | CNY/kW | 5620 | 5293 | 4985 | 4695 | 4421 |
| Fixed OM cost | CNY/kW | 150 | 135 | 120 | 105 | 90 | |
| Variable OM cost | CNY/kWh | 0.19 | 0.16 | 0.13 | 0.10 | 0.07 | |
| Coal-fired power with CCS | Investment cost | CNY/kW | 36,688 | 33,020 | 29,718 | 26,747 | 24,073 |
| Fixed OM cost | CNY/kW | 229 | 200 | 180 | 162 | 145 | |
| Variable OM cost | CNY/kWh | 2.5 | 2.0 | 1.5 | 1.0 | 0.5 | |
| Storage (Li battery) | Investment cost | CNY/kW | 1700 | 1500 | 1300 | 1100 | 900 |
| Fixed OM cost | CNY/kW | 55 | 50 | 45 | 40 | 35 | |
| Storage (Hydrogen storage) | Investment cost | CNY/kW | 4699 | 4514 | 4337 | 4167 | 4004 |
| Fixed OM cost | CNY/kW | 105 | 95 | 85 | 75 | 65 |
| Items | Unit | 2020 | 2030 | 2040 | 2050 | 2060 |
|---|---|---|---|---|---|---|
| Wind | CO2g/kWh | 7 | 6 | 5 | 4 | 3 |
| Solar | CO2g/kWh | 65 | 58 | 50 | 41 | 31 |
| Coal-fired | CO2g/kWh | 930 | 900 | 860 | 810 | 750 |
| Coal-fired with CCS | CO2g/kWh | 93 | 90 | 86 | 81 | 75 |
| Li battery | CO2g/kWh | 72 | 67 | 62 | 57 | 52 |
| Hydrogen storage | CO2g/kWh | 61 | 57 | 53 | 49 | 44 |
References
- Net Zero by 2050—Analysis. Available online: https://www.iea.org/reports/net-zero-by-2050 (accessed on 4 June 2025).
- Xi’s Speeches at UN Meetings Marking 75th Anniversary Published. Available online: https://www.chinadaily.com.cn/a/202010/21/WS5f902505a31024ad0ba801c7.html (accessed on 4 June 2025).
- Yang, F.; Jia, L.; Zhou, Y.; Guan, D.; Feng, K.; Choi, Y.; Zhang, N.; Li, J. Life Cycle Assessment Shows That Retrofitting Coal-Fired Power Plants with Fuel Cells Will Substantially Reduce Greenhouse Gas Emissions. One Earth 2022, 5, 392–402. [Google Scholar] [CrossRef]
- Wang, B.; Wang, L.; Zhong, S.; Xiang, N.; Qu, Q. Low-Carbon Transformation of Electric System against Power Shortage in China: Policy Optimization. Energies 2022, 15, 1574. [Google Scholar] [CrossRef]
- Geels, F.W.; Berkhout, F.; van Vuuren, D.P. Bridging Analytical Approaches for Low-Carbon Transitions. Nat. Clim. Chang. 2016, 6, 576–583. [Google Scholar] [CrossRef]
- Yin, J.N.; Huang, G.H.; Xie, Y.L.; An, Y.K. Carbon-Subsidized Inter-Regional Electric Power System Planning under Cost-Risk Tradeoff and Uncertainty: A Case Study of Inner Mongolia, China. Renew. Sustain. Energy Rev. 2021, 135, 110439. [Google Scholar] [CrossRef]
- Wang, X.; Lu, Z.; Li, T.; Zhang, P. Carbon-Neutral Power System Transition Pathways for Coal-Dominant and Renewable Resource-Abundant Regions: Inner Mongolia as a Case Study. Energy Convers. Manag. 2023, 285, 117013. [Google Scholar] [CrossRef]
- Dai, H.; Mischke, P.; Xie, X.; Xie, Y.; Masui, T. Closing the Gap? Top-down versus Bottom-up Projections of China’s Regional Energy Use and CO2 Emissions. Appl. Energy 2016, 162, 1355–1373. [Google Scholar] [CrossRef]
- Xiao, Y.; Yang, C.; Chen, T.; Lei, M.; Wattana, S.; Wattana, B. Strategies of a Wind–Solar–Storage System in Jiangxi Province Using the LEAP–NEMO Framework for Achieving Carbon Peaking Goals. Energies 2025, 18, 1135. [Google Scholar] [CrossRef]
- Li, S.; Kong, W.; Wang, Y.; Yuan, L. Medium and Long-Term Energy Demand Forecasts by Sectors in China under the Goal of “Carbon Peaking & Carbon Neutrality”: Based on the LEAP-China Model. Energy 2024, 310, 133017. [Google Scholar] [CrossRef]
- Bhuvanesh, A.; Jaya Christa, S.T.; Kannan, S.; Karuppasamy Pandiyan, M. Aiming towards Pollution Free Future by High Penetration of Renewable Energy Sources in Electricity Generation Expansion Planning. Futures 2018, 104, 25–36. [Google Scholar] [CrossRef]
- Zhang, Z.; Jia, J.; Guo, Y.; Wu, B.; Chen, C. Scenario of Carbon Dioxide (CO2) Emission Peaking and Reduction Path Implication in Five Northwestern Provinces of China by the Low Emissions Analysis Platform (LEAP) Model. Front. Energy Res. 2022, 10, 983751. [Google Scholar] [CrossRef]
- Akpahou, R.; Mensah, L.D.; Quansah, D.A.; Kemausuor, F. Long-Term Energy Demand Modeling and Optimal Evaluation of Solutions to Renewable Energy Deployment Barriers in Benin: A LEAP-MCDM Approach. Energy Rep. 2024, 12, 1888–1904. [Google Scholar] [CrossRef]
- El-Sayed, A.H.A.; Khalil, A.; Yehia, M. Modeling Alternative Scenarios for Egypt 2050 Energy Mix Based on LEAP Analysis. Energy 2023, 266, 126615. [Google Scholar] [CrossRef]
- Wang, P.; Wang, C.; Hu, Y.; Liu, Z. Analysis of Energy Consumption in Hunan Province (China) Using a LMDI Method Based LEAP Model. Energy Procedia 2017, 142, 3160–3169. [Google Scholar] [CrossRef]
- LMDI Decomposition of Energy-Related CO2 Emissions Based on Energy and CO2 Allocation Sankey Diagrams: The Method and an Application to China. Available online: https://www.mdpi.com/2071-1050/10/2/344 (accessed on 4 June 2025).
- Mousavi, B.; Lopez, N.S.A.; Biona, J.B.M.; Chiu, A.S.F.; Blesl, M. Driving Forces of Iran’s CO2 Emissions from Energy Consumption: An LMDI Decomposition Approach. Appl. Energy 2017, 206, 804–814. [Google Scholar] [CrossRef]
- De Oliveira-De Jesus, P.M. Effect of Generation Capacity Factors on Carbon Emission Intensity of Electricity of Latin America & the Caribbean, a Temporal IDA-LMDI Analysis. Renew. Sustain. Energy Rev. 2019, 101, 516–526. [Google Scholar] [CrossRef]
- Wang, W.; Liu, X.; Zhang, M.; Song, X. Using a New Generalized LMDI (Logarithmic Mean Divisia Index) Method to Analyze China’s Energy Consumption. Energy 2014, 67, 617–622. [Google Scholar] [CrossRef]
- Tone, K. A Slacks-Based Measure of Efficiency in Data Envelopment Analysis. Eur. J. Oper. Res. 2001, 130, 498–509. [Google Scholar] [CrossRef]
- Fong, W.; Sun, Y.; Chen, Y. Examining the Relationship between Energy Consumption and Unfavorable CO2 Emissions on Sustainable Development by Going through Various Violated Factors and Stochastic Disturbance–Based on a Three-Stage SBM-DEA Model. Energies 2022, 15, 569. [Google Scholar] [CrossRef]
- Shu, T.; Liao, X.; Yang, S.; Yu, T. Towards Sustainability: Evaluating Energy Efficiency with a Super-Efficiency SBM-DEA Model across 168 Economies. Appl. Energy 2024, 376, 124254. [Google Scholar] [CrossRef]
- Gökgöz, F.; Erkul, E. Investigating the Energy Efficiencies of European Countries with Super Efficiency Model and Super SBM Approaches. Energy Effic. 2019, 12, 601–618. [Google Scholar] [CrossRef]
- Choi, Y.; Yu, Y.; Lee, H.S. A Study on the Sustainable Performance of the Steel Industry in Korea Based on SBM-DEA. Sustainability 2018, 10, 173. [Google Scholar] [CrossRef]
- Huang, H.; Wang, T. The Total-Factor Energy Efficiency of Regions in China: Based on Three-Stage SBM Model. Sustainability 2017, 9, 1664. [Google Scholar] [CrossRef]
- Nyangchak, N. Assessing Renewable Energy Efficiency and Policies: A Combined Analysis of LMDI, Super-SBM, and Fieldwork in Qinghai, China. Energy Sustain. Dev. 2024, 80, 101420. [Google Scholar] [CrossRef]
- Gong, W.; Zhu, B.; Wang, C.; Fan, Z.; Zhao, M.; Chen, L. Factor decomposition and regression analysis of the energy related carbon emissions in Shandong, China: A perspective of industrial structure. Energy Eng. J. Assoc. Energy Eng. 2021, 118, 981. [Google Scholar] [CrossRef]
- Li, R.; Han, X.; Wang, Q. Do Technical Differences Lead to a Widening Gap in China’s Regional Carbon Emissions Efficiency? Evidence from a Combination of LMDI and PDA Approach. Renew. Sustain. Energy Rev. 2023, 182, 113361. [Google Scholar] [CrossRef]
- Cong, R.; Abe, M.; Fujiyama, A.; Matsumoto, T. An Intelligent-Based Framework for Urban Energy Transition and Sustainable Development. Renew. Energy 2025, 250, 123323. [Google Scholar] [CrossRef]
- Zhang, X.; Fan, D. Carbon Emission Quota Allocation of High Energy Consumption Industries in Undeveloped Areas—A Case Study of Inner Mongolia Autonomous Region. Heliyon 2022, 8, e11241. [Google Scholar] [CrossRef]
- Tseng, S.-W. Analysis of Energy-Related Carbon Emissions in Inner Mongolia, China. Sustainability 2019, 11, 7008. [Google Scholar] [CrossRef]
- Li, B.; Cong, R.; Matsumoto, T.; Li, Y. Optimal Energy Storage System and CCS Accelerate Energy Decarbonization: A Case Study of Inner Mongolia, China. J. Hum. Environ. Symbiosis 2025, 41, 46–60. [Google Scholar] [CrossRef]
- Zhao, W. China’s Goal of Achieving Carbon Neutrality before 2060: Experts Explain How. Natl. Sci. Rev. 2022, 9, nwac115. [Google Scholar] [CrossRef]
- 14th Five Year Plan of the Inner Mongolia Autonomous Region to Deal with Climate Change|FAOLEX. Available online: https://www.fao.org/faolex/results/details/zh/c/LEX-FAOC206373/ (accessed on 4 June 2025).
- Kahrl, F.; Lin, J.; Liu, X.; Hu, J. Sunsetting Coal Power in China. iScience 2021, 24, 102939. [Google Scholar] [CrossRef] [PubMed]
- Fang, K.; Tang, Y.; Zhang, Q.; Song, J.; Wen, Q.; Sun, H.; Ji, C.; Xu, A. Will China Peak Its Energy-Related Carbon Emissions by 2030? Lessons from 30 Chinese Provinces. Appl. Energy 2019, 255, 113852. [Google Scholar] [CrossRef]
- Litynskia, J.; McNemara, A.; Rodostaa, T.; Deela, D.; Vikarab, D.; Srivastavab, R.D.; Myerc, L.; Kanec, R.U.S. DOE’s Efforts to Promote Knowledge Sharing Opportunities from R&D Efforts: Development of the U.S. Carbon Utilization and Storage Atlas and Best Practices Manuals. Energy Procedia 2013, 37, 6112–6124. [Google Scholar] [CrossRef]
- Oberthür, S. The New Climate Policies of the European Union: Internal Legislation and Climate Diplomacy; ASP/Vubpress/UPA: Brussels, Belgium, 2010; ISBN 978-90-5487-607-6. [Google Scholar]
- Global CCS Institute. Global Status of CCS 2023—Report & Executive Summary; Global CCS Institute: Melbourne, Australia, 2023. [Google Scholar]
- Liu, Q.; Wang, Q.; Hong, Q. China’s Energy Transition with the Scenario of Carbon Neutrality, Outlook by 2060. In Annual Report on China’s Petroleum, Gas and New Energy Industry (2021); Cai, F., Ma, Y., Jin, Z., Eds.; Springer Nature: Singapore, 2022; pp. 25–44. ISBN 978-981-19-6076-5. [Google Scholar]
- Duan, W.; Zhao, W.; Xu, D. Study on the Pathway of Energy Transition in Inner Mongolia under the “Dual Carbon” Goal. Heliyon 2024, 10, e39764. [Google Scholar] [CrossRef]
- Yu, S.; Horing, J.; Liu, Q.; Dahowski, R.; Davidson, C.; Edmonds, J.; Liu, B.; Mcjeon, H.; McLeod, J.; Patel, P.; et al. CCUS in China’s Mitigation Strategy: Insights from Integrated Assessment Modeling. Int. J. Greenh. Gas Control 2019, 84, 204–218. [Google Scholar] [CrossRef]
- Zhang, Z.; Du, X.; Shang, Y.; Zhang, J.; Zhao, W.; Su, J. Research on Demand Response Potential of Adjustable Loads in Demand Response Scenarios. Energy Eng. 2024, 121, 1577–1605. [Google Scholar] [CrossRef]
- Pang, Y.; He, Y.; Jiao, J.; Cai, H. Power Load Demand Response Potential of Secondary Sectors in China: The Case of Western Inner Mongolia. Energy 2020, 192, 116669. [Google Scholar] [CrossRef]
- Wang, H.; Zhang, J.; Wang, P.; Zhang, N. The Role of Demand-Side Flexibilities on Low-Carbon Transition in Power System: A Case Study of West Inner Mongolia, China. Renew. Energy 2025, 242, 122478. [Google Scholar] [CrossRef]
- Zhang, K.; Wang, X.; Yang, H.; Chen, Q.; Jiang, C.; Ke, J. Industrial Virtual Power Plants in Western Inner Mongolia: The Potential to Enhance Grid Flexibility and Improve Energy Management. IEEE Electrif. Mag. 2025, 13, 90–100. [Google Scholar] [CrossRef]
- Li, J.; Hu, Y.; Chi, Y.; Liu, D.; Yang, S.; Gao, Z.; Chen, Y. Analysis on the Synergy between Markets of Electricity, Carbon, and Tradable Green Certificates in China. Energy 2024, 302, 131808. [Google Scholar] [CrossRef]
- Chang, X.; Wu, Z.; Wang, J.; Zhang, X.; Zhou, M.; Yu, T.; Wang, Y. The Coupling Effect of Carbon Emission Trading and Tradable Green Certificates under Electricity Marketization in China. Renew. Sustain. Energy Rev. 2023, 187, 113750. [Google Scholar] [CrossRef]
- Wang, X.; Chen, H.; Tong, X.; Gao, Y.; Pan, P.; Liu, W. Optimal Scheduling of a Multi-Energy Complementary System Simultaneously Considering the Trading of Carbon Emission and Green Certificate. Energy 2024, 310, 133212. [Google Scholar] [CrossRef]
- Zhuo, Z.; Du, E.; Zhang, N.; Nielsen, C.P.; Lu, X.; Xiao, J.; Wu, J.; Kang, C. Cost Increase in the Electricity Supply to Achieve Carbon Neutrality in China. Nat. Commun. 2022, 13, 3172. [Google Scholar] [CrossRef] [PubMed]
- Fan, J.-L.; Xu, M.; Li, F.; Yang, L.; Zhang, X. Carbon Capture and Storage (CCS) Retrofit Potential of Coal-Fired Power Plants in China: The Technology Lock-in and Cost Optimization Perspective. Appl. Energy 2018, 229, 326–334. [Google Scholar] [CrossRef]
- Liu, T.; Yang, Z.; Duan, Y.; Hu, S. Techno-Economic Assessment of Hydrogen Integrated into Electrical/Thermal Energy Storage in PV+ Wind System Devoting to High Reliability. Energy Convers. Manag. 2022, 268, 116067. [Google Scholar] [CrossRef]
| Items | Variable Type | Variable Name | Unit |
|---|---|---|---|
| Input variables | Energy Consumption | Million T | |
| Total cost | Billion CNY | ||
| Installed capacity | Thousand MW | ||
| Output variables | Desired output | Low-carbon electricity | Billion kWh |
| Undesired output | CO2 emission | Million T |
| Items | Scenario Descriptions |
|---|---|
| Scenario 1 (S1): The renewable energy + storage system | The percentage of renewable energy and storage systems will increase to 30% in 2030 and will reach 90% in 2060. |
| Scenario 2 (S2): The CCS technology development | The CFPPs will gradually be equipped with CCS, and the CFPPs with CCS will reach from 10% to 90% between 2030 and 2060. |
| Scenario 3 (S3): The demand response | In total, 10% of electricity users actively participate in demand response, and the demand response is 8% of the maximum load of the whole society in 2030; 40% of electricity users actively participate in demand response, and the demand response is 20% of the maximum load of the whole society in 2060. |
| Scenario 4 (S4): The TCE and TGC scenarios | Implementation of carbon price and green electricity prices in the power sectors, with a carbon price of 100 CNY/ton in 2030 and 700 CNY/ton in 2060, and a green electricity price of 100 CNY/MWh in 2030 and 500 CNY/MWh in 2060. |
| Index | 2020 | 2030 | 2040 | 2050 | 2060 |
|---|---|---|---|---|---|
| The average annual growth rate of GDP | 4.95% | 5.32% | 4.18% | 3.35% | 2.31% |
| The population (millions) | 25.23 | 23.40 | 22.98 | 22.06 | 21.11 |
| The urbanization rate | 67.84% | 69.96% | 71.25% | 75.41% | 77.38% |
| The proportion of the three industries | 11.84%: 39.56%: 48.59% | 6.55%: 38.04%: 57.73% | 5.54%: 36.53%: 59.48% | 4.53%: 35.01%: 61.23% | 3.50%: 33.50%: 63.00% |
| Item | Time | DMUs | ΔREEG | ΔREGP | ΔREPC | ΔRECI | ΔREIC |
|---|---|---|---|---|---|---|---|
| S1 | 2030 | 1 | 0 | 0 | 0 | 0 | 0 |
| 2040 | 2 | 26.2 | 0 | 0.4 | 134.1 | 62.6 | |
| 2050 | 3 | 33.5 | 0 | 1.4 | 194.7 | 68.3 | |
| 2060 | 4 | 0 | 0 | 0 | 0 | 0 | |
| S2 | 2030 | 5 | 13.5 | 0 | 0 | 10.5 | 14.6 |
| 2040 | 6 | 71.6 | 0 | 0 | 256.7 | 93.5 | |
| 2050 | 7 | 78.3 | 31.2 | 1.5 | 292.1 | 78.3 | |
| 2060 | 8 | 0 | 0 | 0 | 0 | 0 | |
| S3 | 2030 | 9 | 0 | 0 | 0 | 0 | 0 |
| 2040 | 10 | 63.1 | 0 | 0.4 | 166.5 | 133.5 | |
| 2050 | 11 | 91.8 | 0 | 0.5 | 294.6 | 173.1 | |
| 2060 | 12 | 6.9 | 0 | 1.5 | 0 | 145.8 | |
| S4 | 2030 | 13 | 0 | 0 | 0 | 0 | 0 |
| 2040 | 14 | 45.8 | 0 | 0 | 183.5 | 77.7 | |
| 2050 | 15 | 47.8 | 0 | 0 | 273.2 | 71.6 | |
| 2060 | 16 | 0 | 0 | 0 | 0 | 0 |
| Item | Time | ΔLELG | ΔLEGP | ΔLEPC | ΔLECI | ΔLEIC | ΔLECC | ΔLE |
|---|---|---|---|---|---|---|---|---|
| S1 | 2020–2030 | 72.47 | 91.11 | 37.44 | −35.86 | 45.63 | −27.45 | 183.33 |
| 2030–2040 | 148.30 | 72.89 | 23.18 | −117.22 | 150.15 | −7.33 | 269.96 | |
| 2040–2050 | 169.34 | 135.27 | 60.63 | −208.45 | 326.61 | −131.47 | 351.94 | |
| 2050–2060 | 168.23 | 72.43 | 418.82 | −386.33 | 614.11 | −569.40 | 317.86 | |
| S2 | 2020–2030 | 50.31 | 83.11 | 19.85 | −17.13 | 31.58 | −25.04 | 142.67 |
| 2030–2040 | 239.38 | 72.97 | −26.59 | −191.03 | 349.97 | −7.34 | 437.36 | |
| 2040–2050 | 272.55 | 159.26 | −50.71 | −271.26 | 1043.60 | −154.79 | 998.65 | |
| 2050–2060 | 68.24 | 84.05 | 169.24 | −102.84 | 610.51 | −660.78 | 168.42 | |
| S3 | 2020–2030 | 52.69 | 83.99 | −37.21 | 44.99 | −37.44 | −25.31 | 81.71 |
| 2030–2040 | 132.77 | 64.19 | 2.85 | −94.01 | 119.32 | −6.46 | 218.68 | |
| 2040–2050 | 151.58 | 119.69 | −0.76 | −158.60 | 246.66 | −116.33 | 242.24 | |
| 2050–2060 | 164.33 | 64.70 | 197.15 | −210.41 | 370.53 | −508.68 | 77.62 | |
| S4 | 2020–2030 | 82.46 | 94.58 | 31.07 | −29.96 | 51.78 | −28.50 | 201.43 |
| 2030–2040 | 187.10 | 80.15 | −14.26 | −132.57 | 260.47 | −8.06 | 372.83 | |
| 2040–2050 | 191.74 | 152.88 | 5.59 | −171.37 | 537.90 | −148.59 | 568.15 | |
| 2050–2060 | 126.27 | 79.62 | 237.18 | −166.22 | 774.86 | −625.99 | 425.74 |
| Item | Time | ΔLELG | ΔLEGP | ΔLEPC | ΔLECI | ΔLEIC | ΔLECC |
|---|---|---|---|---|---|---|---|
| S1 | 2020–2030 | 0.40 | 0.50 | 0.2 | −0.2 | 0.25 | −0.15 |
| 2030–2040 | 0.55 | 0.27 | 0.09 | −0.43 | 0.56 | −0.03 | |
| 2040–2050 | 0.48 | 0.38 | 0.17 | −0.59 | 0.93 | −0.37 | |
| 2050–2060 | 0.53 | 0.23 | 1.32 | −1.22 | 1.93 | −1.79 | |
| S2 | 2020–2030 | 0.35 | 0.58 | 0.14 | −0.12 | 0.22 | −0.18 |
| 2030–2040 | 0.55 | 0.17 | −0.06 | −0.44 | 0.80 | −0.02 | |
| 2040–2050 | 0.27 | 0.16 | −0.05 | −0.27 | 1.05 | −0.15 | |
| 2050–2060 | 0.41 | 0.50 | 1.00 | −0.61 | 3.62 | −3.92 | |
| S3 | 2020–2030 | 0.64 | 1.03 | −0.46 | 0.55 | −0.46 | −0.31 |
| 2030–2040 | 0.61 | 0.29 | 0.01 | −0.43 | 0.55 | −0.03 | |
| 2040–2050 | 0.63 | 0.49 | 0.00 | −0.65 | 1.02 | −0.48 | |
| 2050–2060 | 2.12 | 0.83 | 2.54 | −2.71 | 4.77 | −6.55 | |
| S4 | 2020–2030 | 0.41 | 0.47 | 0.15 | −0.15 | 0.26 | −0.14 |
| 2030–2040 | 0.50 | 0.21 | −0.04 | −0.36 | 0.70 | −0.02 | |
| 2040–2050 | 0.34 | 0.27 | 0.01 | −0.30 | 0.95 | −0.26 | |
| 2050–2060 | 0.30 | 0.19 | 0.56 | −0.39 | 1.82 | −1.47 |
Disclaimer/Publisher’s Note: The statements, opinions and data contained in all publications are solely those of the individual author(s) and contributor(s) and not of MDPI and/or the editor(s). MDPI and/or the editor(s) disclaim responsibility for any injury to people or property resulting from any ideas, methods, instructions or products referred to in the content. |
© 2025 by the authors. Licensee MDPI, Basel, Switzerland. This article is an open access article distributed under the terms and conditions of the Creative Commons Attribution (CC BY) license (https://creativecommons.org/licenses/by/4.0/).
Share and Cite
Li, B.; Cong, R.; Matsumoto, T.; Li, Y. Research on Different Energy Transition Pathway Analysis and Low-Carbon Electricity Development: A Case Study of an Energy System in Inner Mongolia. Energies 2025, 18, 3129. https://doi.org/10.3390/en18123129
Li B, Cong R, Matsumoto T, Li Y. Research on Different Energy Transition Pathway Analysis and Low-Carbon Electricity Development: A Case Study of an Energy System in Inner Mongolia. Energies. 2025; 18(12):3129. https://doi.org/10.3390/en18123129
Chicago/Turabian StyleLi, Boyi, Richao Cong, Toru Matsumoto, and Yajuan Li. 2025. "Research on Different Energy Transition Pathway Analysis and Low-Carbon Electricity Development: A Case Study of an Energy System in Inner Mongolia" Energies 18, no. 12: 3129. https://doi.org/10.3390/en18123129
APA StyleLi, B., Cong, R., Matsumoto, T., & Li, Y. (2025). Research on Different Energy Transition Pathway Analysis and Low-Carbon Electricity Development: A Case Study of an Energy System in Inner Mongolia. Energies, 18(12), 3129. https://doi.org/10.3390/en18123129