1. Introduction
The growing global demand for energy, driven by population growth and industrialization, continues to rely heavily on non-renewable sources, accounting for over 80% of primary energy consumption (
Table 1) [
1].
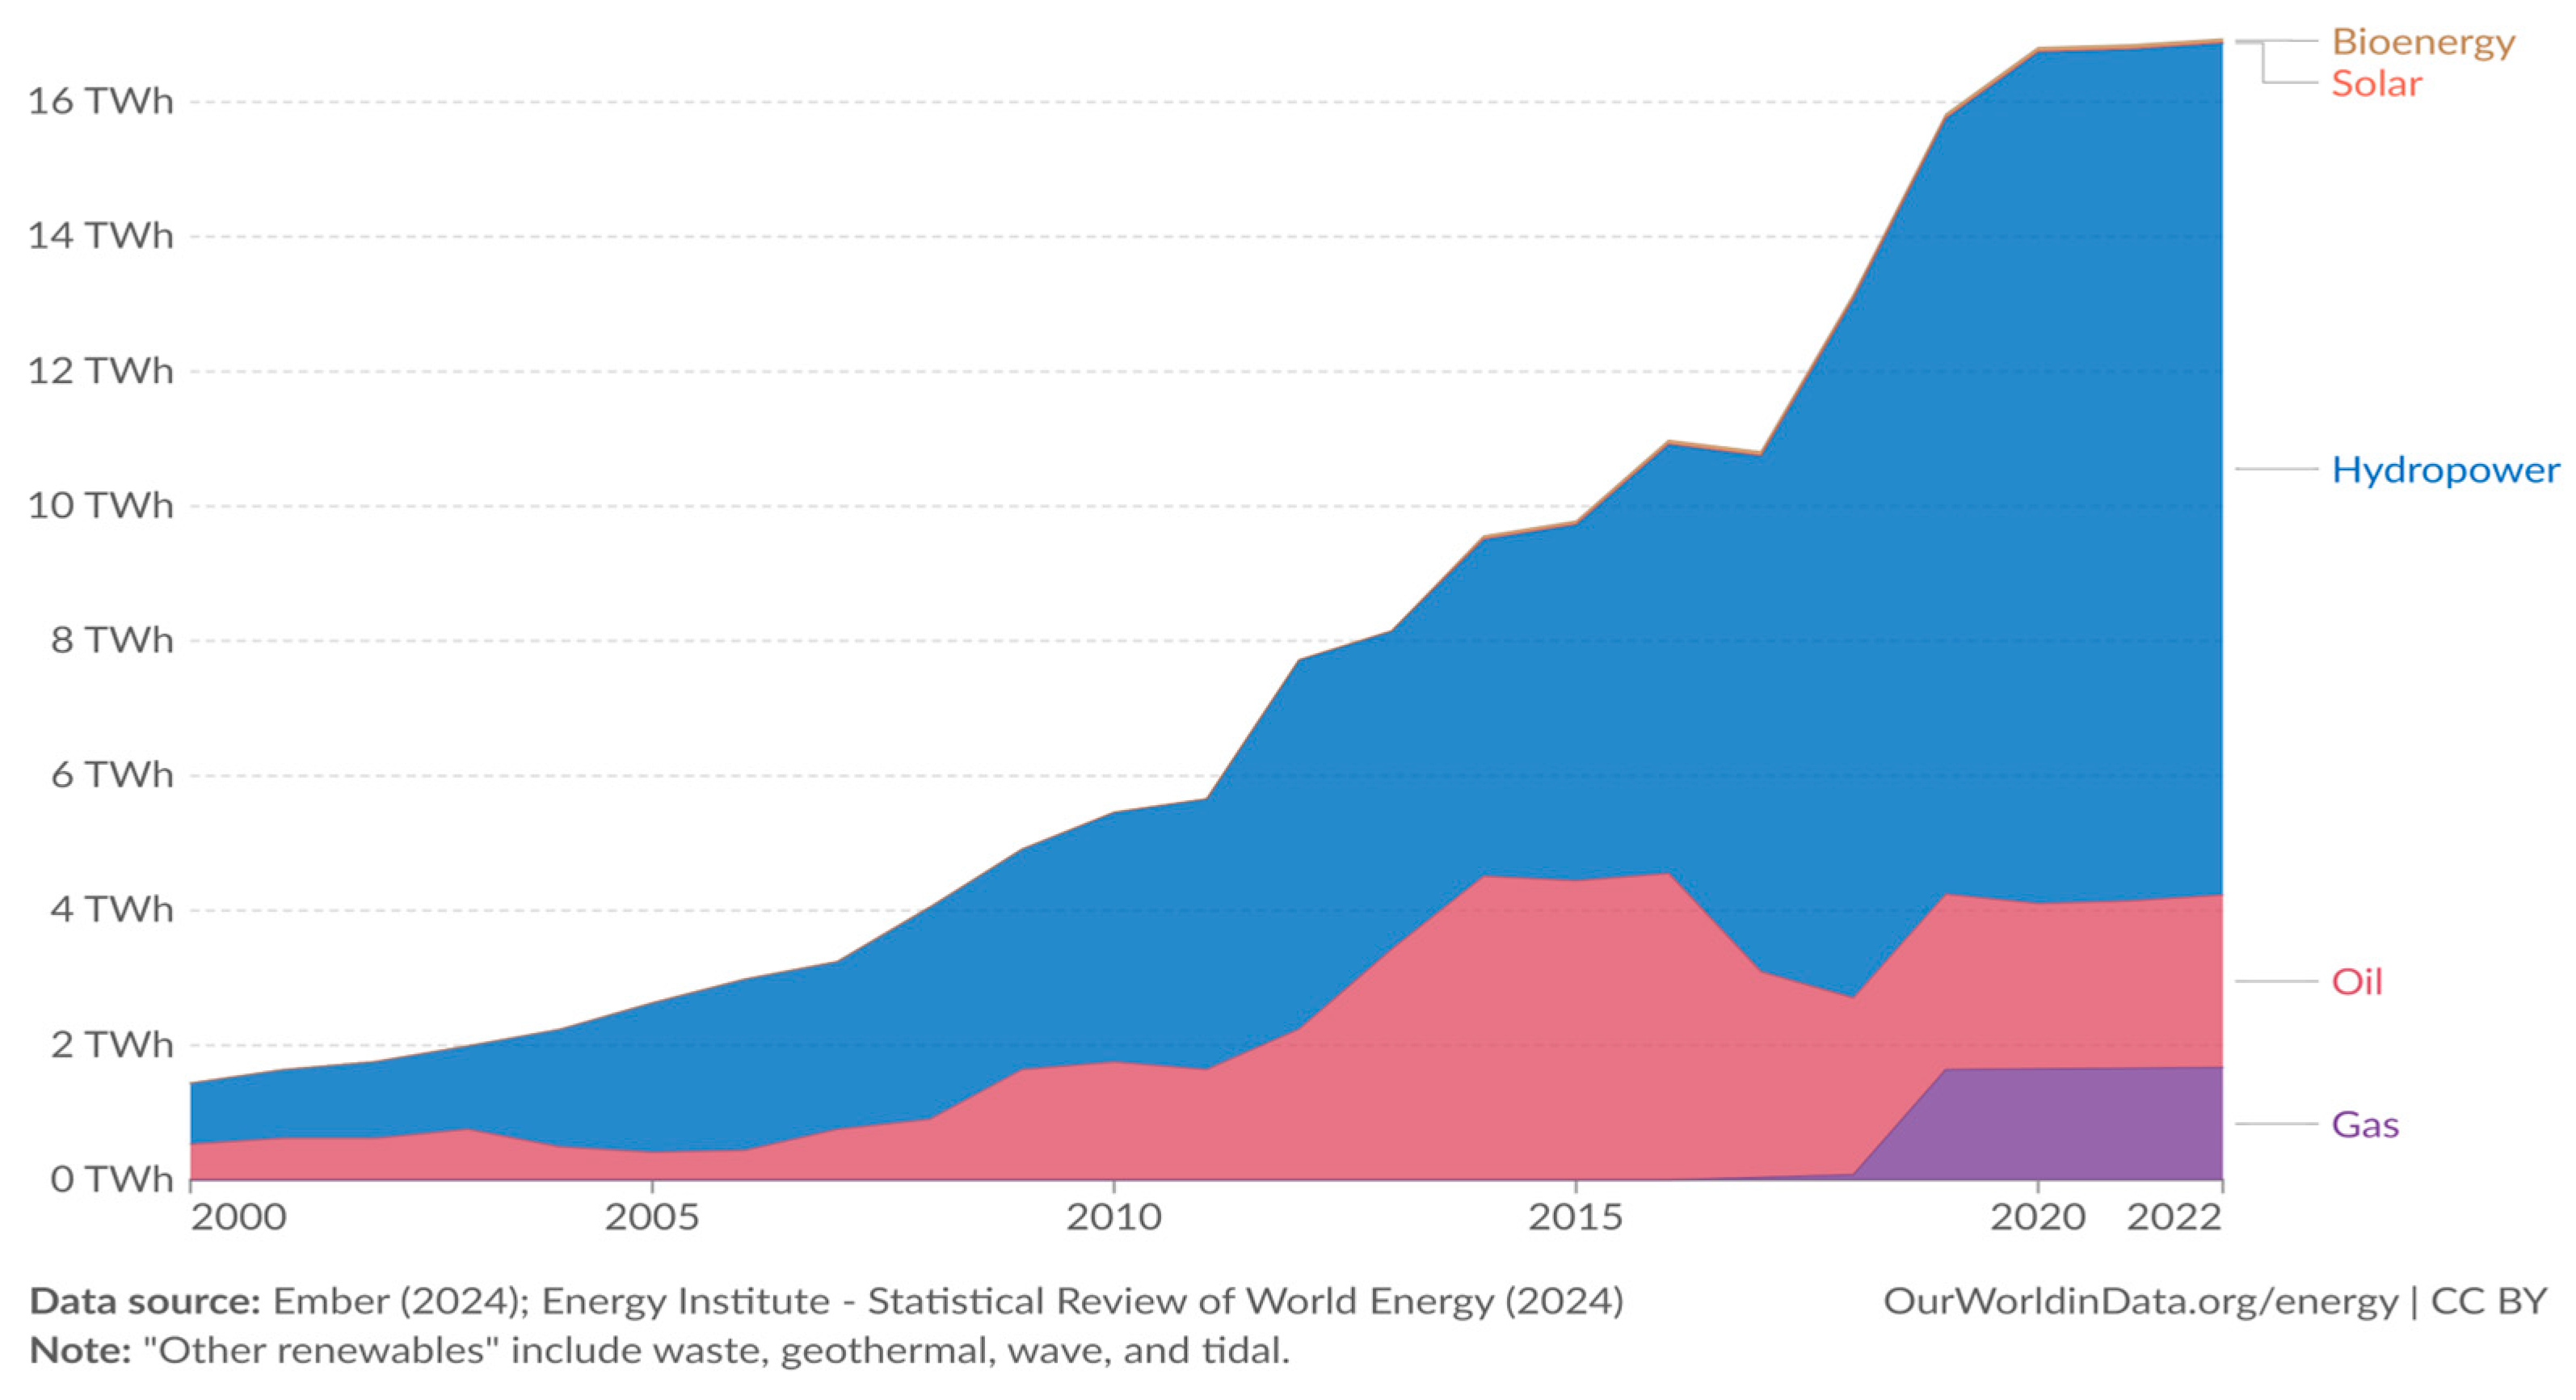
As can be seen in
Figure 1, in Angola, despite the predominance of hydropower in the energy mix (74.62%), electrification rates remain critically low, with only 42.8% coverage in urban areas and less than 10% in rural regions. This has led to widespread reliance on costly and polluting diesel generators [
2,
3].
Poorly managed municipal solid waste (MSW) exacerbates public health risks, contributing to endemic diseases caused by exposure to harmful compounds. Addressing these challenges requires innovative solutions that simultaneously mitigate environmental, energy, and public health issues. Hybrid renewable energy systems, integrating MSW gasification with solar photovoltaic (PV) technology, offer a promising pathway. The synergies between these sources ensure reliability, reduce intermittency, and promote energy security [
4,
5,
6,
7].
Freris and Infield [
8] point out that the synergies between different renewable sources are clearly too important to ignore and can often make the combined exploitable potential greater than the sum of the parts considered in isolation. Soudagar et al. [
9] indicate that hybrid systems complement each other to overcome the variable nature of renewable energy sources, such as solar and wind energy, and that, in conjunction with the storage system, they can improve system reliability, energy security, and sustainability. Lee et al. [
10] and Alhijazi et al. [
11] corroborate this, describing that single-source energy systems (PV and wind) can be unreliable and inefficient in terms of costs, given their intermittent availability, which interrupts the permanent supply of energy. Hybrid systems, on the other hand, increase energy storage capacity, reduce the cost of energy production, improve power quality, and increase total energy efficiency.
The use of MSW, for example, to generate energy helps to avoid the intermittency of a single-source renewable energy system if both sources are combined [
10]. These hybrid systems also offer greater flexibility in the use of local renewable resources and have a higher potential for local employment.
El-Sattar et al. [
12] carried out a study on an optimal hybrid system design of PV units, biomass gasification, an electrolyzer, and a fuel cell, for a remote area in Egypt, to meet the electricity demand, with a peak load of 420 kW. The study was developed using algorithms conducted in MATLAB and applied to solve the optimization problem related to the suggested configuration.
Another study was carried out in Egypt by El-Sattar et al. [
13], which aimed to size a hybrid off-grid PV system with biomass gasification and a battery, using a quantum model of the Runge–Kutta optimization algorithm. The results showed that the modification algorithm gives the best fitness function in terms of costs of energy, net present cost, and loss of power supply probability.
Cano et al. [
14] conducted a techno-economic assessment of a hybrid energy system in an isolated area of Ecuador using HOMER Pro v3.16.2 software. The system integrated 5 kW hydrokinetic turbines, 140 PV panels (35 kWp), batteries, and 70 kWe biomass gasifiers, which powered a 110 kWh gas microturbine to ensure electricity availability when solar and hydrokinetic sources were insufficient. The results confirmed the system’s feasibility by demonstrating reliable energy production, cost-effectiveness, and enhanced stability through diversified energy sources.
The study by Campos et al. [
15] evaluated a biomass–solar hybrid renewable energy system for João Pinheiro City (Brazil), using Ebsilon Professional software. It focused on energy, economic, and ecological aspects. The system achieved an overall energy efficiency of 17.43% and a Levelized Cost of Energy (LCOE) of 0.034 USD/kWh. The eco-efficiency indicator showed the environmental benefits of this system.
Another study carried out with HOMER Pro v3.16.2 was conducted by Ribó-Pérez et al. [
16], which concerned the modeling of biomass gasifiers and hybrid renewable energy microgrids in rural communities in Honduras and Zambia. This study indicated that the hybrid system analyzed was technically and economically viable.
The research by Yew et al. [
17] developed an optimal hybrid renewable energy system in HOMER Pro v3.16.2 software for Johor, Malaysia, integrating solar and biomass energy sources. The system, consisting of a 4075 kW PV, a 2100 kW biomass gasifier, 9363 battery units, and 1939 kW converters, proved to be cost-effective. It meets residential load demand with minimal unmet electric load and capacity shortage. This research highlights the economic viability and technical feasibility of a solar–biomass system.
An evaluation of the performance of a solar PV system combined with a biomass gasifier for electricity generation by Macías et al. [
18] was carried out in Central and South America. The system consisted of a downdraft fixed-bed gasifier connected to a 30 kWe motor generator and a 5 kWe solar PV system, with a battery storage system.
The study by Xin et al. [
19] introduced a biomass–solar hybrid system for sustainable fuel production, integrating solar-driven biomass gasification and PV electrolysis. The system improved energy efficiency by 6.57% and reduced the levelized cost of fuel by 12.5%. It also achieved a significant reduction in greenhouse gas (GHG) emissions, with an estimated −0.56 kg of CO
2 equivalent per kg of methanol produced.
In the studies referred to above, involving the hybrid systems of biomass gasification with PV systems, the common raw materials used are agro-industrial wastes such as sugarcane bagasse, eucalyptus, rice husks, palm kernel shells, coffee husks, pine needles, and rice straws, among others. However, there have been studies on the use of MSW in a hybrid PV system [
20,
21,
22]. For example, Balan et al. [
21], in a study carried out in Romania, made a techno-economic analysis of the on-grid hybrid system consisting of a 2.5 MW PV source and an MSW gasifier coupled to a 250 kWe internal combustion engine generator set. PV production is prioritized in the system, operating from 8 a.m. to 4 p.m., and the MSW gasification generator acts as a backup only in situations where PV production is not available.
Sun and Tang [
22] studied, in China, using Aspen Plus v11.0 software, an MSW gasification process integrated with solid oxide water electrolysis technology powered by PV panels to generate electricity and produce fuels such as methane, methanol, and dimethyl ether (DME). Pan et al. [
20] carried out a similar study; however, the difference lies in the fact that theses authors focused on the technology for producing methane from the syngas generated, enriched by hydrogen (H
2) from water electrolysis.
Previous studies have explored some hybrid systems in diverse contexts, emphasizing their technical and economic viability. However, little research has been conducted on integrating MSW gasification and PV systems in developing regions like Lobito (Angola), where energy poverty and waste mismanagement are acute. To address this knowledge gap, this research seeks to answer the following research questions:
How can the integration of MSW gasification and PV systems contribute to sustainable electricity generation in Lobito, Angola, a developing region?
What are the technical, economic, and environmental impacts of implementing a hybrid MSW-PV energy system, including its feasibility in reducing energy poverty and improving waste management?
Under what conditions can the hybrid system generate surplus electricity to support green hydrogen production through water electrolysis, and what are the key limitations in the current energy framework?
By addressing these questions, this research aims to explore the potential of combining a gasification plant of municipal solid waste (MSW) and a solar PV system to generate electricity and ensure a reliable power supply in Lobito, Angola. The primary objective is to evaluate the effectiveness of MSW gasification in electricity generation. Given that the current site for MSW landfilling has sufficient area and considering Lobito’s potential for generating electricity through solar radiation, this study incorporates a PV system to evaluate the potential of the hybrid system (MSW gasification + PV system).
The electricity production from gasification is based on MSW arriving at the landfill, rather than waste already deposited (urban mining). The process involves generating syngas from the incoming MSW, which is then gasified on site. The resulting electricity is directly supplied to the grid, ensuring efficient local electric energy generation without the need to transport syngas to other locations. If a significant energy surplus is identified, the feasibility of producing green hydrogen (H2) through water electrolysis is assessed. While this study includes an assessment of green hydrogen production via water electrolysis, it is recognized that this component’s feasibility depends on the availability of electricity excess, which remains constrained in the current Lobito energy framework.
To achieve these aims, a modeling and simulation study was developed to evaluate the potential for electricity generation. For the PV system, data from PVGIS v5.3 [
23], the PVsyst version 8 software, and MS Excel spreadsheets were utilized. A simulation of an MSW gasifier was conducted using Aspen Plus version 11.0. Both systems were integrated within the hybrid systems simulation software, HOMER Pro v3.16.2 version 3.16.2, incorporating an electrolyzer to assess the potential for green hydrogen generation from the electrical surplus of both systems.
This study is innovative, as there are currently no prior studies in the Lobito region and very few in Angola and Africa, making it a pioneering work in exploring the integration of MSW gasification and solar PV for electricity generation in this region. The novelty of this research lies in its comprehensive approach to modeling and simulating a grid-connected hybrid renewable energy system, which has not been previously attempted in Lobito. By utilizing advanced simulation tools such as PVGIS v5.3, PVsyst v8, Aspen Plus v11.0, and HOMER Pro v3.16.2, this study provides a robust framework for evaluating the potential of hybrid renewable energy systems.
This research contributes to several key areas:
Renewable energy integration: It advances the understanding of how MSW gasification and solar PV can be effectively combined to enhance energy security and reliability.
Sustainable waste management: It offers insights into the use of MSW produced in Lobito as a valuable resource for energy production, promoting sustainable waste management practices.
Environmental benefits: It aims to demonstrate the potential for a significant reduction in fossil CO2 equivalent emissions through the adoption of renewable energy systems, contributing to global efforts to mitigate climate change.
Green hydrogen production: By assessing the feasibility of green hydrogen generation from excess electrical energy, the research explores an innovative pathway for hydrogen economy development.
Furthermore, this research provides practical implications for local authorities and policymakers by showcasing the potential benefits of implementing hybrid renewable energy systems in urban areas. The findings of this study could serve as a reference for future energy planning initiatives, encouraging the inclusion of innovative energy recovery projects from MSW in developing countries.
2. Methodology
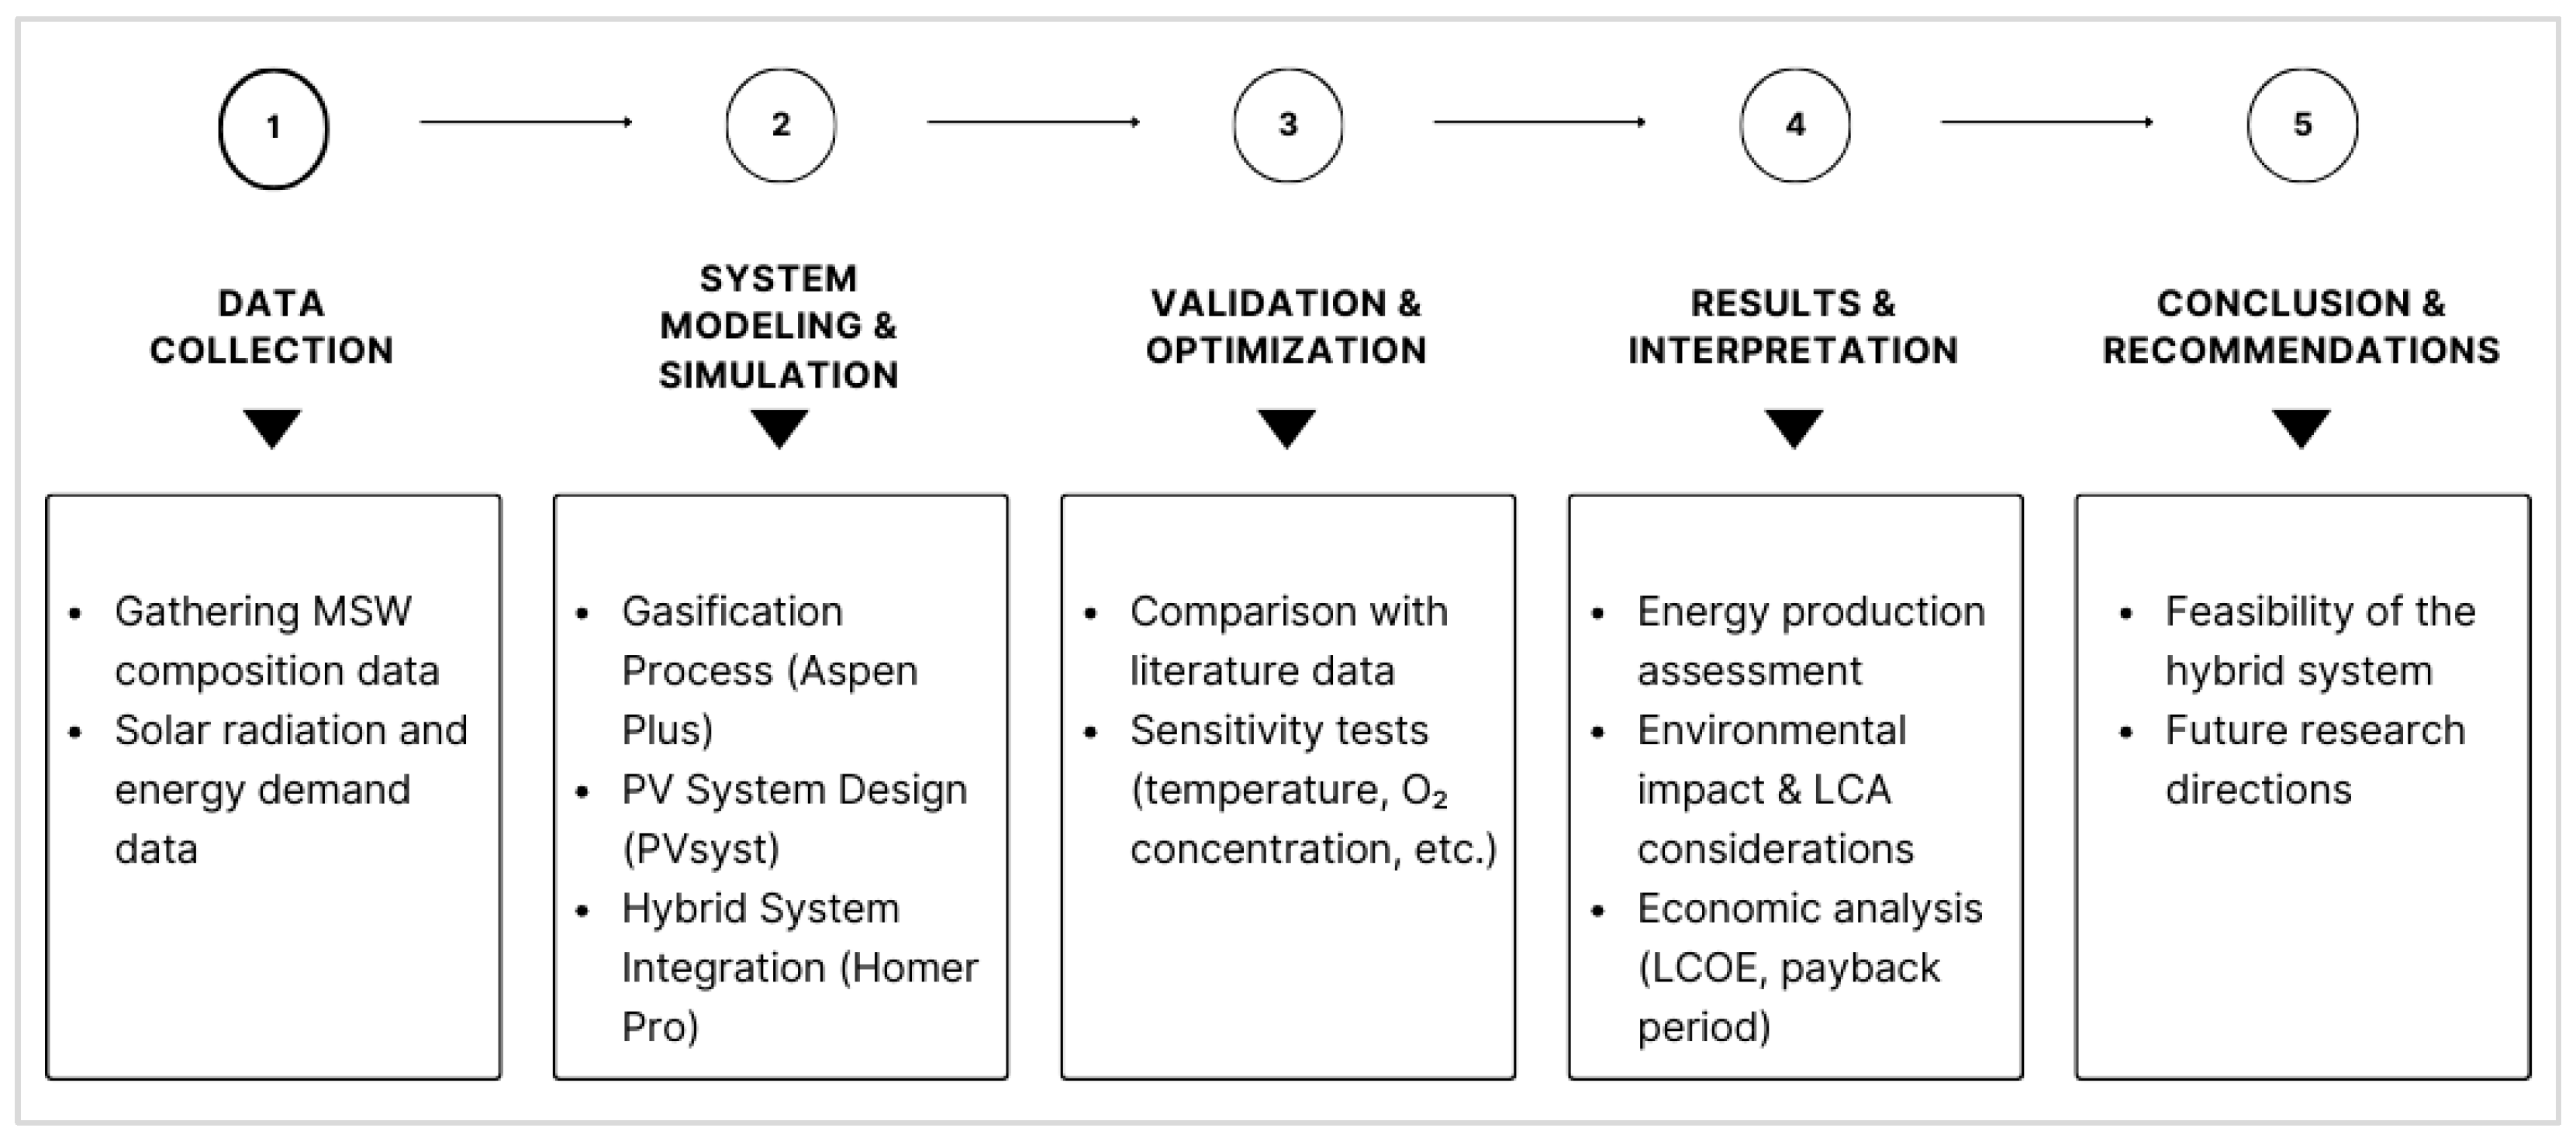
Figure 2 presents a flowchart illustrating the key methodological steps followed in this study.
The methodology includes data collection on MSW composition and solar energy potential, system modeling and simulation using specialized software, validation and optimization processes, and the final analysis of results. This structured workflow ensures a comprehensive evaluation of the feasibility of the hybrid system.
2.1. Modeling and Simulation of an MSW Gasification Unit
Gasification is a thermochemical process that converts organic materials, such as MSW, into a combustible gas mixture, called syngas, under the controlled conditions of temperature and oxygen [
24,
25,
26]. The primary reactions include the following:
Pyrolysis: The thermal decomposition of waste in the absence of oxygen, producing char, tar, and volatile gases.
Combustion: The partial oxidation of carbon-based materials to generate heat for sustaining the process (e.g., C + 0.5 O2 → CO; ΔH = −111 MJ/kmol).
Reduction: The conversion of CO2 and water vapor into CO and H2 via reactions such as the water–gas shift (CO + H2O → CO2 + H2; ΔH = −41 MJ/kmol) and the Boudouard reaction (C + CO2 → 2 CO; ΔH = +172 MJ/kmol).
For the success of modeling the process flowchart on Aspen Plus v11.0, it was necessary to rely mainly on the models used by Begum et al. [
27] and Moshi et al. [
28]. Their studies only provide generic and contextual data; therefore, it was necessary to survey the Lobito Municipal Administration to obtain specific information related to MSW. As this government body does not have some data, it was necessary to resort to bibliographic data provided by the World Bank and the African Development Bank and studies on waste composition in similar contexts.
Considering the total number of residents currently estimated in Lobito is at 484,351 inhabitants, a total amount of around 200 t/day (wet weight) of MSW generated is estimated at a conservative production rate of 0.41 kg/(day.inhabitant). Thus, the processing capacity of the gasification system sized in this study was 200 t/day (wet weight) with an average water content of 39.47%.
According to the World Bank, Angola falls into the group of lower-middle-income countries. Using the data provided by Dong [
29] and Hadi [
30] regarding the typical percentage of materials present in MSW, it was possible to establish an average composition of MSW in the city of Lobito (
Table 2).
The elemental composition of the MSW from the city of Lobito was estimated as having the values shown in
Table 3.
Proximate analysis (
Table 2) was inserted into the Phyllis online database [
31], from which the low heating value (LHV) of Lobito’s MSW was automatically calculated as 7.82 MJ/kg. While this value exceeds typical LHVs reported for MSW in other cities in developing countries, it reflects the relatively low fraction of organic waste and the high proportion of non-biodegradable materials such as plastics and textiles in Lobito’s MSW. It is recommended that future research studies include additional local surveys and waste characterization campaigns to further refine these estimates and improve their statistical robustness and repeatability, as the Phyllis online database is mainly a European database, probably not applicable to Angola’s reality.
The gasifier modeled in this study is a fixed-bed downdraft gasifier due to its advantages in handling MSW with varying moisture and ash contents. However, it is important to note that this selection serves as a reference for analysis and does not imply that it is the only viable gasification technology. Depending on specific implementation conditions, other configurations such as fluidized-bed gasifiers may offer operational advantages, particularly in terms of mixing efficiency and adaptability to heterogeneous waste compositions.
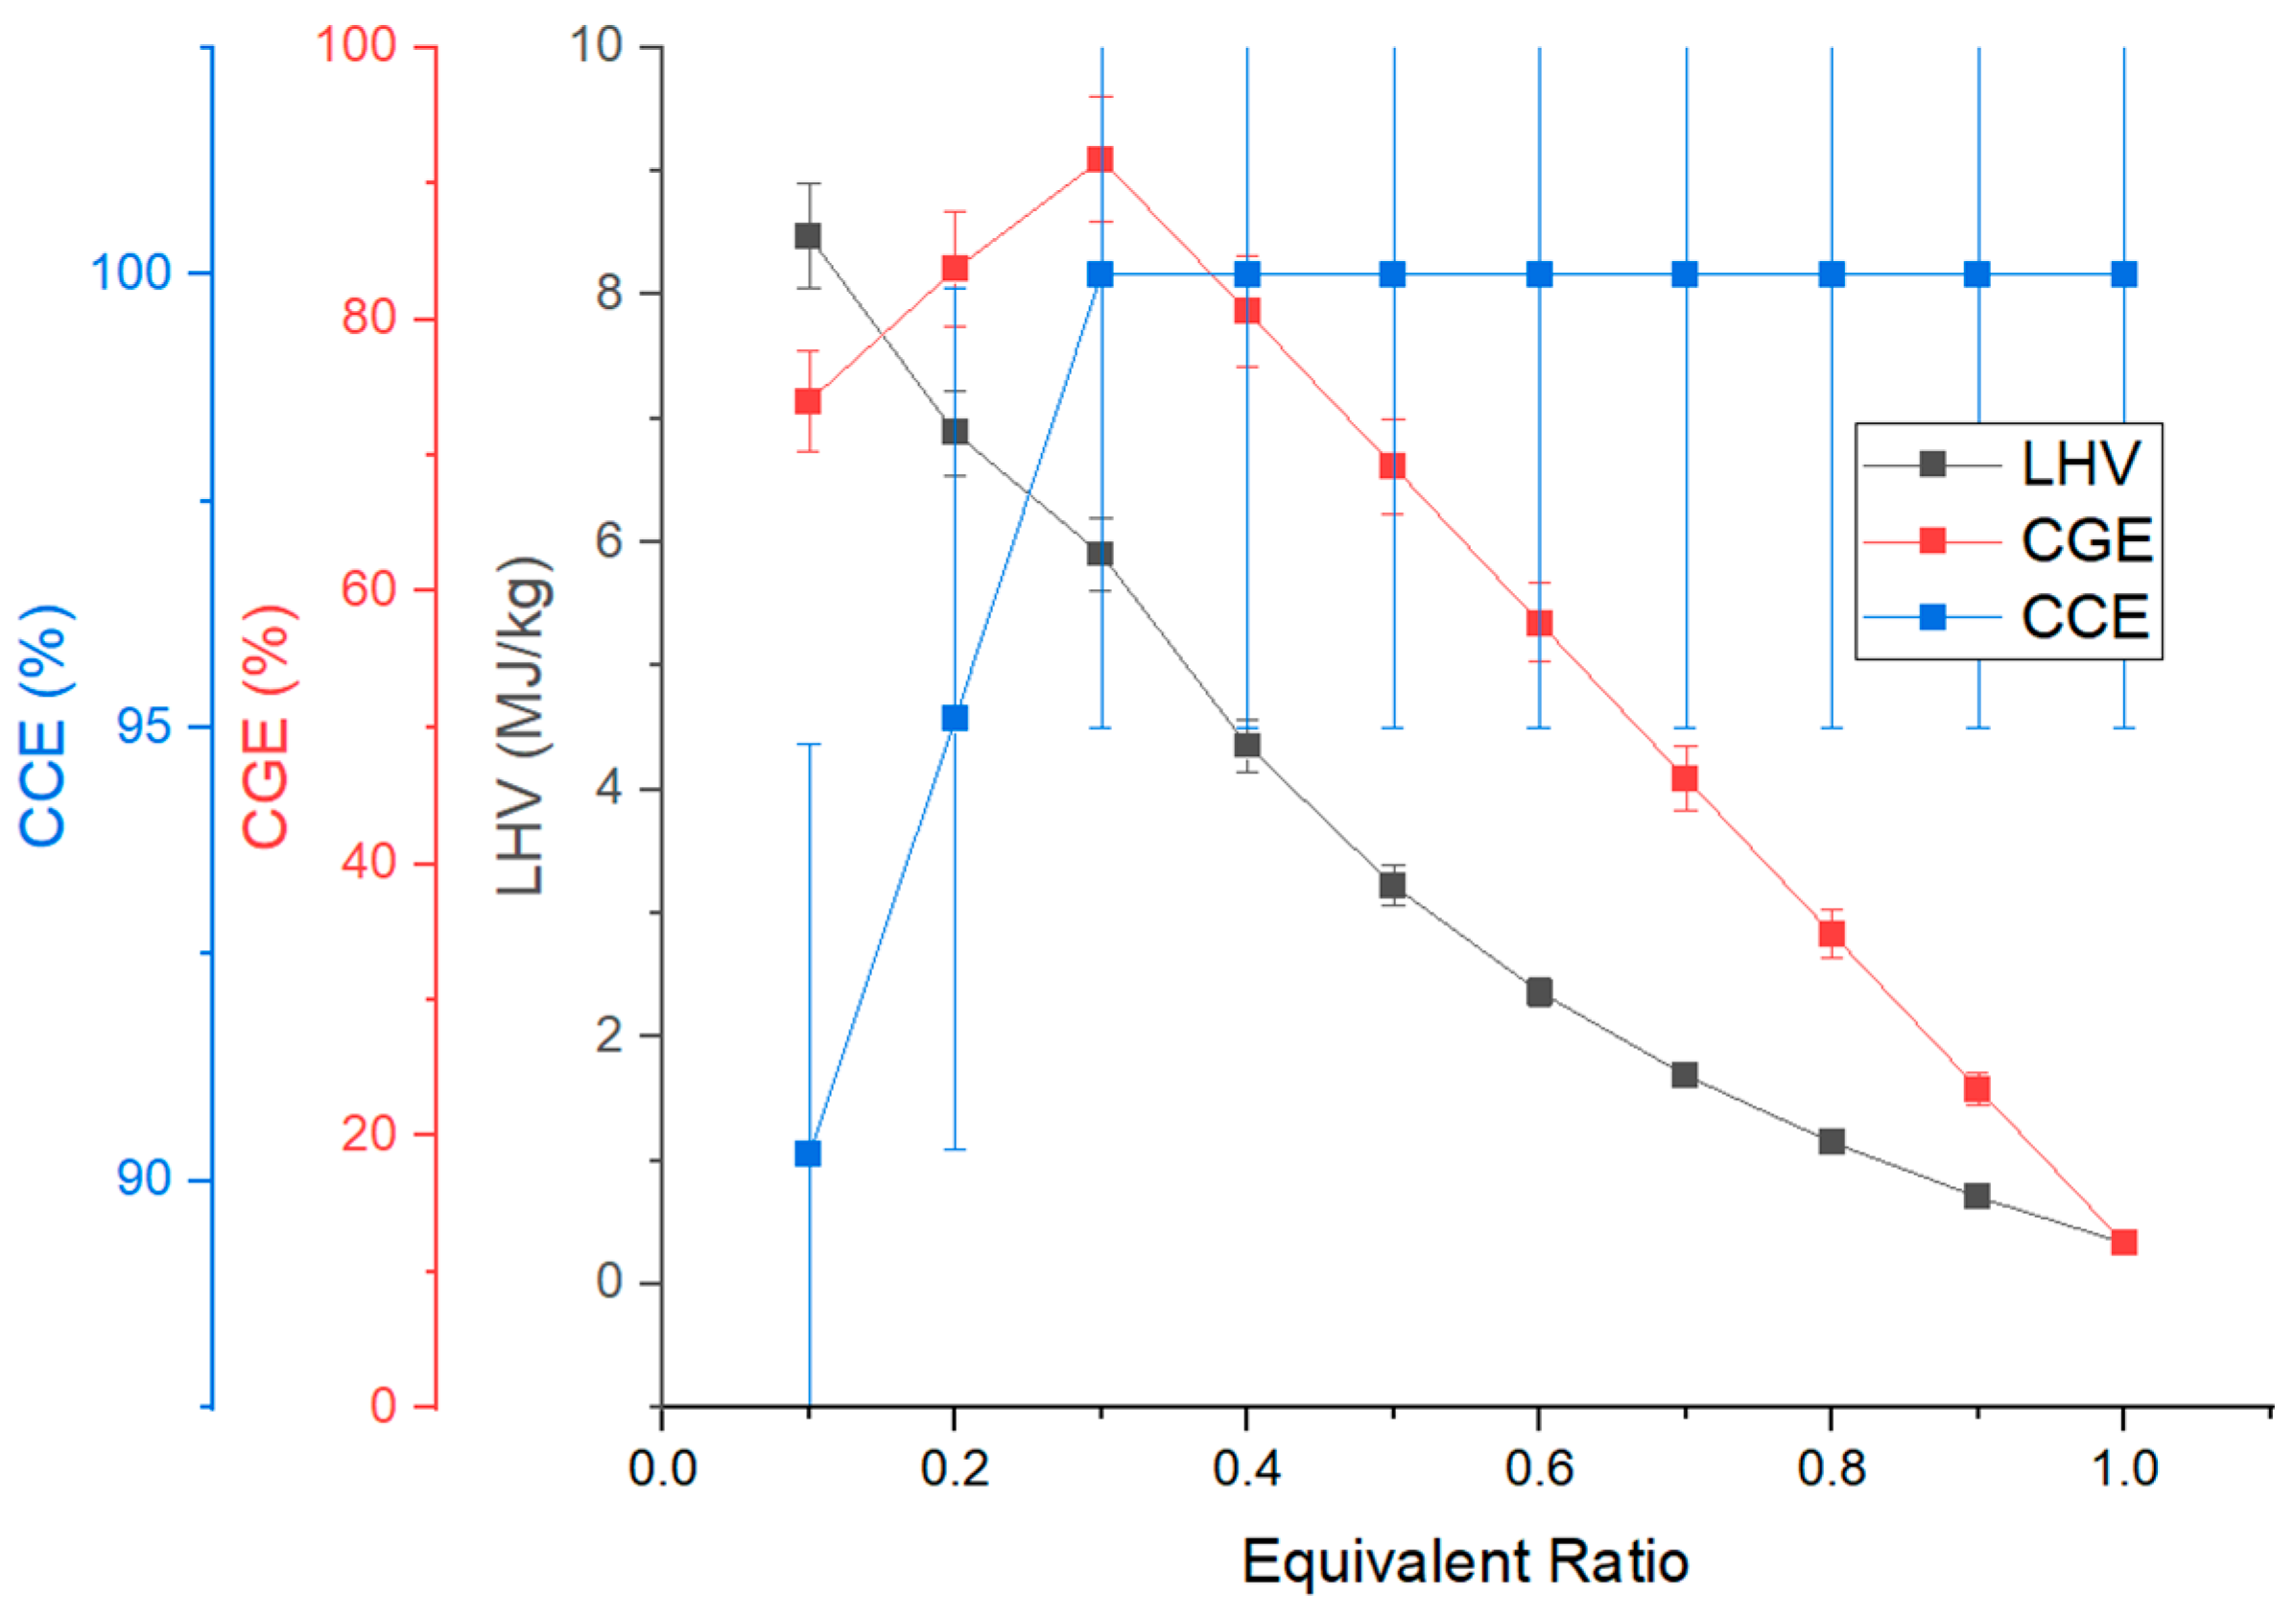
The key operating parameters were modeled, including the equivalence ratio (ER), gasification temperature, MSW flow rate, and air flow rate. The ER used was 0.1, and the injection and proper distribution of air within the system were managed through a FORTRAN statement defined in the calculator (C-2) of the Aspen Plus v11.0 flowchart.
It is important to note that in calculator C-2, the equation aimed to determine the mass flow rate of the feedstock stream by accounting for its pure and non-conventional components while subtracting the mass flow rates of O
2 and N
2 already present in the stream. Since both are components of air, this adjustment ensured a properly balanced air supply. Equation (1) was used:
where
—the mass flow rate of the gasifying agent injected into the system (kg/h).
—the total mass flow rate of the feedstock stream (kg/h).
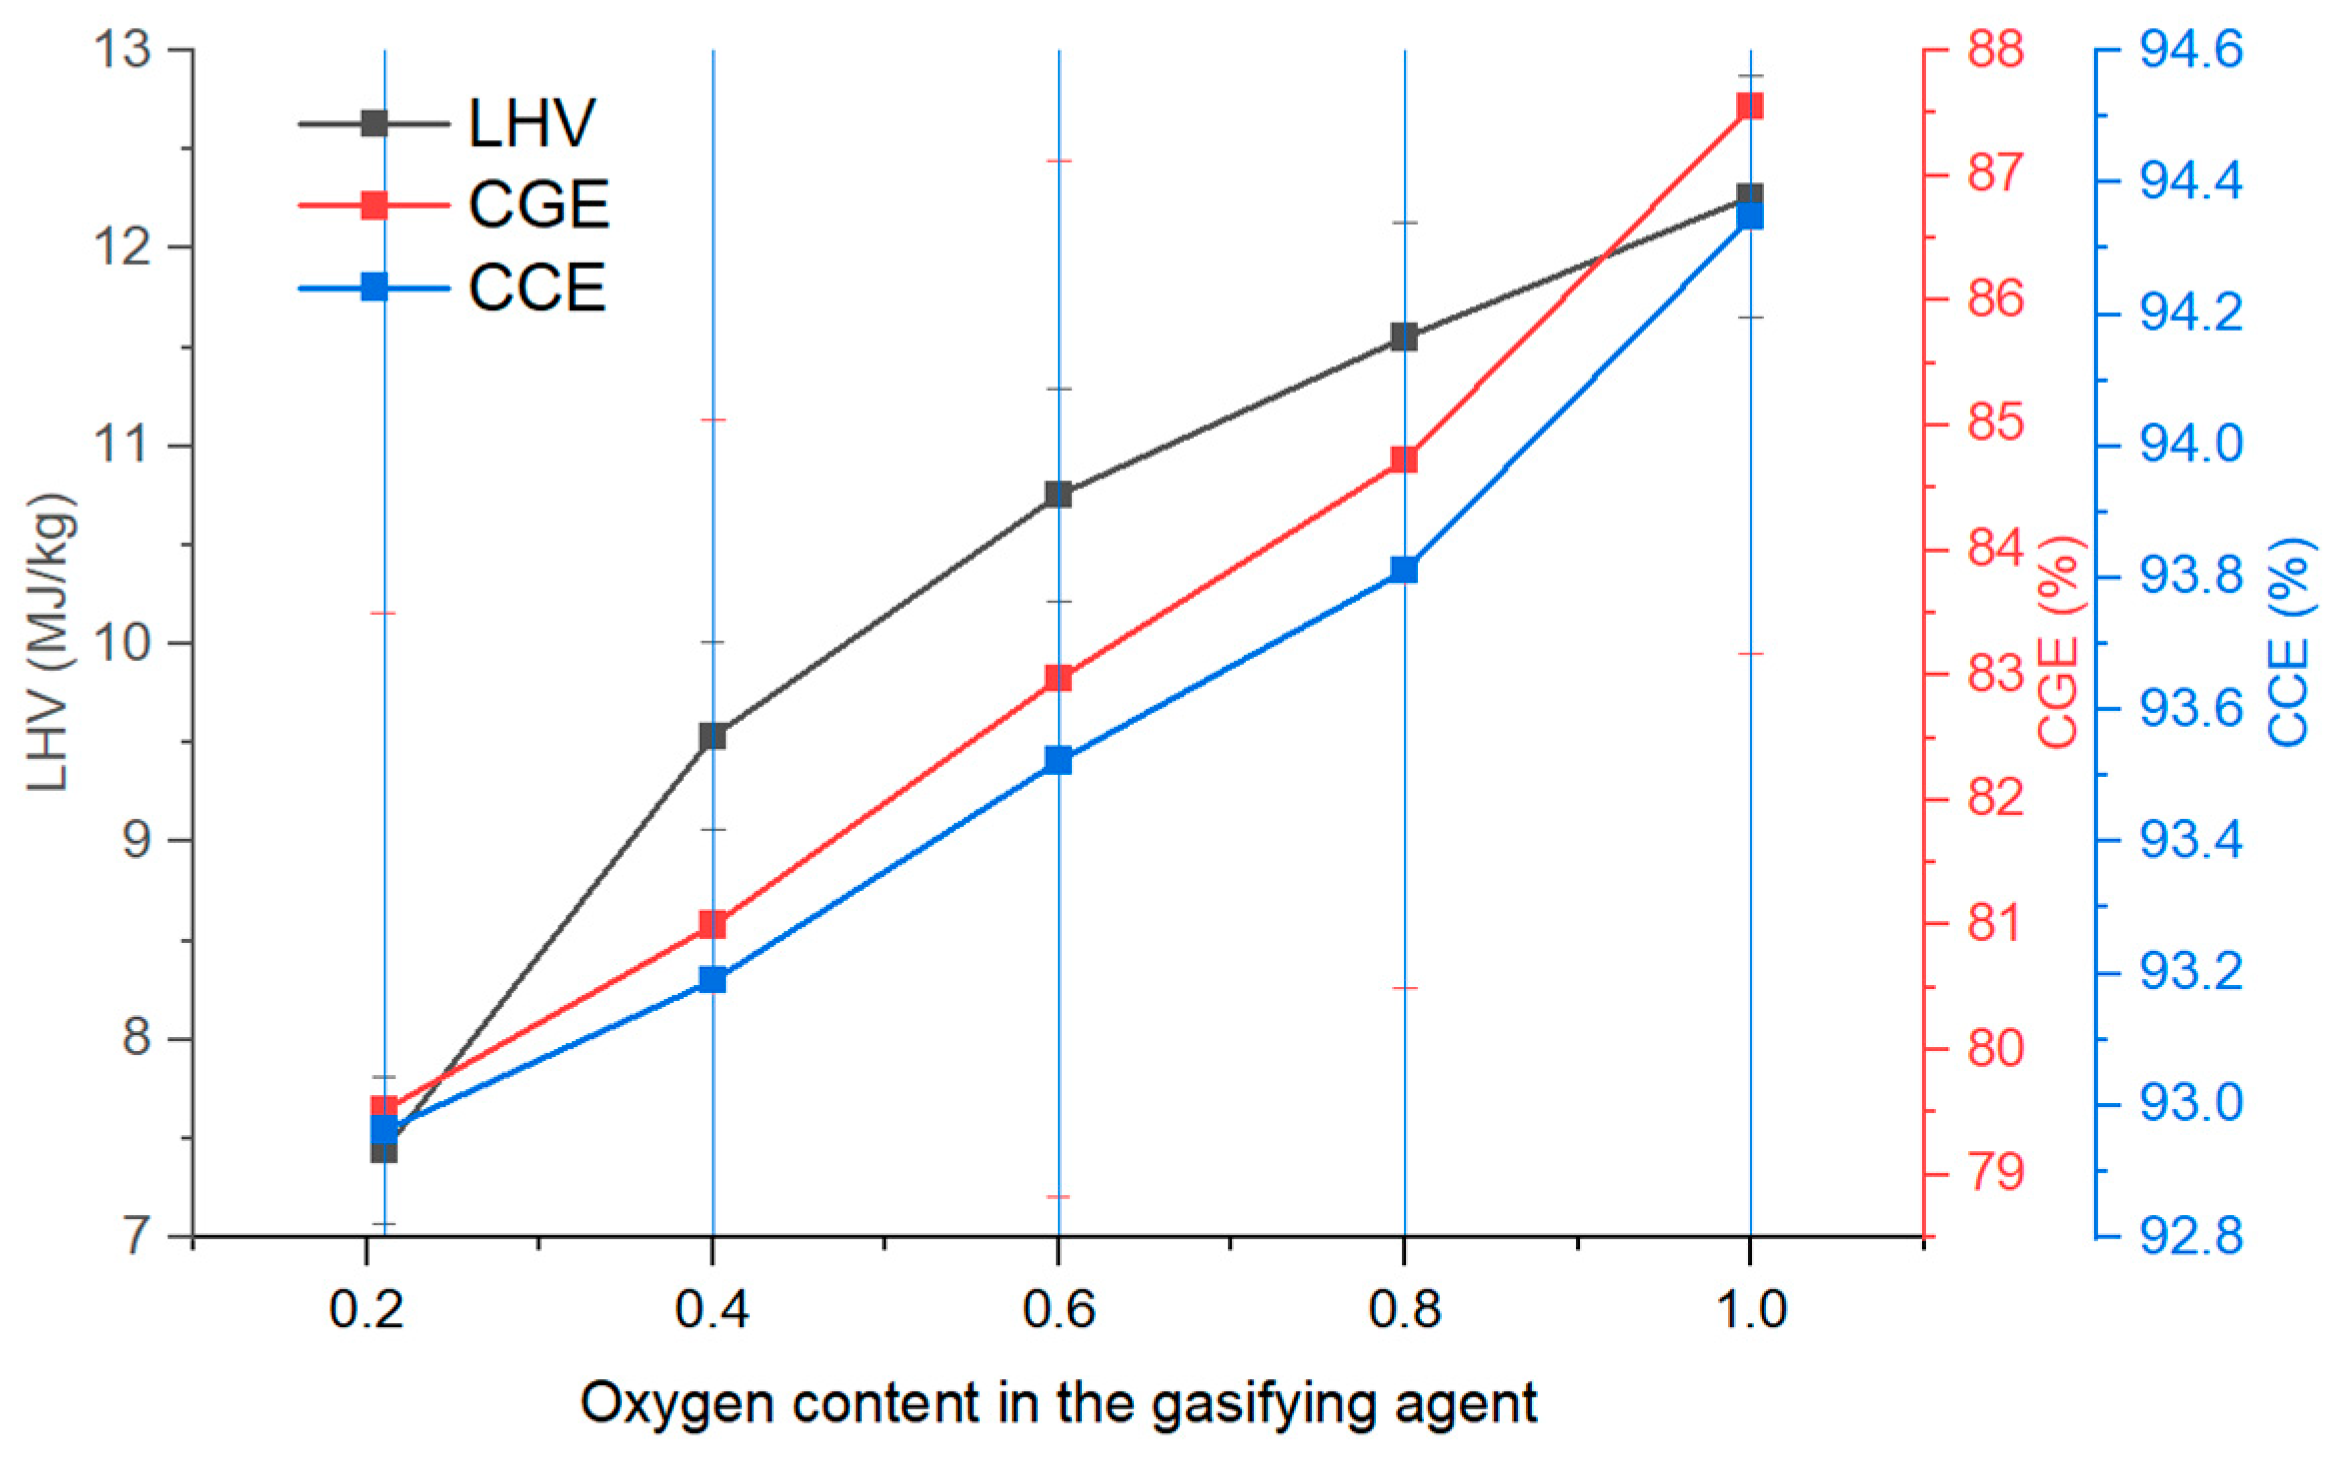
—the mass fraction of O2 in the gasifying agent, which can vary between 0.21 and 1.
—the mass flow rate of O2 present in the feedstock stream (kg/h).
—the mass flow rate of N2 present in the feedstock stream (kg/h).
ER—the equivalence ratio, ranging from 0.1 (partial oxidation) to values greater than 1 (complete oxidation).
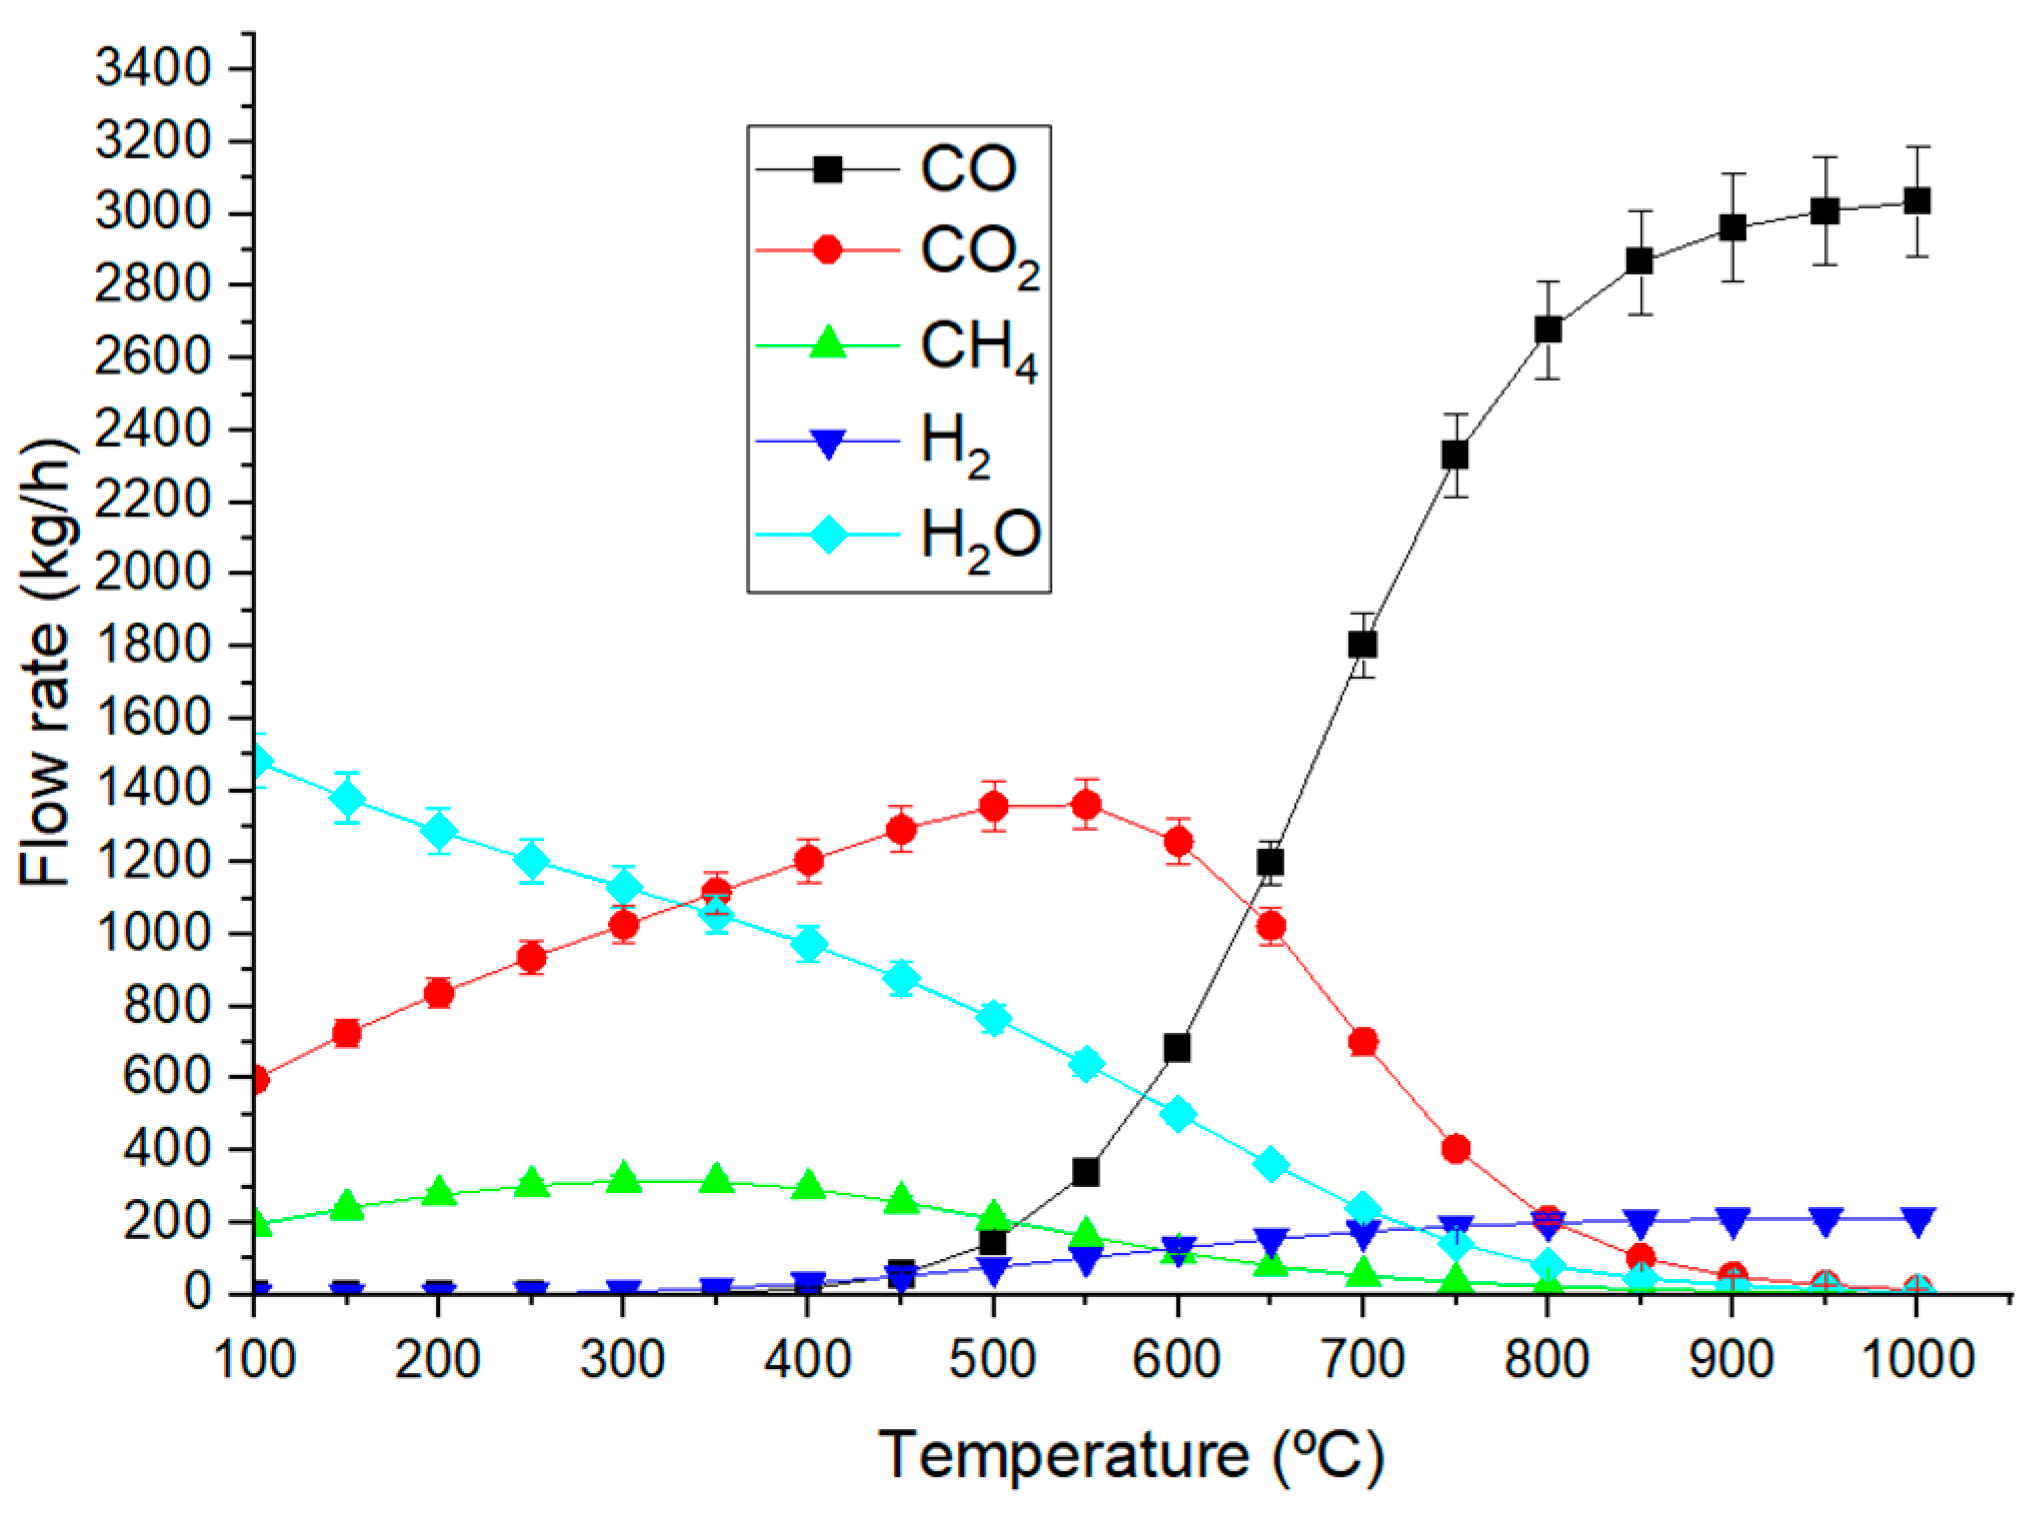
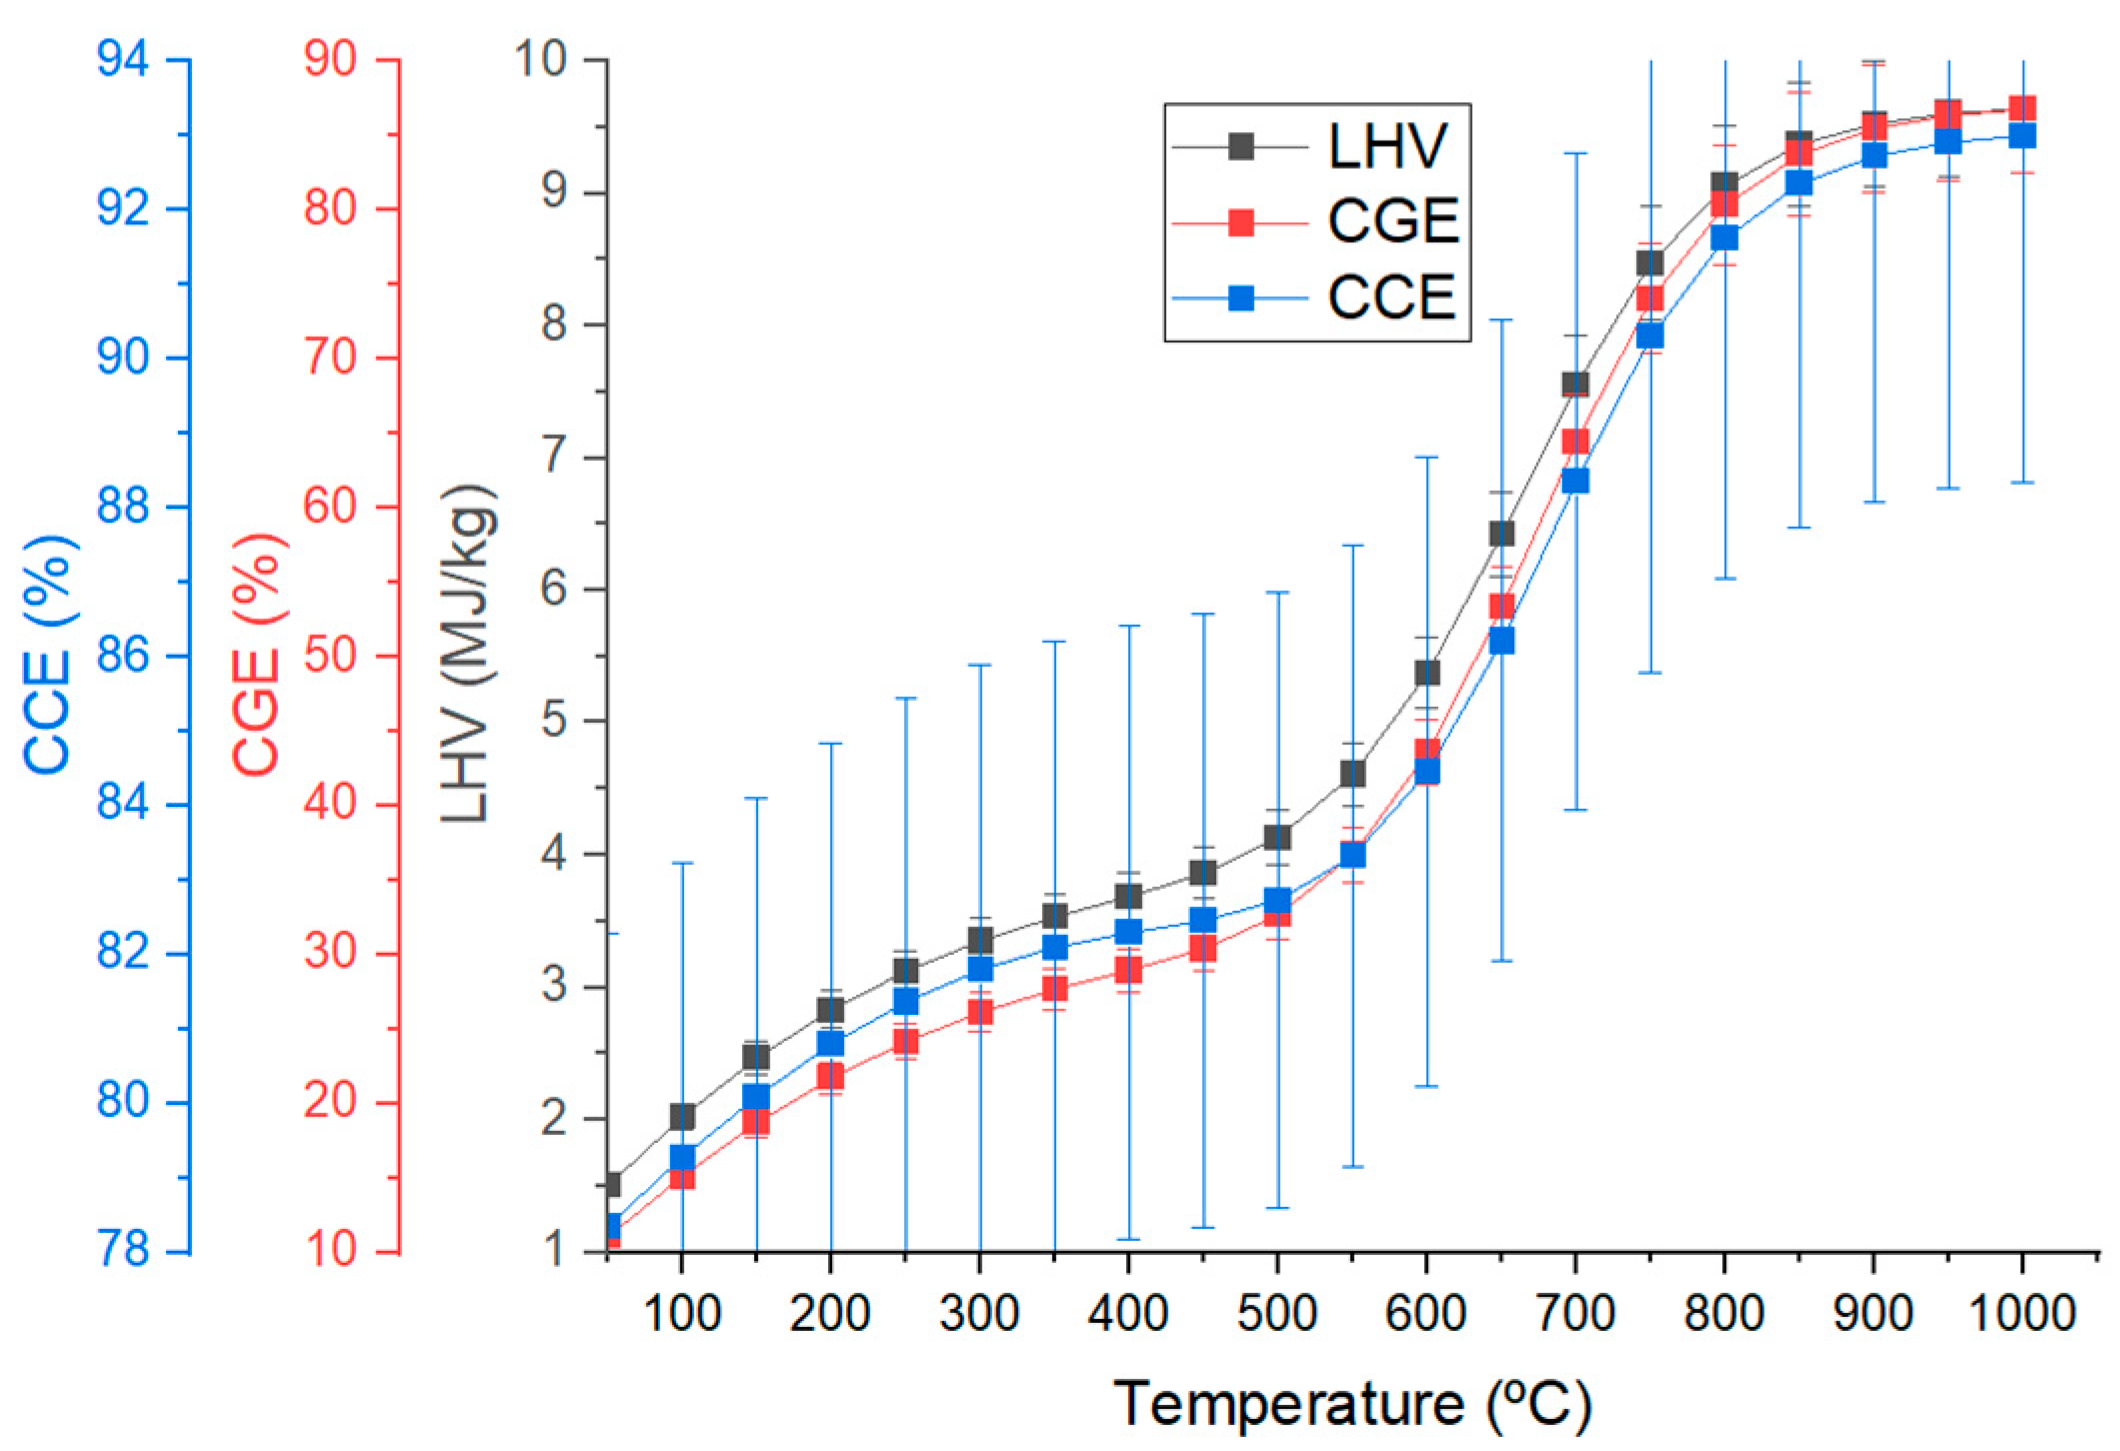
To ensure downstream applications, the syngas underwent preliminary treatment to remove ash (cyclones) and tar (condensation). The advanced removal of contaminants like HCl and H2S, though beyond this study’s scope, was discussed as essential for long-term system viability and syngas quality. Key outputs included syngas composition, LHV, Cold Gas Efficiency (CGE), and Carbon Conversion Efficiency (CCE). The syngas composition, dominated by CO, H2, and CH4, was validated against bibliographic data, ensuring the model’s reliability.
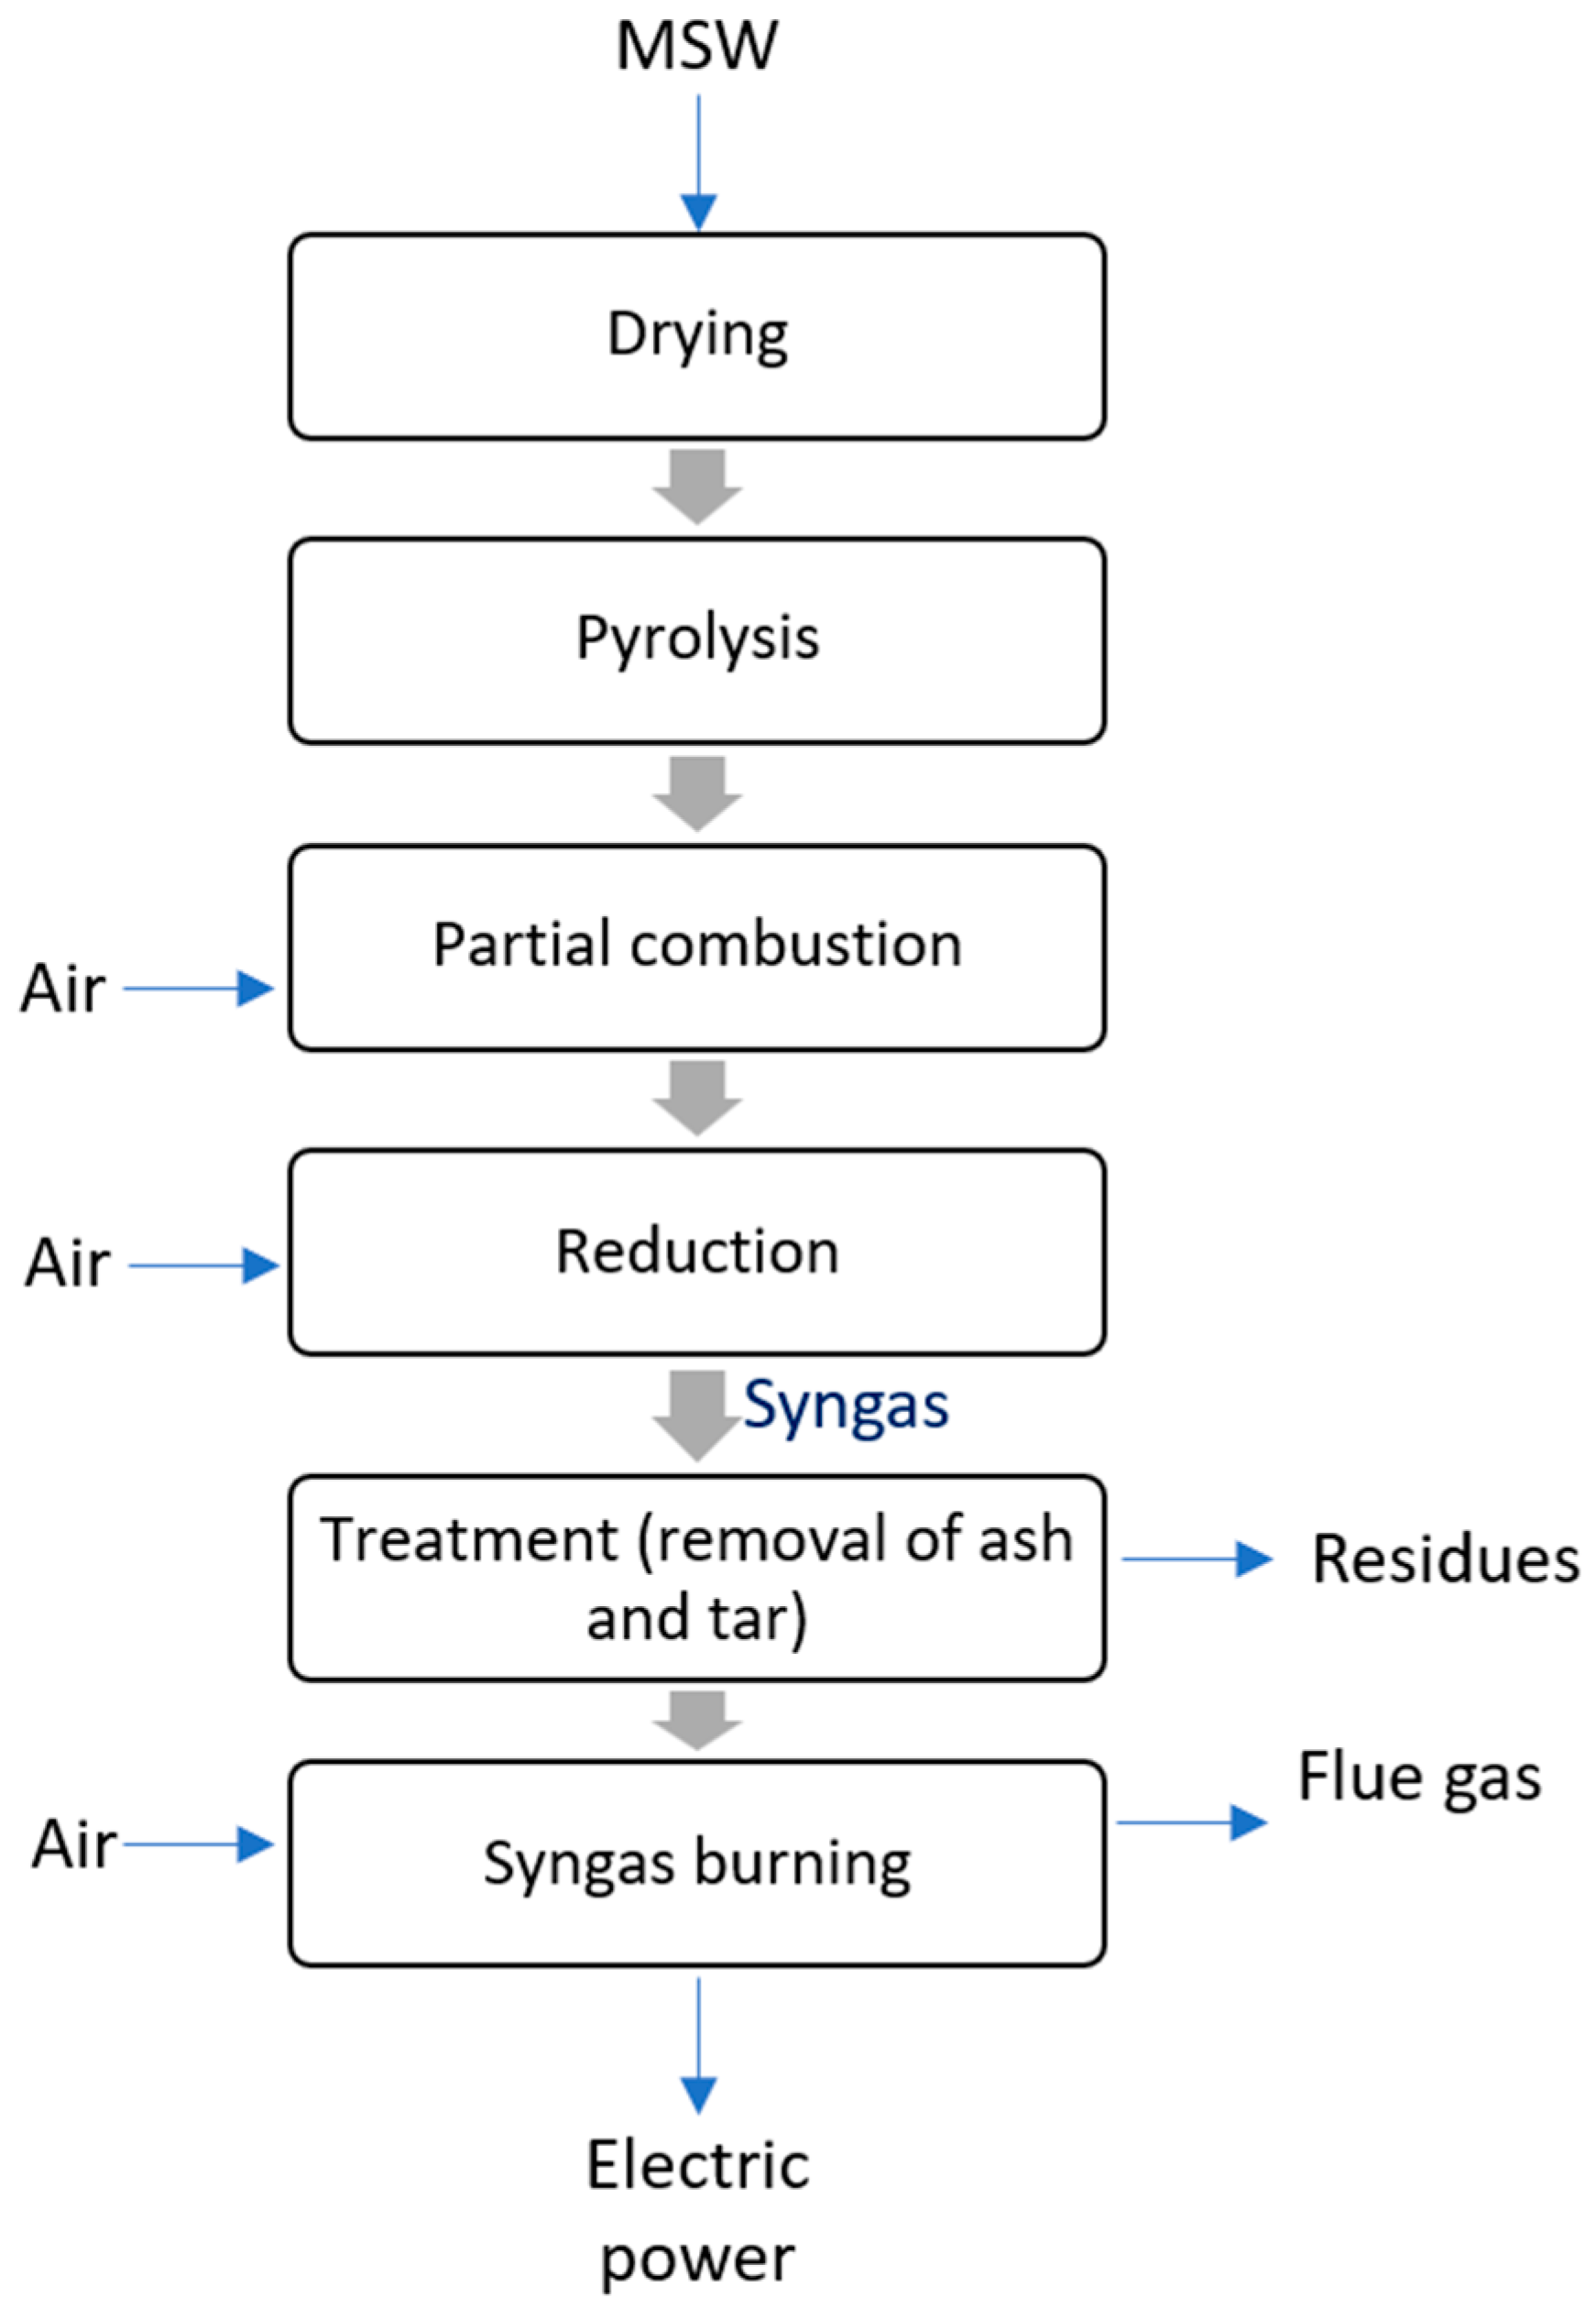
The proposed model for the MSW gasification system is shown in the simplified block diagram in
Figure 3 and detailed in the process flowchart in
Figure 4. Much of the data used for modeling purposes in Aspen Plus v11.0 was mainly obtained from the available literature [
27,
28].
The model was developed under the following assumptions:
The process runs in a steady-state condition.
The combustion and reduction blocks are isothermal.
Char is assumed to consist of carbon and ash.
Ash does not participate in the chemical reactions as it is considered inert.
All the sulfur is converted into H2S.
All the chlorine is converted into HCl.
No nitrogen oxide is formed, but only NH3 is produced; however, its content is so low that it does not cause significant inaccuracies in the simulation.
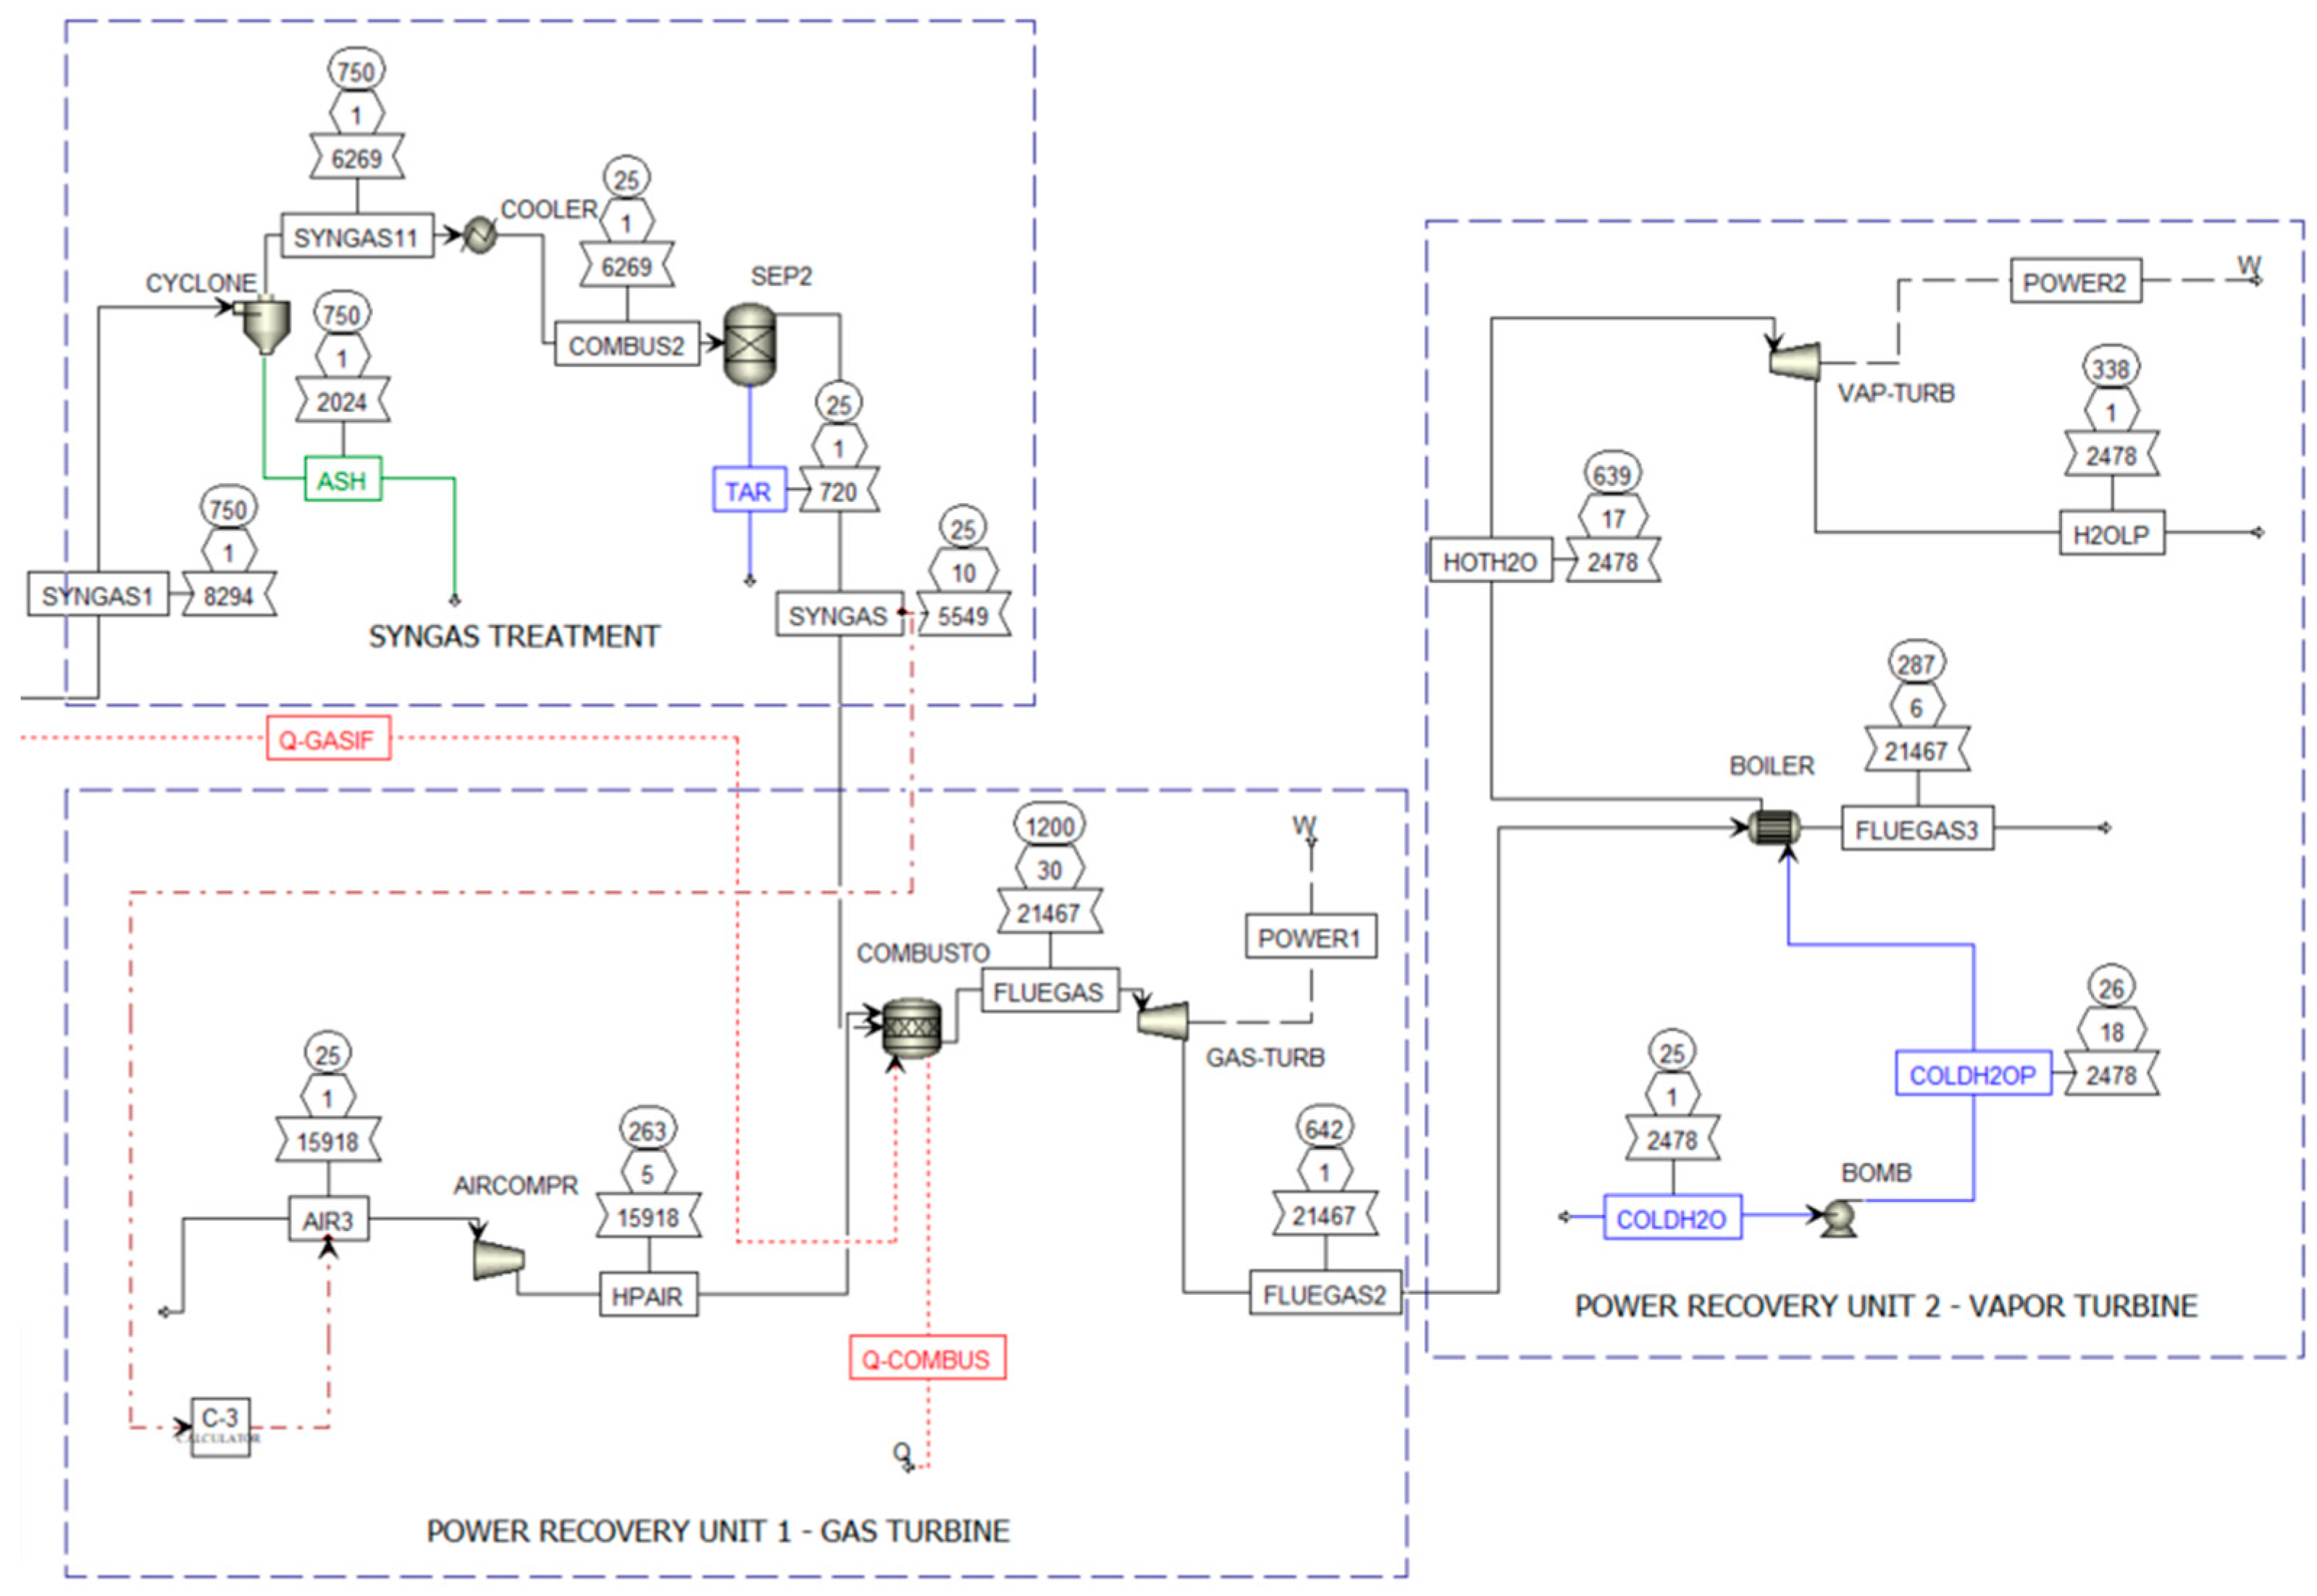
The flowchart shown in
Figure 4 illustrates the MSW gasification and subsequent electricity generation. It is structured into several sections to depict each stage of the process:
Drying: This stage removes moisture from the waste material using a dryer and a drying drum, operating at temperatures up to 120 °C.
Pyrolysis: The dried waste undergoes thermal decomposition in the absence of oxygen in a pyrolysis reactor at a temperature of 650 °C, producing pyrolysis gas.
Gasification: The pyrolysis gas and remaining waste are converted into syngas (a mixture of H2 and CO), with the assistance of an air compressor, with gasification occurring at up to 750 °C.
Syngas treatment: The syngas is cleaned and conditioned to remove impurities like ash and tar using components such as cyclones and separators.
Power Recovery Unit 1: The cleaned syngas is used to generate electricity through a gas turbine, connected to a power generator.
Power Recovery Unit 2: Waste heat from the gas turbine is used to generate additional electricity through a vapor turbine, connected to another power generator.
2.2. Modeling and Simulation of a Photovoltaic Solar Power Plant
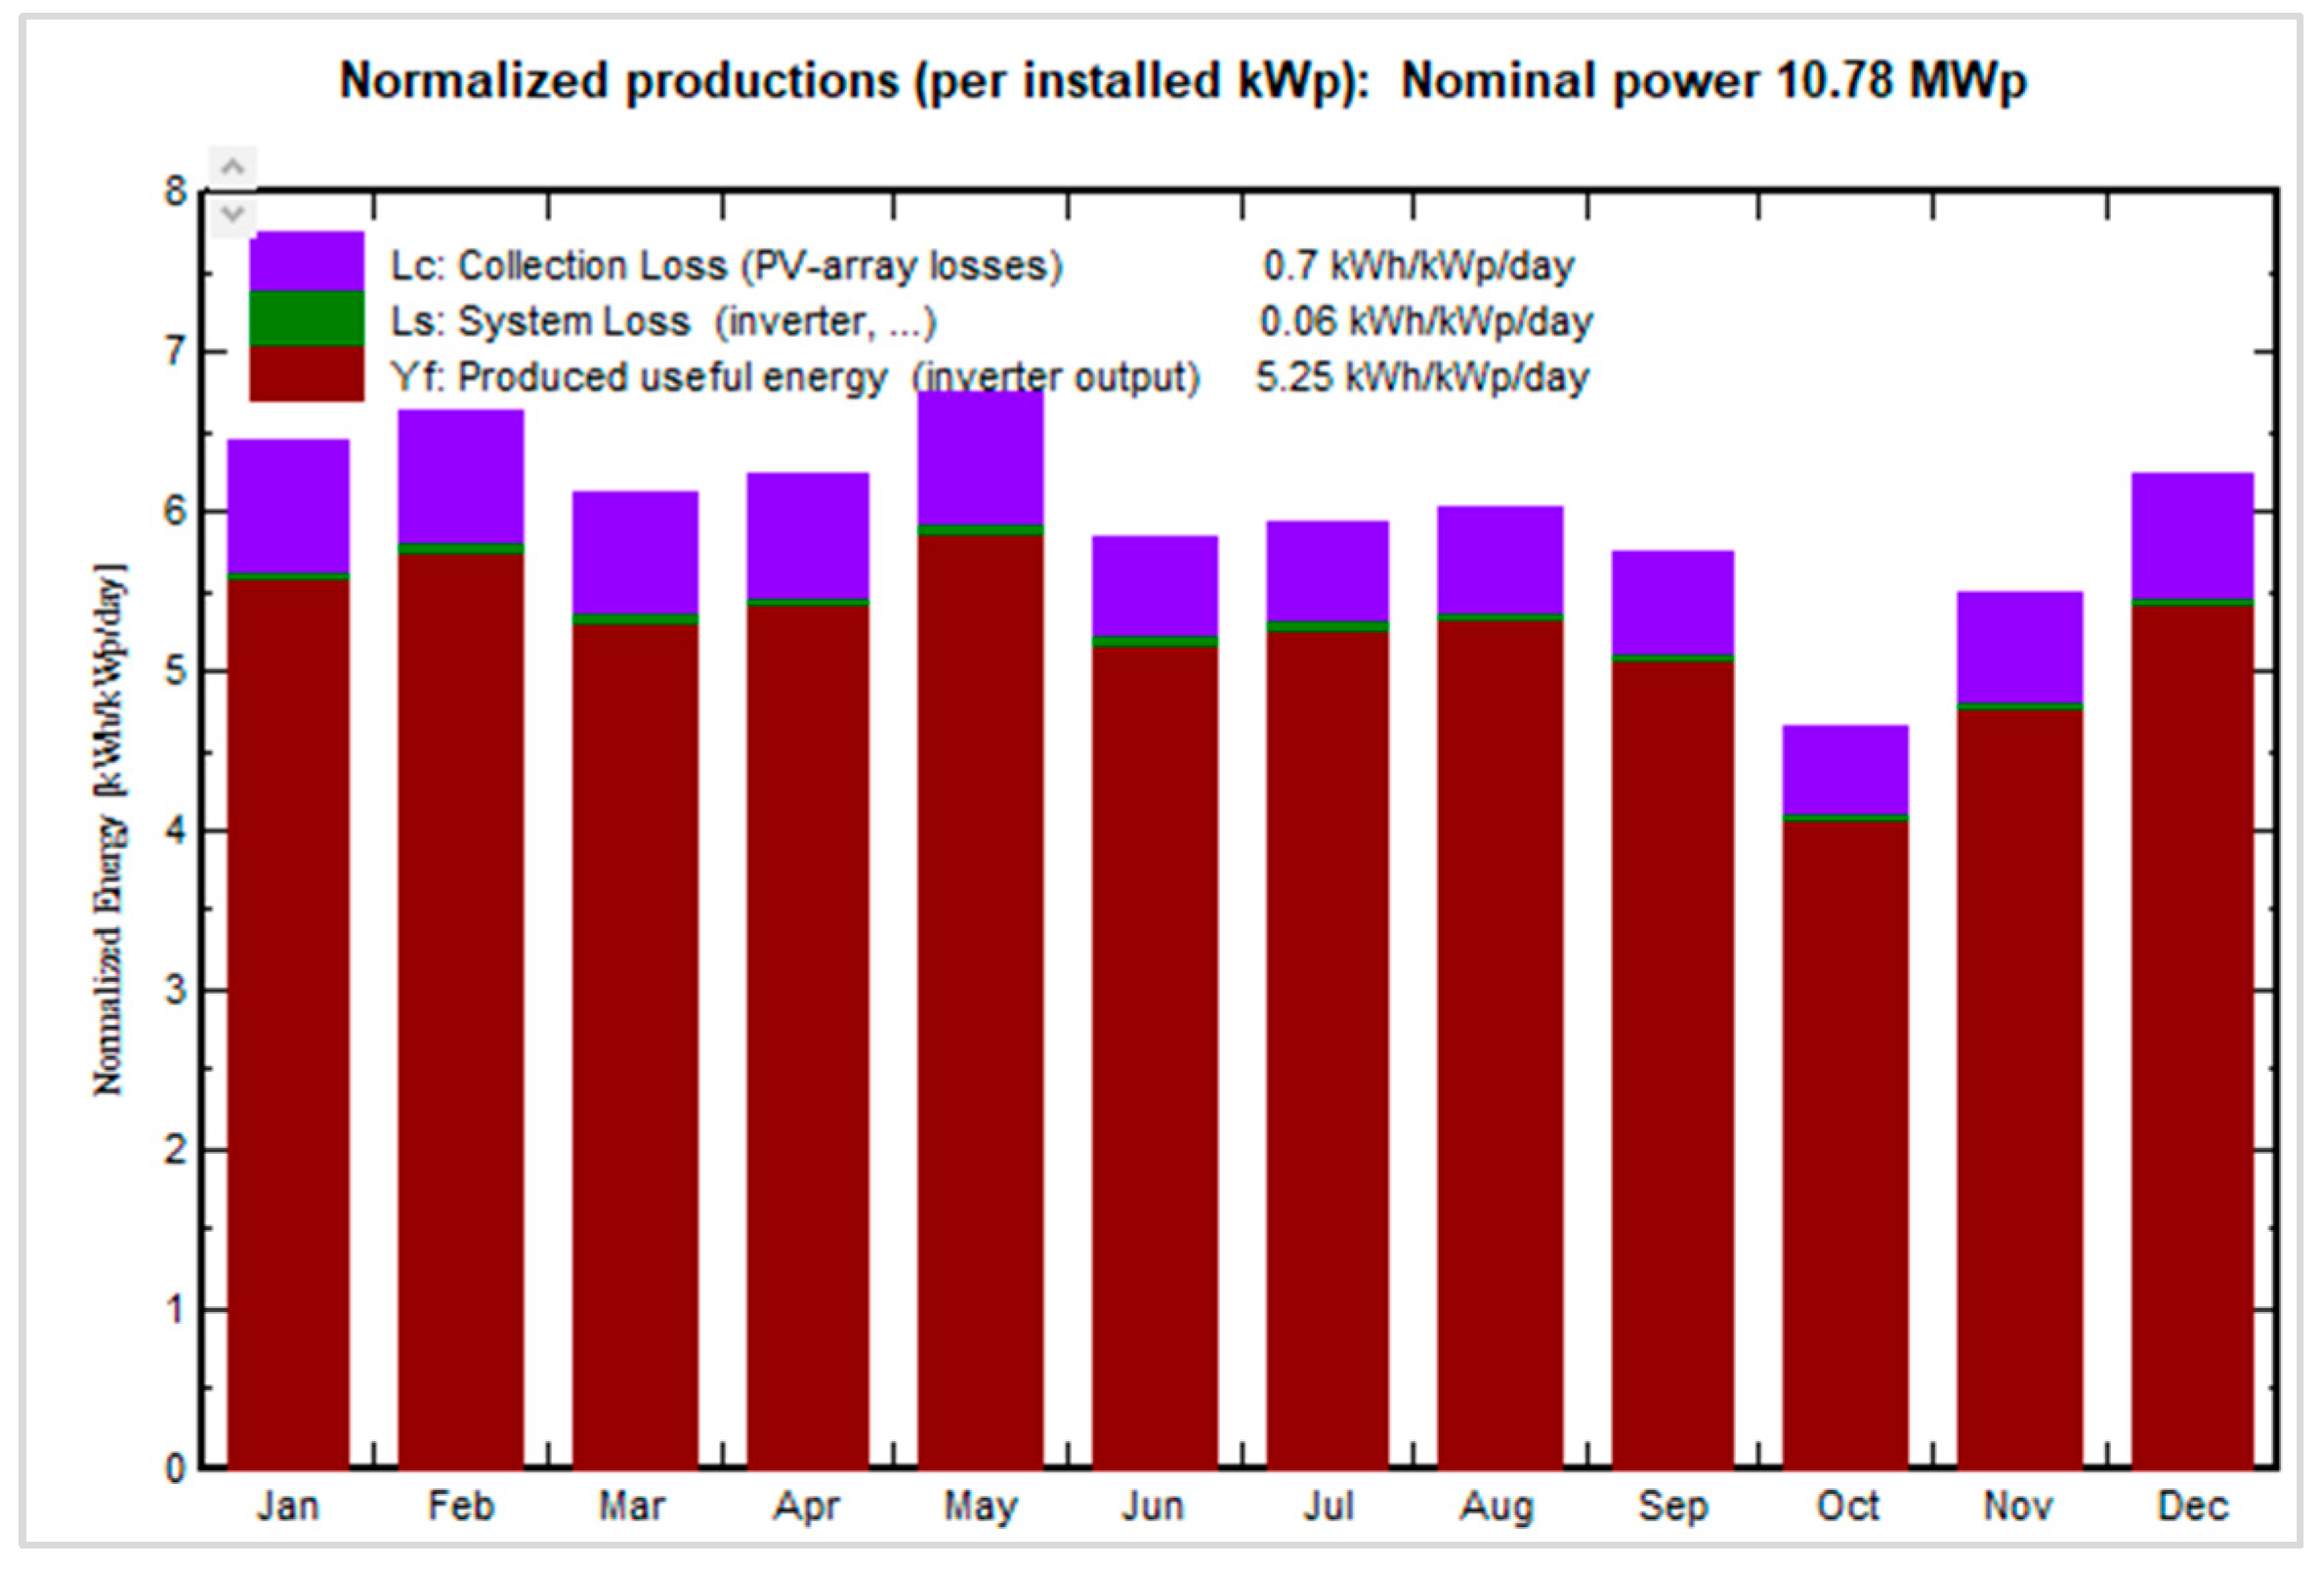
The solar PV system design and energy yield were analyzed using local solar radiation data, panel specifications, and shading simulations. The PVsyst v8 software provided detailed reports on the performance ratio (PR), energy losses, and environmental benefits (e.g., reduction in CO2 equivalent emissions).
Since the intention is to model a hybrid system, the PV system is proposed to be installed in the vicinity of the Lobito dump (12°23′39.53′′ S; 13°38′11.92′′ E), which, according to the Google Earth simulation, currently has a perimeter of approximately 2 km and an area of approximately 15 hectares (
Figure 5). Therefore, by installing the gasification plant to process the majority of the MSW and considerably reducing the need for additional landfill space, this study proposes allocating 5 hectares for the solar PV installation.
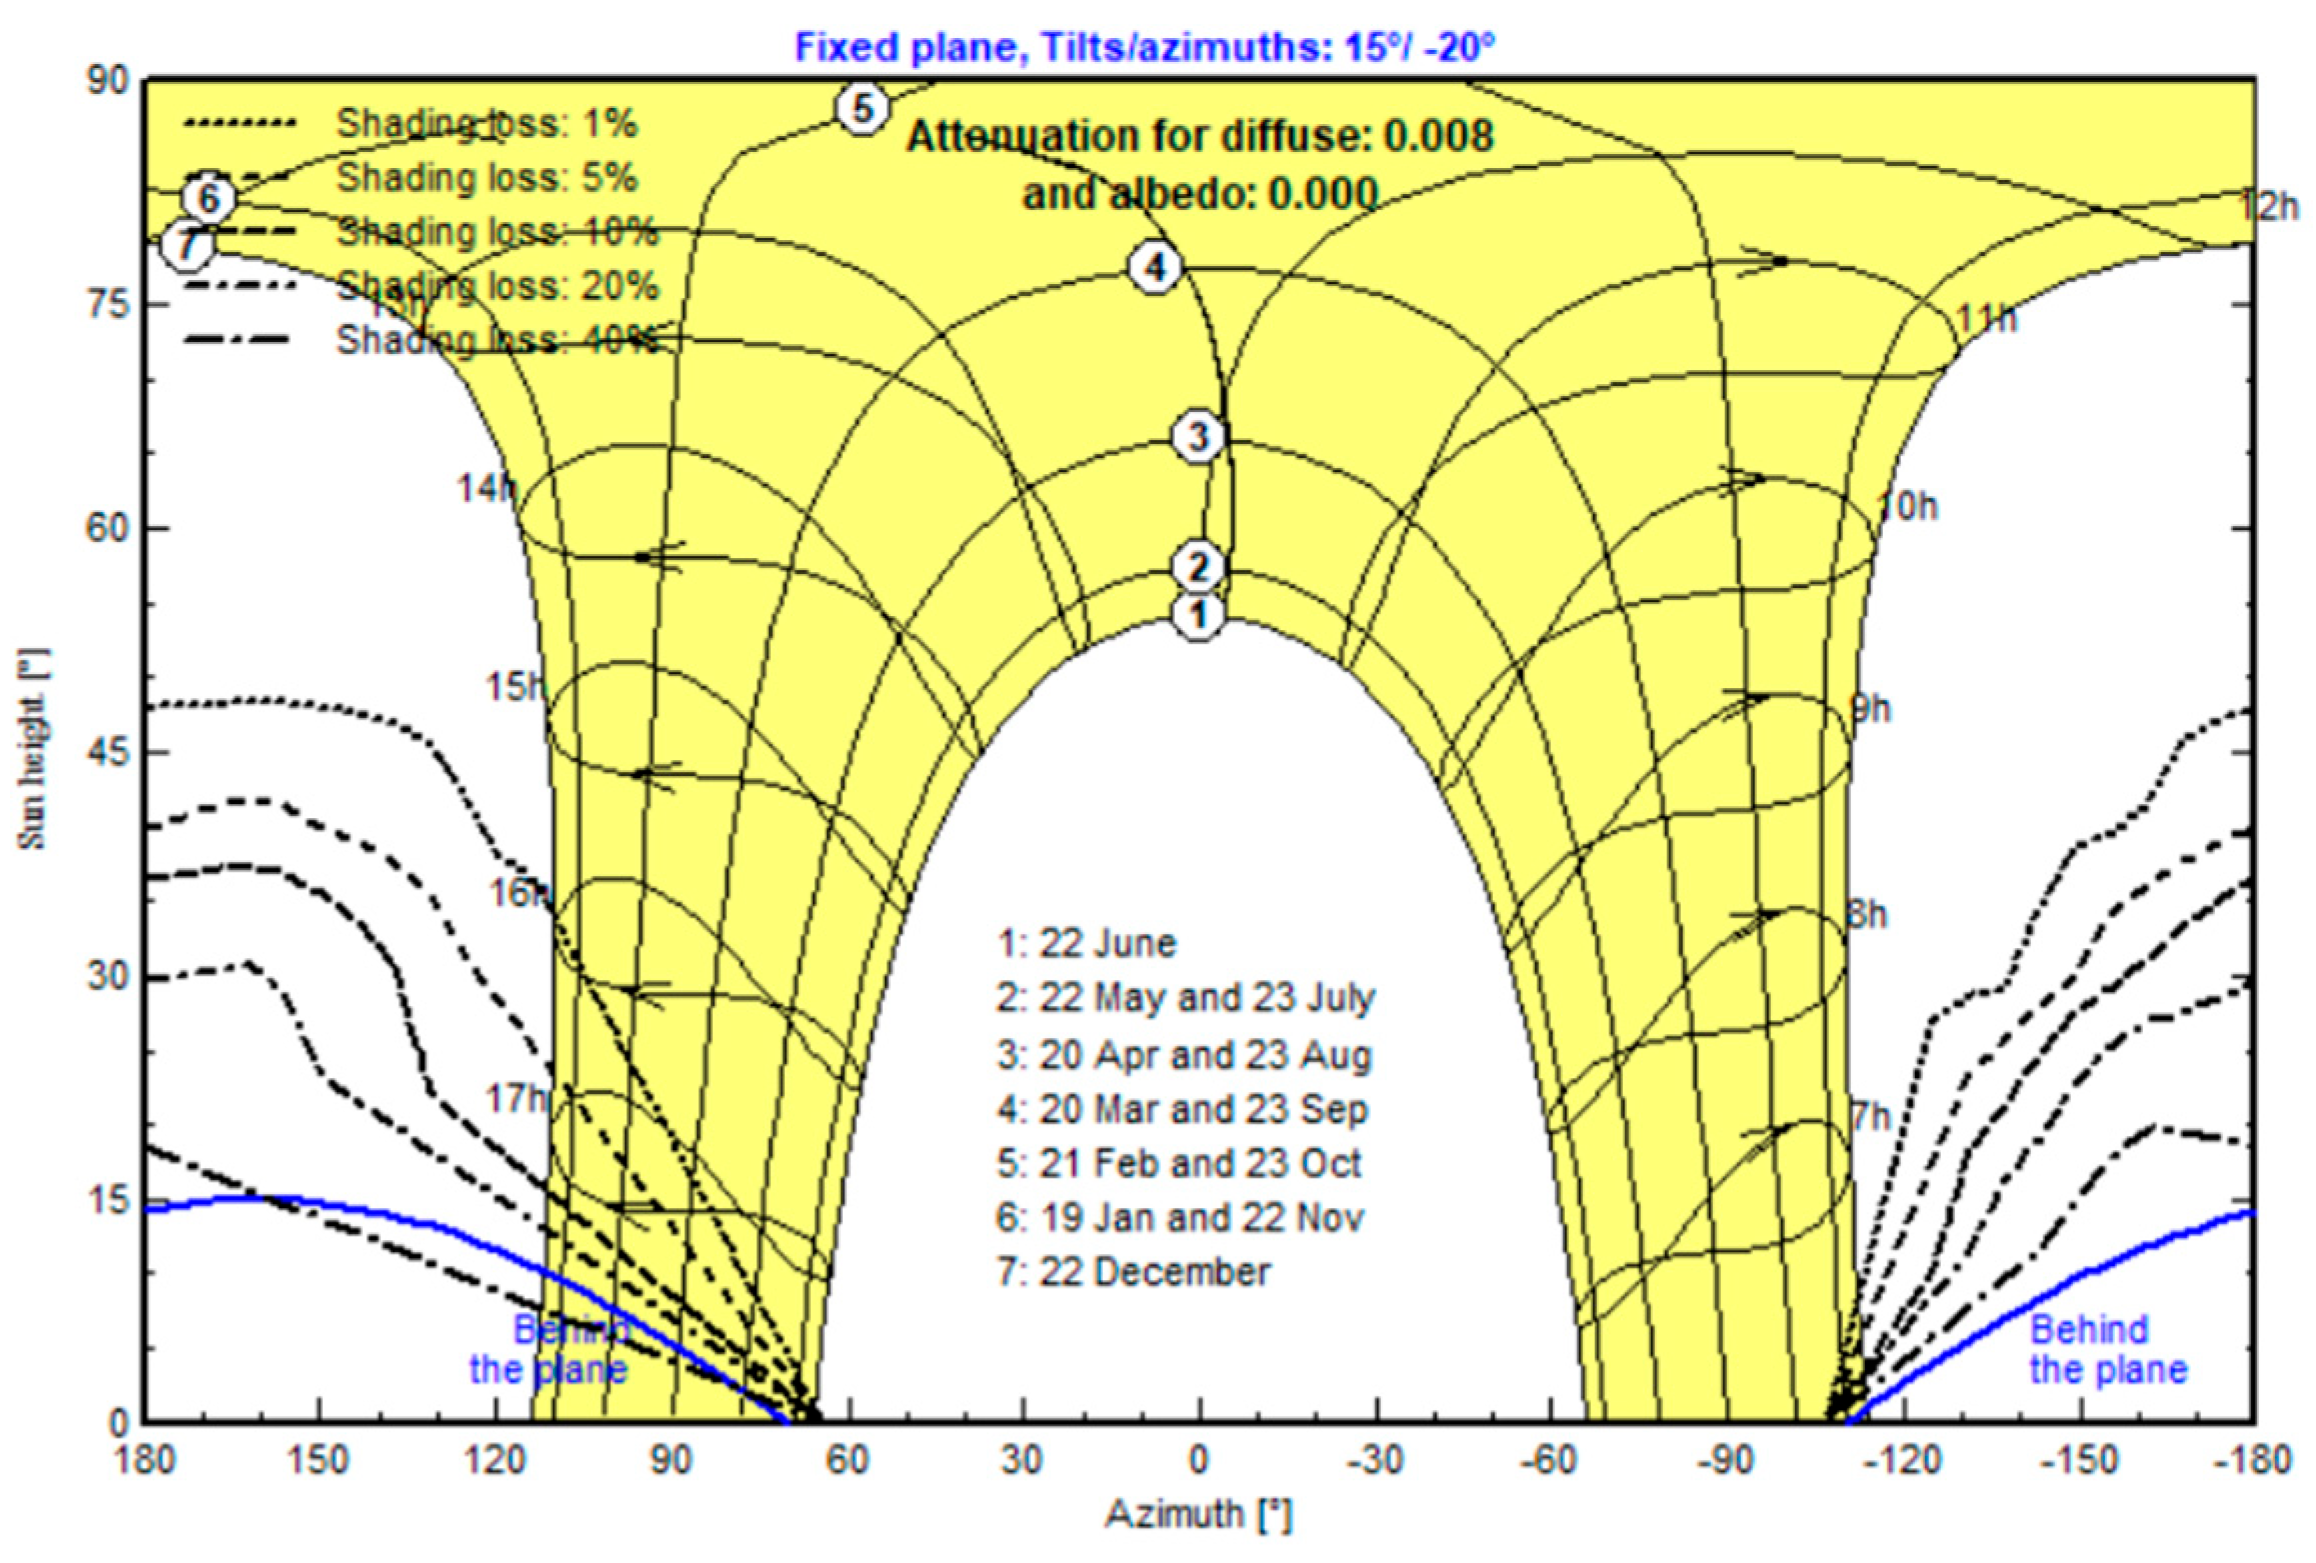
Since Lobito is located in the Southern Hemisphere, the PV panels will have to be oriented in the Northern direction. The optimum angle and azimuth positions were analyzed using the European Commission’s PVGIS v5.3 database [
23]. PVGIS recommends an optimum angle of 15° and an azimuth of −179° (−1° in PVsyst v8). Since the site where the system will be installed does not have an azimuth of 180° (0° in PVsyst v8), the panels will have to be installed according to the layout of the field. Therefore, the optimum angle of 15° was maintained when configuring the system in PVsyst v8, and the azimuth was set to −20° (−160° in PVGIS v5.3).
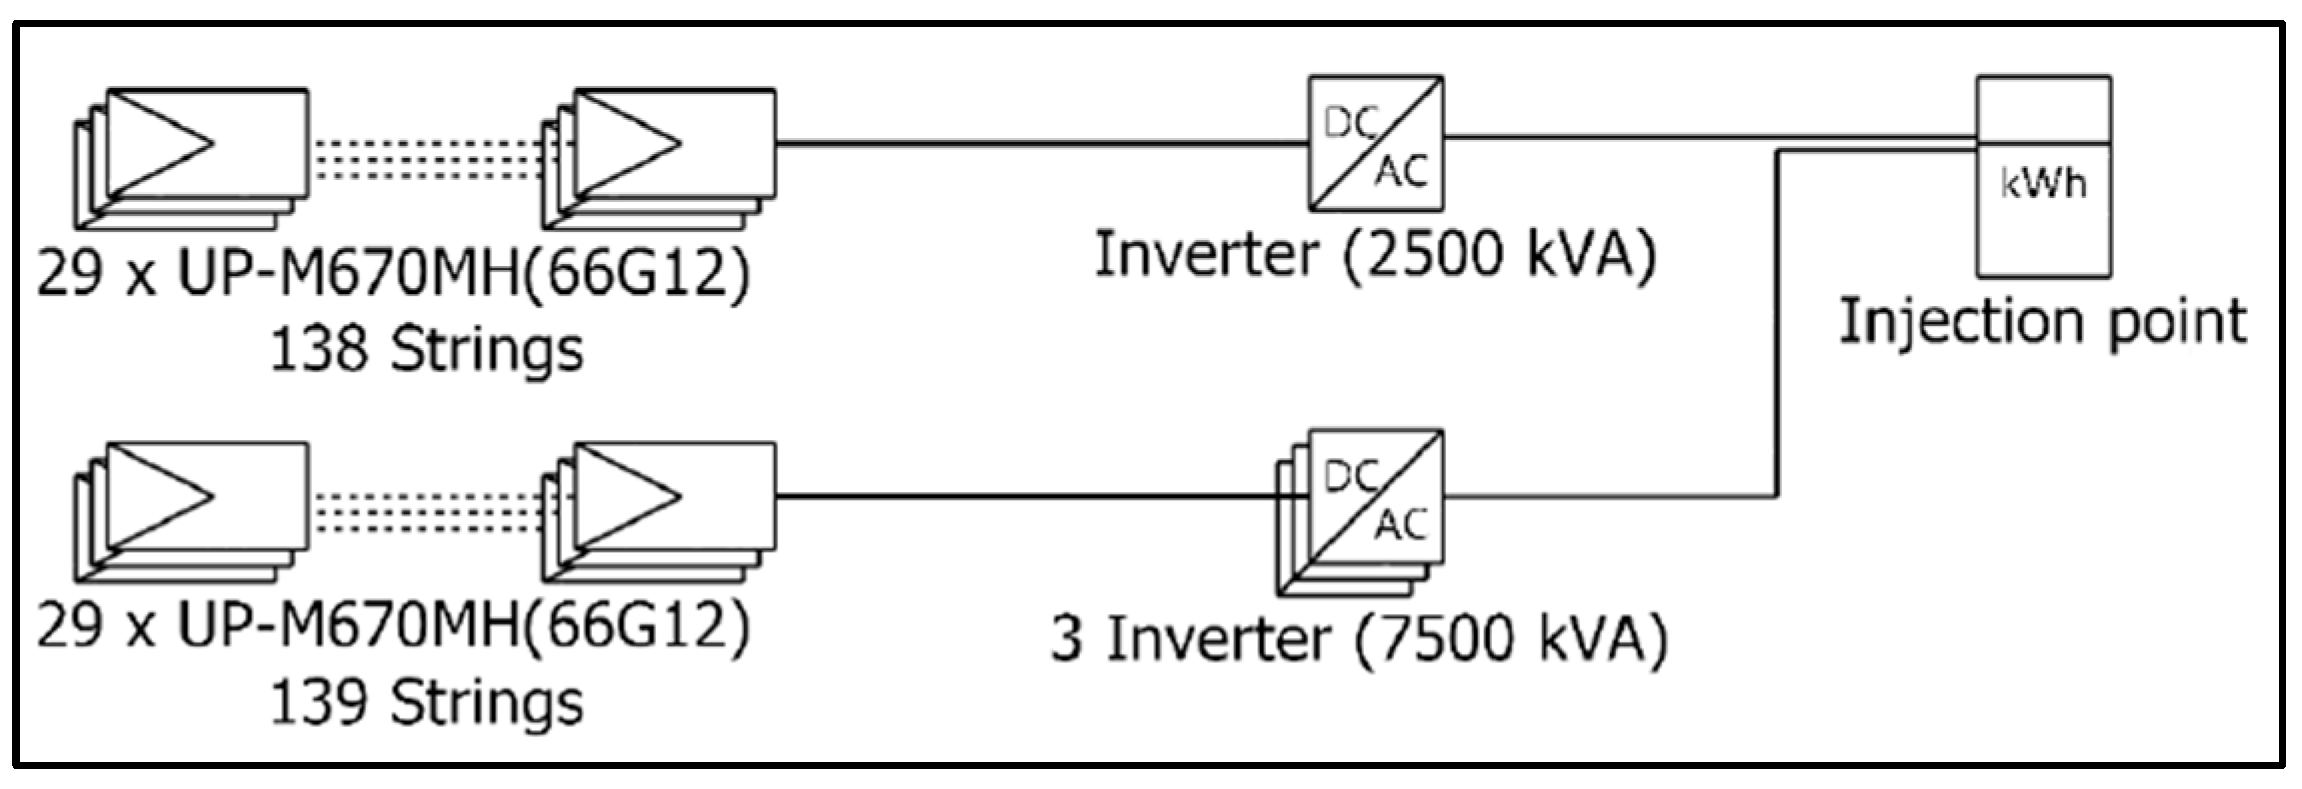
The PV module with the highest peak power currently available was chosen—model UP-M670MH-66G12—made of monocrystalline silicon by Upsolar (Shanghai, China), manufactured in 2021, with a peak power of 670 Wp.
Table 4 shows some of the data available on the manufacturer’s datasheet.
The inverter for the installation was selected based on the criterion outlined in Equation (2):
where
Pinst is the power peak of the installation and
Pinvert is the nominal inverter power. Therefore, the Sungrow’s inverter model SG2500-HV-20 (production in Hefei, Anhui, China; headquarters in Costa Mesa, CA, USA) was selected, with 2500 kW of nominal AC output power.
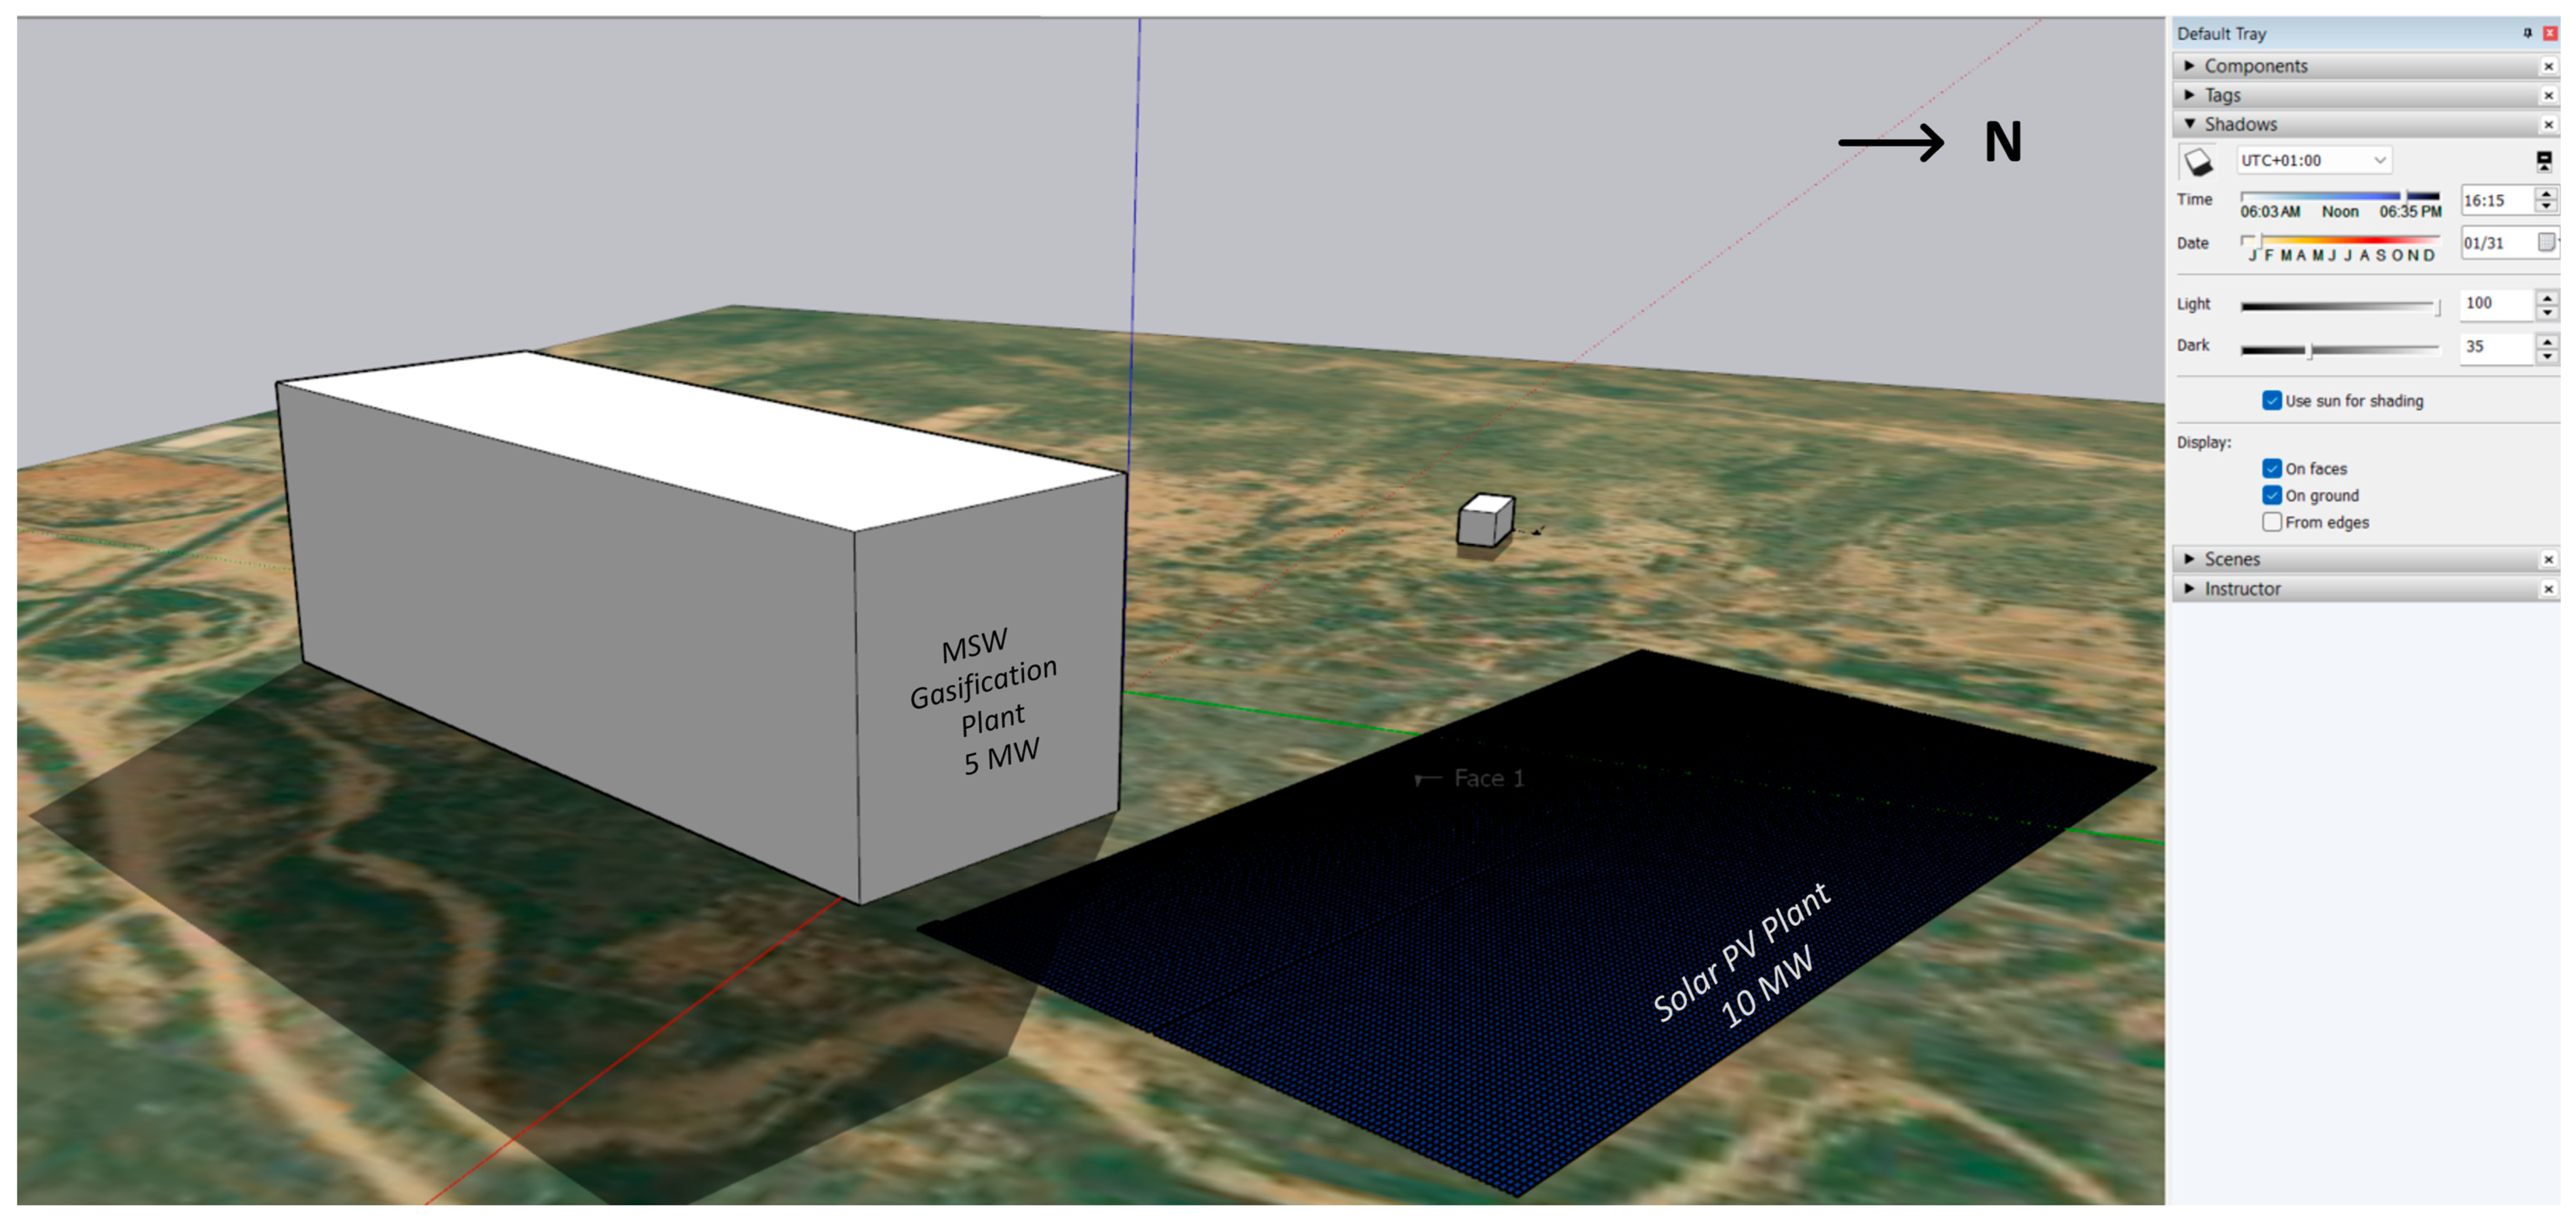
Table 5 shows the main data of the selected inverter, according to its respective datasheet. Since the installation of the PV system was considered in the same location as the MSW gasification plant, its layout and possible shadowing effects were simulated in PVsyst v8 and SketchUp v2023.0 software by building the 3D scenario. The structure, with an approximate area of 3 hectares for a 200 t/day capacity MSW plant, was oriented to the South, opposite the PV module faces, to prevent shading (
Figure 6).
2.3. Simulation of System Integration: MSW Gasification, Solar PV Plant, Water Electrolysis, and Public Electricity Grid
The integration of the systems was analyzed through modeling and simulation in the HOMER Pro v3.16.2 software. The hybrid system was modeled by inserting (a) an electrical grid component, (b) a syngas generator producing the same electrical power obtained in the Aspen Plus v11.0 simulation, (c) a solar PV system with the same peak power as that obtained in the PVsyst v8 sizing, (d) a water electrolyzer, (e) a hydrogen tank, and (f) a fuel cell, in a system with a load that was calculated to have a peak power demand of approximately 770 MW, corresponding to the Lobito region.
Figure 7 summarizes the hybrid system modeled in HOMER Pro v3.16.2.
The water electrolysis system was included in the hybrid model, in HOMER Pro v3.16.2, to assess its potential under the hypothetical scenarios of electricity surplus. However, given the current deficit in electricity supply in the region, the practicality of this component remains limited and contingent on future production capacity expansions.
Rather than representing an existing commercially available unit, the model incorporates typical electrolysis parameters, including efficiency, the hydrogen production rate, and operational constraints, based on industry data.
This approach allows for an optimized simulation of the system’s performance without relying on a specific supplier or custom-built prototype. Future studies may explore commercially available electrolysis systems to validate the assumptions made in this model.
Metrics such as LCOE, electricity production (GWh/year), and payback period (years) were calculated and generated in HOMER Pro v3.16.2. The model incorporated hourly load data for the Lobito region to assess grid reliability and penetration rates.
A 5 MW gasifier was designed to process 200 t/day of MSW, producing syngas with a lower heating value (LHV) of 8.69 MJ/kg. Operating continuously for 24 h, the gasification unit compensates for the intermittency of solar PV, ensuring a steady power supply. This hybrid approach underscores the essential role of gasification in renewable energy systems, especially in areas prone to energy shortages.
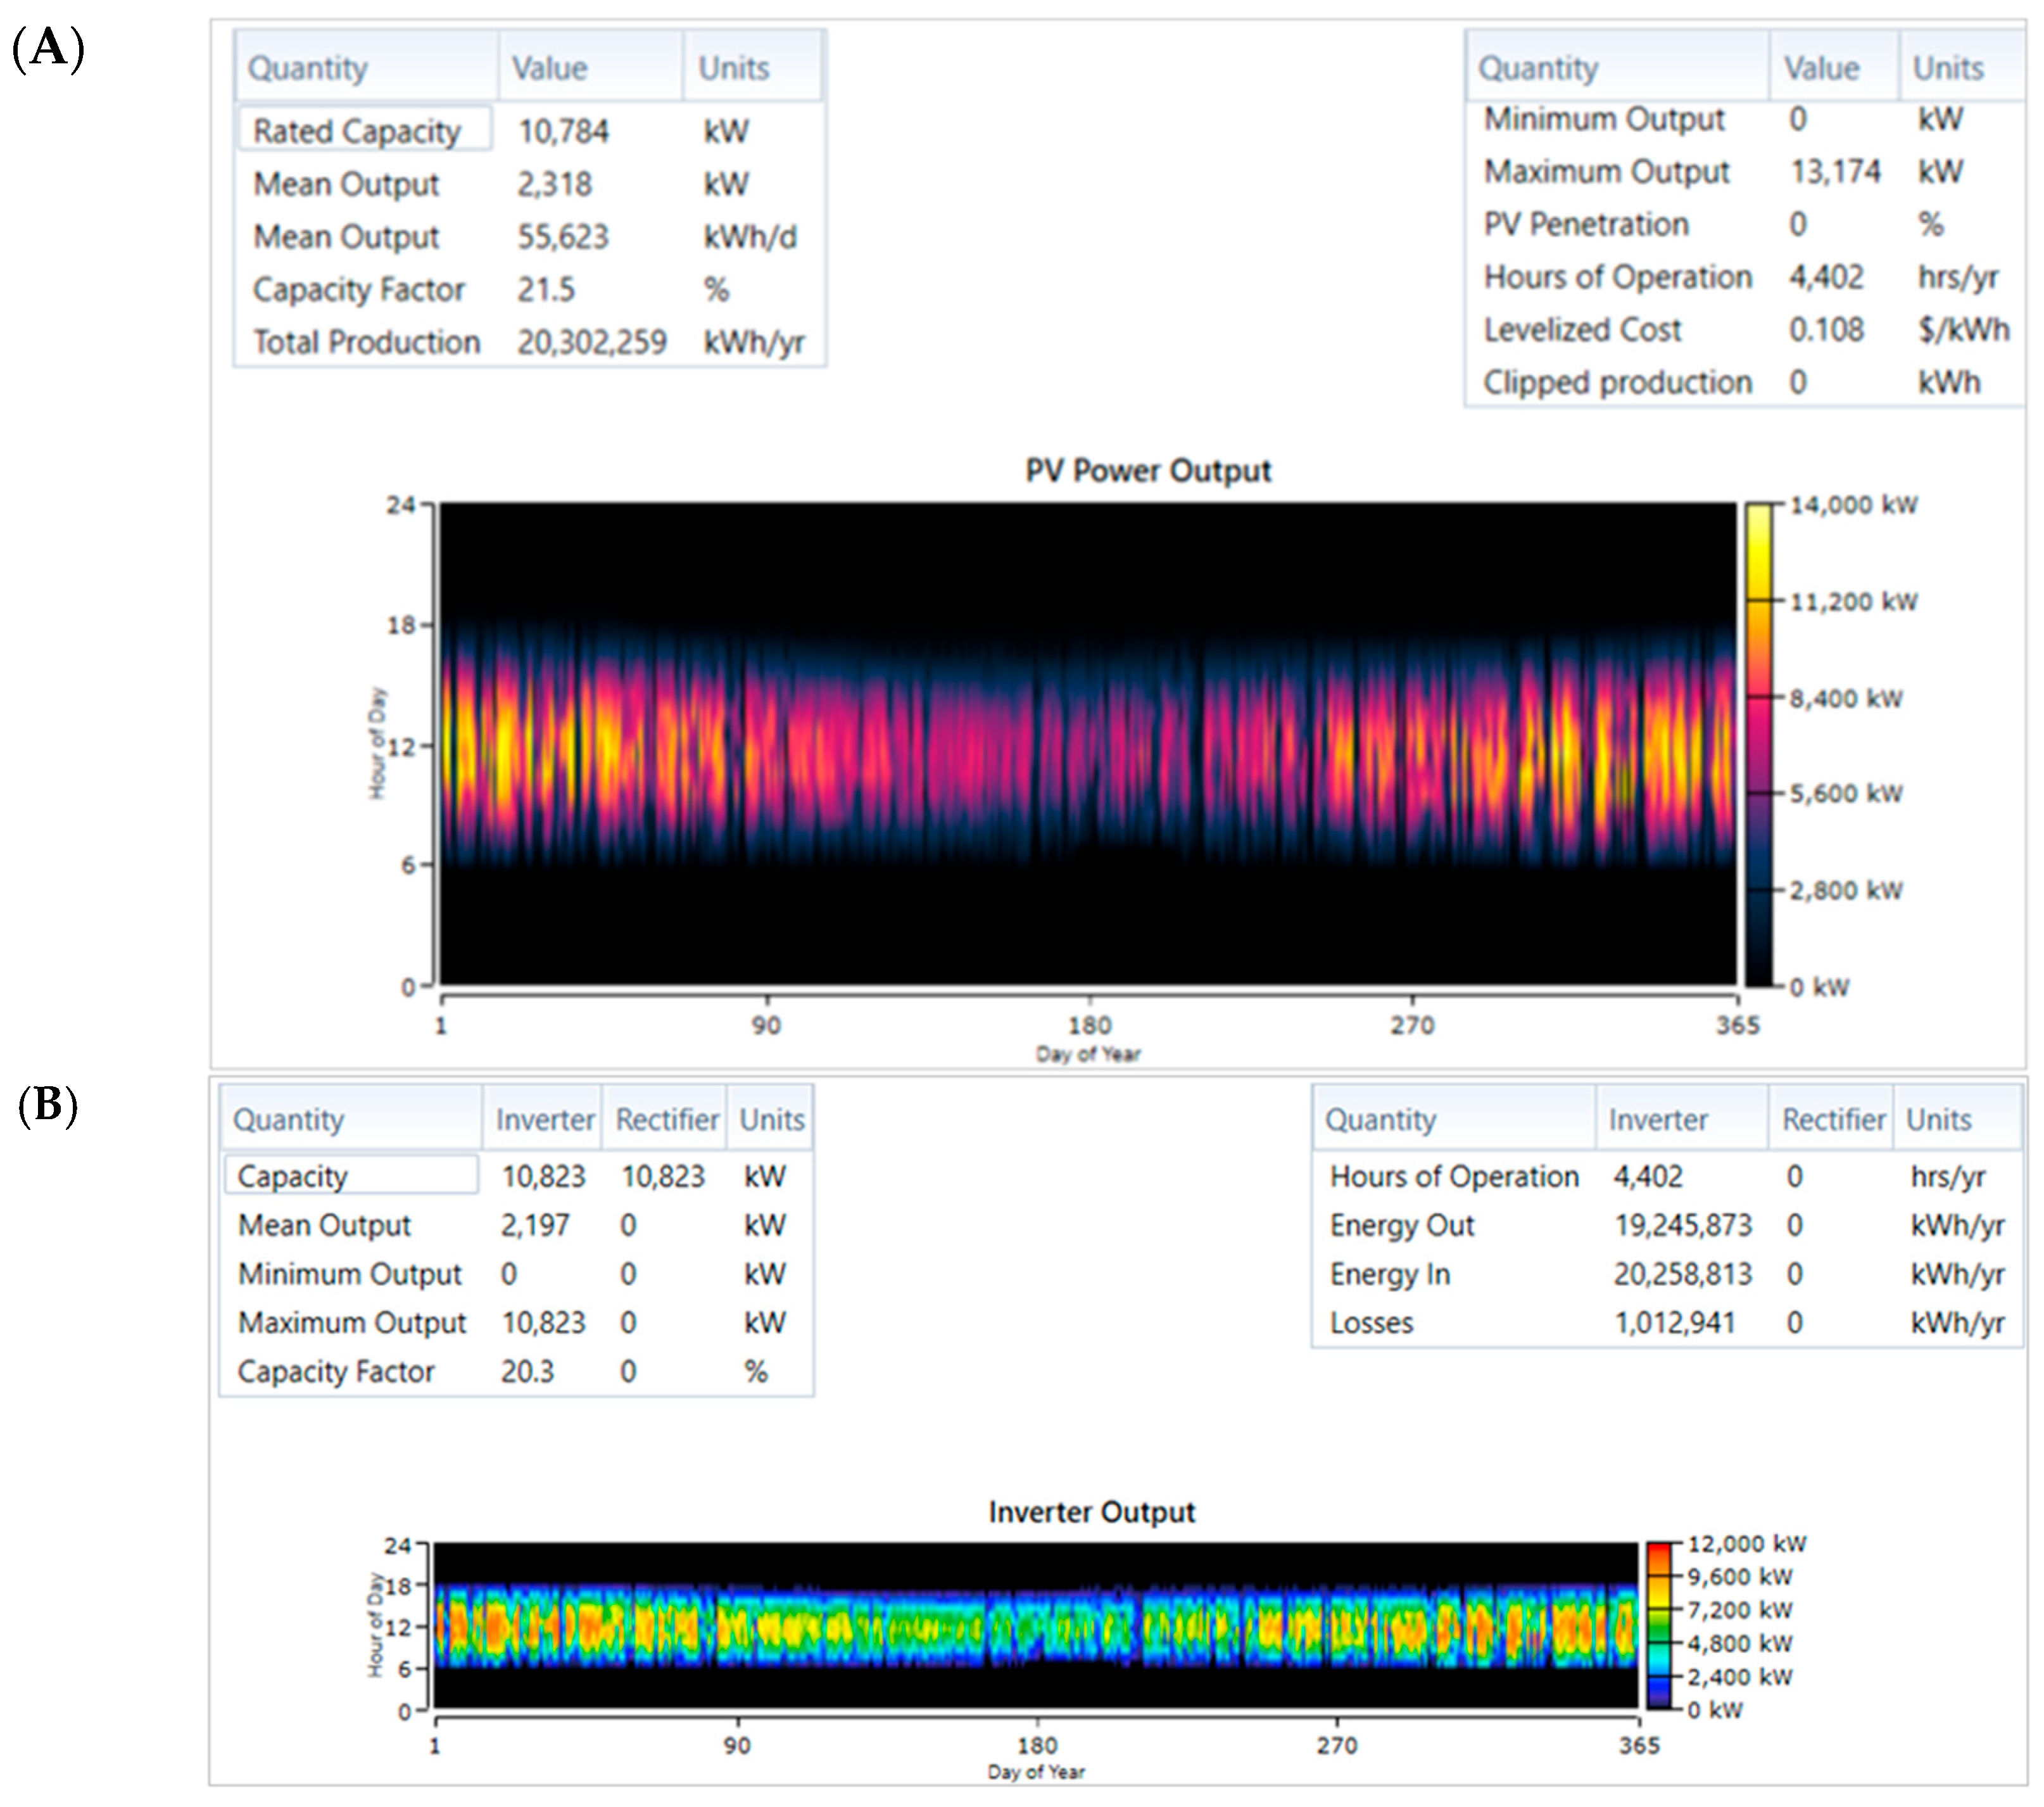
The solar PV system was configured based on the information made available throughout the study on PVsyst v8.
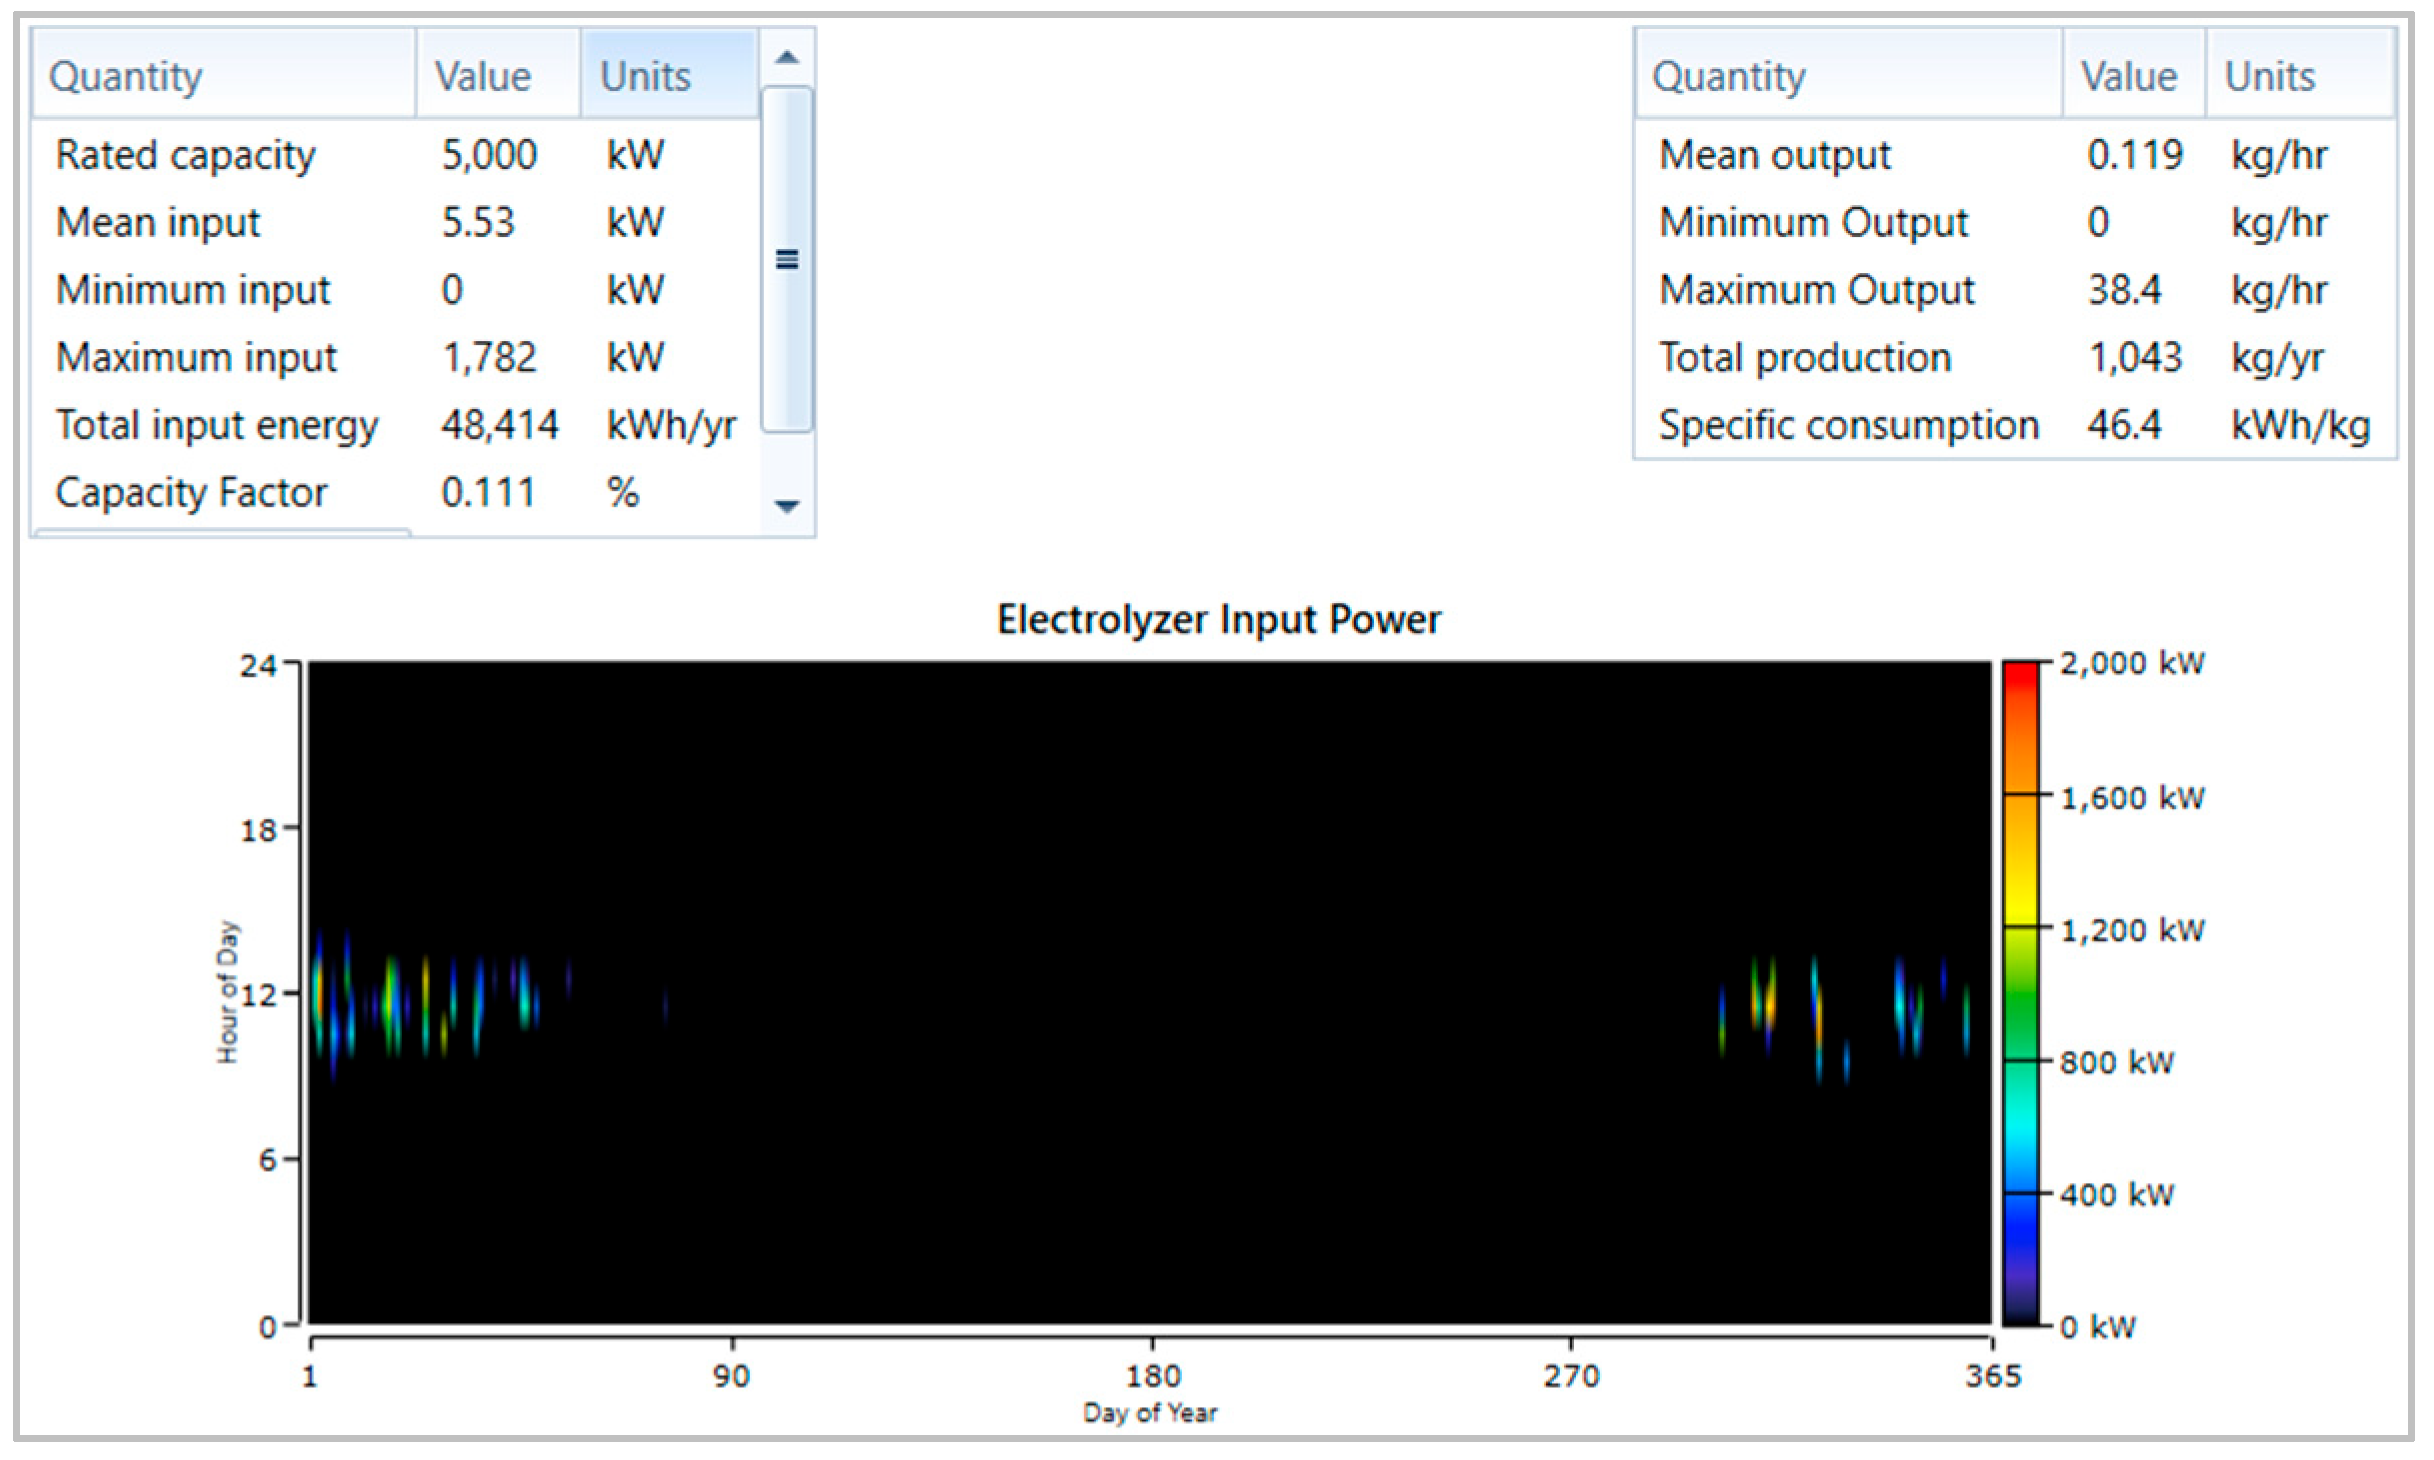
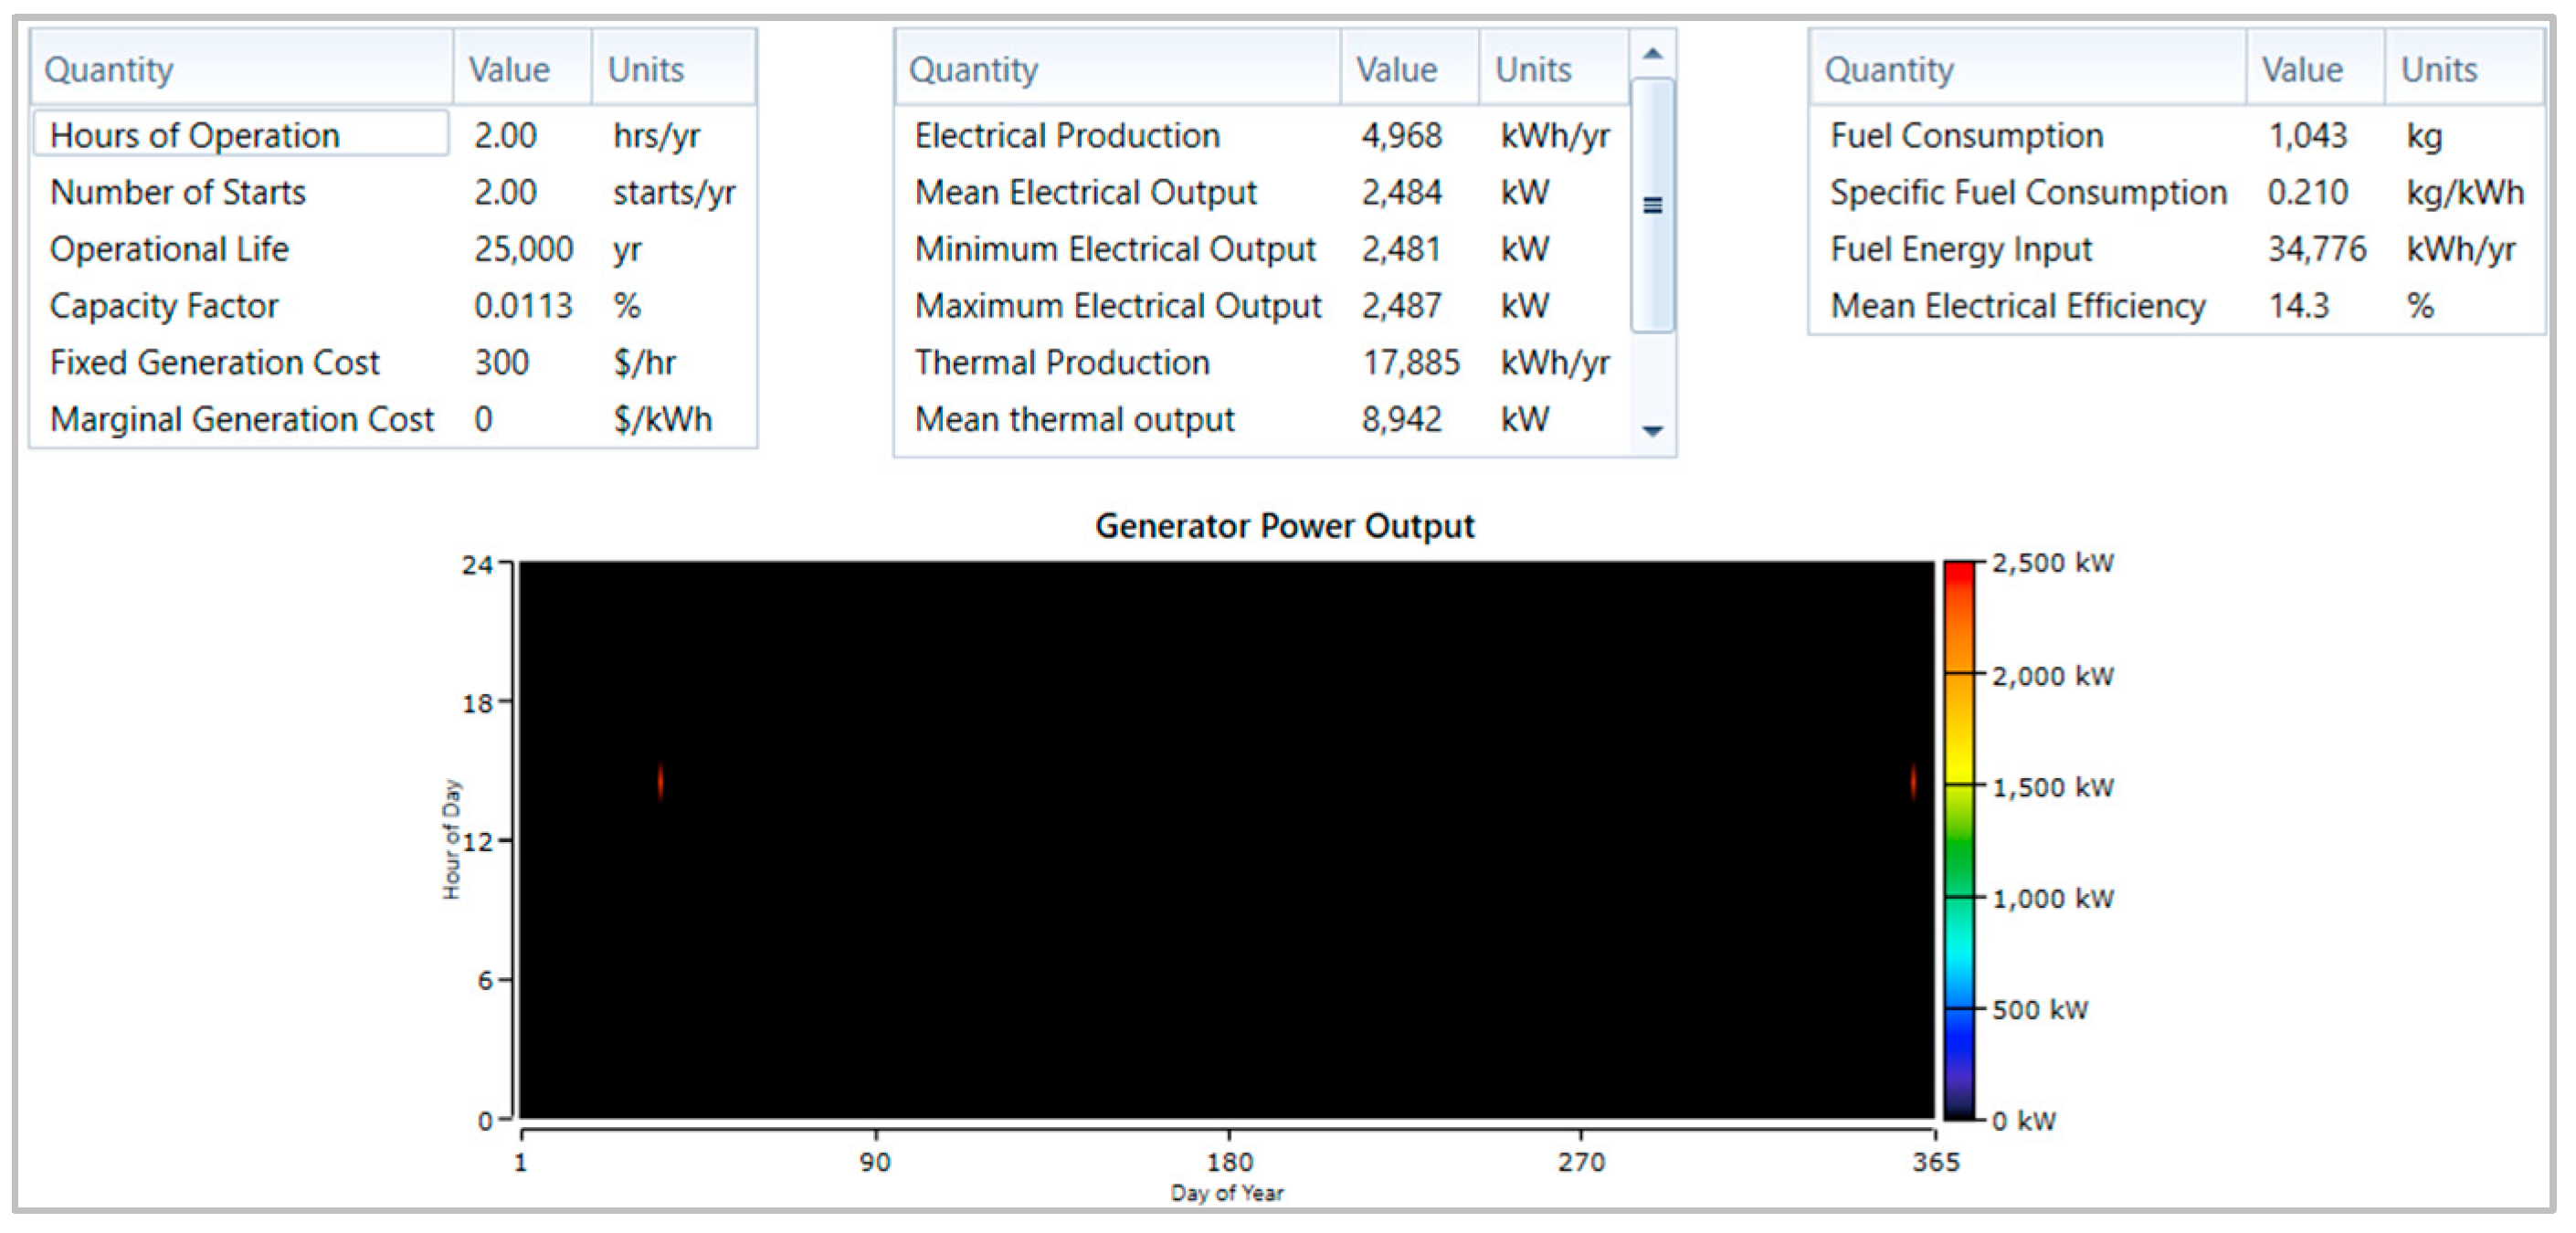
An electrolyzer with a capacity of 5 MW was configured, with 85% efficiency and DC output. The hydrogen produced was sent to a 9 t storage tank, with no initial rate of stored hydrogen. The fuel cell configured had a maximum output of 5 MW, with a DC electrical bus that produces electrical energy from stored hydrogen. The thermal energy generated was not considered.
Finally, the public electricity grid—modeled with a variable load of 500–700 MW—was analyzed to assess its response to the integration of the hybrid renewable energy system and the associated load-response dynamics.
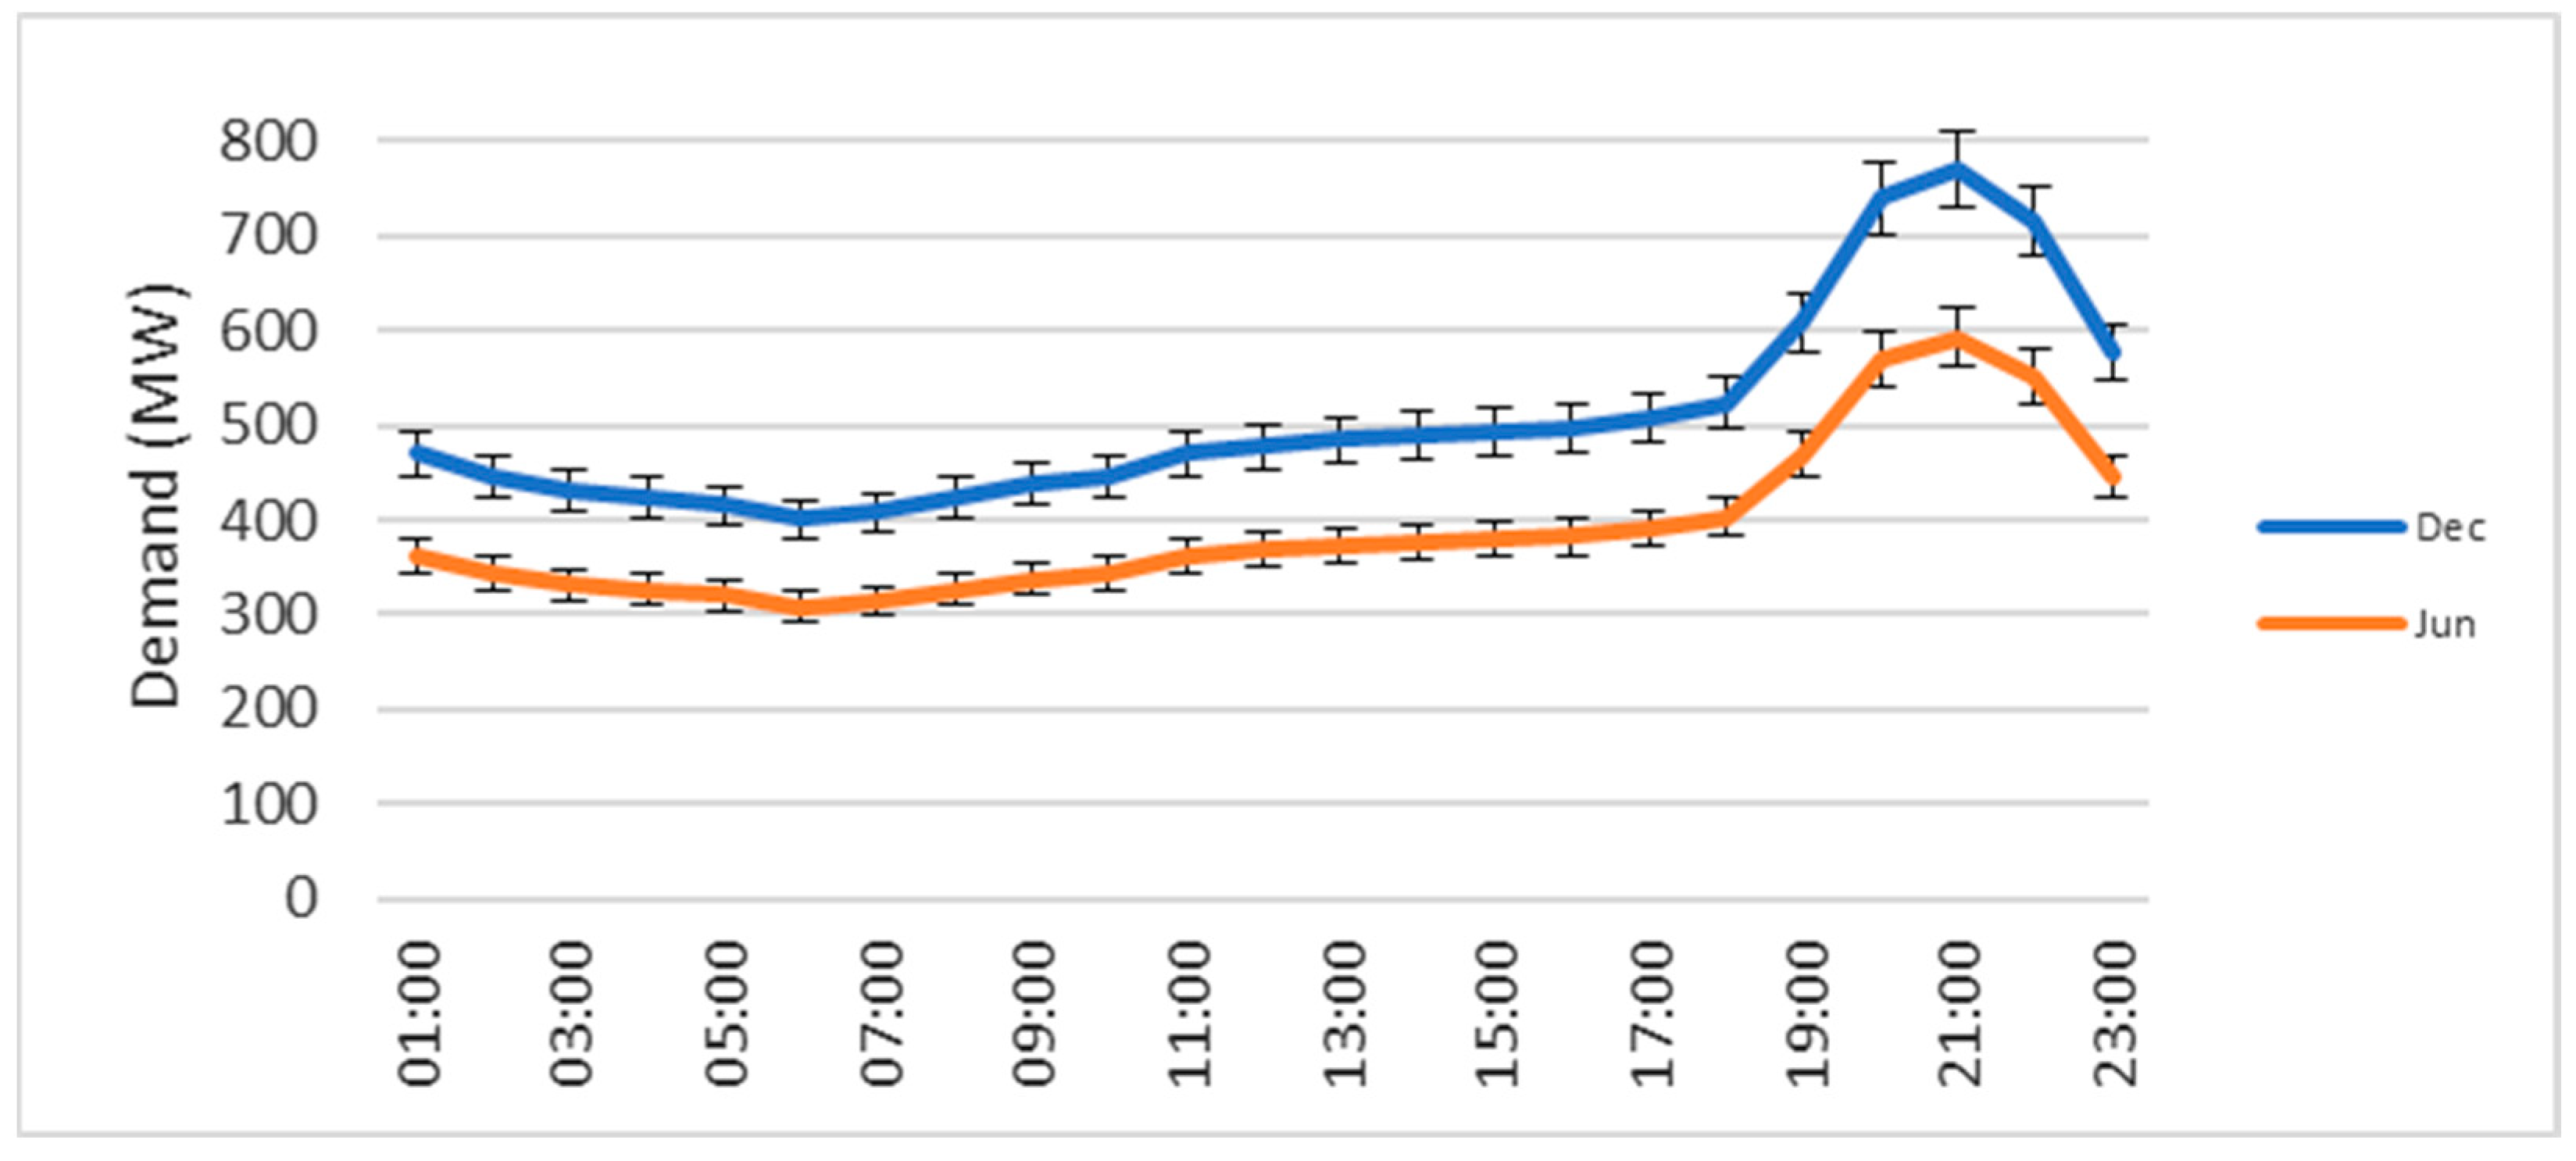
Regarding the peak power demand of 770 MW, it is important to explain how this value was calculated. According to JICA et al. [
32], in a report on the electric sector development project in Angola until 2040, the central region—where the study region is located—is expected to have a peak power demand of 877 MW for residential, commercial, and industrial customers by 2025, considering the current electrification rate. The maximum demand per consumer is estimated to be 1.589 kW for the studied region. Without considering the electrification rate, assuming a general demand based on the current number of residents in Lobito (484,351 inhabitants) and the per capita demand rate of 1.589 kW, the general demand power was calculated as 770 MW.
Based on the information presented and the load diagrams proposed by JICA et al. [
32], it became possible to define the specific load diagram for the study region (
Figure 8), whose data was then used to configure the public electricity grid in HOMER Pro v3.16.2 software.
4. Conclusions
This study assessed the potential of a hybrid renewable energy system integrating MSW gasification and a PV system to address energy challenges in Lobito, Angola. The gasification process converts MSW into syngas through thermal decomposition under controlled conditions. The PV system supplements this process by harnessing solar energy, optimized through precise system design and simulation to maximize energy output under local solar conditions.
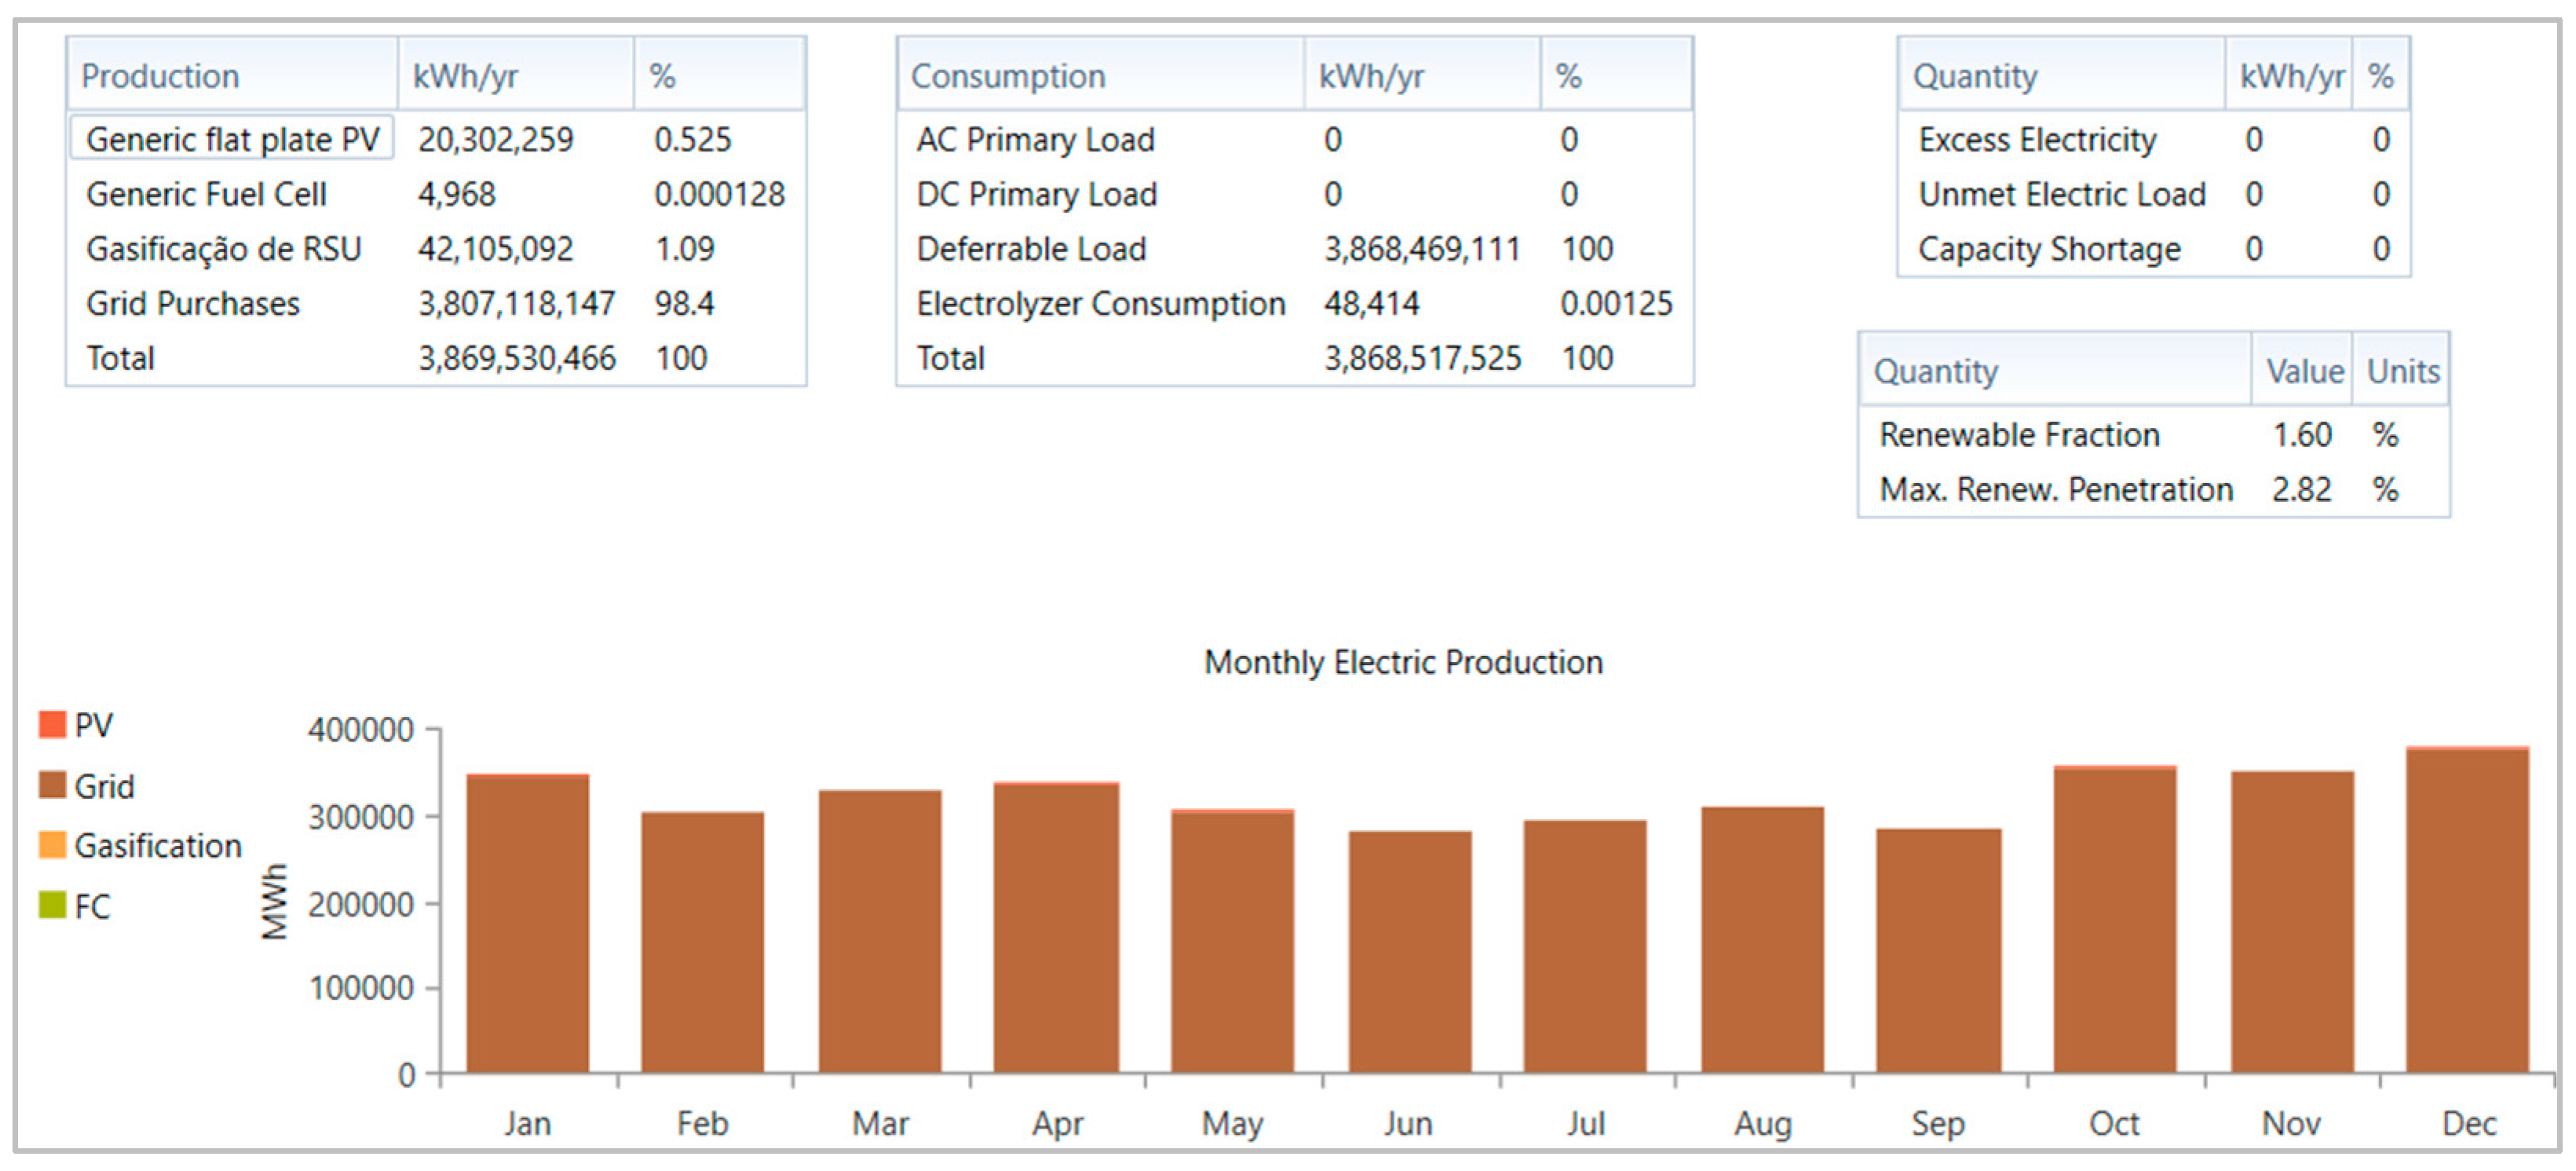
The integration of the MSW gasification plant and solar PV park addressed critical energy challenges by ensuring continuous power generation and reducing reliance on fossil fuels. The system generated 62 GWh/year, with a penetration rate of 2.80%, supplying electricity to 1186 households while achieving an LCOE of 0.1792 USD/kWh and a payback period of 16 years.
From an environmental perspective, the system reduced CO2 emissions by 42,000 t/year from MSW gasification and 395 t/year from PV production, demonstrating its potential for decreasing GHG emissions and mitigating climate change related to waste-related pollution. The deployment of MSW gasification also highlighted the role of waste-to-energy technologies in enhancing urban waste management and promoting a circular economy.
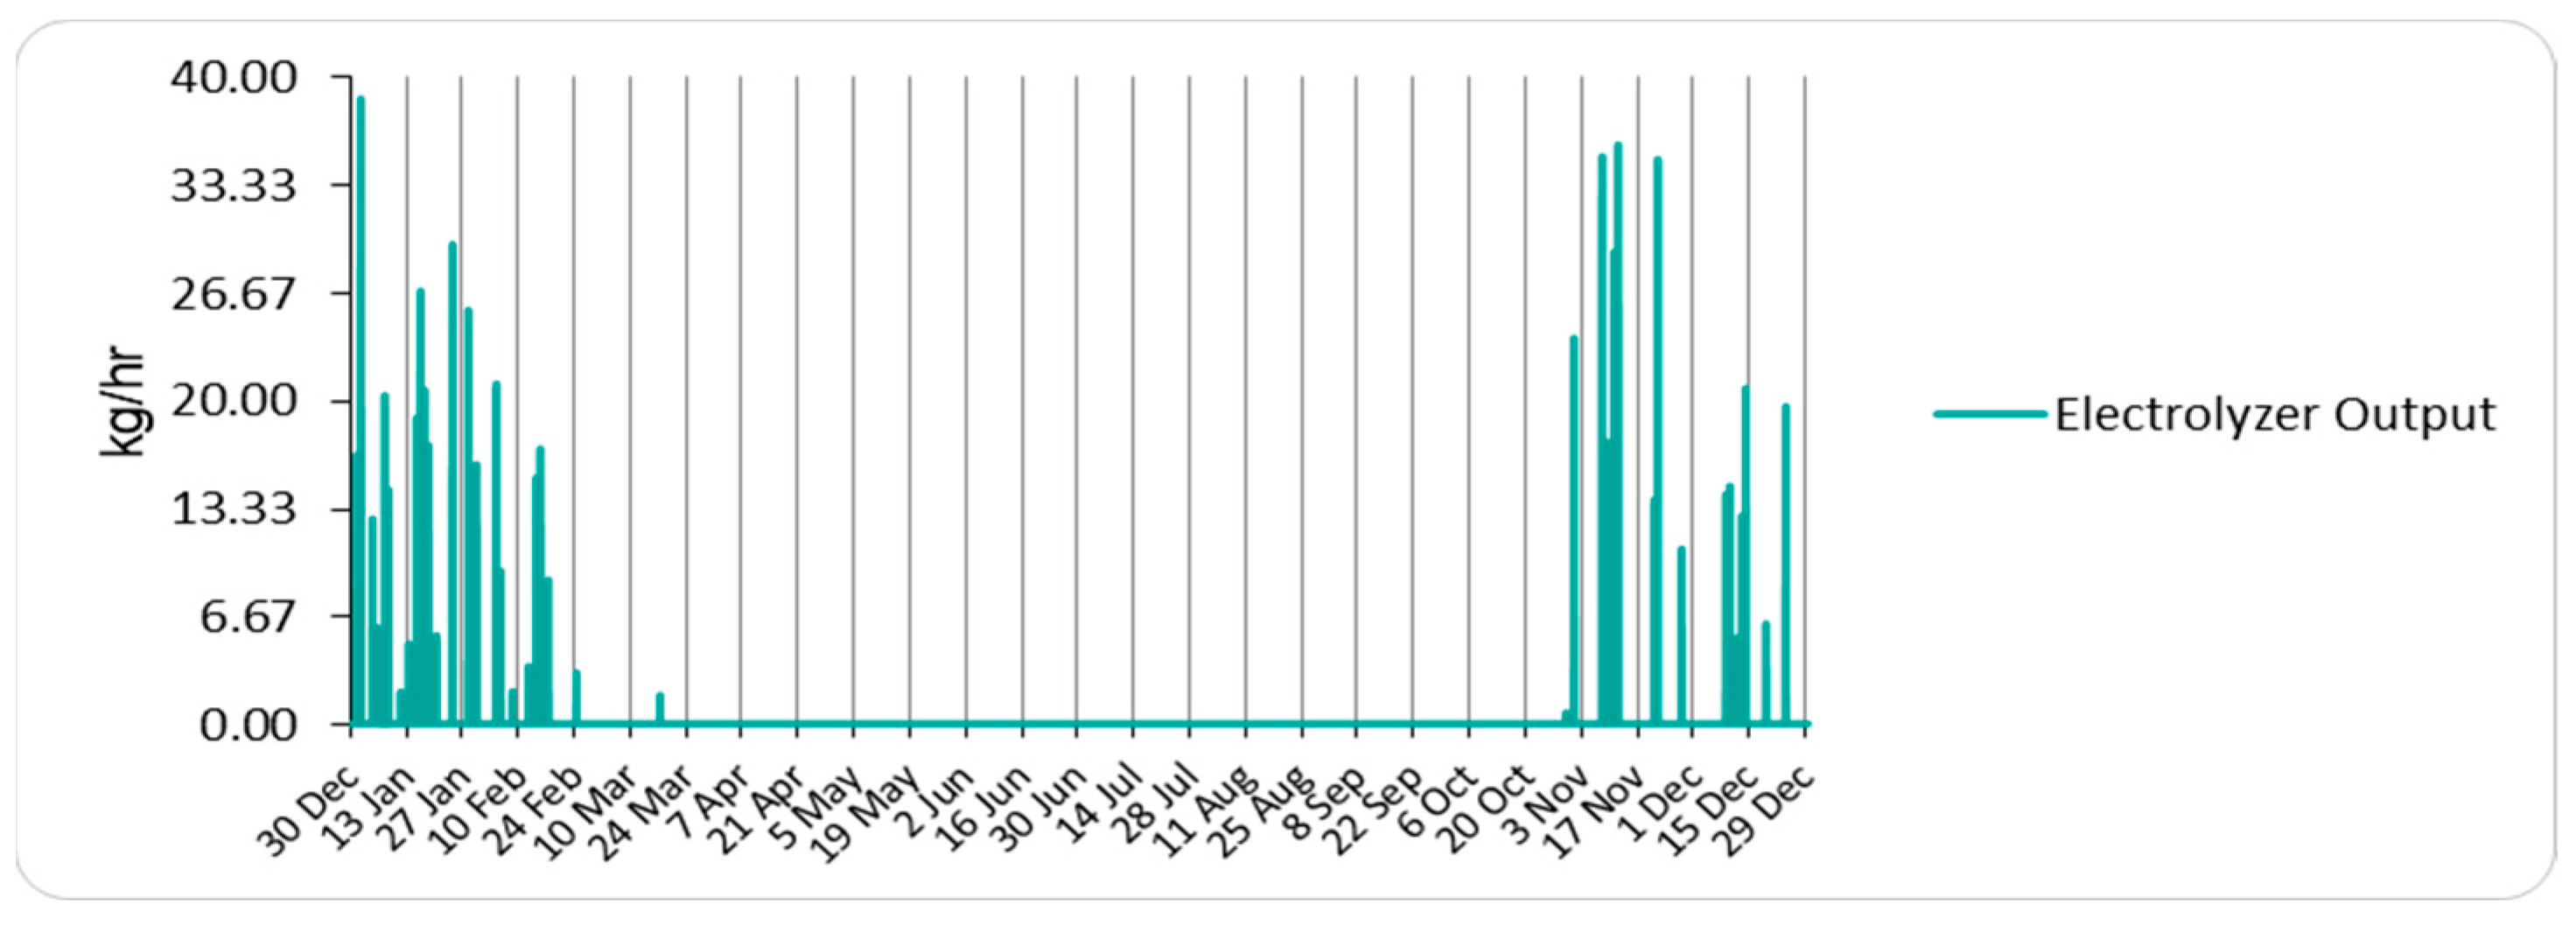
However, the lack of surplus electricity for green hydrogen production indicates the need for further infrastructure investments to increase energy production if H2 is intended to be produced. This limitation highlights a key area for future research: scaling up hybrid systems to achieve excess energy for advanced applications such as hydrogen generation and storage. Additionally, studies on optimizing syngas cleaning processes could enhance the efficiency and longevity of gasification systems.
While this study focused on the technical and economic feasibility of the proposed hybrid system, future research should explore maintenance and operational challenges, particularly for MSW gasification. These factors are critical for ensuring long-term economic viability and practical implementation.
Furthermore, the payback period of 16 years is primarily due to the inclusion of the hydrogen production system, which is not currently economically viable. When excluding the hydrogen production component, the payback period is reduced to 11 years, making the system significantly more attractive for investment and implementation in similar regions.
It is also recommended that future work include additional local surveys and waste characterization studies to further refine the proximate analysis and the LHV of MSW.
In conclusion, this research provides a scalable framework for integrating renewable energy sources in developing regions, offering a pathway to reduce energy poverty, improve environmental quality, and achieve sustainable development goals, such as good health and well-being, affordable and clean energy, decent work and economic growth, and industry, innovation, and infrastructure. The findings are intended to inform policymakers, investors, and researchers in the development of hybrid energy solutions tailored to local contexts.


