Article

Comprehensive Evaluation of Cogeneration Biogas Multiple Supply System for Rural Communities in Northwest China

College of Energy and Power Engineering, Lanzhou University of Technology, Lanzhou 730050, China
*
Author to whom correspondence should be addressed.
Energies 2025, 18(12), 3124; https://doi.org/10.3390/en18123124
Submission received: 6 May 2025 / Revised: 27 May 2025 / Accepted: 6 June 2025 / Published: 13 June 2025

Abstract

In the context of rapid urbanization in China, many farmers still live in areas far away from urban energy supply networks. To meet the multi-level energy demands of rural communities, this study proposes a combined heat, power, and electricity (CCHP) supply system that uses solar and biomass energy as inputs, tailored to the natural resources and climatic conditions of the northwestern region. A theoretical model of this system was established in Nanan Community, Wuwei City, and its dynamic performance throughout the year was simulated and analyzed using TRNSYS software. The system was also evaluated for its economic viability, energy efficiency, and environmental impact. The results show that compared with the original and traditional energy supply systems, the CCHP system achieves average primary energy saving rates of −9.87% and 41.52% during the heating season, annual cost savings of 50.35% and 64.19%, carbon dioxide emission reduction rates of 32.89% and 66.86%, and a dynamic investment payback period of 3.14 years. This study provides development ideas for constructing modern integrated energy systems in rural areas that are remote from urban energy supply networks and offers references for investors.

1. Introduction

With the development of society and the “double carbon” goal, the energy consumption of rural communities has shown a significant increase, with clean energy, such as biomass, gradually replacing traditional coal-fired energy supply methods [1,2]. The problem of unstable energy supply is often caused by the inherent nature of a single renewable energy source. A distributed multi-generation system, with multiple renewable energy sources complementing each other, can not only meet the multi-level energy demand of users, but can also realize the recycling of rural resources and improve the local environment, which is of great significance for the revitalization of the countryside [3].
At present, many scholars have conducted a lot of research on the integration optimization [4,5,6], performance analysis [7,8], and comprehensive evaluations [9,10,11] of distributed energy systems that use renewable energy sources, wherein these comprehensive evaluations mainly include the evaluation of the energy performance [12], economic performance [13], and environmental performance [14] of the system. Among them, Zhu Y et al. [15] established an optimization design model for a distributed CCHP system, based on minimum system costs, for rural communities in Ankang City. The results showed that following changes to carbon reduction strategies, the energy consumption and cost of the distributed cogeneration system exhibited diverse differences. Zhang D et al. [16,17] constructed a cogeneration system, with biomass as the main energy input, and studied the environmental benefits, economic benefits, and geographical applicability of the system. The research results indicate that the CHPB system has significant potential in regard to reducing carbon emissions, especially in rural areas of China. Das Barun K et al. [18] constructed a CHP system that had a micro gas turbine and PV system, and analyzed the energy cost and efficiency of the system, as well as the energy demand, and analyzed the operational performance and economics of the system. Yousefi H et al. [19,20] modeled an internal combustion engine drive system and the combination of an internal combustion engine and a photovoltaic/thermal system in two CCHP modes, for use in a large office building in Tehran, and compared and analyzed the energy performance, economy, and environmentally friendliness of these two modes. Research has shown that although the addition of renewable energy may increase the initial investment costs, in the long run, the economic and environmental benefits it brings are significant. Al Moussawi H et al. [21] designed a solid oxide fuel cell (SOFC), based on an environmentally friendly trigeneration system, to meet maximum heating, cooling, and domestic hot water loads, and evaluated the system according to the 4-E assessment criteria. Song X et al. [22] investigated the performance of a CCHP system under two strategies, heat following and electricity following, comparing and analyzing the primary energy consumption under both strategies. Wang X et al. [23] studied and analyzed the energy supply and system economics under climate change conditions, using a CCHP system in a hospital in Shanghai, China, as a case study. Huang Y et al. [24] built a biofuel cogeneration system, equipped with an energy storage device, to meet the dynamic energy demand for electricity, heating, and cooling in remote households, using techno-economic modeling and performance analysis. Compared with the triple supply system for fossil fuel combustion, the biofuel cogeneration system can reduce CO2 emissions by 8.9 tons per year. Lombardo W et al. [25] studied a novel solar-driven combined cooling, heating, and power (CCHP) system and performed energy and economic analysis of the system. Zhang D et al. [26] constructed a biogas system, with the anaerobic digestion of cow manure as the main driver, to meet the multi-level energy demand of 17 households in rural China for heat, electricity, and biogas.
The above research indicates that the use of solar energy or biomass energy can effectively reduce fossil energy consumption and environmental pollution, and improve the economic benefits. However, in rural areas with abundant renewable resources, relying solely on the utilization mode of a single renewable energy source is still insufficient to meet the energy needs, and there are still certain shortcomings in regard to such systems.
Pal A et al. [27] proposed a hybrid renewable energy system, complemented by solar and biomass energy, based on a small rural community in India, and evaluated the biogas resources in the area and analyzed the energy cost of the system. Wang J J et al. [28] proposed a hybrid cooling, heating, and power system, driven by biomass and solar energy, and analyzed and studied its thermodynamic performance and CO2 reduction rate under variable external conditions. The research results show that the exergy efficiency of the biological proton system is 16.2%, the exergy efficiency of the solar subsystem is 9.4%, and the CO2 emission reduction rate is 95.7%. Murugaperumal et al. [29] established a hybrid renewable energy system incorporating solar, wind, and biomass energy for rural areas, and optimized and analyzed the technical and economic feasibility of the system. The research results indicate that the system’s power generation cost is INR 10.18/KW·h. Moaleman A et al. [30] constructed a cooling–heating–electricity multi-generation system, with solar energy as the main energy input, modeled and simulated the system using TRNSYS software, and studied the dynamic performance of the system. Umar Maqbur et al. [31] proposed a microgrid system that complements solar and biomass energy, aiming to maximize the energy output of renewable energy systems and reduce energy costs. By optimizing the system design and adopting effective economic dispatch strategies, the cost effectiveness and environmental benefits of the system can be achieved. In addition, government subsidies can significantly reduce the investment payback period for solar photovoltaic systems, thereby improving the utilization rate of renewable energy. Wang L et al. [32] proposed a solar, wind, and biomass complementary system. The results indicate that the model can effectively improve the economic efficiency of PIES operators and users, while ensuring reliability. Nikitin A et al. [33] constructed a solar and wind complementary multi-generation system to provide cooling, heating, electricity, and fresh water to residential buildings and analyzed the thermodynamic performance and environmental and economic benefits of the system throughout the year. Mohsenipour M et al. [34] constructed a renewable energy system driven by solar energy and other renewable energy sources, oriented in regard to a greenhouse. Ma Z et al. [35] constructed a combined biomass and solar cogeneration system and evaluated the economic and environmental benefits of the system.
The above-mentioned scholars have studied multi-energy complementary power supply systems, which have better economic and environmental benefits. However, for users in cold rural areas, the demand for heat, electricity, and gas is higher.
Li J et al. [36] constructed a hybrid power system, complemented by solar, wind, and biomass energy, in a village in western China, evaluated its cost effectiveness and environmental benefits, and conducted a sensitivity analysis. Li C et al. [37] proposed a distributed energy system, with complementary solar and biomass energy, to meet the energy demand of a residential thermoelectric biogas plant for remote areas with biomass resources, and evaluated the system from energy, economic, and environmental perspectives. The research results indicate that the energy supply cost of the system is USD 0.098/kWh. Das H S et al. [38] evaluated the potential of renewable energy resources in Sarawak, eastern Malaysia, and studied the operational strategy for hybrid power systems. The research results showed that the system had good economic benefits and no carbon emissions. Villarroel-Schneider J et al. [39] analyzed the feasibility of a poly-generation plant, established jointly by 30 small dairy farms. A multi-renewable energy system that uses solar energy and cow dung as energy inputs is proposed, covering the supply of electricity, refrigeration, biogas for cooking, and fertilizers. The results show that the total cost of power generation and heat supply is USD 0.044 and USD 0.070/kW·h, respectively, and the system can reduce CO2 emissions by 127 tons per year.
The above research demonstrates the application of various renewable energy supply systems in rural areas, indicating that utilizing abundant renewable resources locally can effectively reduce energy costs for rural users and generate environmental benefits.
This study aims to address the problem of rural residents living in buildings where traditional energy supply methods are not applicable and where urban energy supply networks cannot cover remote rural areas. A combined heat, electricity, and biogas supply system has been built to meet the multi-level energy needs of rural communities for heat, electricity, and biogas.

2. Materials and Methods

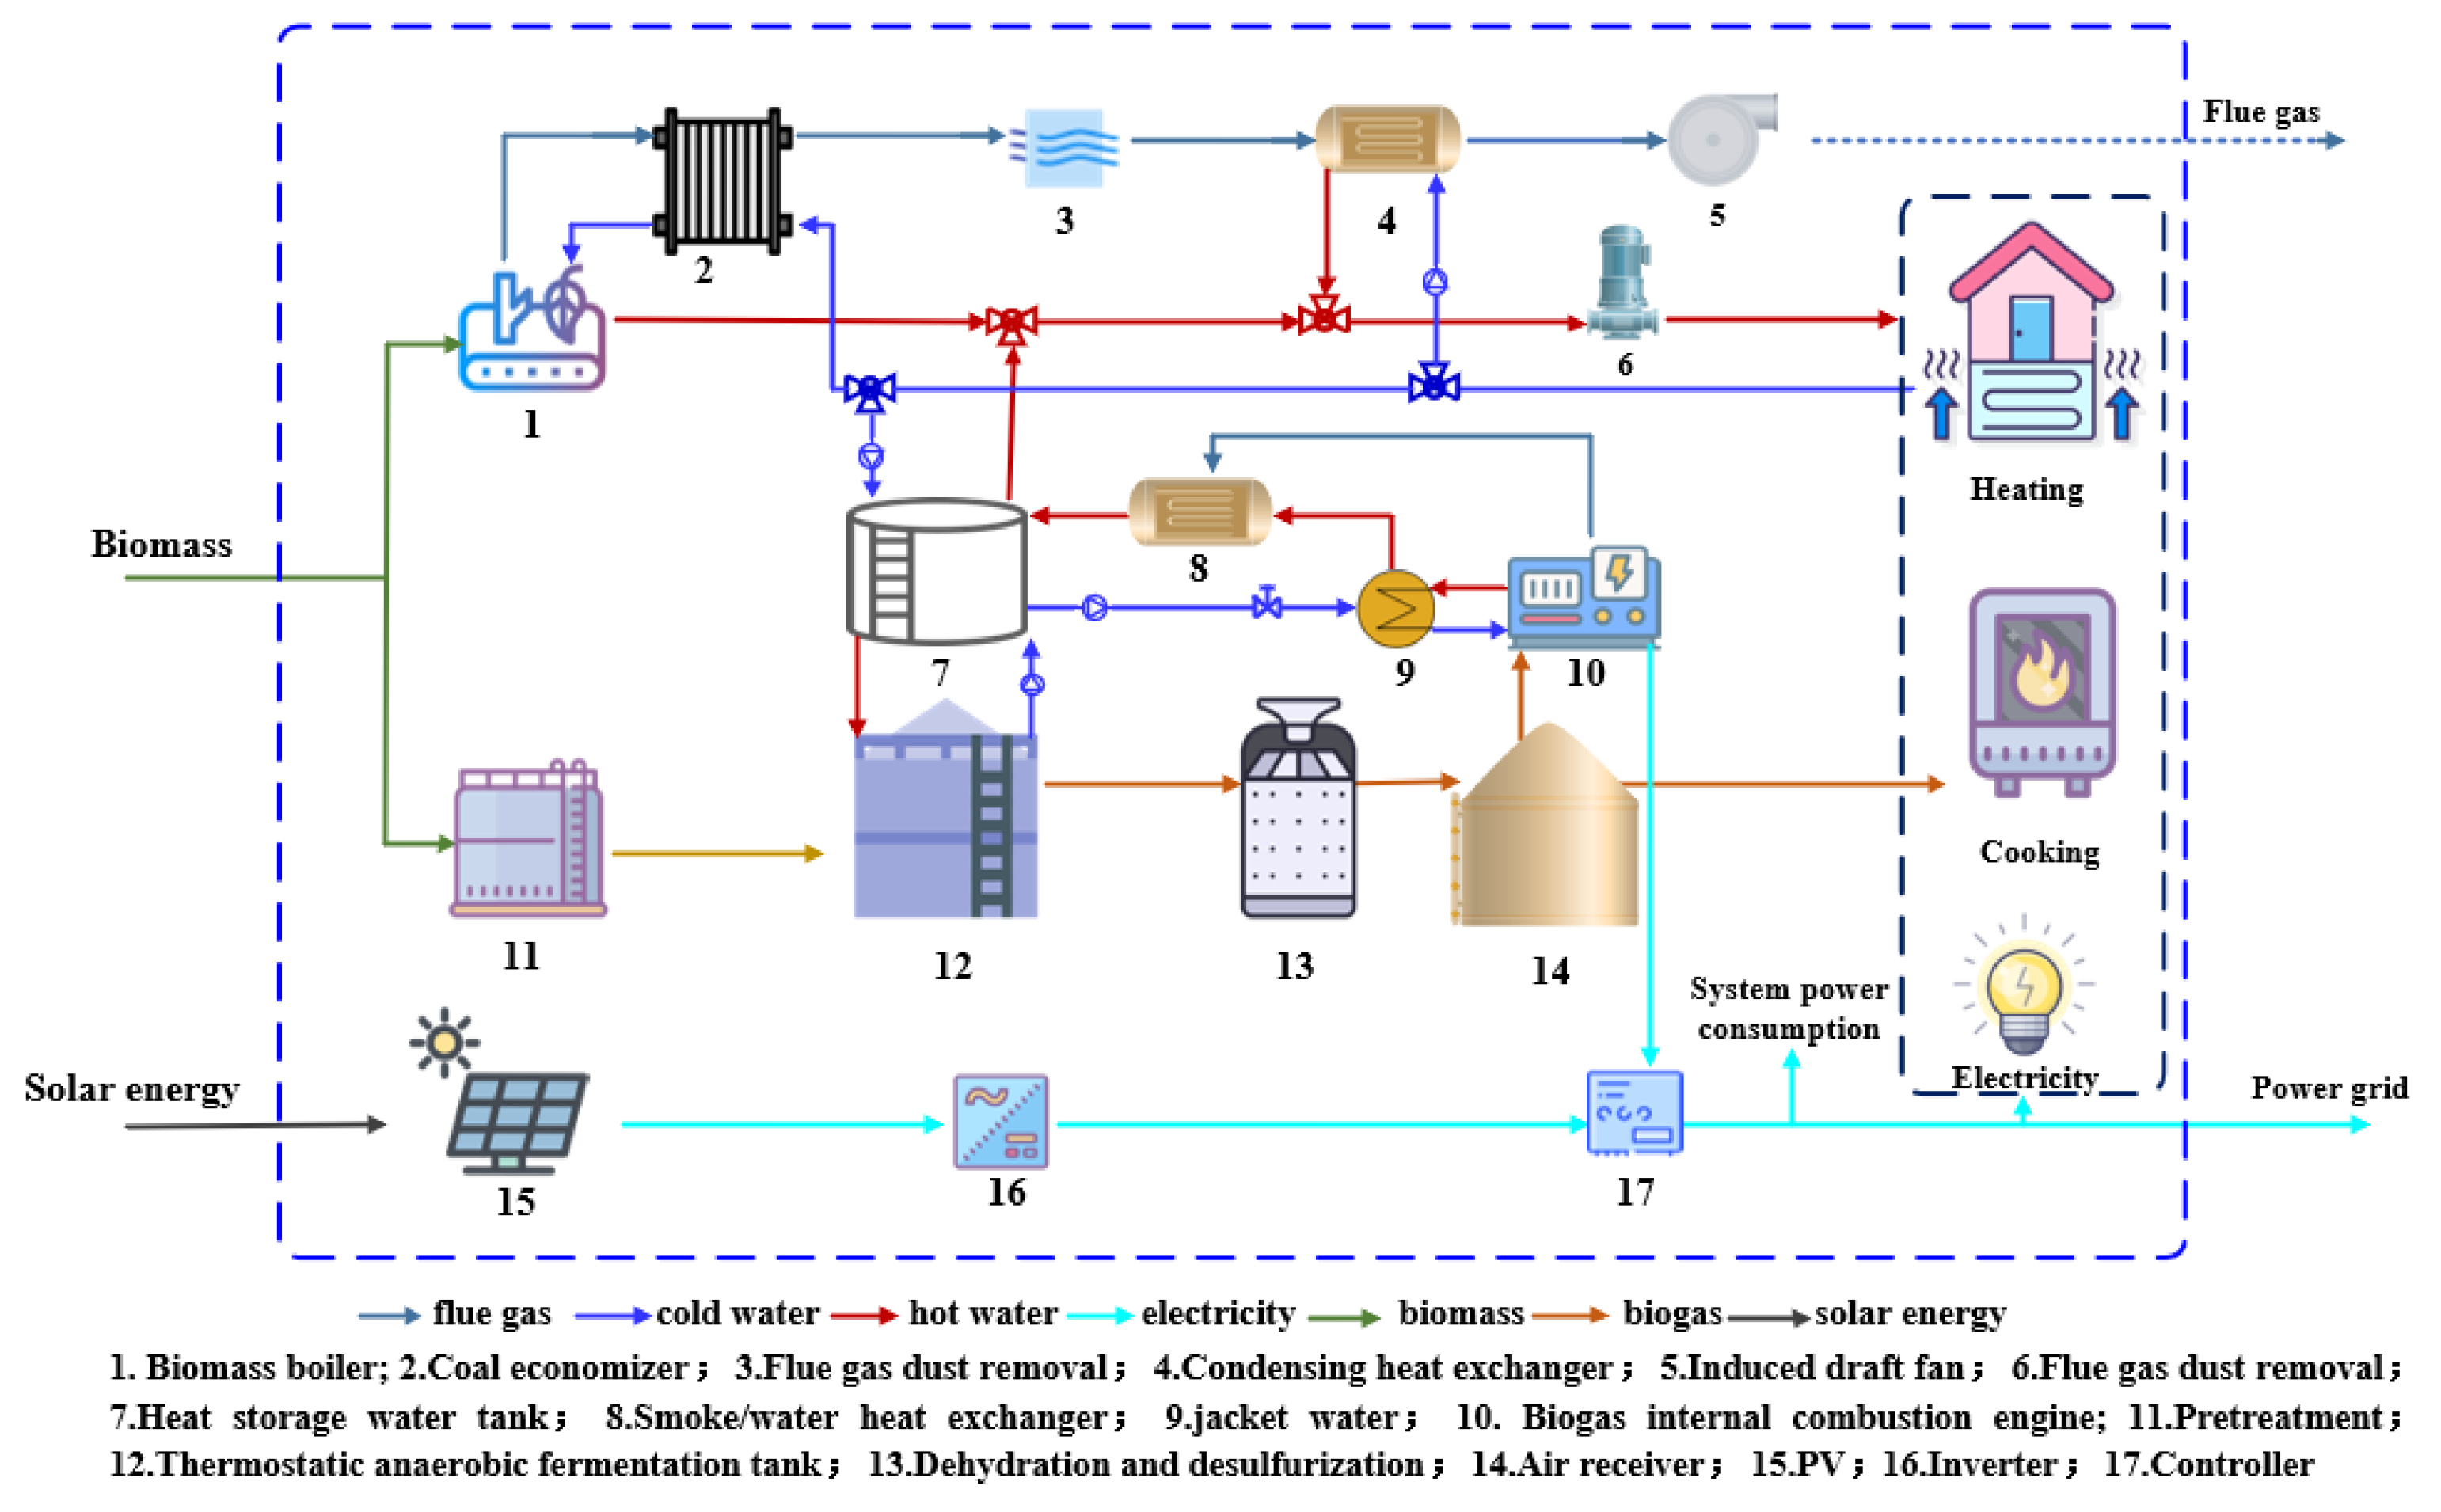
2.1. System Description

Figure 1 shows a diagram of the northwest rural community cogeneration biogas multi-generation system. It includes a PV power generation subsystem, an anaerobic fermentation subsystem, a biogas internal combustion power generation and waste heat utilization subsystem, a biomass direct-fired boiler, and a condensing heat exchanger subsystem. The system uses biomass and solar energy as energy inputs, and through the energy conversion process carried out by each piece of equipment in the system, the energy demand of users for thermoelectric biogas is met throughout the year. A portion of the biogas produced by the anaerobic fermentation subsystem throughout the year is supplied to the customer, while the rest is used by the biogas generator for cogeneration. The system has two modes of operation: During the heating season, the heating system’s return water at the customer’s end is divided into three streams, one of which enters the condensing heat exchanger and exchanges heat with the flue gas, after two stages of de-dusting to recover sensible and latent heat released by the flue gas and, while the biogas generator generates electricity, the recovered waste heat from the cylinder sleeve water and the flue gas is transferred to the heat storage tank, which in addition to meeting the heat load of the fermenter, stores the excess heat. The last return water enters the biomass boiler, after preheating through the coal saver, and the three return water streams converge after full heat exchange, and are supplied to the users by the circulation pump, thus entering the next cycle. During the non-heating season, only the biogas generator set and the PV power generation subsystem are in operation, and the recovered heat from the biogas generator set is supplied to the fermenter only. The electric load of the multi-generation system and the electric load of the users are mainly met by the biogas generator set and the PV power generation subsystem. When the total electric load demand is greater than the total power generation, the shortage is met by the grid at this time; when the total electric load demand is less than the total power generation, the surplus electricity is sold online at this time. The inverter converts the electricity generated by the PV into DC/AC, and the control system determines whether to purchase or sell electricity, according to the relationship between the total electricity generation and the total electricity load.

2.2. Mathematical Model of the Main Equipment in the System

2.2.1. Constant Temperature Anaerobic Reactor

The system has two cylindrical anaerobic fermenters, with a volume of 1000 m3 and a height of 10 m. The effective volume of the tanks is 90%, and the theoretical gas production of the fermenters was calculated, using the methane kinetic model of the manure class proposed by Hashimoto and Chen [40,41].
q bg = q v , bg η v V f
q v , b g = B S 0 H R T φ C H 4
B = B 0 1 K H R T μ m + K 1
K = 0.8 + 0.0016 exp 0.06 S 0
μ m = 0.013 T 0.129
where q bg is the biogas yield, m3/d; q v , b g is the pool volume biogas yield, m3/(m3·d); η v is the volume rate of the fermenter; B is the methane yield of the organic waste material, m3·CH4/(kg·VS); S 0 is the volatile solids concentration, taken as 60 kg·VS/m3; HRT is the hydraulic residence time, taken as 20 days; φ C H 4 is the volume fraction of methane in the biogas, taken as 60%; B 0 is the ultimate methane yield of organic waste, taken as 0.33 m3·CH4/(kg·VS); K is a dimensionless parameter; μ m is the maximum growth rate of microorganisms, d−1; T is the fermentation temperature, the temperature range is 20~60 °C, and here the value is 35 °C.
In addition, in order to maintain the stability of the fermentation liquid temperature in the fermenter, it is necessary to continuously provide heat to the fermenter, and the heat load of the fermenter is calculated as follows.
Q f = Q m , i n + Q f , l o s s
Q m , i n = q m , i n c p , i n T T w
Q f , l o s s = A t o p K t o p + A e d g e K e d g e + A b o t t o m K b o t t o m T T a
c p , i n = 4.17 × 1 0.00812 T S
T w = 4.717 e 0.041 T a
where Q f is the heat load of the fermenter, kW; Q m , i n is the heat consumption of the feed warming, kW; Q f , l o s s is the heat consumption of the fermenter insulation, kW; q m , i n is the feed volume of the fermenter, kg/s; c p , i n is the specific heat capacity of the raw material entering the fermenter, kJ/(kg·°C); T w is the initial temperature of the feed liquid, approximately equal to the tap water temperature, °C; T S is the solid content of the feed liquid, taken as 10%; T a is the ambient temperature, °C; A t o p is the area of the top of the fermenter, m2; K t o p is the average heat transfer coefficient of the top of the fermenter, W/(m2·K); A e d g e is the area of the edge of the fermenter, m2; K e d g e is the average heat transfer coefficient of the edge of the fermenter, W/(m2·K); A b o t t o m is the area of the bottom of the fermenter, m2; and K b o t t o m is the average heat transfer coefficient of the bottom of the fermenter, W/(m2·K).

2.2.2. Biomass Direct-Fired Boilers

The model enables the total efficiency and combustion efficiency of the biomass boiler to be defined, as well as setting the boiler discharge temperature [36].
Q f l u i d = m f l u i d C p f l u i d T o u t T i n
P L R = Q f l u i d Q max
Q f u e l = Q f l u i d η b o i l e r
Q e x h a u s t = Q f u e l 1 η c o m b u s t i o n
Q l o s s = Q f u e l Q e x h a u s t Q f l u i d
where Q f l u i d is the heat transferred to the fluid, kJ/h; m f l u i d is the mass flow rate of the fluid entering the boiler, kg/h; C p f l u i d is the specific heat capacity of the fluid, kJ/(kg·k); T o u t is the outlet fluid temperature of the boiler, °C; T i n is the inlet fluid temperature of the boiler, °C; P L R is the partial load rate of the boiler; Q max is the rated heat production of the boiler, kJ/h; η b o i l e r is the total efficiency of the boiler, %; Q f u e l is the heat released by the fuel combustion, kJ/h; η c o m b u s t i o n is the combustion efficiency of the boiler, %; Q e x h a u s t is the amount of heat loss from the boiler exhaust, kJ/h; and Q l o s s is the amount of heat loss, kJ/h.

2.2.3. Biogas Internal Combustion Generator Sets

The model calculates the actual part-load rate, mechanical efficiency, electrical efficiency, the proportion of waste heat attributed to each part of the biogas internal combustion engine, and the exhaust flow fraction, by calculating the part-load rate of the internal combustion engine, based on external documentation, as shown in the following equations.
P L R d e s = P d e s P r t d
f t o t a l = f j a c k e t w a t e r + f o i l c o o l e r + f a f t e r c o o l e r + f e x h a u s t + f e n v
P d e l i v e r = P L R a c t P d e s
P s h a f t = P d e l i v e r η e l e c
q r e q u i r e d = P s h a f t η m e c h
q j a c k e t w a t e r = f j a c k e t w a t e r f t o t a l q r e q u i r e d P s h a f t
T j a c k e t w a t e r , o u t = T j a c k e t w a t e r , i n + q j a c k e t w a t e r m j a c k e t w a t e r C p j a c k e t w a t e r
m e x h a u s t = m e x h , r t d f e x h f l o w
q e n v = f e n v f t o t a l q r e q u i r e d P s h a f t
where P L R d e s is the required partial load rate; P d e s is the customer demand power, kJ/h; P r t d is the rated output power, kJ/h; f t o t a l is the proportion of total waste heat, this value is 1; f j a c k e t w a t e r is the proportion of waste heat going into the water on the cylinder liner, %; f o i l c o o l e r is the proportion of waste heat going into the oil cooler, %; f a f t e r c o o l e r is the proportion of waste heat going into the aftercooler coolant, %; f e x h a u s t is the proportion of waste heat going into the exhaust, %; f e n v is the proportion of waste heat going into the environment, %; P d e l i v e r is the power generation, kJ/h; P L R a c t is the actual partial load rate; P s h a f t is the mechanical shaft power, kJ/h; η e l e c is the generator generation efficiency, %; q r e q u i r e d is the required energy input, kJ/h; η m e c h is the mechanical efficiency of the engine, %; q j a c k e t w a t e r is the energy transferred to the jacket water, kJ/h; T j a c k e t w a t e r , o u t is the jacket water outlet temperature, °C; T j a c k e t w a t e r , i n is the jacket water inlet temperature, °C; m j a c k e t e t w a t e r is the jacket water flow rate, kg/h; C p j a c k e t w a t e r is the jacket water specific heat capacity, kJ/(kg·K); m e x h a u s t is the mass flow rate of the exhaust, kg/h; m e x h , r t d is the mass flow rate of the exhaust at the rated operating conditions, kg/h; and q e n v is the energy loss into the environment, kJ/h.

2.2.4. PV Power Generation Module

The model uses a “four-parameter” equivalent circuit model to predict the current–voltage characteristics of a single module, and extrapolates the results of the single module equivalent circuit to predict the performance of a multi-module array. The model is shown in Figure 2.
The four-parameter model assumes that the slope of the current–voltage characteristic (IV curve) is zero under short-circuit conditions:
d I d V v = o = 0
The relationship between the current and voltage of the circuit is:
I = I L I 0 exp q γ k T c ( V + I R s ) 1
The photocurrent is linearly related to the incident radiation:
I L = I L , r e f G T G T , r e f
The relationship between the diode reverse saturation current and temperature is:
I 0 I 0 , r e f = T c T c , r e f 3
Bringing the current and voltage in the three cases (open circuit, short circuit, and maximum power point) into the equation, three equations can be obtained:
0 = I L , r e f I 0 , r e f exp q γ k T c , r e f V o c , r e f 1 V o c , r e f R s h
I s c , r e f = I L , r e f I 0 , r e f exp q I s c , r e f R s γ k T c , r e f 1 I s c , r e f R s R s h
I m p , r e f = I L , r e f I 0 , r e f exp q γ k T c , r e f V m p , r e f + I m p , r e f R s 1 V m p , r e f + I m p , r e f R s R s h
The three equations above are further simplified and organized as follows:
I L , r e f I s c , r e f
γ = q V m p , r e f V o c , r e f + I m p , r e f R s k T c , r e f ln 1 I m p , r e f I s c , r e f
I 0 , r e f = I s c , r e f exp q V o c , r e f γ k T c , r e f
In addition to the three equations mentioned above, an additional equation is needed to determine the last unknown parameter. The fourth equation is derived from the analytical derivative of the voltage with respect to the temperature under reference open-circuit conditions:
A = r N s V o c T c = μ v o c = γ k q ln I s c , r e f I 0 , r e f + T c μ i s c I s c , r e f 3 + q ε A k T c , r e f
A = r N s
where I L is the photocurrent, A; I 0 is the diode reverse saturation current, A; q is the electronic charge constant; γ is the empirical fitting parameter of the PV curve; k is the Boltzmann constant; T c is the module temperature, K; R s is the module series resistance, Ω; I L , r e f is the module photocurrent under the reference condition, A; G T is the total radiation incident in regard to the PV array; G T , r e f is the incident radiation under the reference condition; I 0 , r e f is the diode reverse saturation current under the reference condition, A; T c , r e f is the NOCT module temperature under the reference condition, K; V o c , r e f is the open-circuit voltage under the reference condition, V; R s h is the module shunt resistance, Ω; I s c , r e f is the short-circuit current under the reference condition, A; I m p , r e f is the current at the maximum power point on the IV curve under the reference condition, A; V m p , r e f is the voltage at the maximum power point on the IV curve under the reference condition, V; V o c is the open-circuit voltage, V; μ i s c is the short-circuit current temperature coefficient, A/K; and N s is the number of cells in each module.

2.2.5. Thermal Storage Tank

The heat transfer at the top, bottom, and sides of the tank for tank node j is as follows:
Q l o s s , t o p , j = A t o p , j U t o p ( T tan k , j T e n v , t o p )
Q l o s s , b o t t o m , j = A b o t t o m , j U b o t t o m ( T tan k , j T e n v , b o t t o m )
Q l o s s , e d g e s , j = A t o p , j U e d g e s ( T tan k , j T e n v , e d g e s )
where Q l o s s , t o p , j , Q l o s s , b o t t o m , j , Q l o s s , e d g e s , j are the top, bottom, and side heat loss of the tank, kJ/h; A t o p , j , A b o t t o m , j , A e d g e s , j are the top, bottom, and side heat loss surface area of the tank, m2; U t o p , U b o t t o m , U e d g e s are the top, bottom, and side heat loss coefficients of the tank, kJ/(h·m2·K); T e n v , t o p , T e n v , b o t t o m , T e n v , e d g e s are the top, bottom, and side ambient temperatures of the tank, °C; and T tan k , j is the node temperature of the tank, °C.
The nodes in the tank can conduct heat to each other, and the heat transfer equation for tank node j is as follows:
Q c o n d , j = k j A j T j T j + 1 L c o n d , j + k j 1 A j 1 T j T j 1 L c o n d , j 1
where the subscripts j , j + 1 , j 1 are the current node, the node directly below the current node, and the node directly above the current node, respectively; T is the node temperature, °C; k is the thermal conductivity of the fluid, kJ/(h·m·K); A is the heat transfer area of the node, m2; and L c o n d is the vertical distance between the current node and the node below or the node above, m.

2.2.6. Condensing Heat Exchanger

C c = m c C p c , C h = m h C p h
C max = max C c , C h , C min = min C c , C h
C min C max 0.01 , ε = 1 exp U A C min
C min C max > 0.01 , ε = 1 exp U A C min 1 C min C max 1 C min C max exp U A C min 1 C min C max
T h , o u t = T h , i n ε C min C h T h , i n T c , i n
Q T = ε C min T h , i n T c , i n
where C c is the cold-side fluid heat capacity, kJ/(h·k); C h is the hot-side fluid heat capacity, kJ/(h·k); C max is the larger heat capacity in both sides of the fluid, kJ/(h·k); C min is the smaller heat capacity in both sides of the fluid, kJ/(h·k); U A is the total heat transfer coefficient of the heat exchanger, kJ/(h·k); ε is the heat exchanger effectiveness; m c is the cold-side fluid mass flow rate, kg/h; m h is the hot-side fluid mass flow rate, kg/h; C p c is the cold-side fluid specific heat capacity, kJ/(kg·K); C p h is the hot-side fluid specific heat capacity, kJ/(kg·K); T h , i n is the inlet temperature of the hot-side fluid, °C; T h , o u t is the outlet temperature of the hot-side fluid, °C; T c , i n is the inlet temperature of the cold-side fluid, °C; and Q T is the total heat transfer of the heat exchanger, kJ/h.
When the outlet flue gas temperature is higher than the dew point temperature, only the sensible heat is recovered at this time, and no correction is made to the outlet water temperature; when the outlet flue gas temperature is lower than the dew point temperature, both the sensible heat and the latent heat of the flue gas are recovered at this time, and a portion of the condensate is generated at the same time, and the fitting equations for the exhaust temperature and latent heat recovery and condensate volume are as follows.
The fitted equation for the latent heat recovery versus the exhaust temperature:
Q q r = 0.763 x 2 + 14.285 x + 1267.51
The fitting equation for the condensate volume and the exhaust temperature:
m ln s = 0.00033 x 2 + 0.00712 x + 0.49747

2.3. System Evaluation

2.3.1. Energy Evaluation

The primary energy utilization rate [42] of the multi-generation system is:
P E R m s = E t + Q h + Q b i o m c d L H V c d / 3600 + Q f u e l m s + E g i r d / η g i r d η e
Q b i o = V b i o L H V b i o η s l / 3600
where E t is the electrical energy output of the system, kW·h; Q h is the thermal energy output of the system, kW·h; Q b i o is the heat output of the biogas for cooking, kW·h; m c d is the mass of dry cow dung input into the multi-generation system, kg; L H V c d is the low level calorific value of cow dung, kJ/kg; Q f u e l m s is the thermal energy input of biomass fuel, kW·h; E g i r d is the electrical energy purchased from the grid, kW·h; η g i r d is the power plant generation efficiency, %; η e is the grid transmission and distribution efficiency, %; V b i o is the volume of biogas used for cooking, m3; L H V b i o is the low level calorific value of biogas, kJ/kg; η s l is the thermal efficiency of the biogas stove, %.
The primary energy utilization rates of the conventional supply system and the original energy supply system are as follows:
P E R t r = E t + Q h + Q b i o Q h / η h t + Q b i o / η s t + E t / η g i r d η e
P E R o r i = E t + Q h + Q b i o m c d L H V c d + Q f u e l o r i + E t / η g i r d η e
where P E R t r is the primary energy utilization rate of the traditional subsupply system, %; P E R o r i is the original energy supply system primary energy utilization rate, %; m c d is the mass of dry cow dung input into the original system, kg; Q f u e l o r i is the thermal energy of biomass fuel input into the original system, kW·h; η h t is the thermal efficiency of the coal stove, %; and η s t is the thermal efficiency of the earthen stove, %.
The primary energy saving rate of the multi-generation system compared with the traditional energy supply system:
P E S R = F t o t a l t r F t o t a l m s F t o t a l t r = 1 Q t o t a l / P E R m s Q t o t a l / P E R t r = 1 P E R t r P E R m s
where F t o t a l t r is the total primary energy consumption of the traditional subsupply system, kW·h; and F t o t a l m s is the total primary energy consumption of multiple supply system, kW·h.

2.3.2. Environmentality Evaluation

The total CO2 emissions of a multi-generation system are the sum of the CO2 emissions from the combustion of fuel in the biomass boiler, the combustion of biogas in the biogas generator, the combustion of biogas by the customer for cooking, and the combustion of coal for power generation corresponding to grid supplementation.
m C O 2 = μ C O 2 , f u e l Q f u e l + μ C O 2 , b i o Q i c e + μ C O 2 , b i o Q b i o + μ C O 2 , g i r d E g i r d
where μ C O 2 , f u e l is the CO2 emission factor of the biomass boiler, g/kW·h; μ C O 2 , b i o is the CO2 emission factor of biogas combustion, g/kW·h; μ C O 2 , g i r d is the CO2 emission factor of the grid supplement, g/kW·h; Q fuel m s is the thermal energy output of the biomass boiler in the multi-generation system, Q i c e m s is the thermal energy of biogas combustion in the biogas generator set, kW·h; and Q b i o is the heat generated by biogas combustion for cooking, kW·h.
Compared to the original system, the CO2 emission reduction rate of the multi-supply system is [43]:
C D E R R = m C O 2 o r i m C O 2 m s m C O 2 o r i
The CO2 reduction rate of the multi-generation system compared to the traditional subsupply system is:
C D E R R = m C O 2 t r m C O 2 m s m C O 2 t r

2.3.3. Economic Evaluation

The annual value of the cost of a multi-generation system is [44]:
A C m s = I C m s i 0 1 + i 0 n 1 + i 0 n 1 + O C m s
O C m s = O O C m s + O M C m s
O M C m s = κ I C m s
where A C m s is the annual value of the cost of the multi-generation system, USD; I C m s is the initial investment cost of the system, USD; O C m s is the annual operation and maintenance cost of the multi-generation system, USD; O O C m s is the annual operating cost of the system, USD; O M C m s is the annual maintenance cost of the system, USD; κ is the maintenance cost factor, %; i 0 is the base discount rate, %; and n is the life of the system, years.
The cost of a multiple supply system is based on the original energy supply system cost with the addition of the cost of a condensing heat exchanger, a PV power generation system, a biogas generator set, and heat storage tank equipment. The initial investment in terms of the original energy supply system is the sum of the initial investment for each piece of equipment in the biogas station and the biomass direct-fired boiler heating station, so the initial investment in terms of the original energy supply system and the initial investment of the multi-linked supply system are as follows:
I C o r i = I C b s , t o t a l o r i + I C h s , t o t a l o r i
I C m s = I C o r i + I C e x m s + I C P V m s + I C i c e m s + I C tan k m s
where I C o r i is the total initial investment cost of the original energy supply system, USD; I C b s , t o t a l o r i is the initial investment cost of each piece of equipment in the anaerobic fermentation subsystem as part of the original energy supply system, USD; I C h s , t o t a l o r i is the initial investment cost of each piece of equipment in the biomass boiler heating station in the original energy supply system, USD; I C e x m s is the initial investment cost of the condensing heat exchanger equipment, USD; I C P V m s is the initial investment cost of the equipment in the PV power generation system, USD; I C i c e m s is the initial investment cost of the equipment in the biogas power generation cogeneration unit, USD; and I C tan k m s is the initial investment cost of the thermal storage water tank, USD.
The annual operating cost of a multi-generation system is calculated using the following equation:
O O C m s = P c d m c d + P f u e l 3600 Q f u e l m s L H V f u e l + P w a t e r m w a t e r m s + P e l E g i r d P s l u m s l u m s P r e s m r e s m s
where P c d is the price of dry manure, USD/kg; P f u e l is the price of biomass fuel, USD/kg; P w a t e r is the price of tap water, USD/t; P e l is the price of grid electricity, USD/kW·h; P s l u is the price of slurry, USD/kg; P r e s is the price of the residue, USD/kg; m w a t e r m s is the price of water consumed by the multiple supply system, USD/kg; m s l u m s is the mass of slurry used by the combined supply system, kg; m r e s m s is the mass of residue used by the combined supply system, kg; and L H V f u e l is the low level calorific value of biomass fuel, kJ/kg.
The net benefit of multi-generation systems is:
S m s = P h e a t A h e a t + P b i o V b i o + P e l E t O C m s
where S m s is the net return of the combined supply system, USD; P h e a t is the heating price, USD/(m2·a); P b i o is the gas supply price, USD/m3; and A h e a t is the heating area, m2.
The annual operating cost of the original energy supply system is calculated using the following formula:
O O C o r i = P c d m c d + P f u e l 3600 Q f u e l o r i L H V f u e l + P w a t e r m w a t e r o r i + P e l E t P s l u m s l u o r i P r e s m r e s o r i
where m w a t e r o r i is the water consumed by the original energy supply system, t; m s l u o r i is the mass of slurry used by the original energy supply system, kg; and m r e s o r i is the mass of residue used by the original energy supply system, kg.
The annual value of the cost of the original energy supply system is:
A C o r i = I C o r i κ + i 0 1 + i 0 n 1 + i 0 n 1 + O O C o r i
The annual value of the cost of a conventional supply system is:
A C t r = I C h t + I C s t κ + i 0 1 + i 0 n 1 + i 0 n 1 + P c o a l 3600 Q h η h t L H V c o a l + P s t r a w 3600 Q s t r a w η s t L H V s t r a w + P e l E t
where I C h t is the investment cost of the coal stove, USD; I C s t is the investment cost of the earth stove, USD; P c o a l is the price of coal, USD/kg; P s t r a w is the price of straw, USD/kg; L H V c o a l is the low calorific value of coal, kJ/kg; and L H V s t r a w is the low calorific value of straw, kJ/kg.
The annual cost savings rate of the multi-supply system compared to the original energy supply system is:
A C S R = A C o r i A C m s A C o r i
The annual cost savings rate of the multi-supply system compared to the original energy supply system is:
A C S R = A C t r A C m s A C t r
The net present value refers to the sum of the net cash flows for each year within the design life of the system, discounted at a certain discount rate, in regard to the total net cash flows of the investment, during the operation of the system. If the NPV > 0, it proves that the system is economically feasible, and the greater the net present value, the better the economic benefits of the system.
N P V = i = 0 n C i C o i / 1 + i 0 i
where Ci is the cash inflow in year i, USD; and Co is the cash outflow in year i, USD.

3. System Model Establishment

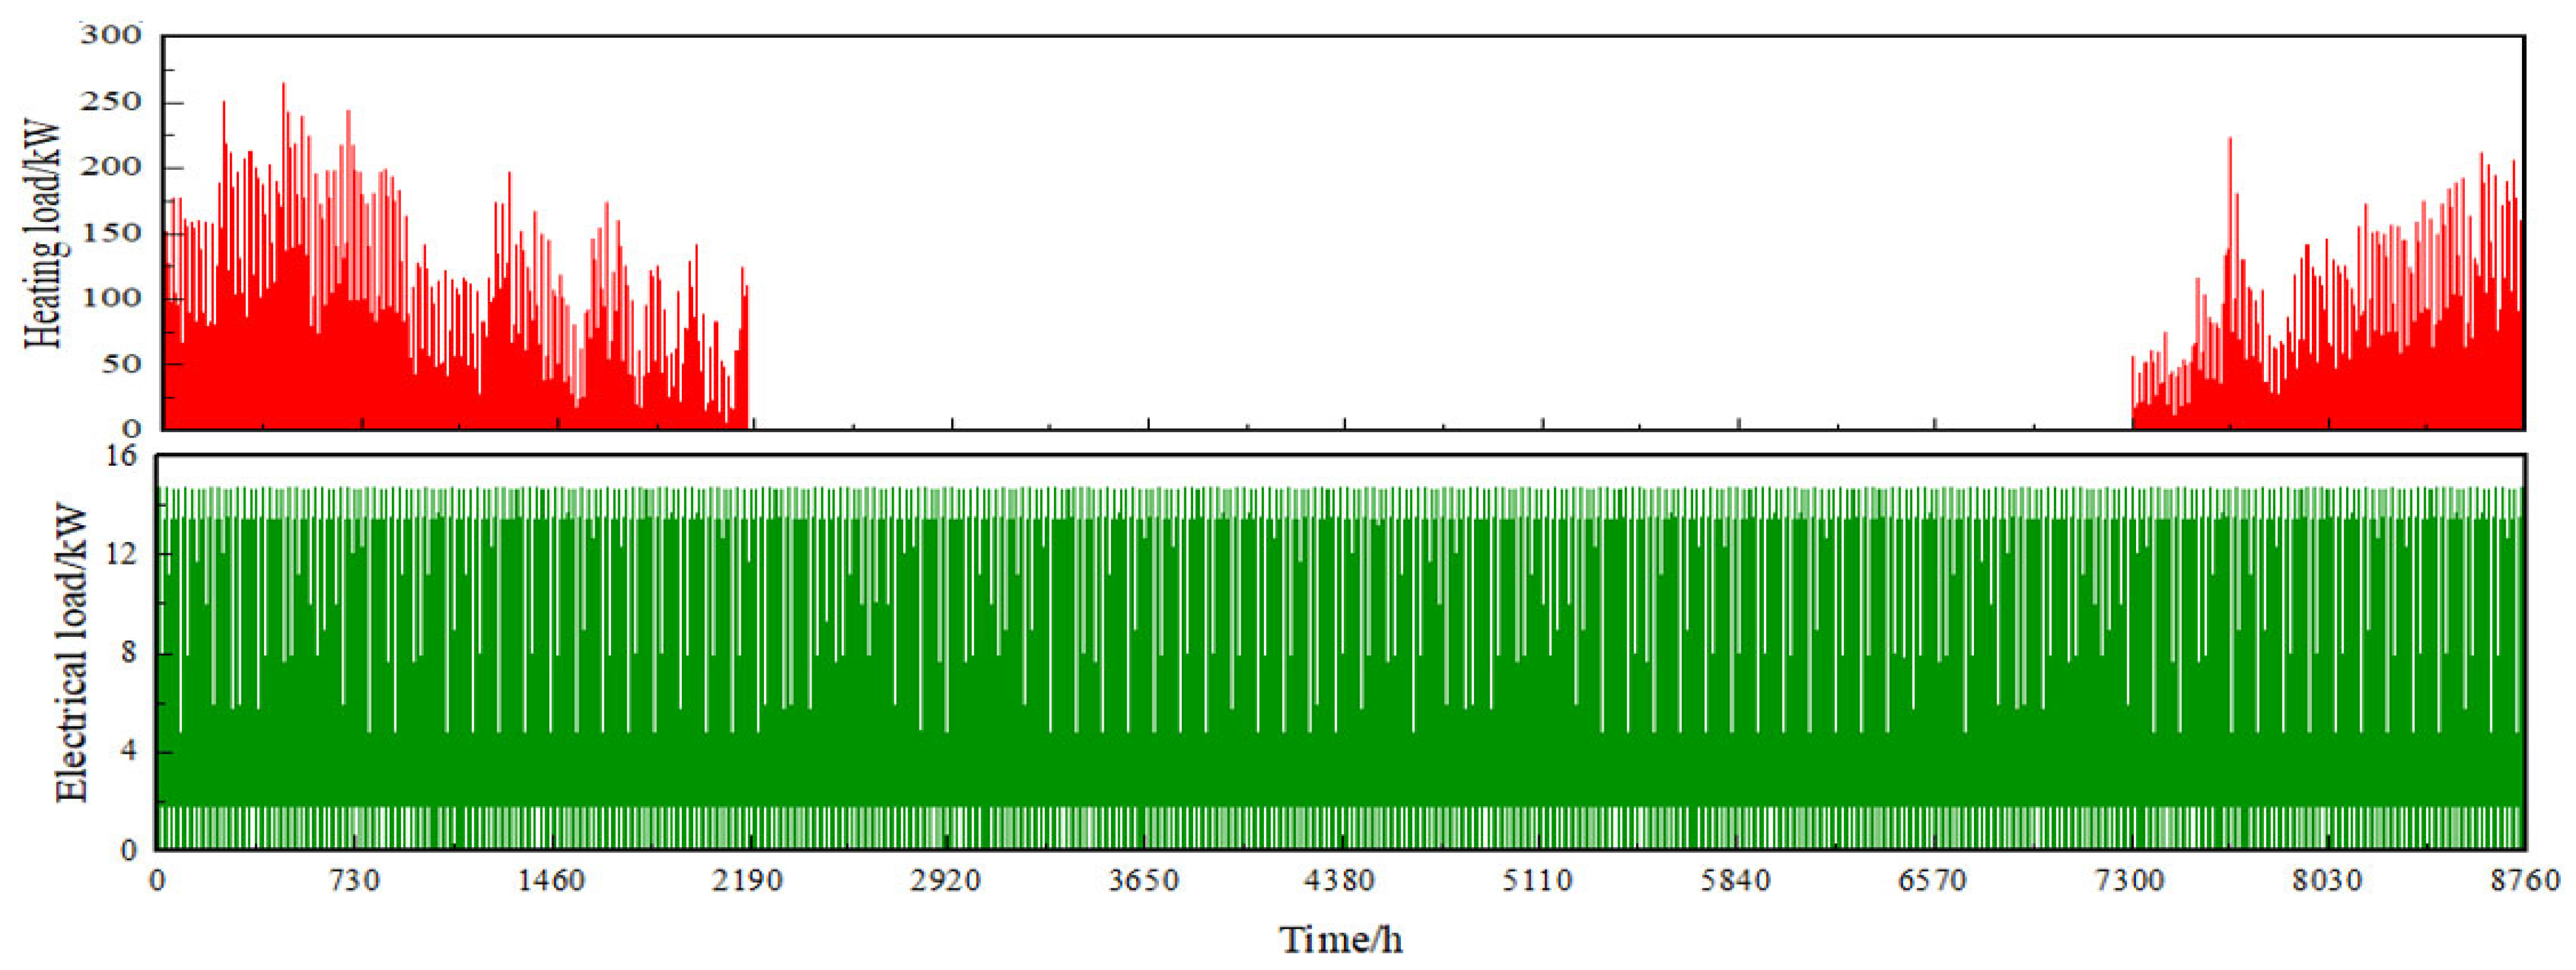
3.1. Thermoelectric Load Calculation

The community has 26 residential buildings, with a total heating area of 52,380 m2; the building that was selected is a six-story standard building in the community, a building with four units, a building heating area of 98 m2 per household, a household of four people, and a user biogas load calculated as 1 m3/(d·household). In this paper, the building model is simplified, and each floor is defined as a thermal zone in the TRNBuild; the window–wall ratio is 0.35 for northwest facing, and 0.3 and 0.5 for southeast facing, respectively, and the heating period is set from November 1 to March 31 of the following year, with daily heating hours of 5:00–11:00 and 17:00–23:00. In the TRNBuild, the heat load of the wall envelope, cold air infiltration, winter interior design temperature, lighting, and equipment and personnel heat disturbance are set for each heat zone to obtain the annual time-by-time heat load and user electric load, as shown in Figure 3. For the whole building (heating area of 2232 m2, 24 residents), the heating season heat load fluctuates greatly according to the ambient temperature change; the maximum heat load is 325.49 kW, the average heat load is 47.5 W/m2, the accumulated heat load of the whole building in the heating season is 201763.31 kW·h, the users’ daily electric load remains the same, but the electric load fluctuates greatly in a day depending on the usage habits, with a maximum electric load of 23.61 kW. The accumulated electric load for the whole year is 599,544.17 kW·h, and the average daily electricity consumption by each household is 6.80 kW·h.

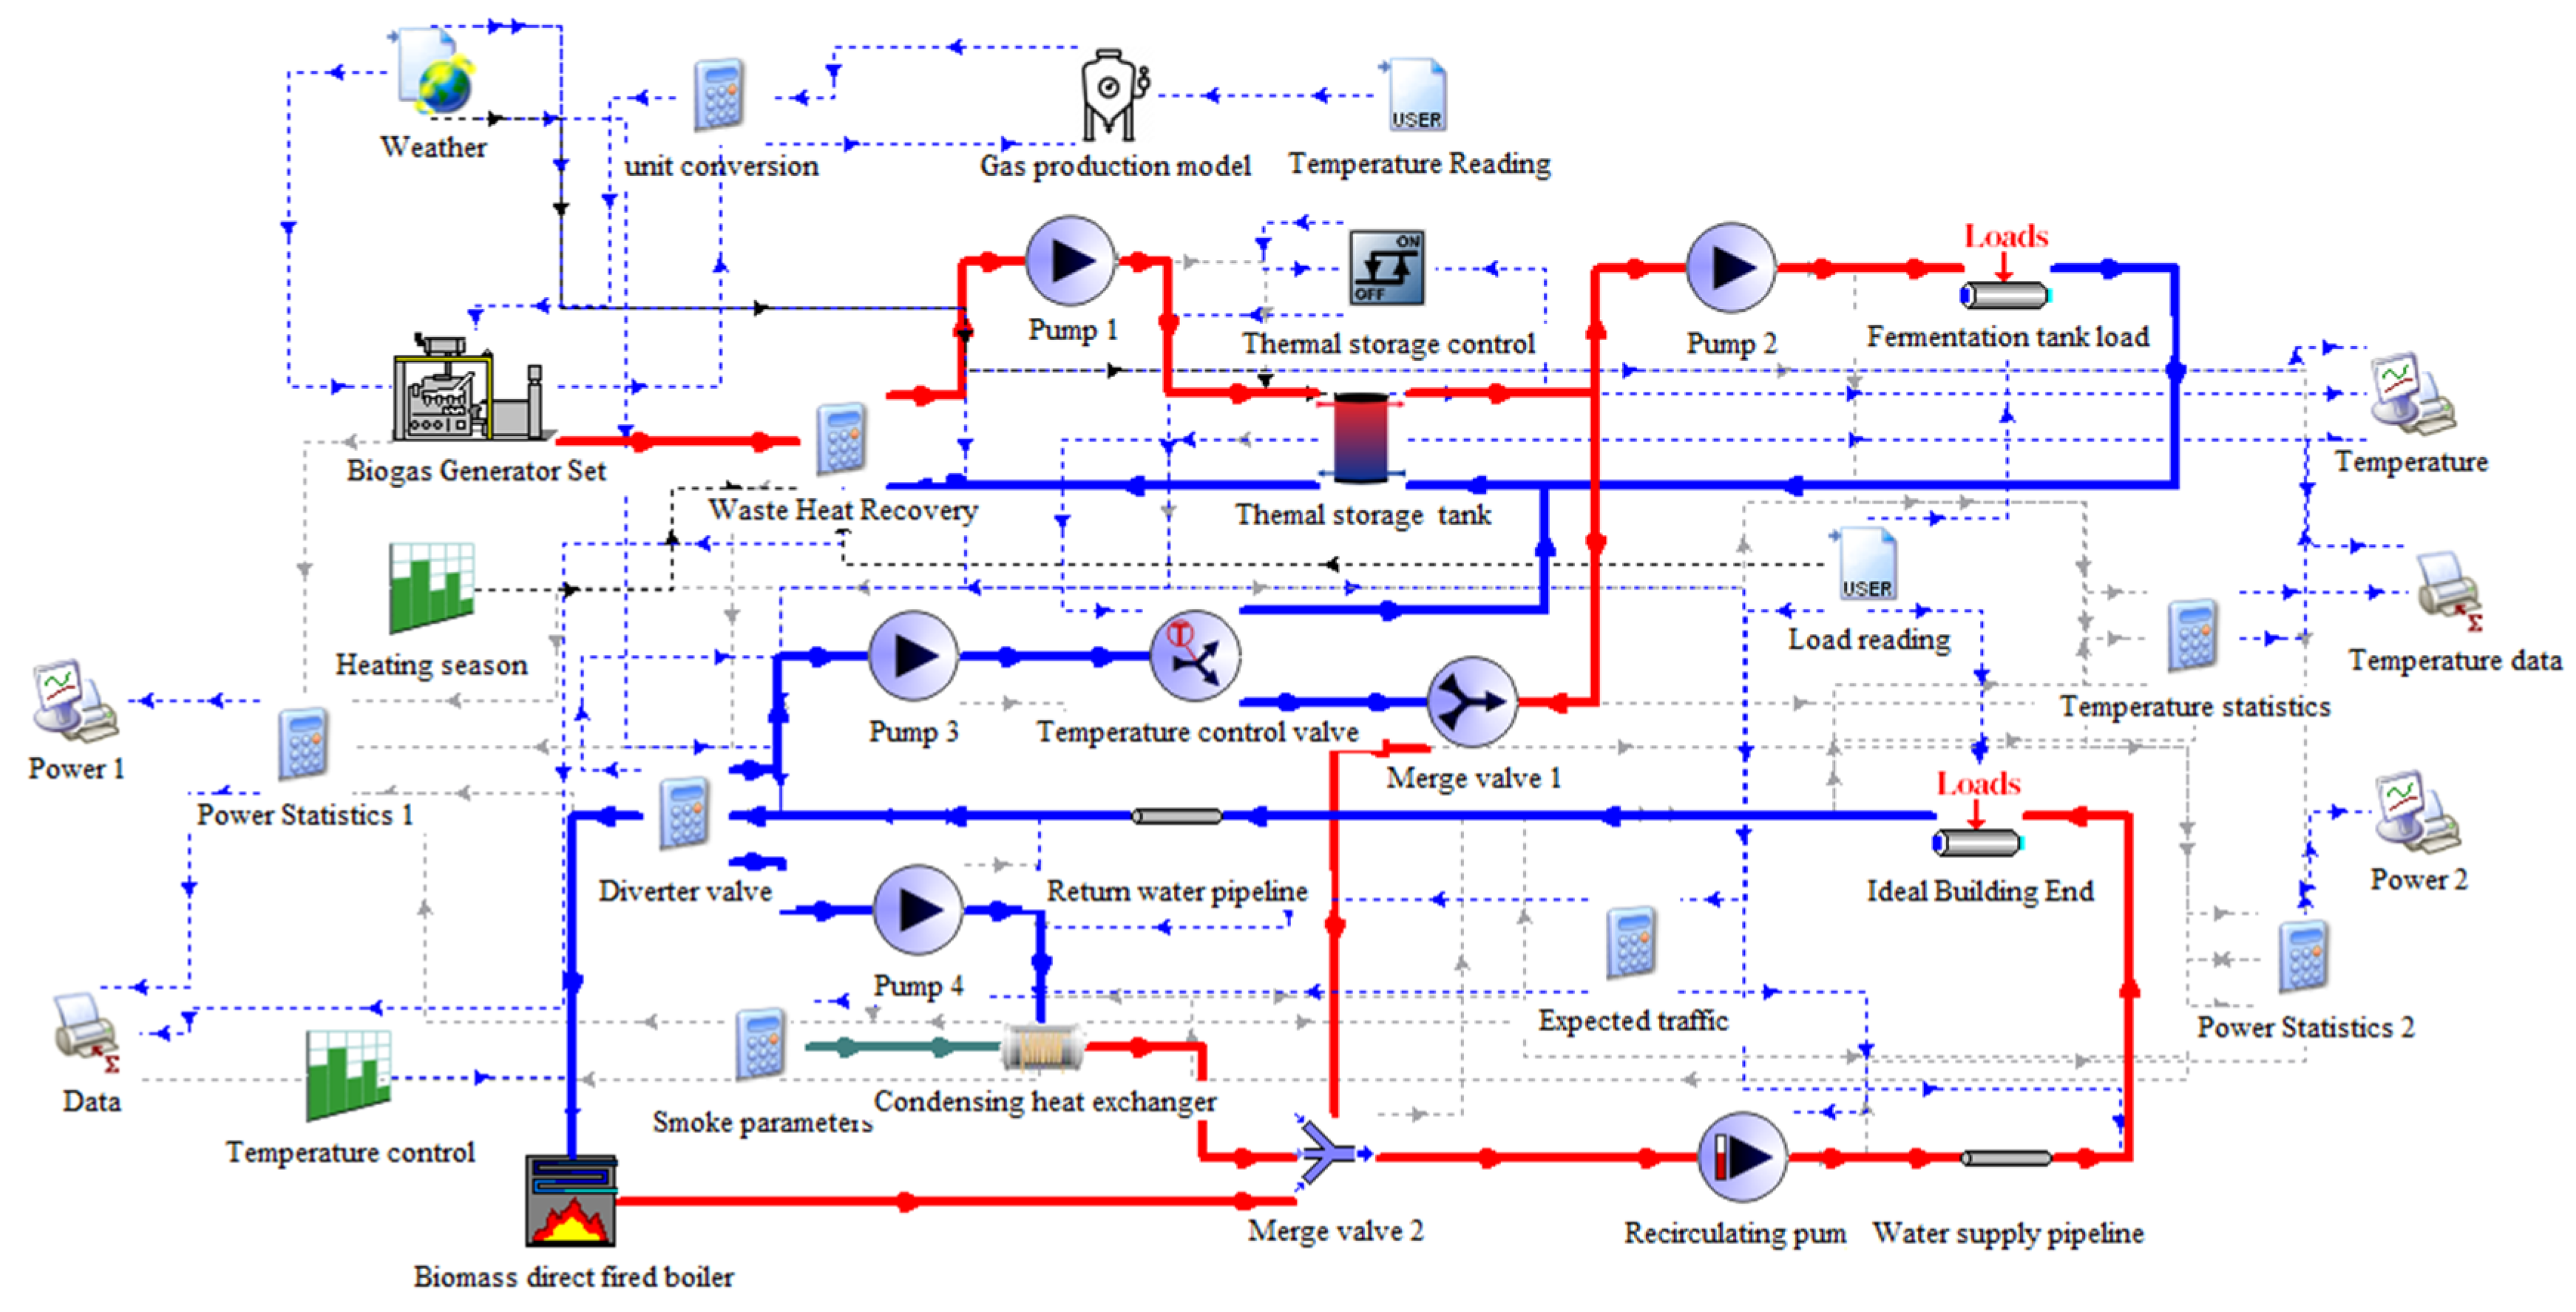
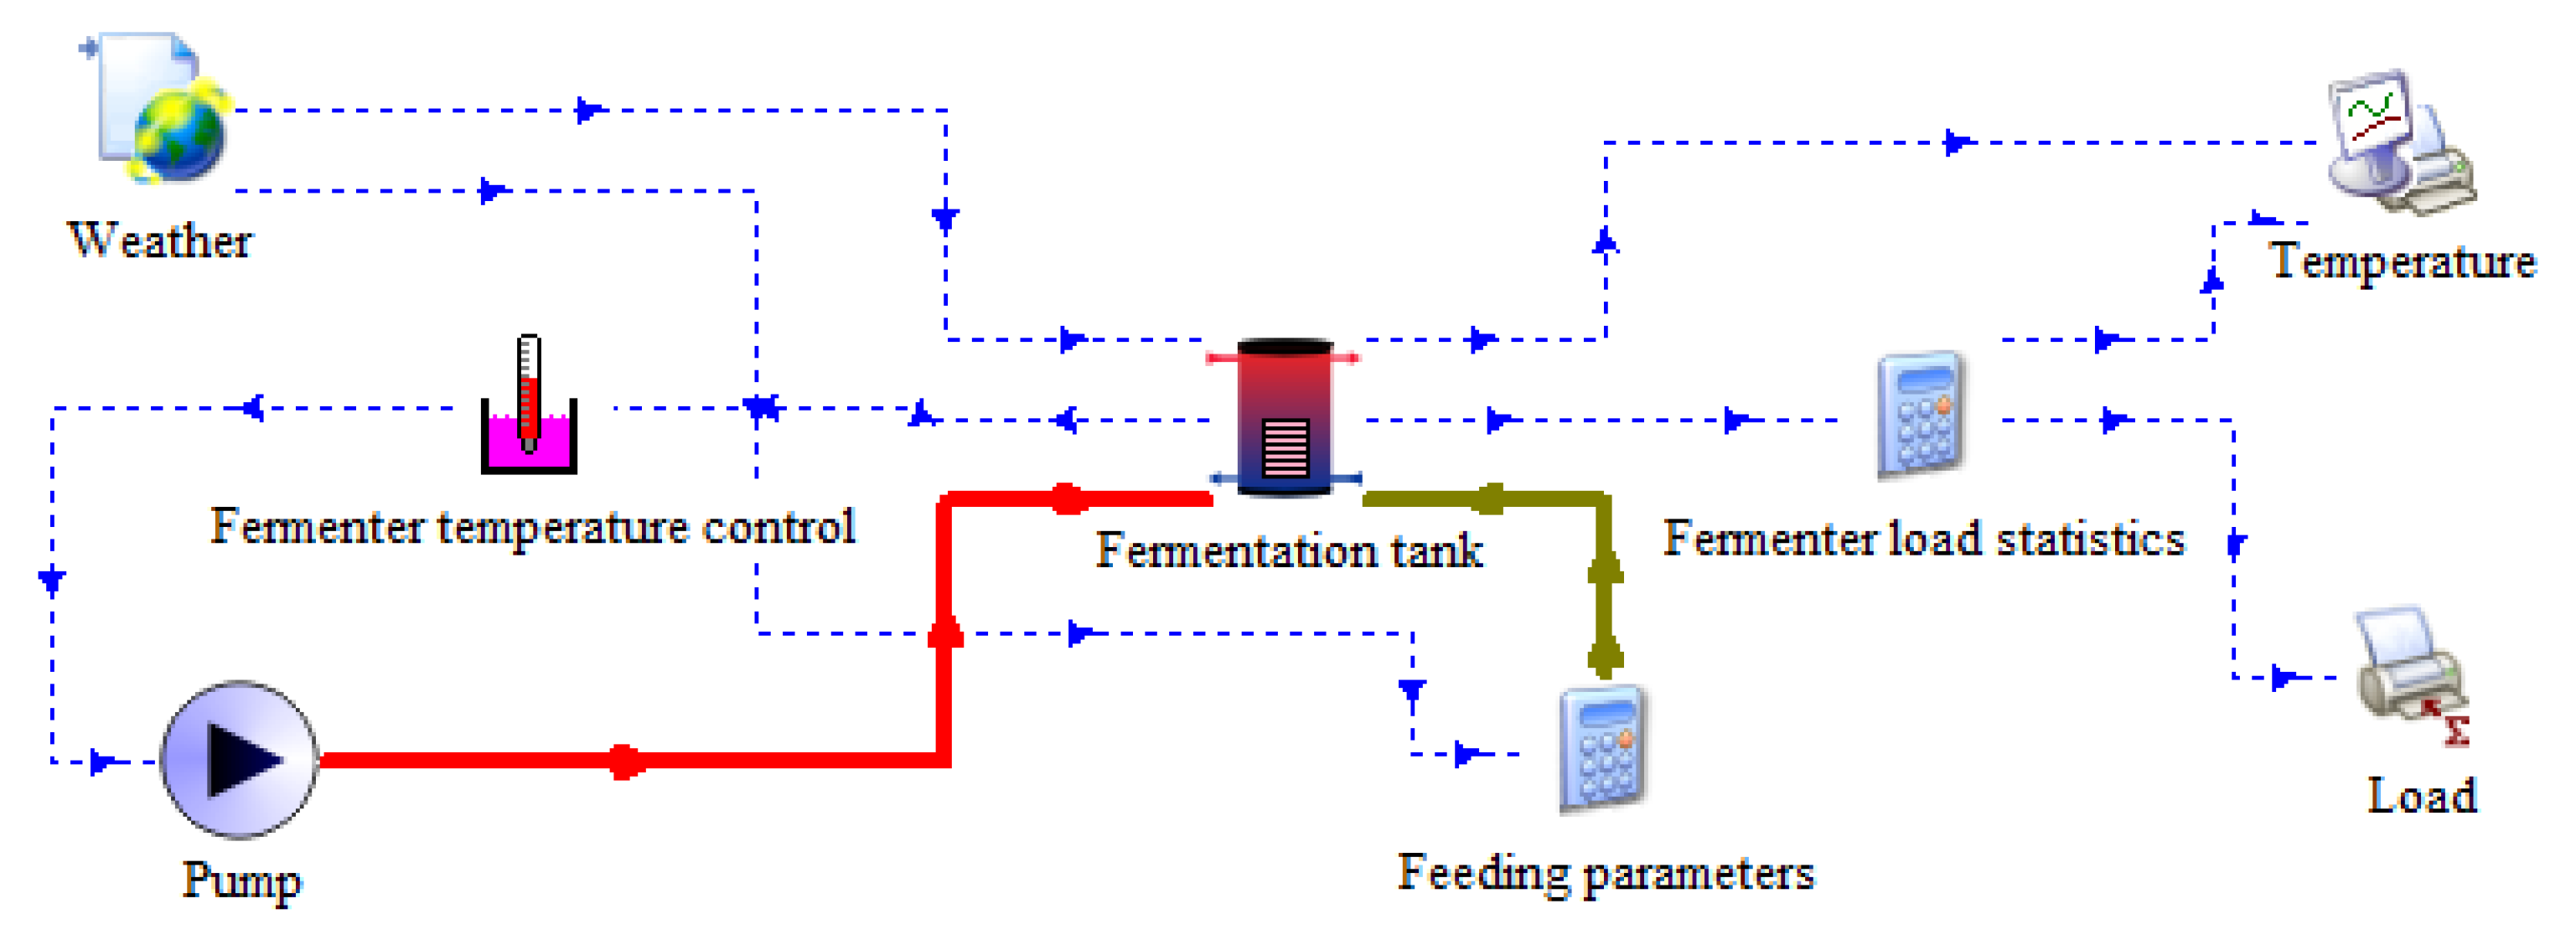
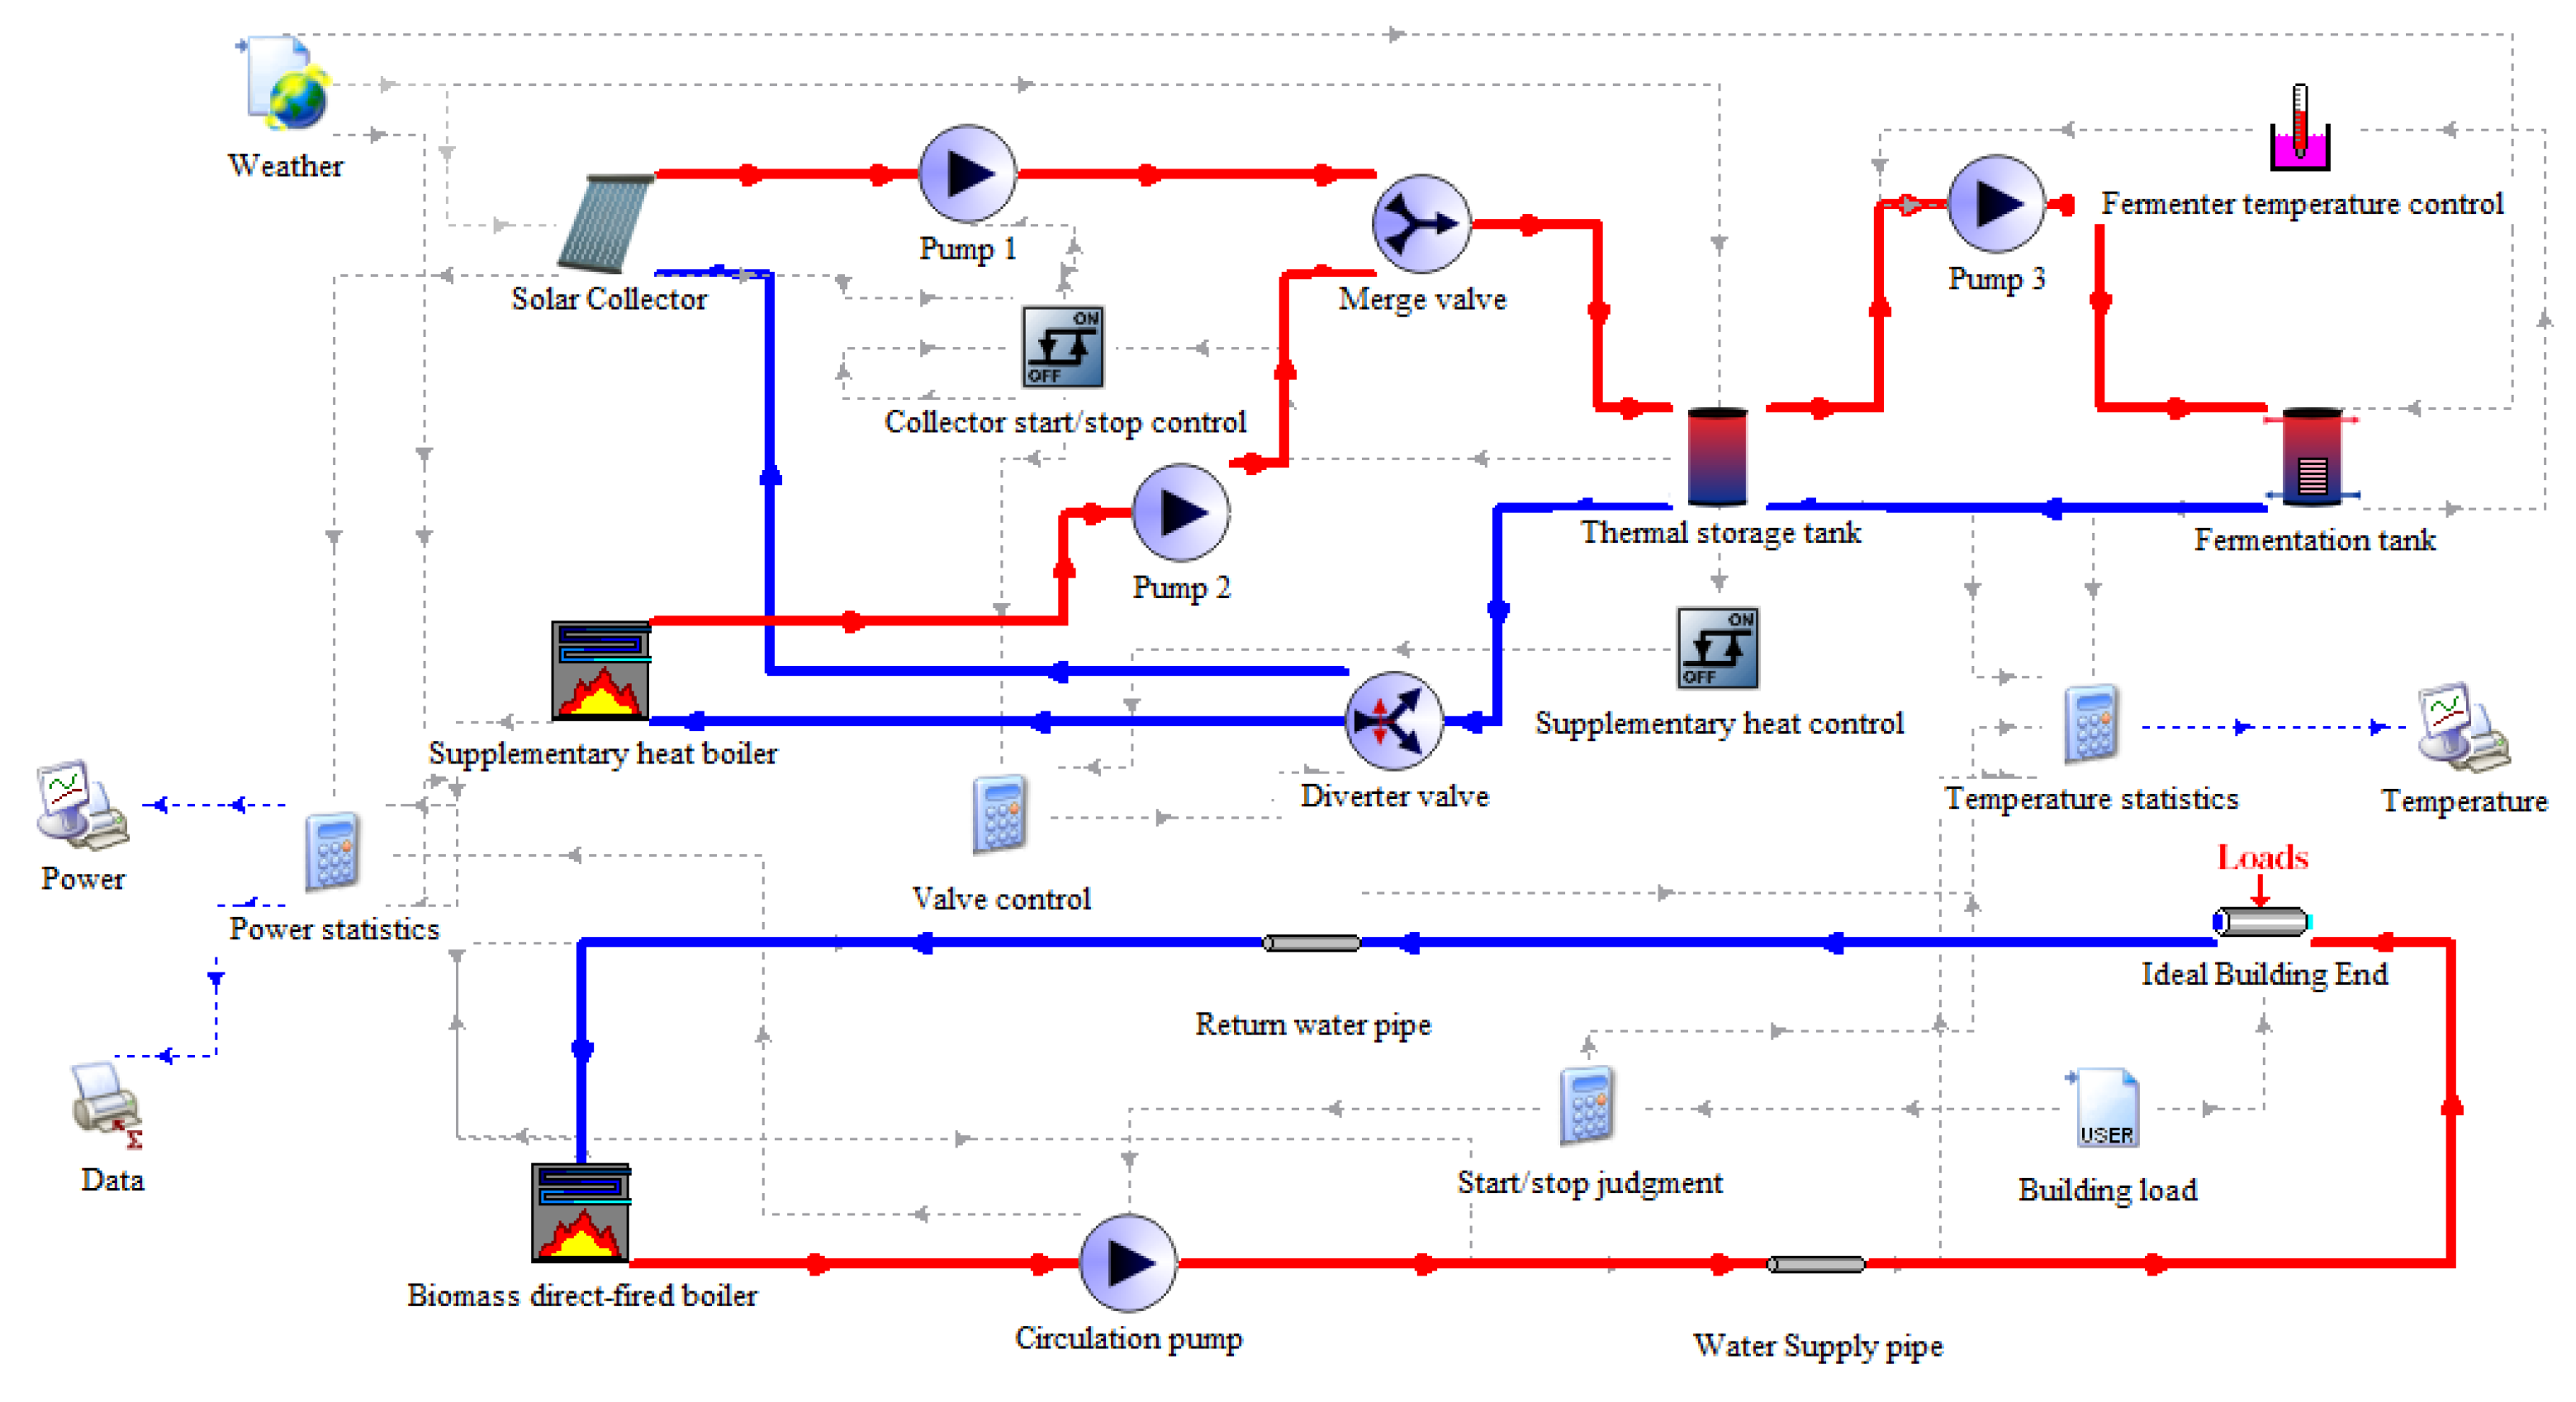
3.2. TRNSYS Simulation Modeling

The software version used in this article is TRNSYS 18. This article adopts the method of first modeling the local situation and then modeling the global situation, which has the advantages of simple data processing and easy convergence, while improving the calculation speed of the model. The heating model of the fermentation tank, the heat load calculation system model, and the power model of the thermoelectric multi power system are shown in Figure 4, Figure 5 and Figure 6.
The main equipment capacity for building the TRNSYS model in this research is shown in Table 1, and the main parameters are shown in Table 2 [45].

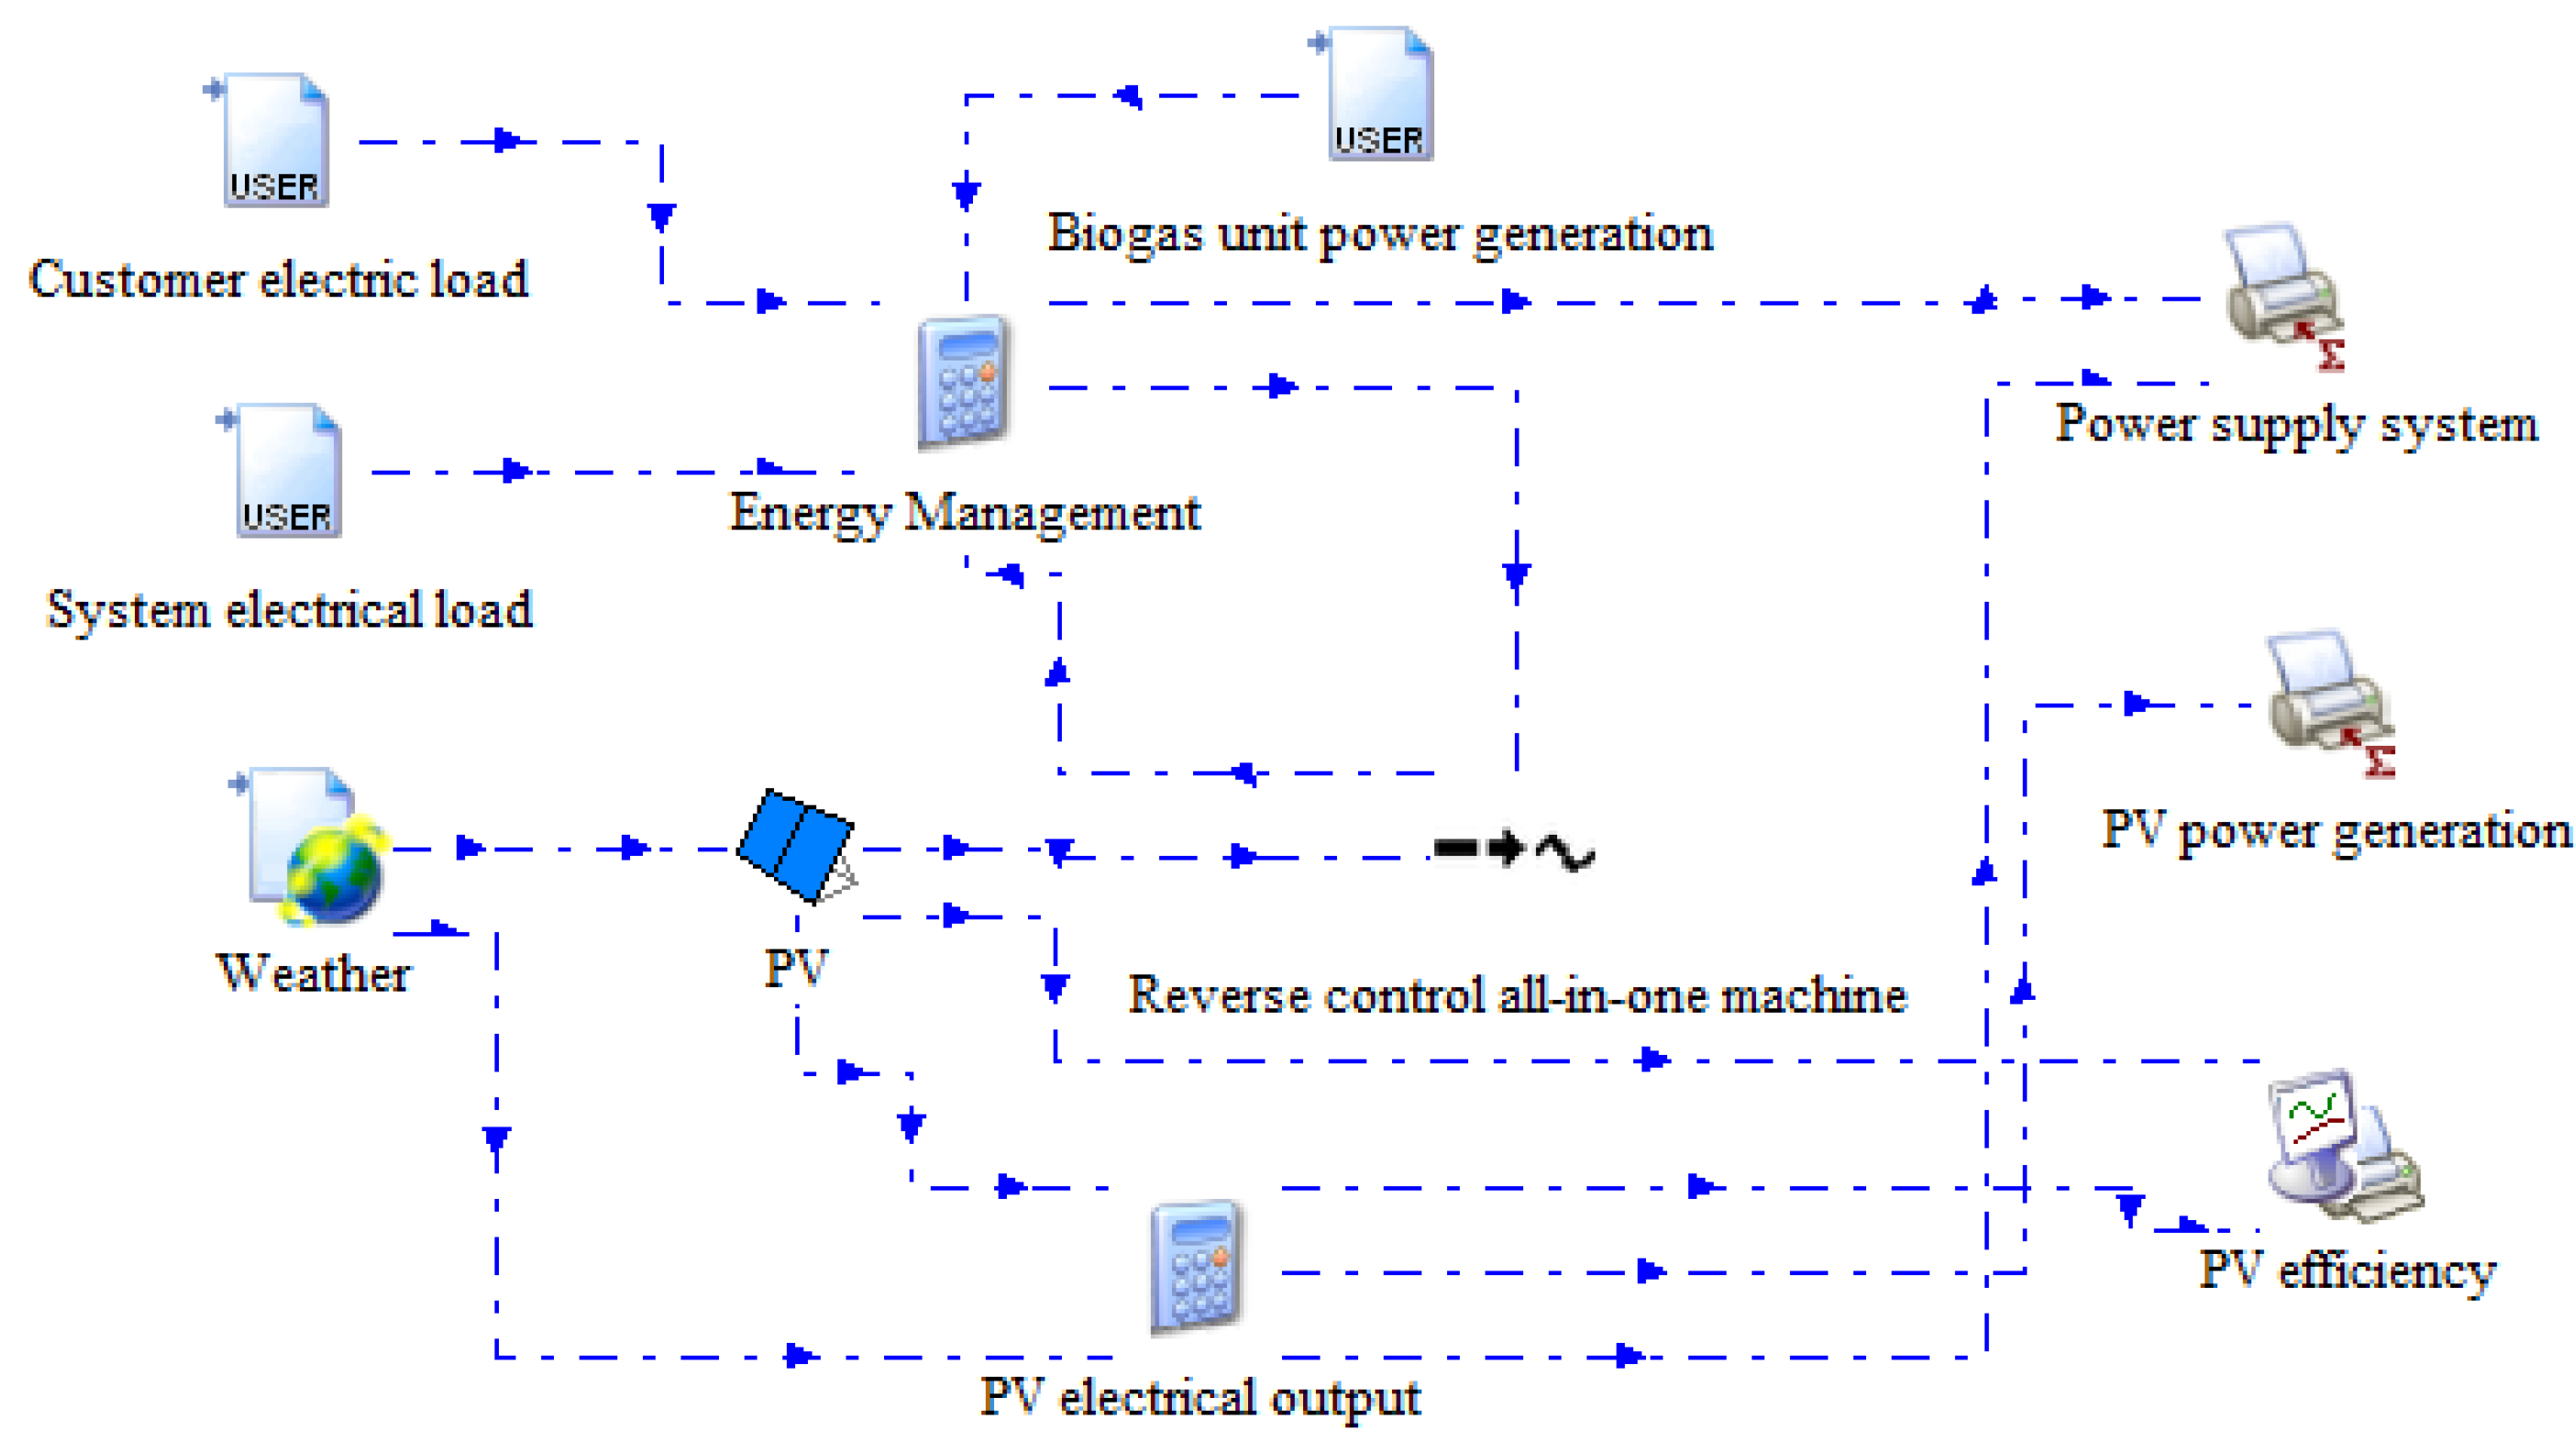
3.3. System Control Method

According to the settings of the parameters in each module in the system, the heat load of the fermenter and the average daily temperature of the fermenter are calculated first, and the temperature of the fermenter is controlled in such a way that when the temperature in the fermenter is lower than 34.75 °C, the circulating water pump is turned on to heat the fermenter, and when the temperature in the fermenter is higher than 35.25 °C, the circulating water pump is turned off. After that, the data on the daily average temperature, heat load, and building heat load of the fermenter are imported into the heat supply model of the combined heat and power system, which is divided into two operation modes, namely the heating season and the non-heating season; in the non-heating season mode, the biomass boiler and boiler-related pumps are turned off at this time, the heat generated by the biogas generator set in the model is only supplied to the fermenter, while generating electricity; in the heating season mode, the biomass boiler and boiler-related pumps are turned on and off, according to the operation time period. In regard to the heating subsystem, the circulating pump will operate with variable frequency, according to the user’s heat load, and the operating frequency range is 35 Hz~50 Hz. The total flow of the return water from the variable frequency pump will be divided into three streams, and part of the return water will enter the temperature control valve through pump 2, and then one share of the return water will be diverted into the tank for heating, and the other share of the return water will return to the heat storage tank, after converging with the heat exchange. At the same time, in order to ensure the stability of the temperature in the heat storage tank, pump 2 will judge whether to turn on according to the temperature of the heat storage tank, and this judgment means that when the temperature of the heat storage tank is higher than 55 °C, the pump turns on, and when the temperature of the heat storage tank is lower than 50 °C, the pump turns off. One of the return streams of water goes back to the main heating pipe, after the waste heat in terms of the flue gas goes through the condensing heat exchanger; the last stream of fluid goes back to the biomass boiler for heating, and the three streams of fluid will eventually converge and be supplied to the users by the circulation pump. Since the heat load is low at the beginning of the heating season and at the end of the heating season, and the return water temperature is not conducive to the recovery of flue gas waste heat, the boiler water supply temperature is set to 42 °C and 41 °C, respectively, during these two periods of the heating season, which not only ensures that heating occurs, but also facilitates the recovery of flue gas waste heat. In regard to the power supply model, the total power generated by the biogas generating units and PV power generation subsystem will be supplied to the system and priority users throughout the year, and when the total power generation is higher than the total electrical load, the surplus power will be sold online; when the total power generation is lower than the total electrical load, the power grid will be supplemented to meet the total electrical load of the system and the users.

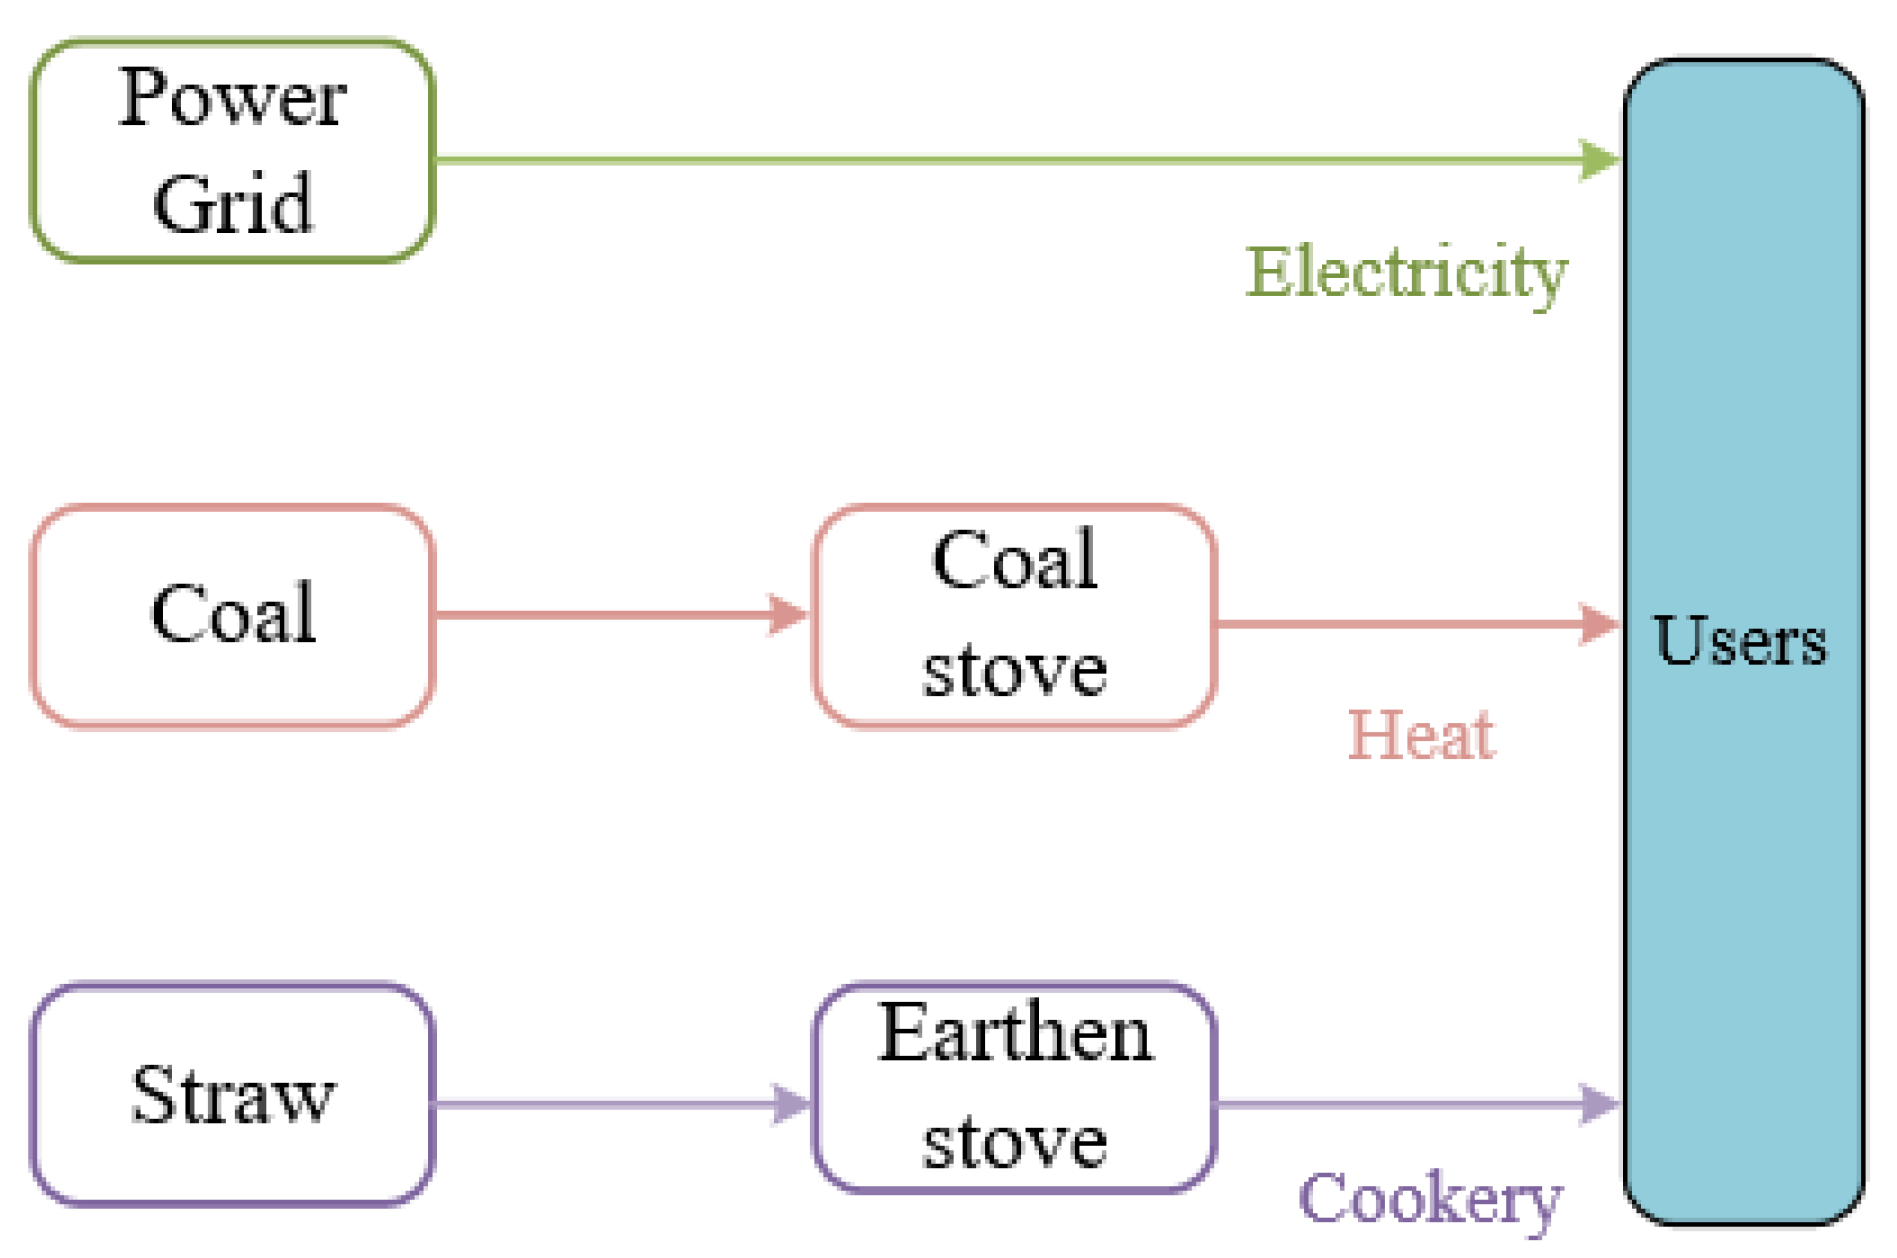
3.4. Original Energy Supply System Model

In this paper, the original energy supply system and the traditional subsupply system are selected as the comparison objects to study the differences in energy efficiency, economy, and environmental protection in regard to the multi-level energy demand of the same target users, under different energy supply modes. As shown in Figure 7 the original energy supply system TRNSYS simulation model has only one fermenter in operation, and the daily gas production is only supplied to the user, the heat load of the fermenter is satisfied by the solar collector and the supplemental heat boiler, the solar collector area is 65 m2 after the field measurement, and the solar collector operation strategy means that when the outlet water temperature of the solar collector is greater than the tank temperature of 8 °C, the collector pump is turned on, and the solar collector starts to heat the water tank, and when the difference between the outlet water temperature of the solar collector and the tank water temperature is less than 2 °C, the collector pump is turned off. The operation strategy of the supplementary heat boiler is that when the water temperature in the water tank is less than 50 °C, the supplementary heat pump turns on to heat the water tank, and when the water temperature in the water tank is higher than 60 °C, the supplementary heat pump turns off. Since the solar collector is affected by solar radiation, there are three modes of operation of the fermenter heating subsystem: the first mode involves the solar collector operating alone; the second mode involves the supplemental heat boiler operating alone; and the third mode involves the solar collector and the supplemental heat boiler operating simultaneously. The temperature of the fermenter is controlled at about 35 °C, and the feed rate is 19,400 kg/d. The biomass boiler heating subsystem is turned on during the heating time in the heating season, and the circulating water pump operates at a fixed frequency. The total annual electrical load of the original energy supply system is met by the grid.
As shown in Figure 8, in regard to the traditional energy supply method, the electric load of the user is met by the grid, the heat load of the heating season is met by burning coal, and the heat needed for daily cooking is met by burning straw.

4. Results and Discussion

4.1. Typical Day System Performance

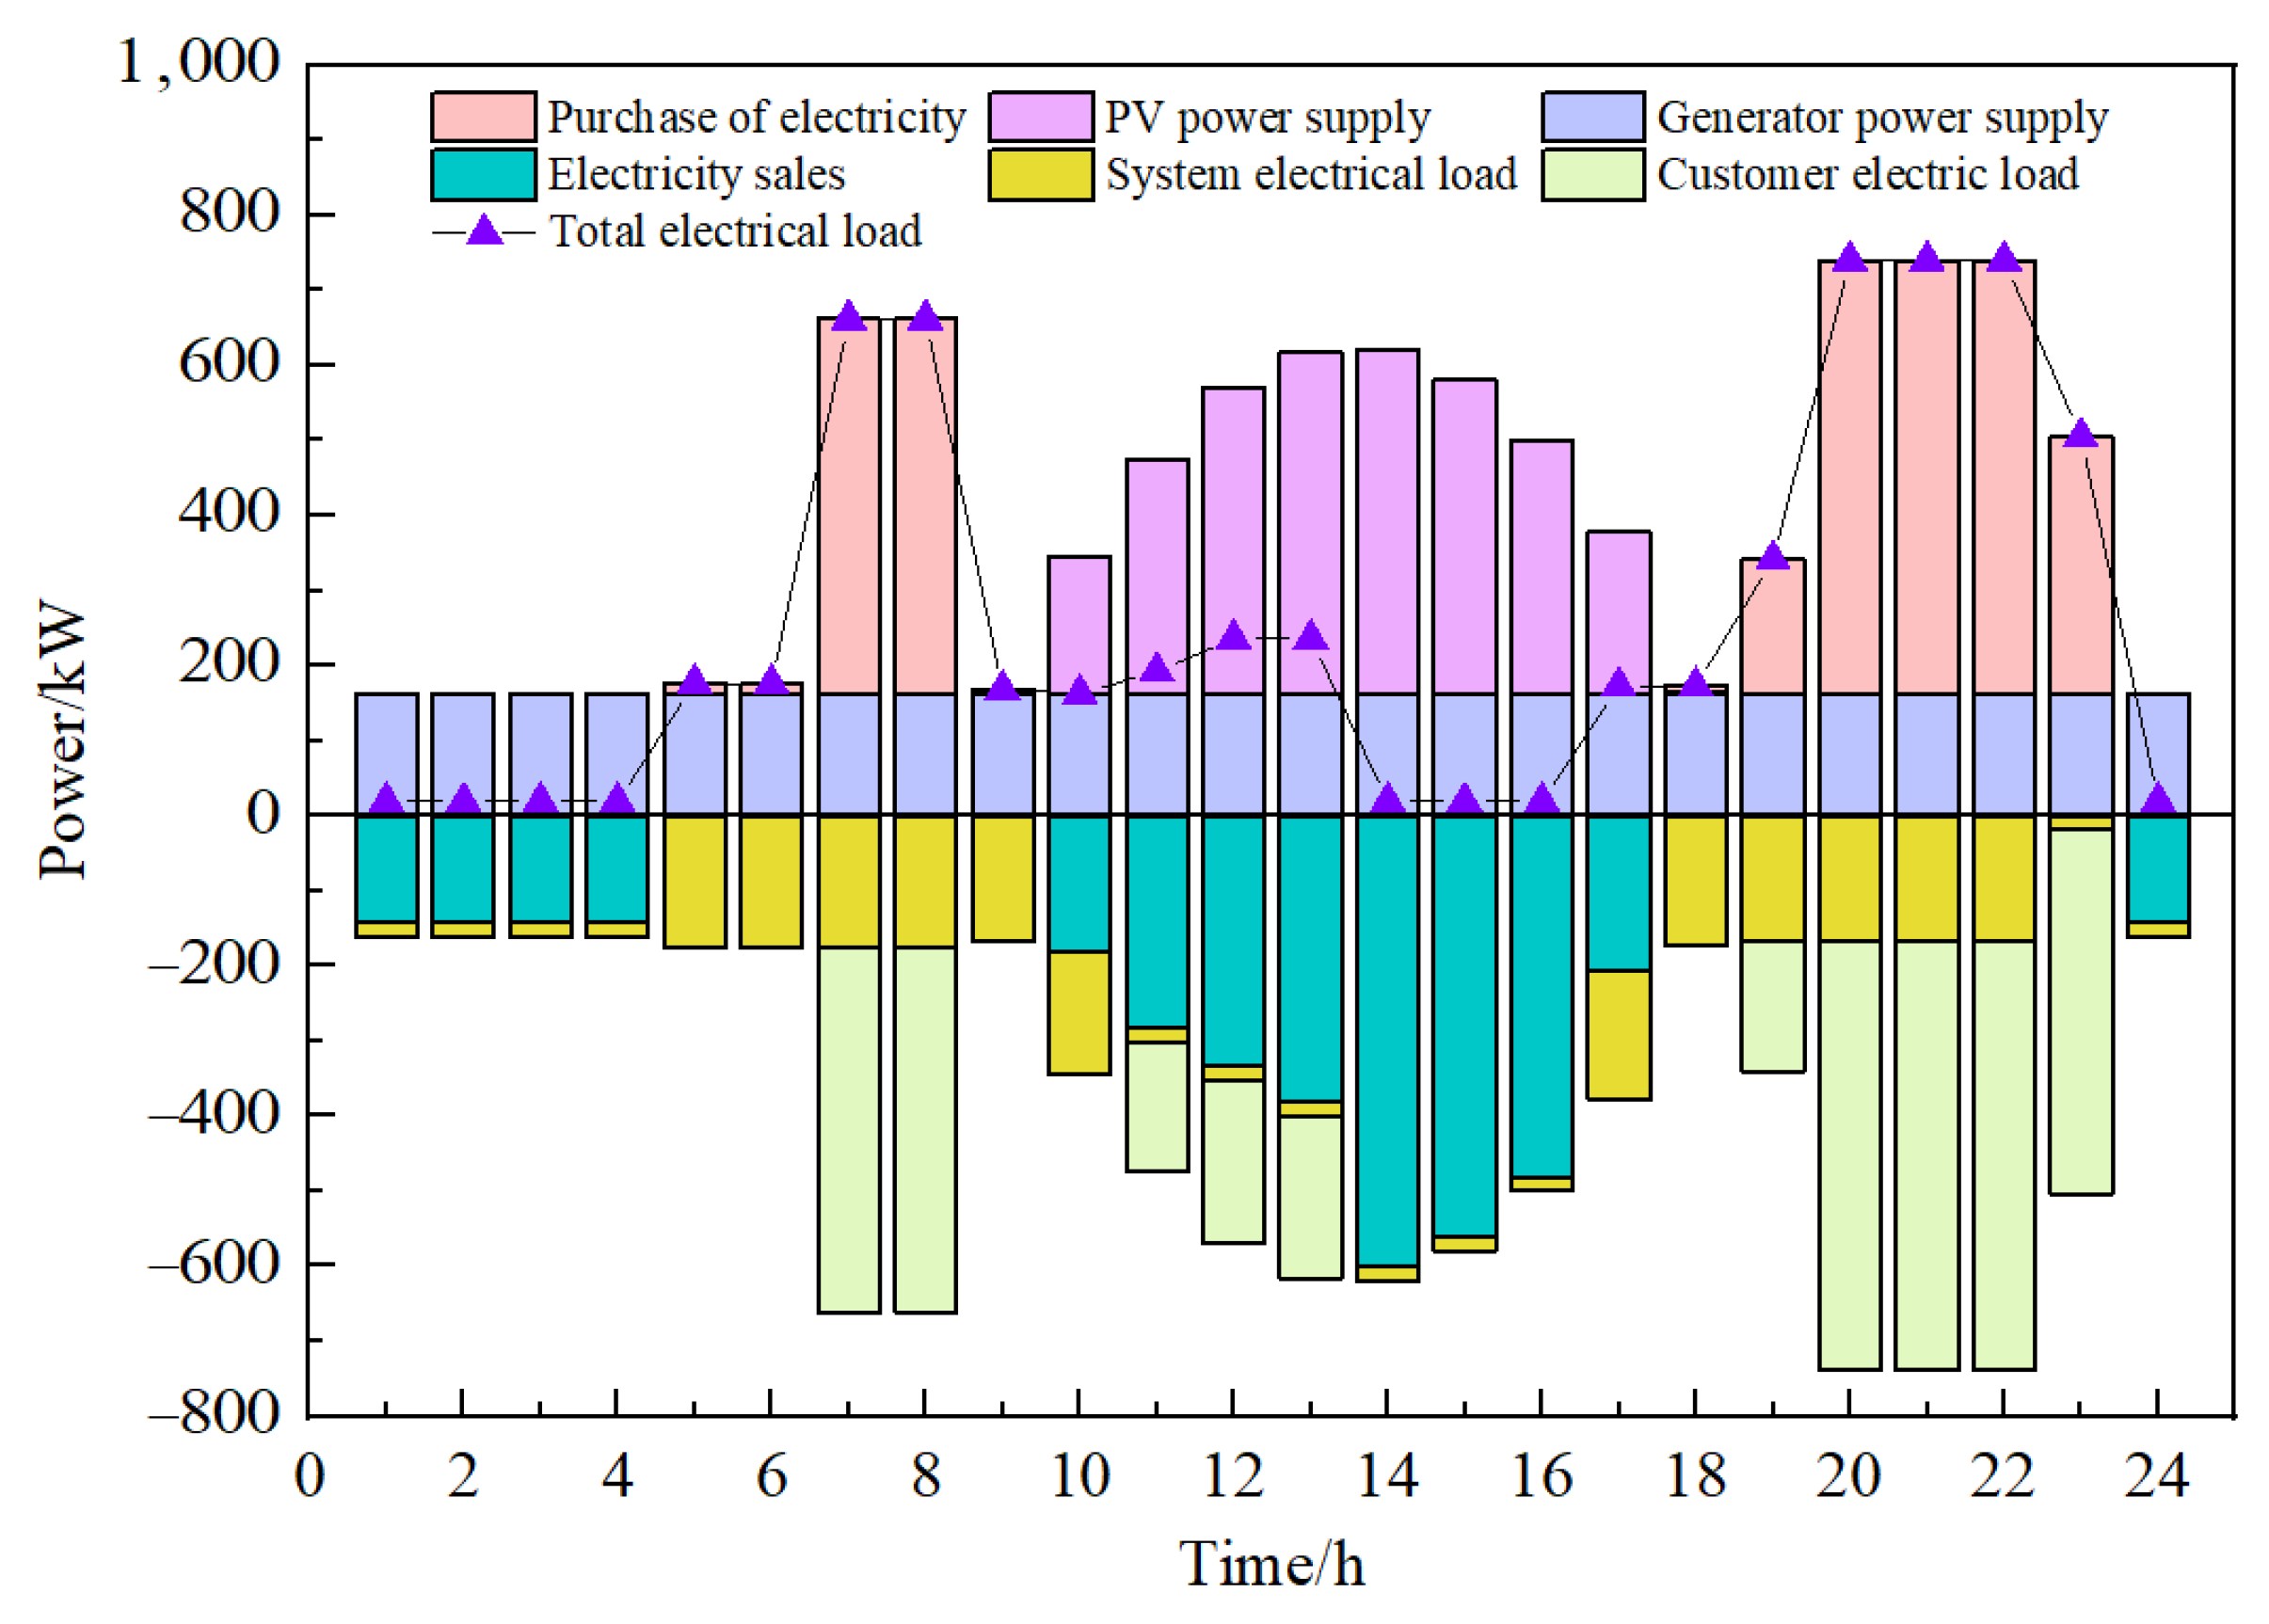
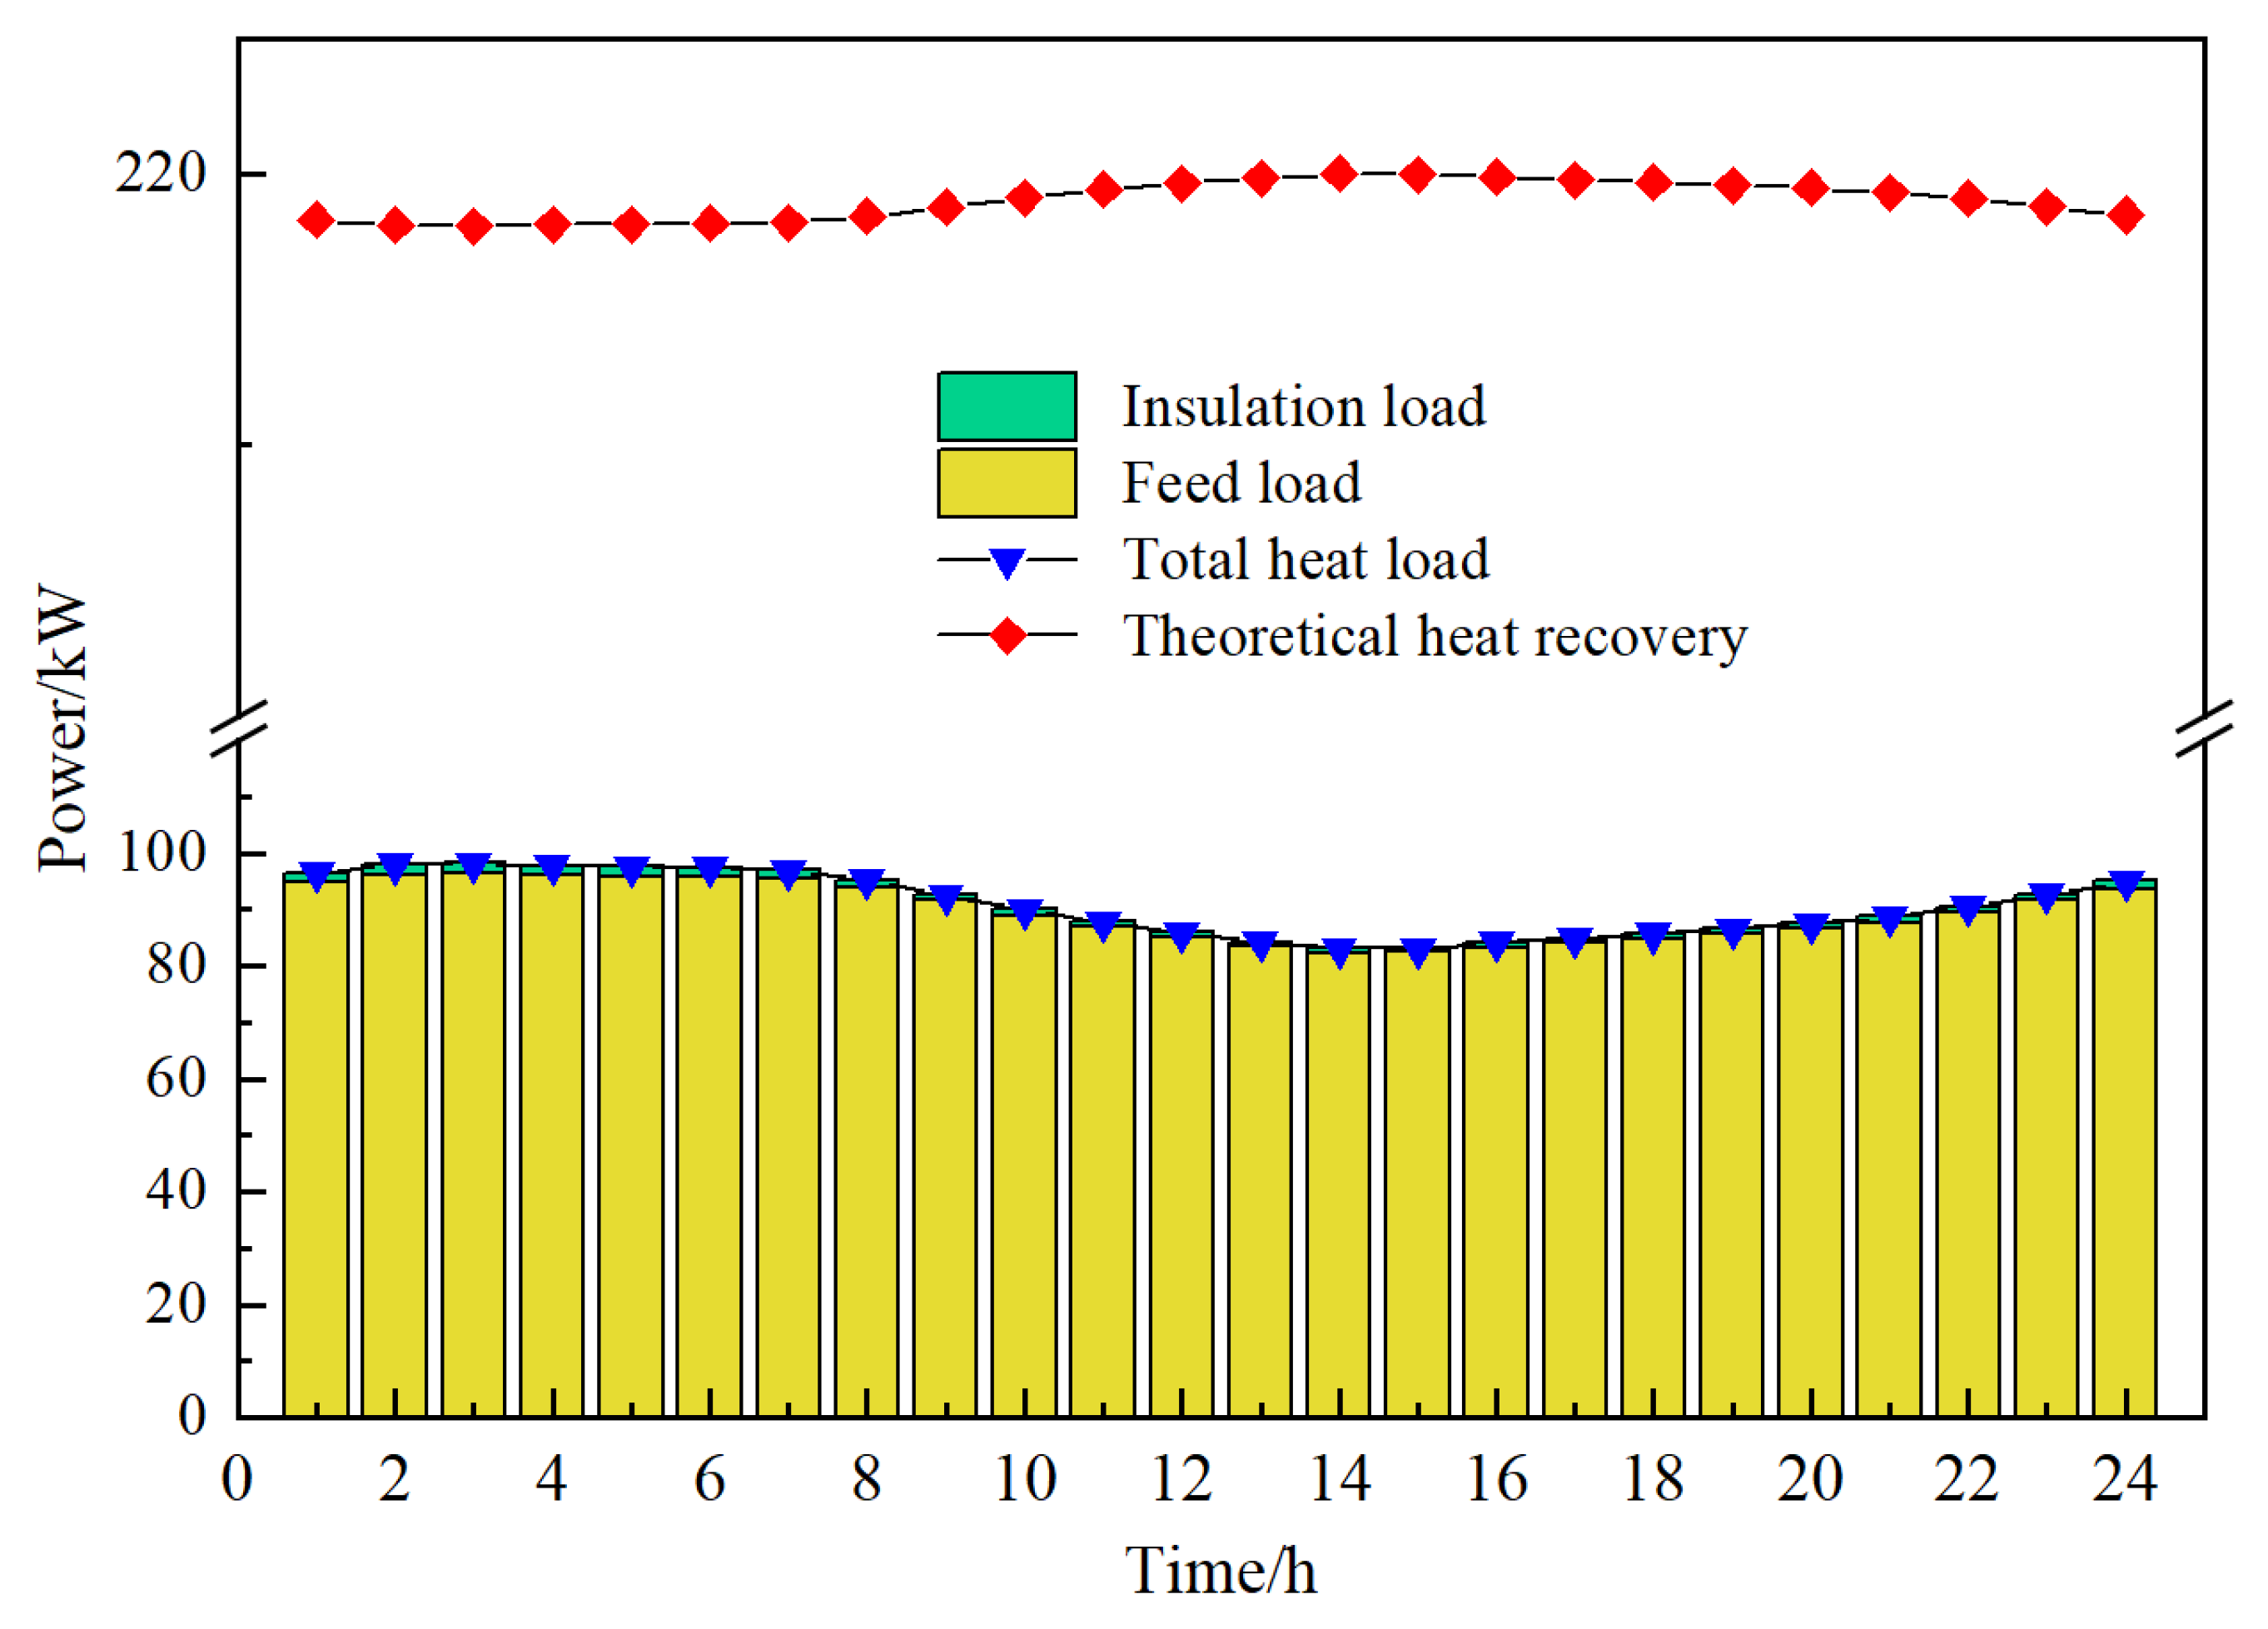
4.1.1. Typical Day During the Heating Season

Figure 9 shows a typical daily heat balance during the heating season. The total heat load during the heating season consists of the user heat load and the fermenter heat load, and the fermenter heat load accounts for a small proportion compared with the user heat load. The total heat load of the system is supplied by the biomass boiler, the waste heat from the biogas generator and the condensing heat exchanger, and the heat load of the fermenter is completely provided by the waste heat from the biogas generator, and the excess heat is stored in the storage tank and the heated part of the heating return water during the heating time. The fermenter heat load is only available from 0:00 to 5:00, 11:00 to 17:00, and 23:00 to 24:00, while the other time periods are subject to both fermenter heat load and customer heat load. The fermenter heat load is relatively smooth throughout the day, and the user heat load has a general trend of gradually decreasing from 5:00 to 11:00 and gradually increasing from 17:00 to 23:00. The user heat load throughout the day is 38,311.30 kW·h for the biomass boiler and 2713.32 kW·h for the condensing heat exchanger. The heat supply from the generator set for heating the return water is 1388.47 kW·h, accounting for 90.33%, 6.40%, and 3.27% of the total waste heat recovered. The heat supply of the fermenter for the whole day is 3596.31 kW·h, accounting for 72.15% of the total waste heat recovered from the generator set. The average heat load of the fermenter for the whole day is 149.85 kW, and the highest heat load of the users for the whole day heating time is 6108.87 kW, the lowest heat load is 1630.23 kW, and the average heat load is 3534.42 kW.
As shown in Figure 10, in regard to the typical daily electric balance during the heating season, the total system electric load includes the system electric load and the user electric load; the system electric load is mainly influenced by the heating time, the user electric load is mainly influenced by the user’s energy consumption habits, the two peaks of the total electric load appear at 5:00~17:00 and 17:00~23:00, the three valleys appear at 0:00~4:00, 13.00~16:00, and 23:00~24:00, the output power of the biogas generator set is stable throughout the day, the PV power generation subsystem is influenced by solar radiation, there is electric power output during the time period of 9:00~18:00; in regard to the whole day during the valley time period, only the power produced by the biogas generator set can meet the total electric load demand, and a part of the power generated is sold to the grid; during the peak time period, because at this time there is no solar radiation, the PV power generation subsystem does not produce electricity, and the biogas generator set power generation is not enough to meet the total electrical load, so there is a need to purchase electricity from the grid. The total power generation for the whole day is 6681.43 kW·h, the power generation of the biogas generator set is 3888.72 kW·h, and the power generation of the PV subsystem is 2792.71 kW·h, accounting for 58.2% and 41.8% of the total power generation, respectively. The total electric load for the day was 6228.91 kW·h, of which 2273.01 kW·h was the total system electric load and 3955.90 kW·h was the total customer electric load, accounting for 36.49% and 63.51% of the total electric load, respectively. The total electricity purchased for the whole day was 3293.18 kW·h, the total electricity sold was 3745.7 kW·h, and the net electricity sold for the whole day was 452.52 kW·h.

4.1.2. Typical Day During the Non-Heating Season

Figure 11 shows the heat balance during the non-heating season. The total heat load during the non heating season is to ensure the constant temperature anaerobic fermentation heat load of the biogas plant, which is met by the waste heat recovered by the biogas generator set. The heat load of the fermenter is mainly affected by the ambient temperature, and the overall performance trend is that the heat load is higher in the morning and evening, and lower at noon, and the total heat load of the fermenter is 98.19 kW at the maximum, 83.09 kW at the minimum, and 90.84 kW on average; the total heat load of the fermenter for the whole day was 2180.08 kW·h, of which the total fermenter feed load was 2152.44 kW·h and the total insulation load was 27.64 kW·h, accounting for 98.73% and 1.27% of the total fermenter heat load, respectively. Due to the low heat load of the fermenter, the theoretical recoverable heat of the biogas generator set was not fully utilized, and the total theoretical recoverable heat for the whole day was 5256.28 kW·h, and the heat used by the fermenter was only 41.48% of the theoretical total recoverable heat.
As shown in Figure 12, in regard to the electric balance for a typical day during the non-heating season, the customer electric load has the same trend as a typical day during the heating season, the total electric load of the system is lower because only the biogas fermentation subsystem is running, the peak and trough values of the total electric load appear during the same time period on a typical day during the non-heating season and a typical day during the heating season, but the peak power is lower, the output power of the biogas generator set is stable throughout the day, the time period of the PV power generation subsystem is 7:00~20:00; during the valley time period, the total electric load is met by the biogas generator set alone for most of the time period, and a small part of the time period is met by the PV subsystem and the biogas generator set together, and the total power generation during both time periods is greater than the total system electric load, and electricity is sold to the grid at this time; during the peak time period, the total electric load is greater than the total power generation, which is met by the biogas generator set and the grid, or the biogas generator set, the PV subsystem, and the grid together to meet the demand, at this time electricity is purchased from the grid. The total power generation for the whole day is 5093.84 kW·h, of which 3887.76 kW·h is generated by the biogas generator set and 1206.08 kW·h is generated by the PV power generation subsystem, accounting for 76.32% and 23.68% of the total power generation, respectively. The total electricity load for the day was 4438.9 kW·h, of which the total system electricity load was 483.0 kW·h, and the total customer electricity load was 3955.9 kW·h, accounting for 10.88% and 89.12% of the total electricity load, respectively; the accumulated electricity sales for the day was 2911.99 kW·h, the cumulative electricity purchases for the day was 2257.05 kW·h, and the net electricity sales for the whole day was 654.94 kW·h.

4.2. Benefit Analysis

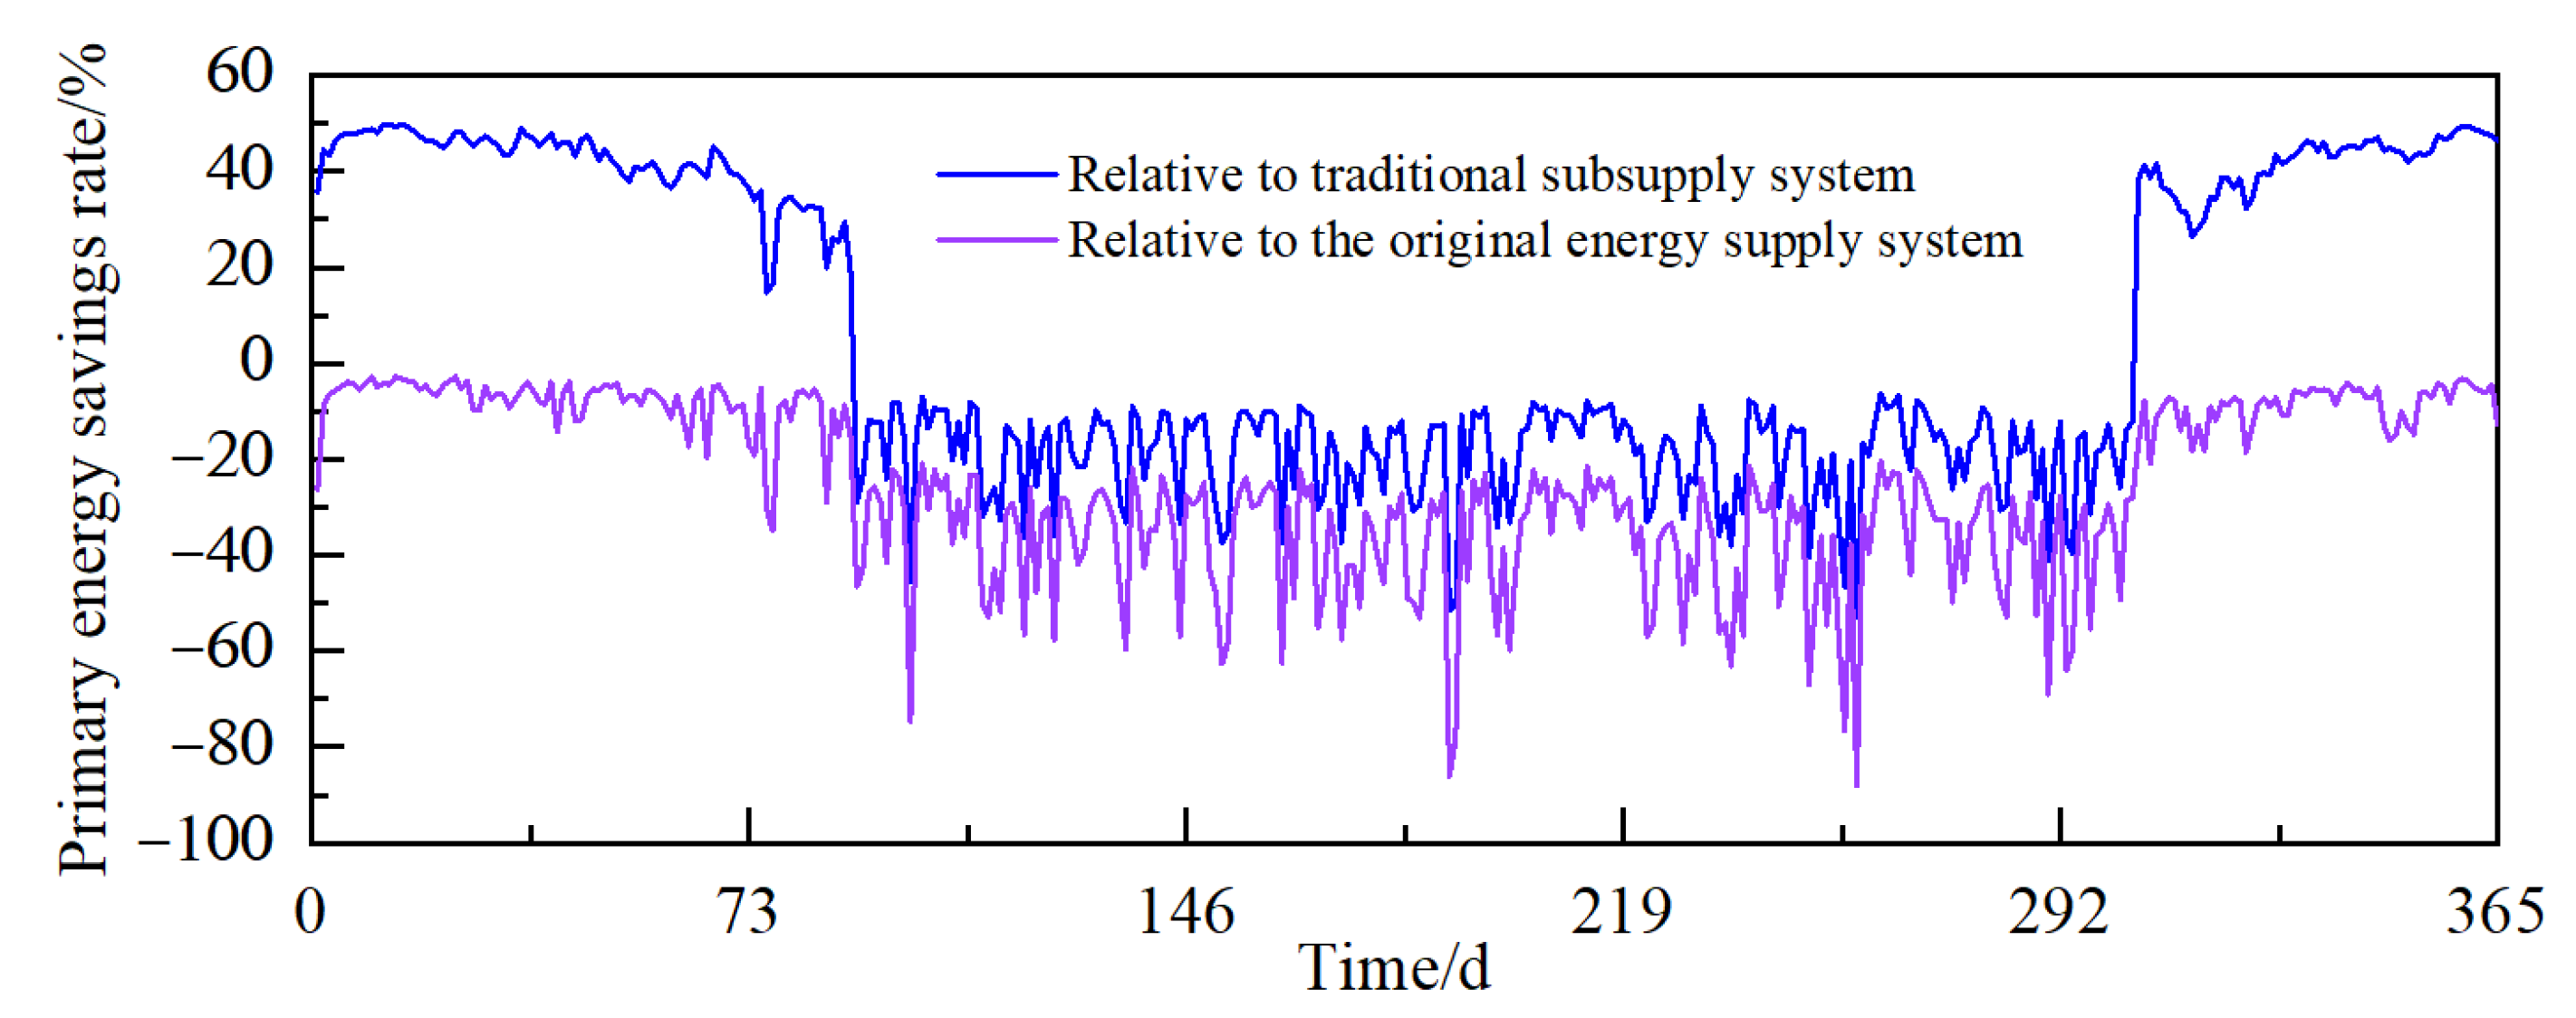
4.2.1. Energy Analysis of the System

The primary energy utilization rates of the three energy supply systems are shown in Figure 13. The trends in the primary energy utilization rates of the multi-generation system and the original energy supply system are basically the same during the heating season, but the primary energy utilization rate of the multi-generation system is lower, due to the fact that the main load during the heating season is the customer heat load and both systems are supplied by biomass direct-fired boilers, but the power supply methods are different. The total power generation efficiency is lower than that of the power plant; therefore, the primary energy utilization rate of the multi-generation system is slightly lower than that of the original energy supply system during the heating season. The average primary energy utilization rate of the multi-generation system and the primary energy supply system is 58.60% and 63.38% during the heating season, respectively, and 25.98% and 35.35% during the non-heating season, respectively. The primary energy utilization rate of the conventional supply system has a stable trend throughout the year, with an average primary energy utilization rate of 31.98% throughout the year. As shown in Figure 14, the average primary energy saving rate of the multiple supply system compared with the traditional subsupply system and the original energy supply system during the heating season is 41.52% and −9.87%, respectively.

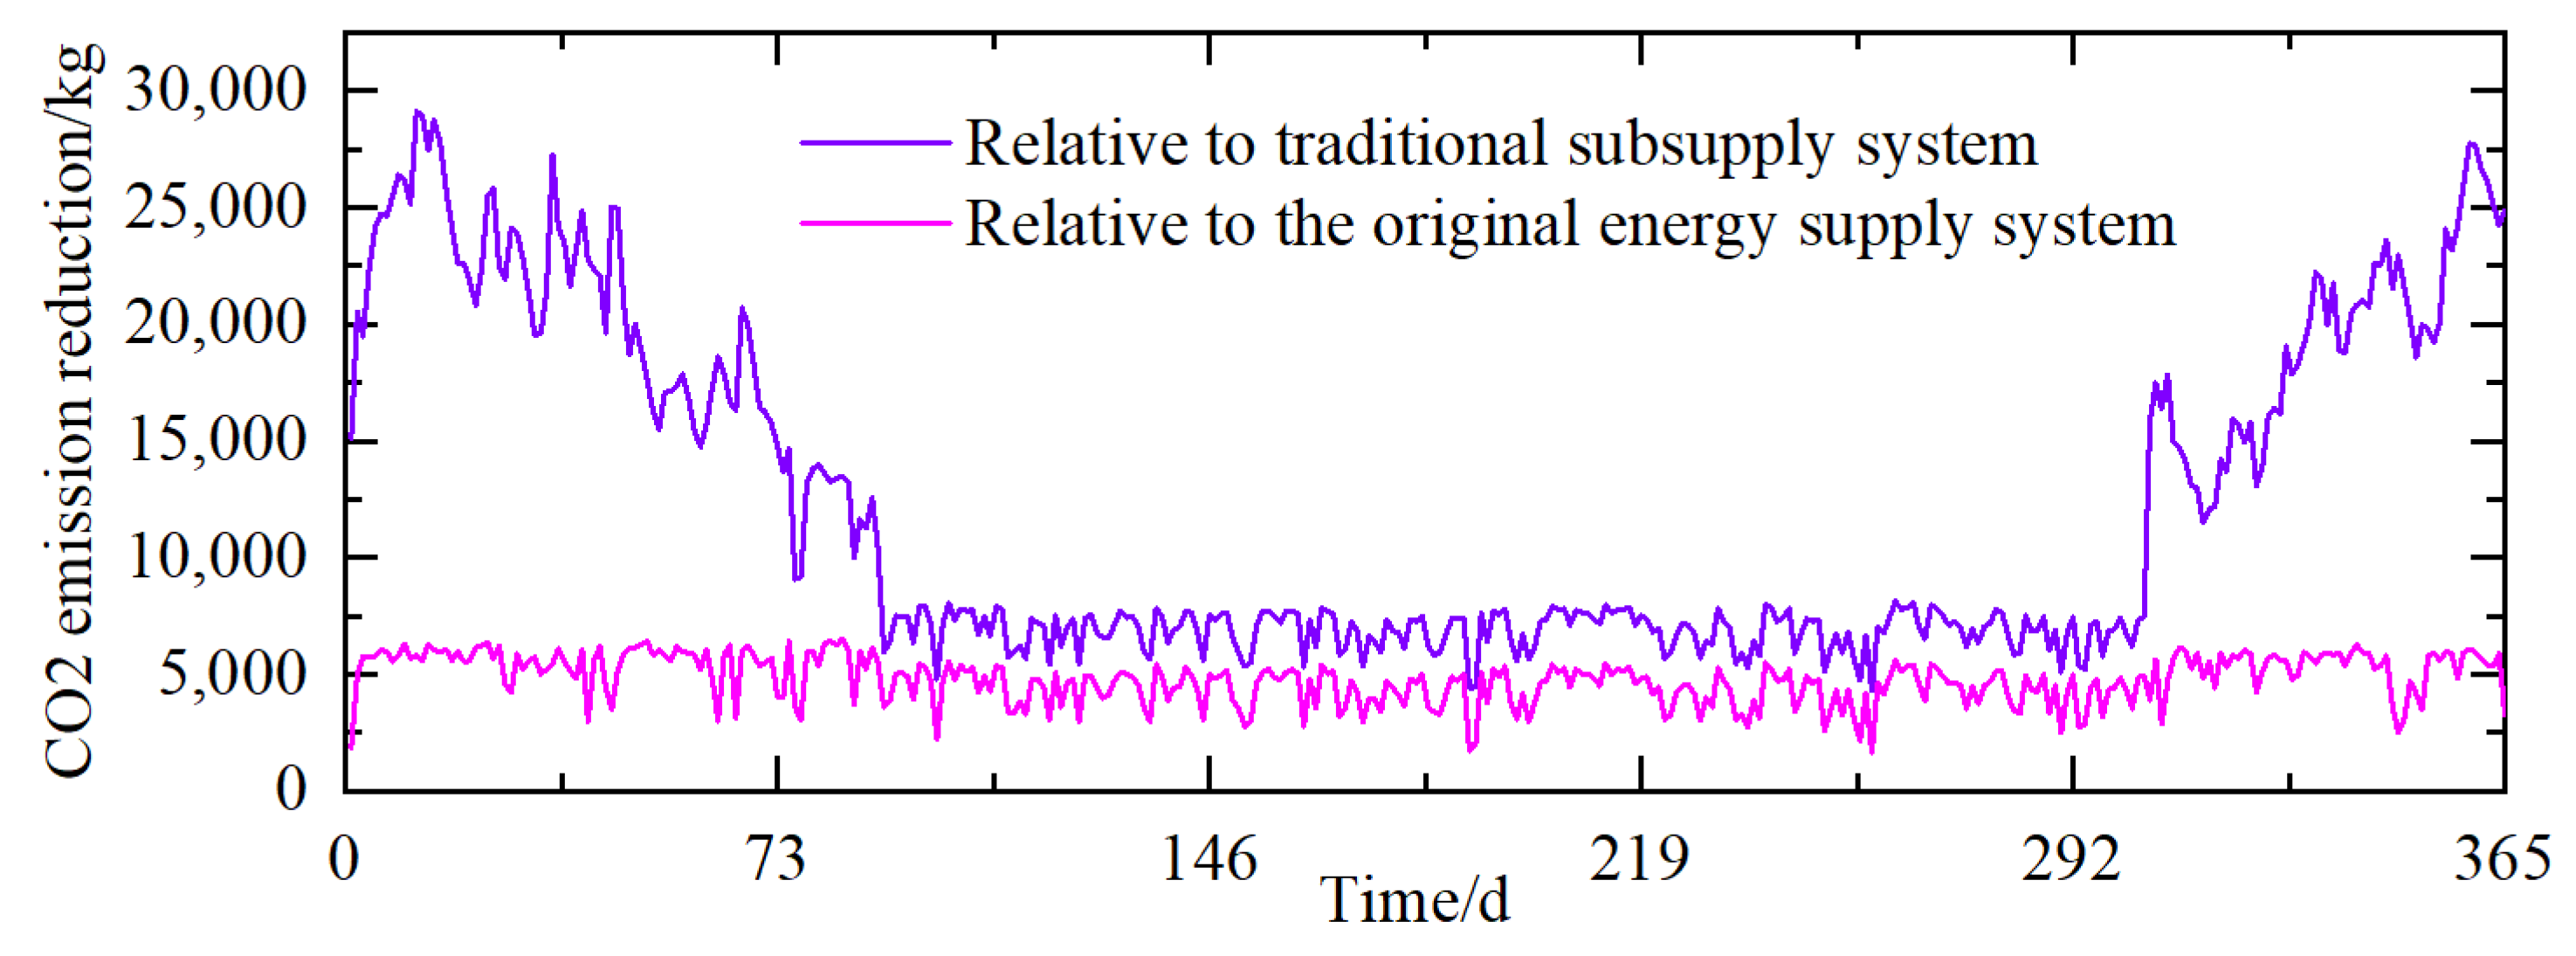
4.2.2. Environmental Benefits of the System

As shown in Figure 15, the CO2 emissions from the system for the whole year are the same for all three supply modes, and the CO2 emissions during the heating season are higher and fluctuate more depending on the load; the CO2 emissions during the non-heating season are stable and fluctuate less. The maximum daily CO2 emissions during the heating season are 19,760.80 kg, 25,561.06 kg, and 48,873.63 kg for the multiple supply system, the original energy supply system, and the traditional subsupply system, respectively, and the minimum daily CO2 emissions are 4357.85 kg, 8899.48 kg, and 14,405.53 kg, respectively. The average daily CO2 emissions during the non-heating season were 2939.33 kg, 7264.86 kg, and 9812.15 kg; the average daily CO2 emissions during the year were 6664.07 kg, −11,437.40 kg, and 18,744.74 kg; the total CO2 emissions during the year were 2,432,387.20 kg, 4,174,652.11 kg, and 6,841,830.08 kg, respectively.
As shown in Figure 16, the daily CO2 emission reduction of the multi-generation system is relatively stable compared to the original energy supply system, and the fluctuation range is not large throughout the year, which is mainly due to the difference between the power supply method of the multi-generation system and the original energy supply system. The average daily CO2 emission reduction of the multi-generation system is 4773.33 kg compared with the original energy supply system; the CO2 emission reduction of the multi-generation system is stable during the heating season compared with the traditional subsupply system, but fluctuates more during the non-heating season, with an average daily CO2 emissions reduction of 19,461.31 kg during the heating season and 6872.83 kg during the non-heating season, and an average daily CO2 emissions reduction of 12,080.67 kg during the whole year. The total CO2 emissions reduction of the multi-generation system compared with the original energy supply system and the traditional subsupply system is 1,742,264.91 kg and 4,409,442.88 kg, respectively.
As shown in Figure 17, the CO2 emissions reduction rate of the year-round multi-generation system compared with the traditional subsupply system has a stable trend throughout the year. The maximum daily CO2 reduction rate is 55.92%, the minimum daily CO2 reduction rate is 11.77%, the average daily CO2 reduction rate during the heating season is 32.89%, the average daily CO2 reduction rate during the non-heating season is 58.92%, and the average daily CO2 reduction rate during the year is 48.15%.

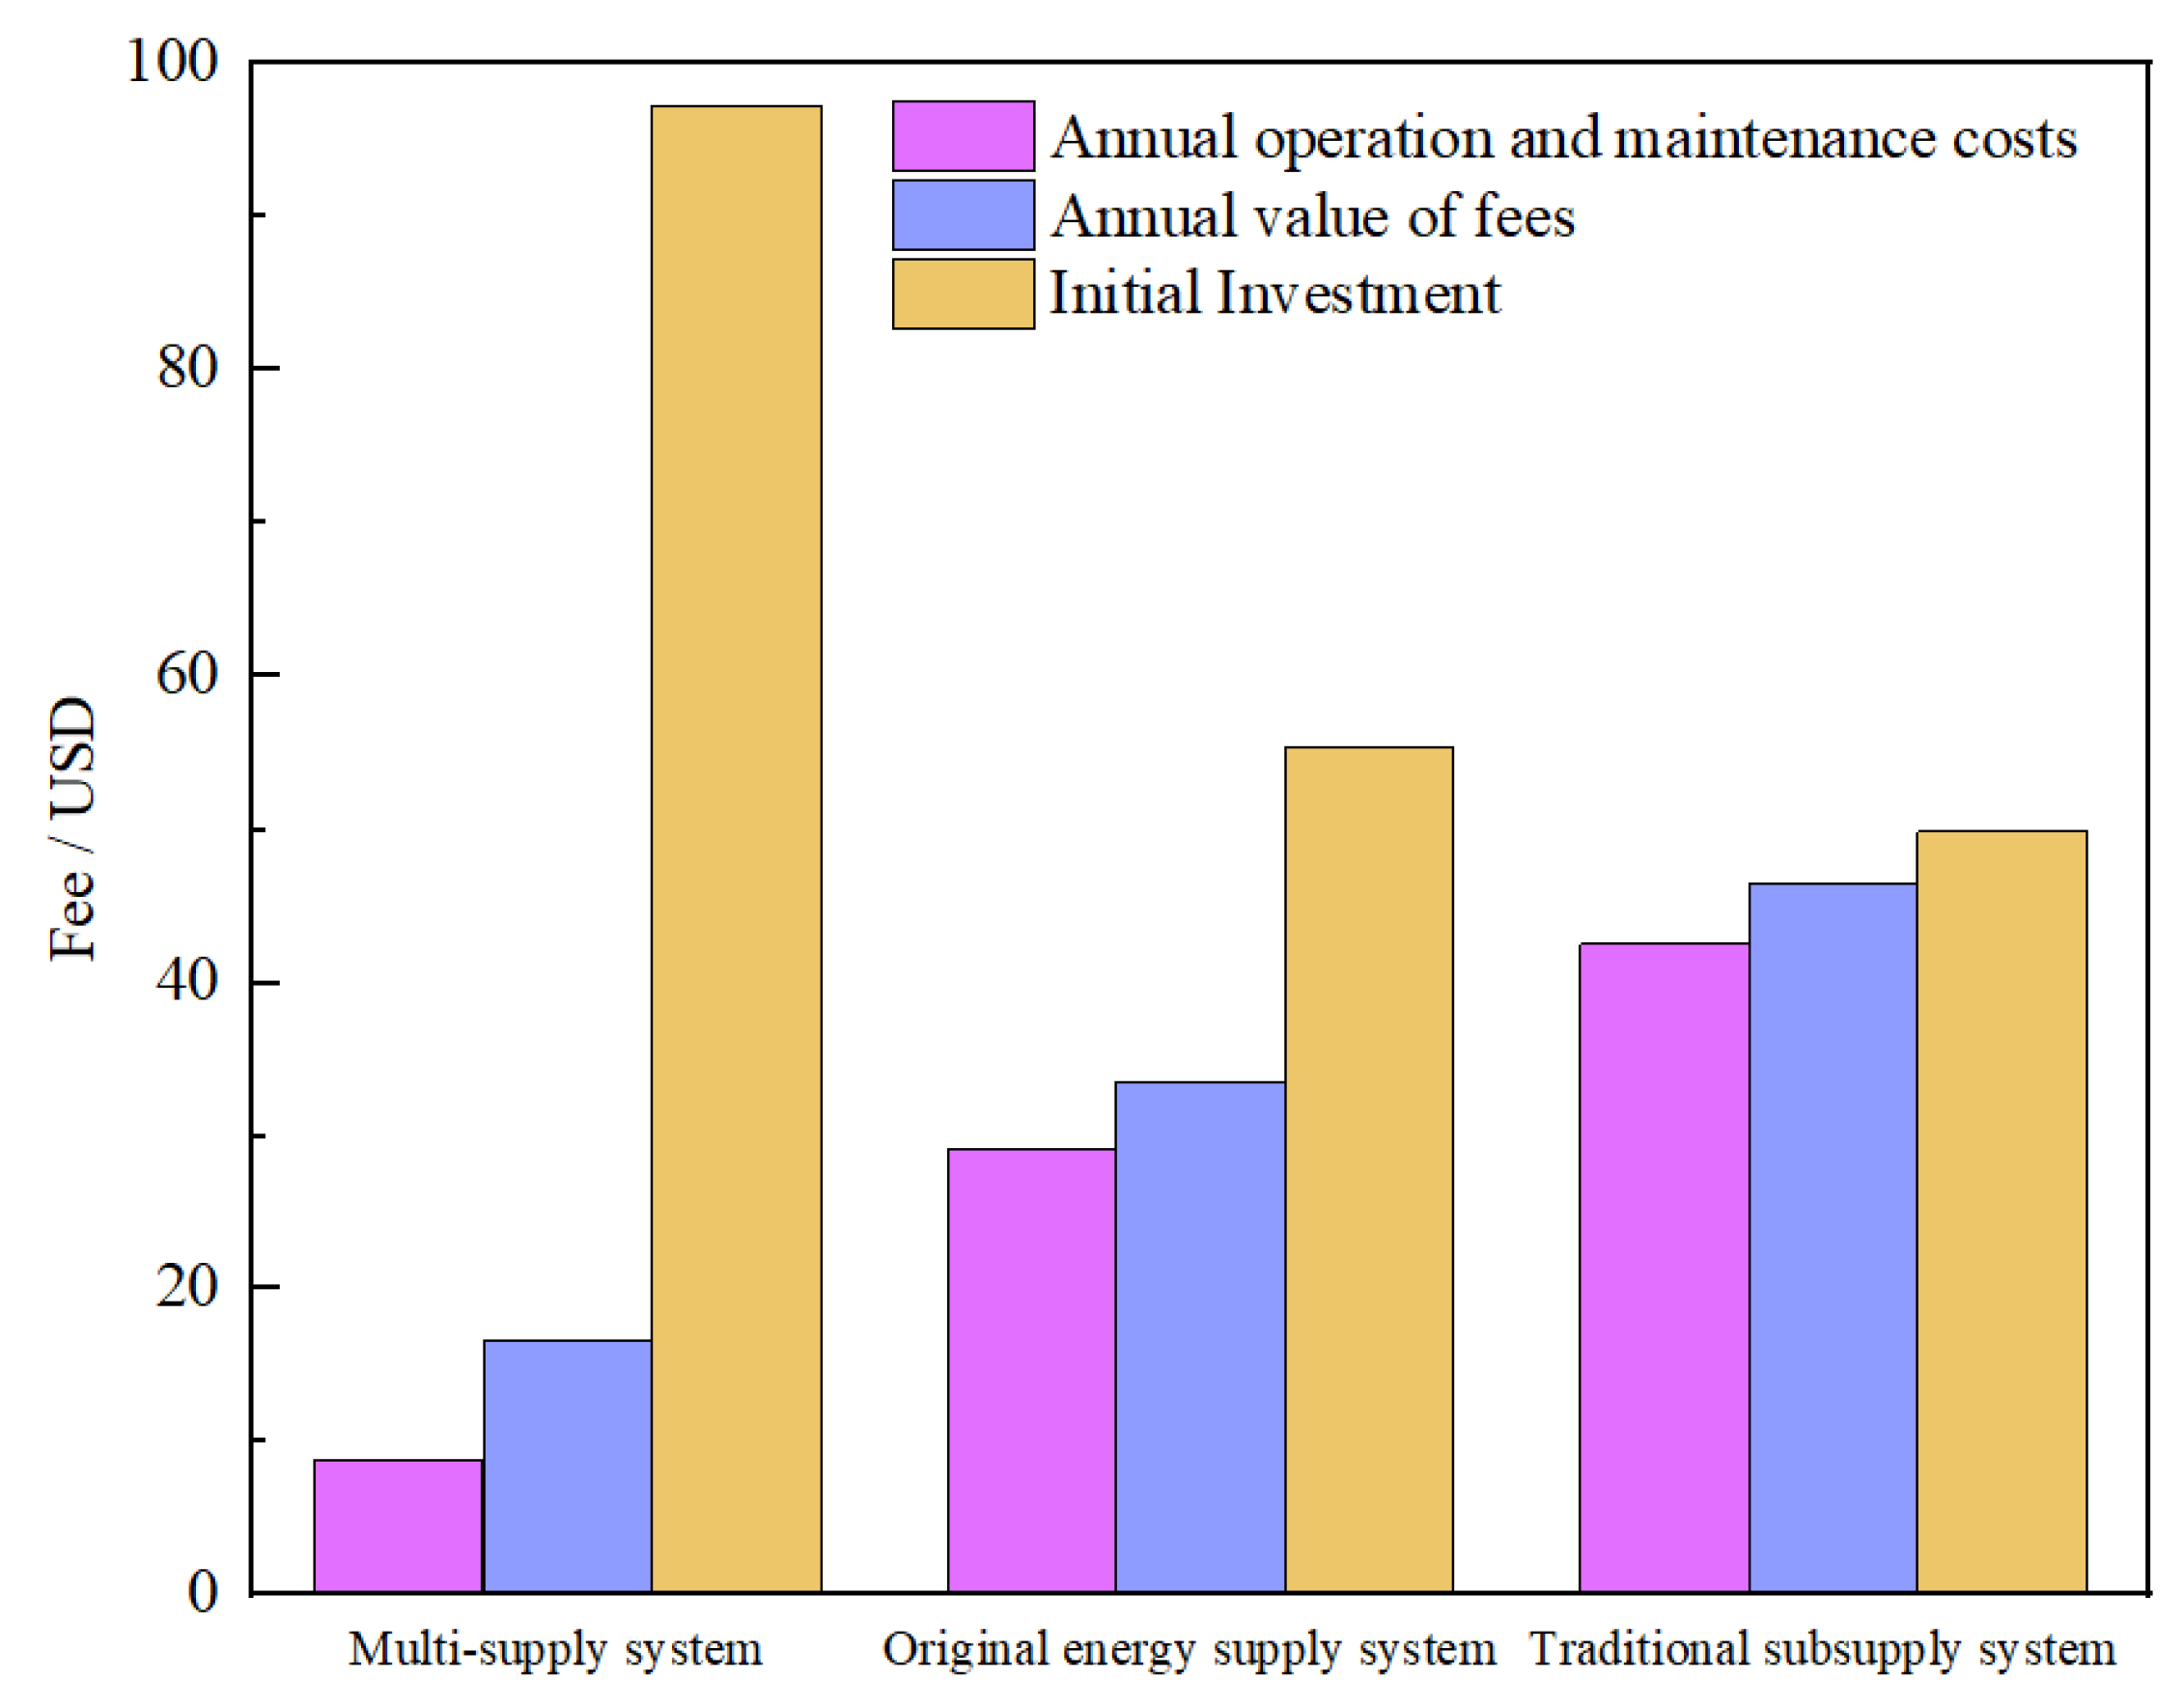
4.2.3. Economic Analysis of the System

According to the data in Table 3, the economic indicator parameters of the system are calculated as shown in Figure 18. The initial investment in the multi-supply system is USD 973,100, the annual operation and maintenance cost is USD 88,500, and the annual value of the cost is USD 166,500. Under the three energy supply modes, the initial investment in the multi-supply system is the highest, and the annual operation and maintenance costs are the lowest. Compared to the original energy supply system and the traditional subsupply system, the annual cost savings of the multi-supply system are 50.35% and 64.19%, respectively. The annual operating cost of the multi-supply system is USD 251,800, the annual income is USD 594,400, the annual net income is USD 342,600, and the static investment payback period is 2.84 years
Considering the time value of the funds in terms of the multi-generation system, after calculation, within the service life of the multi-generation system, the present value of the cumulative cost is USD 4.1114 million, the present value of the cumulative benefit is USD 7.4078 million, and the net present value is USD 3.2964 million. The dynamic investment recovery period for the multi-generation system is 3.14 years. The net present value of the system is greater than 0, and the benefit/cost ratio is greater than 1. The system is economically feasible.

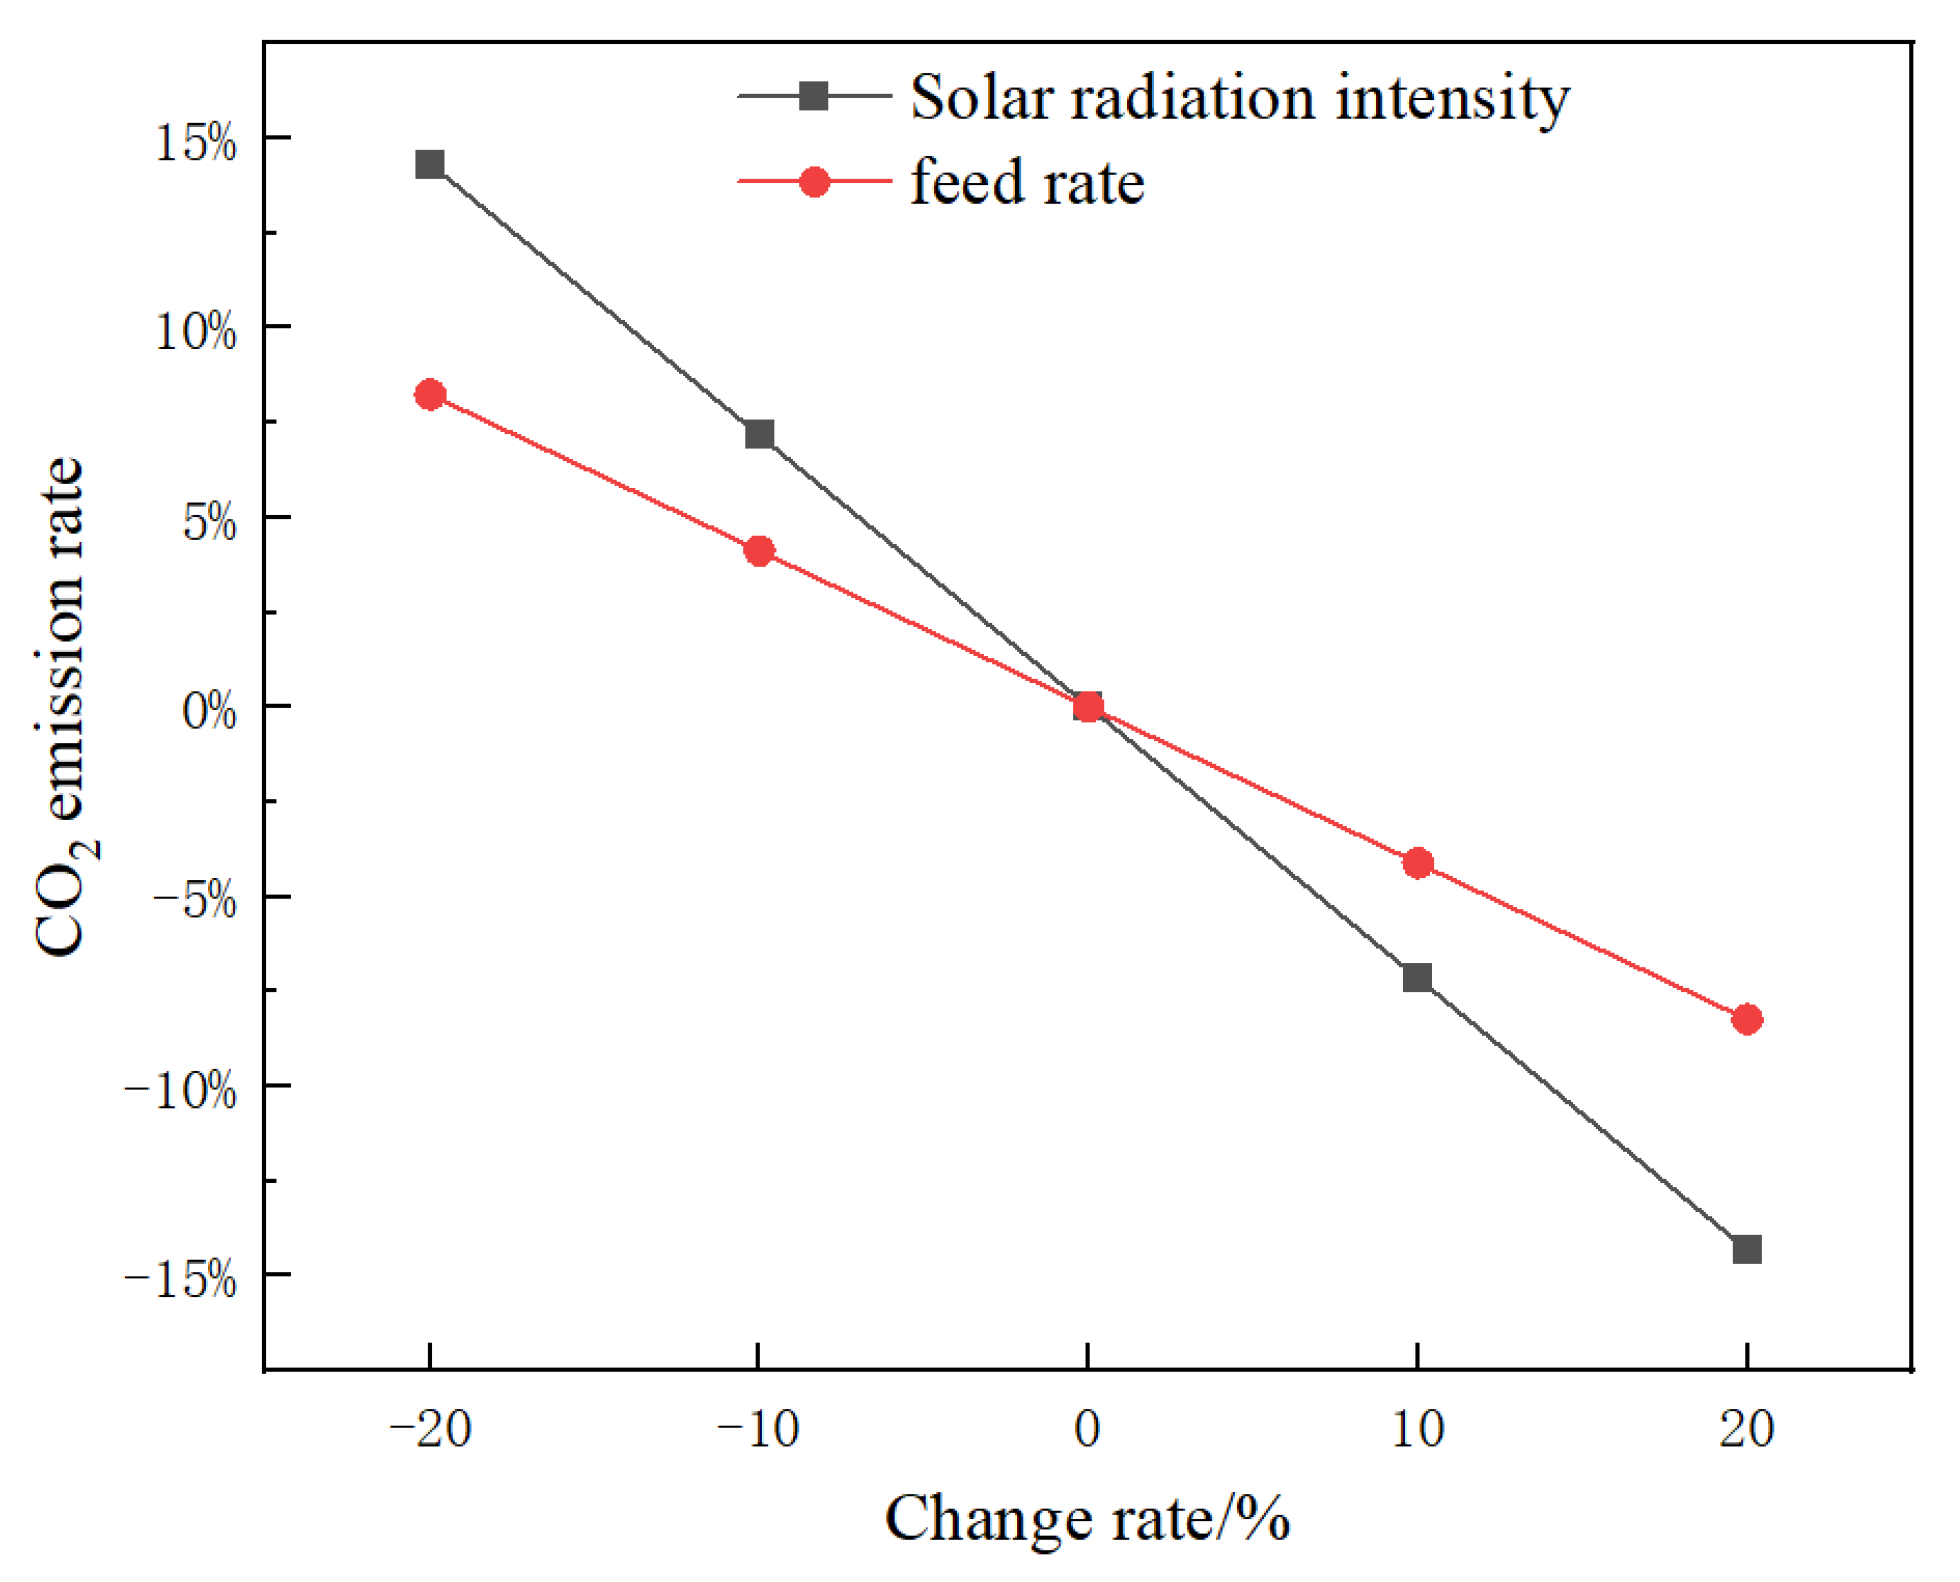
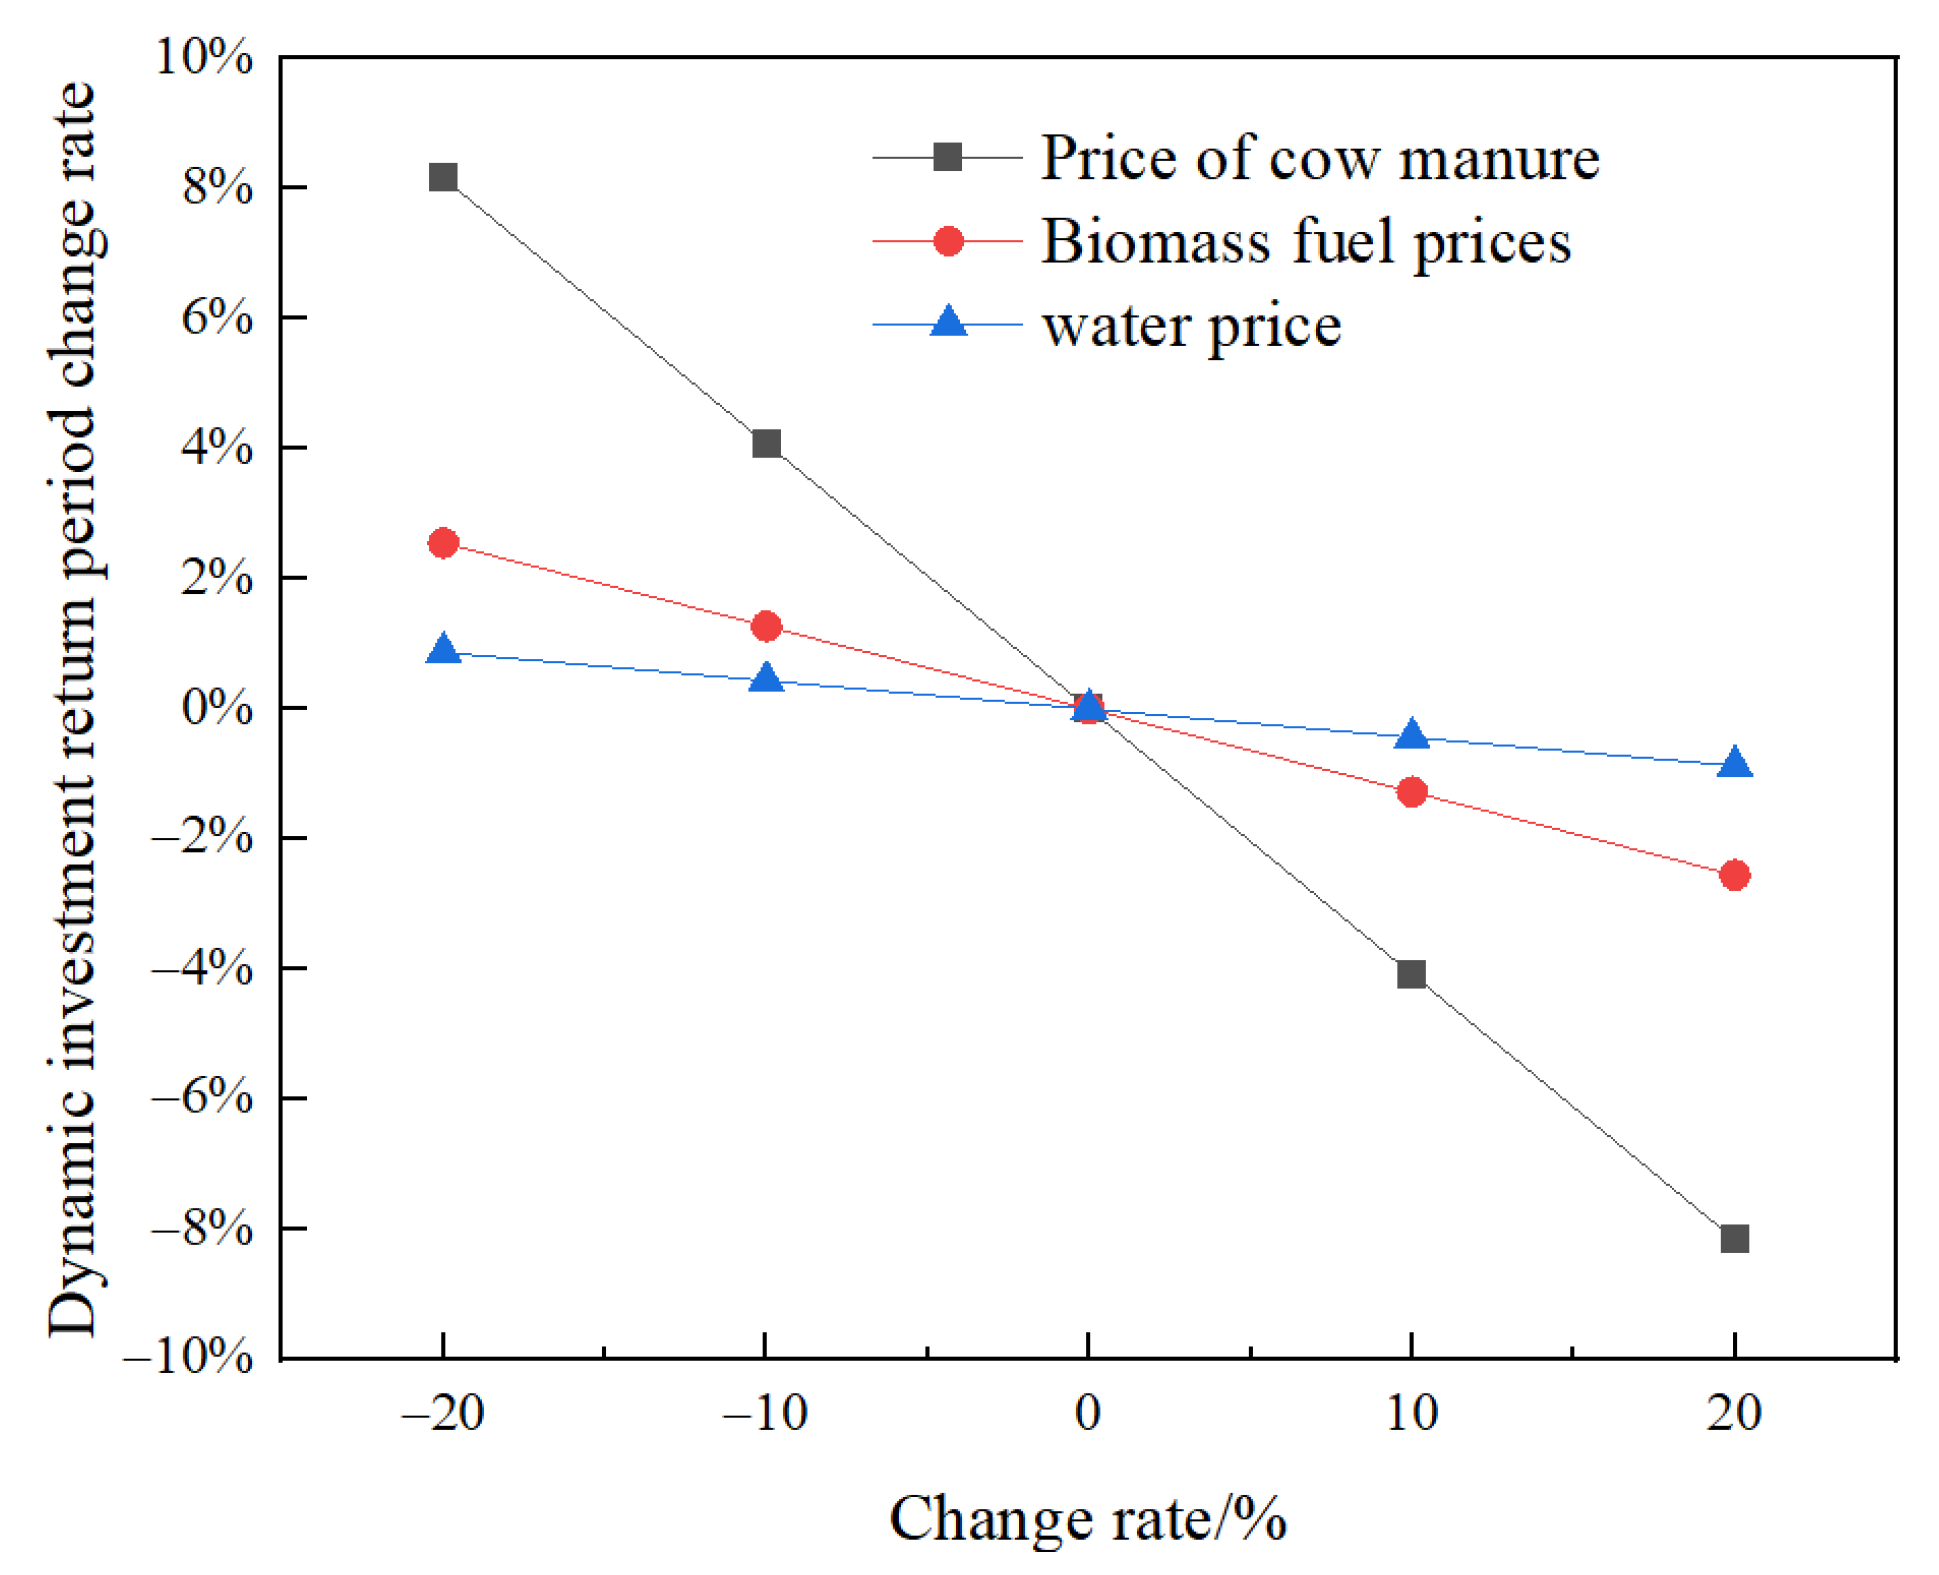
4.3. Sensitivity Analysis

In order to improve the universal adaptability of the system, sensitivity analysis is needed to assess the solar radiation intensity, feed rate, and raw material prices.
The intensity of solar radiation and the rate of biogas production have a significant impact on the CO2 emissions from the system. The analysis results are shown in Figure 19. It can be seen that the intensity of solar radiation has a greater impact on the CO2 emissions from the system than the gas production rate. This is because during the operation of the system, the electricity generated by the biogas generator is preferentially supplied in regard to the system’s own power consumption and user electricity demand, while the electricity sold to the outside world mainly comes from photovoltaics.
From Figure 20, it can be seen that the price of cow manure has a significant impact on the investment return period for the system, with a price fluctuation of 20% and an investment return period fluctuation of 8.16%

5. Conclusions

This paper constructs a combined heat and power biogas system, with solar energy and biomass as energy inputs, analyses the heat and power balance on a typical day, analyses the operational performance of the system on a typical day, and compares the original energy supply system with the traditional subsupply system, and comprehensively evaluates the differences in terms of energy performance, environmental protection, and economy, and obtains the following conclusions:
(1)
During the heating season, the average primary energy utilization rate of multi-generation systems is 58.60%. Compared with traditional distribution systems and primary energy supply systems, the average primary energy saving of multi-generation systems is 41.52% and −9.87%, respectively.
(2)
The total CO2 emissions from the multi-generation system is 2,432,387.20 kg. Compared with the primary energy supply system and the traditional secondary supply system, the total CO2 emissions reduction of the multi-generation system is 1,742,264.91 kg and 4,409,442.88 kg, respectively, with an average daily CO2 reduction rate of 48.15% and 66.86%, respectively.
(3)
The initial investment in the multi-supply system is USD 973,100, the annual operating cost is USD 251,800, and the annual income is USD 594,400. Compared with the original energy supply system and the traditional subsupply system, the annual cost savings of the multi-supply system are 50.35% and 64.19%, respectively. Within the service life of the multi-generation system, the net present value is USD 3.2964 million, and the dynamic investment payback period is 3.14 years, which is economically feasible.

Author Contributions

Conceptualization, J.L.; methodology, J.L.; software, X.H.; data curation, J.L.; supervision, J.L.; formal analysis, X.H.; writing—original draft preparation, Jinping Li and X.H.; writing—review and editing, J.L. and X.H.; funding acquisition, J.L. All authors have read and agreed to the published version of the manuscript.

Funding

This research was funded by the Gansu Key R&D Program Project (24YFGA061) and the Gansu Province Higher Education Industry Support and Guidance Project (2022CYZC-28).

Data Availability Statement

The data that support the findings of this study are available from the corresponding author upon reasonable request.

Conflicts of Interest

The authors declare no conflict of interest.

References

  1. Li, S.; Zhang, L.; Su, L.; Nie, Q. Exploring the coupling coordination relationship between eco-environment and renewable energy development in rural areas: A case of China. Sci. Total Environ. 2023, 880, 163229. [Google Scholar] [CrossRef] [PubMed]
  2. Zhang, Y.; Zhi, G.; Jin, W.; Xu, P.; Li, Z.; Kong, Y.; Zhang, H.; Shen, Y.; Hu, J. Identifying the fundamental drives behind the 10-year evolution of northern China’s rural household energy and emission: Implications for 2030 and beyond. Sci. Total Environ. 2023, 865, 161053. [Google Scholar] [CrossRef] [PubMed]
  3. Li, S.; Zhang, L.; Wang, X.; Zhu, C. A decision-making and planning optimization framework for multi-regional rural hybrid renewable energy system. Energy Convers. Manag. 2022, 273, 116402. [Google Scholar] [CrossRef]
  4. Wang, Y.; Song, M.; Jia, M.; Li, B.; Fei, H.; Zhang, Y.; Wang, X. Multi-objective distributionally robust optimization for hydrogen-involved total renewable energy CCHP planning under source-load uncertainties. Appl. Energy 2023, 342, 121212. [Google Scholar] [CrossRef]
  5. Zeng, L.; Xu, J.; Wu, M.; Tang, J.; Wu, Q.; Wang, Q.; Fan, G. Day-ahead interval optimization for CCHP system considering uncertainty of wind power and PV. Int. J. Electr. Power Energy Syst. 2022, 138, 107895. [Google Scholar] [CrossRef]
  6. Yan, R.; Wang, J.; Wang, J.; Tian, L.; Tang, S.; Wang, Y.; Zhang, J.; Cheng, Y.; Li, Y. A two-stage stochastic-robust optimization for a hybrid renewable energy CCHP system considering multiple scenario-interval uncertainties. Energy 2022, 247, 123498. [Google Scholar] [CrossRef]
  7. Stanek, W.; Gazda, W.; Kostowski, W. Thermo-ecological assessment of CCHP (combined cold-heat-and-power) plant supported with renewable energy. Energy 2015, 92, 279–289. [Google Scholar] [CrossRef]
  8. Deymi-Dashtebayaz, M.; Norani, M. Sustainability assessment and emergy analysis of employing the CCHP system under two different scenarios in a data center. Renew. Sustain. Energy Rev. 2021, 150, 111511. [Google Scholar] [CrossRef]
  9. Xu, X.; Zhang, Z.; Yuan, J.; Shao, J. Design and multi-objective comprehensive evaluation analysis of PV-WT-BG-Battery hybrid renewable energy systems in urban communities. Energy Convers. Manag. X 2023, 18, 100357. [Google Scholar] [CrossRef]
  10. Li, J.; Xu, W.; Feng, X.; Lu, H.; Qiao, B.; Gu, W.; Zhang, G.; Jiao, Y. Comprehensive evaluation system for optimal configuration of multi-energy systems. Energy Build. 2021, 252, 111367. [Google Scholar] [CrossRef]
  11. Chen, X.; Long, S.; Wang, C.; Chai, F.; Li, L.; Duan, P.; Li, S.; Wan, Z.; Qu, Z. Comprehensive assessment on a hybrid PEMFC multi-generation system integrated with solar-assisted methane cracking. Int. J. Hydrogen Energy 2023, 48, 14025–14037. [Google Scholar] [CrossRef]
  12. Ren, H.; Quan, Z.; Wang, Z.; Wang, L.; Jing, H.; Zhao, Y. Performance simulation and analysis of a multi-energy complementary energy supply system for a novel BIPVT nearly zero energy building. Energy Convers. Manag. 2023, 282, 116879. [Google Scholar] [CrossRef]
  13. Zhao, X.; Gao, W.; Qian, F.; Li, Y.; Ushifusa, Y.; Yang, Z.; Yin, W.; Ge, J. Economic performance of multi-energy supply system in a zero-carbon house. Energy Build. 2020, 226, 110363. [Google Scholar] [CrossRef]
  14. Ge, Y.; Ma, Y.; Wang, Q.; Yang, Q.; Xing, L.; Ba, S. Techno-economic-environmental assessment and performance comparison of a building distributed multi-energy system under various operation strategies. Renew. Energy 2023, 204, 685–696. [Google Scholar] [CrossRef]
  15. Zhu, Y.; Shao, B.; Tong, Q.L.; Li, Y.X.; Yan, X.X.; Wu, N.; Du, T. Analysis of Carbon Reduction Strategy on Distributed Combined Cooling, Heating and Power (CCHP) Systems Design in Rural Area. IOP Conf. Ser. Earth Environ. Sci. 2018, 146, 012053. [Google Scholar] [CrossRef]
  16. Zhang, D.; Zhang, R.; Zheng, Y.; Zhang, B.; Jiang, Z.Y.; An, Z.J.; Bai, J.H. Carbon emission reduction analysis of CHP system driven by biogas based on emission factors. Energy Built Environ. 2022, 4, 576–588. [Google Scholar] [CrossRef]
  17. Zhang, D.; Zhang, B.; Zheng, Y.; Zhang, R.; Liu, P.F.; An, Z.J. Economic assessment and regional adaptability analysis of CCHP system coupled with biomass-gas based on year-round performance. Sustain. Energy Technol. Assess. 2021, 45, 101141. [Google Scholar] [CrossRef]
  18. Das, B.K.; Al-Abdeli, Y.M.; Kothapalli, G. Integrating renewables into stand-alone hybrid systems meeting electric, heating, and cooling loads: A case study. Renew. Energy 2021, 180, 1222–1236. [Google Scholar] [CrossRef]
  19. Yousefi, H.; Ghodusinejad, M.H.; Kasaeian, A. Multi-objective optimal component sizing of a hybrid ICE+ PV/T driven CCHP microgrid. Appl. Therm. Eng. 2017, 122, 126–138. [Google Scholar] [CrossRef]
  20. Yousefi, H.; Ghodusinejad, M.H.; Noorollahi, Y. GA/AHP-based optimal design of a hybrid CCHP system considering economy, energy and emission. Energy Build. 2017, 138, 309–317. [Google Scholar] [CrossRef]
  21. Al Moussawi, H.; Fardoun, F.; Louahlia, H. 4-E based optimal management of a SOFC-CCHP system model for residential applications. Energy Convers. Manag. 2017, 151, 607–629. [Google Scholar] [CrossRef]
  22. Song, X.; Liu, L.; Zhu, T.; Zhang, T.; Wu, Z. Comparative analysis on operation strategies of CCHP system with cool thermal storage for a data center. Appl. Therm. Eng. 2016, 108, 680–688. [Google Scholar] [CrossRef]
  23. Wang, X.; Xu, Y.; Fu, Z.; Guo, J.; Bao, Z.; Li, W.; Zhu, Y. A dynamic interactive optimization model of CCHP system involving demand-side and supply-side impacts of climate change. Part II: Application to a hospital in Shanghai, China. Energy Convers. Manag. 2022, 252, 115139. [Google Scholar] [CrossRef]
  24. Huang, Y.; Wang, Y.D.; Chen, H.; Zhang, X.; Mondol, J.; Shah, N.; Hewitt, N.J. Performance analysis of biofuel fired trigeneration systems with energy storage for remote households. Appl. Energy 2017, 186, 530–538. [Google Scholar] [CrossRef]
  25. Lombardo, W.; Sapienza, A.; Ottaviano, S.; Branchini, L.; De Pascale, A.; Vasta, S. A CCHP system based on ORC cogenerator and adsorption chiller experimental prototypes: Energy and economic analysis for NZEB applications. Appl. Therm. Eng. 2021, 183, 116119. [Google Scholar] [CrossRef]
  26. Zhang, D.; Zheng, Y.; Wu, J.; Li, B.; Li, J. Annual energy characteristics and thermodynamic evaluation of combined heating, power and biogas system in cold rural area of Northwest China. Energy 2020, 192, 116522. [Google Scholar] [CrossRef]
  27. Pal, A.; Bhattacharjee, S. Effectuation of biogas based hybrid energy system for cost-effective decentralized application in small rural community. Energy 2020, 203, 117819. [Google Scholar] [CrossRef]
  28. Wang, J.J.; Yang, Y. Energy, exergy and environmental analysis of a hybrid combined cooling heating and power system uti-lizing biomass and solar energy. Energy Convers. Manag. 2016, 124, 566–577. [Google Scholar] [CrossRef]
  29. Murugaperumal, K.; Raj, P.A.D.V. Feasibility design and techno-economic analysis of hybrid renewable energy system for rural electrification. Sol. Energy 2019, 188, 1068–1083. [Google Scholar] [CrossRef]
  30. Moaleman, A.; Kasaeian, A.; Aramesh, M.; Mahian, O.; Sahota, L.; Tiwari, G.N. Simulation of the performance of a solar concentrating photovoltaic-thermal collector, applied in a combined cooling heating and power generation system. Energy Convers. Manag. 2018, 160, 191–208. [Google Scholar] [CrossRef]
  31. Maqbool, U.; Tyagi, A.; Tyagi, V.V.; Kothari, R. Optimization of the renewable-energy-based micro-grid for rural electrification in northern region of India. Clean Technol. Environ. Policy 2020, 579–590. [Google Scholar] [CrossRef]
  32. Wang, L.; Lin, J.; Dong, H.; Wang, Y.; Zeng, M. Demand response comprehensive incentive mechanism-based multi-time scale optimization scheduling for park integrated energy system. Energy 2023, 270, 126893. [Google Scholar] [CrossRef]
  33. Nikitin, A.; Deymi-Dashtebayaz, M.; Baranov, I.V.; Sami, S.; Nikitina, V.; Abadi, M.K.; Rumiantceva, O. Energy, exergy, economic and environmental (4E) analysis using a renewable multi-generation system in a near-zero energy building with hot water and hydrogen storage systems. J. Energy Storage 2023, 62, 106794. [Google Scholar] [CrossRef]
  34. Mohsenipour, M.; Ebadollahi, M.; Rostamzadeh, H.; Amidpour, M. Design and evaluation of a solar-based trigeneration system for a nearly zero energy greenhouse in arid region. J. Clean. Prod. 2020, 254, 119990. [Google Scholar] [CrossRef]
  35. Ma, Z.; Dong, F.; Wang, J.; Zhou, Y.; Feng, Y. Optimal design of a novel hybrid renewable energy CCHP system considering long and short-term benefits. Renew. Energy 2023, 206, 72–85. [Google Scholar] [CrossRef]
  36. Li, J.; Liu, P.; Li, Z. Optimal design and techno-economic analysis of a solar-wind-biomass off-grid hybrid power system for remote rural electrification: A case study of west China. Energy 2020, 208, 118387. [Google Scholar] [CrossRef]
  37. Li, C.; Yang, H.; Shahidehpour, M.; Xu, Z.; Zhou, B.; Cao, Y.; Zeng, L. Optimal planning of islanded integrated energy system with solar-biogas energy supply. IEEE Trans. Sustain. Energy 2019, 11, 2437–2448. [Google Scholar] [CrossRef]
  38. Das, H.S.; Tan, C.W.; Yatim, A.H.M.; Lau, K.Y. Feasibility analysis of hybrid photovoltaic/battery/fuel cell energy system for an indigenous residence in East Malaysia. Renew. Sustain. Energy Rev. 2017, 76, 1332–1347. [Google Scholar] [CrossRef]
  39. Villarroel-Schneider, J.; Balderrama, S.; Sanchez, C.; Cardozo, E.; Malmquist, A.; Martin, A. Open-source model applied for techno-economic optimization of a hy-brid solar PV biogas-based polygeneration plant: The case of a dairy farmers’ association in central Bolivia. Energy Conver-Sion Manag. 2023, 291, 117223. [Google Scholar] [CrossRef]
  40. Hashimoto, A.G. Methane from cattle waste: Effects of temperature, hydraulic retention time, and influent substrate concentration on kinetic parameter (k). Biotechnol. Bioeng. 1982, 24, 2039–2052. [Google Scholar] [CrossRef]
  41. Chen, Y.R.; Hashimoto, A.G. Substrate utilization kinetic model for biological treatment process. Biotechnol. Bioeng. 1980, 22, 2081–2095. [Google Scholar] [CrossRef] [PubMed]
  42. Teng, J.; Wang, W.; Mu, X. A novel economic analyzing method for CCHP systems based on energy cascade utilization. Energy 2020, 207, 118227. [Google Scholar] [CrossRef]
  43. Li, N.; Zhao, X.; Shi, X.; Pei, Z.; Mu, H.; Taghizadeh-Hesary, F. Integrated energy systems with CCHP and hydrogen supply: A new outlet for curtailed wind power. Appl. Energy 2021, 303, 117619. [Google Scholar] [CrossRef]
  44. Wang, Z.; Cai, W.; Tao, H.; Wu, D.; Meng, J. Research on capacity and strategy optimization of combined cooling, heating and power systems with solar photovoltaic and multiple energy storage. Energy Convers. Manag. 2022, 268, 115965. [Google Scholar] [CrossRef]
  45. Klein, S. TRNSYS 17: A Transient System Simulation Program; University of Wisconsin: Madison, WI, USA, 2010. [Google Scholar]
Figure 1. Cogeneration biogas–gas multiple supply system.
Energies 18 03124 g001
Figure 2. Equivalent circuit diagram of the four-parameter model.
Energies 18 03124 g002
Figure 3. Hourly thermoelectric load curve throughout the year.
Energies 18 03124 g003
Figure 4. Heat supply model in regard to a thermoelectric multiple supply system.
Energies 18 03124 g004
Figure 5. Fermenter heat load calculation model.
Energies 18 03124 g005
Figure 6. Power supply model in regard to a thermoelectric multiple supply system.
Energies 18 03124 g006
Figure 7. Simulation model of the original energy supply system.
Energies 18 03124 g007
Figure 8. Traditional energy supply method.
Energies 18 03124 g008
Figure 9. Typical daily heat balance during the heating season.
Energies 18 03124 g009
Figure 10. Typical daily electricity balance during the heating season.
Energies 18 03124 g010
Figure 11. Typical daily heat balance during the non-heating season.
Energies 18 03124 g011
Figure 12. Typical daily electricity balance during the non-heating season.
Energies 18 03124 g012
Figure 13. System annual primary energy utilization.
Energies 18 03124 g013
Figure 14. Primary energy savings of multi-generation system compared to traditional subsupply system/primary energy supply system.
Energies 18 03124 g014
Figure 15. System annual CO2 emissions.
Energies 18 03124 g015
Figure 16. CO2 emissions reduction for multi-generation system versus original system/traditional subsupply system, throughout the year.
Energies 18 03124 g016
Figure 17. CO2 reduction rate of annual multi-generation system versus original energy supply system/traditional subsupply system.
Energies 18 03124 g017
Figure 18. Parameters of the economic indicators of the different systems.
Energies 18 03124 g018
Figure 19. CO2 emission change rate.
Energies 18 03124 g019
Figure 20. The impact of raw material prices on investment payback period.
Energies 18 03124 g020
Table 1. Main equipment parameter settings for multi-generation system.
EquipmentNumerical ValueUnit
PV504.21kWp
Biogas generator set180kW
Condensing heat exchanger115m2
Anaerobic fermenter2000m3
Thermal storage tank34.28m3
Biomass direct-fired boilers7MW
Circulation pumps375m3/h
Table 2. Main parameters of TRNSYS model.
ModuleNameParameterNumberParameterNumber
Energies 18 03124 i001Meteorological data moduleSurface inclination angle37.93°
Energies 18 03124 i002Biomass boilerCustomized heat7000 kWThermal efficiency85%
Combustion efficiency92%
Energies 18 03124 i003Anaerobic fermentation tankFermentation tank capacity1000 m3Height10 m
Specific heat capacity of fermentation broth4.1667 kJ/(kg·k)Feed quality flow rate1784.88 kg/h
Energies 18 03124 i004Biogas generator moduleInstalled capacity180 kWGas flow1300 kg/h
Inlet temperature of water on the cylinder liner86 °CCylinder liner water outlet temperature91.26 °C
Cylinder liner water flow rate15,000 kg/h,Exhaust gas temperature100 °C.
Energies 18 03124 i005Heat storage water tankVolume34.28 m3Height2 m
Heat loss coefficient2.5 kJ/(h·m2·K)
Energies 18 03124 i006Anaerobic fermentation gas production moduleTS10%Dry cow manure gas production factor0.3 m3/(kg⸱TS)
HRT20 daysTemperature35 °C
Energies 18 03124 i007PVOpen-circuit voltage44.4 VShort-circuit current8.64 A
Maximum power point voltage35.9 VMaximum power point current8.08 A
Table 3. Values for price parameters related to economic evaluation.
PriceSymbolsNumerical ValuesUnit
Anaerobic fermentation system I C b s , t o t a l o r i 333,600USD
Biomass direct-fired boiler heating system I C h s , t o t a l o r i 221,371USD
PV power generation system I C P V m s 0.579USD/Wp
Biogas cogeneration system I C i c e m s 614.29USD/kW
Condensing heat exchanger I C e x m s 114.29USD/m2
Thermal storage tank I C tan k m s 121.43USD/m3
Coal stove I C h t 142.86USD/each
Earthen stove I C s t 285.71USD/each
Dried cow dung P c d 0.043USD/kg
Biomass fuel P f u e l 71.429USD/t
Running water P w a t e r 0.554USD/t
Electricity grid P e l 0.079USD/kW·h
Heating P h e a t 3.571USD/(m2·a)
Gas supply P b i o 0.257USD/m3
Slurry P s l u 0.002USD/kg
Residue P r e s 0.034USD/kg
Standard coal P c o a l 0.117USD/kg
Straw P s t r a w 0.040USD/kg
Disclaimer/Publisher’s Note: The statements, opinions and data contained in all publications are solely those of the individual author(s) and contributor(s) and not of MDPI and/or the editor(s). MDPI and/or the editor(s) disclaim responsibility for any injury to people or property resulting from any ideas, methods, instructions or products referred to in the content.

