
Convergence or Divergence? A Cluster Analysis of Energy Poverty Patterns Across the European Union Amidst Policy Shifts and Crises


Abstract
1. Introduction
2. Materials and Methods
3. Energy Security
3.1. Energy Security: Definition and Evolution
- Classical approach—a national focus on safeguarding fuel supplies (primarily oil).
- Coordinative approach (post-1970s crises)—international cooperation to manage shortage risks.
- Agenda broadening phase (1990s–2000s)—introduction of sustainable development concerns (climate policy, renewables, efficiency).
- Multidimensional approach (since the 2010s)—the integration of economic, environmental, and social facets, including energy poverty and justice.
- Dynamic (contemporary) approach—emphasis on system resilience, the minimization of vulnerability, and the role of innovation in shaping future security.
3.2. Indicators for Assessing Energy Security
3.2.1. Multidimensional 4A Indicators
- Availability denotes the physical availability of energy carriers in the required quantities [12]. This dimension covers, inter alia, the geological supply of resources (domestic reserves of oil, gas, coal), the level of indigenous energy production, and the degree of import dependence [13]. Traditionally, availability has been regarded as the foremost pillar of energy security. In the EU context, relevant indicators include the energy self-sufficiency ratio, the diversification of the energy basket, and the volume of strategic reserves.
- Accessibility refers to the physical and geopolitical security of access to energy sources [15]. It encompasses energy infrastructure (transmission networks, pipelines, LNG terminals, interconnectors) together with geopolitical and geographic factors. In the EU, gas crises involving Russia and Ukraine (2006, 2009) illustrate accessibility problems. In regions such as Sub-Saharan Africa, this dimension often signifies the population’s basic physical access to electricity.
- Affordability concerns the economic dimension of energy security, namely the cost of energy to the economy and society [16,17]. Energy should be available at prices that are acceptable, do not impede economic growth, and do not unduly burden households. Indicators include wholesale and retail energy prices, the share of household budgets devoted to energy, and price stability. This dimension links energy security to a country’s wider economic security.
- Acceptability encompasses the environmental and social acceptability of energy sector activities and the technologies employed [8]. Its importance has grown markedly with the advent of climate policy imperatives. Indicators include emission levels, the share of clean sources (renewables, nuclear) in the energy mix, and the incidence of social opposition to infrastructure projects [18,19]. In the EU, energy policy is tightly intertwined with climate policy; the drive toward climate neutrality necessitates a transformation of the energy mix, which can pose challenges for supply security and price stability.
3.2.2. Ex Post vs. Ex Ante Indicators
3.2.3. Composite Aggregate Indices
3.2.4. Indicator Matrices and Multi-Criteria Approaches
3.2.5. Rankings and Institutional Indicators
3.3. Energy Poverty and Energy Security
- Low household income.
- High energy prices (relative to income).
- Affordability. This is the most direct and visible linkage. When energy costs account for an excessively high share of household budgets, households may be forced to reduce their energy consumption below necessary levels or sacrifice other basic needs (e.g., food, medicine, education) to pay utility bills [17,28,29].
- Availability/Accessibility. While access to electricity networks is nearly universal in most EU countries, certain regions—especially rural, remote, or less developed areas—may still lack access to modern energy infrastructure, such as gas grids or stable electricity networks capable of supporting modern heating systems [25]. Limited access to more efficient or affordable energy carriers may compel residents to rely on more expensive (e.g., electric resistance heating) or environmentally and health-wise harmful alternatives (e.g., low-quality solid fuels).
- Acceptability. This dimension relates to energy poverty, primarily through the quality of housing stock. Poor energy performance of buildings (e.g., lack of insulation, leaky windows), which significantly increases energy demand, is often associated with broader housing deficiencies such as dampness and mold, which negatively impact residents’ health and comfort [29]. Improving energy standards in buildings—part of efforts toward greater environmental acceptability (e.g., emission reductions) and social acceptability (e.g., improved living conditions)—is also a key tool for combating energy poverty [24]. Additionally, low-income households may be forced to rely on energy sources that are cheap but environmentally or health-wise unacceptable.
4. Energy Poverty in the European Union
4.1. Definitions and Indicators
- Inability to Keep Home Adequately Warm (Eurostat code: ilc_mdes01)
- –
- Definition: This indicator measures the share of individuals in the population who report that their household cannot afford to keep their home adequately warm. The EU-SILC survey question refers to the subjective assessment of the household’s financial ability to maintain an adequate indoor temperature, regardless of whether the household actually experiences the need for heating at the time of the survey.
- –
- Relevance to Energy Poverty: This is one of the most direct indicators reflecting the inability to meet a basic energy need—thermal comfort—due to financial constraints. A high value of this indicator directly points to issues of energy affordability related to heating.
- –
- Limitations: The main limitation is the subjectivity of the assessment. As pointed out by the EU Energy Poverty Observatory [33], what constitutes an ’adequate temperature’ may vary significantly not only due to individual preferences, age, or gender but also across countries due to different climatic conditions and cultural norms regarding thermal comfort. This can introduce a regional bias, where the same response might reflect different objective conditions in different parts of the EU.
- Arrears on Utility Bills (Eurostat code: ilc_mdes07)
- –
- Definition: This indicator measures the share of individuals living in households that, over the past 12 months, have been in arrears on utility bills (heating, electricity, gas, water) due to financial difficulties. The EU-SILC survey asks, `In the last twelve months, has the household been in arrears, meaning unable to pay on time due to financial difficulties, utility bills (heating, electricity, gas, water) for the main dwelling?’
- –
- Relevance to Energy Poverty: Arrears on utility bills are a clear signal of a household’s financial struggles in covering basic living expenses, including energy costs. It is considered an objective (though self-reported) indicator of payment difficulties.
- –
- Limitations: The indicator includes all utility bills, including water, and not solely energy-related bills, which may slightly overestimate the extent of strictly energy-related poverty. More importantly, it does not capture so-called `hidden energy poverty,’ where households avoid arrears by drastically reducing their energy consumption, often below levels necessary for comfort and health. Additionally, it does not account for the presence of support mechanisms, such as social tariffs, emergency assistance, or installment payment plans, which may help households avoid arrears despite financial hardship.
- Housing Cost Overburden Rate (Eurostat code: ilc_lvho07c)
- –
- Definition: This indicator measures the percentage of the population living in households where total housing costs (after the deduction of housing allowances) exceed 40% of the household’s disposable income (also after deduction of housing allowances). Housing costs include rent (for tenants), mortgage interest payments (for owners), utility bills (water, electricity, gas, heating), insurance, local taxes, and the costs of regular maintenance and repairs.
- –
- Relevance to Energy Poverty: Although this indicator measures the overall burden of housing costs rather than energy costs specifically, it is relevant because energy expenditures often constitute a significant part of total housing expenses. Excessive housing costs can restrict a household’s ability to meet other basic needs and may signal a risk of energy poverty, particularly when combined with the low energy efficiency of the dwelling.
- –
- Limitations: The 40% income threshold is set arbitrarily. The indicator covers a broad range of housing costs, not just energy-related expenses, meaning that a high value does not necessarily point to problems with energy costs specifically. Moreover, it does not directly measure thermal comfort or energy efficiency.
- At-Risk-of-Poverty Rate (AROP) (Eurostat code: ilc_li02)
- –
- Definition: The at-risk-of-poverty (AROP) rate measures the proportion of individuals whose equivalent disposable income (after social transfers) falls below the at-risk-of-poverty threshold, set at 60% of the national median equivalent disposable income (after social transfers). Equivalent disposable income is calculated by adjusting household income for household size and composition using the modified OECD equivalence scale.
- –
- Relevance to Energy Poverty: Low income is one of the three main risk factors for energy poverty. Individuals at risk of income poverty, by definition, have limited financial resources, making it more difficult for them to afford energy costs, especially in the context of high prices or poor energy efficiency of their dwellings. AROP serves as a key contextual indicator for analyzing energy poverty. It is also one of the three components of the broader AROPE indicator (At Risk of Poverty or Social Exclusion).
- –
- Limitations: AROP is a relative, not an absolute measure—the poverty threshold depends on the overall income level in a given country and year. This means that a person considered at risk of poverty in one country might not be classified as such in another. Moreover, this indicator does not directly measure energy expenditure, housing conditions, or thermal comfort.
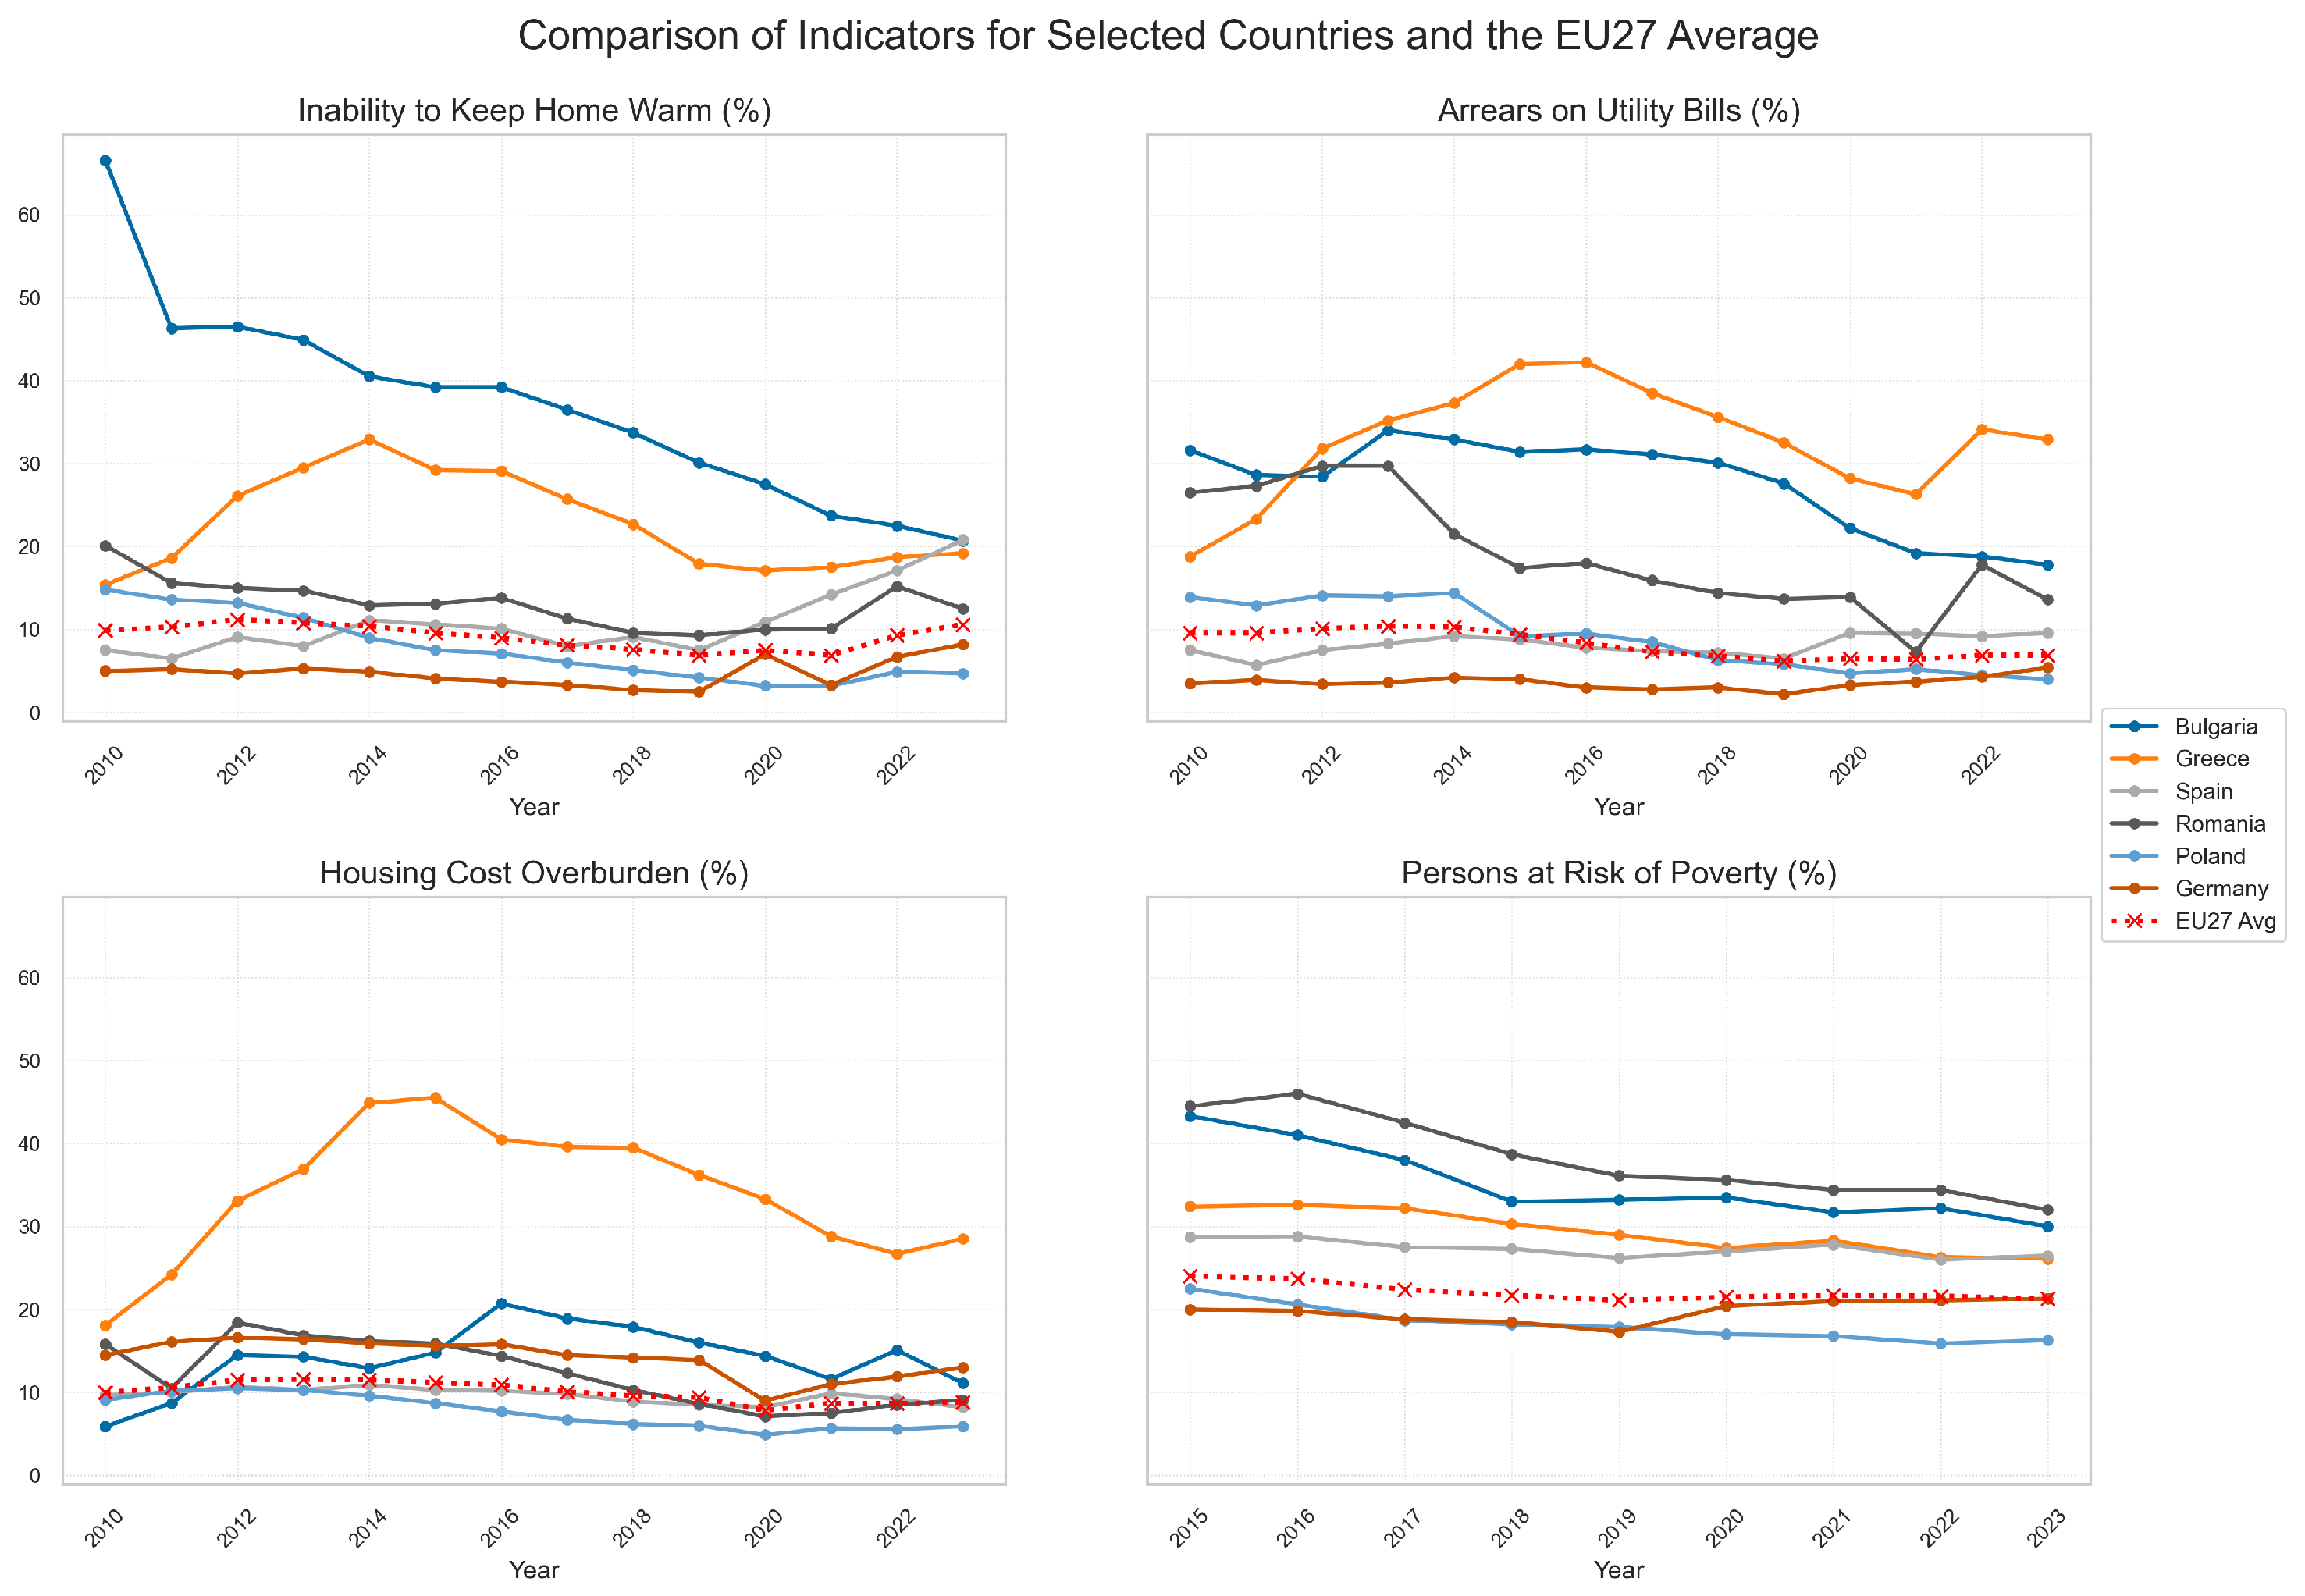
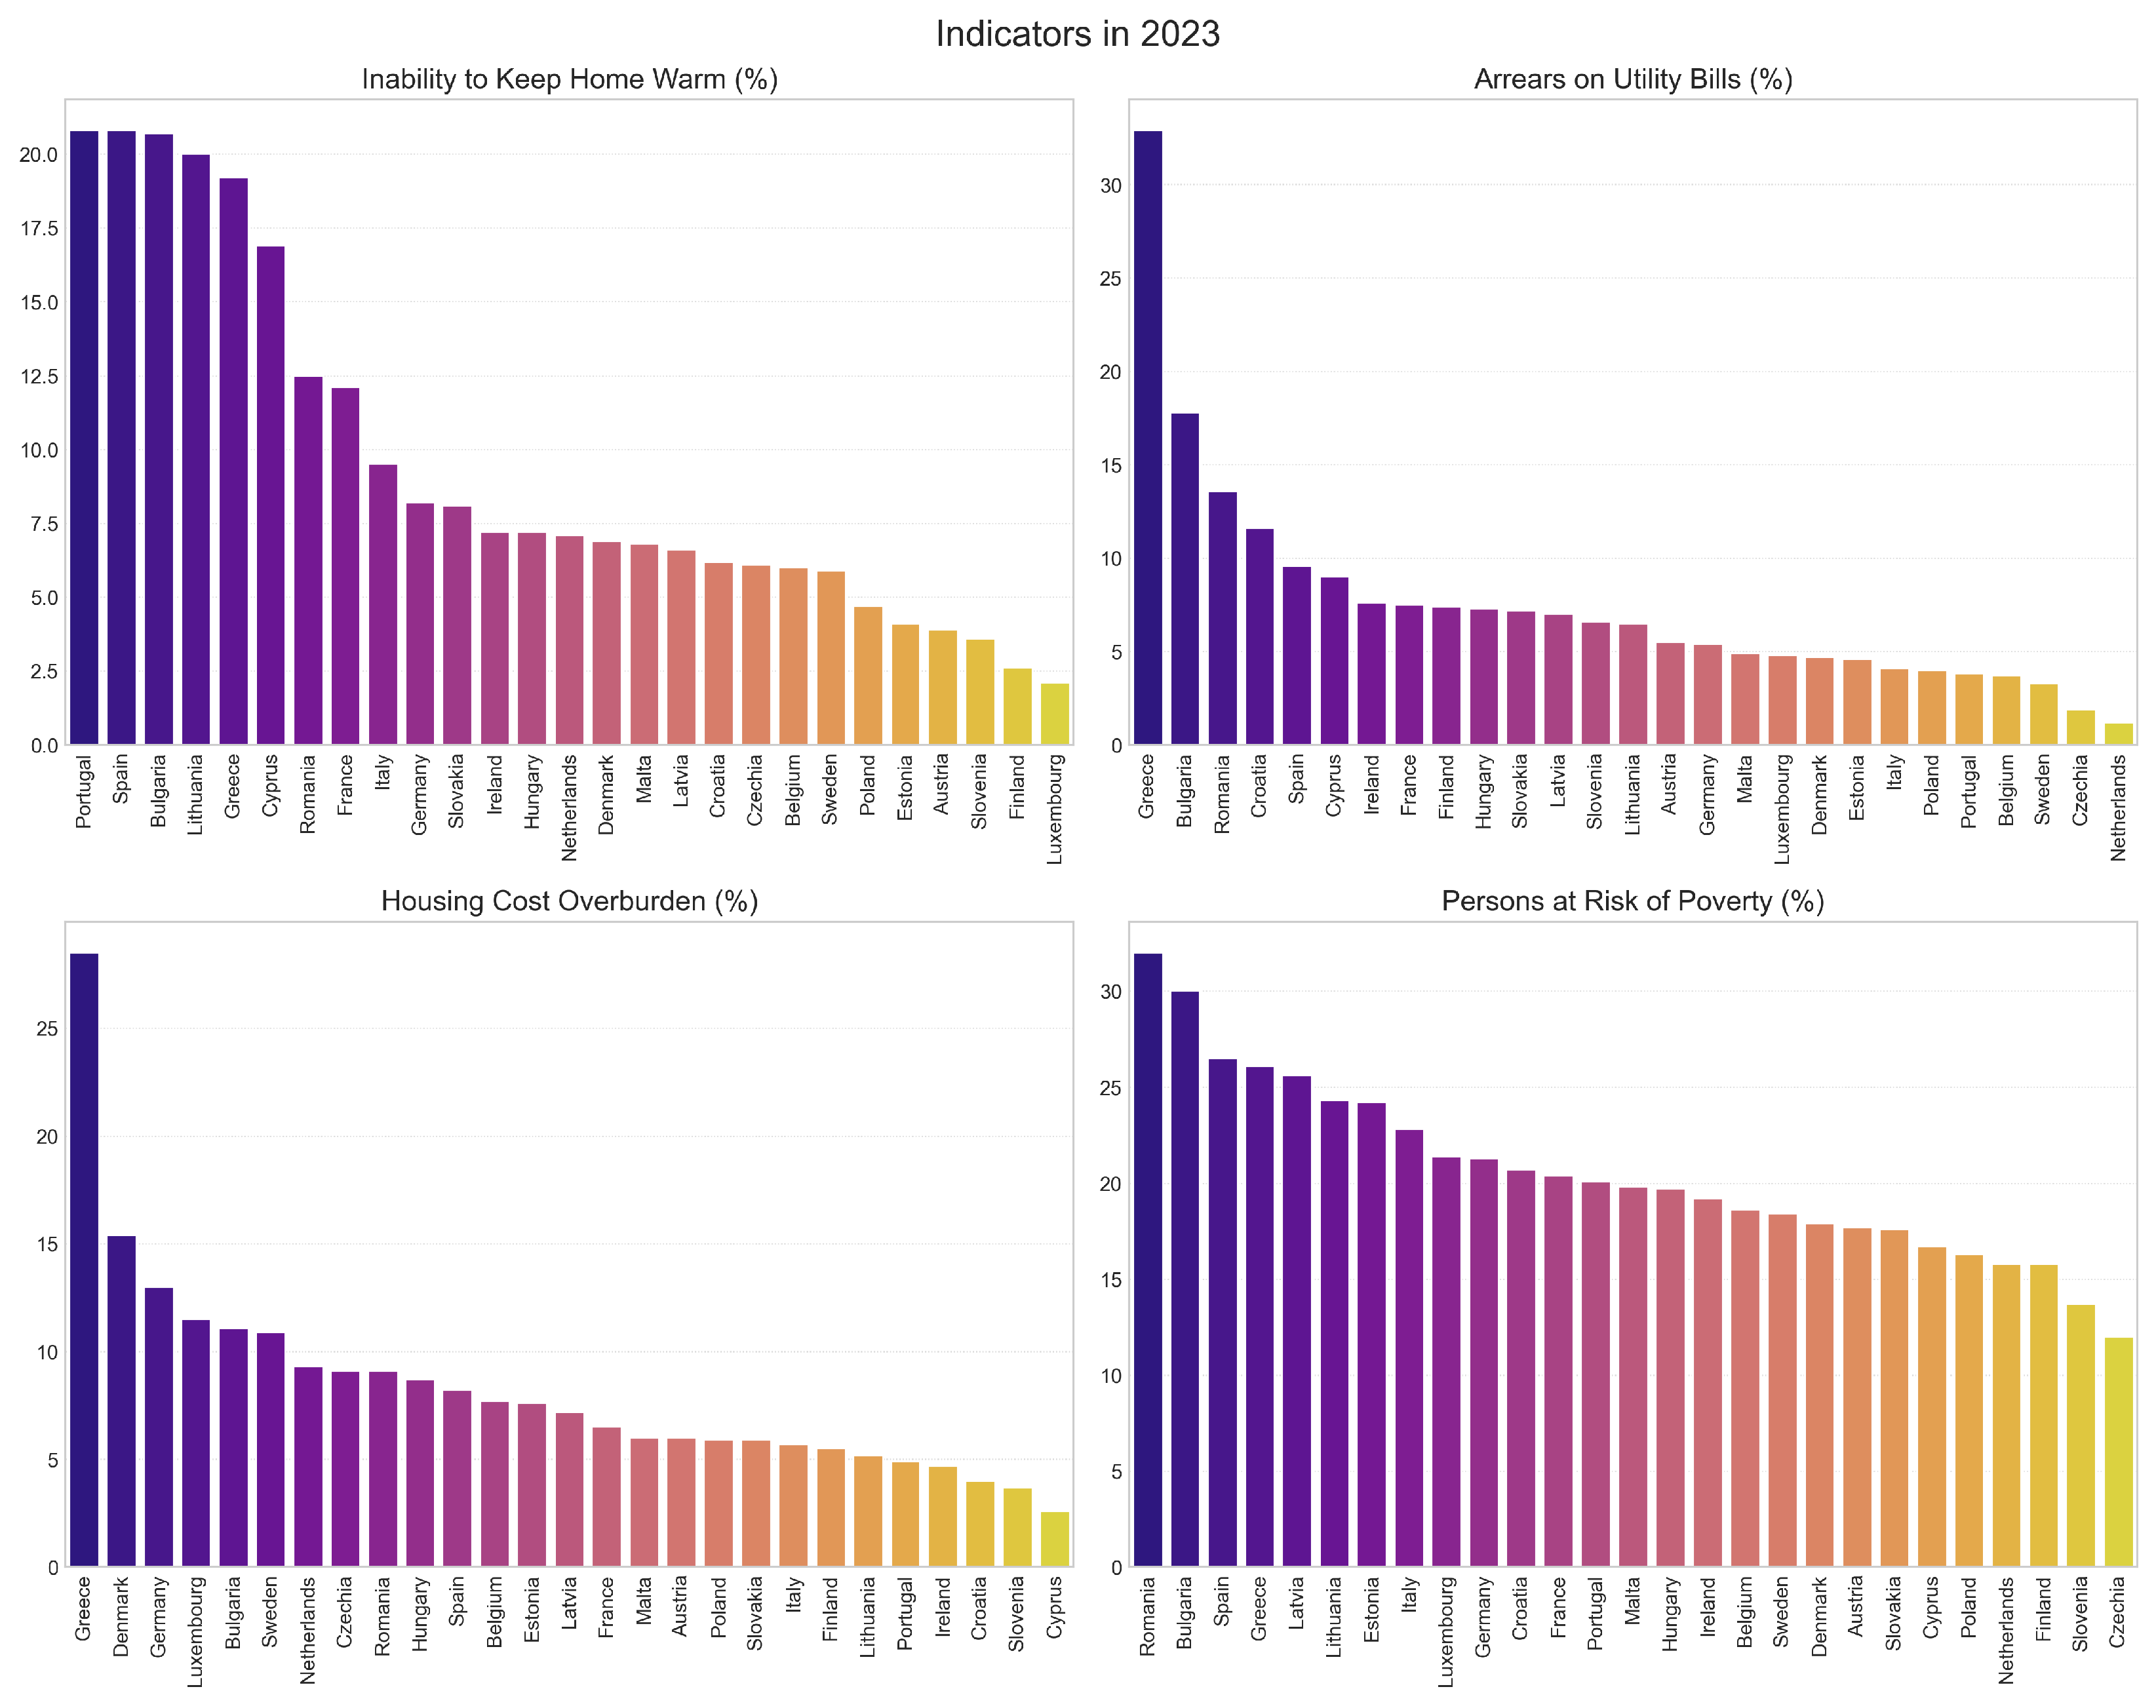
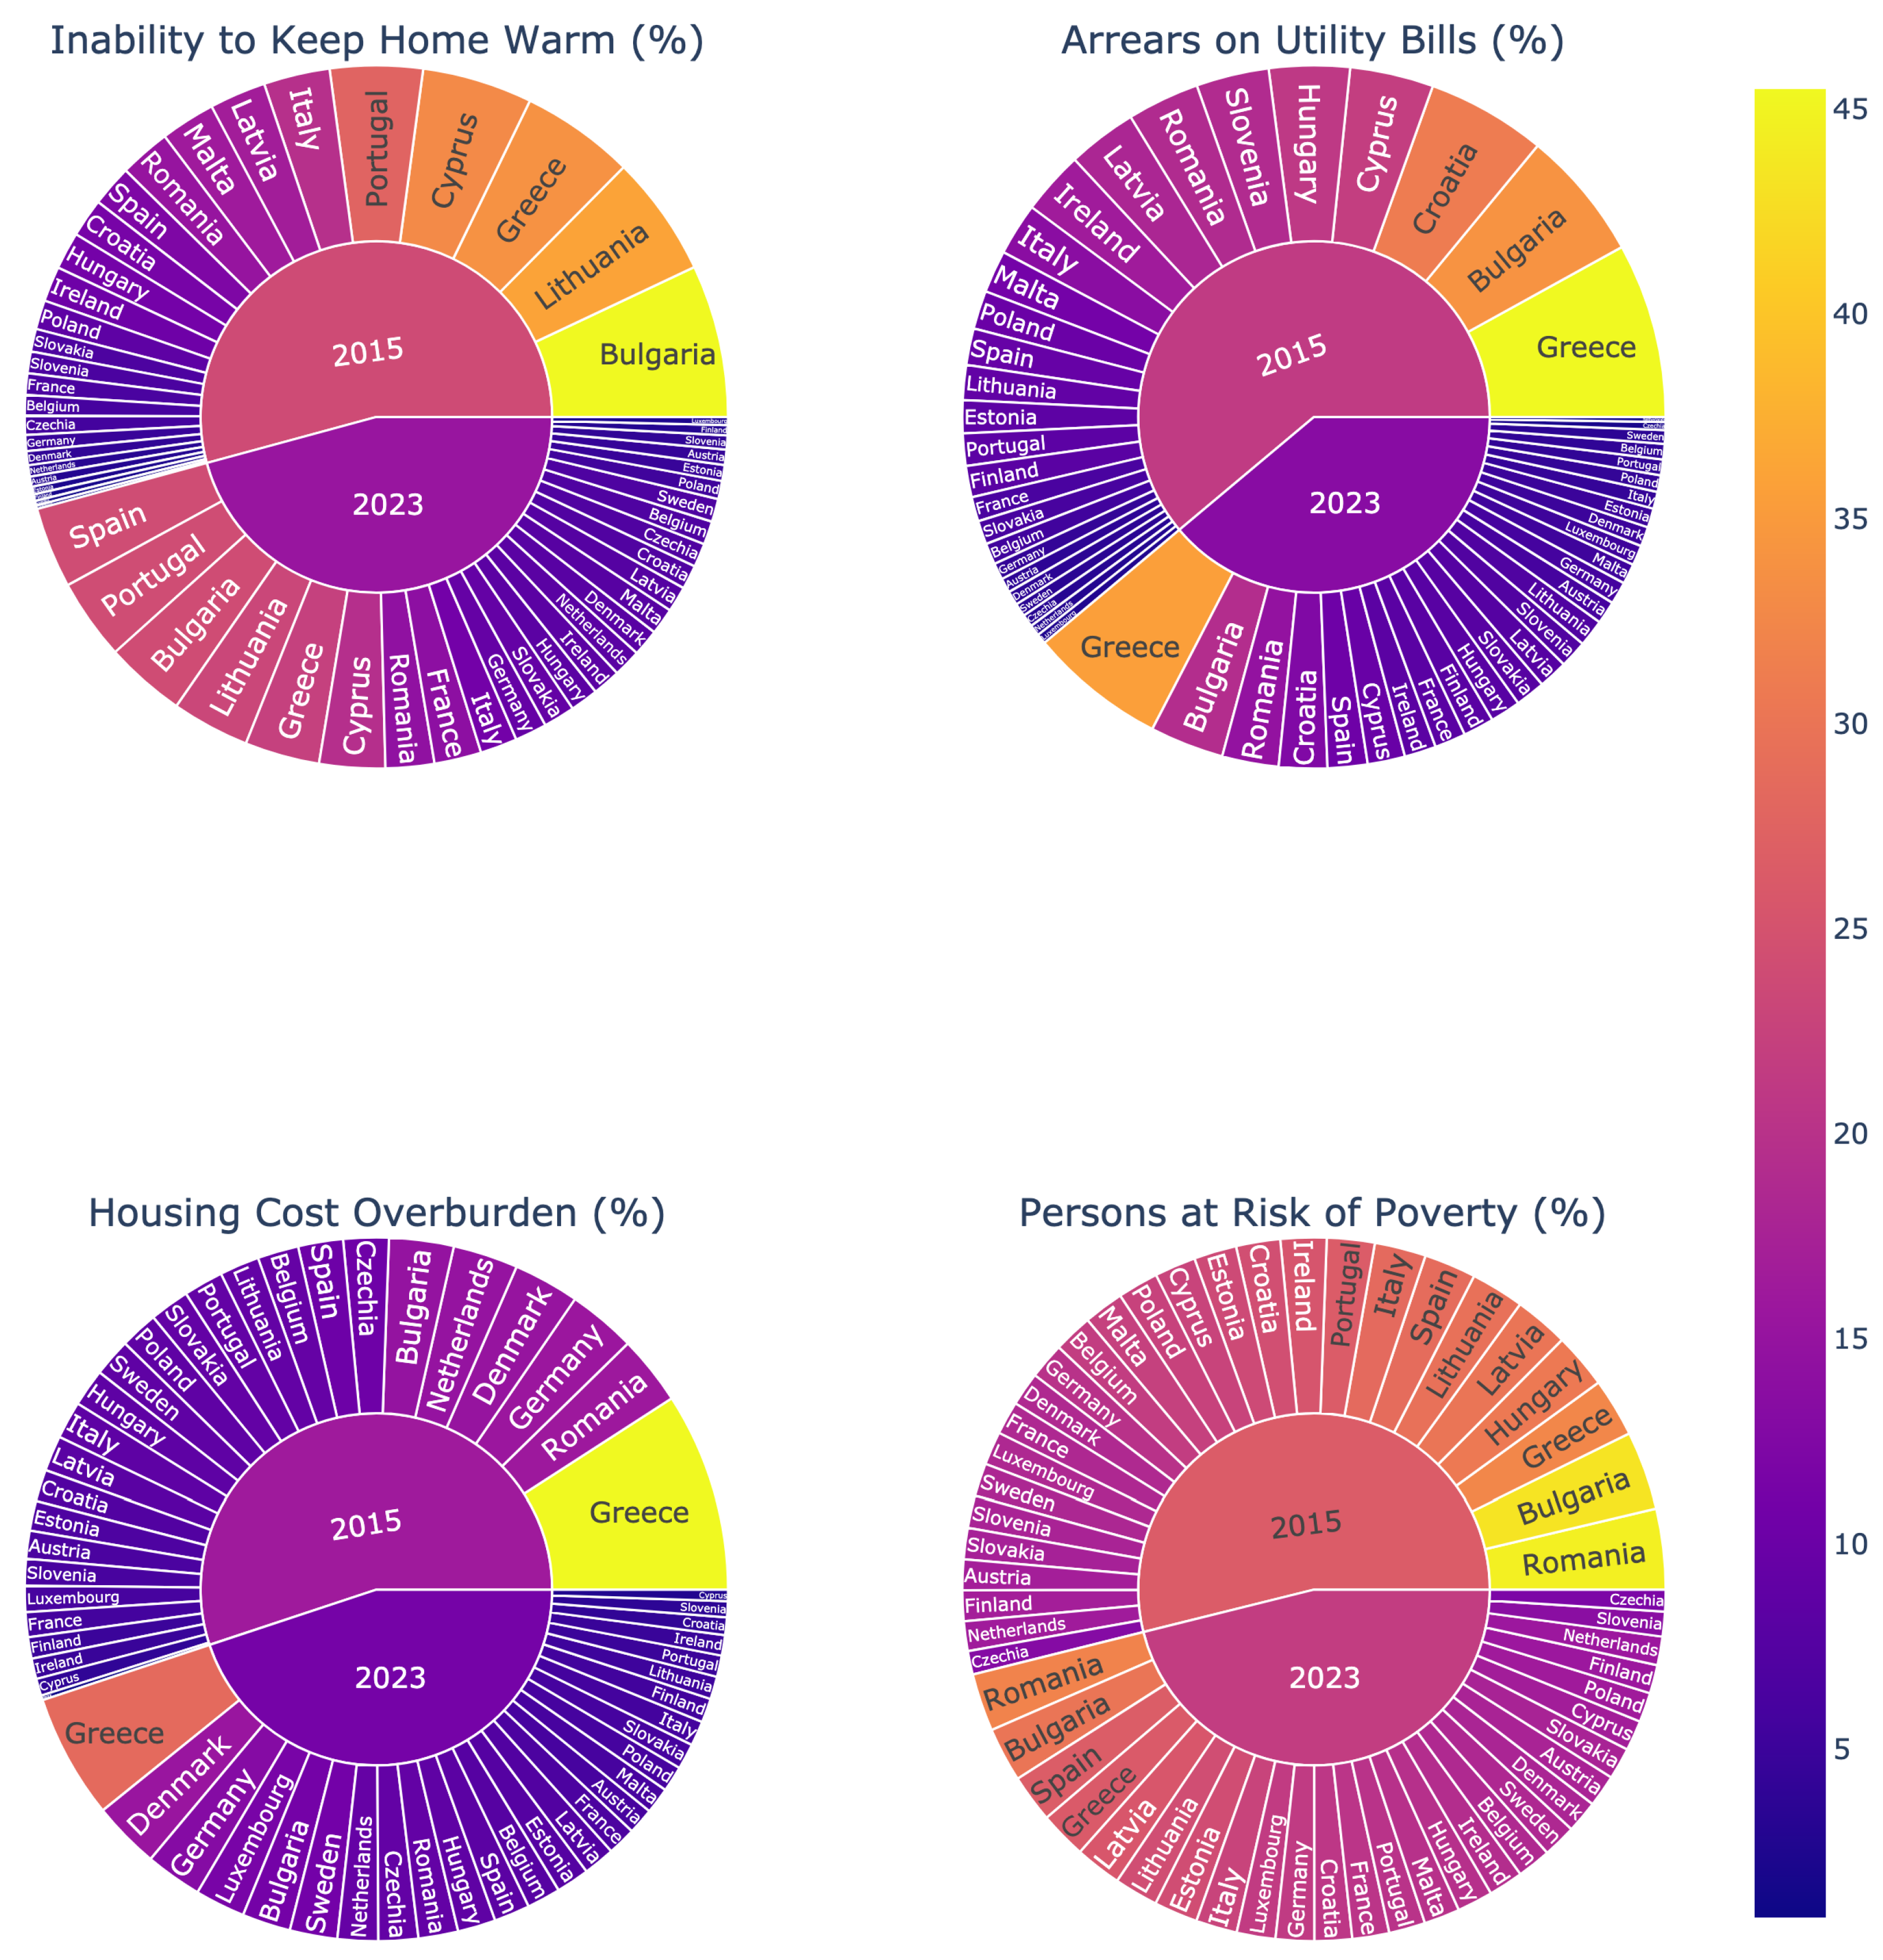
4.2. Analysis of Trends of Selected Indicators in European Union Countries
5. Cluster Analysis
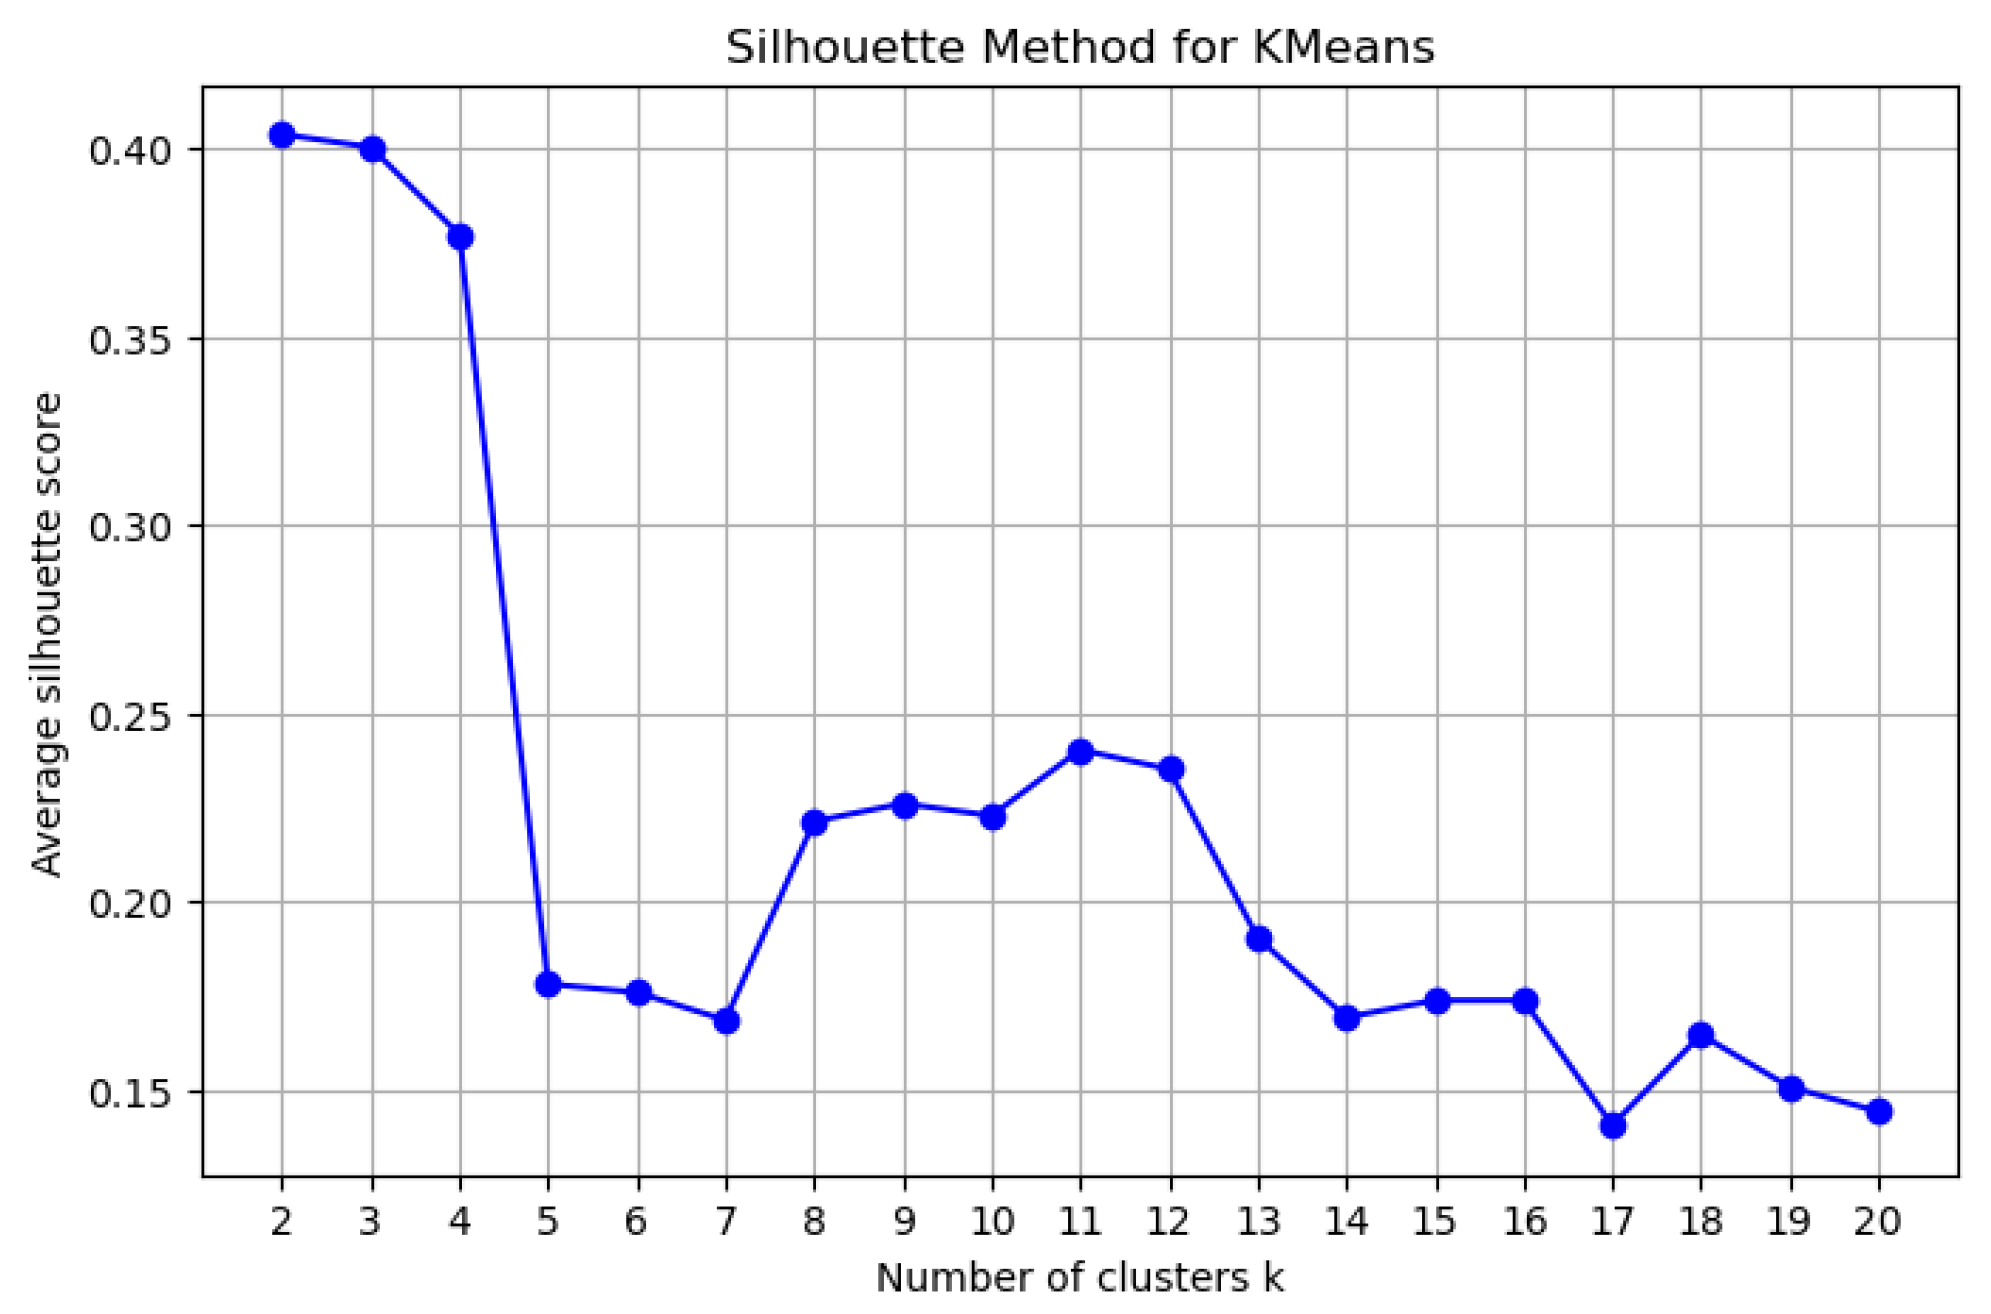
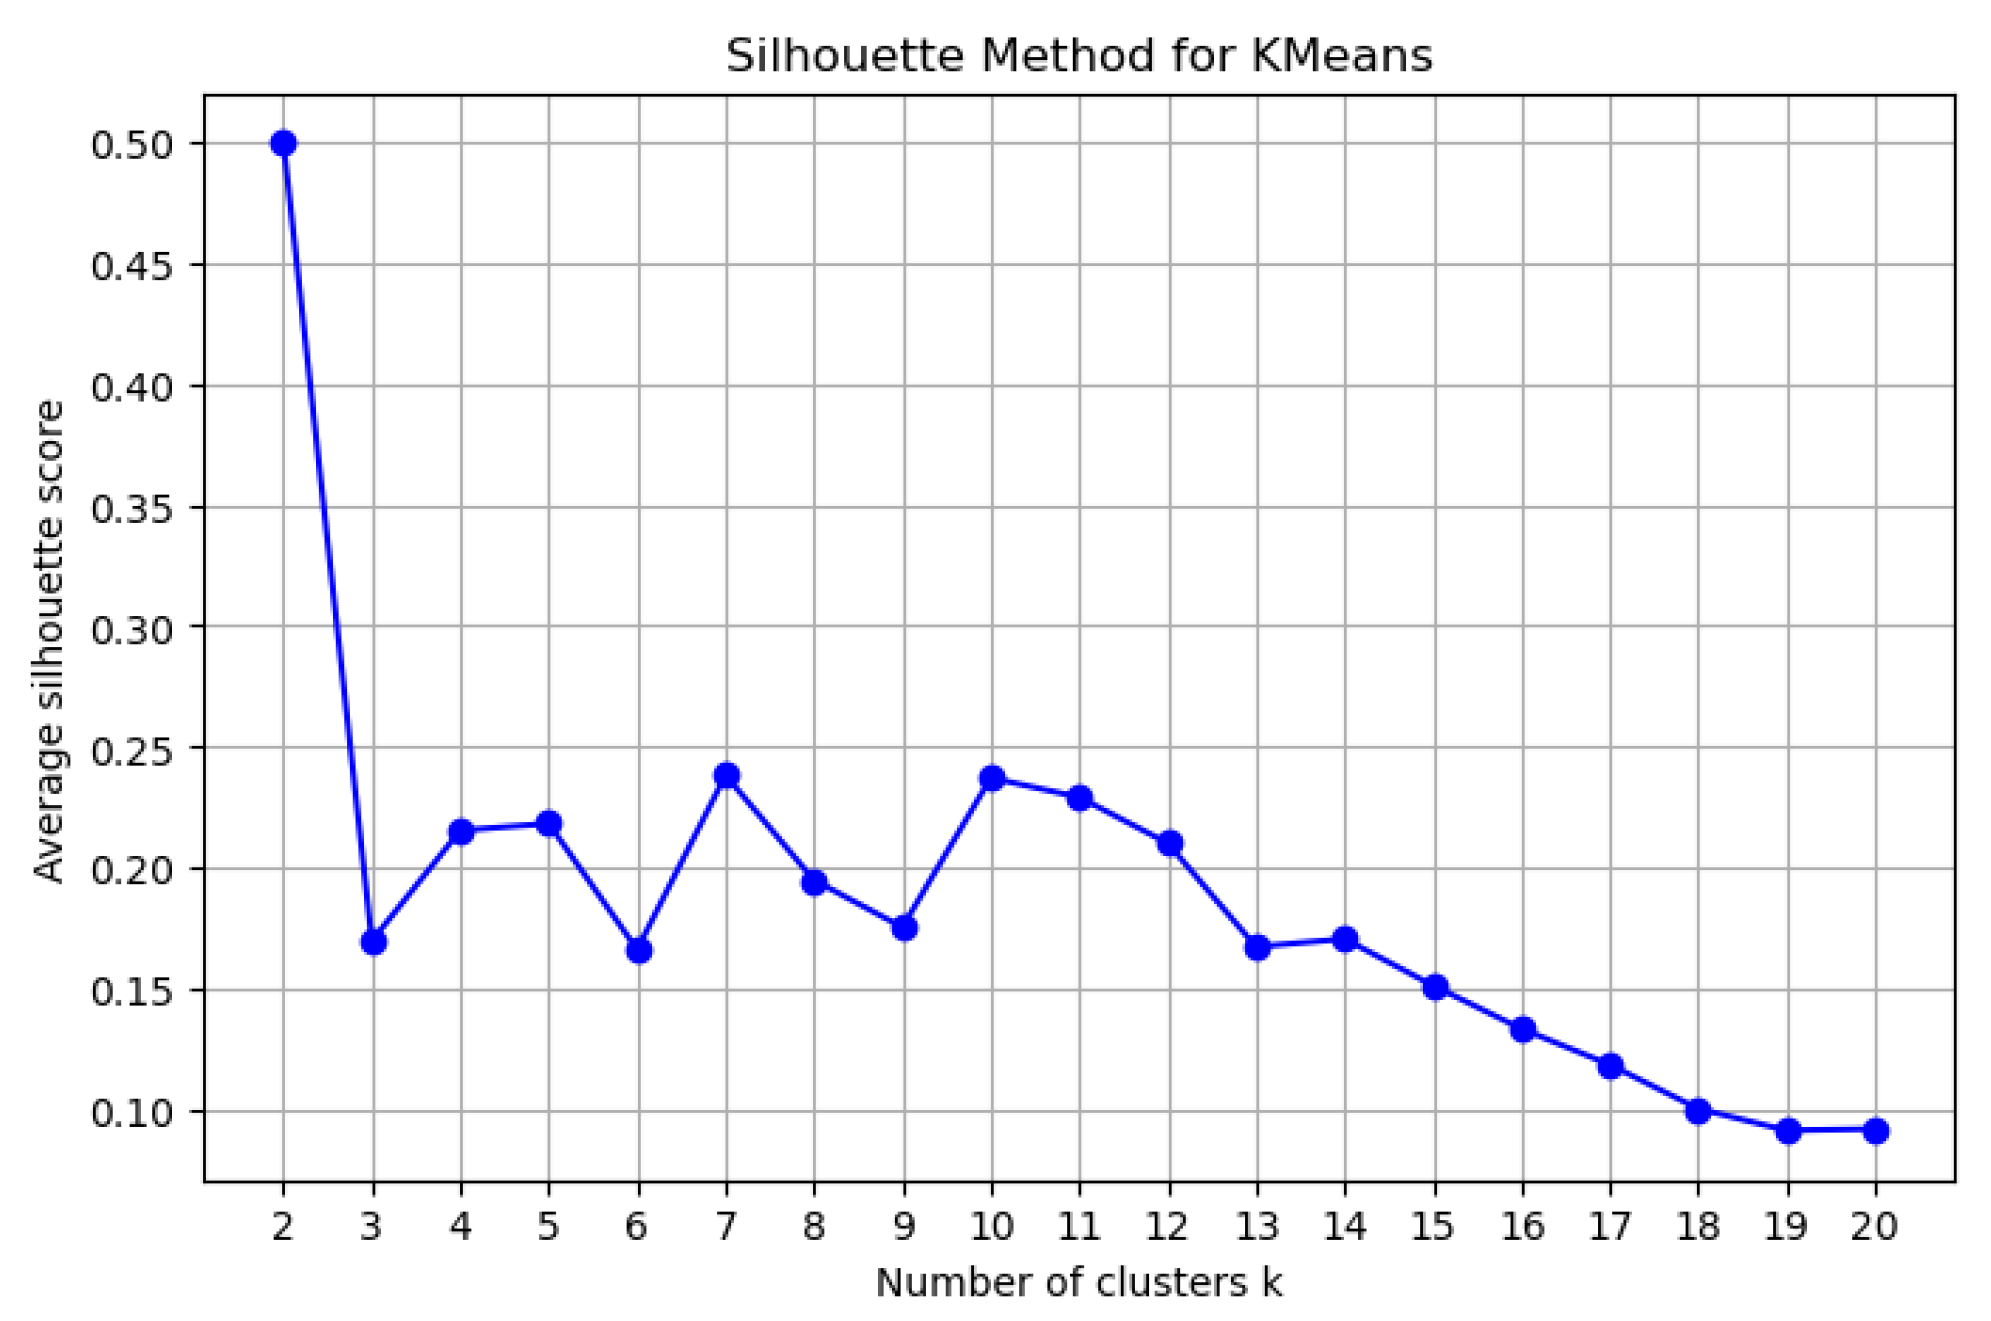
5.1. Theoretical Introduction
5.2. Results
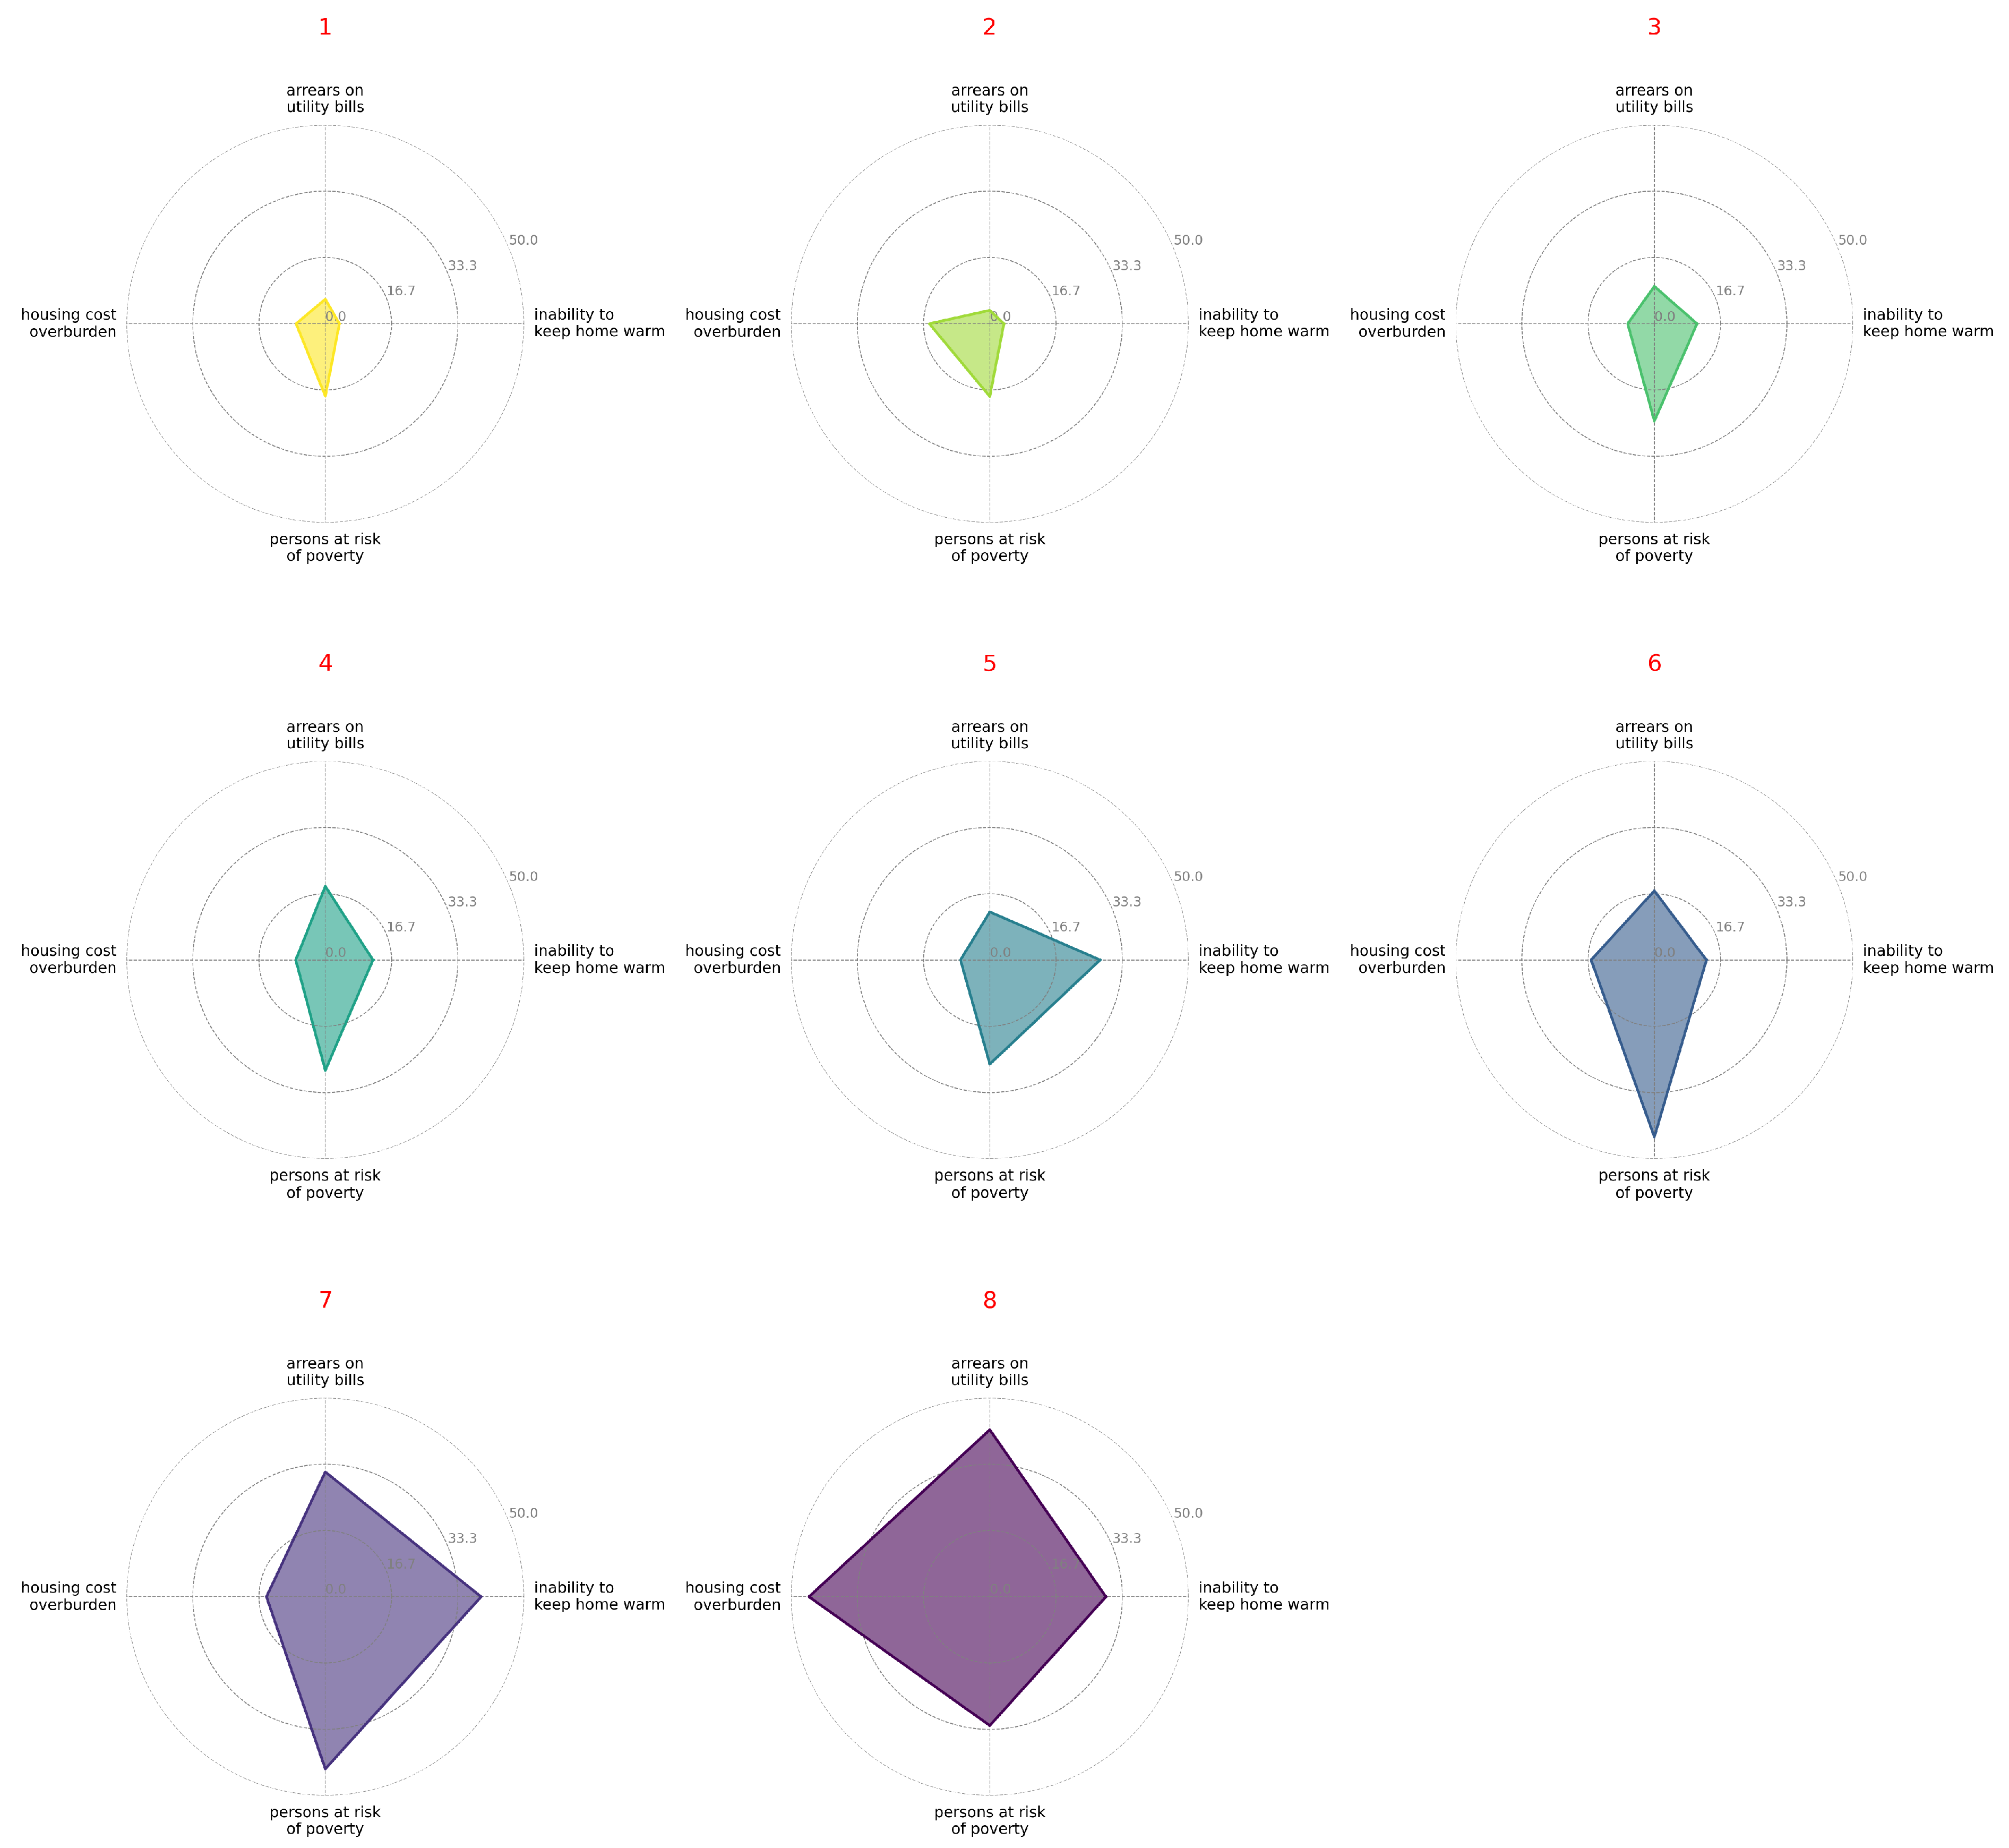
5.2.1. Cluster Profiles for 2015
- Cluster 1:
- Lowest-risk group. Only 3.6% of the population was unable to keep their dwelling adequately warm, and 6.2% was in arrears on utility bills. The incidence of housing cost over-burden (defined as housing costs exceeding 40% of disposable income) was 7.4%, while the at-risk-of-poverty rate stood at 18.2%. This cluster was composed mainly of the wealthiest `old-EU’ economies with extensive welfare systems and high building energy efficiency. Countries: Austria, Belgium, Czechia, Estonia, Finland, France, Luxembourg, Sweden, Slovenia, and Slovakia.
- Cluster 2:
- Very low-risk group with high housing costs. Arrears were virtually negligible (3.4%), and the inability to heat affected only 3.5% of residents. By contrast, the housing-cost over-burden rate reached 15.2%. The profile is consistent with high-income countries where energy poverty is rare but housing (rents, mortgages) is expensive. Countries: Germany, Denmark, and the Netherlands.
- Cluster 3:
- Moderate-risk group with low housing costs. On average, 10.7% of the population could not afford adequate heating, and 9.4% were in arrears—figures slightly above Clusters 1–2 but still below the 2015 EU mean of roughly 11%. The housing-cost burden was very modest (6.7%), and the at-risk-of-poverty rate was 24.5%. Countries: Spain, Malta, and Poland.
- Cluster 4:
- Moderate risk with high arrears. Arrears were markedly higher (18.5%), while the share unable to heat was 12.0%. The poverty rate reached 27.8%, and the housing-cost burden 7.4%, pointing to somewhat weaker economic fundamentals than in Cluster 3. Countries: Croatia, Hungary, Ireland, Italy, and Latvia.
- Cluster 5:
- High risk driven by heating deprivation. A striking 27.7% of residents could not keep their dwelling warm, yet arrears (12.1%) and housing-cost burden (7.4%) were moderate. The poverty rate was 26.2%. Countries: Cyprus, Lithuania, and Portugal.
- Cluster 6:
- High poverty with moderate energy indicators. An exceptional 44.5% of the population was at risk of poverty, whereas 13.1% lacked adequate warmth, 17.4% were in arrears, and 15.9% faced housing-cost over-burden. Countries: Romania.
- Cluster 7:
- Very high energy-poverty risk. Roughly 39.2% of inhabitants were unable to heat their homes, 31.4% were in arrears, and 43.3% were at risk of poverty—alarmingly high across all dimensions. Countries: Bulgaria.
- Cluster 8:
- Extreme financial strain (highest-risk group). While the share unable to heat (29.2%) was slightly below Cluster 7, an unprecedented 42.0% of the population was in arrears, and 45.5% faced housing cost over-burden; the poverty rate was 32.4%. This extreme value for housing cost overburden reflects the severe and unique economic context of Greece in 2015, which was still grappling with the effects of the sovereign debt crisis, leading to a sharp decline in disposable incomes against relatively inflexible housing costs. Countries: Greece.
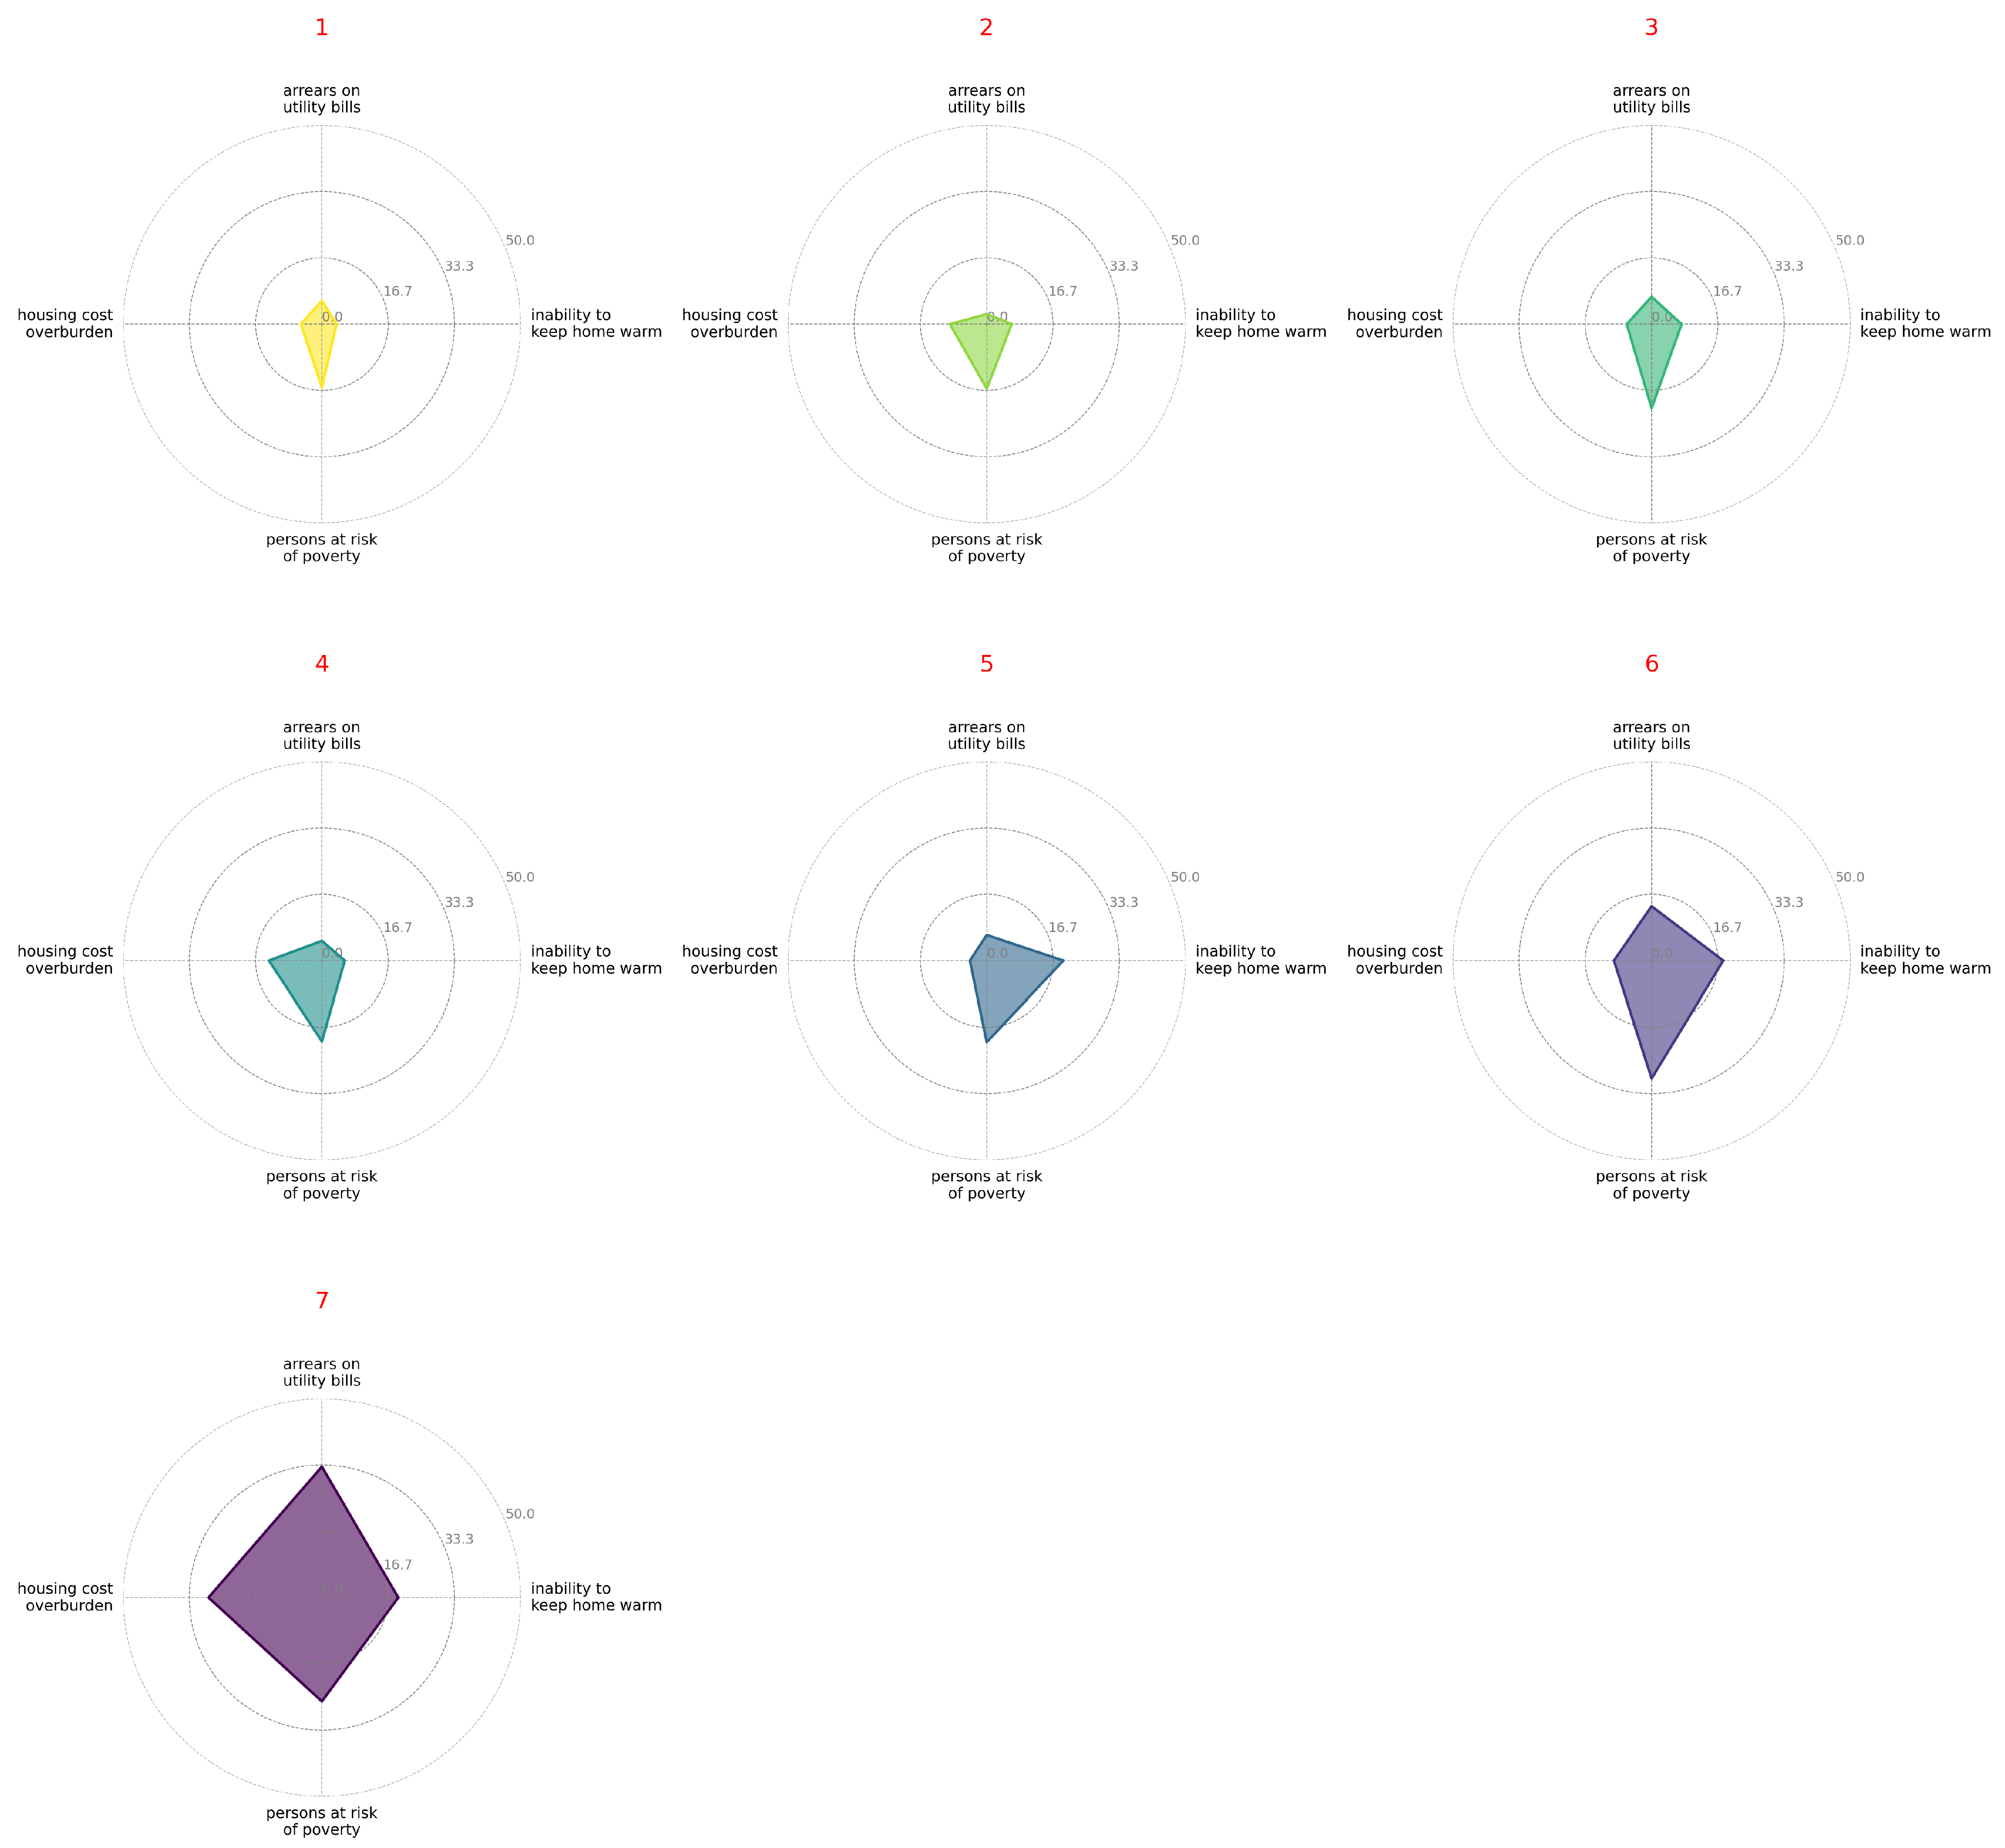
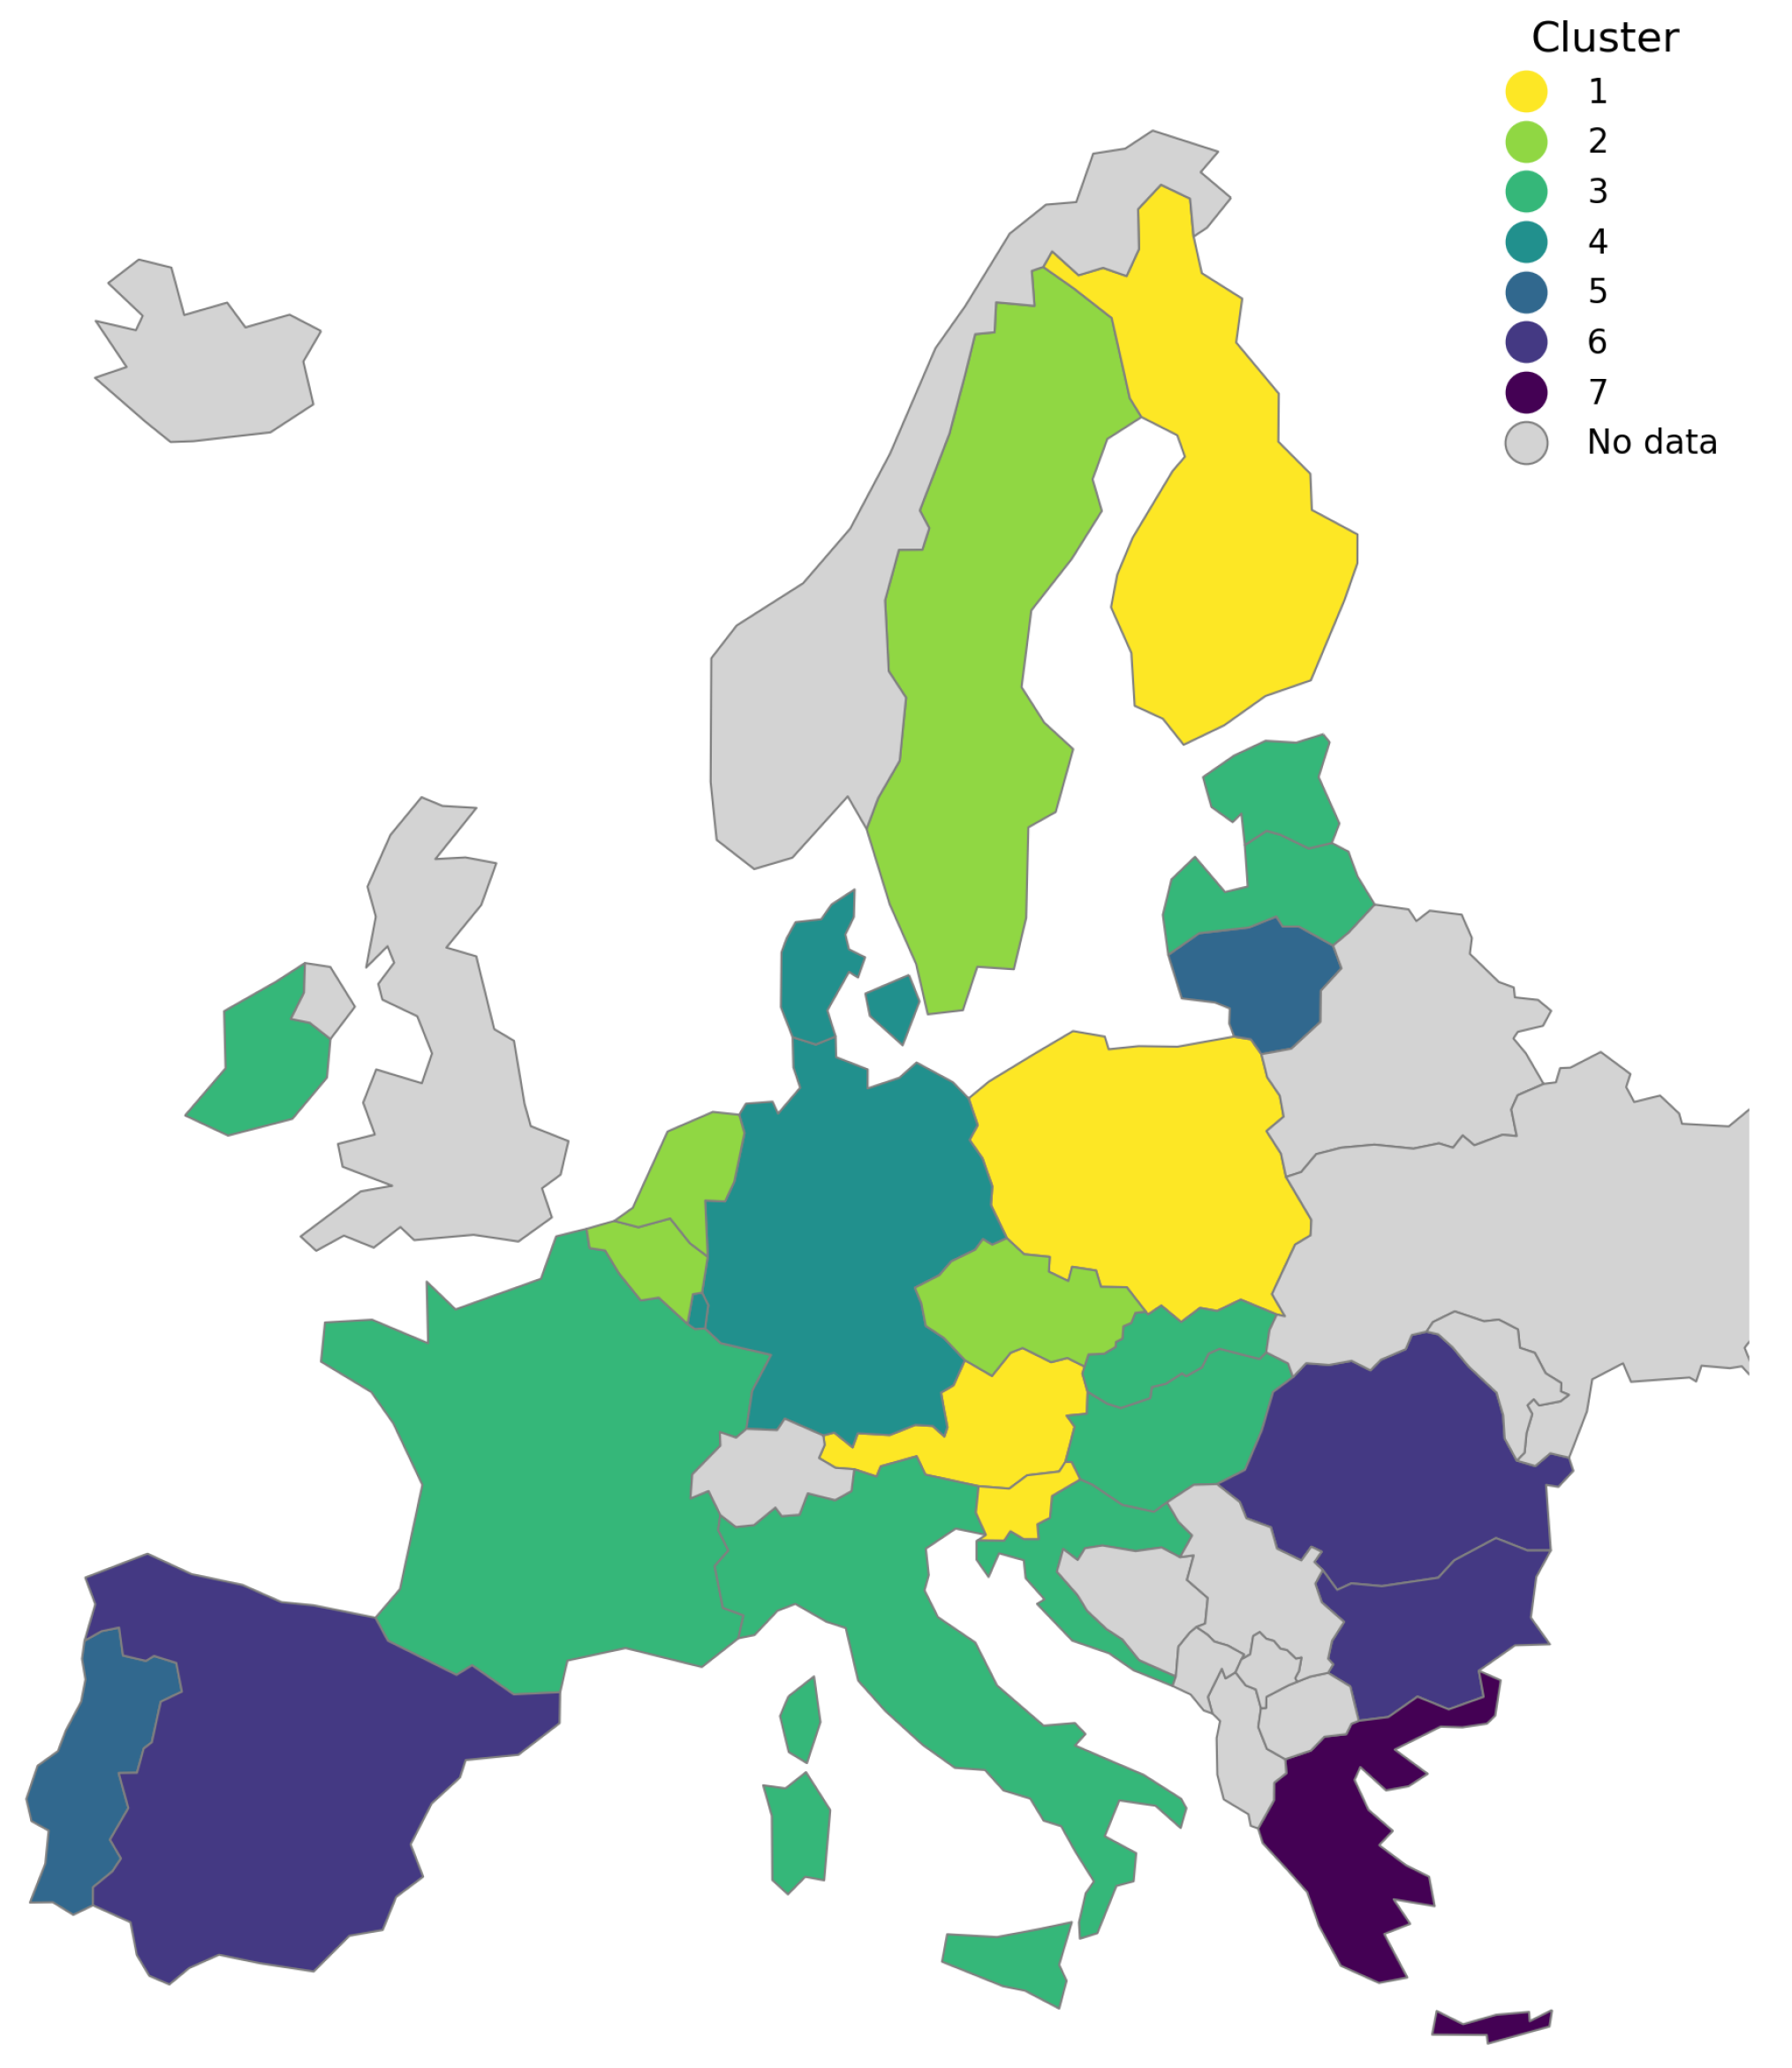
5.2.2. Cluster Profiles for 2023
- Cluster 1:
- Lowest-risk group. The average for direct thermal deprivation is only 3.7% and 5.9% for being in arrears on utility bills. Housing-cost over-burden affected 5.3%, while the at-risk-of-poverty rate dropped to 15.9%. Countries: Austria, Finland, Poland, and Slovenia.
- Cluster 2:
- Very low risk with minimal arrears. This cluster shows the lowest arrears mean in the sample (2.5%) and a small share of residents unable to heat (6.3%). The housing cost over-burden is somewhat higher (9.3%); the poverty rate is 16.2%. Countries: Belgium, Czechia, Netherlands, and Sweden.
- Cluster 3:
- Low-risk catching-up group. Thermal deprivation stands at 7.5%, arrears at 6.9%, and poverty at 21.1%. Countries: Estonia, France, Croatia, Hungary, Ireland, Italy, Latvia, Malta, and Slovakia.
- Cluster 4:
- Moderate risk with high housing costs. Thermal deprivation (5.7%) and arrears (5.0%) are comparable to Clusters 1–3, but the housing-cost over-burden peaks at 13.3%. The poverty rate is 20.2%. Countries: Germany, Denmark, Luxembourg.
- Cluster 5:
- Structural energy deprivation. A high 19.2% of residents live in inadequately heated dwellings, but only 6.4% are in arrears and 4.2% face excessive housing costs; poverty stands at 20.4%. Countries: Cyprus, Lithuania, and Portugal.
- Cluster 6:
- High-risk peripheral group. Roughly 18.0% cannot heat their homes; 13.7% are in arrears; 9.5% bear excessive housing costs; and nearly 29.5% are at risk of poverty. Countries: Bulgaria, Spain, and Romania.
- Cluster 7:
- Highest-risk group. Thermal deprivation affects 19.2% of the population; arrears reach 32.9%; housing cost over-burden stands at 28.5%; and the poverty rate is 26.1%. Countries: Greece.
5.2.3. Key Changes Between 2015 and 2023
- Improvements in Central and Eastern Europe:
- –
- Poland demonstrated significant improvement, transitioning from Cluster 3 (moderate risk, low housing costs) in 2015 to Cluster 1 (lowest risk) in 2023.
- –
- Slovenia maintained its position in Cluster 1 (lowest risk).
- –
- Czechia moved from Cluster 1 to Cluster 2 (very low risk with minimal arrears).
- –
- Slovakia and Estonia transitioned from Cluster 1 to Cluster 3 (low-risk catching-up group).
- –
- Croatia, Hungary, and Latvia improved their positions, moving from Cluster 4 (moderate risk with high arrears) to Cluster 3.
- –
- Bulgaria, although still in a high-risk group, improved its position, transitioning from Cluster 7 (very high-risk) to Cluster 6 (high-risk peripheral group).
- –
- Lithuania remained in Cluster 5, characterized by structural energy deprivation.
- Maintenance of Low Risk or Minor Changes in Northern and Western Europe:
- –
- Austria and Finland remained in Cluster 1 (lowest risk).
- –
- Belgium and Sweden moved from Cluster 1 to Cluster 2.
- –
- The Netherlands remained in Cluster 2.
- –
- France transitioned from Cluster 1 to Cluster 3.
- –
- Germany, Denmark, and Luxembourg moved from Cluster 2 (Germany, Denmark) and Cluster 1 (Luxembourg) to Cluster 4 (moderate risk with high housing costs).
- –
- Ireland improved its position from Cluster 4 to Cluster 3.
- Deterioration or Persistence of High Risk in Southern Europe:
- –
- Spain experienced a notable deterioration, moving from Cluster 3 (moderate risk) to Cluster 6 (high-risk peripheral group). This significant negative shift can be attributed to the severe impact of the post-2021 energy price crisis on households, likely exacerbated by a high dependency on volatile gas prices in its electricity mix and pre-existing structural vulnerabilities that were not fully mitigated by policy interventions.
- –
- Italy and Malta transitioned from Cluster 4 and Cluster 3, respectively, to Cluster 3, signifying an improvement for Italy and a similar risk level for Malta.
- –
- Portugal and Cyprus remained in Cluster 5 (structural energy deprivation).
- –
- Romania remained in Cluster 6 (high risk), although the source text mentions moderate improvement in its indicators.
- –
- Greece moved from Cluster 8 (extreme financial strain, highest-risk group) to Cluster 7 (the highest-risk group in the new 7-cluster structure), still remaining among the most vulnerable countries.
6. Conclusions
- A ’convergence scenario’, where the effective implementation of EU and national policies, such as the SCF, combined with sustained investments in energy efficiency, leads to a continued narrowing of the energy poverty gap between Member States. This would be driven by significant improvements in the Southern, Central, and Eastern European countries identified in the higher-risk clusters.
- An alternative ’divergence scenario’, in which future energy market shocks, an economic slowdown, or the insufficient implementation of protective measures could deepen existing divides. In such a scenario, the most vulnerable countries could face further marginalization, undermining the EU’s social cohesion goals and the fairness of the green transition.
Funding
Data Availability Statement
Acknowledgments
Conflicts of Interest
Abbreviations
| EU | European Union |
| EU-SILC | European Union Statistics on Income and Living Conditions |
| COVID-19 | Coronavirus Disease 2019 |
| IDE | Integrated Developmnet Environment |
| CSES | Comprehensive Security of Energy Systems |
| LNG | Liquefied Natural Gas |
| AESPI | Aggregated Energy Security Performance Indicator |
| SCF | Social Climate Fund |
| EED | Energy Efficiency Directive |
| AROP | At-Risk-of-Poverty |
| OECD | Organisation for Economic Co-operation and Development |
| AROPE | At-Risk-of-Poverty or Social Exclusion |
| EU27 | European Union 27 |
| pp | Percentage Points |
| WSS | Within-cluster Sum of Squares |
References
- Kosowski, P.; Kosowska, K.; Janiga, D. Primary Energy Consumption Patterns in Selected European Countries from 1990 to 2021: A Cluster Analysis Approach. Energies 2023, 16, 6941. [Google Scholar] [CrossRef]
- Kosowski, P. From Fossil Fuels to Renewables: Clustering European Primary Energy Production from 1990 to 2022. Energies 2024, 17, 5596. [Google Scholar] [CrossRef]
- R Core Team. R: A Language and Environment for Statistical Computing; R Foundation for Statistical Computing: Vienna, Austria, 2024. [Google Scholar]
- RStudio Team. RStudio: Integrated Development Environment for R; RStudio, PBC: Boston, MA, USA, 2024. [Google Scholar]
- Python Software Foundation. Python Language Reference, version 3.11; Python Software Foundation: Wilmington, DE, USA, 2025.
- Microsoft Corporation. Visual Studio Code; Microsoft Corporation: Redmond, WA, USA, 2025. [Google Scholar]
- Proskuryakova, L. Updating energy security and environmental policy: Energy security theories revisited. J. Environ. Manag. 2018, 223, 203–214. [Google Scholar] [CrossRef] [PubMed]
- Cherp, A.; Jewell, J. The concept of energy security: Beyond the four As. Energy Policy 2014, 75, 415–421. [Google Scholar] [CrossRef]
- Fang, D.; Shi, S.; Yu, Q. Evaluation of Sustainable Energy Security and an Empirical Analysis of China. Sustainability 2018, 10, 1685. [Google Scholar] [CrossRef]
- Lee, C.; Xing, W.; Lee, C. The impact of energy security on income inequality: The key role of economic development. Energy 2022, 248, 123564. [Google Scholar] [CrossRef]
- Strojny, J.; Krakowiak-Bal, A.; Knaga, J.; Kacorzyk, P. Energy Security: A Conceptual Overview. Energies 2023, 16, 5042. [Google Scholar] [CrossRef]
- Asia Pacific Energy Research Centre (APERC). A Quest for Energy Security in the 21st Century Resources and Constraints; APERC: Tokyo, Japan, 2007. [Google Scholar]
- Kruyt, B.; van Vuuren, D.; de Vries, H.; Groenenberg, H. Indicators for energy security. Energy Policy 2009, 37, 2166–2181. [Google Scholar] [CrossRef]
- Kisel, E.; Hamburg, A.; Härm, M.; Leppiman, A.; Ots, M. Concept for Energy Security Matrix. Energy Policy 2016, 95, 1–9. [Google Scholar] [CrossRef]
- Abdullah, F.; Iqbal, R.; Hyder, S.; Jawaid, M. Energy security indicators for Pakistan: An integrated approach. Renew. Sustain. Energy Rev. 2020, 133, 110122. [Google Scholar] [CrossRef]
- Löschel, A.; Moslener, U.; Rübbelke, D. Indicators of energy security in industrialised countries. Energy Policy 2010, 38, 1665–1671. [Google Scholar] [CrossRef]
- Amin, S.; Chang, Y.; Khan, F.; Taghizadeh-Hesary, F. Energy security and sustainable energy policy in Bangladesh: From the lens of 4As framework. Energy Policy 2021, 161, 112719. [Google Scholar] [CrossRef]
- Fouladvand, J. Behavioural attributes towards collective energy security in thermal energy communities: Environmental-friendly behaviour matters. Energy 2022, 261, 125353. [Google Scholar] [CrossRef]
- Paravantis, J.; Kontoulis, N. Energy Security and Renewable Energy: A Geopolitical Perspective; IntechOpen Book Chapter; IntechOpen: London, UK, 2020. [Google Scholar] [CrossRef]
- Valdés, J. Arbitrariness in Multidimensional Energy Security Indicators. Ecol. Econ. 2018, 145, 263–273. [Google Scholar] [CrossRef]
- Martchamadol, J.; Kumar, S. An aggregated energy security performance indicator. Appl. Energy 2013, 103, 653–670. [Google Scholar] [CrossRef]
- Siksnelyte-Butkiene, I.; Štreimikienė, D.; Lekavičius, V.; Baležentis, T. Comprehensive analysis of energy security indicators and measurement of their integrity. Technol. Forecast. Soc. Change 2024, 200, 123167. [Google Scholar] [CrossRef]
- Cornelis, M. What Is the Status of Energy Poverty in the European Union? Available online: https://eu.boell.org/en/2024/11/20/what-status-energy-poverty-european-union (accessed on 22 April 2025).
- Heller, A.L.; Brunzema, I.; Schlomann, B. Energy Efficiency Policies Across the EU and Their Impact on Alleviating Energy Poverty. Insights from the MURE Database; Technical Report; Fraunhofer-Gesellschaft: Munich, Germany, 2024. [Google Scholar] [CrossRef]
- Bouzarovski, S.; Petrova, S. A global perspective on domestic energy deprivation: Overcoming the energy poverty–fuel poverty binary. Energy Res. Soc. Sci. 2015, 10, 31–40. [Google Scholar] [CrossRef]
- Castaño Rosa, R.; Solís-Guzmán, J.; Rubio-Bellido, C.; Marrero, M. Towards a multiple-indicator approach to energy poverty in the European Union: A review. Energy Build. 2019, 193, 36–48. [Google Scholar] [CrossRef]
- Galvin, R. Reducing poverty in the UK to mitigate energy poverty by the 10% and LIHC indicators: What tax changes are needed, and what are the consequences for CO2 emissions? Ecol. Econ. 2024, 217, 108055. [Google Scholar] [CrossRef]
- European Commission. Action Plan for Affordable Energy Unlocking the True Value of Our Energy Union to Secure Affordable, Efficient and Clean Energy for All Europeans. Communication from the Commission. 2025. Available online: https://energy.ec.europa.eu/document/download/7e2e6198-b6b8-46fe-b263-984b437da3ab_en?filename=Communication (accessed on 22 April 2025).
- Bouzarovski, S.; Thomson, H.; Cornelis, M. Confronting Energy Poverty in Europe: A Research and Policy Agenda. Energies 2021, 14, 858. [Google Scholar] [CrossRef]
- Thomson, H.; Bouzarovski, S. Addressing Energy Poverty in the European Union: State of Play and Action; Technical Report; European Energy Poverty Observatory (EPOV): Brussels, Belgium, 2019; Available online: https://energy-poverty.ec.europa.eu/system/files/2024-05/paneureport2018_updated2019.pdf (accessed on 27 April 2025).
- Yougova, D.; Energy Poverty in the EU. EP Think Tank | European Parliamentary Research Service Blog. 2015. Available online: https://epthinktank.eu/2015/12/11/energy-poverty-in-the-eu/ (accessed on 27 April 2025).
- Widuto, A. Energy Poverty in the EU; Briefing; European Parliamentary Research Service (EPRS): Brussels, Belgium, 2023; Available online: https://www.europarl.europa.eu/RegData/etudes/BRIE/2022/733583/EPRS_BRI(2022)733583_EN.pdf (accessed on 27 April 2025).
- EU Energy Poverty Observatory. The Inability to Keep the Home Adequately Warm Indicator: Is It Enough to Measure Energy Poverty? EU Energy Poverty Observatory Newsroom: Brussels, Belgium, 2023; Available online: https://energy-poverty.ec.europa.eu/newsroom/news/nability-keep-home-adequately-warm-indicator-it-enough-measure-energy-poverty (accessed on 27 April 2025).
- MacQueen, J.B. Some Methods for Classification and Analysis of MultiVariate Observations. In Proceedings of the Fifth Berkeley Symposium on Mathematical Statistics and Probability; Cam, L.M.L., Neyman, J., Eds.; University of California Press: Oakland, CA, USA, 1967; Volume 1, pp. 281–297. [Google Scholar]
- Jain, A.K.; Dubes, R.C. Algorithms for Clustering Data; Prentice-Hall, Inc.: Upper Saddle River, NJ, USA, 1988. [Google Scholar]
- Kaufman, L.; Rousseeuw, P.J. (Eds.) Finding Groups in Data; John Wiley & Sons, Inc.: Hoboken, NJ, USA, 1990. [Google Scholar]
- Xu, R.; Wunsch, D. Survey of Clustering Algorithms. IEEE Trans. Neural Netw. 2005, 16, 645–678. [Google Scholar] [CrossRef] [PubMed]
- Mirkin, B. Clustering for Data Mining; Chapman and Hall/CRC: Boca Raton, FL, USA, 2005. [Google Scholar]
- Everitt, B.; Landau, S.; Leese, M. Cluster Analysis, 4th ed.; Arnold: London, UK, 2001. [Google Scholar]
- Hennig, C. What are the true clusters? Pattern Recognit. Lett. 2015, 64, 53–62. [Google Scholar] [CrossRef]
- Jain, A.K. Data clustering: 50 years beyond K-means. Pattern Recognit. Lett. 2010, 31, 651–666. [Google Scholar] [CrossRef]
- Arthur, D.; Vassilvitskii, S. K-Means++: The Advantages of Careful Seeding. In Proceedings of the Eighteenth Annual ACM-SIAM Symposium on Discrete Algorithms, SODA ’07, New Orlean, LA, USA, 7–9 January 2007; pp. 1027–1035. [Google Scholar]
- Tan, P.N.; Steinbach, M.; Kumar, V. Introduction to Data Mining; Addison-Wesley Longman Publishing Co., Inc.: Upper Saddle River, NJ, USA, 2005. [Google Scholar]
- Milligan, G.W.; Cooper, M.C. An examination of procedures for determining the number of clusters in a data set. Psychometrika 1985, 50, 159–179. [Google Scholar] [CrossRef]
- Hastie, T.; Tibshirani, R.; Friedman, J. The Elements of Statistical Learning; Springer: New York, NY, USA, 2009. [Google Scholar]
- Rousseeuw, P.J. Silhouettes: A graphical aid to the interpretation and validation of cluster analysis. J. Comput. Appl. Math. 1987, 20, 53–65. [Google Scholar] [CrossRef]


| Indicator | 2010 | 2015 | 2019 | 2021 | 2023 |
|---|---|---|---|---|---|
| Inability to Keep Home Adequately Warm | 9.9 | 9.6 | 6.9 | 6.9 | 10.6 |
| Arrears on Utility Bills | 9.6 | 9.4 | 6.2 | 6.4 | 6.9 |
| Housing Cost Overburden Rate | 10.0 | 11.2 | 9.4 | 8.7 | 8.8 |
| At Risk of Poverty Rate | NA | 24.0 | 21.1 | 21.7 | 21.3 |
| Cluster | Inability to Keep Home Warm | Arrears on Utility Bills | Housing Cost Overburden | Persons at Risk of Poverty | Countries |
|---|---|---|---|---|---|
| 1 | 3.55 | 6.17 | 7.35 | 18.20 | Austria, Belgium, Czechia, Estonia, Finland, France, Luxembourg, Sweden, Slovenia, Slovakia |
| 2 | 3.53 | 3.37 | 15.20 | 18.33 | Germany, Denmark, Netherlands |
| 3 | 10.73 | 9.40 | 6.70 | 24.47 | Spain, Malta, Poland |
| 4 | 12.00 | 18.52 | 7.44 | 27.76 | Croatia, Hungary, Ireland, Italy, Latvia |
| 5 | 27.73 | 12.10 | 7.37 | 26.20 | Cyprus, Lithuania, Portugal |
| 6 | 13.10 | 17.40 | 15.90 | 44.50 | Romania |
| 7 | 39.20 | 31.40 | 14.80 | 43.30 | Bulgaria |
| 8 | 29.20 | 42.00 | 45.50 | 32.40 | Greece |
| Cluster | Inability to Keep Home Warm | Arrears on Utility Bills | Housing Cost Overburden | Persons at Risk of Poverty | Countries |
|---|---|---|---|---|---|
| 1 | 3.70 | 5.88 | 5.28 | 15.88 | Austria, Finland, Poland, Slovenia |
| 2 | 6.28 | 2.53 | 9.25 | 16.20 | Belgium, Czechia, Netherlands, Sweden |
| 3 | 7.54 | 6.87 | 6.26 | 21.11 | Estonia, France, Croatia, Hungary, Ireland, Italy, Latvia, Malta, Slovakia |
| 4 | 5.73 | 4.97 | 13.30 | 20.20 | Germany, Denmark, Luxembourg |
| 5 | 19.23 | 6.43 | 4.23 | 20.37 | Cyprus, Lithuania, Portugal |
| 6 | 18.00 | 13.67 | 9.47 | 29.50 | Bulgaria, Spain, Romania |
| 7 | 19.20 | 32.90 | 28.50 | 26.10 | Greece |
Disclaimer/Publisher’s Note: The statements, opinions and data contained in all publications are solely those of the individual author(s) and contributor(s) and not of MDPI and/or the editor(s). MDPI and/or the editor(s) disclaim responsibility for any injury to people or property resulting from any ideas, methods, instructions or products referred to in the content. |
© 2025 by the author. Licensee MDPI, Basel, Switzerland. This article is an open access article distributed under the terms and conditions of the Creative Commons Attribution (CC BY) license (https://creativecommons.org/licenses/by/4.0/).
Share and Cite
Kosowski, P. Convergence or Divergence? A Cluster Analysis of Energy Poverty Patterns Across the European Union Amidst Policy Shifts and Crises. Energies 2025, 18, 3117. https://doi.org/10.3390/en18123117
Kosowski P. Convergence or Divergence? A Cluster Analysis of Energy Poverty Patterns Across the European Union Amidst Policy Shifts and Crises. Energies. 2025; 18(12):3117. https://doi.org/10.3390/en18123117
Chicago/Turabian StyleKosowski, Piotr. 2025. "Convergence or Divergence? A Cluster Analysis of Energy Poverty Patterns Across the European Union Amidst Policy Shifts and Crises" Energies 18, no. 12: 3117. https://doi.org/10.3390/en18123117
APA StyleKosowski, P. (2025). Convergence or Divergence? A Cluster Analysis of Energy Poverty Patterns Across the European Union Amidst Policy Shifts and Crises. Energies, 18(12), 3117. https://doi.org/10.3390/en18123117