Article

Risk-Aware Scheduling for Maximizing Renewable Energy Utilization in a Cascade Hydro–PV Complementary System

by
Yan Liu
1,
Xian Zhang
2,
Ziming Ma
2,
Wenshi Ren
3,
Yangming Xiao
3,
Xiao Xu
1,*,
Youbo Liu
1 and
Junyong Liu
1
1
School of Electrical Engineering, Sichuan University, Chengdu 610065, China
2
Beijing Power Exchange Center, Beijing 100032, China
3
State Grid Sichuan Economic Research Institute, Chengdu 610041, China
*
Author to whom correspondence should be addressed.
Energies 2025, 18(12), 3109; https://doi.org/10.3390/en18123109
Submission received: 23 April 2025 / Revised: 8 June 2025 / Accepted: 9 June 2025 / Published: 12 June 2025

Abstract

With the increasing integration of variable renewables, cascade hydro–photovoltaic (PV) systems face growing challenges in scheduling under PV output uncertainty. This paper proposes a risk-aware bi-level scheduling model based on the Information Gap Decision Theory (IGDT) to maximize renewable energy utilization while accommodating different risk preferences. The upper level optimizes the uncertainty horizon based on the decision-maker’s risk attitude (risk-neutral, opportunity-seeking, or risk-averse), while the lower level ensures operational feasibility under corresponding deviations in the PV and hydropower schedule. The bi-level model is reformulated into a single-level mixed-integer linear programming (MILP) problem. A case study based on four hydropower plants and two photovoltaic (PV) clusters in Southwest China demonstrates the effectiveness of the model. Numerical results show that the opportunity-seeking strategy (OS) achieves the highest total generation (68,530.9 MWh) and PV utilization (102.2%), while the risk-averse strategy (RA) improves scheduling robustness, reduces the number of transmission violations from 38 (risk-neutral strategy) to 33, and increases the system reserve margin to 20.1%. Compared to the conditional value-at-risk (CVaR) model, the RA has comparable robustness. The proposed model provides a flexible and practical tool for risk-informed scheduling in multi-energy complementary systems.

1. Introduction

1.1. Motivation

The rapid deployment of variable renewable energy (VRE), particularly photovoltaic (PV) power, is reshaping global energy systems. According to the International Energy Agency (IEA), it is estimated that the worldwide capacity of renewable energy will be more than double by 2030, with solar PV contributing over 80% of new additions [1]. While this growth is essential for achieving carbon reduction targets, it also presents significant challenges arising from the unpredictable, fluctuating, and non-continuous nature of renewable energy output. These issues exacerbate grid operational complexity, increase the risk of renewable energy curtailment, and require greater system flexibility to accommodate large proportions of renewable energy [2].
Cascade hydropower plants, with their substantial storage capacities and rapid ramping capabilities, provide a valuable resource for addressing challenges posed by variable renewable energy. These plants offer flexibility to mitigate the uncertainty and variability in PV generation [3,4]. The joint scheduling of hydro and PV resources enhances the efficiency of renewable energy use, mitigates energy wastage, and strengthens system reliability [5,6]. This coordination has been a key focus in recent studies, particularly in resource-rich regions like Southwest China, where hybrid hydro–PV systems have garnered significant attention [6].
Despite these advancements, optimizing the dispatch of hybrid hydro–PV systems under uncertainty remains a critical challenge. Most existing approaches rely on deterministic or probabilistic models to characterize forecast uncertainty. However, PV forecast uncertainties often exhibit epistemic characteristics, which are difficult to capture accurately using traditional methods. Deterministic methods tend to underestimate operational uncertainties, while probabilistic approaches introduce computational complexities and unrealistic assumptions in practical applications.
To overcome these challenges, recent research has investigated the use of the Information Gap Decision Theory (IGDT) to support robust decision-making in multi-energy systems facing high levels of uncertainty [7,8,9]. The IGDT enables decision-makers to make informed scheduling strategies without relying on precise probability distributions, thus enhancing system resilience against forecast deviations. Some frameworks combine the IGDT with probabilistic modeling to better manage uncertainty in multi-energy systems [10]. However, its application to large-scale generation–side cascade hydro–PV systems remains limited. Furthermore, a unified scheduling framework that accommodates varying risk attitudes has yet to be fully developed.

1.2. Literature Review

1.2.1. Renewable Energy Systems (Hydropower + PV)

This section reviews scheduling models for renewable energy systems, focusing on the integration of hydropower and PV systems, as well as hybrid configurations involving wind and energy storage. Due to its operational flexibility, hydropower serves as a natural complement to the intermittent nature of PV generation. Numerous studies have explored coordinated dispatch strategies to enhance system efficiency and reliability under uncertainty. Luo et al. [11] developed a short-term optimization model for cascade hydro–PV systems using MILP, aiming to maximize renewable energy utilization and minimize curtailment. Song [12] applied fuzzy clustering means (F-CM) and scenario analysis to account for PV uncertainty, thereby improving system stability and dispatch reliability. Zhao et al. [13] proposed a multi-objective optimization model using the Copula–Monte Carlo method, which captures the joint output characteristics of PV and hydropower to support clean energy consumption and peak shaving. In their model, peaking is achieved by minimizing the average deviation in residual load across multiple zones. Nonetheless, earlier approaches predominantly rely on deterministic or scenario-based approaches with limited probabilistic representation, often assuming simplified system structures and static risk preferences. These limitations restrict their applicability to large-scale, real-world cascade operations.
To enhance flexibility beyond conventional hydro–PV configurations, emerging storage technologies have attracted attention. Wu et al. [14] developed a day-ahead IGDT-based scheduling model for wind and gravity energy storage (GES), reformulating a bi-level risk model into a tractable single-level framework, which enabled economically efficient scheduling under both price and wind uncertainties. While this reformulation improves tractability, such approaches are rarely extended to hydro–PV systems with multi-timescale coupling and spatial heterogeneity.
Concurrently, a number of studies have further explored complementary aspects that are closely related to the design and operation of hydropower PV systems, including physical safety constraints and infrastructure limitations. Xiong et al. [15] introduced a vibration-avoidance strategy in hydro–wind–PV configurations, where hydropower served as the stabilizing anchor, ensuring safe turbine operation while optimizing generation and maintaining system stability across multiple simulation scenarios. Zhang et al. [16] proposed a multi-objective planning model centered on hydro–PV integration, which combines PV sizing with power transmission capacity design to directly address curtailment issues and enhance carbon mitigation.
Yet, most of these models focus on technical feasibility rather than comprehensive risk analysis and often overlook dynamic environmental conditions or hydrological uncertainty. Additionally, Li and Qiu [17] proposed a long-term multi-objective model for hydro–PV systems, using decoupled timescales and a modified NSGA-II algorithm to validate hydropower’s compensatory role under variable solar conditions. Wang et al. [18] developed a two-stage robust day-ahead scheduling model for hydro–PV systems, using an ambiguity set to describe PV uncertainty and improve dispatch adaptability and power balance. These models focus on long-term planning and enhancing day-ahead scheduling robustness.
However, they may not fully consider operational risk attitudes or permit the flexible adjustment of robustness levels in response to different decision-maker preferences. Lu et al. [19] focused on medium- to long-term scheduling for cascade hydro–PV systems, using an improved interval optimization (IO) technique to handle uncertainties in hydrological inflow and PV output. This model enhanced system robustness and economic performance while reducing curtailment. Lei et al. [20] established a dual-layer optimization architecture for hydro–wind–PV hybrid systems under wind and solar uncertainty. They introduced a synchronous peak shaving strategy and a λ-flow iteration method, achieving a 95.53% peak shaving rate and improving economic efficiency. In this model, peak shaving refers to minimizing temporal fluctuations in residual load—defined as the system load minus renewable generation—over time and across scenarios.
Still, these efforts are largely scenario-dependent and may suffer from scalability issues when applied to systems with large spatiotemporal variability. Fan et al. [21] developed a stochastic multi-objective optimization model for wind–solar–hydro hybrid systems, considering generation and demand-side uncertainties. Their approach improved net profit and reduced the fluctuation in the remaining load, improving grid balance and system reliability. Li et al. [22] proposed a short-term optimal scheduling strategy for hydro–wind–solar systems based on deep learning and a two-layer nested optimization framework, effectively managing renewable generation uncertainty and maximizing energy storage benefits. Zhang et al. [23] introduced a hydro–PV capacity planning framework that bridges temporal operational scales, identifying optimal PV sizing under different curtailment thresholds and improving resource utilization in cascade hydro–PV systems. Although these hybrid frameworks show strong performance in simulations, many rely on machine learning models that may require extensive historical data and lack robustness guarantees under severe forecast errors.

1.2.2. Multi-Energy System Integration and Uncertainty

The integration of multi-carrier energy systems under uncertainty has prompted the development of various optimization strategies aimed at managing operational risks and improving system performance. Coordinating renewable energy sources like wind, solar, and hydropower is essential for increasing the reliability and flexibility of power systems.
To this end, recent studies have proposed scheduling models that incorporate multi-timescale operation and robust optimization techniques. Li et al. [24] proposed a market-oriented scheduling framework for a wind–solar–hydro–storage consortium, which balances long-term contract execution with short-term uncertainty. This approach optimized energy resource scheduling across multiple timescales, ensuring efficient integration while mitigating uncertainty impacts. Li et al. [25] implemented a bio-inspired Moth-Flame Optimization (MFO) algorithm for multi-objective optimization for hydro–solar systems, targeting enhanced power generation and capacity utilization through flexible and adaptive scheduling. Gong et al. [26] pioneered a chance-constrained robust optimization approach for PV–storage networks, employing probabilistic source-load uncertainty modeling to maintain cost-effectiveness in active distribution systems. Similarly, Zhou et al. [27] formulated a dual-stage robust optimization paradigm for low-carbon energy integration, successfully reconciling economic and environmental objectives under carbon policy uncertainties. Huang et al. [28] enhanced hydro–solar system flexibility by a day-ahead scheduling model incorporating a coupled cloud model and hierarchical compensation strategies, thereby reducing PV curtailment and improving hydropower adaptability to solar fluctuations. Shi et al. [29] explored the integration of solar-powered compressed air energy storage (SPCAES) in a multi-energy hub, applying the IGDT with a risk-averse strategy and the Elephant Herd Optimization (EHO) algorithm to achieve 15% cost savings and 20% revenue enhancement during peak demand periods.
However, many of these models rely on specific forecasting methods or assume perfect coordination among subsystems, which may limit their scalability and practical deployment. Building on these frameworks, other studies have focused on enhancing long-term system flexibility under broader uncertainty scenarios. Shi et al. [30] investigated a hybrid cascade hydro–wind–PV–battery system under uncertain load growth, proposing a two-stage stochastic optimization model based on scenario analysis. This approach supported cost-effective system planning while capturing the long-term impacts of uncertainty. Tian et al. [31] formulated a cross-regional hydro–wind–PV scheduling model that simultaneously optimized power curtailment, load shedding, and generation stability, ensuring compliance with multi-regional grid requirements and maintaining operational stability. In parallel, Tang et al. [32] enhanced the Input–Output (IO) method for cascade hydro–PV systems, addressing uncertainties in inflow runoff and photovoltaic power output, improving system robustness and reducing curtailment. Tan et al. [33] devised operational rules for hybrid pumped-storage hydropower–PV systems, reconstructed from conventional cascade stations. By incorporating long-distance transmission constraints and PV forecast uncertainty, their model improves generation profits, regulation capacity, and risk management, facilitating the transition to more flexible multi-energy integration.
Nevertheless, many scenario-based approaches rely heavily on predefined distributions or lack real-time adaptability, which can affect performance under highly volatile conditions. More recent efforts have further extended this line of research into the domain of market participation and real-time dispatch. Li et al. [34] proposed a Wasserstein-metric-based chance-constrained model for hydro–solar–pumped storage systems in electricity markets, optimizing contract fulfillment and day-ahead bidding under dual-price and generation uncertainty. Finally, Tan et al. [35] implemented a three-layer (day-ahead/intraday/real-time) risk-averse strategy for hydro–PV–storage systems, utilizing battery storage to mitigate forecast errors in the Longyangxia project, thereby improving generation safety and operational flexibility. Li et al. [36] applied Nash bargaining and ADMM decomposition to coordinate wind–PV–pumped storage–hydropower systems across energy and ancillary service markets, achieving a 20% increase in renewable utilization through fair revenue allocation. However, these models often assume ideal communication among market participants and may overlook practical limitations such as market volatility, data delays, and system inertia.
In order to systematically compare recent advances in multi-energy dispatch under uncertainty, Table 1 summarizes representative studies in terms of optimization models, uncertainty-handling techniques, and modeling scope. These references cover a variety of risk-aware strategies, including the IGDT, DRCC, scenario-based stochastic optimization, and market-oriented coordination.

1.2.3. Information Gap Decision Theory in Energy Systems

The IGDT has been increasingly adopted in energy systems to support robust decision-making under severe uncertainty, where traditional probabilistic models often fall short. The IGDT enables the formulation of adaptive strategies by quantifying the trade-offs between robustness and performance, accommodating both risk-averse and risk-seeking decision preferences. Sun et al. [37] proposed a hybrid stochastic programming-IGDT model for Integrated Energy Systems (IESs), addressing uncertainties in PV and hydropower generation. Their approach enables flexible dispatch strategies by incorporating multiple risk attitudes, providing a more adaptable solution for uncertain energy production. Ding et al. [38] extended the IGDT to a complementary energy system that integrates P2G, CCS, and CHP technologies, improving operational robustness in multi-energy configurations. Similarly, Liu et al. [39] applied the IGDT to multi-energy retailers (MERs), incorporating the demand response for electricity, gas, and heat under price uncertainty, and developed adaptive scheduling plans tailored to different risk preferences. Zhu et al. [40] proposed a robust long-term optimization framework for hydro–PV hybrid systems. Although they did not explicitly use the IGDT, their model integrated a multi-objective evolutionary algorithm with stochastic multi-criteria analysis (SMAA-FOS), demonstrating the utility of robust decision-making under forecast uncertainty. This model improved economic performance and operational stability, aligning closely with the IGDT principles.
Recent advancements have focused on expanding the applicability of the IGDT across various energy systems. Phu et al. [41] developed an IGDT-based normalized weighted-sum (IGDT-NWS) model for an integrated energy hub (IEH), which includes renewables, biomass-to-hydrogen electrolysis, hybrid storage, and hydrogen market interaction. This method considers uncertainties in energy demand, prices, and renewable generation, leading to improvements in cost efficiency, emissions reduction, and energy export metrics. Ji et al. [42] introduced the Comprehensive Risk Strategy–IGDT (CRS-IGDT) for park-level IESs, allowing dynamic adaptation between risk-averse and risk-seeking strategies via an adaptive step ratio and a comprehensive risk cost function. Wu et al. [43] designed a bi-level IGDT-based integrated demand response (IDR) model for IESs acting as price makers in electricity and gas markets, integrating uncertainty management with game-theoretic bidding and privacy-preserving algorithms. Yin et al. [44] proposed an entropy-weighted NSGA-II enhanced IGDT model (EWNS-IGDT) for high-altitude electric–heat–oxygen integrated systems (EHO-IESs), improving uncertainty quantification and significantly reducing costs and emissions. These studies demonstrate how the IGDT is becoming a vital tool for improving the robustness and flexibility of energy systems by integrating multiple energy sources and managing complex uncertainties.

1.2.4. Research Gaps and Unmet Needs

Although considerable progress has been made in the scheduling of hydro–PV and multi-energy systems, several critical limitations remain. Most existing models rely on deterministic or scenario-based probabilistic approaches, which inadequately capture epistemic uncertainty in PV generation and thus tend to underestimate operational risks [11,12,26]. While robust optimization techniques such as the IGDT have been introduced to address deep uncertainty [37,39], their application in large-scale cascade hydro–PV systems—particularly those involving spatial and temporal coupling—remains limited [14,36].
It is widely acknowledged that hydropower acts as a foundational stabilizing component in hybrid energy systems, enabling effective peak load balancing and ancillary service provision [17,18,22]. However, the optimal utilization of this flexibility remains constrained by the incomplete modeling of system dynamics. In particular, storage degradation, transmission bottlenecks, and energy conversion losses are often oversimplified or omitted, undermining dispatch accuracy and long-term operational robustness [15,16,29].
Moreover, the representation of decision-makers’ risk preferences remains underexplored. While some models incorporate risk-averse or robust strategies [19,41], few allow adaptive control over robustness levels or support diverse risk attitudes—such as risk-neutral, opportunity-seeking, and conservative approaches—that align with realistic policy and investment behaviors [18,37,42]. Although the IGDT is conceptually well-suited for such applications, its practical use is often hindered by bi-level formulation complexity and the lack of tractable reformulations.
In addition, data-driven methods, including deep learning and metaheuristics, have enhanced prediction accuracy and computational efficiency [22,25]. However, these methods often suffer from limited interpretability and generalizability, particularly under non-stationary conditions, such as climate anomalies or market volatility [33,44]. Moreover, while market-oriented scheduling frameworks have gained traction [34,36], many rely on the idealized assumptions of subsystem coordination and information availability—conditions that rarely hold in practice due to latency, data asymmetry, or strategic market behavior.
These limitations underscore the urgent need for risk-aware scheduling models that (i) explicitly account for forecast uncertainty, (ii) flexibly represent different risk attitudes, and (iii) remain computationally tractable under real-world operational constraints.
1.3. Contributions and Organizations

To address the challenges posed by PV output uncertainty and varying risk preferences in cascade hydro–PV hybrid systems, this paper proposes a risk-aware scheduling framework. The key contributions are summarized as follows:
  • A unified scheduling model based on the IGDT is developed to explicitly handle PV forecast uncertainty and accommodate varying risk preferences. By introducing a non-negative deviation tolerance parameter, the model supports three representative dispatch strategies, the risk-neutral model (RN), the opportunity-seeking model (OS), and the risk-averse model (RA), all within a single formulation.
  • A bi-level optimization reformulation technique is proposed to transform the original IGDT-based model into a tractable single-level mixed-integer linear programming (MILP) problem. This ensures computational efficiency and facilitates practical implementation using standard optimization solvers.
  • A real-world case study based on a cascade hydro–PV system in Southwest China is conducted to validate the proposed model. Simulation results reveal the trade-offs among economic performance, system robustness, and renewable energy utilization across different risk-aware strategies.
This paper is organized as follows: Section 2 presents a deterministic scheduling model under a risk-neutral strategy as the baseline for comparison. Section 3 introduces the proposed risk-aware scheduling framework based on the IGDT, incorporating both opportunity-seeking and risk-averse strategies within a bi-level optimization structure. Section 4 conducts a case study on a cascade hydro–PV hybrid system to evaluate scheduling performance under three risk strategies. Section 5 concludes this paper with key findings and outlines potential directions for future research.

2. Deterministic Scheduling Model Under Risk-Neutral Strategy

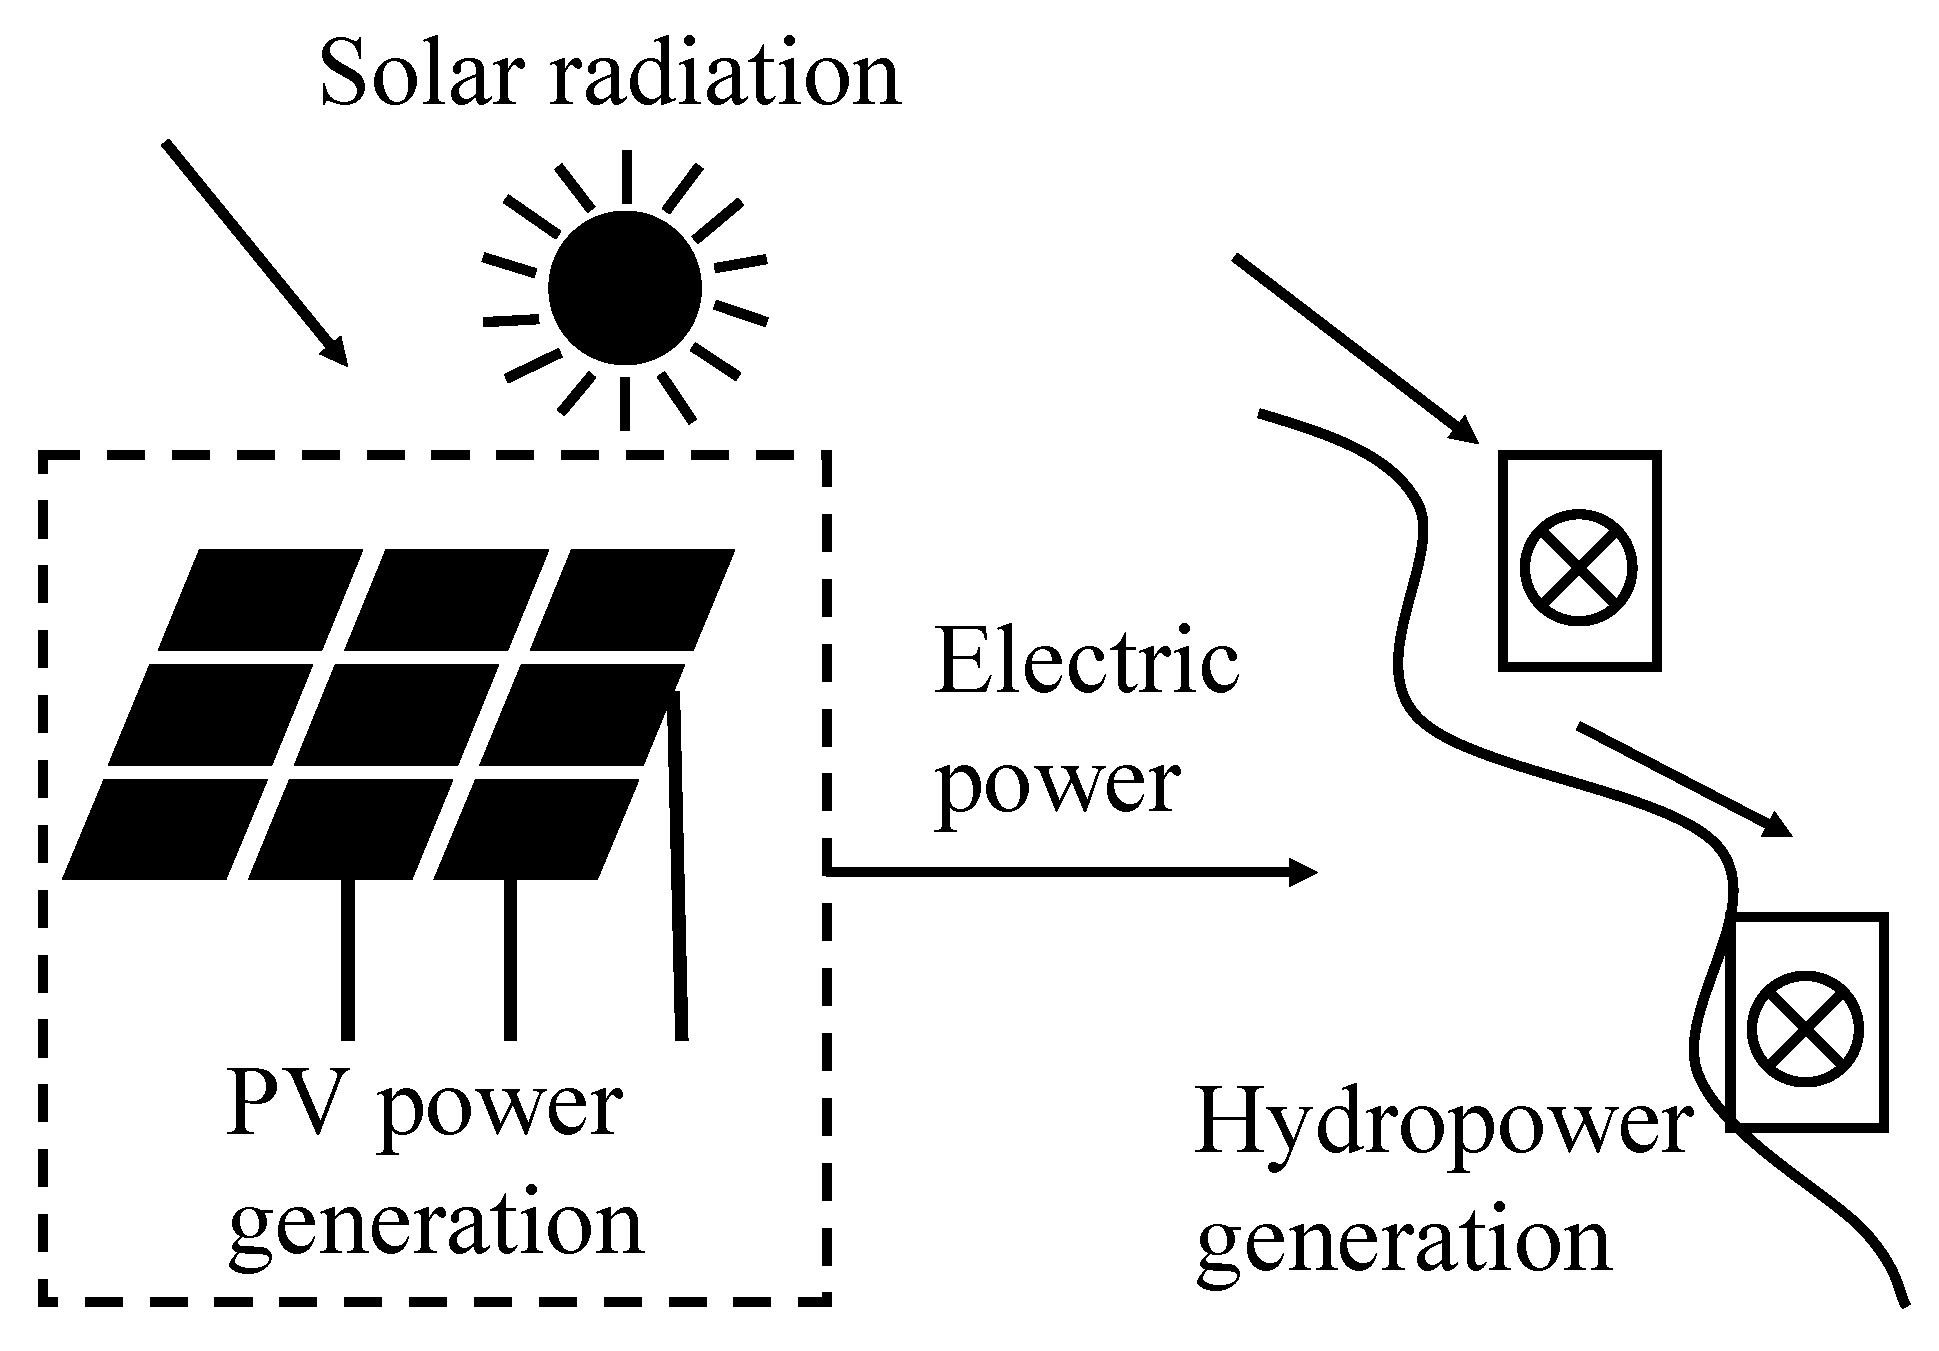
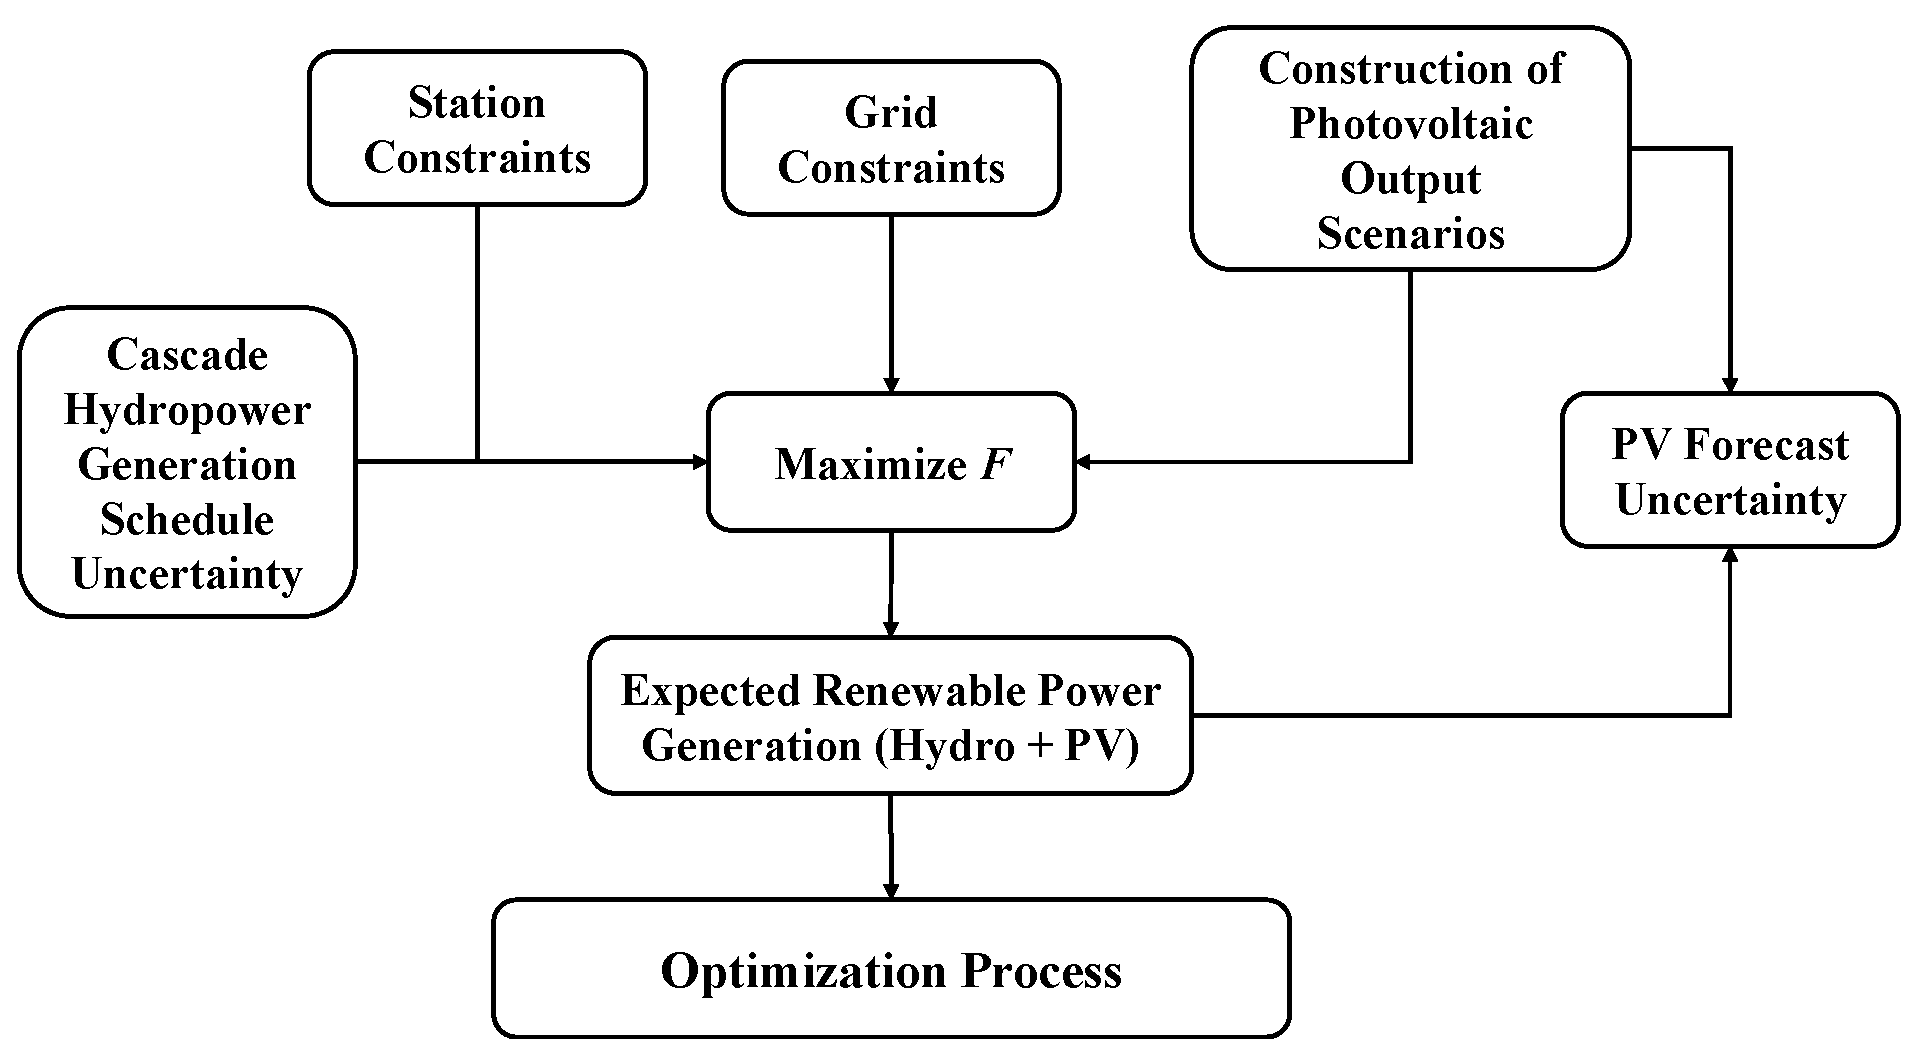
This section introduces the conventional scheduling model based on a risk-neutral assumption, which serves as the baseline for comparison. The deterministic model strictly adheres to the forecasted PV generation and hydropower availability profiles, without explicitly considering forecast uncertainties. The objective is to maximize the expected usable energy from the cascade hydro–PV hybrid system under idealized and known conditions. Figure 1 illustrates a typical cascade hydro–PV hybrid system. Solar radiation drives PV power generation, while hydropower stations sequentially generate electricity along the river flow. The outputs from both sources are jointly dispatched to improve renewable energy utilization and system reliability. Figure 2 presents the optimization process, outlining the model constraints and the approach used to achieve the objective of maximizing the expected consumable power.

2.1. Objective Function

To establish a baseline for comparison, a scheduling model is developed under a risk-neutral assumption, where forecasted PV generation and hydropower inflows are treated as accurate and deterministic inputs. Although the objective function adopts an expectation value structure, this stage has not yet involved any formal uncertainty modeling techniques such as the IGDT. The optimization objective is to maximize the total amount of renewable energy that can be efficiently utilized by the hybrid cascade hydropower–PV system throughout the scheduling period. This deterministic formulation serves as a benchmark for evaluating the performance improvements offered by risk-aware models introduced in the next section. The corresponding mathematical expression is given as
F = max t = 1 T i = 1 I P i , t h y d r o + j = 1 J P j , t p v g = 1 G P g , t w ¯
where P j , t p v represents the photovoltaic power generation from field j at time t, while P i , t h y d r o corresponds to the planned power output from hydropower plant i during the same time interval. The variable P g , t w ¯ quantifies the power curtailment occurring at constrained network section g. The model considers J photovoltaic arrays, G system constraint points, and T operational periods, with Δ t defining the duration of each scheduling interval (in hours).

2.2. Model Constraints

To ensure the reliability and feasibility of system operations, the model incorporates a comprehensive set of constraints, including those related to physical characteristics, hydraulic processes, and operational limits.

2.2.1. Hydropower System Operational Constraints

(1)
Reservoir Water Budget Constraints
V i , t = V i , t 1 + 3600 ( I i , t Q i , t ) Δ t I i , t = Q i 1 , t τ + R i , t Q i , t = Q i , t p + Q i , t d
where V i , t denotes the reservoir storage volume at plant i when time period t concludes. The model accounts for I i , t , representing the total incoming water flow to plant i during interval t . The hydraulic connectivity between upstream and downstream stations is modeled through τ , which defines the water transit time from predecessor station i 1 to current station i . Q i , t represents the total discharge released from hydroelectric plant i in operational period t , and Q i 1 , t τ captures the delayed inflow contribution from upstream facility i 1 , where t τ denotes the hydraulic propagation time, and R i , t quantifies the transitional water flow between consecutive stations i 1 and i at time t . Q i , t p and Q i , t d , respectively, quantify the turbine discharge for power generation and the safety-oriented spillage discharge at hydropower station i during time period t .
(2)
Reservoir Level Bounds
Z _ i , t u p Z i , t u p Z ¯ i , t u p
where Z i , t u p denotes the measured actual water level at hydropower station i during time interval t , while Z ¯ i , t u p , and Z _ i , t u p represent the corresponding maximum and minimum allowable operating levels, respectively.
(3)
Boundary Conditions for Reservoir Level Constraints
Z i , t u p = Z i , b e g i n u p Z i , T u p Z i , e n d u p Δ Z
where Z i , b e g i n u p denotes the starting reservoir level when the scheduling period commences, while Z i , e n d u p specifies the required water level at the operational horizon’s conclusion. The parameter Δ Z defines the permissible variation range for the terminal water level, ensuring that the prescribed storage volume is maintained for subsequent scheduling cycles.
(4)
Outflow Constraints
Q _ i , t Q i , t Q ¯ i , t
where Q ¯ i , t and Q _ i , t specify the maximum and minimum permissible outflow rates, respectively, at hydropower station i during time interval t .
(5)
Hydropower Generation Limits
P _ i , t h y d r o P i , t h y d r o P ¯ i , t h y d r o
where P ¯ i , t h y d r o and P _ i , t h y d r o denote the maximum and minimum allowable power output, respectively, at generating station i during time step t .
(6)
Reservoir Level–Volume Correlation
V i , t = f i 2 z v Z i , t u p
where f i 2 z v Z i , t u p characterizes the level–storage relationship by a nonlinear function at reservoir i .
(7)
Tailwater Level–Discharge Relationship
Z i , t d o w n = f i 2 q Q i , t
where f i 2 q Q i , t characterizes the nonlinear correspondence between discharge quantity and tailrace elevation at hydropower plant i , while Z i , t d o w n quantifies the instantaneous tailwater level at the same station during operational interval t .

2.2.2. Hydropower Unit Operational Constraints

(1)
Power Generation Capacity Limitations
u i , n , t P _ i , n P i , n , t u i , n , t P ¯ i , n
where P i , n , t denotes the active power output of the n-th turbine unit at hydropower station i during time period t , with P ¯ i , n and P _ i , n representing its corresponding upper and lower generation limits, respectively. The operational status of each unit is modeled using a binary variable u i , n , t , where a value of 1 indicates that the unit is online and available for generation, while 0 signifies an offline state. Based on these definitions, the total power output of station i at time t is calculated as the summation of outputs from all its generating units:
P i , t h y d r o = N i n = 1 u i , n , t P i , n , t
where N i represents the total number of installed turbine units at the facility.
(2)
Unit Generating Discharge Constraints
u i , n , t Q _ i , n p Q i , n , t p u i , n , t Q ¯ i , n p
where Q i , n , t p represents the water flow through turbine unit n at hydropower plant i during operational interval t , while Q ¯ i , n p and Q _ i , n p specify the corresponding maximum and minimum permissible discharge rates, respectively. The total generating discharge for the entire station is mathematically expressed as
Q i , t p = N i n = 1 u i , n , t Q i , n , t p
(3)
Unit Vibration Zone Constraints
P i , n , t P i , n , k max P i , n , t P i , n , k min 0
where P i , n , k max and P i , n , k min specify the maximum and minimum allowable power output, respectively, for the k-th vibration avoidance region of generating unit n at hydropower plant i , respectively.
(4)
Unit Operational Time Limits
u i , n , t u i , n , t 1 = y i , n , t on y i , n , t off y i , n , t on + y i , n , t off 1 y i , n , t on + t + T i , n off 1 λ = t + 1 y i , n , λ off 1 y i , n , t off + t + T i , n off 1 λ = t + 1 y i , n , λ on 1 T t = 1 y i , n , t on M i , n on
where y i , n , t on is a binary activation indicator that equals 1 when generating unit n at plant i initiates operation at time t ; y i , n , t off similarly indicates deactivation events through a value of 1, and M i , n on defines the permissible activation frequency threshold for turbine unit n at hydropower plant i throughout the optimization horizon.
(5)
Unit Output Ramp Rate Constraints
Δ P i , n P i , n , t + 1 P i , n , t Δ P i , n
where Δ P i , n quantifies the maximum permissible power output variation rate for turbine unit n at plant i .
(6)
Output Smoothing Constraints
P i , n , t P i , n , t σ 1 P i , n , t P i , n , t 1 0 , σ = 1 , 2 , , t e 1
where t e specifies the minimum duration required for generating unit n at hydropower plant i to execute a complete power adjustment cycle. This constraint helps reduce wear and tear on the unit caused by frequent adjustments and, more importantly, maintain hydrological stability by dampening discharge fluctuations that could disrupt downstream aquatic ecosystems.
(7)
Unit Generating Water Head Constraints
H i , n , t = Z i , t u p Z i , t 1 u p 2 Z i , t down H i , n , t loss
where H i , n , t captures the effective gross head available for power generation at unit n of plant i during interval t , while H i , n , t loss accounts for the corresponding hydraulic losses incurred during the energy conversion process.
(8)
Water Head Loss Function
H i , n , t loss = a i Q i , n , t p 2 + b i
where a i quantifies the normal head loss during standard operations, whereas b i accounts for additional abnormal head losses under non-ideal conditions.
(9)
Unit Dynamic Characteristics
P i , n , t = f i , n N H Q Q i , n , t p , H i , n , t
where f i , n N H Q denotes the multivariate nonlinear coupling function that characterizes the interdependencies among the power output, net hydraulic head, and turbine flow rate for the n-th generating unit at hydropower station i .

2.2.3. Grid Constraints

(1)
Cascade Output Balance Constraint
I t = 1 P l , t h y d r o P t p l a n ε         t = 1 , 2 , , T
where P t p l a n defines the scheduled generation output for the entire cascade hydropower system, with ε defining the permissible operational tolerance deviation.
(2)
Partition Transmission Capacity Constraints
P g , t w = max P g , t L g , t C g , t , 0 P g , t = n , j Ω k P i , n , t + P j , t p v
where L g , t specifies the load in grid section g during interval t , while C g , t defines the corresponding maximum power transfer capacity. P g , t denotes the aggregate generation output from all units in the g-th partition section during time period t . Based on the objective function and the partition section constraints, it is evident that unutilized hydropower is prioritized over PV curtailment when curtailment is necessary. The model seeks to optimize hydropower reduction within an acceptable range, thereby maximizing PV utilization and minimizing curtailment. This approach improves the overall consumption of the hybrid system while ensuring grid stability. However, if restricted by the partition section’s transmission capacity, some degree of PV curtailment may still be unavoidable.

2.3. Linearization Techniques

To ensure the computational tractability of the MILP-based scheduling model, a series of nonlinear constraints are converted into corresponding linear approximations. The linearization process involves three main steps. First, nonlinear relationships, such as the reservoir level–storage correlations, discharge–tailwater level dependencies, and hydraulic loss function, are approximated using piecewise linear techniques. This allows for the efficient representation of nonlinear hydraulic characteristics. Second, the dynamic behavior of generating units, including vibration zones and ramping limits, is modeled using binary indicator variables to capture discrete operating states. Lastly, constraint formulations related to unit fluctuation limits are enhanced by introducing adjustment tracking variables, which ensure operational stability and improve convergence.

Model Transformation

The construction of the MILP model relies on the linearization of nonlinear constraints. The optimization formulation incorporates multiple nonlinear relationships, particularly those expressed in Equations (7), (8), (13), (16), (18), and (19). Specifically, the reservoir level–storage correlations, discharge–tailwater level dependencies, and hydraulic loss function are linearized using a piecewise linear approach. The dynamic characteristics of generating units are modeled with the triangular weighting functions [45]. For major reservoir systems with limited daily water level variations, the reservoir level–storage correlations within operational ranges proximate to initial conditions can be effectively approximated as linear.
(1)
Linear Reformulation of Unit Vibration Range Constraints
Large-capacity units exhibiting multiple mechanical resonance regions result in the segmentation of the output range between the maximum and minimum limits into several non-continuous safe operating intervals. Following the approach in [11], this study assumes that the vibration zones of the units remain fixed and are not affected by variations in the unit’s water head. The resulting safe operating domains are mathematically defined as
P _ i , n , P i , n , 1 min , , P i , n , k 1 max , P i , n , k min , P i , n , k max , P ¯ i , n
To model these non-continuous regions, binary variables θ i , n , k , k are introduced to indicate whether unit n at station i operates within the k-th safe interval during time slot t. The nonlinear constraint can thus be linearized as
K + 1 k = 1 θ i , n , k , k P i , n , k 1 max P i , n , t K + 1 k = 1 θ i , n , t , k P i , n , k min K + 1 k = 1 θ i , n , t , k = u i , n , t
where u i , n , t 0 , 1 denotes the on/off state of unit n, and θ i , n , k , k = 1 if the unit is operating within the k-th interval; otherwise, θ i , n , k , k = 1 .
(2)
Linear Reformulation of Hydro Unit Ramp Rate Limitations
Frequent output fluctuations in hydropower units are characterized by upward or downward adjustments between consecutive time periods. The linearization approach for hydroelectric units proposed in the literature [11] is used. This method effectively improves solution efficiency while addressing output fluctuation constraints.
α i , n , t Δ P i , n P i , k , t + 1 P i , n , t Δ P i , n α i , n , t + β i , n , t 1 T t = 1 α i , n , t + β i , n , t M α β
where α i , n , t 0 , 1 and β i , n , t 0 , 1 indicate power reduction and increase actions, respectively, for the n-th generating unit at station i during time period t . Specifically, α i , n , t = 1 signifies a downward power adjustment at t + 1 , while β i , n , t = 1 denotes an upward adjustment at t + 1 . When both variables equal 0, the unit maintains a stable output. M α β constrains the maximum allowable adjustments during the scheduling horizon. Additionally, to ensure that the unit maintains a stable output for at least t e time periods after each adjustment, the following constraints are introduced:
α l , n , t + β l , n , t + t t 1 β l , n , t + α L , n , t + t t 1 t 4 γ = 0 α i , n , t + γ 1       t s = 1 , 2 , , t e 1   t ħ γ = 0 β l , n , t + γ 1
When a unit maintains a stable output for t e consecutive time periods, it can be in one of three valid states: upward adjustment, downward adjustment, or stable output. Assume the current time is t 0 : if an upward or downward adjustment occurs at time t 1 , only the steady output state is retained immediately following this change. Both upward and downward adjustment states are temporarily disabled. These adjustment states are re-enabled only after the unit has sustained a stable output for an additional t e consecutive time periods. This constraint is imposed to enhance the operational stability of unit outputs throughout the scheduling horizon.

3. Opportunity-Seeking and Risk-Averse Scheduling via IGDT

The scheduling model in Section 2 is based on a predetermined cascade hydropower generation schedule, using the planned output as a reference for short-term dispatch. However, real-world operations involve various uncertainties, including variable weather conditions, inflow fluctuations, equipment constraints, and deviations in PV power output. These uncertainties make it challenging to ensure the accurate execution of the dispatch plan. In particular, deviations between the planned and actual cascade hydropower generation schedule and PV generation may lead to suboptimal scheduling. To enhance the practical applicability and resilience of the dispatching framework, it is crucial to incorporate such output uncertainties into the optimization model and provide risk-averse decision support under uncertain conditions.
To tackle this challenge, this study applies the IGDT to formulate both opportunity-seeking and risk-averse scheduling models that explicitly consider output uncertainty. The IGDT is a non-probabilistic decision-making approach designed to address situations where historical information about uncertain parameters is limited. While probabilistic methods such as scenario modeling have been widely used for solar power forecasting [19,20,21], they usually require well-defined distributions and large amounts of historical data. In contrast, the advantage of the IGDT method is that uncertainty caused by any parameters without sufficient historical information can be applied to the scheduling problem [39]. Therefore, this method is suitable for situations where there are not enough historical data from uncertainty sources. By reducing the input data, the amount of optimization computation will be greatly reduced.
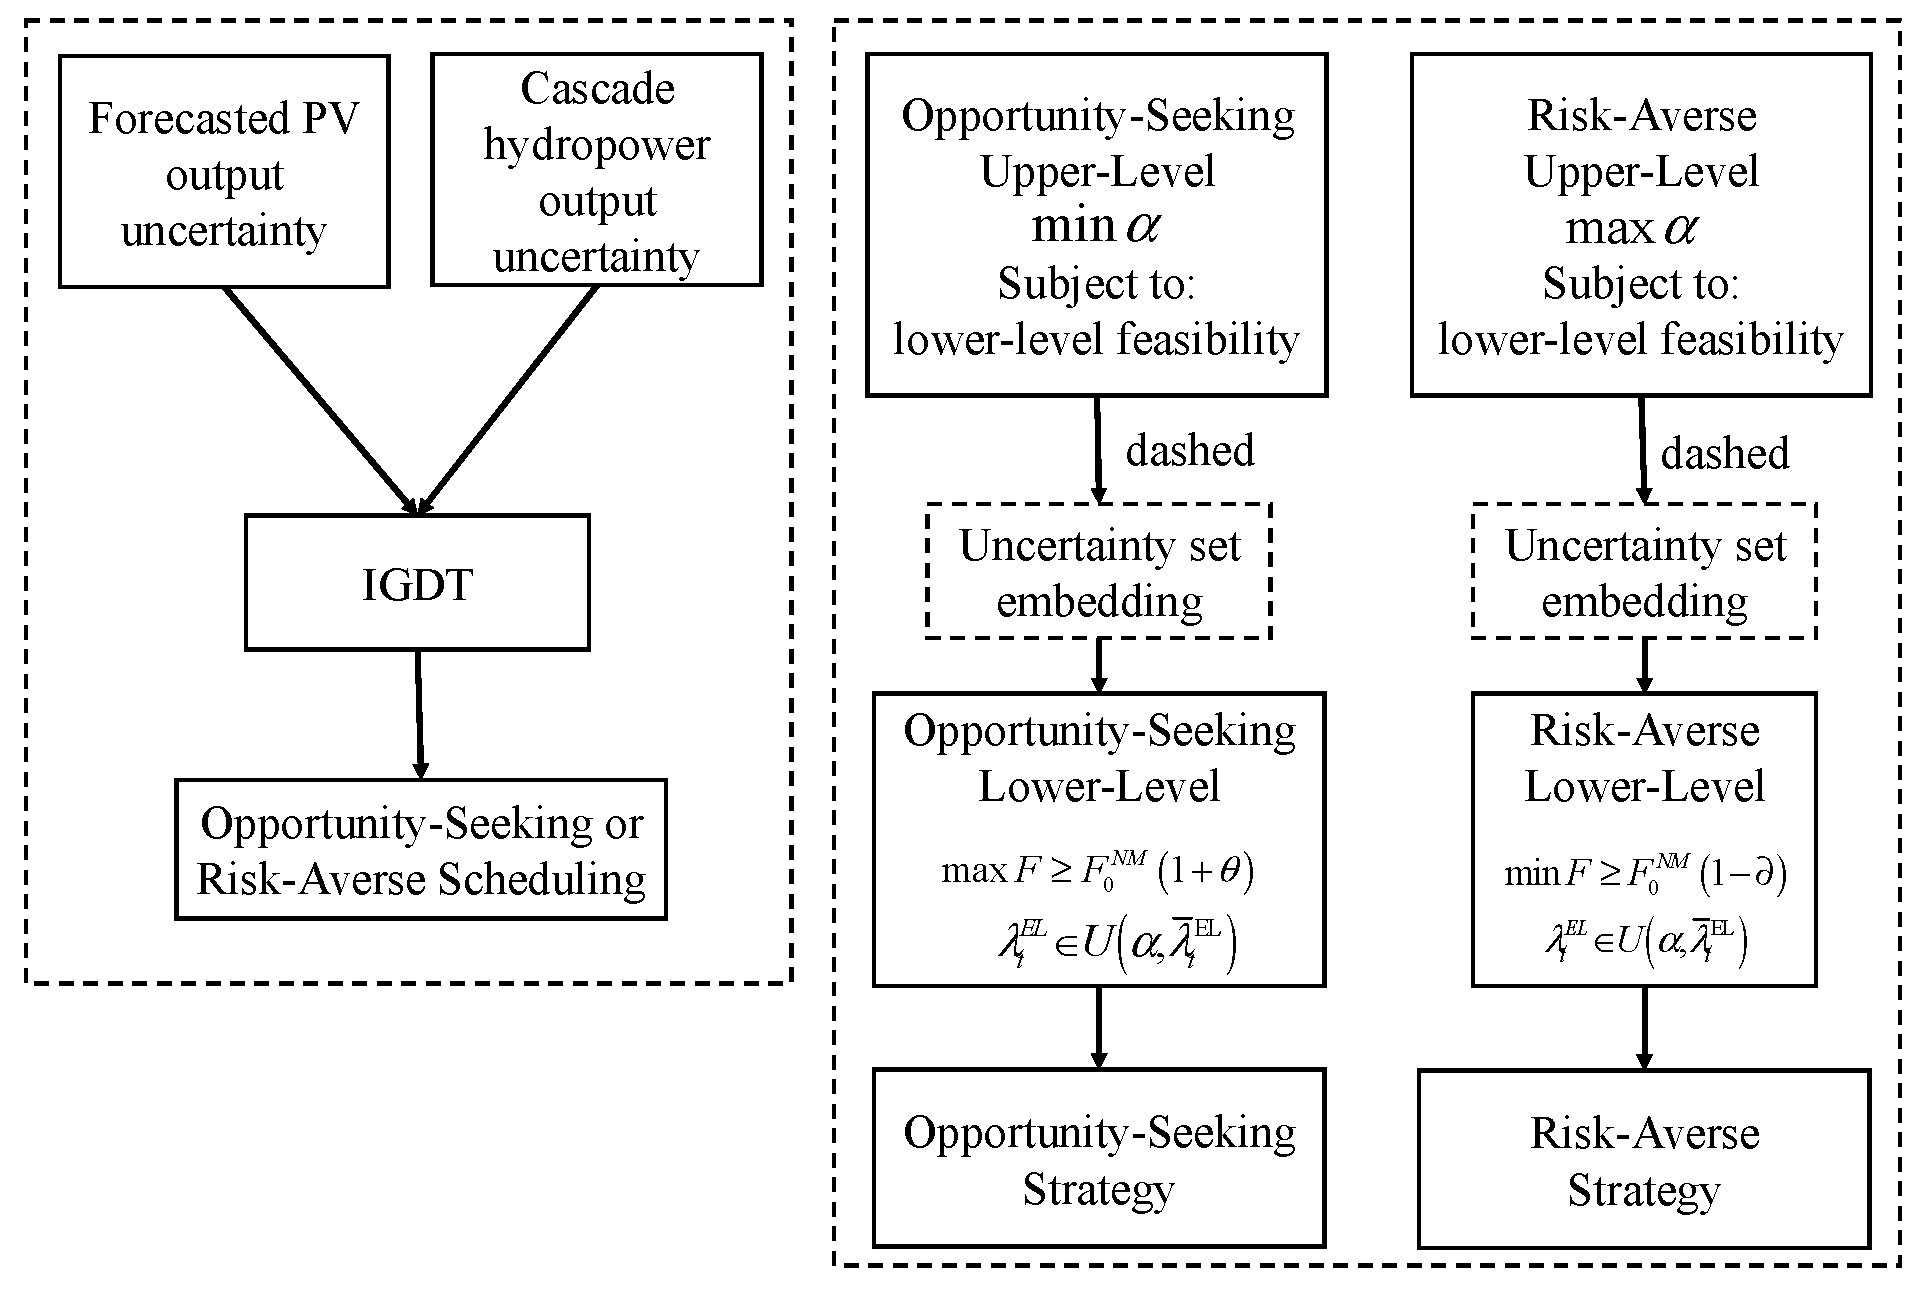
To provide a clearer understanding, Figure 3 presents the overall framework of the IGDT-based opportunity-seeking and risk-averse scheduling models. It highlights how forecasted hydropower–PV output and output deviation jointly inform the upper-level decision-making process, which determines the acceptable uncertainty horizon. The lower-level model then ensures feasibility and performance under opportunity-seeking (OS) or risk-averse (RA) conditions through a bi-level optimization structure with embedded uncertainty sets.

3.1. Model Motivation and IGDT Framework

In contrast to traditional robust optimization, which requires clearly defined upper and lower bounds for uncertain parameters, the IGDT allows uncertainty to be modeled as imprecise sets, such as envelope sets, fractional deviation sets, or ellipsoidal sets. In this model, the uncertainty of key variables, including cascade hydropower output and PV generation, is modeled using a fractional uncertainty set. Let λ ¯ t E L denote the forecasted value of a general uncertain variable at time t , and let α 0 denote the uncertainty horizon, a decision parameter that quantifies the maximum deviation that the system can tolerate without compromising feasibility or reliability. The actual value of λ t E L is assumed to lie within the following uncertainty set:
λ t E L ( 1 α ) λ ¯ t E L ,   ( 1 + α ) λ ¯ t E L , α 0
When α = 0 , the model assumes perfect forecast conditions. As α increases, the system becomes more tolerant of deviations from nominal values, thereby enhancing its robustness against uncertainty. This formulation enables the model to flexibly evaluate system vulnerability under varying levels of uncertain disturbance. To accommodate different risk attitudes in the presence of uncertainty, this study develops three IGDT-based scheduling strategies. The RN disregards uncertainty, relying solely on forecasted values for optimization, serving as a baseline scenario. The OS assumes favorable deviations from forecasts, such as higher-than-expected PV generation. In contrast, the RA adopts a conservative stance, optimizing performance under worst-case conditions to ensure that the system meets its operational targets even in adverse scenarios. By integrating the IGDT into the short-term scheduling of the cascade hydro–PV hybrid system, the proposed model facilitates risk-aware decision-making, enhancing both system reliability and economic efficiency in uncertain and dynamically changing environments.

3.2. Bi-Level IGDT-Based Scheduling Model

3.2.1. Model Assumptions

To begin with, the IGDT model introduces an uncertainty horizon parameter, denoted by α , which quantifies the system’s tolerance to deviations from forecasted values. A larger α indicates that the system can withstand greater levels of uncertainty. In this model, a predefined generation baseline F 0 N M , derived from the risk-neutral (RN) scheduling model, serves as the performance threshold. The expected daily generation F under uncertainty must be maintained relative to this baseline. Furthermore, the system’s input forecasts, hydropower generation schedule, and PV output forecasts are assumed to vary within a bounded fractional uncertainty set, whose size is controlled by α . Therefore, the uncertainty associated with these two variables can be expressed as
P j , t p v ( 1 α ) P ¯ j , t p v ,   ( 1 + α ) P ¯ j , t p v
P t p l a n   ( 1 α ) P ¯ t p l a n   ,   ( 1 + α ) P ¯ t p l a n  
where P ¯ j , t p v and P ¯ t p l a n   denote the forecasted PV output and the planned hydropower generation schedule, respectively. The parameter α 0 , 1 defines the relative uncertainty bound.

3.2.2. Opportunity-Seeking Model

In the OS strategy, the objective of the dispatch model is to increase power generation by tolerating greater levels of uncertainty. This approach reflects an opportunity-seeking attitude, assuming that deviations from forecasted values may lead to more favorable outcomes. The corresponding dispatch model is formulated as a bi-level optimization problem: the upper-level model minimizes the uncertainty horizon α , while the lower-level model ensures that the expected daily generation meets or exceeds a predefined performance threshold under physical, operational, and uncertainty-set constraints. The model verifies that at least one realization of uncertain parameters within the defined uncertainty set leads to a feasible and satisfactory dispatch.
(1)
Upper-Level Model
The upper-level optimization aims to minimize the uncertainty horizon α , which quantifies the extent to which the system actively accepts favorable deviations from baseline forecasts. Under an opportunity-seeking strategy, the model seeks to achieve more generation within the scope of optimistic variations, while minimizing the degree of uncertainty necessary to attain those returns.
min α
Subject to the following: the lower-level problem is feasible under α .
(2)
Lower-Level Model
The lower-level problem evaluates the system’s scheduling performance under optimistic bias, assuming upward deviations of uncertain parameters. The uncertain variables λ t E L are defined over an upper-deviating uncertainty set λ t E L 0 ,   ( 1 + α ) λ ¯ t E L , where α 0 denotes the uncertainty horizon, reflecting the system’s willingness to embrace favorable deviations. The model ensures that the resulting total generation F exceeds a predefined opportunity threshold F O , while maintaining operational feasibility under the given uncertainty set. Specifically, the opportunity threshold is defined as F O = F R N 1 + θ , where θ is the opportunity margin. The goal of the lower-level model is to identify at least one feasible realization of the uncertain vector λ t E L within its admissible range, such that all system constraints (Equations (1)–(28)) are satisfied.
Find feasible F , such that
s . t . max F F O F O = F R N 1 + θ λ t E L 0 ,   ( 1 + α ) λ ¯ t E L Equation .   ( 1 ) ( 28 )

3.2.3. Risk-Averse Model

In the RA strategy, the objective of the dispatch model is to maximize the system’s robustness against the adverse deviations of uncertain parameters. This approach reflects a risk-averse attitude, where forecast errors are expected to result in unfavorable outcomes. The corresponding dispatch model is also formulated as a bi-level optimization problem: the upper-level model maximizes the uncertainty horizon α , while the lower-level model ensures that the expected daily generation meets or exceeds the performance threshold for all realizations within the uncertainty set. This guarantees that the system maintains operational feasibility even under the worst-case deviations.
(1)
Upper-Level Model
The upper-level optimization seeks to maximize the uncertainty horizon α , which quantifies the system’s tolerance to unfavorable deviations from baseline forecasts. Under a risk-averse strategy, the model aims to capture sufficient generation within the pessimistic deviation range while maximizing the level of uncertainty that can be tolerated.
max α
Subject to the following: the lower-level problem is feasible under α .
(2)
Lower-Level Model
The lower-level problem evaluates the system’s scheduling performance under pessimistic bias, assuming the downward deviations of uncertain parameters. The uncertain variables are defined over downer-deviating uncertainty set λ t E L ( 1 α ) λ ¯ t E L ,   0 , where α 0 denotes the uncertainty horizon, reflecting the system’s tolerance to unfavorable deviations. The model ensures that the resulting total generation F exceeds a predefined risk threshold F R , while maintaining feasibility under all possible realizations in the uncertainty set. Specifically, the risk threshold is defined as F R = F R N 1 , where is the risk margin. The goal of the lower-level model is to identify all realizations of the uncertain vector λ t E L within its admissible range and satisfy all system constraints (Equations (1)–(28)).
Find feasible F , such that
s . t . min F F R F R = F R N 1 λ t E L ( 1 α ) λ ¯ t E L ,   0 Equation .   ( 1 ) ( 28 )

3.3. Reformulation into Single-Level MILP

To address the computational complexity of the original bi-level scheduling model based on IGDT, we convert the bi-level structure into a simple and tractable single-level optimization problem. The core idea is to embed the feasibility conditions of the lower-level model—the OS and the RA—into the upper-tier formulation by explicitly expressing the uncertainty-set and the performance constraints. This reformulation allows the resulting model to be solved using a standard MILP solver, resulting in a significant improvement in computational efficiency while retaining the underlying risk-aware decision logic of the IGDT. The model conversion process is shown in detail below, and the reformulated OS model and RA model will be presented separately.

3.3.1. Reformulated OS Model

To improve computational efficiency, the bi-level optimization model under the OS strategy is reformulated as a single-level problem by embedding the lower-level constraints into the upper-level formulation. The following steps outline the reformulation process.
  • Explicit Definition of Uncertainty Set
In the bi-level model, the uncertain parameters are abstractly represented by the variable λ t E L , which denotes system inputs subject to bounded deviations within the uncertainty horizon α . In this study, λ t E L is concretely instantiated by two key variables: the PV power output P j , t p v and the cascade hydropower generation schedule P t p l a n   , both of which are assumed to deviate optimistically under the opportunity-seeking strategy. These deviations are defined as linear perturbations around their nominal forecasts:
P j , t p v = P ¯ j , t p v ( 1 + α ) , P t p l a n   = P ¯ t p l a n   1 + α
This explicit mapping from λ t E L to problem-specific decision variables allows for the direct embedding of the uncertainty set into the reformulated single-level model, facilitating tractable optimization while preserving the original IGDT decision logic.
2.
Embedding Lower-Level Objective as a Constraint
In the original bi-level IGDT model, the lower-level model ensures that the expected daily generation F meets or exceeds a predefined performance threshold under physical, operational, and uncertainty-set constraints. To convert the model into a tractable single-level formulation, the lower-level objective is embedded into the upper-level model as an explicit constraint. Specifically, the opportunity threshold F O is used as a performance benchmark, and the constraint F F O is imposed in the upper-level model to guarantee that the generation under uncertainty remains acceptable. The physical and operational constraints of the original lower-level model are preserved in the single-level formulation.
min   α s . t .   F F O F O = F R N 1 + θ P j , t p v = P ¯ j , t p v ( 1 + α ) P t p l a n   = P ¯ t p l a n   1 + α Equation .   ( 1 ) ( 28 )
This reformulation allows for a direct solution via conventional optimization solvers, enabling the system to adaptively pursue enhanced generation under optimistic deviations while maintaining reliability.

3.3.2. Reformulated RA Model

Similarly, the bi-level optimization model under the RA strategy is reformulated as a single-level problem. The following steps outline the reformulation process.
  • Explicit Definition of Uncertainty Set
In the RA strategy, the PV power output P j , t p v and the cascade hydropower generation schedule P t p l a n   are assumed to deviate pessimistically under the risk-averse strategy. These deviations are defined as linear perturbations around their nominal forecasts:
P j , t p v = P ¯ j , t p v ( 1 α ) , P t p l a n   = P ¯ t p l a n   1 α
2.
Embedding Lower-Level Objective as a Constraint
To convert the RA model into a tractable single-level formulation, the lower-level objective is embedded into the upper-level model as an explicit constraint. Specifically, the opportunity threshold F R is used as a performance benchmark, and the constraint F F O is imposed in the upper-level model to guarantee that all the generation under uncertainty remains acceptable. The physical and operational constraints of the original lower-level model are preserved in the single-level formulation.
max   α s . t .   F F R F R = F R N 1 P j , t p v = P ¯ j , t p v ( 1 α ) P t p l a n   = P ¯ t p l a n   1 α Equation .   ( 1 ) ( 28 )
This formulation ensures that the system achieves risk-averse scheduling with guaranteed generation performance, even under the most adverse realizations of uncertainty.

3.4. Solution Procedure

The procedure for solving the proposed complementary hydro–PV scheduling model, aimed at maximizing renewable energy utilization under uncertainty, is outlined as follows:
  • Step 1: Data initialization and parameter setup. Initialize scheduling data and key parameters, including the cascade hydropower generation plan, forecasted PV output, section output limits, ramping constraints, reservoir water levels, turbine capacities, and relevant operational data. Establish initial values for the opportunity or robustness deviation factors and generation thresholds based on the selected risk attitude (opportunity-seeking or risk-averse).
  • Step 2: IGDT strategy selection and model formulation. Choose between the OS or the RA IGDT scheduling strategy and formulate the corresponding bi-level optimization model accordingly.
  • Step 3: Transformation into single-level optimization. Apply model transformation techniques described in previous sections to convert the bi-level IGDT optimization problem into a solvable single-level optimization model. Embed the uncertainty set within the constraints using fractional deviation expressions.
  • Step 4: Uncertainty modeling. Use the IGDT modeling approach to construct uncertainty variable bias models.
  • Step 5: Model implementation and solution. Formulate the unified scheduling model as a MILP problem by incorporating the objective function and all relevant operational constraints. The model is structured to ensure linearity and tractability, facilitating compatibility with standard mathematical programming solvers.
  • Step 6: Results analysis and evaluation. Extract optimal uncertainty horizons and planned outputs for hydropower and PV units. Analyze scheduling outcomes such as unit commitment decisions, reservoir management strategies, and section output flows. Evaluate the OS or RA provided by the model under uncertainty scenarios.

4. Case Study

This section conducts a case study designed to validate the proposed short-term scheduling model for a cascade hydropower–PV hybrid system under uncertainty. The objective is to evaluate the system’s scheduling performance under different risk strategies, with a specific focus on its ability to handle fluctuations in PV output and maximize the utilization of clean energy.

4.1. System Configuration and Parameter Description

Figure 4 illustrates a schematic configuration of a watershed cascade system in Southwest China. The cascade hydropower–PV hybrid system consists of four hydropower stations and two PV clusters, which are distributed across a river basin and interconnected via four transmission-constrained sections. Each hydropower plant comprises multiple generating units, while the PV clusters are integrated based on regional solar resource availability. The upstream and downstream relationships, reservoir characteristics, and time-delay water flow between stations are explicitly modeled to capture the realistic hydrological dynamics.
In this case, a typical day during the dry season (from October to the following April) is selected to reflect representative operational conditions. The scheduling horizon spans 24 h and is discretized into 96 intervals, each lasting 0.25 h. The cascade PV hybrid system is segmented into four transmission-constrained sections, with each section comprising specific hydropower stations and PV clusters. To ensure operational feasibility and maintain grid stability, transmission and load capacity constraints are imposed on a section-wise basis. Ramping constraints for hydropower units are set at 60 MW per interval, reflecting realistic operational flexibility. All the remaining physical and operational parameters are summarized in Table 2, which provides the key input data for the proposed scheduling model.
The MILP model is implemented in MATLAB R2018b with YALMIP (20230622) and solved using Gurobi 11.0.1 on a personal computer (AMD Ryzen 5 3500U, 12 GB RAM, Windows 10, 64-bit).

4.2. Comparative Analysis of Risk-Aware Scheduling Strategies

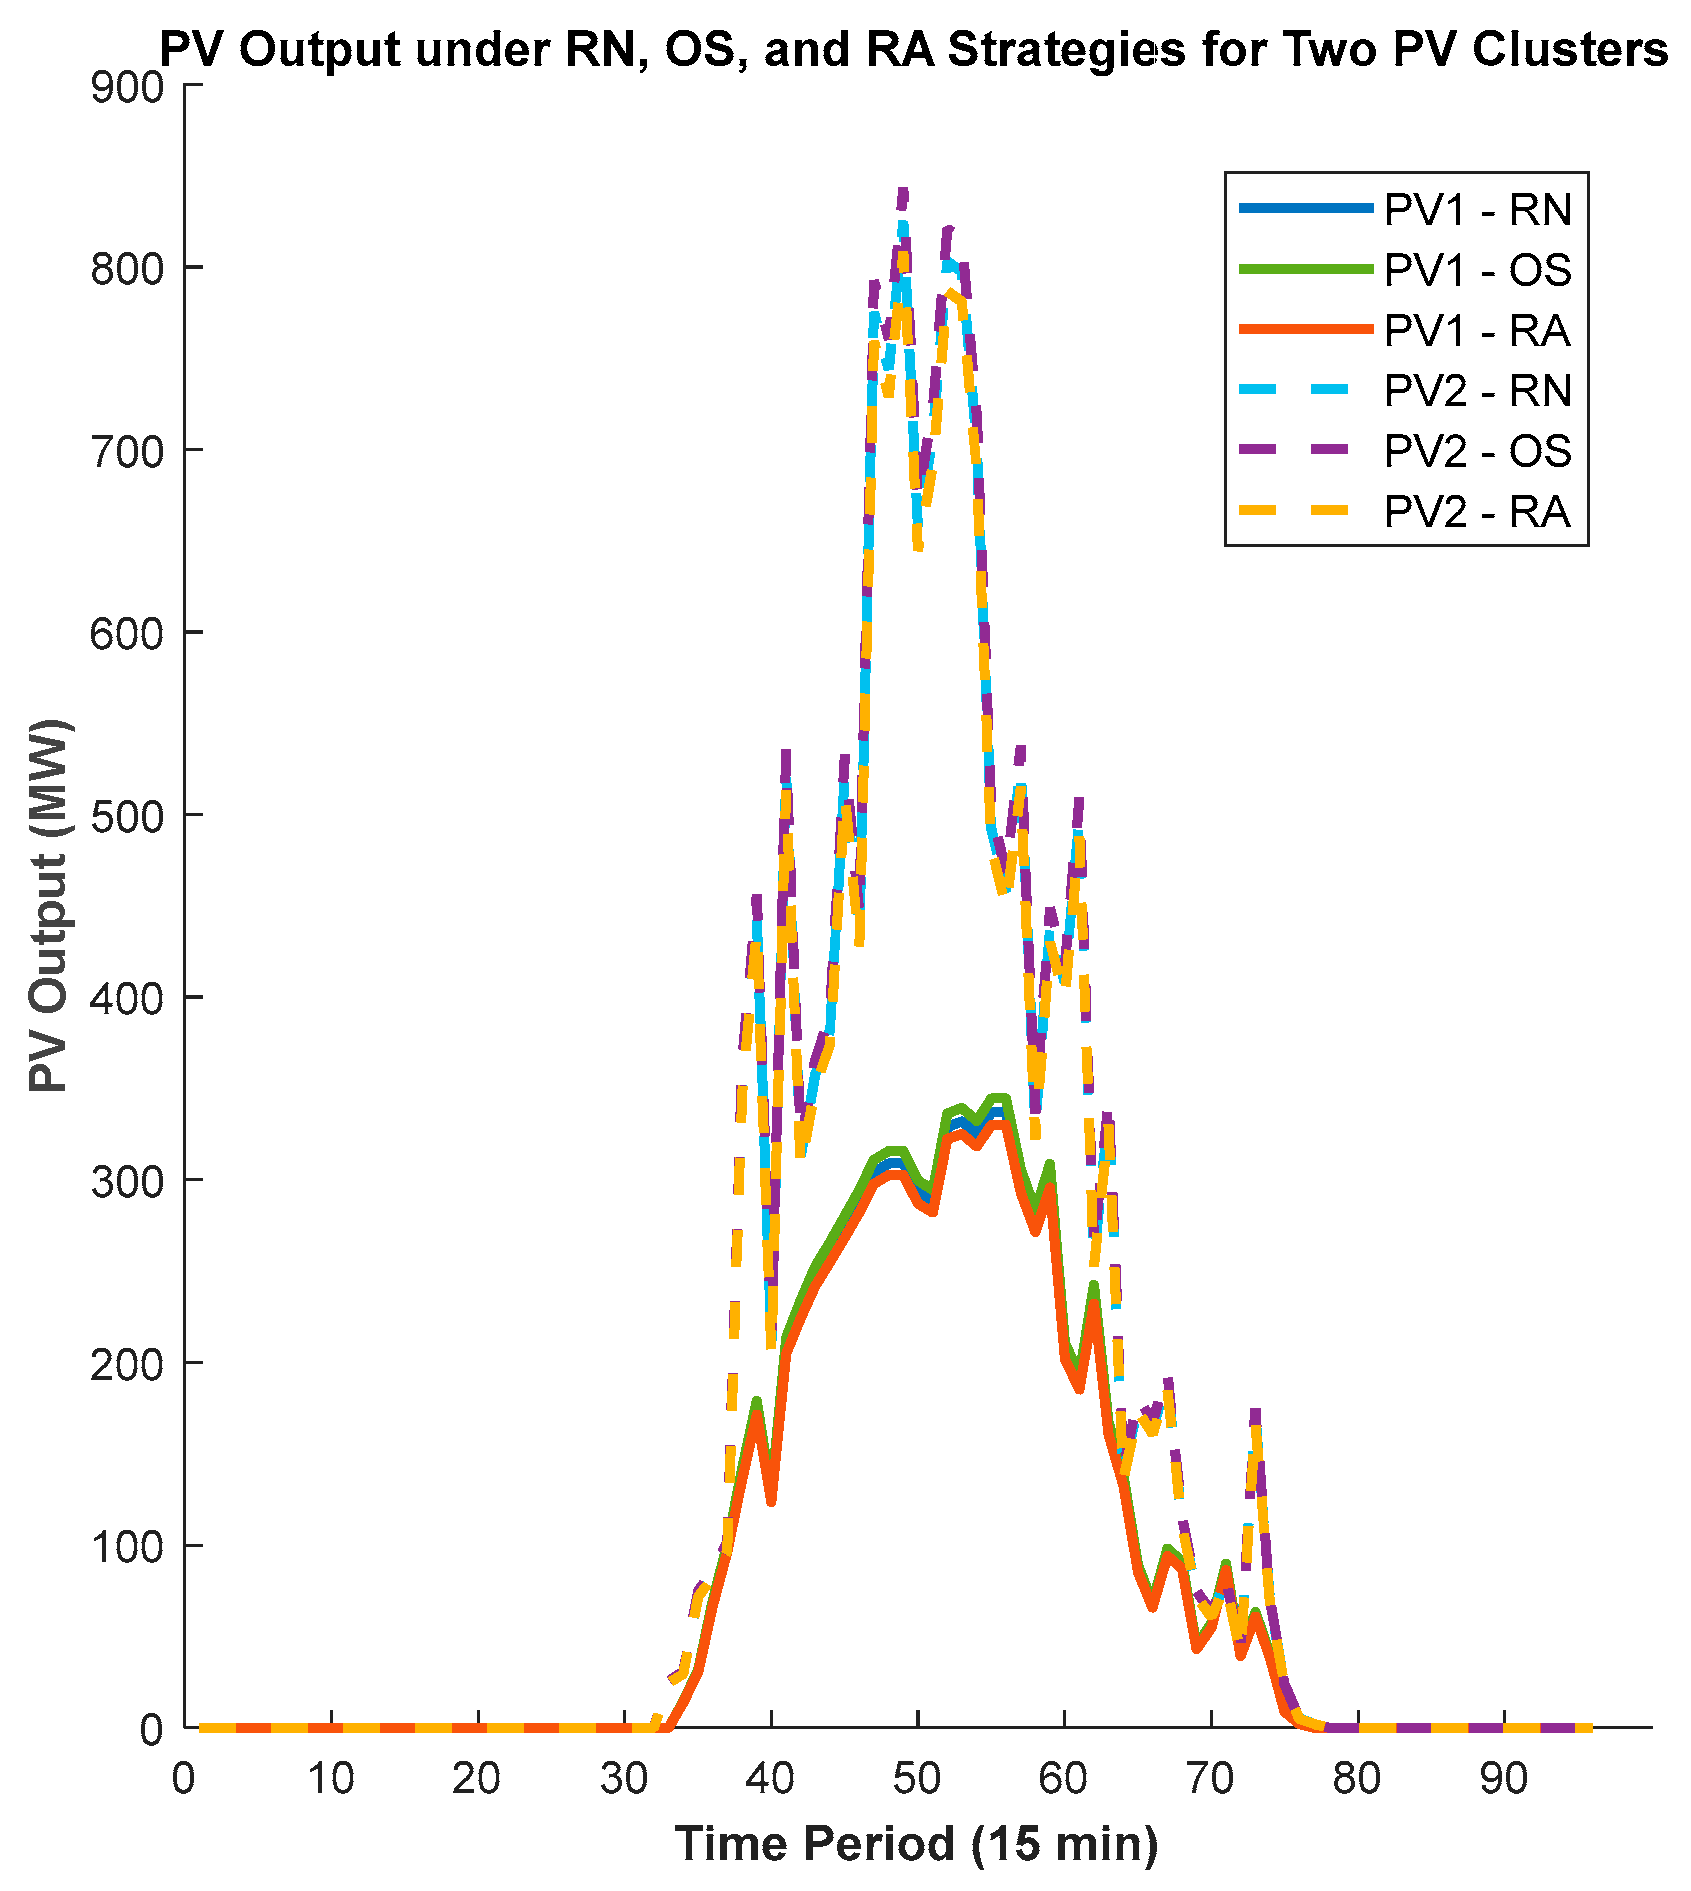
Figure 5 compares the realized PV output trajectories of the two clusters under the RN, OS, and RA strategies. Solid lines denote Cluster 1, whereas dashed lines denote Cluster 2. Table 2 further quantifies the differences in peak output, mean output, standard deviation and utilization.
Compared with the baseline RN case, the OS strategy raises the average PV utilization by approximately 2.2% (Table 3), capturing more favorable irradiance while slightly increasing the output volatility. In contrast, the RA strategy deliberately curtails ≈ 2% of the nominal PV energy, thereby lowering the standard deviation by the same order of magnitude and providing smoother profiles within the predefined uncertainty set.

4.2.1. Risk-Neutral Strategy

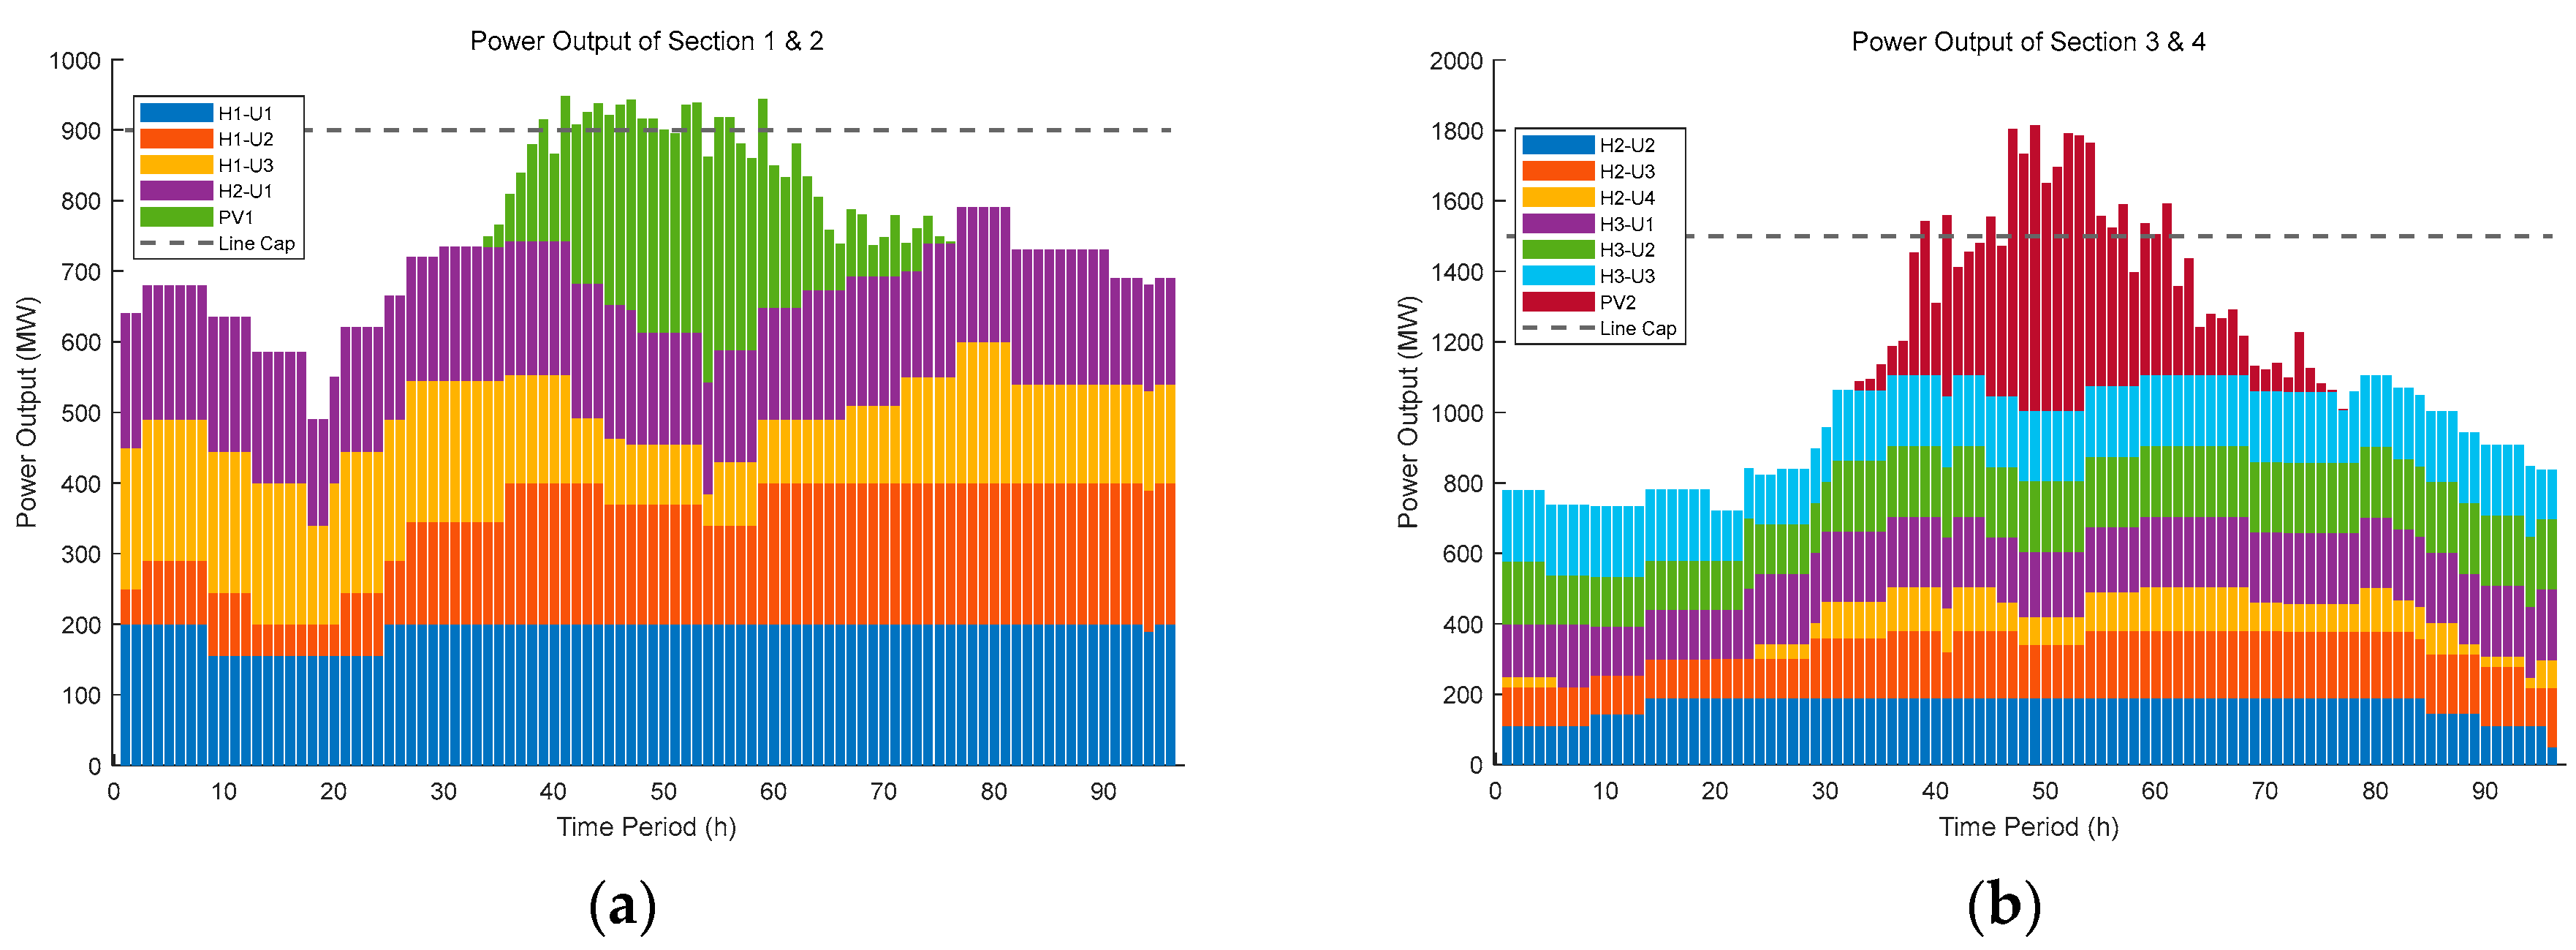
Figure 6 illustrates the power output scheduling results under the RN strategy. The system operates strictly based on the forecasted day-ahead generation plans, without considering deviation margins or risk preferences. Hydropower units follow scheduled trajectories, while PV stations are dispatched according to their expected output curves. This coordinated strategy aims to minimize curtailment and avoid grid transmission violations.
As shown in Figure 6a, Hydropower Plants 1 and 2 in Sections 1 and 2 effectively coordinate with PV Cluster 1 by adjusting their output in response to PV fluctuations—decreasing generation during PV peaks and ramping up during troughs. This typical “peak shaving and valley filling” strategy smooths the overall output and avoids energy curtailment. In contrast, Figure 6b illustrates that Plants 2 to 4 and PV Cluster 2 in Sections 3 and 4 operate within the defined transmission capacity limits, demonstrating efficient and balanced resource allocation.
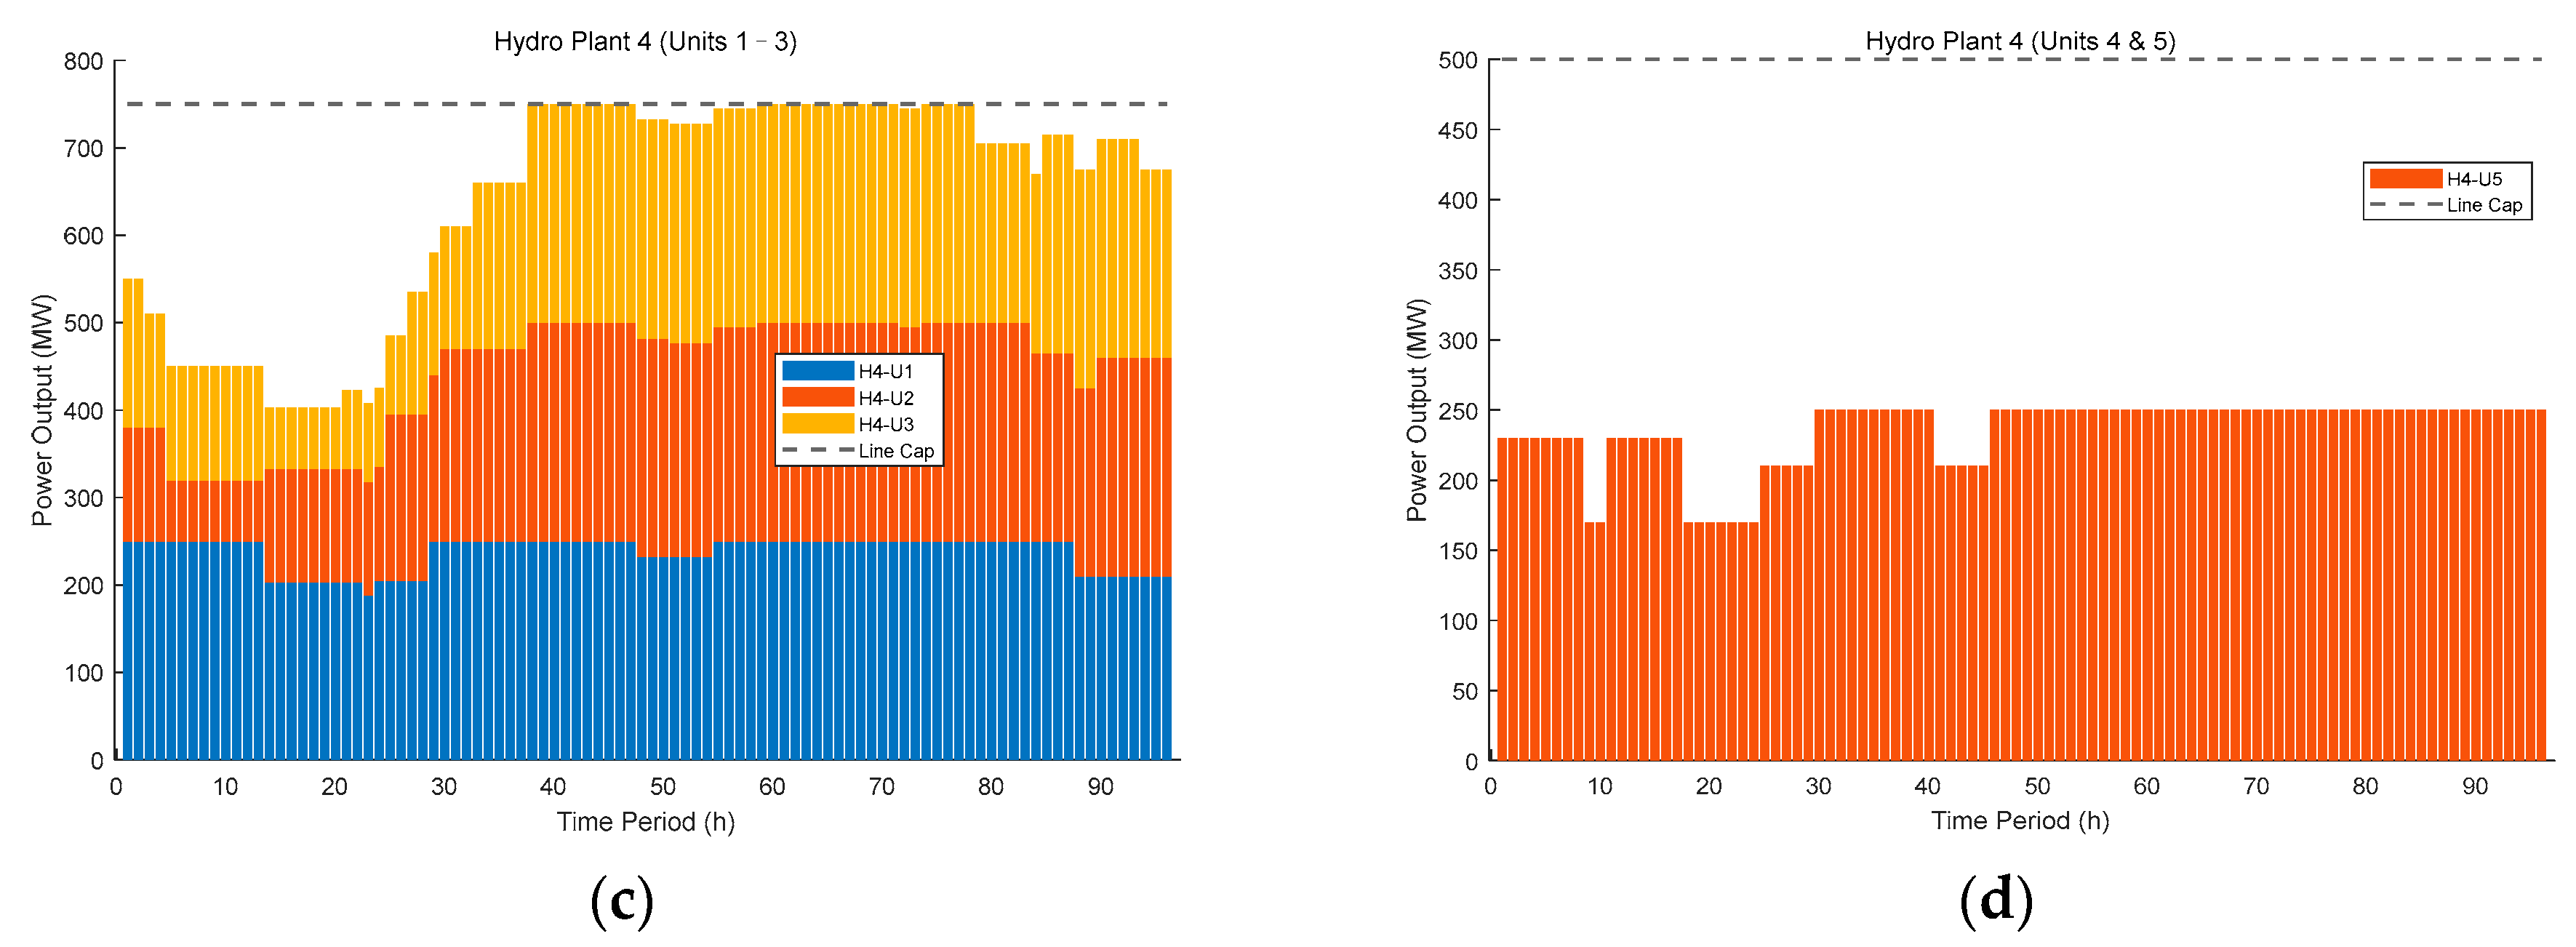
Figure 6c,d present the scheduling characteristics of Hydroelectric Plant 4. Units 1 to 3 demonstrate dynamic ramping behavior, making them well-suited for fast-response regulation tasks. In contrast, Unit 4 remains offline, while Unit 5 operates steadily in a base-load mode, ideal for continuous power generation with minimal start-up or shut-down events. This functional division between flexible ramping units and stable base-load units enhances overall dispatch adaptability and contributes to improved operational efficiency.
In summary, the NM strategy follows the forecasted generation profiles without considering uncertainty margins. It facilitates stable and coordinated dispatch between hydropower and PV units, ensures the full utilization of renewable resources, and avoids overcommitment and transmission limit violations. As a result, it serves as a benchmark for evaluating the performance of risk-aware strategies in subsequent sections.

4.2.2. Opportunity-Seeking Strategy

To explore potential economic benefits under favorable PV generation scenarios, the OS strategy introduces an optimistic bias into the PV forecast. In this setting, the hydropower generation plan is deliberately elevated, and PV output is allowed to exceed expected values within a specified deviation margin. The objective is to maximize the expected consumable energy while accepting a higher level of operational risk. Compared with the risk-neutral strategy, the OS approach exhibits a more aggressive scheduling posture, fully mobilizing both hydropower and PV resources.
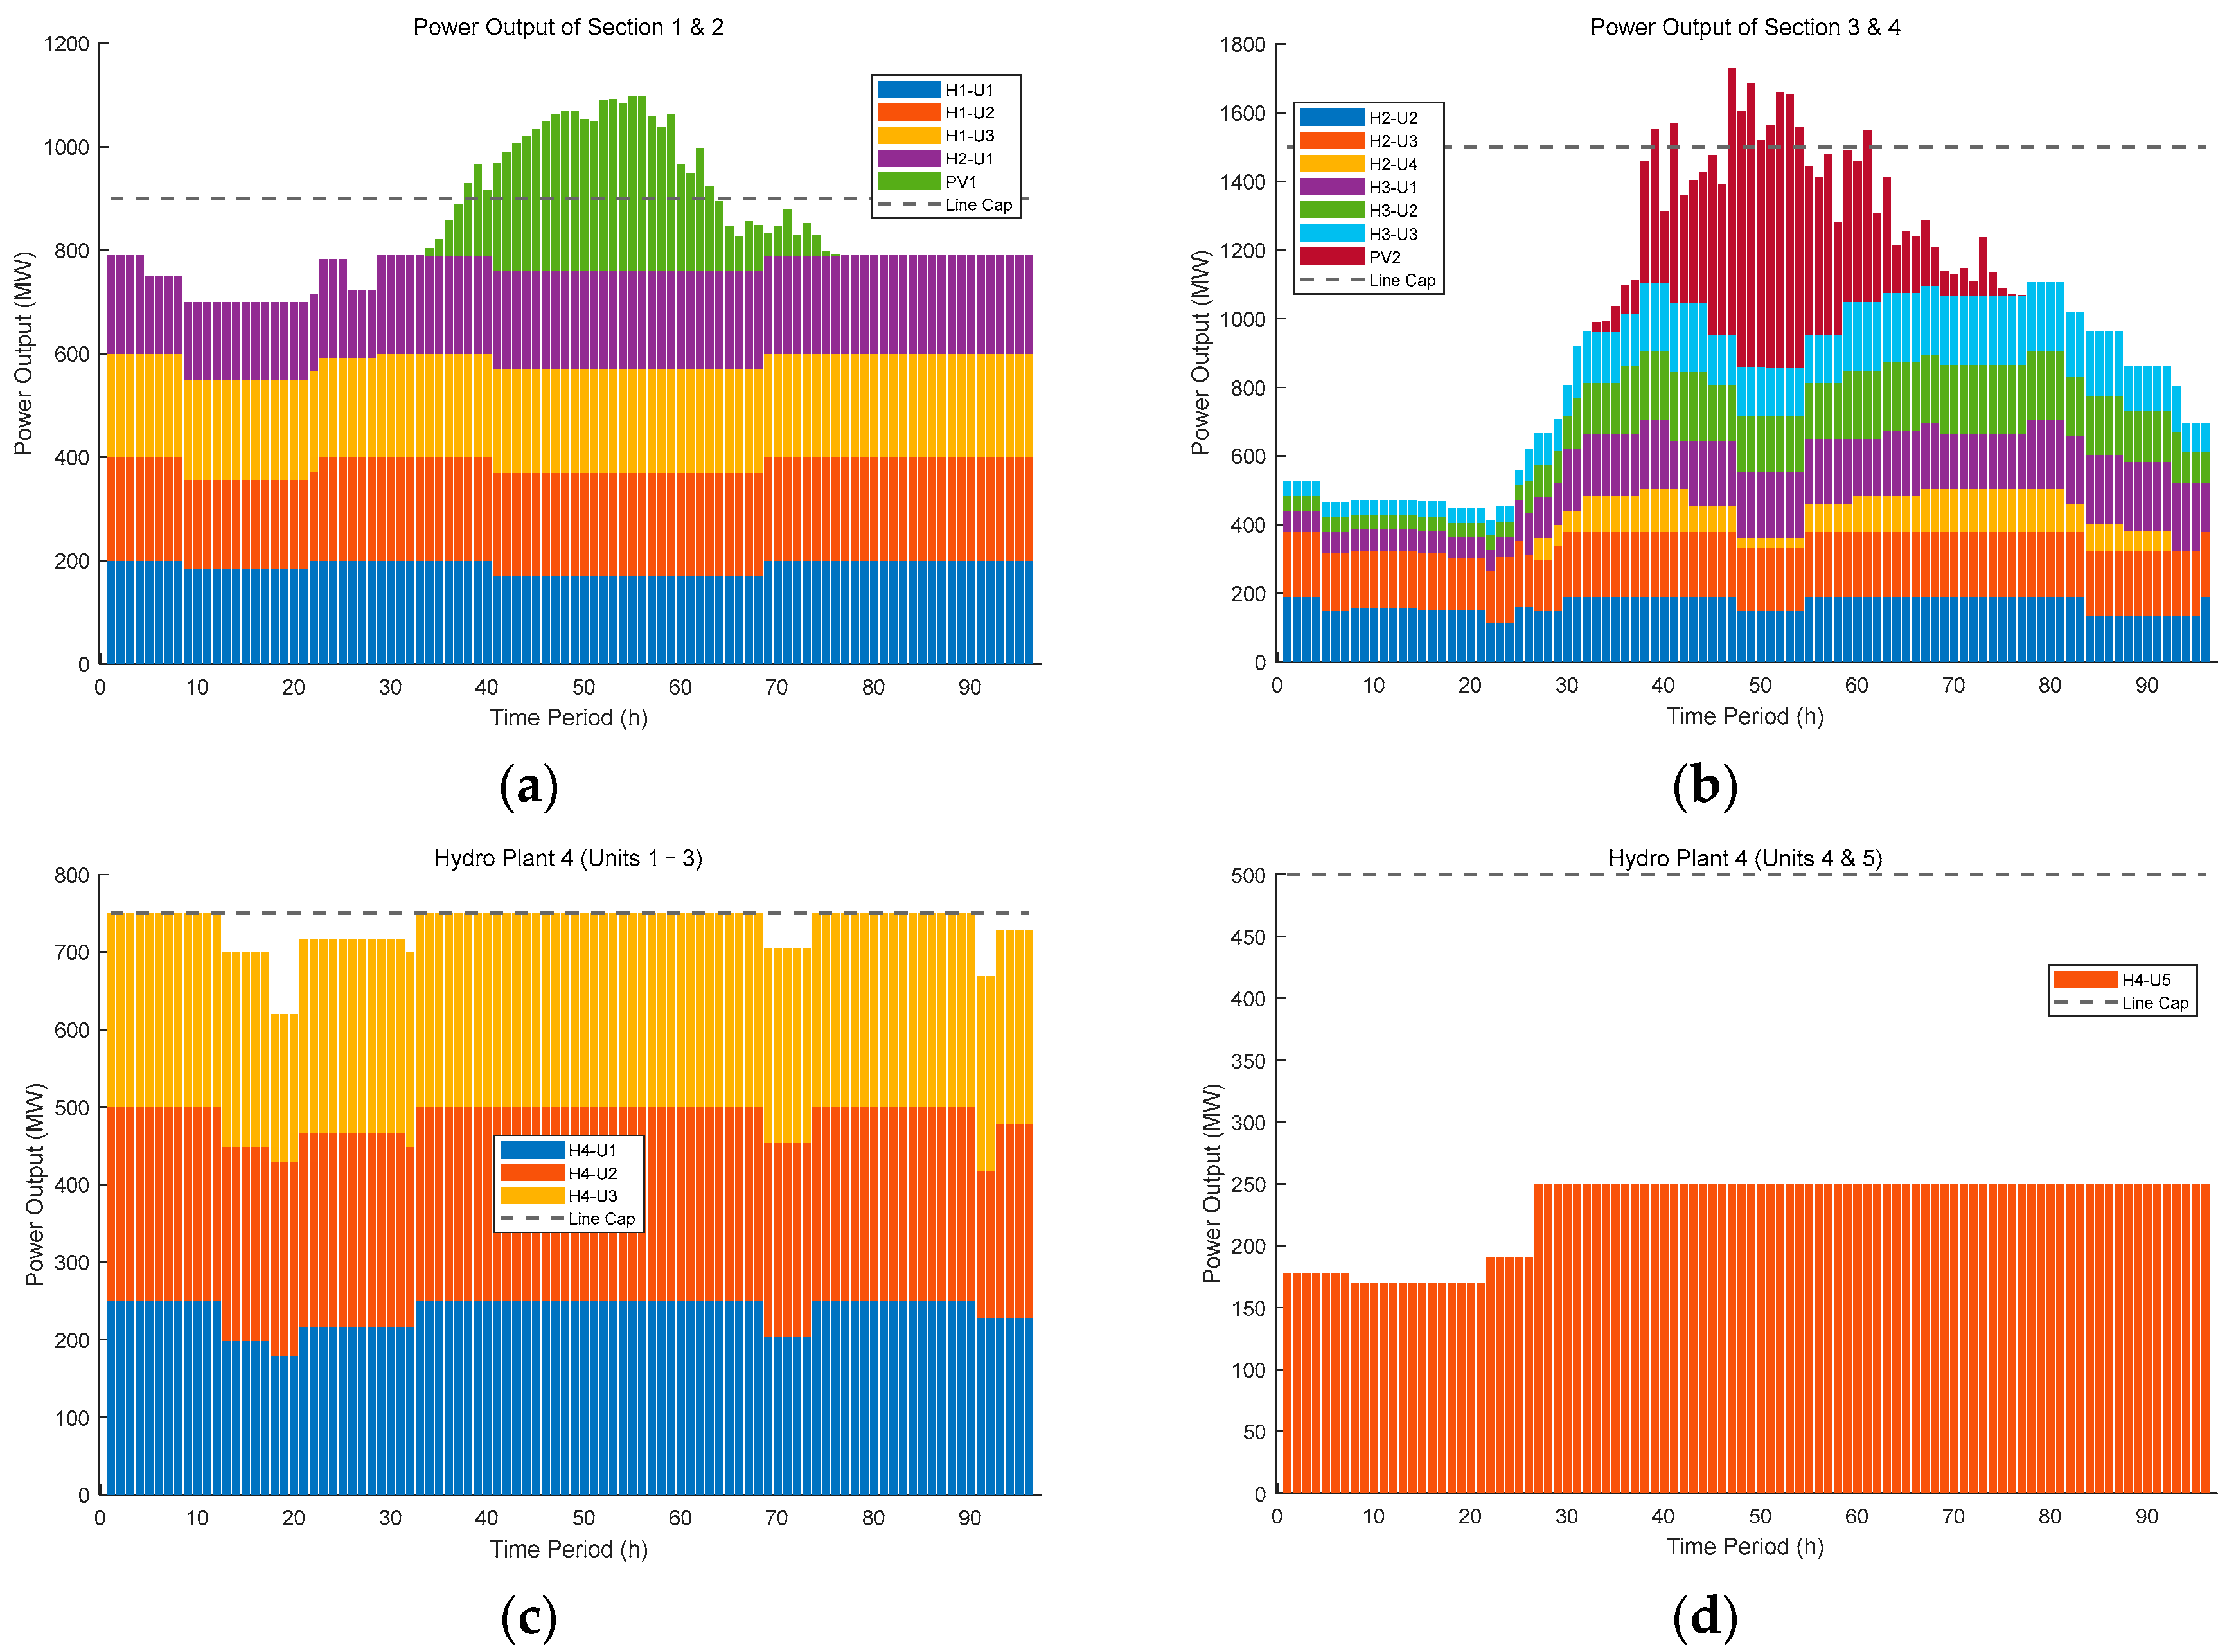
Figure 7 illustrates the scheduling results of the cascade hydro–PV system under the OS strategy. This strategy capitalizes on favorable PV forecast deviations by allowing upward adjustments in both hydropower plans and PV output within predefined uncertainty bounds. By tolerating greater forecast deviations, the model aims to maximize the expected output and economic returns under optimistic scenarios.
In Figure 7a, Hydro Plant 1 (Units 1 to 3), Hydro Plant 2 (Unit 1), and PV Plant 1, scheduled in Sections 1 and 2, exhibit a noticeable increase in output compared to the risk-NM strategy. During daylight periods (approximately periods 35 to 75), when PV generation is abundant, hydropower units also sustain elevated high production levels. This joint dispatch behavior reflects the OM strategy’s tendency for simultaneous output maximization from both sources rather than conservative compensation.
Figure 7b shows the dispatch performance of Hydro Plant 2 (Units 2 to 4), Hydro Plant 3 (Units 1 to 3), and PV Plant 2 in Sections 3 and 4. During PV peak intervals, the system operates near the transmission capacity limit, illustrating a proactive scheduling response aimed at profit maximization. Unlike the NM scenario, no significant curtailment or output flattening are observed, confirming the OM strategy’s emphasis on economic efficiency.
Figure 7c,d offer further insights into the scheduling of Hydroelectric Plant 5, with Units 1 through 5 examined individually. Among them, Units 1 to 3 and Unit 5 maintain consistently high outputs across the entire scheduling horizon, with Unit 5 operating near its upper capacity limit and contributing significantly to total system generation. In contrast, Unit 4 remains offline throughout the period. This pattern reflects the OS strategy’s proactive approach to maximizing the utilization of high-capacity units, thereby enhancing system revenue under favorable conditions.
Overall, the OM strategy significantly enhances the total system output, improves PV utilization, and increases hydropower unit participation. However, this efficiency gain comes at the expense of operational flexibility. The system frequently operates near its generation and transmission capacity limits, heightening its sensitivity to forecast errors or unforeseen disturbances. Therefore, while the OM model performs effectively under stable or favorable conditions, its robustness under adverse scenarios may be limited.

4.2.3. Risk-Averse Strategy

To assess the scheduling performance of the cascade hydro–PV system under risk-averse decision-making, the RA strategy is implemented. Unlike the opportunity-seeking strategy, the RA strategy prioritizes system reliability by guaranteeing a minimum acceptable generation under worst-case deviations in both PV generation and hydropower availability. This risk-averse formulation shifts the objective from generation maximization to reliability assurance, making it particularly suitable for highly uncertain environments.
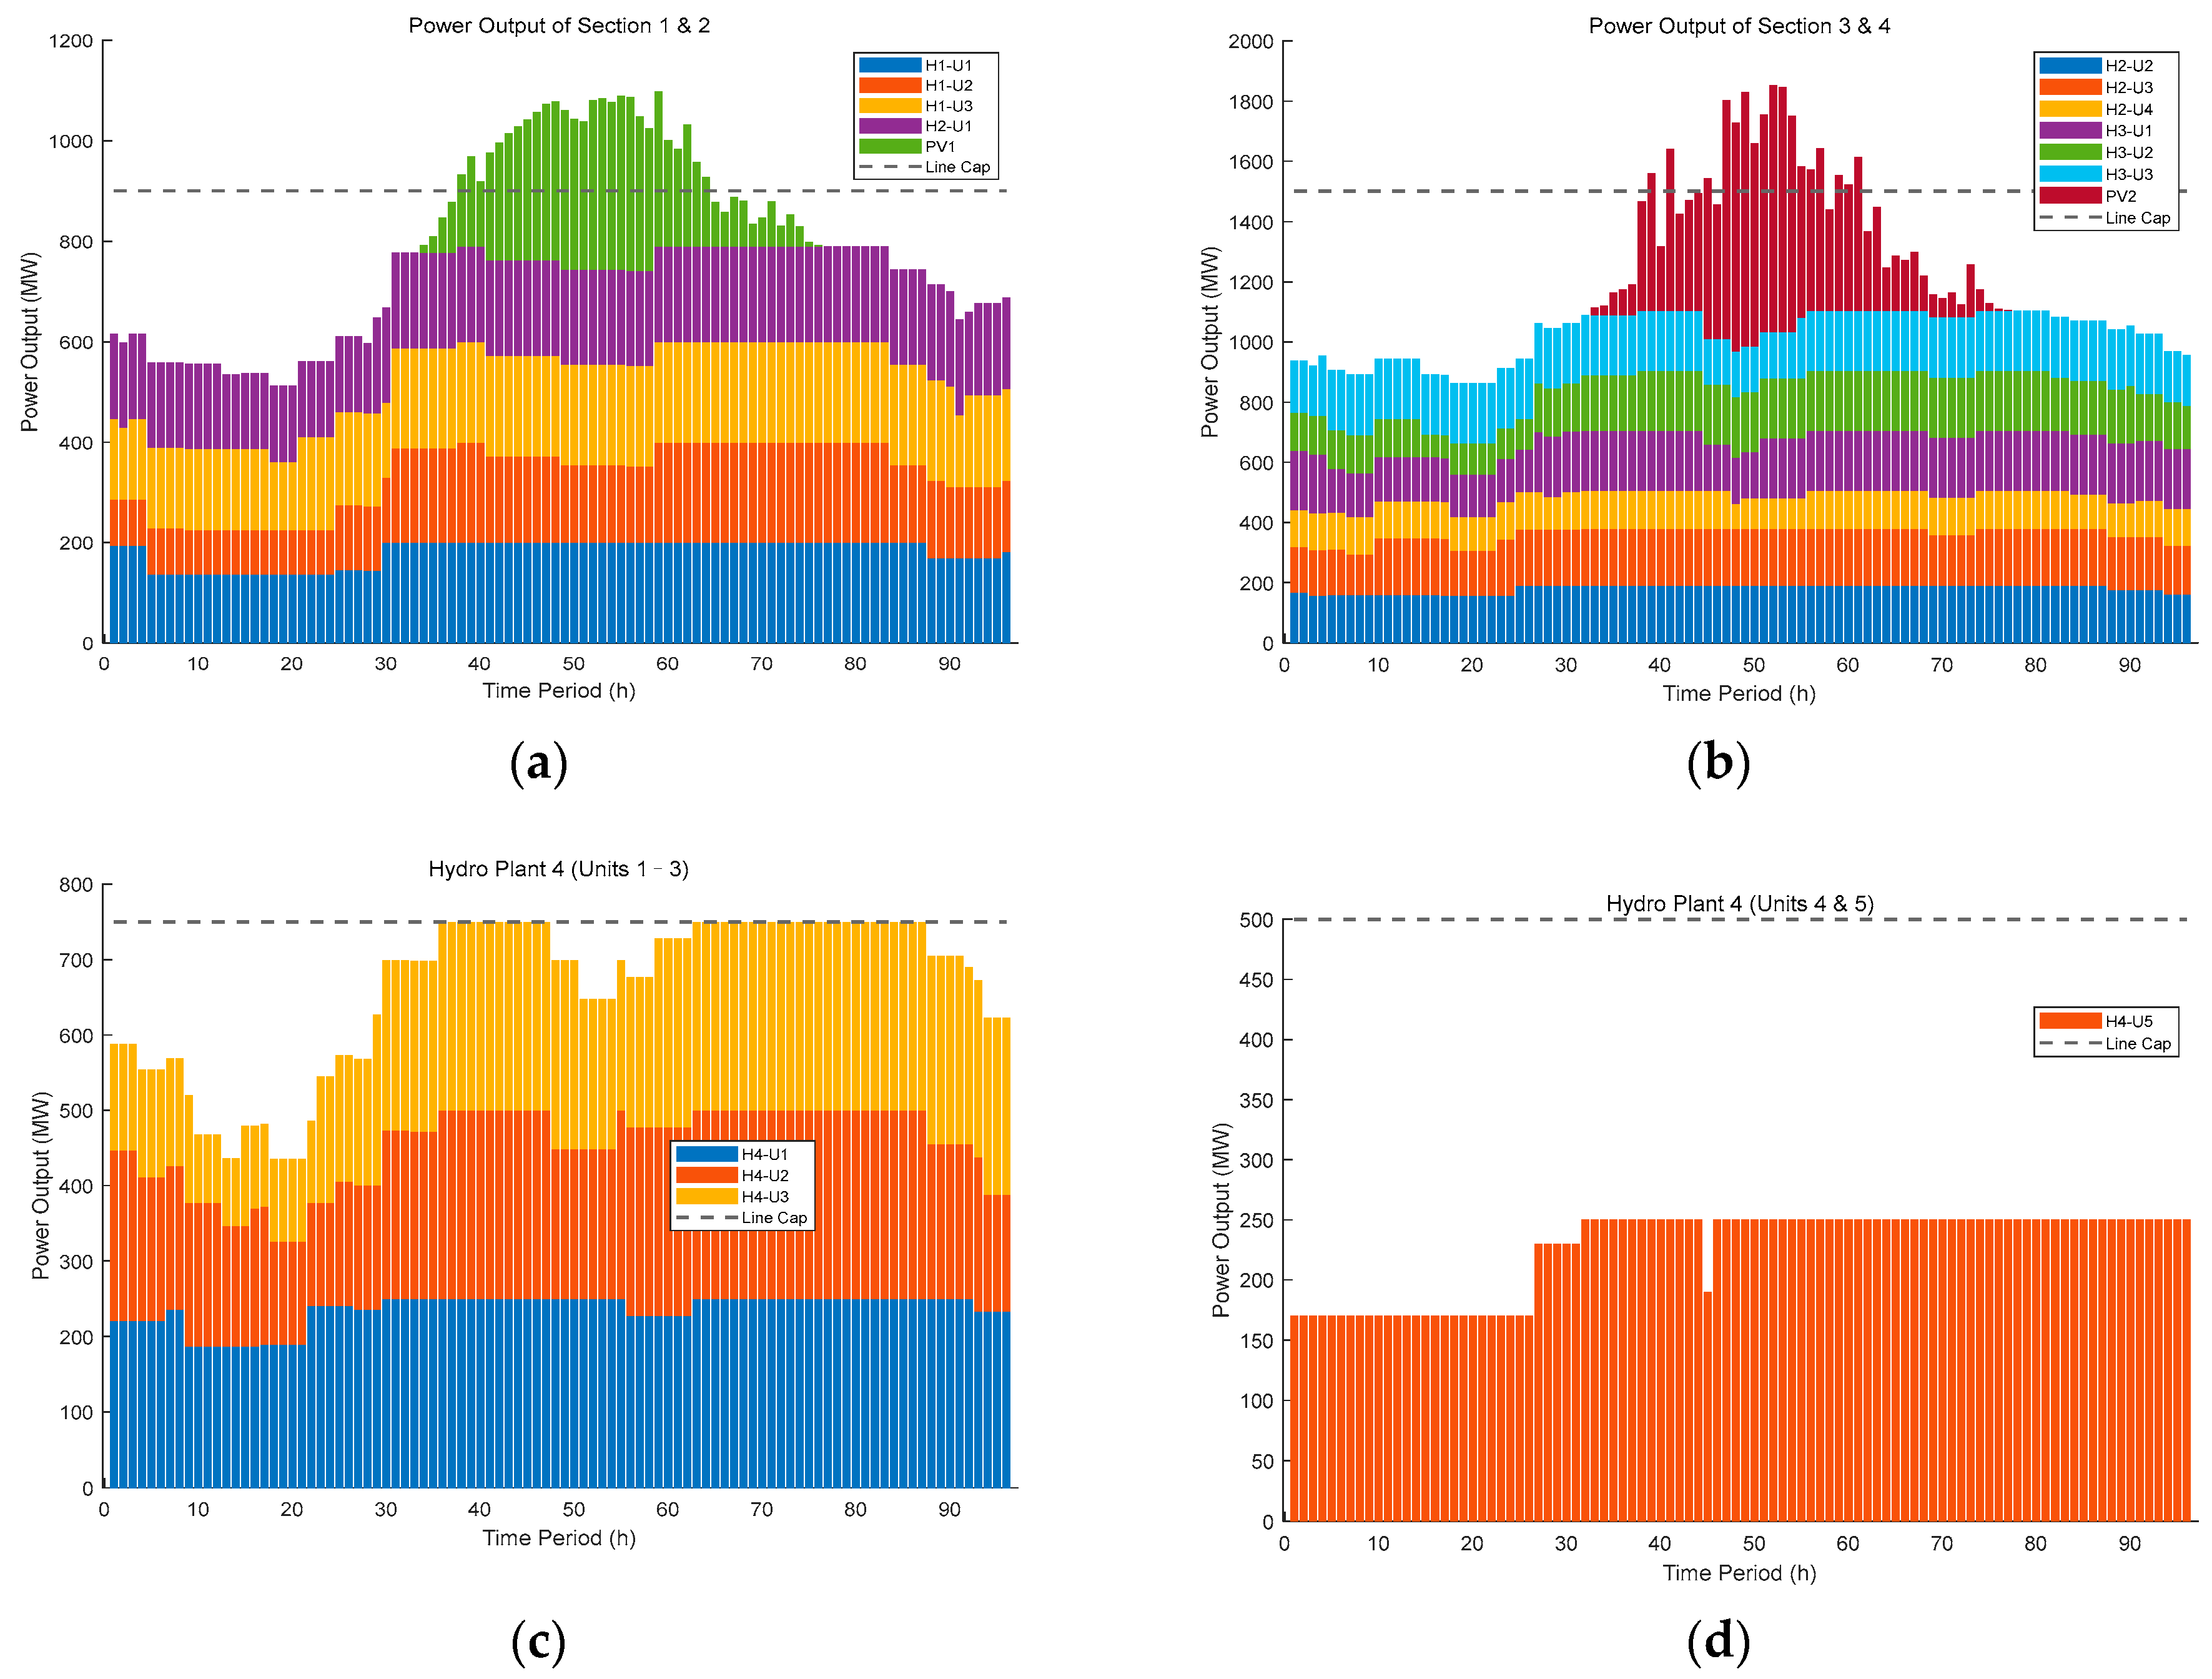
Figure 8 presents the optimal dispatch results for hydropower and PV units under the RA strategy. Compared to the RN and OS strategies, the system exhibits a significantly more conservative operational profile.
In Figure 8a,b, the power output from Hydro Plants 1 to 3 and both PV clusters demonstrates significant curtailment during high PV generation periods (approximately periods 40 to 70). This adjustment avoids overcommitment under uncertain conditions and minimizes the risk of violating transmission or generation constraints. The reduced PV utilization reflects the RM strategy’s preference for cautious scheduling over aggressive resource exploitation.
Hydropower Plants 1 and 2 (Figure 8a) follow a smooth output trajectory, reducing frequent ramping operations and ensuring a stable power supply. In contrast, Hydro Plants 2 to 4 (Figure 8b) increase their baseline generation levels to hedge against potential underperformance from PV sources, thereby shifting the system’s balancing responsibility toward dispatchable hydropower.
Figure 8c,d provide detailed insights into the dispatch behaviors of Hydro Plant 4. Units 1 to 3 offer steady support with minimal ramping, as shown in Figure 8c. In Figure 8d, only Unit 5 is dispatched, operating continuously near full capacity, while Unit 4 remains offline throughout the scheduling horizon. This reflects a conservative commitment strategy, preserving Unit 4 as backup and prioritizing the stable performance of more efficient units.
Overall, the RM strategy results in lower total energy output and the reduced utilization of intermittent PV resources. However, it significantly enhances system robustness, maintains higher spinning reserves, and avoids high-risk operating zones. These features make the RM strategy particularly suitable for highly uncertain or adverse operating conditions, where system security and guaranteed economic return are prioritized over aggressive profit seeking.

4.3. Quantitative Evaluation of RN, OS, and RA Strategies

To comprehensively assess the effectiveness of the proposed risk-aware scheduling framework, this section provides a quantitative comparison of three representative strategies: RN, OS, and RA. The evaluation is based on key performance indicators, including total renewable generation, PV utilization rate, curtailment volume, system flexibility, and operational robustness. Table 4 summarizes the comparative results, offering detailed insights into the inherent trade-offs between economic efficiency and risk mitigation associated with each strategy.
Based on the sensitivity analysis results in Section 4.4, both the opportunity margin θ and risk margin are fixed at 0.02 for this evaluation.
As shown in Table 3, the NM strategy serves as the baseline scenario, strictly following forecasted power schedules without considering deviations in PV output. It achieves balanced performance, with a total generation of 67,187.2 MWh, 100% PV utilization, and zero curtailment, reflecting stable and conservative dispatch behavior.
In contrast, the OS strategy introduces an optimistic bias in PV output and hydropower dispatch, aiming to exploit favorable scenarios. This leads to the highest total generation (68,530.9 MWh) and a PV utilization rate of 102.2%, attributed to forecast overshooting. However, this aggressive scheduling reduces the reserve margin, increases the number of transmission constraint violations (44 time steps), and causes slightly higher water spillage, indicating a trade-off with operational robustness.
The RA strategy prioritizes robustness against forecast uncertainties. By introducing a risk adjustment factor based on the IGDT, the model sacrifices part of the PV output to ensure system feasibility under worst-case conditions. Consequently, PV utilization drops to 98.0%, and total generation decreases to 65,843.4 MWh. Despite the lower generation levels, the RA strategy offers the largest reserve margin (20.1%), reflecting a conservative and resilient dispatch policy. The reduced number of constraint violations (33 time steps) further affirms its robustness.
The curtailment indicators emphasize the operational trade-offs among the three strategies. The RN strategy avoids curtailment entirely due to exact adherence to forecasts. The RA strategy leads to 115.5 MWh of PV curtailment as a safeguard for system stability. In the OS strategy, a negative curtailment value appears due to optimistic forecast adjustment, which does not imply actual overgeneration but reflects the model’s optimistic scheduling intent. Thus, it is marked as “–” for clarity.
In summary, each strategy exhibits distinct characteristics aligned with its underlying risk attitude. The RN strategy ensures a balance between utilization and feasibility. The OS strategy excels in energy exploitation under favorable conditions but poses greater operational stress. The RA strategy ensures system reliability and safety under uncertainty, making it more suitable for high-risk scenarios, despite lower renewable energy utilization.

4.4. Sensitivity Analysis

To evaluate the robustness and responsiveness of the proposed IGDT-based scheduling models, we conduct a sensitivity analysis focusing on three key aspects: the opportunity margin θ , the risk margin , and the uncertainty horizon α . The OS strategy is evaluated under varying values of θ , while the RA strategy is examined under different levels of . Their impact on the total renewable generation F is also analyzed to provide deeper insights into model behavior under different uncertainty and preference conditions.

4.4.1. Sensitivity of α and F Under Varying θ or

Table 5 reports the optimized values of α and the corresponding total generation F for the OS and RA strategies, respectively. As expected, with increasing values of θ or , the models allow for greater uncertainty levels (i.e., larger α ).
The OS model benefits from higher margin θ by aggressively increasing the uncertainty horizon α and the total generation F up to a point, beyond which the model becomes infeasible, indicating its sensitivity to overcommitment under uncertainty. Conversely, in the RA strategy, α increases nearly linearly with , but the total renewable generation F decreases, highlighting a trade-off between robustness and efficiency. These results suggest that the careful calibration of the risk parameters is essential for balancing robustness and operational performance, especially when applying the IGDT in a real scheduling environment.

4.4.2. Fixed θ or and Varying α : Stress Testing System Feasibility Under Varying Conditions

To further examine the model’s tolerance to uncertainty, Table 6 fixes the opportunity margin θ or risk margin at representative values (e.g., 0.01 and 0.02) and manually varies the uncertainty horizon α within a feasible range to observe changes in system feasibility and the generation of F .
In the OS model, increasing α up to a limit yields progressively higher F , but infeasibility breaks down beyond a critical point (e.g., α = 0.04 for θ = 0.01), illustrating a sharp feasibility boundary under aggressive uncertainty acceptance. In the RA model, feasibility rapidly deteriorates when α exceeds a relatively low threshold, confirming its conservative and cautious stance in risk handling.

4.5. Comparison with CVaR-Based Robust Scheduling

In the CVaR-based model, the violations of transmission constraints are controlled by reformulated CVaR constraints. Specifically, a risk tolerance δ and a confidence level β are used to limit the expected magnitude of line overloads beyond a specified magnitude. Unlike the IGDT, which uses a bi-level structure to explore worst-case scenarios over a range of uncertainties, the CVaR model uses expectation-based penalties and explicitly embeds risk controls in a single-level MILP. Table 7 summarizes the comparative performance metrics of the IGDT strategy and the CVaR strategy under PV forecast uncertainty and hydro–generation schedule uncertainty.
The CVaR strategy, with full PV utilization and no curtailment, has the highest total generation (69,359.2 MWh) but the lowest reserve margin (15.6%), which implies limited robustness. The RA strategy ensures the highest reserve margin (20.1%) and the lowest number of violations (34) at the cost of lower PV utilization (98.0%) and higher curtailment (462 MWh). The OS strategy favors an optimistic bias, resulting in higher generation (274,123.6 MWh) and significant PV overutilization (102.2%). The RN baseline ensures stable operation but lacks flexibility.
Overall, the IGDT-based strategies (OS and RA) provide a clear trade-off between utilization and robustness, with RA being more suitable for risk-averse applications and OS for opportunity-seeking applications.

5. Discussion and Future Work

5.1. Extension to Multi-Objective Scheduling

The goal of the current model is to maximize the use of renewable energy under conditions of uncertainty; it can be easily extended to other system-level goals. A common extension is economic cost minimization, which takes into account generation costs, startup/shutdown costs, and curtailment losses. While this study focuses on clean-energy dominated systems (hydroelectric and photovoltaic), future versions of the model could still be extended to thermal power plants, especially in regions where coal-fired generation is still important. In this case, dispatch decisions could be co-optimized to reduce emissions and carbon accounting, and environmental constraints could be incorporated into the objective function. These extensions would allow the model to achieve a wider range of economic and sustainability goals, which we plan to investigate in future studies.

5.2. System Expansion

The proposed scheduling framework is built on top of a generic modular structure that does not depend on any particular grid topology, thus enabling seamless scaling. Although the current case study is based on a system with four hydropower plants and two PV clusters, the underlying optimization model and code implementation can be readily extended to accommodate larger systems. In particular, the framework allows for the direct integration of more PV units, and more complex cascaded hydro–configuration systems. If future studies require the evaluation of a wider range of system performance, such extensions can be incorporated with only minor modifications to the structure.

5.3. Environmental and Regulatory Implications

The adoption of a risk-averse dispatch strategy can have important environmental and regulatory implications. Under such a strategy, the system prioritizes operational stability and robustness, often at the expense of renewable energy use. This is very much in line with stringent grid security standards and dispatch reliability requirements, especially in safety-critical applications such as peak shaving, black-start preparation, or dispatch during extreme weather conditions. From an environmental perspective, conservative dispatch may lead to increased water spillage and renewable energy curtailment. However, it also reduces the risk of overcommitment and unexpected reserve shortages.

5.4. More Uncertainty Sources

Future work may focus on integrating additional sources of uncertainty to further enhance the robustness and applicability of the proposed IGDT-based scheduling model. Key directions include the following:
  • Power market price uncertainty: In real power systems, price volatility also introduces additional uncertainty that affects dispatch decisions and revenue expectations. Using market signals as an objective (e.g., profit maximization) can make the model more consistent with the actual operation of energy and ancillary services markets.
  • Climate-driven hydrological changes: Long-term changes in inflow due to climate change could significantly affect the availability of hydropower. Modeling these changes as dynamic uncertainty sets within the IGDT model will enhance the long-term sustainability of the model.

6. Conclusions

This study develops a risk-aware short-term scheduling model for cascade hydropower–PV hybrid systems, explicitly considering uncertainties in PV output. Leveraging the IGDT, the proposed framework effectively captures forecast deviations and accommodates varying risk preferences. Three representative scheduling strategies are presented: risk-neutral (RN), opportunity-based (OS), and risk-averse (RA), which correspond to balanced, aggressive, and conservative attitudes toward uncertainty, respectively.
The proposed model accurately captures the essential operational characteristics of hydropower, including unit-level dispatch, hydraulic head losses, water flow delays, and detailed power flow and transmission constraints. Its effectiveness and adaptability are validated through a practical case study of a multi-reservoir hydropower–PV hybrid system in Southwest China. Based on simulation results under different risk-aware scheduling strategies, several key insights are summarized as follows:
  • The RN strategy provides a reliable baseline by strictly adhering to forecasted generation plans, achieving complete renewable energy utilization without curtailment and demonstrating stable performance under nominal conditions.
  • The OS strategy allows upward adjustments in both PV output and hydropower plans, achieving the highest total generation and PV utilization (102.2%). However, this results in a reduced reserve margin, more frequent constraint violations, and increased system stress.
  • The RA strategy prioritizes system security by conservatively scheduling resources to withstand worst-case deviations. It reduces renewable energy utilization but maximizes uncertainty tolerance (α = 0.020), eliminates unit startups, and enhances operational robustness.
Quantitative indicators such as curtailment, reserve margin, water spillage, and transmission violations further highlight the inherent trade-off between economic performance and risk resilience across the three strategies.
In conclusion, the IGDT-based scheduling framework proposed in this study provides a flexible, interpretable, and practical tool for decision-making under uncertainty in hybrid renewable energy systems. By enabling operators to tailor scheduling strategies based on real-time forecast confidence and risk preferences, the model effectively balances economic efficiency and operational reliability, thereby enhancing the resilience and performance of integrated renewable systems.

Author Contributions

Conceptualization, Y.L. (Yan Liu); methodology, X.Z. and Z.M.; software, Y.L. (Yan Liu); validation, Y.L. (Yan Liu), X.Z. and Z.M.; formal analysis, Y.L. (Yan Liu); investigation, X.Z. and Z.M.; resources, X.X., Y.L. (Youbo Liu), and J.L.; data curation, Y.L. (Yan Liu); writing—original draft preparation, Y.L. (Yan Liu); writing—review and editing, Y.L. (Yan Liu) and X.X.; visualization, W.R. and Y.X.; supervision, X.X.; project administration, X.X.; funding acquisition, X.Z., Z.M., W.R. and Y.X. All authors have read and agreed to the published version of the manuscript.

Funding

This research was funded by the State Grid Corporation of China (grant numbers: 5108-202357442A-3-2-ZN).

Data Availability Statement

The raw data supporting the conclusions of this article will be made available by the corresponding author on request.

Acknowledgments

This research was supported by the Science and Technology Program for Research on Paths and Key Technologies for Large Hydropower Participation in Electricity Market of State Grid Corporation of China. Grant number: 5108-202357442A-3-2-ZN. The authors are grateful to the reviewers and editors for their valuable comments and suggestions.

Conflicts of Interest

Authors Xian Zhang and Ziming Ma were employed by the company Beijing Power Exchange Center. The remaining authors declare that the research was conducted in the absence of any commercial or financial relationships that could be construed as a potential conflict of interest.

References

  1. International Energy Agency (IEA). Renewables 2024: Analysis and Forecasts to 2030. Fuel Report—October 2024. Available online: https://www.iea.org/reports/renewables-2024 (accessed on 31 March 2025).
  2. International Energy Agency (IEA). Managing Seasonal and Interannual Variability of Renewables. Report—April 2023. Available online: https://www.iea.org/reports/managing-seasonal-and-interannual-variability-of-renewables (accessed on 31 March 2025).
  3. Wang, F.; Xu, J.; Wang, Q. Complementary Operation-Based Sizing and Scheduling Strategy sfor Hybrid Hydro–PV–Wind Generation Systems Connected to Long-Distance Transmission Lines. Appl. Energy 2024, 364, 123082. [Google Scholar] [CrossRef]
  4. Yang, J.; Liu, J.; Qiu, G.; Liu, J.; Jawad, S.; Zhang, S. A Spatio-Temporality-Enabled Parallel Multi-Agent-Based Real-Time Dynamic Dispatch for Hydro–PV–PHS Integrated Power System. Energy 2023, 278 Pt B, 127915. [Google Scholar] [CrossRef]
  5. Tachibana, T.; Kikuike, K.; Kawashima, T.; Hozumi, N.; Murakami, Y. Temperature-Dependent Electrical and Thermal Characteristics of tpPI/h-BN Composite Insulating Material Using Electrostatic Adsorption Method. In Proceedings of the 2020 International Symposium on Electrical Insulating Materials (ISEIM), Tokyo, Japan, 13–17 September 2020; pp. 407–409. Available online: https://ieeexplore.ieee.org/document/9275740 (accessed on 2 February 2025).
  6. Yang, J.; Zhang, S.; Liu, J.; Han, X.; Peng, W.; Liu, J. Dynamic Dispatch of Hybrid Hydro/PV/PHS Complementary Power Generation System Based on Deep Reinforcement Learning. In Proceedings of the 2021 IEEE 5th Conference on Energy Internet and Energy System Integration (EI2), Taiyuan, China, 22–24 October 2021; pp. 2125–2129. [Google Scholar] [CrossRef]
  7. Huo, Z.; Zhang, J.; Cheng, C.; Cao, H.; Yang, Y. A Synergistic Model Framework for Identifying Variable Renewable Energy Integration Capacity and Deployment Sites for Hydro–Wind–PV Integrated Energy Bases. Energy 2025, 314, 134326. [Google Scholar] [CrossRef]
  8. Gao, F.; Gao, J.; Huang, N.; Wu, H. Selection of an Economics-Energy-Environment Scheduling Strategy for a Community Virtual Power Plant Considering Decision-Makers’ Risk Attitudes Based on Improved Information Gap Decision Theory. Energy 2024, 299, 131401. [Google Scholar] [CrossRef]
  9. Yan, C.; Wang, C.; Hu, Y.; Yang, M.; Xie, H. Optimal Operation Strategies of Multi-Energy Systems Integrated with Liquid Air Energy Storage Using Information Gap Decision Theory. Int. J. Electr. Power Energy Syst. 2021, 132, 107078. [Google Scholar] [CrossRef]
  10. Dorahaki, S.; MollahassaniPour, M.; Rashidinejad, M.; Siano, P.; Shafie-khah, M. A Flexibility-Oriented Model for a Sustainable Local Multi-Carrier Energy Community: A Hybrid Multi-Objective Probabilistic-IGDT Optimization Approach. Appl. Energy 2025, 377 Pt C, 124678. [Google Scholar] [CrossRef]
  11. Luo, B.; Chen, Y.; Liu, Z.; Li, X.; Zhang, H. Short-Term Optimal Dispatch Model for Maximizing Expectation of Accommodation Power of Cascade Hydro-Photovoltaic Complementary System. Autom. Electr. Power Syst. 2023, 47, 66–75. [Google Scholar] [CrossRef]
  12. Song, K. Scenario-Based Optimization Scheduling for Hydro-PV Systems Based on Feature Clustering. Hydropower Energy Sci. 2021, 39, 202–205. [Google Scholar] [CrossRef]
  13. Zhao, D.; Yu, C.; Feng, X.; Liu, H.; Bai, J. Multi-Objective Optimization Scheduling for Hydro-PV Systems Considering Clean Energy Consumption and Multi-Grid Peak Shaving. J. N. China Electr. Power Univ. (Nat. Sci. Ed.) 2023, 1–14. Available online: https://link.cnki.net/urlid/13.1212.tm.20240724.1057.002 (accessed on 13 February 2025).
  14. Wu, X.; Li, N.; He, M.; Wang, X.; Ma, S.; Cao, J. Risk-Constrained Day-Ahead Scheduling for Gravity Energy Storage System and Wind Turbine Based on IGDT. Renew. Energy 2022, 185, 904–915. [Google Scholar] [CrossRef]
  15. Xiong, H.; Egusquiza, M.; Østergaard, P.A.; Pérez-Díaz, J.I.; Sun, G.; Egusquiza, E.; Patelli, E.; Xu, B.; Duan, H.; Chen, D.; et al. Multi-Objective Optimization of a Hydro-Wind-Photovoltaic Power Complementary Plant with a Vibration Avoidance Strategy. Appl. Energy 2021, 301, 117459. [Google Scholar] [CrossRef]
  16. Zhang, Y.; Zhao, X.; Wang, X.; Li, A.; Wu, X. Multi-Objective Optimization Design of a Grid-Connected Hybrid Hydro-Photovoltaic System Considering Power Transmission Capacity. Energy 2023, 284, 128683. [Google Scholar] [CrossRef]
  17. Li, F.-F.; Qiu, J. Multi-Objective Optimization for Integrated Hydro–Photovoltaic Power System. Appl. Energy 2016, 167, 377–384. [Google Scholar] [CrossRef]
  18. Wang, Z.; Wu, F.; Li, Y.; Li, J.; Liu, Y.; Liu, W. Day-Ahead Dispatch Approach for Cascaded Hydropower-Photovoltaic Complementary System Based on Two-Stage Robust Optimization. Energy 2023, 265, 126145. [Google Scholar] [CrossRef]
  19. Lu, N.; Wang, G.; Su, C.; Ren, Z.; Peng, X.; Sui, Q. Medium- and Long-Term Interval Optimal Scheduling of Cascade Hydropower-Photovoltaic Complementary Systems Considering Multiple Uncertainties. Appl. Energy 2024, 353 Pt A, 122085. [Google Scholar] [CrossRef]
  20. Lei, K.; Chang, J.; Wang, X.; Guo, A.; Wang, Y.; Ren, C. Peak Shaving and Short-Term Economic Operation of Hydro-Wind-PV Hybrid System Considering the Uncertainty of Wind and PV Power. Renew. Energy 2023, 215, 118903. [Google Scholar] [CrossRef]
  21. Fan, Y.; Liu, W.; Zhu, F.; Wang, S.; Yue, H.; Zeng, Y.; Xu, B.; Zhong, P. Short-Term Stochastic Multi-Objective Optimization Scheduling of Wind-Solar-Hydro Hybrid System Considering Source-Load Uncertainties. Appl. Energy 2024, 372, 123781. [Google Scholar] [CrossRef]
  22. Li, F.; Chen, S.; Ju, C.; Zhang, X.; Ma, G.; Huang, W. Research on Short-Term Joint Optimization Scheduling Strategy for Hydro-Wind-Solar Hybrid Systems Considering Uncertainty in Renewable Energy Generation. Energy Strategy Rev. 2023, 50, 101242. [Google Scholar] [CrossRef]
  23. Zhang, J.; Guo, A.; Wang, Y.; Chang, J.; Wang, X.; Wang, Z.; Tian, Y.; Jing, Z.; Peng, Z. How to Achieve Optimal Photovoltaic Plant Capacity in Hydro-Photovoltaic Complementary Systems: Fully Coupling Long-Term and Short-Term Operational Modes of Cascade Hydropower Plants. Energy 2024, 313, 134161. [Google Scholar] [CrossRef]
  24. Li, X.; Hu, J.; Zhang, Y.; Wang, Q.; Li, F. Market-Oriented Multi-Timescale Operational Scheduling Strategy for Wind-Solar-Hydro-Storage Integrated Systems. Proc. CSEE 2024, 1–17. Available online: https://link.cnki.net/urlid/11.2107.tm.20250228.1604.007 (accessed on 19 February 2025).
  25. Li, Z.; Yuan, X.; Xiao, P.; Zhang, T.; Qin, H. Multi-Objective Optimization Scheduling of Hydro-Solar Complementary Systems Based on the Moth-Flame Optimization Algorithm. J. Yangtze River Sci. Res. Inst. 2024, 1–10. Available online: https://link.cnki.net/urlid/42.1171.TV.20240904.1422.030 (accessed on 24 February 2025).
  26. Gong, Y.; Wu, X.; Wu, J.; Wan, D.; Li, Y.; Hu, S. Distributionally Robust Chance-Constrained Optimization Method for Active Distribution Network Considering Source-Load Uncertainty in Photovoltaic-Storage Operations. Electr. Power Syst. Autom. 2025, 37, 98–106. [Google Scholar] [CrossRef]
  27. Zhou, T.; Xue, Y.; Ji, J.; Han, Y.; Bao, W.; Li, F.; Zhang, N. Two-Stage Robust Optimization Method for Electricity-Cooling-Heating Integrated Energy System Considering Indirect Carbon Emission Uncertainty. Power Syst. Technol. 2024, 48, 50–63. [Google Scholar] [CrossRef]
  28. Huang, X.; Zhou, W.; Xianyu, H.; Zhang, Y.; Li, X. Day-Ahead Optimal Scheduling of Hydro-PV Complementary Systems Considering Source-Load Collaboration Risk. J. Water Resour. Water Eng. 2024, 35, 119–126. [Google Scholar] [CrossRef]
  29. Shi, Y.; Zhao, Q.; Jiao, L. Optimum Exploitation of Multiple Energy System Using IGDT Approach and Risk Aversion Strategy and Considering Compressed Air Storage with Solar Energy. Energy 2024, 291, 130369. [Google Scholar] [CrossRef]
  30. Shi, Y.; Wang, H.; Li, C.; Negnevitsky, M.; Wang, X. Stochastic Optimization of System Configurations and Operation of Hybrid Cascade Hydro-Wind-Photovoltaic with Battery for Uncertain Medium- and Long-Term Load Growth. Appl. Energy 2024, 364, 123127. [Google Scholar] [CrossRef]
  31. Tian, Y.; Chang, J.; Wang, Y.; Wang, X.; Zhao, J.; Meng, X.; Jing, Z.; Zhang, J. A Long-Term Scheduling Method for Cascade Hydro-Wind-PV Complementary Systems Considering Comprehensive Utilization Requirements and Load Characteristics. J. Clean. Prod. 2025, 494, 145032. [Google Scholar] [CrossRef]
  32. Tang, H.; Li, R.; Song, T.; Ju, S. Short-Term Optimal Scheduling and Comprehensive Assessment of Hydro-Photovoltaic-Wind Systems Augmented with Hybrid Pumped Storage Hydropower Plants and Diversified Energy Storage Configurations. Appl. Energy 2025, 389, 125787. [Google Scholar] [CrossRef]
  33. Tan, Q.; Nie, Z.; Wen, X.; Su, H.; Fang, G.; Zhang, Z. Complementary Scheduling Rules for Hybrid Pumped Storage Hydropower-Photovoltaic Power System Reconstructing from Conventional Cascade Hydropower Stations. Appl. Energy 2024, 355, 122250. [Google Scholar] [CrossRef]
  34. Li, P.; Xu, X.; Yang, Y.; Liu, J.; Hu, W. Distributionally Robust Economic Scheduling of a Hybrid Hydro/Solar/Pumped-Storage System Considering the Bilateral Contract Flexible Decomposition and Day-Ahead Market Bidding. J. Clean. Prod. 2023, 428, 139344. [Google Scholar] [CrossRef]
  35. Tan, Q.; Zhang, Z.; Wen, X.; Fang, G.; Xu, S.; Nie, Z.; Wang, Y. Risk Control of Hydropower-Photovoltaic Multi-Energy Complementary Scheduling Based on Energy Storage Allocation. Appl. Energy 2024, 358, 122610. [Google Scholar] [CrossRef]
  36. Li, X.; Tan, Z.; Shen, J.; Yang, J.; Fan, W.; Zhao, H.; Zhang, T. Research on the Operation Strategy of Joint Wind-Photovoltaic-Hydropower-Pumped Storage Participation in Electricity Market Based on Nash Negotiation. J. Clean. Prod. 2024, 442, 140981. [Google Scholar] [CrossRef]
  37. Sun, Q.; Fu, Y.; Lin, H.; Wennersten, R. A Novel Integrated Stochastic Programming-Information Gap Decision Theory (IGDT) Approach for Optimization of Integrated Energy Systems (IESs) with Multiple Uncertainties. Appl. Energy 2022, 314, 119002. [Google Scholar] [CrossRef]
  38. Ding, X.; Yang, Z.; Zheng, X.; Zhang, H.; Sun, W. Effect of Decision-Making Principle on P2G–CCS–CHP Complementary Energy System Based on IGDT Considering Energy Uncertainty. Int. J. Hydrogen Energy 2024, 81, 986–1002. [Google Scholar] [CrossRef]
  39. Liu, Y.; Zhang, Q.; Huang, L. Information Gap-Based Scheduling Strategy of a Multi-Energy Retailer with Integrated Demand Response Program. Sustain. Cities Soc. 2022, 78, 103605. [Google Scholar] [CrossRef]
  40. Zhu, F.; Zhong, P.; Sun, Y.; Xu, B.; Ma, Y.; Liu, W.; Zhang, D.; Dawa, J. A Coordinated Optimization Framework for Long-Term Complementary Operation of a Large-Scale Hydro-Photovoltaic Hybrid System: Nonlinear Modeling, Multi-Objective Optimization and Robust Decision-Making. Energy Convers. Manag. 2020, 226, 113543. [Google Scholar] [CrossRef]
  41. Phu, P.V.; Huy, T.H.B.; Park, S.; Kim, D. An IGDT Approach for the Multi-Objective Framework of Integrated Energy Hub with Renewable Energy Sources, Hybrid Energy Storage Systems, and Biomass-to-Hydrogen Technology. J. Energy Storage 2024, 89, 111488. [Google Scholar] [CrossRef]
  42. Ji, Z.; Tian, J.; Liu, S.; Yang, L.; Dai, Y.; Banerjee, A. Optimal Scheduling of Park-Level Integrated Energy System Considering Multiple Uncertainties: A Comprehensive Risk Strategy-Information Gap Decision Theory Method. Appl. Energy 2025, 377 Pt D, 124700. [Google Scholar] [CrossRef]
  43. Wu, B.; Zhang, S.; Yuan, C.; Wang, X.; Wang, F.; Zhang, S. IGDT-Based Demand Response Strategy for an Integrated Energy System Considering Its Interactions with Multi-Energy Markets. Int. J. Electr. Power Energy Syst. 2025, 166, 110516. [Google Scholar] [CrossRef]
  44. Yin, Z.; Zhang, Z.; Zhu, R.; Zhang, Y.; Wang, J.; Tang, W. Optimized Multi-Unit Coordinated Scheduling Based on Improved IGDT: Low-Carbon Scheduling Research for the Electric-Heat-Oxygen Integrated Energy System. Int. J. Electr. Power Energy Syst. 2025, 167, 110629. [Google Scholar] [CrossRef]
  45. Su, C.; Cheng, C.; Wang, P.; Shen, J.; Wu, X. Optimization Model for Long-Distance Integrated Transmission of Wind Farms and Pumped-Storage Hydropower Plants. Appl. Energy 2019, 242, 285–293. [Google Scholar] [CrossRef]
Figure 1. Cascade hydro–PV system.
Energies 18 03109 g001
Figure 2. Flowchart for maximizing expected consumable power in hydro–PV systems.
Energies 18 03109 g002
Figure 3. Conceptual structure of the IGDT-based opportunity-seeking and risk-averse scheduling models under uncertainty.
Energies 18 03109 g003
Figure 4. Schematic configuration of the cascade hydropower–PV hybrid system.
Energies 18 03109 g004
Figure 5. PV output trajectories under the RN, OS, and RA strategies (solid lines: Cluster 1; dashed lines: Cluster 2).
Energies 18 03109 g005
Figure 6. Power output curves of hydropower units and PV stations under the RN strategy. (a) Power output of Sections 1 and 2 (Hydropower Plant 1 Units 1–3, Hydropower Plant 2 Unit 1, and PV Cluster 1). (b) Power output of Sections 3 and 4 (Hydropower Plant 2 Units 2–4, Hydropower Plant 3 Units 1–3, and PV Cluster 2). (c) Power output of Hydropower Plant 4 Units 1–3. (d) Power output of Hydropower Plant 4 Units 4 and 5.
Energies 18 03109 g006
Figure 7. Power output curves of hydropower units and PV stations under the OS strategy. (a) Power output of Sections 1 and 2 (Hydropower Plant 1 Units 1–3, Hydropower Plant 2 Unit 1, and PV Cluster 1). (b) Power output of Sections 3 and 4 (Hydropower Plant 2 Units 2–4, Hydropower Plant 3 Units 1–3, and PV Cluster 2). (c) Power output of Hydropower Plant 4 Units 1–3. (d) Power output of Hydropower Plant 4 Units 4 and 5.
Energies 18 03109 g007
Figure 8. Power output curves of hydropower units and PV stations under the RA strategy. (a) Power output of Sections 1 and 2 (Hydropower Plant 1 Units 1–3, Hydropower Plant 2 Unit 1, and PV Cluster 1). (b) Power output of Sections 3 and 4 (Hydropower Plant 2 Units 2–4, Hydropower Plant 3 Units 1–3, and PV Cluster 2). (c) Power output of Hydropower Plant 4 Units 1–3. (d) Power output of Hydropower Plant 4 Units 4 and 5.
Energies 18 03109 g008aEnergies 18 03109 g008b
Table 1. Comparative summary of representative optimization models for multi-energy system scheduling under uncertainty.
Ref.Method and Uncertainty HandlingKey Uncertain VariablesOptimized Focus
[24]Three-stage MILP + IGDT-CvaR + scenario-based pricePV, wind, priceBidding, hydro–PV dispatch, storage, profit
[25]Multi-objective R-IMOMFO + historical hydro/PVInflow, PVHydro/PV dispatch, benefit, stability
[26]MILP + DRCCPV, loadPV/ESS active and reactive dispatch, voltage/reactive control, cost
[27]Two-stage robust with polyhedral setsPV, wind, loadStartup, dispatch, carbon cost, system cost
[28]Day-ahead MILP + DP + cloud modelPVHydro/PV dispatch
[29]RA-IGDT + MILP + EHOPV, wind, load, priceDispatch of CCHP, SPCAES, EV, ISC; cost; emission
[30]Two-stage stochastic MILP + scenario-basedInflow, wind, solar, loadSystem configuration, energy dispatch, cost
[31]Coupled long-short-term MILP + load curve reconstructionInflow, PV, wind, loadHydro/wind/PV scheduling, output control
[32]NSGA-II + CRITIC–TOPSIS + scenario-basedPV, wind, inflow, temperature, loadDispatch of HPP, WPP, PVP, PHS, BES; curtailment; LPOE
[33]Nested MILP + rule-based dispatchPV outputHydro/PV dispatch, pumping plan, output shaping
[34]MILP + DRCC + Wasserstein set + CVaRPV, priceHydro/PV/PS dispatch, bidding, bilateral contract, profit
[35]Three-layer MILP + DP + PV forecast deviationPV (multi-scale)Dispatch of hydro/PV/EES, startup, SOC control
[36]Nash + ADMM + Scenario-based PV/WindWind, PV, priceDispatch of WPPSH, revenue allocation
Table 2. Model parameters of the cascade hydropower–photovoltaic system.
ParameterSymbolValueDescription
Total Time Periods T 9696 dispatch intervals
Number of Hydropower Plants I 44 hydropower plants
Number of PV Plants J 22 photovoltaic plants
Number of Constraint Sections G 44 transmission constraint sections
Reservoir Water Level (Upper) Z ¯ i , t u p [1140, 970, 837, 760]Maximum reservoir water level at each station
Reservoir Water Level (Lower) Z _ i , t u p [1071, 936, 814, 709]Minimum reservoir water level at each station
Initial Reservoir Water Level Z i , b e g i n u p [1076, 950, 822, 720]Initial reservoir water levels
Target End Reservoir Water Level Z i , e n d u p [1076, 950, 822, 720]End-of-dispatch target water levels
Maximum Outflow Q ¯ i , t [3866, 11,142, 15,956, 18,360]Maximum outflow limits
Minimum Outflow Q _ i , t [866, 1142, 5956, 8360]Minimum outflow limits
Hydropower Output (Max) P ¯ i , t hydro [600, 695, 600, 1250]Maximum hydropower output
Hydropower Output (Min) P _ i , t hydro [100, 125, 100, 150]Minimum hydropower output
PV Installed Capacity N p v [550, 1200]Installed capacity of each PV plant
Table 3. Performance indicators of PV output under RN, OS, and RA strategies.
ClusterStrategyPeak (MW)Mean (MW)STD (MW)Forecasted PV Output (%)
PV1RN337.081.3117.8100.0
OS344.583.2120.4102.2
RA330.179.7115.498.0
PV2RN825.0155.4241.1100.0
OS843.4158.9246.5102.2
RA808.2152.3236.298.0
Bold values indicate baseline (RN). In the OS strategy, forecasted PV output exceeds 100% because the model optimizes the predicted PV output (e.g., by (1 + α) adjustment) to take advantage of favorable scenarios. This does not mean that the actual generation exceeds the physical capacity.
Table 4. Comparative performance metrics of RN, OS, and RA strategies under PV uncertainty.
MetricUnitRNOSRADescription
Total generation (Hydro + PV)MWh67,187.268,530.965,843.4Total scheduled renewable output
Hydropower generationMWh61,504.962,722.260,276.7Hydropower plant output
Objective function value (F)MWh67,187.268,530.965,843.4Objective value
PV generationMWh5682.25808.75566.7Actual PV output under scheduling
PV utilization rate%100.0102.298.0PV output/forecasted PV capacity
Curtailment of PV energyMWh0– *115.5Forecasted PV not used
Curtailment rate%0−2.225 *2.033Curtailment/forecasted PV output
α (IGDT uncertainty horizon)--0.0220.020Maximum tolerable forecast deviation
Average hydro reserve margin%18.516.920.1Mean relative reserve relative to maximum capacity
Line constraint violation count 384433Time steps exceeding transmission capacity
Max transmission line loadMW1728.21853.41813.2Highest observed load on any grid section
Startup count of hydro units-101Total startup actions across all hydro units
Water spill volume106 m31002.62173.91122.9Total spillage (unused water due to overflow or constraints)
* for OS strategy, negative curtailment indicates overutilization of PV forecast (i.e., actual output exceeds forecasted value).
Table 5. Sensitivity analysis of opportunity margin θ and risk margin on uncertainty horizon α and total generation F .
Strategy Margin   θ / Uncertainty   Horizon   α Generation   F
OS0.010.010867,859.0
0.020.022368,530.9
0.030.035569,202.8
0.04infeasibleinfeasible
RA0.010.010366,515.3
0.020.020365,843.5
0.030.030365,171.6
0.040.040364,499.7
Table 6. Sensitivity of system feasibility and generation under varying uncertainty horizon α .
Strategy Margin   θ / Uncertainty   Horizon   α Generation   F
OS0.010.01infeasible
0.0268,399.2
0.0368,955.6
0.04infeasible
RA0.010.0166,537.8
0.02infeasible
0.020.0166,537.1
0.0265,861.0
0.03infeasible
Table 7. IGDT vs. CVaR: scheduling performance under uncertainty.
StrategyTotal Generation (MWh)PV Utilization (%)Curtailment (MWh)Reserve Margin (%)Transmission ViolationsWater Spillage (106 m3)
RN67,187.2100.0018.5381002.6
OS68,530.9102.2– *16.9442173.9
RA65,843.498.0115.520.1331122.9
CvaR69,359.2100.0015.645985.6
* for OS strategy, negative curtailment indicates overutilization of PV forecast (i.e., actual output exceeds forecasted value).
Disclaimer/Publisher’s Note: The statements, opinions and data contained in all publications are solely those of the individual author(s) and contributor(s) and not of MDPI and/or the editor(s). MDPI and/or the editor(s) disclaim responsibility for any injury to people or property resulting from any ideas, methods, instructions or products referred to in the content.