Article

Swirling Flameless Combustion of Pure Ammonia Fuel

Department of Mechanical Engineering, Kookmin University, Seoul 02707, Republic of Korea
*
Author to whom correspondence should be addressed.
Energies 2025, 18(12), 3104; https://doi.org/10.3390/en18123104
Submission received: 2 May 2025 / Revised: 30 May 2025 / Accepted: 3 June 2025 / Published: 12 June 2025

Abstract

Ammonia combustion has garnered increasing attention due to its potential as a carbon-free fuel. Globally swirling flow in a rectangular furnace generates flameless conditions by high flue gas recirculation. The reverse air injection (RAI) technique enabled stable swirling flameless combustion of pure ammonia without auxiliary methods. Experiments with pure ammonia combustion in a swirling flameless furnace demonstrated an operable equivalence ratio (ER) range of 0.3–1.05, extending conventional flammability limits of pure ammonia as a fuel. NO emissions were reduced by 40% compared to conventional combustion, with peak concentrations of 1245 ppm at ER = 0.71 and near-zero emissions at ER = 1.05. Notably, flameless combustion exhibited lower temperature sensitivity in NO formation; however, the ER has a serious effect. Developing a simplified reaction model for ammonia combustion is crucial for computational fluid dynamics (CFD) research. A reduced kinetic mechanism comprising 36 reactions and 16 chemical species was introduced, specifically designed for efficient and precise modeling of pure ammonia flameless combustion. Combustion simulation using the eddy dissipation concept (EDC) approach confirmed the mechanism’s predictive capability, maintaining acceptable accuracy across the operating conditions.

1. Introduction

The rapid consumption of fossil fuels for energy generation has led to severe environmental challenges, prompting researchers and policymakers to explore clean and renewable energy alternatives [1]. Hydrogen emerges as a promising sustainable energy source with zero-carbon emissions [2]. Despite significant technological advancements, the economic progress of hydrogen-based technologies has been hindered by high infrastructure costs [3]. To address these challenges, chemical storage in solid hydrides, hydrocarbons, or ammonia has been proposed [4]. Liquid ammonia, in particular, stands out as a carbon-free and cost-effective hydrogen carrier with established infrastructure [5,6]. Characterized by its high volumetric hydrogen content and ability to store a large proportion of hydrogen under ambient conditions, ammonia is considered a primary contender for enabling a secure supply of renewable hydrogen for various applications [7,8,9,10]. Its advantages include ease of storage, well-defined regulatory standards, and a strong safety record, making it a viable option for both stationery and mobile energy solutions within existing infrastructure frameworks [11]. However, it is crucial to explore the inherent characteristics and limitations of combustion technologies to investigate the impacts of implementing ammonia as a fuel [12,13,14].
Recent developments in ammonia combustion technology have focused on NOx reduction strategies and improved flame stability [15]. The fundamental mechanisms governing NOx formation, including the well-established Zeldovich mechanism, provide theoretical foundation for understanding nitrogen chemistry in combustion systems [16].
One extensively studied approach is fuel blending, where ammonia is mixed with reactive fuels like hydrogen or methane to improve flame stability and reduce ignition temperature. While blending with methane compromises ammonia’s carbon-free advantage, blending with hydrogen retains this benefit but introduces challenges, including hydrogen storage costs and increased NOx emissions [17,18]. Another promising method is catalytic combustion, which employs catalysts to lower ignition temperatures and accelerate ammonia oxidation. Although this improves combustion efficiency and reduces NO emissions, it faces practical challenges such as high catalyst costs, degradation over time, and the need for precise control of operational conditions [19,20].
Flameless combustion, also known as “flameless oxidation” or “high-temperature air combustion,” MILD (moderate or intense low-oxygen dilution) combustion, etc., is an innovative approach to fuel combustion that distinguishes itself by the absence of a visible flame during the process owing to a dispersed volumetric combustion [21]. This combustion regime is characterized by high inlet temperature, low oxygen concentration in the reaction zone, and strong recirculation of combustion products, leading to a more uniform temperature distribution and reduced peak temperatures compared to conventional combustion. These characteristics make flameless combustion particularly relevant to ammonia combustion for several reasons:
  • Lower peak temperature significantly reduces thermal NOx formation, a major concern in ammonia combustion due to its high nitrogen content.
  • The strong recirculation and thorough mixing in flameless combustion can help to address ammonia’s low reactivity by providing longer residence times and higher radical species supply.
  • The uniform and high temperature distribution promotes complete combustion of ammonia, reducing emissions of unburned fuel.
In flameless combustion, thermal De-NOx processes involving intermediate species such as NH and NH2 actively reduce NO formation under fuel-rich conditions [22]. Flameless combustion has applications in industries such as power generation and environmental protection, where reducing NOx emissions is critical [23].
Pure ammonia combustion faces several fundamental challenges. First, ammonia’s low flame speed (0.07 m/s) compared to conventional fuels like methane (0.4 m/s) makes it difficult to maintain stable combustion [14]. Second, its high ignition temperature (651 °C) and narrow flammability limits (16–25 vol% in air) create significant stability issues [7]. Additionally, ammonia’s low heating value (18.6 MJ/kg) compared to methane (50 MJ/kg) results in lower power density, requiring larger combustion volumes for equivalent power output [24].
The novelty and contribution of this work, compared to previous studies on ammonia combustion, lies in the fact that although flameless combustion has shown great potential, its practical application with pure ammonia fuel remains largely unexplored. Moreover, despite numerous studies, the challenge of achieving stable pure ammonia combustion without additives or support mechanisms remains unresolved.
In previous MILD combustion research, Sorrentino et al. designed a lab-scale cyclonic burner but still required water injection to supply OH radicals for sustaining the reaction, achieving minimum NOx emissions of about 100 ppm under stoichiometric conditions while struggling with unburned NH3 and H2 emissions under fuel-rich conditions [25]. Following a similar approach, Ariemma et al. experimentally investigated water addition to the unburned mixture in a cyclonic burner, confirming that while water addition showed positive effects on emissions through enhanced De-NOx processes, fundamental understanding of the physical and chemical processes in pure ammonia MILD combustion remained limited [26].
Zieba et al. investigated NH3-doped flameless combustion in a 20 kW FLOX burner, demonstrating that ammonia could decompose in a methane-free syngas configuration.
However, they did not achieve pure ammonia combustion as their system still required H2 and CO in the fuel mixture to generate sufficient radicals for ammonia decomposition. Even in their most successful case with methane-free syngas, the fuel mixture contained 25% H2 and 18% CO to maintain stable combustion, highlighting the persistent challenge of achieving flameless combustion with pure ammonia alone [25].
Reverse air injection (RAI), a recent advancement in flameless combustion technology, modifies traditional approaches by altering the fluid dynamics of the air and fuel mixture to generate a globally swirling flow through the furnace [27,28]. The RAI configuration achieves significantly higher recirculation ratios (>5) compared to conventional flameless systems (2–4), creating more uniform temperature distribution with variations of less than ±50 K across the combustion chamber [28,29]. This enhanced mixing leads to residence times longer than traditional systems, allowing complete NH3 decomposition even at lower temperatures. Previous studies required temperatures above 1500 K for stable operation, while RAI can maintain stable combustion at temperatures as low as 1200 K due to its unique swirling flow patterns [27,28].
Despite numerous studies, achieving stable pure ammonia combustion remains challenging due to its low flame speed, high ignition temperature, and limited radical availability [14,24]. Previous research has explored catalytic combustion and fuel blending, yet limitations such as high NO emissions or complex system requirements persist [30,31]. This study addresses these challenges by investigating the potential of RAI to stabilize ammonia combustion without auxiliary methods. The key novelties and contributions of this work compared to previous ammonia combustion studies include: (1) achieving stable pure ammonia flameless combustion without additives or catalyst support, extending the operational equivalence ratio range to 0.3–1.05; (2) demonstrating significant NO emission reduction (40% compared to conventional combustion) with near-zero emissions under stoichiometric conditions; (3) developing and validating a simplified 36-reaction kinetic mechanism that reduces computational cost by 55% while maintaining accuracy; and (4) establishing the RAI configuration as an effective approach for controlling ammonia combustion through equivalence ratio adjustment rather than complex auxiliary systems. By integrating experimental and numerical methods, we seek to provide a comprehensive understanding of the mechanisms governing NO formation and reduction in a pure ammonia flameless furnace.

2. Experimental Conditions and Methods

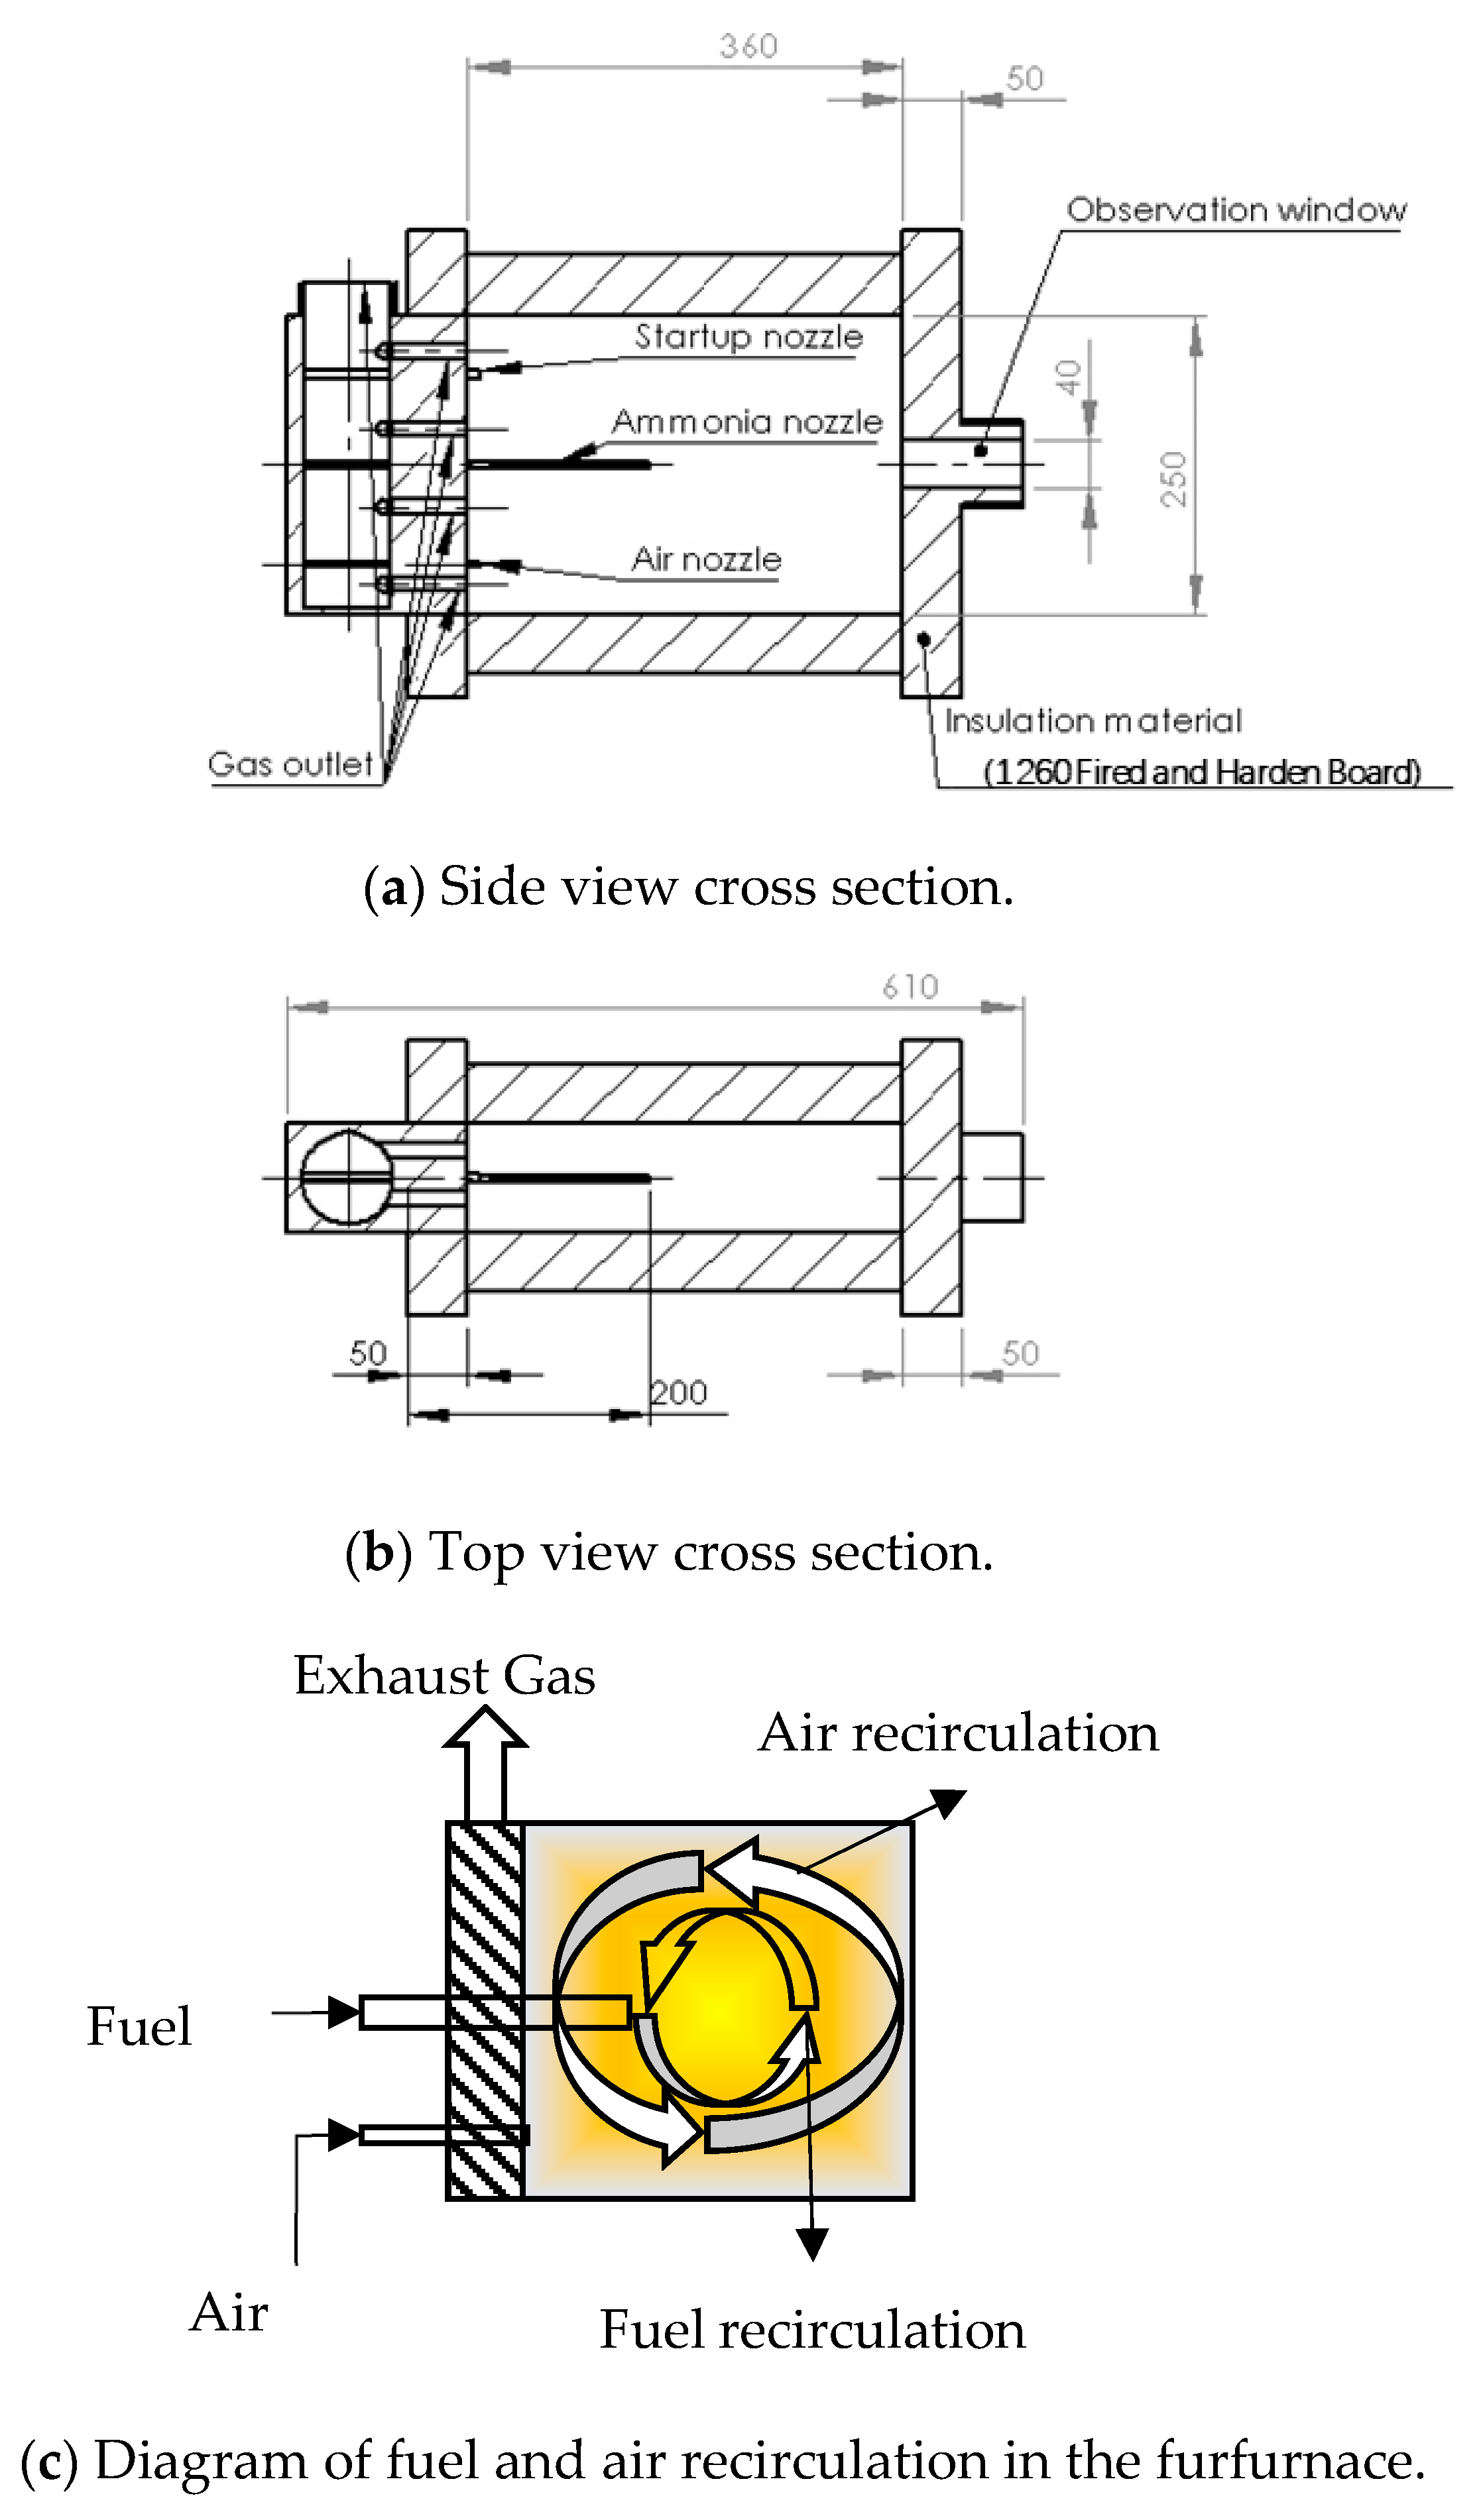
2.1. Experimental Setup

The RAI flameless furnace and experimental apparatus are illustrated in Figure 1. The dashed lines indicate the start-up flow paths using Liquefied Petroleum Gas (LPG) for initial heating, while the solid lines represent the actual operational flow paths during ammonia flame-less combustion. It comprises a rectangular combustion chamber with internal dimensions of 90 × 250 × 360 mm, enveloped by a 50 mm insulation material (1260 Fired and Harden Board, density = 350 kg/m3, thermal conductivity = 0.2 W/m °C). When the system is started, a premixed Liquefied Petroleum Gas (LPG) burner is used, as shown by the dotted line in Figure 1, to heat the combustion chamber to 800 °C (valves 3 and 4 are closed, valves 1 and 2 are opened), and then switched to flameless combustion (at this time, valves 3 and 4 are opened, valves 1 and 2 are closed). In the flameless mode, ammonia gas is introduced through the central inlet nozzle (diameter = 5 mm), while combustion air is preheated by passing through a compact tubular heat exchanger, which recovers thermal energy from the exhaust stream. The preheated air, with an inlet temperature of approximately 420–450 °C, is then injected into the furnace via a high-velocity nozzle (diameter = 3 mm). In contrast, ammonia is not pre-heated and is directly injected at ambient temperature through the central nozzle (diameter = 5 mm). This configuration enables the formation of a strong recirculation flow and supports stable volumetric combustion under low-oxygen conditions.
To quantitatively assess the mixing strength and ensure flameless conditions, the recirculation ratio (RR) is defined as:
R R = m recirculated gas m f r e s h   a i r  
Based on our previous studies [28,29], a recirculation ratio greater than 2 is generally regarded as a condition for flameless combustion. In this study, the unique RAI configuration achieves RR > 5 under air injection velocities exceeding 100 m/s, thus ensuring deep flue gas recirculation and enhanced radical retention.
Figure 2 shows the geometry of the furnace. As the air is injected at high speed above 100 m/s through the small nozzle (diameter = 3 mm), it generates low static pressure pulling the flue gas to mix and march together, which is the basic mechanism of flameless combustion to reduce oxygen concentration [29,32,33]. As shown in Figure 2c, due to the downwardly shifted position of the air nozzle, it generates outside recirculation of air. Meanwhile the fuel injected through the central nozzle generates a fuel rich zone at the center of the furnace, which is also recirculating in the same direction owing to the inertia of the air jet. The combustion reaction proceeds while the fuel molecule diffuses through the air recirculation zone. Hence a dispersed reaction happens at low O2 and fuel concentration to generate flameless phenomena. The RAI flow structure has been validated through our previous CFD studies [27,28,29] and is confirmed by the current simulation results, where asymmetric recirculation patterns and high recirculation ratios (>5) clearly demonstrate the reverse entrainment mechanism.
Table 1 shows the list of measurement instruments. NO emission measurements were normalized to 15% O2 reference conditions using the following correction formula [34]:
N O 15 % O 2 = N O measured × 20.9 15 20.9 O 2 measured
where N O 15 % O 2 is the corrected NO concentration, N O measured is the measured concentration, and O 2 measured is the measured oxygen concentration. This standardization allows for proper comparison of emission values by removing the air dilution effect across different operating conditions.
Furnace temperatures were monitored using K-type thermocouples (naked bead type, φ1 mm). These thermocouples, positioned through the four ports atop the furnace as depicted in Figure 1, were subject to an inherent uncertainty of 0.5% according to the manufacturer’s specifications, while Kim’s research suggests that bead-type thermocouples may exhibit errors up to 150 °C due to radiation interference of cooling tube walls [30]. In the insulated chamber setup, the influence of such interference was mitigated by the high heat transfer coefficient of the recirculating flue gas at high speed [27]. Given the high operational temperatures above 900 °C, the potential for radiative interference with the thermocouple readings was identified and subsequently addressed. A correction formula, derived on the premise of equilibrium between radiative and convective heat transfers at the thermocouple bead’s surface, was employed to adjust the measured values:
Q r a d = Q c o v = ε σ T 1 4 T 3 4 = h T 1 T 2
where Q r a d and Q c o v represent the radiative and convective heat transfers, respectively, ε denotes the emissivity, σ is the Stefan–Boltzmann constant (5.67 × 10⁻⁸ W/m2·K4), T1 is the temperature of the thermocouple, T2 is the temperature of the surrounding gas to be measured, and T3 refers to the average wall temperature of the combustion chamber. h is the heat transfer coefficient, calculated based on the gas properties and velocity at each location from the CFD simulation. The calculated heat transfer coefficient at the TC beads ranges from 50 to 95.8 W/m2·K, depending on the specific location within the combustion chamber and operating condition. This variation in heat transfer coefficients necessitated location-specific temperature corrections to ensure accurate thermocouple readings throughout the combustion chamber.
Thermocouple (TC) data is recorded using a DAQ system (Yokogawa MV 2000), primarily to monitor the average temperature within the furnace. Both the air and ammonia fuel gas streams are regulated by mass flow controllers (Bronkhorst F-202AV (Bronkhorst High-Tech B.V., Ruurlo, The Netherlands) with a maximum flow of 250 L/min and a precision of ±0.5%; TSC-230 (Tokyo Keiso Co., Ltd., Tokyo, Japan) with a maximum flow of 10 L/min and a precision of ±0.1%). Additionally, the initial heating phase employs LPG as fuel, controlled via an LPG flowmeter (F-201CV), capable of a maximum flow of 25 L/min and maintaining a precision of ±0.5%.

2.2. Experimental Conditions

The transformative phases of fuel combustion are captured in Figure 3. Figure 3a presents the initial ignition stage, where a blue flame is indicative of a high-temperature combustion zone—a signature characteristic of hydrocarbon fuel combustion with flame [35]. During the flameless combustion stage using LPG, as shown in Figure 3b, the blue flame disappears and a uniformly glowing zone appears, indicating a transition to flameless combustion with no visible flame. The nitrogen oxide measurement results at the two stages of Figure 3a,b, which are 40 ppm and 7 ppm, respectively, confirm the effectiveness of flameless combustion in reducing nitrogen oxide emissions [36]. Upon the transition to the pure ammonia combustion phase in Figure 3c, a notable shift in the color spectrum is observed, from orange to yellow orange within the chamber. This color change is attributed to the combustion characteristics of ammonia, particularly the presence and interactions of NH and NH2 radicals [37].
The operational parameters are detailed in Table 2, providing a comprehensive overview of the specific conditions and variables, such as equivalence ratio and air velocity, which affect the emission of NO and ammonia. During the actual experiment, temperature is regulated by adjusting the equivalence ratio. Once the furnace temperature reaches 900 °C (1173 K), this condition serves as the starting point for measuring the concentrations of NO, H2, and NH3 under varying temperature scenarios. The measurement for a given set of conditions is concluded when the furnace temperature attains a steady state or reaches to the maximum available temperature (1200 °C, 1473 K) for the safety of the furnace materials. This measurement process is repeated for different equivalence ratios shown in Table 2 to catch the effects of furnace temperature along with equivalence ratio. The different numbers of outlet holes observed through the observation window represent the same experimental configuration viewed from different angles. The perforated outlet design achieves uniform gas extraction for flameless combustion stability, as established by Cavaliere and de Joannon [21]. The computational model reasonably simplifies this as a single outlet boundary condition for global flow analysis.

3. Numerical Simulation

3.1. Fluid Dynamics and Heat Transfer Model

Fluid flow, heat and mass transfer, and reaction simulations were simulated using the Reynolds-Averaged Navier–Stokes (RANS) equations coupled with energy conservation equations in ANSYS Fluent v.17 [38,39]. These simulations, crucial for understanding the complex interaction between flow dynamics and chemistry in flameless combustion, were based on the fundamental governing equations outlined in Table 3. Turbulence was modeled with the standard k-ε model [40], known for its effectiveness in predicting turbulent kinetic energy and dissipation rates, essential for complex reaction and flow. The model constants used were: C u = 0.09, C 1 ε = 1.44, C 2 ε = 1.92, σk = 1.0, and σε = 1.3, which are the standard values validated for combustion applications. Heat transfer within the combustion chamber was addressed by solving the energy equation, including both convective and radiative transfer mechanisms, pivotal for accurate thermal environment modeling in flameless combustion [41]. The radiative aspect was specifically handled using the discrete ordinates model (DOM) with the WSGGM (weighted sum of gray gases model) [42]. Additionally, the species transport equation was integrated into the simulation, enabling detailed chemical species tracking within the combustion process.
The complete ammonia thermophysical properties listed in Table 4 are implemented in the CFD model to ensure accurate representation of transport phenomena. These properties, including the specific heat ratio of 1.31 and autoignition temperature of 630 °C, are critical for proper modeling of ammonia combustion characteristics and heat transfer processes in the flameless combustion environment [15]. The selection of these models was based on their proven effectiveness in simulating complex combustion processes. However, the unique characteristics of ammonia flameless combustion necessitated the use of specialized combustion models, which are described in the following sections.

3.2. Numerical and Kinetic Modeling

3.2.1. EDC Model Implementation and Numerical Setup

The Eddy Dissipation Concept (EDC) model was implemented to simulate ammonia flameless combustion, specifically for its capability to handle finite-rate chemistry effects essential for capturing ammonia’s slow reaction kinetics [43]. In the EDC framework, chemical reactions occur in fine turbulent structures where the dissipation of turbulence kinetic energy takes place, making it ideal for modeling low-reactivity fuels such as ammonia [44]. To address numerical challenges arising from the stiff chemistry system, an adaptive chemistry integration approach was implemented. The ISAT (In Situ Adaptive Tabulation) algorithm was utilized with a two-stage tolerance adjustment strategy to establish initial stability followed by refinement for final accuracy [45]. This approach significantly reduced computational time while ensuring solution fidelity. Similarly, under-relaxation factors were initially set lower to establish stability and then gradually adjusted to accelerate convergence.
For mesh configuration details, refer to the grid independence study in Section 3.3. Boundary conditions were precisely defined to match experimental parameters. Air velocities ranged from 80 to 283 m/s across different equivalence ratios, while the fuel inlet maintained a consistent flow rate of 10 lpm across all cases. Both inlets were assigned a turbulence intensity of 5%. The turbulent length scales were specified as 0.003 m for the air inlet and 0.005 m for the fuel inlet, corresponding to approximately 10% of the respective nozzle hydraulic diameters [40]. The thermophysical properties of ammonia used in the simulations are as follows: thermal conductivity λ = 0.025 + 6.5 × 10⁻⁵ T (W/m·K), specific heat capacity cp = 2060 + 0.15 T (J/kg·K), and dynamic viscosity μ = 9.82 × 10⁻⁶ + 2.8 × 10⁻⁸ T (Pa·s), where T is temperature in Kelvin. These temperature-dependent properties are implemented in ANSYS Fluent (2023 R2) to ensure accurate representation of ammonia transport characteristics across the operating temperature range of 300–1500 K.

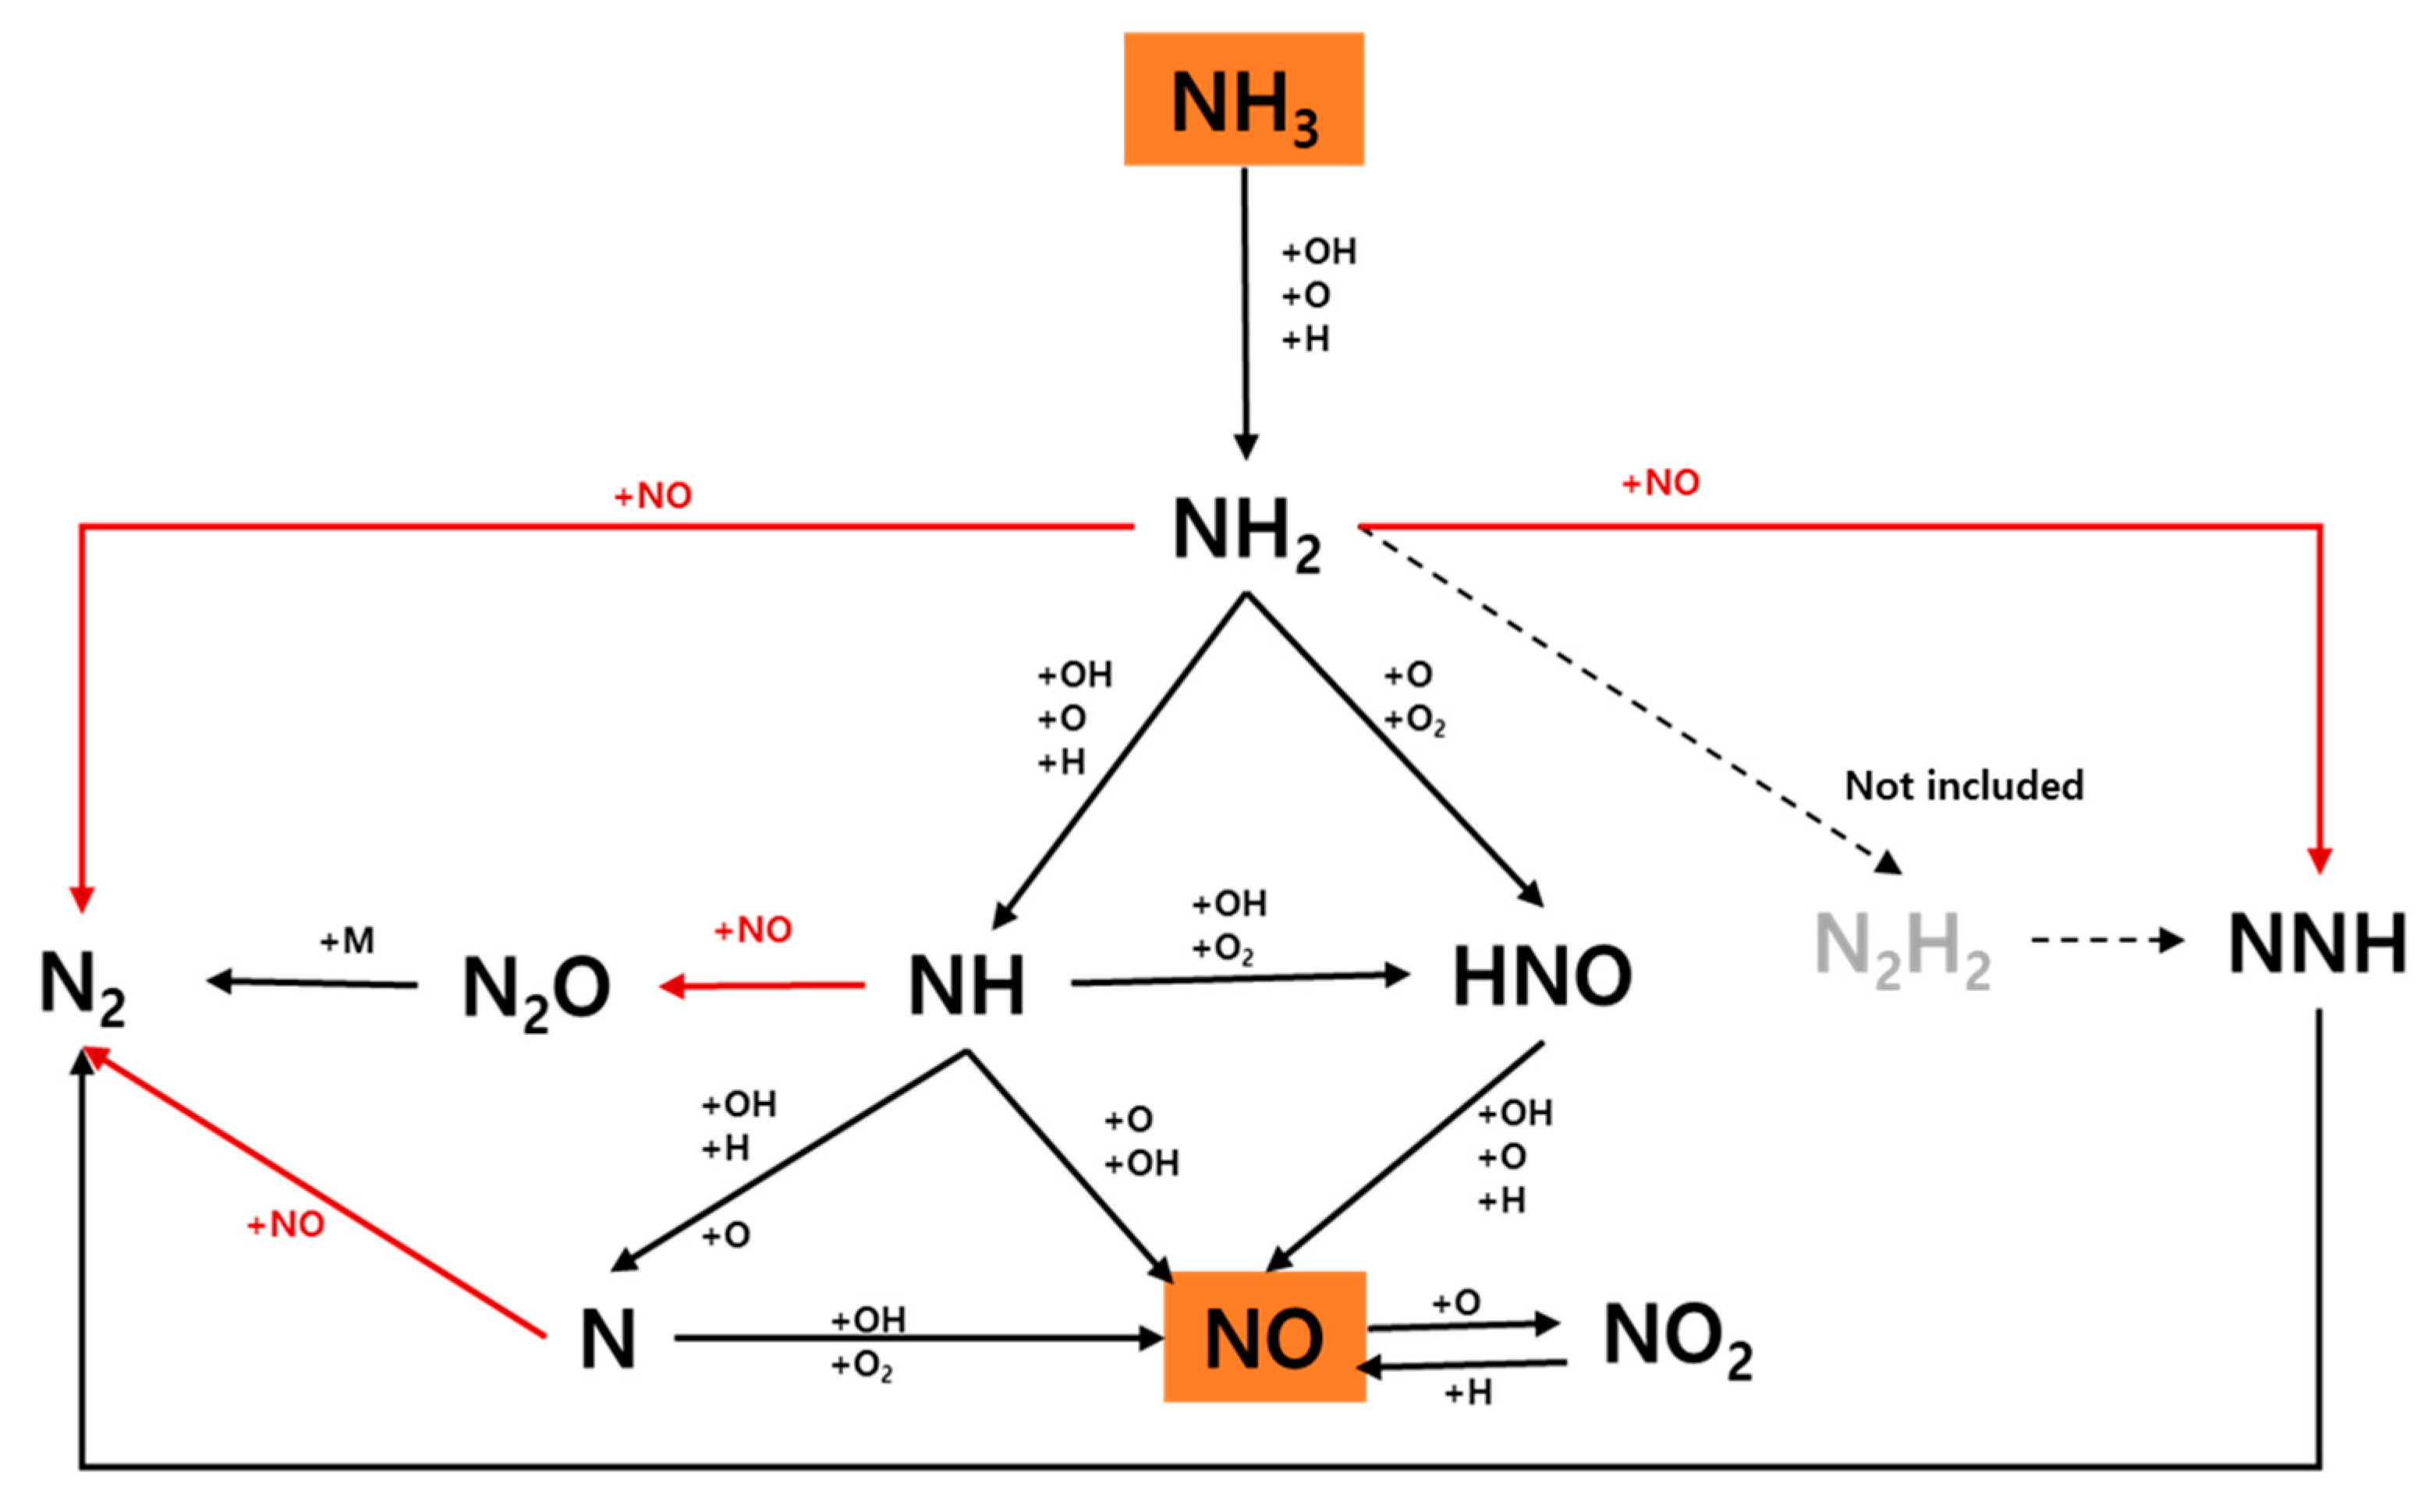
3.2.2. Simplified Chemical Kinetic Mechanism for Ammonia Combustion

The chemical kinetic scheme presented in Table 5 is directly adapted from the work of Duynslaegher et al. [46], with simplification to focus on the most critical reaction pathways for NO formation and consumption. This 36-reaction mechanism significantly reduced calculation time (approximately 55% faster) compared to the original mechanism while preserving essential reaction pathways. The reaction rate constants in Table 5 are expressed in the Arrhenius form:
k f = A i T β i e x p E i R T
where k f is the rate constant, A i is the pre-exponential factor, E i is the activation of energy, R is the gas constant, and T is the absolute temperature.
The mechanism captures the essential reaction pathways governing ammonia oxidation and NO formation/consumption, as illustrated in Figure 4. This pathway diagram represents a strategic simplification of the original Duynslaegher et al. [46] mechanism, where we have focused on the dominant routes for NO formation and consumption while removing secondary pathways with minimal impact on overall NO predictions. Specifically, we eliminated the N2H2 intermediates (shown in gray with dashed lines in Figure 4) and retained only the most influential reaction pathways.
This reaction scheme specifically addresses the two dominant routes for NO formation during ammonia combustion: (i) the sequential H-abstraction pathway (NH3 → NH2 → NH → NO) and (ii) the HNO-intermediate pathway (NH3 → NH2 → HNO → NO). The mechanism includes primary ammonia decomposition routes (R1–R4) and subsequent NH2 radical reactions (R5–R12), which represent critical branch points in the mechanism leading to either NO formation or reduction. The red arrows in Figure 4 highlight the key NO reduction pathways that are particularly important for accurate prediction of NO emissions. Reactions R11 (NH2 + NO → N2 + H2O) and R20 (NH + NO → N2O + H) significantly influence the NO consumption rates at lower temperatures characteristic of flameless combustion.
The mechanism also addresses NH and N radical chemistry (R13–R24), which are crucial intermediates in the oxidation pathway. The HNO formation and consumption reactions (R9, R10, R16, R27–R29) play a key role in the secondary pathway for NO production. The NO and NO2 reactions (R25–R26) complete the nitrogen oxide conversion pathways. The pressure-dependent reactions are described using the TROE formalism based on the theory of thermal unimolecular reactions at low pressures [47].
For efficient computation while maintaining chemical accuracy, the mechanism incorporates fundamental hydrogen-oxygen chemistry (R31–R35) that significantly influences the radical pool, particularly the formation of reactive O and OH radicals necessary for ammonia oxidation initiation. The mechanism includes essential hydrogen-oxygen chemistry (R31–R35) that generates the reactive O, H, and OH radicals necessary for initiating and sustaining ammonia oxidation through the primary reaction pathways.
To evaluate the accuracy and efficiency of the simplified mechanism, a benchmark simulation was conducted under ER = 1.0 conditions using the same boundary and solver settings. The simplified mechanism successfully reduced the number of reactions from over 100 (original Duynslaegher mechanism [46]) to 36, leading to a significant reduction in computational cost. Specifically, the total simulation time decreased from approximately 12 h to 5.6 h, corresponding to a 55% reduction in CPU time. Meanwhile, the predicted NO concentrations deviated by less than 7.5% across the reactor domain. These results demonstrate that the simplified mechanism retains the dominant reaction pathways necessary for capturing NO formation and reduction behavior, while offering substantial improvements in simulation efficiency. Therefore, it is well-suited for CFD analysis and design optimization of ammonia flameless combustion systems.

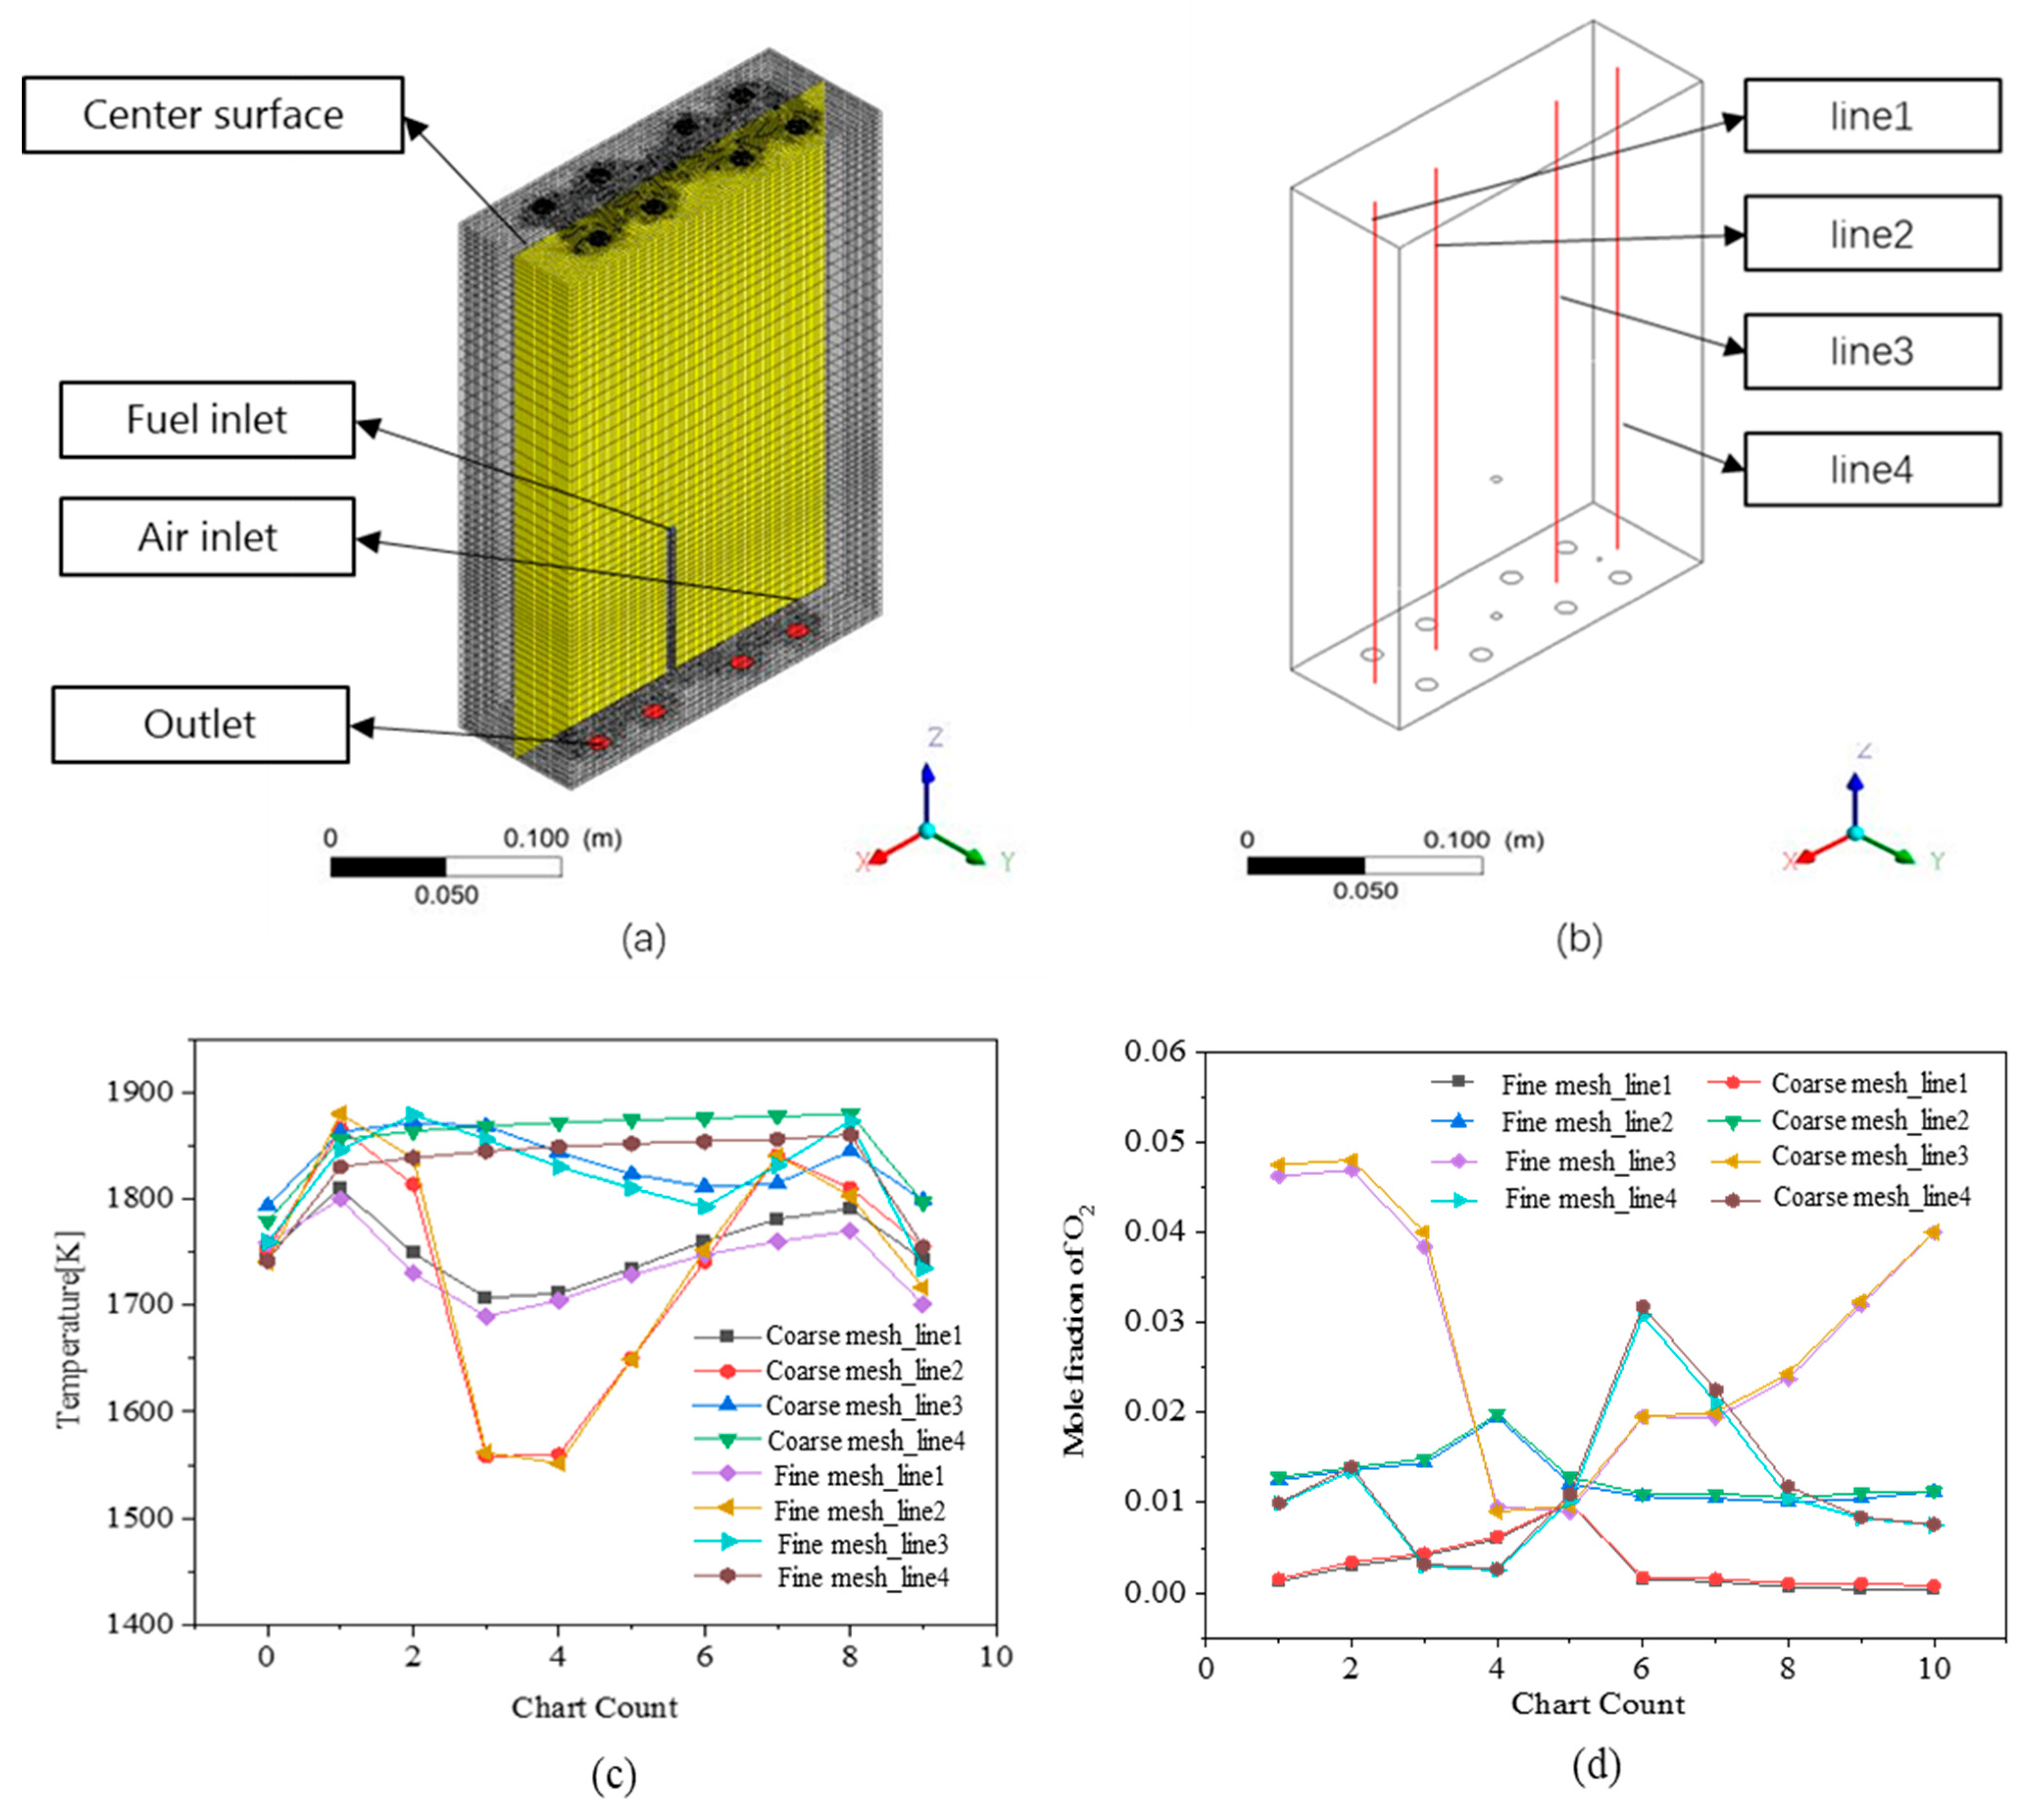
3.3. Computational Mesh Analysis

Prior to conducting the full numerical investigation, a systematic grid dependency study compared a fine mesh (1,964,836 cells) and a coarse mesh (644,140 cells) under the ER = 1 operating condition. Figure 5 shows the results using the coarse mesh model, which was ultimately selected for all simulations. Panel (a) displays the computational domain with center surface, fuel inlet, air inlet, and outlet. Four monitoring lines (panel b) were established to evaluate solution accuracy. Comparative temperature profiles (panel c) and O2 mole fraction distributions (panel d) between both meshes showed good agreement, with maximum deviations of only 2.3% for temperature and 3.1% for O2 mass fraction. The grid convergence index (GCI) of 3.47% confirmed adequate numerical accuracy [48]. While monitoring lines 3 and 4 show steeper gradients, the overall mesh density was optimized for global accuracy and computational efficiency, and further local refinement showed negligible improvement in solution quality. Based on these results, the 644,140-cell model was selected for subsequent simulations, reducing computational requirements by 67% while maintaining solution fidelity. All simulations achieved residual convergence below 10−4 for continuity, momentum, energy, and species equations, ensuring numerical accuracy of the solutions.

4. Results and Discussion

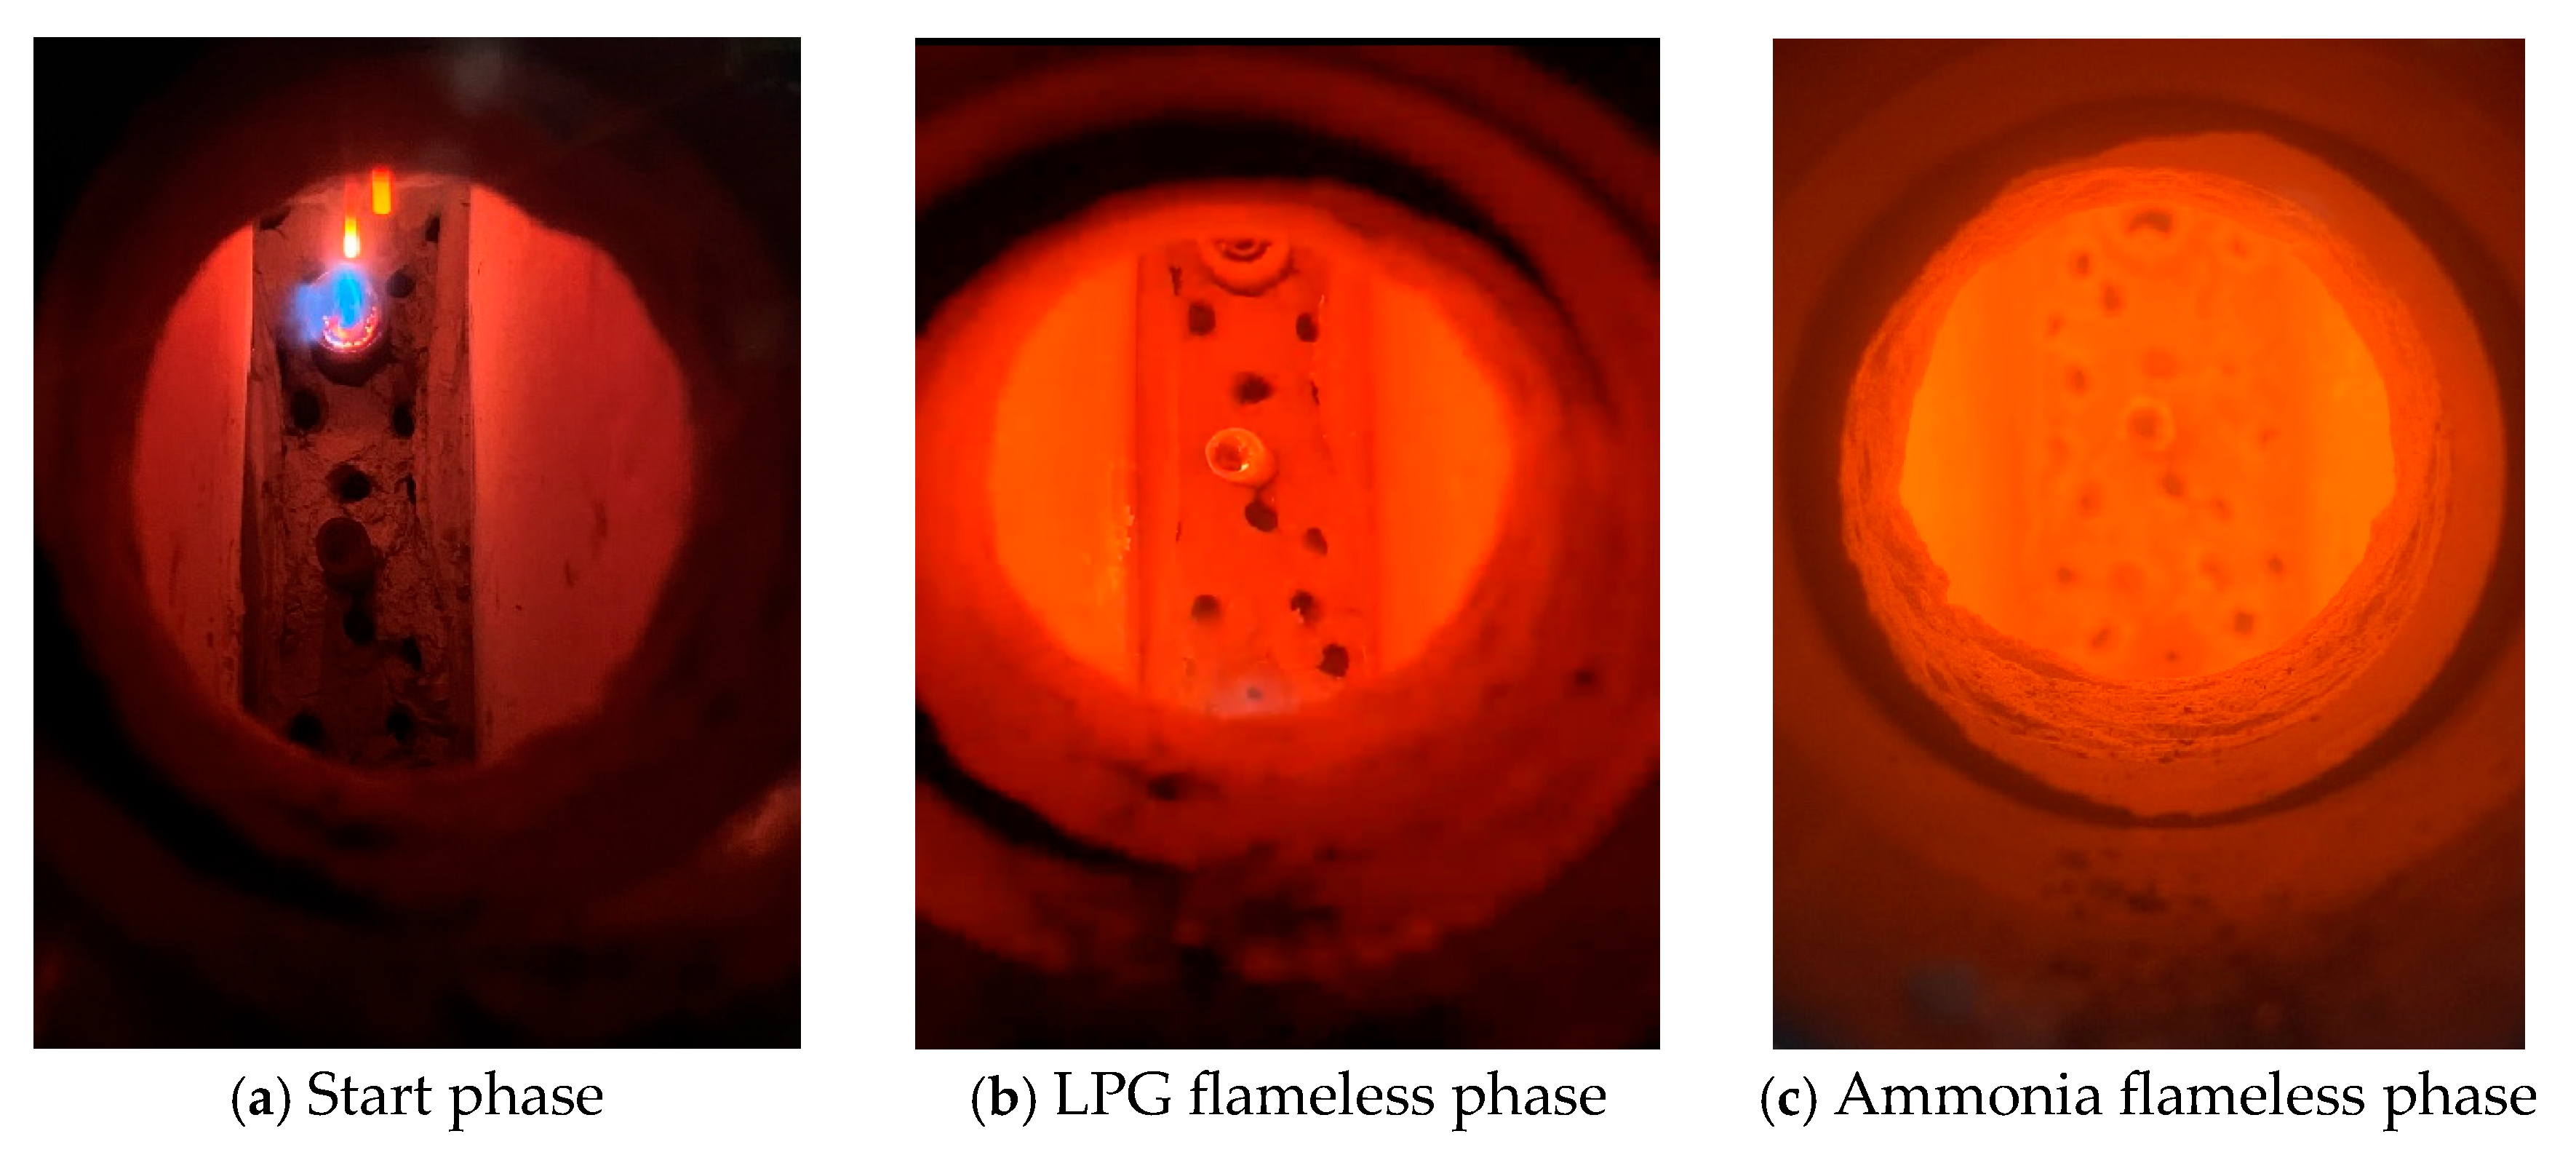
4.1. Experimental Results

The results of the experimental study depicted in Figure 6 provide the impact of ER and temperature on the emission of nitrogen oxide (NO), hydrogen (H2), and ammonia (NH3). Figure 6a demonstrates the relationship between NO concentration, ER, and temperature, which reveals a sensitive dependence of NO concentration on both ER and temperature, with ER exhibiting a more pronounced effect. Notably, there is a specific range of ER, between 0.6 and 0.8, where the concentration of NO reaches its apex, peaking at approximately 1245 ppm at 0.71. This observation aligns with the findings of Hayakawa et al.’s research, while indicating a 40% reduction in NO emissions within this range [49].
The data indicates a nonlinear relationship between NO concentration and ER; the concentration diminishes as ER deviates from this peak range. Particularly significant is the remarkable decline in NO concentration at ER above 1, dropping to near-zero at ER = 1.05. When compared to other pure ammonia combustion studies, such as Ariemma et al. [50] who reported minimum NO emissions of approximately 100 ppm with water injection assistance, the present results show significantly lower emissions without any additives or support mechanisms. The reason for this phenomenon is that the radicals such as NH and NH2 would diffuse along with the recirculation of flue gas where the reduction reactions can occur with appropriate environment.
The experimental findings also demonstrate a significant extension of ammonia’s flammability limits. While traditional ammonia combustion is limited to an ER range of 0.6–1.2 [14], the present flameless system maintained stable combustion across an unprecedented range of 0.3–0.6. This extension of the lean limit is directly related to the characteristics of this system, which creates strong flue gas recirculation and enhances radical concentrations through the chamber [27,28]. Figure 6b,c presents contour plots of hydrogen and residual ammonia emissions, respectively, under varying conditions of ER and temperature. The plots show a relatively uniform color distribution along the temperature axis, indicating that hydrogen and ammonia concentrations are predominantly influenced by ER within the temperature range of 1173 K to 1473 K. The concentration of hydrogen begins to escalate beyond ER of 1.0. Regarding ammonia, the plot shows that under lean combustion conditions (equivalence ratio < 1), the residual ammonia concentration remains below 100 ppm, while the emission increases linearly as the equivalence ratio increases. Because the NH3 concentration increases rapidly at an equivalent ratio of 1.05, it exceeds the upper limit of the detector (5000 ppm) and therefore cannot detect ammonia concentrations above an equivalent ratio of 1.0. Due to the adiabatic flame temperature limitation across equivalence ratios, the blank regions of Figure 6a,c are located on the top-left sides.

4.2. Results of CFD Simulation

Figure 7 presents a comprehensive visualization of the ammonia combustion simulation using the EDC model with the simplified kinetic mechanism. The contour plots display key parameters across five representative equivalence ratios (0.3, 0.45, 0.71, 1.0, and 1.05), providing insight into the reaction dynamics and NO emission.
The NO concentration distribution (first row of Figure 7) exhibits a pronounced dependence on the equivalence ratio, with distinct spatial patterns that correlate with OH radical and HNO intermediate distributions. At low ER values (0.3–0.45), NO concentrations are notably higher in the fuel recirculation zone compared to the air recirculation zone, a pattern similarly observed in the OH radical distribution (second row). This spatial correlation between NO and OH suggests the importance of OH-mediated reactions in the initial stages of NO formation, particularly through reactions R4 (NH3 + OH → NH2 + H2O) and R17 (NH + OH = NO + H2), which facilitate ammonia decomposition and subsequent NO formation. The HNO intermediate (third row) also shows highest concentrations in the fuel recirculation zone at ER = 0.3–0.45, further supporting the dominant NO formation pathway through reaction R28 (HNO + OH = NO + H2O) in this region.
As ER increases to 0.71, NO concentration intensifies significantly throughout the chamber while maintaining higher values in the fuel recirculation zone. This corresponds with an expanded and intensified OH distribution, reinforcing the critical role of OH radicals in ammonia oxidation leading to peak NO formation. Interestingly, at this ER value, HNO concentrations begin to diminish despite peak NO production, suggesting a shift in dominant NO formation pathways. This shift likely involves direct NH oxidation routes becoming more significant, particularly through reaction R14 (NH + O = NO + H), as oxygen remains sufficiently available while temperatures reach optimal values for these reactions.
Most notably, as conditions become fuel-rich (ER = 1.0–1.05), a remarkable reversal occurs in the NO concentration pattern, with the air recirculation zone now displaying higher NO concentrations than the fuel recirculation zone. This spatial redistribution reflects a fundamental shift in the dominant reaction zones as air input decreases. At ER = 0.71, the main reaction zone is located in the fuel recirculation region where sufficient oxygen availability promotes oxygen diffusion and elevated OH concentrations facilitating rapid ammonia decomposition via reaction R4 (NH3 + OH → NH2 + H2O). As the equivalence ratio increases to 1.0 and oxygen input decreases, the main reaction zone shifts to the air recirculation region. In this oxygen-depleted environment, abundant NH and NH2 radicals generated from ammonia decomposition become dominant reactive species that actively consume NO through reduction reactions, particularly R11 (NH2 + NO → N2 + H2O) and R20 (NH + NO → N2O + H). This mechanism explains why NO concentrations dramatically decrease in the fuel recirculation zone while the air recirculation region maintains higher NO levels due to reduced NH2 radical availability for NO reduction. The near disappearance of HNO at these high ER values further confirms the suppression of the HNO pathway to NO formation and the dominance of NO reduction mechanisms in fuel-rich regions. This trend is consistent with previous studies on ammonia combustion that have identified the critical role of ER in NO formation and reduction [7,30]. Somarathne et al. [31] and Okafor et al. [30] have specifically documented near-zero NO emissions in fuel-rich ammonia combustion (ER > 1), attributing this phenomenon to enhanced NO reduction pathways that become dominant.
Oxygen distribution and temperature patterns (fourth and fifth rows) further support the observed NO behavior. The O2 mole fraction at the chamber outlet decreases from 16.3% at ER = 0.3 to near-zero at ER = 1.05, matching the experimental values in Table 2. At higher ER values, this oxygen depletion creates favorable conditions for NO reduction reactions, particularly R11 (NH2 + NO → N2 + H2O), as demonstrated by Xiao et al. [51]. The temperature distribution remains relatively uniform (variations < 150 K) across all operating conditions, with values between 1223–1473 K a defining characteristic of successful flameless combustion [52]. This temperature range provides sufficient thermal energy for ammonia decomposition while avoiding the high-temperature peaks that typically accelerate thermal NO formation, contributing to the lower NO emissions observed under fuel-rich conditions. The velocity pathlines included in Figure 7 clearly demonstrate the asymmetric flow patterns characteristic of the RAI configuration. The pathlines show strong recirculation zones throughout the combustion chamber, confirming the enhanced mixing environment that facilitates stable flameless combustion across different equivalence ratios.
These simulation results demonstrate the characteristic features of the RAI configuration that distinguish it from conventional flameless systems. The asymmetric distribution patterns in Figure 7 show distinct fuel and air recirculation zones, confirming the enhanced mixing achieved through the RAI approach [27,28]. The recirculation ratio >5 significantly exceeds typical flameless combustion systems (2–4) [28,29], and the uniform temperature distribution with variations <150 K across the chamber maintains the defining characteristics of flameless combustion [52]. These features collectively provide evidence for the reverse air injection mechanism beyond the asymmetric air inlet positioning.

4.3. Comparison of CFD Models with Experiment Regarding NO Emissions

Figure 8 presents a comparison between experimentally measured and CFD-predicted NO emissions at the outlet across the range of equivalence ratios (0.3–1.05). The left vertical axis displays NO concentrations in ppm, normalized to 15% O2 (a standard practice in combustion research to facilitate comparison between different operating conditions by accounting for dilution effects). The right vertical axis shows the corresponding average furnace temperature by the measurement and simulation. Error bars on the experimental data represent the standard deviation from multiple measurements, indicating the reproducibility of the results.
The comparison reveals that the EDC model with the simplified kinetic mechanism provides good agreement with experimental measurements across most of the ER range, particularly in the fuel-rich region (ER > 0.7). In this region, the model successfully captures both the quantitative NO concentration values and the trend of decreasing emissions as ER approaches and exceeds stoichiometric conditions. The model accurately predicts the near-zero NO emissions at ER = 1.05, which represents one of the most significant findings of this study. This excellent agreement in the fuel-rich region can be attributed to the model’s effective representation of the NH2-mediated NO reduction pathways (particularly reaction R11: NH2 + NO → N2 + H2O) that become dominant under these conditions, as demonstrated by Somarathne et al. [31] and Okafor et al. [30]
In the fuel-lean region (ER = 0.3–0.7), some discrepancies between experimental and predicted values are observed, with the model generally underestimating NO emissions at very low ER values (0.3–0.4) and overestimating them in the mid-range (ER = 0.5–0.7). These differences may be attributed to several factors. First, the simplified reaction mechanism, while capturing the essential NO formation and reduction pathways, omits some intermediate species and reactions that could affect NO predictions under lean conditions. Second, the turbulence–chemistry interaction model has inherent limitations in fully representing the complex mixing processes in flameless combustion. Miller and Bowman [53] have noted that under lean conditions, the competition between various nitrogen-conversion pathways becomes more complex and sensitive to minor reaction channels that may not be fully captured in simplified mechanisms.
A notable observation from both experimental and simulation results is the relationship between temperature and NO emissions. While the average temperature increases from approximately 1220 K to 1470 K across the equivalence ratio range, NO emissions do not follow the exponential increase typically observed in conventional combustion where the Zeldovich mechanism dominates [52]. This demonstrates a key advantage of ammonia flameless combustion: the ability to operate at higher temperatures while maintaining lower NO emissions due to uniform temperature distribution and absence of localized high-temperature peaks. The model successfully captures this feature of ammonia flameless combustion, where equivalent ratio effects on reaction pathways appear to exert greater influence on NO formation than reaction temperature [51].
The model’s ability to accurately predict NO emissions across various operating conditions demonstrates the effectiveness of the simplified 36-reaction mechanism developed in this study. By focusing specifically on the critical NO formation and reduction pathways while minimizing computational complexity, the approach achieves a balance between accuracy and efficiency that makes it suitable for practical engineering applications in ammonia combustion system design and optimization.

5. Conclusions

The pure ammonia combustion phenomena at the flameless combustion chamber are investigated through experiments and simulations. The ammonia flow rate has been fixed at 10 lpm while the ER is controlled by varying the air flow rate. The experimental results show that the flameless combustion can extend operable range significantly down to ER = 0.3, and the NO emissions are lower than the previous reports, which shows the effect of the flameless combustion for ammonia utilization as a fuel.
This study developed a simplified 36-reaction kinetic mechanism for ammonia flameless combustion, reducing computational cost by 55% compared to the original Duynslaegher model while maintaining predictive accuracy for NO emissions under flameless conditions. The mechanism successfully captured the NO emissions behavior across different equivalence ratios by effectively representing the key formation and reduction pathways, though it showed limitations in predicting NO emissions under very lean conditions that require further optimization in future work.
Experimental validation demonstrated stable pure ammonia combustion across an exceptionally wide equivalence range (0.3–1.05), representing a significant advancement over conventional ammonia combustion systems which typically operate in much narrower operational windows. NO emissions exhibited a distinct maximum at ER = 0.71 (approximately 1245 ppm) and decreased to near-zero values at ER = 1.05, providing clear evidence that fuel-rich conditions represent optimal operation points for ammonia combustion systems targeting minimal NO emissions.
The CFD approach accurately reproduced these trends with acceptable deviations across the entire ER range and successfully predicted the observed spatial redistribution of NO concentration between fuel and air recirculation zones as conditions transitioned from lean to rich.
These findings establish both practical operational guidelines and an efficient computational framework for designing and optimizing low-emission ammonia combustion systems for industrial applications.

Author Contributions

L.Q.: Conceptualization, methodology, primary experimental investigation, and data analysis; writing—original draft. D.S.: Supervision, project administration, and resources; writing—review and editing. H.A.Y.R.: Experimental assistance, literature review, and data validation; writing—review. B.J.: Combustion furnace design, experimental setup support, and data curation; visualization. The authors have reviewed and edited the output and take full responsibility for the content of this publication. All authors have read and agreed to the published version of the manuscript.

Funding

This research was funded by KEIT (No. 20213030040550), KETEP (No. 202003040030090) and Korea Technology and Information Promotion Agency for SMEs (No. RS-2023-00269831).

Data Availability Statement

The original contributions presented in this study are included in the article. Further inquiries can be directed to the corresponding author.

Conflicts of Interest

The authors declare no conflicts of interest.

Abbreviations

FLOXFlameless Oxidation
CFDComputational Fluid Dynamics
DAQData Acquisition
DOMDiscrete Ordinates Model
EDCEddy Dissipation Concept
EREquivalence Ratio
GCIGrid Convergence Index
HNONitroxyl
ISATIn Situ Adaptive Tabulation
LPGLiquefied Petroleum Gas
MILDModerate or Intense Low-oxygen Dilution
NONitric Oxide
RAIReverse Air Injection
RANSReynolds-Averaged Navier–Stokes
RRRecirculation Ratio
TCThermocouple
TROETroe pressure-dependence formalism
WSGGMWeighted Sum of Gray Gases Model

References

  1. Ariemma, G.B.; Sorrentino, G.; Ragucci, R.; de Joannon, M.; Sabia, P. Ammonia/Methane combustion: Stability and NOx emissions. Combust. Flame 2022, 241, 112071. [Google Scholar] [CrossRef]
  2. Sánchez-Bastardo, N.; Schlögl, R.; Ruland, H. Methane pyrolysis for zero-emission hydrogen production: A potential bridge technology from fossil fuels to a renewable and sustainable hydrogen economy. Ind. Eng. Chem. Res. 2021, 60, 11855–11881. [Google Scholar] [CrossRef]
  3. Dincer, I.; Aydin, M.I. New paradigms in sustainable energy systems with hydrogen. Energy Convers. Manag. 2023, 283, 116950. [Google Scholar] [CrossRef]
  4. Muthukumar, P.; Kumar, A.; Afzal, M.; Bhogilla, S.; Sharma, P.; Parida, A.; Jana, S.; Kumar, E.A.; Pai, R.K.; Jain, I. Review on large-scale hydrogen storage systems for better sustainability. Int. J. Hydrogen Energy 2023, 48, 33223–33259. [Google Scholar] [CrossRef]
  5. Yousefi Rizi, H.A.; Shin, D. Green hydrogen production technologies from ammonia cracking. Energies 2022, 15, 8246. [Google Scholar] [CrossRef]
  6. Chehade, G.; Dincer, I. Progress in green ammonia production as potential carbon-free fuel. Fuel 2021, 299, 120845. [Google Scholar] [CrossRef]
  7. Valera-Medina, A.; Xiao, H.; Owen-Jones, M.; David, W.I.; Bowen, P. Ammonia for power. Prog. Energy Combust. Sci. 2018, 69, 63–102. [Google Scholar] [CrossRef]
  8. Nur-E-Alam, M.; Mostofa, K.Z.; Yap, B.K.; Khairul, M.; Das, N.; Kiong, T.S. Machine learning-enhanced all-photovoltaic blended systems for energy-efficient sustainable buildings. Sustain. Energy Technol. Assess. 2024, 62, 103636. [Google Scholar] [CrossRef]
  9. Peters, R.; Pasel, J.; Samsun, R.C. Technology transfer from fuel processing for fuel cells to fuel synthesis from hydrogen and carbon dioxide. Int. J. Hydrogen Energy 2024, 49, 943–961. [Google Scholar] [CrossRef]
  10. Ristig, S.; Poschmann, M.; Folke, J.; Gómez-Cápiro, O.; Chen, Z.; Sanchez-Bastardo, N.; Schlögl, R.; Heumann, S.; Ruland, H. Ammonia decomposition in the process chain for a renewable hydrogen supply. Chem. Ing. Technol. 2022, 94, 1413–1425. [Google Scholar] [CrossRef]
  11. Jindal, A.; Shrimali, G. At-scale adoption of battery storage technology in Indian power industry: Enablers, frameworks and policies. Technol. Forecast. Soc. Change 2022, 176, 121467. [Google Scholar] [CrossRef]
  12. Park, Y.-K.; Kim, B.-S. Catalytic removal of nitrogen oxides (NO, NO2, N2O) from ammonia-fueled combustion exhaust: A review of applicable technologies. Chem. Eng. J. 2023, 461, 141958. [Google Scholar] [CrossRef]
  13. Elbaz, A.M.; Wang, S.; Guiberti, T.F.; Roberts, W.L. Review on the recent advances on ammonia combustion from the fundamentals to the applications. Fuel Commun. 2022, 10, 100053. [Google Scholar] [CrossRef]
  14. Kobayashi, H.; Hayakawa, A.; Somarathne, K.K.A.; Okafor, E.C. Science and technology of ammonia combustion. Proc. Combust. Inst. 2019, 37, 109–133. [Google Scholar] [CrossRef]
  15. Yousefi Rizi, H.A.; Shin, D. Development of ammonia combustion technology for NOx reduction. Energies 2025, 18, 1248. [Google Scholar] [CrossRef]
  16. Zel’dovich, I.A.; Barenblatt, G.I.; Librovich, V.; Makhviladze, G. Mathematical Theory of Combustion and Explosions; Consultants Bureau: New York, NY, USA, 1985. [Google Scholar]
  17. Li, T.; Duan, Y.; Wang, Y.; Zhou, M.; Duan, L. Research progress of ammonia combustion toward low-carbon energy. Fuel Process. Technol. 2023, 248, 107821. [Google Scholar] [CrossRef]
  18. Cai, T.; Zhao, D. Overview of auto-ignition and flame propagation properties for ammonia combustion. AIAA J. 2023, 61, 2754–2778. [Google Scholar] [CrossRef]
  19. Tian, J.; Wang, L.; Xiong, Y.; Wang, Y.; Yin, W.; Tian, G.; Wang, Z.; Cheng, Y.; Ji, S. Enhancing combustion efficiency and reducing nitrogen oxide emissions from ammonia combustion: A comprehensive review. Process Saf. Environ. Prot. 2024, 183, 1–17. [Google Scholar] [CrossRef]
  20. Ma, F.; Guo, L.; Li, Z.; Zeng, X.; Zheng, Z.; Li, W.; Zhao, F.; Yu, W. A review of current advances in ammonia combustion from the fundamentals to applications in internal combustion engines. Energies 2023, 16, 6304. [Google Scholar] [CrossRef]
  21. Zięba, M. Experimental and Modelling Studies on Fuel-NOx Formation During Flameless Combustion of Biogenous Fuels. Ph.D. Thesis, University of Stuttgart, Stuttgart, Germany, 2023. [Google Scholar]
  22. Li, P.-W.; Chyang, C.-S.; Ni, H.-W. An experimental study of the effect of nitrogen origin on the formation and reduction of NOx in fluidized-bed combustion. Energy 2018, 154, 319–327. [Google Scholar] [CrossRef]
  23. Gheidan, A.A.; Wahid, M.B.A.; Opia, A.C. Flameless combustion mode as a promising trend: A review on its fundamental role towards emissions reduction, fuel consumption and performance enhancement. AIP Conf. Proc. 2023, 2432, 020001. [Google Scholar] [CrossRef]
  24. Dimitriou, P.; Javaid, R.A. A review of ammonia as a compression-ignition engine fuel. Int. J. Hydrogen Energy 2020, 45, 7098–7118. [Google Scholar] [CrossRef]
  25. Zieba, M.; Brink, A.; Schuster, A.; Hupa, M.; Scheffknecht, G. Ammonia chemistry in a flameless jet. Combust. Flame 2009, 156, 1950–1956. [Google Scholar] [CrossRef]
  26. Ariemma, G.B.; Sabia, P.; Sorrentino, G.; Bozza, P.; de Joannon, M.; Ragucci, R. Influence of water addition on MILD ammonia combustion performances and emissions. Proc. Combust. Inst. 2021, 38, 5147–5154. [Google Scholar] [CrossRef]
  27. Jiang, W.; Zhu, R.; Shin, D. Heat transfer characteristics of tubular heat exchanger using reverse air injection flameless combustion. Appl. Therm. Eng. 2023, 230, 120713. [Google Scholar] [CrossRef]
  28. Zhu, R.; Shin, D. Study on flow and heat transfer characteristics of 25 kW flameless combustion in a cylindrical heat exchanger for a reforming processor. Energies 2023, 16, 7160. [Google Scholar] [CrossRef]
  29. Choi, C.; Kim, W.; Shin, D. Combustion characteristics by reversed air injection as a flameless combustion. J. Mech. Sci. Technol. 2017, 31, 1593–1601. [Google Scholar]
  30. Okafor, E.C.; Somarathne, K.K.A.; Hayakawa, A.; Kudo, T.; Kurata, O.; Iki, N.; Kobayashi, H. Towards the development of an efficient low-NOx ammonia combustor for a micro gas turbine. Proc. Combust. Inst. 2019, 37, 4597–4606. [Google Scholar] [CrossRef]
  31. Somarathne, K.D.K.A.; Hatakeyama, S.; Hayakawa, A.; Kobayashi, H. Numerical study of a low-emission gas-turbine-like combustor for turbulent ammonia/air premixed swirl flames with a secondary air injection at high pressure. Int. J. Hydrogen Energy 2017, 42, 27388–27399. [Google Scholar] [CrossRef]
  32. Oh, N.; Shin, J.; Jeon, B.; Choi, C.; Shin, D. Development of a flameless furnace with swirling reversed air injection method. In Proceedings of the International Conference of Aerospace and Mechanical Engineering 2019: AeroMech 2019, Pulau Pinang, Malaysia, 20–21 November 2019; Springer: Singapore, 2020; pp. 233–247. [Google Scholar]
  33. Abuelnuor, A.; Wahid, M.; Hosseini, S.E.; Saat, A.; Saqr, K.M.; Sait, H.H.; Osman, M. Characteristics of biomass in flameless combustion: A review. Renew. Sustain. Energy Rev. 2014, 33, 363–370. [Google Scholar] [CrossRef]
  34. Borghi, R.; Destriau, M. Combustion and Flames: Chemical and Physical Principles; Eyrolles: Paris, France, 1998. [Google Scholar]
  35. Bowman, C.T. An experimental and analytical investigation of the high-temperature oxidation mechanisms of hydrocarbon fuels. Combust. Sci. Technol. 1970, 2, 161–172. [Google Scholar] [CrossRef]
  36. Guillou, E. Flame Characteristics and Application of Flameless Combustion. Ph.D. Thesis, University of Cincinnati, Cincinnati, OH, USA, 2008. [Google Scholar]
  37. Zhang, X.; Moosakutty, S.P.; Rajan, R.P.; Younes, M.; Sarathy, S.M. Combustion chemistry of ammonia/hydrogen mixtures: Jet-stirred reactor measurements and comprehensive kinetic modeling. Combust. Flame 2021, 234, 111653. [Google Scholar] [CrossRef]
  38. Udochukwu, G.O.; Vyacheslav, A. Reynolds-averaged Navier–Stokes (RANS) simulation of a staged pressurized oxy-coal combustion (SPOC). Proc. West Va. Acad. Sci. 2019, 91, 1–11. [Google Scholar] [CrossRef]
  39. Tusar, M.; Noman, A.; Islam, M.; Yarlagadda, P.; Salam, B. CFD study of heat transfer enhancement and fluid flow characteristics of turbulent flow through tube with twisted-tape inserts. Energy Procedia 2019, 160, 715–722. [Google Scholar] [CrossRef]
  40. Chen, Y.-S.; Kim, S.-W. Computation of Turbulent Flows Using an Extended k–ε Turbulence Closure Model; NASA Contractor Report 179204; NASA: Washington, DC, USA, 1987.
  41. Nguyen, P.D.; Ghazal, G.; Piñera, V.C.; Battaglia, V.; Rensgard, A.; Ekman, T.; Gazdallah, M. Modelling of flameless oxy-fuel combustion with emphasis on radiative heat transfer for low calorific-value blast-furnace gas. Energy Procedia 2017, 120, 492–499. [Google Scholar] [CrossRef]
  42. Fiveland, W.A. Discrete-ordinates solutions of the radiative transport equation for rectangular enclosures. J. Quant. Spectrosc. Radiat. Transfer 1984, 31, 63–80. [Google Scholar] [CrossRef]
  43. Parente, A.; Malik, M.R.; Contino, F.; Cuoci, A.; Dally, B.B. Extension of the Eddy Dissipation Concept for turbulence/chemistry interactions to MILD combustion. Fuel 2016, 163, 98–111. [Google Scholar] [CrossRef]
  44. Mousavi, S.M.; Sotoudeh, F.; Jun, D.; Lee, B.J.; Esfahani, J.A.; Karimi, N. On the effects of NH3 addition to a reacting mixture of H2/CH4 under MILD combustion regime: Numerical modeling with a modified EDC combustion model. Fuel 2022, 326, 125096. [Google Scholar] [CrossRef]
  45. Pope, S.B. Computationally efficient implementation of combustion chemistry using in-situ adaptive tabulation. Combust. Theory Model. 1997, 1, 41–63. [Google Scholar] [CrossRef]
  46. Duynslaegher, C.; Contino, F.; Vandooren, J.; Jeanmart, H. Modeling of ammonia combustion at low pressure. Combust. Flame 2012, 159, 2799–2805. [Google Scholar] [CrossRef]
  47. Troe, J. Theory of thermal unimolecular reactions at low pressures. I. Solutions of the master equation. J. Chem. Phys. 1977, 66, 4745–4757. [Google Scholar] [CrossRef]
  48. Mansour, A.; Laurien, E. Numerical error analysis for three-dimensional CFD simulations in the two-room model containment THAI +: Grid-convergence index, wall-treatment error and scalability tests. Nucl. Eng. Des. 2018, 326, 220–233. [Google Scholar] [CrossRef]
  49. Hayakawa, A.; Arakawa, Y.; Mimoto, R.; Somarathne, K.K.A.; Kudo, T.; Kobayashi, H. Experimental investigation of stabilization and emission characteristics of ammonia/air premixed flames in a swirl combustor. Int. J. Hydrogen Energy 2017, 42, 14010–14018. [Google Scholar] [CrossRef]
  50. Aminian, J.; Galletti, C.; Shahhosseini, S.; Tognotti, L. Key modeling issues in prediction of minor species in diluted-preheated combustion conditions. Appl. Therm. Eng. 2011, 31, 3287–3300. [Google Scholar] [CrossRef]
  51. Xiao, H.; Valera-Medina, A.; Bowen, P.J. Modeling combustion of ammonia/hydrogen fuel blends under gas-turbine conditions. Energy Fuels 2017, 31, 8631–8642. [Google Scholar] [CrossRef]
  52. Wünning, J.A.; Wünning, J.G. Flameless oxidation to reduce thermal NO-formation. Prog. Energy Combust. Sci. 1997, 23, 81–94. [Google Scholar] [CrossRef]
  53. Miller, J.A.; Bowman, C.T. Mechanism and modeling of nitrogen chemistry in combustion. Prog. Energy Combust. Sci. 1989, 15, 287–338. [Google Scholar] [CrossRef]
Figure 1. Experimental apparatus diagram.
Energies 18 03104 g001
Figure 2. Geometry of the flameless furnace.
Energies 18 03104 g002
Figure 3. Captured images of each combustion phase.
Energies 18 03104 g003
Figure 4. NO formation and reduction reaction pathways for reduced ammonia combustion mechanism.
Energies 18 03104 g004
Figure 5. Grid dependency analysis based on temperature and O2 distribution: (a) coarse mesh (644.140); (b) positions of four monitoring lines; (c) comparison of temperature profiles along the lines for coarse and fine meshes; (d) comparison of O2 mole fraction along the same lines for coarse and fine meshes.
Energies 18 03104 g005
Figure 6. Effect of equivalence ratio and temperature on measured NO, H2, and NH3 emission. (a) NO; (b) H2; (c) NH3. (Energies 18 03104 i001: selected points for simulation analysis).
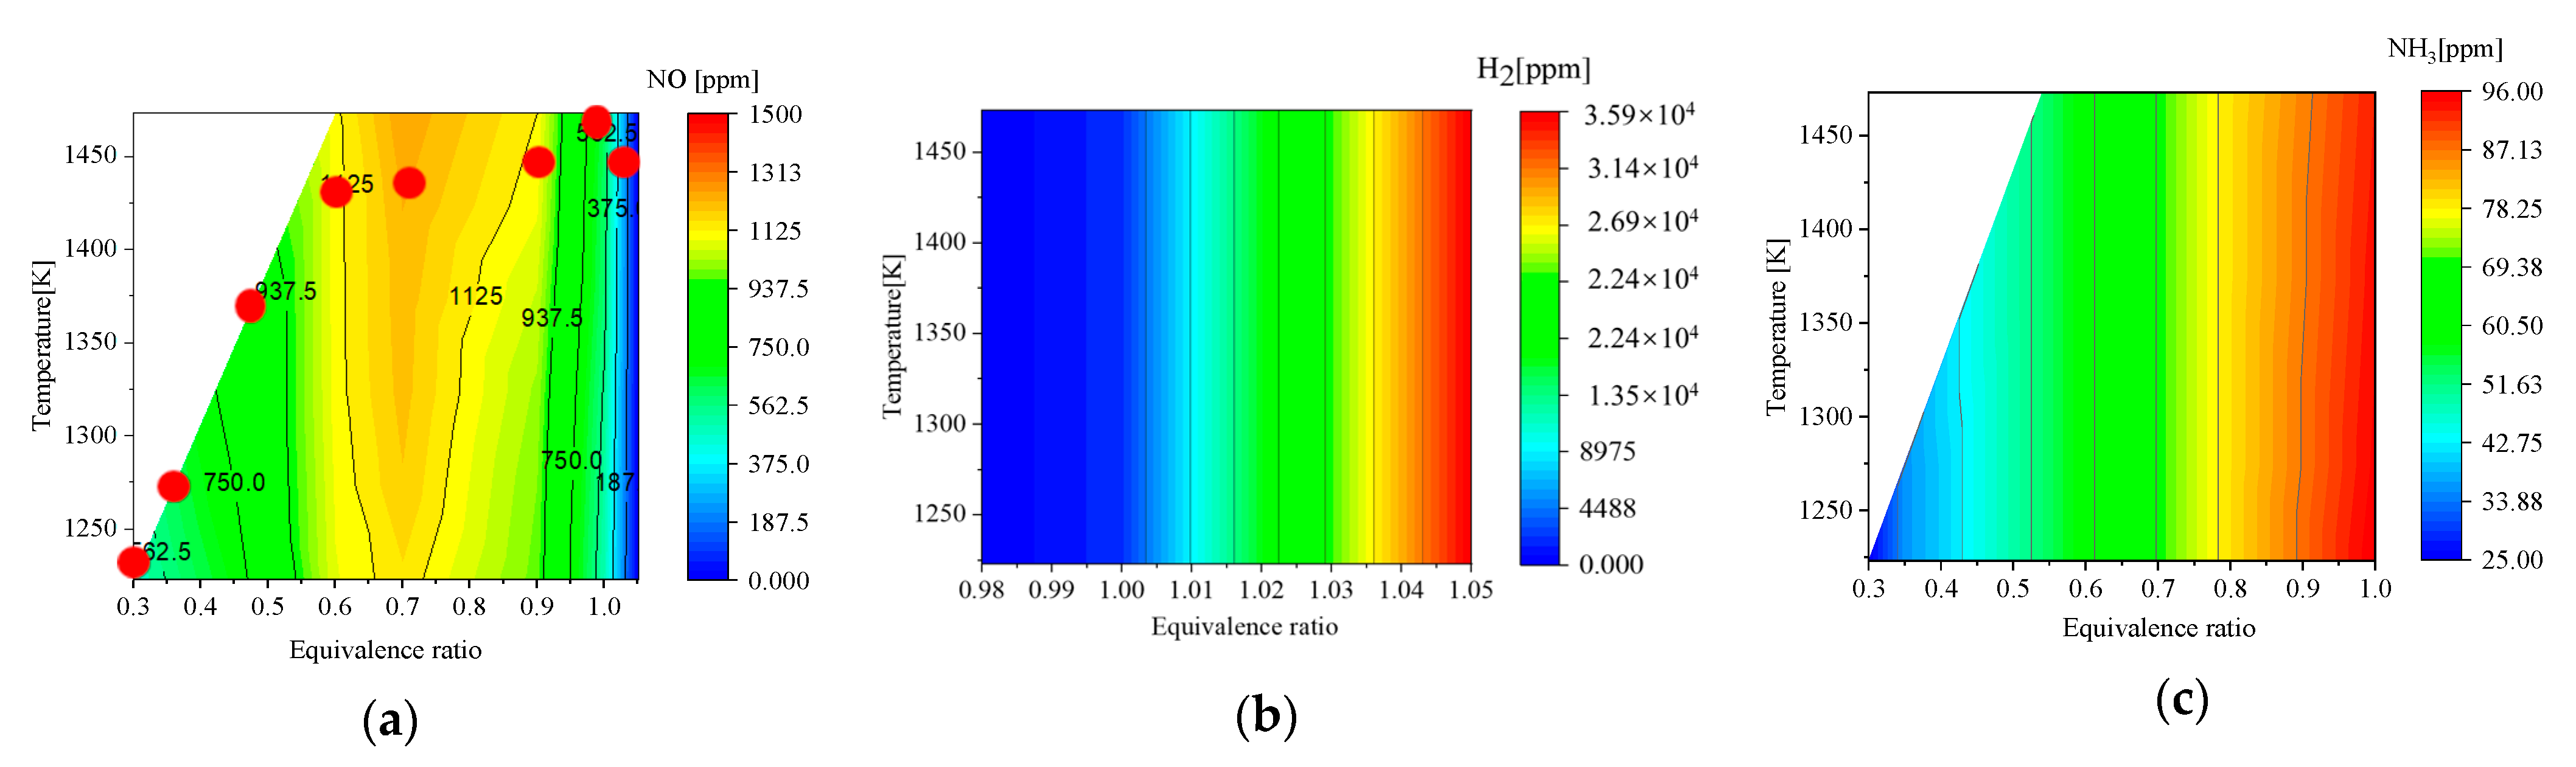
Energies 18 03104 g006
Figure 7. Contour plots of species distributions and temperature across different equivalence ratios (ER = 0.3, 0.45, 0.71, 1.0, and 1.05) simulated using the EDC model with simplified kinetic mechanism.
Energies 18 03104 g007
Figure 8. Comparison of NO emissions at varying ERs.
Energies 18 03104 g008
Table 1. Measurement instruments.
Measurement TargetInstrument
Furnace temperature distributionDAQ (Yokogawa MV2000, Tokyo, Japan)/K-type thermo-couples (T max = 1360 °C, precision: ±1 °C)
Chemical species (O2, NO)Testo 330-LL (Testo SE & Co. KGaA, Lenzkirch, Germany) (O2: 0–25% ± 0.1%, NO: 0–3000 ppm ±0.5%,) (electrochemical sensors)
Chemical species (H2)MRU SWG 200-1 (MRU Instruments Inc., Neckarsulm, Germany) (0–100% ± 1%) (NDIR: non-dispersive infrared sensor)
Chemical species (NH3)CLD844 CM h (Multi Instruments Analytical, Breda, The Netherlands) (0~5000 ppm ± 0.1%) (electrochemical sensor)
Table 2. Operating conditions of ammonia flameless combustion.
CaseAir Flow
Rate [lpm]
Fuel Flow Rate [lpm]Outlet O2 Concentration (Measured) [%]Air Jet
Velocity [m/s]
Equivalence Ratio
134100801.05
236101851.00
340103.3910.9
4501071180.71
560109.81420.60
6801013.31890.45
71001015.42350.36
81201016.32830.30
Table 3. Equations to be solved for computational fluid dynamics [28].
Continuity equation: ρ t + ρ u = 0 (4)
Momentum Conservation Equation t ρ v + ρ v v = p + τ ¯ + ρ g + F (5)
Turbulent kinetic energy k : ρ k t + ρ k u i x i = x j μ t σ k k x i + 2 μ t E i j E i j ρ ε (6)
Dissipation ε : ρ k t + ρ ε u i x i = x j μ t σ ε ε x j + C 1 ε ε k 2 μ t E i j E i j C 2 ε ρ ε 2 k (7)
Energy equation: t ρ H + ρ v H = k t c p H + S h (8)
Discrete ordinates (DO) radiation model: I r , s s + a + σ s I r , s = a n 2 σ T 4 π + σ s 4 π 0 4 π I r , s Φ s , s d Ω (9)
Species transport: t ρ Y i + ρ v Y i = J l + R i (10)
Table 4. The thermophysical properties of ammonia [15].
Thermophysical PropertiesValues
Specific gravity0.597 (1.013 bar at 21 °C) (air = 1)
Specific volume1.411 m3/kg (1.013 bar at 21 °C)
Specific heat at constant pressure (cp)0.037 kJ/(mol·K) (1.013 bar at 15 °C)
Specific heat at constant volume (cv)0.028 kJ/(mol·K) (1.013 bar at 15 °C)
Ratio of specific heats (cp/cv)1.309623 (1.013 bar at 15 °C)
Dynamic viscosity0.000098 Poise (1.013 bar at 0 °C)
Thermal conductivity22.19 mW/(m·K) (1.013 bar at 0 °C)
Autoignition temperature630 °C
Ignition temperature651 °C
Table 5. Simplified reaction mechanism for NH3 combustion and NO formation.
NumberReactions A i β i E i (cal/mole) Others
R1NH3 + M = NH2 + H + M2.20 × 10160.00 × 1009.35 × 104-
R2NH3 + H = NH2 + H25.42 × 1052.40 × 1009.92 × 103-
R3NH3 + O = NH2 + OH1.10 × 1062.10 × 1005.21 × 103-
R4NH3 + OH = NH2 + H2O5.00 × 1071.60 × 1009.50 × 102-
R5NH2 + M = NH + H + M3.16 × 1023−2.00 × 1009.14 × 104-
R6NH2 + H = NH + H21.00 × 1062.32 × 1007.99 × 102-
R7NH2 + O = NH + OH7.00 × 10120.00 × 1000.00 × 100-
R8NH2 + OH = NH + H2O9.00 × 1071.50 × 100−4.60 × 10²-
R9NH2 + O = HNO + H4.50 × 10130.00 × 1000.00 × 100-
R10NH2 + O2 = HNO + OH1.00 × 10130.00 × 1002.63 × 104-
R11NH2 + NO = N2 + H2O2.77 × 1020−2.65 × 1001.26 × 103-
R12NH2 + NO = H2 + N2O1.00 × 10130.00 × 1003.37 × 104-
R13NH + H = N + H23.20 × 10130.00 × 1003.25 × 102-
R14NH + O = NO + H7.00 × 10130.00 × 1000.00 × 100-
R15NH + O = N + OH7.00 × 10120.00 × 1000.00 × 100-
R16NH + OH = HNO + H2.00 × 10130.00 × 1000.00 × 100-
R17NH + OH = NO + H22.00 × 10130.00 × 1000.00 × 100-
R18NH + O2 = HNO + O4.00 × 10130.00 × 1001.79 × 104-
R19NH + O2 = NO + OH4.50 × 1087.90 × 10−11.19 × 10³-
R20NH + NO = N2O + H5.00 × 1014−4.00 × 10−10.00 × 100-
R21NH + NO = N2 + OH6.10 × 1013−5.00 × 10−11.20 × 102-
R22N + O2 = NO + O9.00 × 1091.00 × 1006.50 × 103-
R23N + OH = NO + H2.80 × 10130.00 × 1000.00 × 100-
R24N + NO = N2 + O1.80 × 10140.00 × 1007.61 × 104-
R25NO + O(+M) = NO2(+M)1.30 × 10¹⁵−7.50 × 10−10.00 × 100Low: 4.72 × 1024/−2.87/1.55 × 103
TROE: 9.62 × 10⁻¹/101/7960
Ar/0.6/NO2/6.2/NO/1.8/O2/0.8/N2O/4.4/H2O/10/
R26H + NO(+M) = HNO(+M)1.52 × 10¹⁵−4.10 × 10−10.00 × 100Low: 4.00 × 10²⁰/−1.75/0
H2O/10/O2/1.5/Ar/0.75/H2/2/
R27HNO + H = NO + H24.46 × 10117.20 × 10−16.55 × 10²-
R28HNO + OH = NO + H2O1.30 × 1071.88 × 100−9.56 × 10²-
R29HNO + O = OH + NO5.00 × 10115.00 × 10−12.00 × 10³-
R30NNH = N2 + H3.00 × 1080.00 × 1000.00 × 100-
R31H + HO2 = OH + OH1.70 × 1014−1.00 × 1008.75 × 102
R32H + O2 = OH + O9.75 × 1013−1.30 × 1001.49 × 104-
R33O2 + M = O + O + M1.00 × 1017−1.00 × 1000.00 × 100O/71/O2/20/NO/5/N2/5/N/5/H2O/5/
R34O + H2 = OH + H5.06 × 1042.67 × 1006.29 × 103-
R35H + O2(+M) = HO2(+M)1.48 × 10126.00 × 10−10.00 × 100Low: 3.50 × 10¹⁶/−0.41/−1.12 × 103
TROE: 0.5/1.00 × 105/10
H2O/10.6/H2/1.5/
R36N2O(+M) = N2 + O(+M)1.26 × 10120.00 × 1006.26 × 104Low: 4.00 × 10¹⁴/0.00/5.66 × 104
O2/1.4/N2/1.7/H2O/12/NO/3/N2O/3.5/
Disclaimer/Publisher’s Note: The statements, opinions and data contained in all publications are solely those of the individual author(s) and contributor(s) and not of MDPI and/or the editor(s). MDPI and/or the editor(s) disclaim responsibility for any injury to people or property resulting from any ideas, methods, instructions or products referred to in the content.

