Abstract
The agriculture sector is a major contributor to the economy of Alberta, Canada, accounting for almost 2.8% of the total GDP. Considering its importance, implementing efficient and cost-effective irrigation systems is vital for promoting sustainable agriculture in semi-arid regions like Lethbridge County, Alberta, Canada. Although irrigation is primarily carried out using the Oldman River and its allied reservoirs, groundwater pumping becomes a supplementary necessity during periods of limited surface water availability or droughts. This research investigates the potential of renewable energy resources, such as wind and solar energy, to meet the energy requirements for crop irrigation. The study begins by identifying and calculating the water requirements for major crops in Lethbridge County, such as wheat and barley, using the United Nations Food and Agriculture Organization’s CROPWAT 8.0 software. Subsequently, energy calculations were conducted to meet the specific crop water demand through the design of a hybrid energy system using Homer Pro 3.16.2. A technoeconomic analysis of the renewable hybrid system has been carried out to demonstrate the efficiency and novelty of the proposed work. Outcomes revealed that the proposed system is both efficient and economical in fulfilling the crop water requirement through groundwater pumping, promoting sustainable agriculture, and helping to ensure food security in the region.
1. Introduction
Rapid climate changes, exponential population growth, and urbanization are some of the major challenges nations face in the efficient management of water resources for crop irrigation. Water scarcity is considered the second-largest issue after climate change by scientists in this century [1,2]. An increase in the gap between water supply and demand on a global scale is an emerging concern in the upcoming years [3,4]. Almost 87% of water consumed directly helps in fulfilling approximately 40–45% of the world’s food requirements [5].
Similarly, crops play a vital role in the economy of Canada, i.e., 7% of Canada’s GDP and 11% of jobs are related to the agriculture sector [6,7,8]. Out of this 7% GDP, Alberta’s agriculture sector incorporates a significant share of 2.8% [9]. Wheat and barley are the two major crops of the Alberta region, accounting for 28.4% and 52.2% of Canada’s harvested crops, respectively [10]. In 2022, wheat and barley produced in Alberta were estimated at approximately 416 million bushels and 247.13 million bushels, respectively [11].
Water usage for irrigation purposes in southern Alberta mainly relies on the Bow, Oldman, and South Saskatchewan River sub-basins (SSRB). Population and economic growth have significantly increased the pressure on these basins, which resulted in the closure of additional water license allocations in 2006. The water shortage has further increased in recent years due to increases in temperature, greater evapotranspiration, and changes in the timing and amounts of precipitation, which may be a part of local global climate change [12]. Evapotranspiration (Eto) is an important parameter of the hydrological cycle and plays a vital role in water management concerning irrigated and rainfed agriculture [13]. With the increase in Eto, crop water requirement also increases in a linear trend to maintain the quality of crops [14,15]. The Penman–Monteith equation is employed to estimate the reference evapotranspiration (ETo), which is a key parameter for determining the crop water requirement (CWR). The CWR is derived by multiplying ETo with a crop coefficient (Kc) that varies depending on the crop type and growth stage. The United Nations Food and Agriculture Organization designed a software named CROPWAT based on this method to calculate potential Eto using various parameters, such as temperature, humidity, wind speed, and irradiance.
Lethbridge County is one of the major stakeholders in the agriculture sector of Alberta. Being a semi-arid area, it relies on water from the Oldman River for the irrigation of crops. Due to water reduction from the river basins, groundwater can play a supplementary role in fulfilling the remaining water demand of Lethbridge County. However, groundwater pumping on a large scale is an energy-intensive task. Conventional energy resources are not economical in comparison to renewables and are considered one of the major reasons for abrupt climate change. Renewable energy resources such as solar irradiance, wind, and biomass are needed to shift from conventional power sources to clean and environment-friendly sources for groundwater pumping [16]. Solar photovoltaic systems are considered one of the most economical energy sources due to the decreasing cost over time. Dependency on solar photovoltaic systems has significantly increased all over the globe, shifting reliance from conventional to renewable energy resources [17]. Similarly, as stated by the Canadian Wind Energy Association, wind energy has recently become the primary source of renewable energy generation in Canada. The National Energy Board predicts that wind energy could account for 27% of all new power production between 2017 and 2040. In Alberta, wind energy has become the second most significant new source of electricity, attracting 1.2 billion USD in private investment for five new wind energy developments in recent years [18]. These renewable and clean energy sources can be vital in providing cost-effective and environmentally friendly energy for groundwater pumping.
In an application of CROPWAT [19], the authors presented the water requirement of various crops in Peshawar, Pakistan. Wheat, sorghum, and millet crops were considered for the study. The study emphasized the necessity of irrigation water to produce high-quality crops, as the available rainwater falls short of meeting the calculated crop water requirements for the region. Similarly, in Sudan [20], authors presented a comprehensive analysis on the potential of wind- and solar energy resources-based hybrid systems for water pumping required for irrigation of the agriculture sector. Different combinations of renewables were considered in designing a hybrid system at 12 different locations in Sudan using the soil and weather data. The outcome revealed that optimal hybrid system selection mainly relies on the cost and availability of renewable resources on specific sites.
In Saudi Arabia [21], authors stated that the reduction in rainfall due to climate change has a severe effect on crop production globally, and in some arid and semiarid regions, groundwater resources are diminishing very rapidly, a real threat to the ecosystem and environment [22,23]. To compensate for these changes and ensure food security, motorization of irrigation systems can help in decreasing the impact of droughts. Renewable hybrid systems have been considered for providing energy requirements for irrigation in Shaqra, Saudi Arabia. Crop water requirements for three crops have been calculated using CROPWAT and Homer Pro has been used to design the hybrid system and perform its techno-economic analysis for the understanding of system behavior. The result showed that the hybridization of PV systems and wind turbine setups can help in ensuring the required energy for irrigation purposes in the vicinity. The authors discussed the renewable energy and irrigation nexus concerning various parameters in the area of northwestern India [24]. The study indicates that 72% of the tube wells are electrically powered and consume almost 40% of the total electric power in the area. This has significantly increased the irrigated area by 36% due to low losses and economic energy factors. Due to the dependency on renewable energy sources, the yield of the area discussed is comparatively more economical than the Uttar Pradesh, Bihar, and Gujarat states. Authors in [25] stated that agriculture consumes almost 70% of the water available globally, and its 60% share is being wasted in processes that require efficient water management to ensure food security. The study has been carried out to analyze the irrigation water requirement for the specific crops in the area of Shaheed Benazirabad District, Sindh. CROPWAT software designed by FAO has been used for the water requirement of the area crops. Outcomes revealed that the use of efficient tools such as CROPWAT 8.0 and CLIMWAT 2.0 are beneficial in efficient irrigation and increase productivity.
Likewise, in [26], the authors presented a study on the assessment of crop water requirements for Maize to effectively manage the irrigation setup. CROPWAT was used in the study to analyze the water requirement for the specific crop using 16 years of available data for various parameters associated with water requirement calculations. The output of the research revealed the daily, monthly, and annual requirement of water at different stages of growth to avail high-quality crops. The authors evaluated suitable solutions to reduce agricultural green water scarcity due to rapid climatic changes [27]. The study mentioned that rain-fed agriculture is incorporating almost 60% of the food production on a global scale, which is being affected greatly due to current environmental pollution and its adverse effects in the form of low ratios of rain and even droughts. Green water requirements have been assessed in case of non-availability of rainwater. The study revealed that the green water adaptation strategies have the potential to reduce food production loss for up to 100 million people.
Furthermore, incorporating an Energy Storage System (ESS) can be beneficial for a Hybrid Renewable Energy System (HRES) to meet the fluctuating power supply or in the absence of solar and wind energy generation [28]. In addition to the growing need for sustainable agricultural practices, effective coordination among energy, water, and crop management systems has become increasingly critical. Recent studies on sustainable supply chains emphasize the role of coordination contracts—such as two-part tariffs, revenue sharing, and quantity flexibility—in aligning stakeholder interests and improving operational efficiency under uncertain demand conditions. These synchronization mechanisms not only enhance profitability but also support environmental goals like carbon emission reduction. Drawing on these principles, this research explores how a coordinated, renewable-energy-based irrigation system can promote sustainability in agriculture by optimizing both water use and energy efficiency [29].
Keeping in view the limited research works available on the adaptation of renewable energy resources for fulfilling the crop water requirement, this research work focused on presenting a solution to overcome the surface water scarcity in Lethbridge County, Alberta, Canada. Initially, the FAO-designed CROPWAT software has been used to estimate the crop water requirement of two major crops (wheat and barley) in the region. Using this crop water requirement, the energy requirement has been calculated through empirical calculations for groundwater pumping. Next, a renewable resources-based hybrid energy system was designed and analyzed in a technical and economic sense using Homer Pro software to fulfill the energy requirement for the irrigation of crops through groundwater pumping. Results revealed that hybrid systems are efficient and viable solutions in fulfilling the energy requirements for irrigation by keeping the environment clean.
2. System Design and Working Methodology
The area selected for the proposed study is an agricultural farm in Lethbridge County, Alberta, Canada, located at coordinates 49.696° N, 112.845° W, with an approximate elevation of 910 m above sea level. The County spans an area of approximately 127.19 square kilometers, and slight variations in elevation exist due to topographical differences. The map of Alberta specifying the county location can be seen in Figure 1. The main objective in designing the energy system is to understand the load requirement of any system. The primary task of the proposed research work is to design a hybrid renewable energy system-based groundwater-pumped irrigation mechanism for the specific area in Lethbridge County, Alberta. The block diagram of the proposed system can be seen in Figure 2. As the energy requirement for irrigation is entirely based on the crop water requirement, the crop water requirement has to be identified for the major crops (wheat and barley) in the area and converted into the required energy based on the available area to be irrigated and the water table depth in the specific area to estimate the power required for the pumps for water extraction.
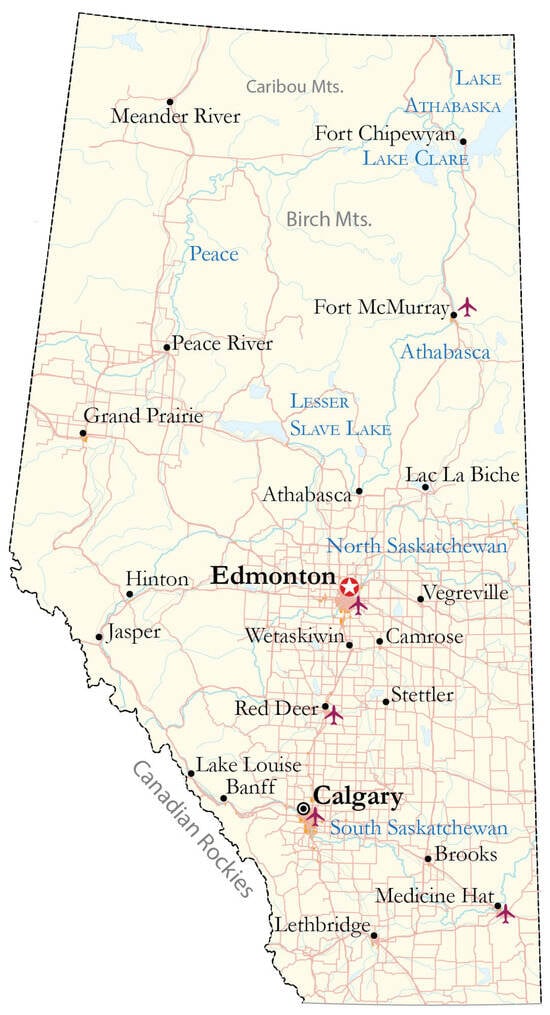
Figure 1.
Alberta map overview highlighting Lethbridge location [30].
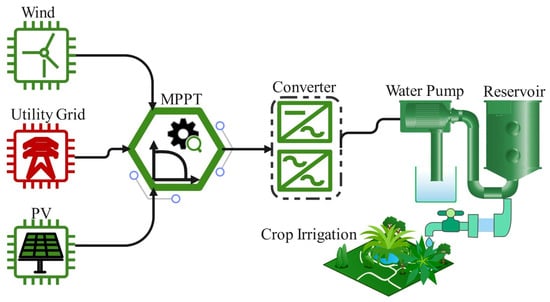
Figure 2.
Block diagram of the proposed system.
Figure 3 shows that, being a semi-arid area, Lethbridge County has had the driest to below normal precipitation accumulation in the last ten years on average. This fact has increased the requirement of reliance on groundwater pumping to preserve the surface water. Keeping in view the renewable resources’ abundance in the area, high solar and wind potential can be analyzed from the Alberta map as shown in Figure 4.
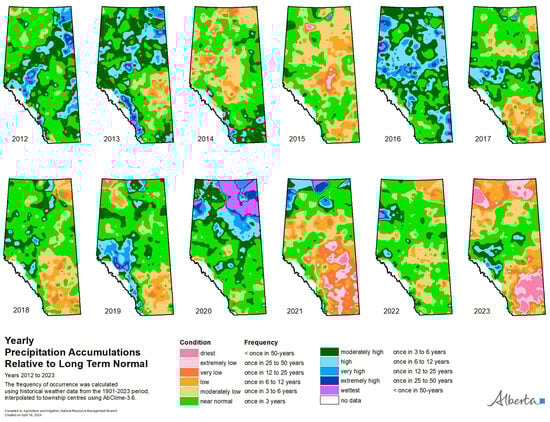
Figure 3.
Alberta map overview highlighting variation in yearly precipitation accumulation [31].
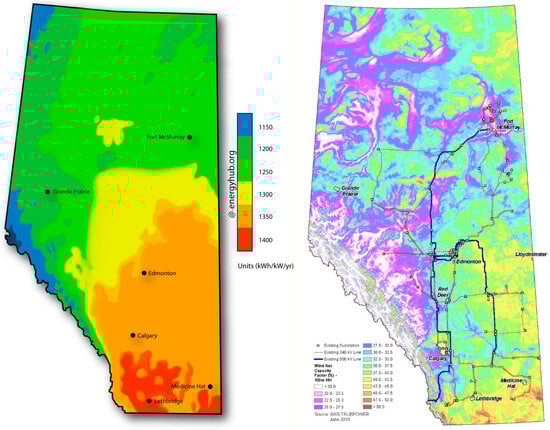
Figure 4.
Alberta map overview highlighting Lethbridge location [32].
The outcome of the work reported here was to find the most economical solution for fulfilling the energy demand of groundwater pumping for the irrigation of crops, as calculated by the crop water requirement. For this purpose, net present cost has been considered as the objective function to efficiently optimize the designed renewable resources-based energy system. Figure 5 explains the working methodology in the flowchart adopted to achieve the goal of the study.
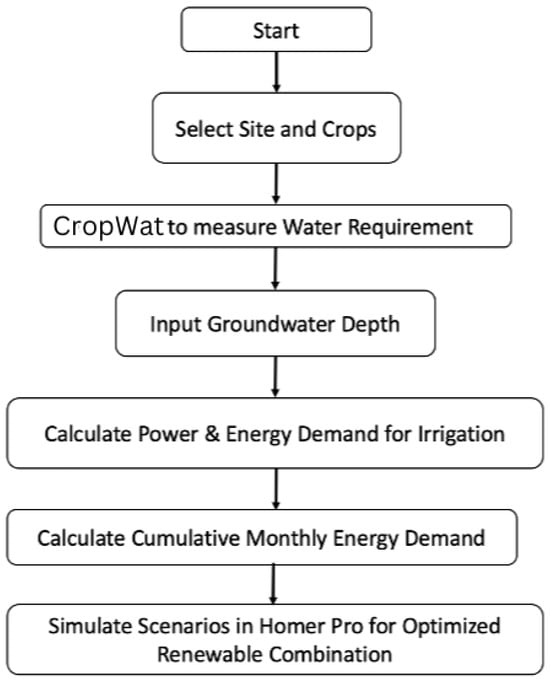
Figure 5.
Working flowchart for the study.
As can be seen in Figure 4, Lethbridge ranked among the areas having the highest solar irradiance as well as wind speed potential in the region.
2.1. Crop Water Requirement Calculation Using CROPWAT
The United Nations Food and Agriculture Organization designed the CROPWAT software to calculate the crop water requirement. It works on the principle of calculating ETO using the Penman–Monteith model [33] with the help of several parameters, such as the type of crops, soil data, rain, and temperature data, etc. Based on these several factors as mentioned, crop water requirement from planting till harvest time can be calculated for specific crops by using Equation (1).
where and represent reference evapotranspiration and crop coefficient, respectively. can be calculated using the Penman–Monteith equation as shown in Equation (2).
In the above equation, and G represent net radiation and soil heat flux density in MJ/m2/day, T, represent daily air temperature and vapor pressure deficit of air in temperature context (kPa), respectively. Here, es represents saturation vapor pressure at a given temperature and represents actual vapor pressure. Whereas, Δ and γ represent the slope of the saturation vapor pressure curve with respect to temperature and the psychrometric constant, respectively.
Crop water requirement refers to the water required to maintain the moisture in the soil lost due to evapotranspiration. However, while calculating the crop water requirement, all water sources need to be considered, such as rainfall or any deep seepage [30]. Keeping in view the different sources, the net irrigation water requirement can be calculated using Equation (3).
In the above equation, represents effective rainfall. As stated above, wheat (spring and winter wheat) and Barley crops have been selected for the proposed study in Lethbridge County, Alberta, Canada. The area selected for crop water requirement calculations is 1000 acres (405 hectares). The Lethbridge Airport weather station has been used to acquire the required weather data. Considered data from the weather station can be seen in Table 1.

Table 1.
Climatic Data from Lethbridge Airport Weather Station for the Study [34].
It can be seen in Table 1 that the temperature stays between −10.5 °C and 26.1 °C. Furthermore, rainfall is another important factor in calculating the crop water requirement. Monthly rainfall data can be seen in Table 2.
Table 2.
Rainfall Data for the Proposed Study.
The total rainfall in the area is calculated as 238.7 mm, which is low, indicating a semi-arid area. Irrigation as a secondary source of water has been utilized historically. Following the closure of issuing water licenses for the Oldman River due to limited supply reservoirs since 2006, groundwater pumping has been recommended. Crop water requirements concerning wheat and barley have been made using CROPWAT, as shown in Table 3 and Table 4. This data has been acquired by incorporating the climatic as well as rain data and other parameters, such as soil data of the study area, in the CROPWAT software.
Table 3.
Crop Water Requirement for Wheat.
Table 4.
Crop Water Requirement for Barley.
The water requirement for both crops has been found to be 268.3 mm/decade and 190.5 mm/decade, respectively. It can be seen from Table 3 and Table 4 that the crop water requirement for both crops is significantly higher than the available rainwater. The data obtained from the software depict that crops having longer periods of growth need a high amount of irrigation, and the elevated water requirement during the summer months shows the need for crops due to dry weather and less precipitation. Furthermore, water evapotranspiration and a decrease in soil moisture are some of the major reasons behind the increased water requirement during these dry months. A better understanding of irrigation schedules and proper planning ensures efficient irrigation management by controlling the timing and amount of irrigation. For this purpose, the total irrigation requirement and irrigation schedule for both crops can be seen in Table 5, Table 6, Table 7 and Table 8.
Table 5.
Total Irrigation Requirement for Wheat.
Table 6.
Irrigation Schedule for Wheat.
Table 7.
Total Irrigation Requirement for Barley.
Table 8.
Irrigation Schedule for Barley.
The above table shows the detailed analysis with respect to the total gross and total net irrigation requirement of crops before and after the consideration of effective rainfall, i.e., 237.6 mm and 171.7 mm for the wheat and barley, respectively. The irrigation supply scheme for the annual crop season comprising these two crops can be seen in Table 9.
Table 9.
Irrigation Supply Scheme for Complete Season.
Irrigation water requirements for both crops were observed for the entire season. The finding reveals that crops having crop cycles across the year need high irrigation capacity. Furthermore, crops having a hot summer season in their cycle require more irrigation to fulfill their water demand as well as maintain the moisture of the soil.
2.2. Energy Calculations to Meet Crop Water Requirement
Based on the calculations of crop water requirements for the selected crops using CROPWAT software in the above section, energy calculations have been performed to design the renewable energy hybrid power system for groundwater pumping and fulfilling the crop requirements. Keeping in view the irrigation requirement as well as the depth of the water table at the site, waterpower has been calculated using Equation (4).
Here, represents waterpower in hp. Groundwater depth has been considered 31 m to calculate waterpower on site, i.e., 168 hp for a selected land area of 1000 acres. From this waterpower and pump efficiency (60%), we can calculate the brake horsepower using Equation (5).
Here, represents pump efficiency and represents brake horsepower. Using this formulation, brake horsepower (280 hp) has been calculated as necessary to evaluate the motor input power to extract groundwater. Using Equation (6), motor input power has been calculated as follows;
In this equation, represents motor efficiency, and represents motor input power, respectively. By considering the motor efficiency of 65%, the motor input power has been calculated, i.e., 431 hp. It has been evaluated from the above calculations that at least 325 kW input power is required by the motors to extract the same capacity of groundwater as required by the crops on 1000 acres for a complete season. It is to be kept in mind that, keeping in view the limitations of motor power capacity, land area can be further subdivided into different sections to efficiently irrigate the land as required.
3. Renewable Energy-Based Hybrid System Design Using Homer Pro
Homer Pro software, developed by the USA’s National Renewable Energy Laboratory (NREL) has been utilized to design and analyze the techno-economic analysis of the renewable energy-based hybrid power system at the site to provide the required energy for the extraction of groundwater. Levelized cost of electricity and net present value are two of the major parameters among many to assess the most optimized and feasible hybrid scenario using Homer Pro [35]. Based on the calculations in the above section and approximations keeping in view the fluctuating nature of the renewables, a modeled load along with different capacity components has been incorporated in the software, and it provides the best-optimized design based on various parameters such as LCOE, NPV, OPEX, CAPEX, and GHG emissions, etc. The main objective of this software is to evaluate the most efficient and optimized system design by combining the conventional and renewable energy resources available on-site [36].
The potential site for the proposed hybrid energy system is a farm in Lethbridge County, Alberta, Canada, as can be seen in Figure 6.

Figure 6.
Site selected for the proposed Study.
The proposed grid-tied hybrid system comprises a PV system having a capacity of 250 kW and 100 kW wind turbine systems, respectively. Similarly, as calculations performed in the above section, an AC load having a capacity of 325 kW was considered for the proposed system. It is to be kept in mind that a battery backup system is not recommended for the designed system, as electric motors (AC load) to be used for pumping would require high initial torque or high in-rush current, which would significantly degrade the BESS lifetime and prove to be highly uneconomical.
The average monthly load profile can be seen in Figure 7. Furthermore, the working flowchart of the Homer Pro software can be seen in Figure 8.
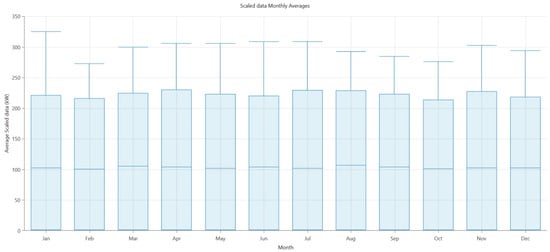
Figure 7.
Average monthly load profile.
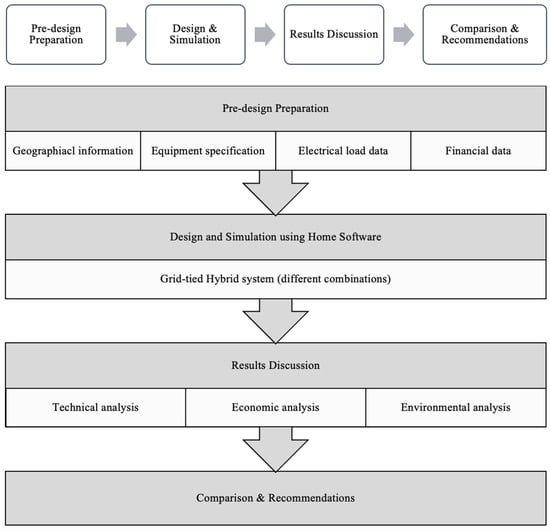
Figure 8.
Homer Pro simulation flowchart.
3.1. Wind Speed Data
Lethbridge County, Alberta, Canada, faces strong winds throughout the year. The county’s wind speed data was collected from the NASA Prediction of Worldwide Energy Sources [37]. The average wind speed in the area was found to be 6.63 m/s at a height of 32 m wind turbine hub and can be seen in Figure 9.
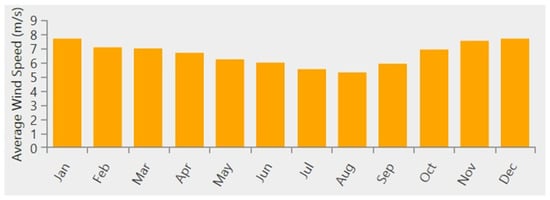
Figure 9.
Monthly average wind speed in Lethbridge, Alberta.
3.2. Solar GHI Data
Similar to wind speed data, typical locations in Alberta have more than 2500 h of sun yearly, exceeding most other regions in Canada [38]. The annual average radiation was estimated to be 3.65 kWh/m2/day. The clearness index has been found to be highest in July and lowest in December and can be analyzed in Figure 10.
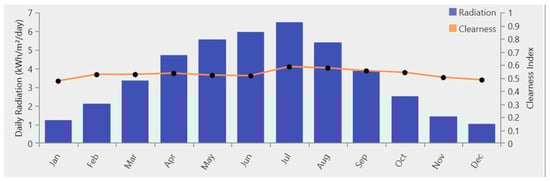
Figure 10.
Monthly average solar irradiance at the selected site for the proposed study.
3.3. Mathematical Modeling
3.3.1. Solar Photovoltaic System
Using the Osterwald method for calculating the PV output power is the most authentic method, and Equation (7) for this purpose can be seen below [39]:
Here, Ppv, N, and Am, represent PV’s generated power, number of solar PV modules, and area of the module, respectively. Similarly, is the generator’s efficiency, and Gt is the global radiation on the tilted plane (W/m2).
3.3.2. Wind Turbine System
Wind turbine output power can be calculated using Equation (8) as follows;
In this equation, P represents power generated from WT in kW, v denotes the wind speed (m/s), whereas ρ represents the density of the air (kg/m3), and A is the cross-sectional area of the wind in m2.
3.3.3. Performance Factors for Techno-Economic Analysis
Various parameters such as LCOE, NPV, CAPEX, OPEX, and GHG emissions play a fundamental role in techno-economic analysis to find out the most optimized and feasible hybrid renewable systems.
Levelized Cost of Energy
The LCOE is the average cost per kilowatt-hour of electrical energy produced by a specific system. LCOE is determined by the division of total annualized cost by the sum of LprimeAC and LprimeDC from Equation (9) in HOMER [37].
In this equation, LprimeAC represents alternating current primary load, whereas LprimeDC represents the direct current main load.
Net Present Value
The current total of all the expenditures incurred by the hybrid system during its specified useful life, minus the salvage value over that useful life, is its net present value. Costs to be considered in NPV are capital, replacement, operating, and maintenance costs, as shown in Equation (10).
In the above equation, Ccapital denotes the initial investment, Creplace is the cost of replacement, Cmaintenance is the cost of upkeep, and Csalvage denotes the cost of salvage.
Total Annualized Cost
The total value occurs throughout the project’s expected timeframe. This cost also provides the net present value that was connected to the component cash flow order. Using HOMER Pro software, the capital recovery factor is multiplied after the entire annualized cost has been determined using NPC.
3.4. Grid-Tied PV-WT Hybrid Power System
As discussed, grid-tied PV-WT systems have been considered while proposing the optimal solution for the site. In this configuration, the power generation system’s optimization was carried out on a combination of both PV and Wind Turbine systems to provide renewable and environmentally friendly energy, as shown in Figure 11.
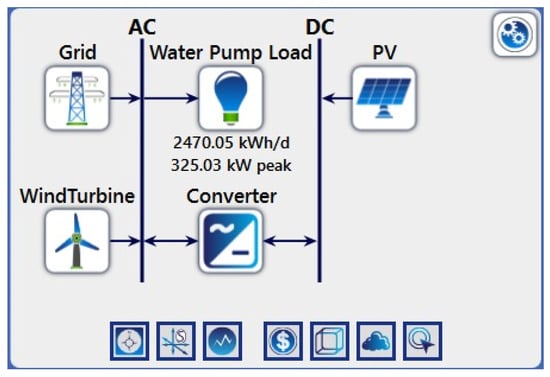
Figure 11.
Schematic overview of grid-connected hybrid system.
4. Rationale for Selecting CropWat and HOMER Pro
The reason for establishing CROPWAT relates to the research goal, which is to calculate exact amounts of irrigation water for various crops in various climates. Through this link, water and energy features are integrated, since crop water demand can be converted into the irrigation amounts needed daily to cultivate the crops, which directs the calculations for the use of energy [40].
HOMER Pro models time-series simulations, load management, economies, and technologies in order to simulate both community-connected and standalone situations. It gives a clear estimate of LCOE, NPC, emissions, battery cycle use, and other important factors integral to making decisions [36].
4.1. Comparison with Aqua Crop
Table 10 shows the comparison of CropWat with other Crop modelling software. Even though Aqua Crop from FAO allows for more advanced modeling of crops and water supply, it does not put as much emphasis on energy. While Aqua Crop can be best for output predictions, when planning and scheduling irrigation, CROPWAT is proven to be more robust [40].
Table 10.
CropWat vs. Aqua Crop.
4.2. HOMER PRO Comparison with Alternatives
While PVsyst, RETScreen, SAM, and Hybrid2 were scrutinized, they did not meet the needs of this study for using several energy systems. The comparison of different modelling tools can be seen in Table 11.
Table 11.
HOMER Pro vs. Other Modeling Tools.
5. Results and Discussion
5.1. Techno-Economic Analysis and Comparison of System Configurations
Different renewable-based hybrid system configurations have been considered while analyzing the performance of the proposed design. Moreover, the outcomes of these different combinations have been compared along with the power generation through a utility grid-only system to evaluate the techno-economic feasibility and environmental soundness based on various important factors. The techno-economic analysis and GHG emissions considering all system configurations are presented in Table 12.
Table 12.
Technoeconomic Comparison of Various Hybrid Combinations of the Proposed System.
As can be seen in the above table, shifting to renewable resources from conventional pollutant resources has become the need of the hour from technical, economic, and environmental perspectives. It can be analyzed from Table 10 that the LCOE of hybrid systems is less than the rates/kWh provided by the conventional Utility Grid. The most optimized and efficient hybrid combination of conventional and renewable resources has been observed as the Grid-tied PV-WT system, as it has a comparatively lower LCOE than the WT-Grid, PV-Grid, and Grid-only systems, i.e., 0.128 CAD/kWh in comparison to 0.204 CAD/kWh, 0.231 CAD/kWh, and 0.320 CAD/kWh, respectively. This PV-WT-Grid configuration is most optimized because due to multiple renewable options, renewable generation is available throughout 24-h. This higher renewable penetration in the system significantly reduced the unit costs and fuel consumption directly associated with the reduction in GHG emissions. Furthermore, renewable penetration in the hybrid combination of PV-WT is higher than in the remaining scenarios as well. Variability in the CAPEX and OPEX costs has been observed between different combinations of hybrid systems. The CAPEX includes capital and replacement costs, while the OPEX includes maintenance and fuel costs.
In Table 10, the comparison between capital costs shows that the most optimized configuration (PV-WT-Grid) has the highest capital cost. This is due to the inclusion of the cost of equipment such as solar PV panels, wind turbines, and converters at the beginning of the project lifecycle. The capital cost in other configurations is comparatively less; they are using one renewable source or none at the least.
The above comparative study highlights the importance of the utility grid configuration from a CAPEX perspective; however, the high OPEX costs (mainly comprising time-to-time operational and maintenance costs due to several factors such as environmental impact, wear and tear, etc.) exponentially reduce its importance in the sense of energy generation in comparison to renewables for compensation of energy demand. Moreover, renewable systems have longer operational lives, typically with a payback period that makes the overall renewable-source-based systems more economical. The payback period of the optimized grid-tied PV-WT hybrid system is almost 2.3 years, compared to the grid-tied WT system’s 2.17 years, owing to the higher capital costs.
From the above simulation results, it can be concluded that hybrid renewable energy systems are more efficient, cost-effective, and environmentally friendly in compensating for the load demand required by the groundwater pumping system for efficient irrigation of the crops throughout the season. The environmental impact is reduced in the proposed hybrid configuration because the renewable fraction has improved.
5.2. Sensitivity Analysis
Various system variables have a distinct impact on the system’s performance. Through sensitivity analysis, the study evaluates how the proposed system performs under different conditions, particularly focusing on carbon emission penalties and grid unit price variations. As illustrated in Table 13. variation in grid unit prices has a significant effect on the performance of the overall system. Despite the significant annual increase of 5.27 cents/kWh in utility grid prices [41], integrating renewable energy in hybrid systems has lowered overall unit costs. This shift towards renewable generation has not only reduced greenhouse gas emissions but also mitigated the impact of higher costs associated with imported grid power. The presented sensitivity analysis proves the importance and authenticates the feasibility of the proposed renewable-based hybrid configuration from the future perspective as well.
Table 13.
Simulation Results of System Configurations with Current Electricity Unit Prices and Future Forecast Prices.
Similarly, a technoeconomic comparison has been carried out by using the no carbon penalties and a 50 CAD/ton carbon penalty set by the Canadian Government in 2022, with a 15 CAD/ton increase annually from 2023 to 2030 [42] to achieve the net zero emission goals according to the Paris agreement. As can be seen in Table 14. LCOE per unit has been increased from 0.128 CAD/kWh in the case of no penalties on carbon emissions to 0.152 CAD/kWh with carbon emission penalties. Similarly, operating costs, as well as maintenance costs, have been significantly increased due to the imposed penalties on carbon emissions, which directly impact the ROI and IRR ratios of the overall project.
Table 14.
Simulation results of system configurations with current zero penalties on carbon emissions and a 50 CAD/ton penalty with 15 CAD increase for the coming years.
5.3. Comparative Studies
In the proposed research study, the real-time irrigation energy demand of an agricultural farm in Lethbridge County, Alberta, Canada, has been analyzed to design and optimize a hybrid renewable energy system for sustainable and cost-effective water pumping. A comparison of the levelized cost of electricity (LCOE) for the case study with global averages from different regions is presented in Table 15. The comparative study shows the significance of the major reliance on the renewable sources in achieving required energy with low COE and GHG emissions. It can be seen that due to efficient selection of renewable input sources, the LCOE of the presented study is the lowest among all. Even though cost variation can be due to the equipment’s pricing in different regions, the right choice of the input sources affects it significantly. Furthermore, most of the studies previously conducted have utilized diesel generators as secondary backup sources before the grid, which increases the overall GHG emissions.
Table 15.
Comparative Study with the Previous Studies.
6. Conclusions
The proposed research study presented a techno-economically viable solution to fulfill the irrigation requirements of crops throughout the season. An agricultural farm in Lethbridge County, Alberta, Canada, has been considered as the case study. Initially, the crop water requirement was calculated using the CROPWAT software. Results revealed that 410 mm/acre of water is required for both crops throughout the season. Then, the calculated irrigation water requirement has been converted into the energy required to pump groundwater for the said purpose. Later on, a hybrid grid-tied renewable energy system was designed using Homer Pro to assess the feasibility of relying on renewables to fulfill the energy demand.
The results revealed that the integration of wind energy with solar resources can very well reduce the dependency on the utility grid electricity. The proposed study demonstrated that shifting from conventional resources to renewable energy technologies is necessary to gain reliable, clean electricity for residential, commercial, agricultural, or industrial loads. The proposed design of the hybrid system resulted in approximately 52% cost reduction of the overall system. Similarly, the renewable energy penetration of the hybrid system is almost 65.4% highlighting the environmentally friendly nature of the proposed design while having a quite low LCOE of 0.128 CAD/kWh. The outcomes revealed that an optimized and efficient energy management system and irrigation scheduling are required to fully utilize the benefits of renewables throughout the day.
Keeping in view the application of renewables in the agriculture sector, a multidimensional approach with higher agricultural loads (farm machinery), as well as other renewable resources such as bioenergy, must be explored to capitalize on the higher benefits from this agro-energy integration. Some of the key findings of the research work are as follows;
- Renewable energy sources, such as wind and solar, can effectively meet energy demands for irrigation, reducing reliance on traditional grid electricity.
- A hybrid renewable energy system for agricultural irrigation is both cost-effective and efficient, with significant cost reductions and lower environmental impact.
- High renewable energy penetration reduces carbon footprints, demonstrating the environmental friendliness of renewable energy-based systems.
- Adoption of renewable energy for groundwater pumping ensures a reliable water supply for crops, contributing to food security in drought-prone regions.
Government incentives and policies can play a crucial role in influencing the agricultural sector’s adoption of renewable energy technologies. Some of the key effects are mentioned below:
- Incentives like subsidies, tax credits, and grants lower the upfront costs of renewable energy systems (e.g., solar panels, wind turbines, or biomass). This makes renewable energy more accessible and affordable for farmers, who may otherwise find the initial investment prohibitive.
- Interest-free loans or low-interest financing options can further reduce the financial burden, making renewable energy investments more feasible for agricultural operations.
- Policies that reward sustainable farming practices or renewable energy adoption, such as carbon credits or emissions trading schemes, incentivize farmers to invest in technologies that reduce their environmental impact.
- Government-funded research programs and extension services can educate farmers about the benefits of renewable energy, available incentives, and the technical aspects of implementing renewable solutions. This helps increase awareness and adoption.
- Governments can create favorable regulatory frameworks that support renewable energy deployment, such as easing grid access for farm-based energy producers or allowing for net metering where excess energy can be sold back to the grid.
Author Contributions
M.A.A. planned and conducted the main investigation, drafted the manuscript, and prepared the tables and figures. P.H., J.B., D.J. and L.S. supervised and reviewed this article. J.B. and D.J. assisted in funding acquisition. All authors have read and agreed to the published version of the manuscript.
Funding
This research work was funded by MITACS, Old Sun Community College and the partner organization Siksika SRDL Group. The reference number for the grants is IT28955.
Data Availability Statement
The data in the paper belongs to the funding organization and authors and is not for public use. They can be made available upon request.
Conflicts of Interest
The authors declare no conflict of interest. The authors declare that this study received funding from MITACS, Old Sun Community College and the partner organization Siksika SRDL Group. The funder was not involved in the study design, collection, analysis, interpretation of data, the writing of this article or the decision to submit it for publication.
References
- Intergovernmental Panel on Climate Change (IPCC) (Ed.) Summary for Policymakers. In Climate Change 2013—The Physical Science Basis: Working Group I Contribution to the Fifth Assessment Report of the Intergovernmental Panel on Climate Change; Cambridge University Press: Cambridge, UK, 2014; pp. 1–30. ISBN 978-1-107-05799-9. [Google Scholar]
- Shah, S.A.; Jehanzaib, M.; Lee, J.-H.; Kim, T.-W. Exploring the Factors Affecting Streamflow Conditions in the Han River Basin from a Regional Perspective. KSCE J. Civ. Eng. 2021, 25, 4931–4941. [Google Scholar] [CrossRef]
- Abdo, K.S.; Fiseha, B.M.; Rientjes, T.H.M.; Gieske, A.S.M.; Haile, A.T. Assessment of Climate Change Impacts on the Hydrology of Gilgel Abay Catchment in Lake Tana Basin, Ethiopia. Hydrol. Process. 2009, 23, 3661–3669. [Google Scholar] [CrossRef]
- Panhwar, M.Y.; Panhwar, S.; Keerio, H.A.; Khokhar, N.H.; Shah, S.A.; Pathan, N. Water Quality Analysis of Old and New Phuleli Canal for Irrigation Purpose in the Vicinity of Hyderabad, Pakistan. Water Pract. Technol. 2022, 17, 529–536. [Google Scholar] [CrossRef]
- Taye, M.T.; Haile, A.T.; Fekadu, A.G.; Nakawuka, P. Effect of Irrigation Water Withdrawal on the Hydrology of the Lake Tana Sub-Basin. J. Hydrol. 2021, 38, 100961. [Google Scholar] [CrossRef]
- Agriculture and Agri-Food Canada. Overview of the Canadian Agri-Food System. Available online: https://agriculture.canada.ca/en/sector/canadian-food-system/overview-agri-food-system (accessed on 24 May 2025).
- Statistics Canada. Symmetric Input-Output Tables. Available online: https://www150.statcan.gc.ca/n1/en/catalogue/15-207-X (accessed on 24 May 2025).
- Windfeld, E.; Lhermie, G. The Value of Canadian Agriculture: Direct, Indirect, and Induced Economic Impacts. Front. Sustain. Food Syst. 2022, 6, 940968. [Google Scholar] [CrossRef]
- Government of Alberta. Gross Domestic Product. Available online: https://economicdashboard.alberta.ca/topics/gdp/ (accessed on 24 May 2025).
- Alberta Government. Agriculture and Irrigation Annual Report—Open Government. Available online: https://open.alberta.ca/publications/2817-4224#detailed (accessed on 24 May 2025).
- Government of Alberta Wheat Production. Available online: https://economicdashboard.alberta.ca/dashboard/wheat-production (accessed on 24 May 2025).
- Bennett, D.; Harms, T.E. Crop Yield and Water Requirement Relationships for Major Irrigated Crops in Southern Alberta. Can. Water Resour. J. Rev. Can. Ressour. Hydr. 2013, 36, 159–170. [Google Scholar] [CrossRef]
- Djaman, K.; O’Neill, M.; Owen, C.K.; Smeal, D.; Koudahe, K.; West, M.; Allen, S.; Lombard, K.; Irmak, S. Crop Evapotranspiration, Irrigation Water Requirement and Water Productivity of Maize from Meteorological Data under Semiarid Climate. Water 2018, 10, 405. [Google Scholar] [CrossRef]
- Gibb, A. In Pursuit of a New ‘Enterprise’ and ‘Entrepreneurship’ Paradigm for Learning: Creative Destruction, New Values, New Ways of Doing Things and New Combinations of Knowledge. Int. J. Manag. Rev. 2002, 4, 233–269. [Google Scholar] [CrossRef]
- Hsiao, T.; Steduto, P.; Fereres, E. A Systematic and Quantitative Approach to Improve Water Use Efficiency in Agriculture. Irrig. Sci. 2007, 25, 209–231. [Google Scholar] [CrossRef]
- Michelsen, C.C.; Madlener, R. Switching from Fossil Fuel to Renewables in Residential Heating Systems: An Empirical Study of Homeowners’ Decisions in Germany. Energy Policy 2016, 89, 95–105. [Google Scholar] [CrossRef]
- Jamil, U.; Pearce, J.M. Energy Policy for Agrivoltaics in Alberta Canada. Energies 2022, 16, 53. [Google Scholar] [CrossRef]
- Martins Godinho, C.; Noble, B.; Poelzer, G.; Hanna, K. Impact Assessment for Renewable Energy Development: Analysis of Impacts and Mitigation Practices for Wind Energy in Western Canada. Impact Assess. Proj. Apprais. 2023, 41, 59–70. [Google Scholar] [CrossRef]
- Khan, M.J.; Malik, A.; Rahman, M.; Afzaal, M.; Mulk, S. Assessment of Crop Water Requirement for Various Crops in Peshawar, Pakistan Using CROPWAT Model. Irrig. Drain. Syst. 2021, 10, 287. [Google Scholar]
- Khan, Z.A.; Imran, M.; Altamimi, A.; Diemuodeke, O.E.; Abdelatif, A.O. Assessment of Wind and Solar Hybrid Energy for Agricultural Applications in Sudan. Energies 2022, 15, 5. [Google Scholar] [CrossRef]
- Alghassab, M.; Khan, Z.A.; Altamimi, A.; Imran, M.; Alruwaili, F.F. Prospects of Hybrid Energy in Saudi Arabia, Exploring Irrigation Application in Shaqra. Sustainability 2022, 14, 5397. [Google Scholar] [CrossRef]
- Ahmadi, M.; Souri, M.K. Growth and Mineral Content of Coriander (Coriandrum sativum L.) Plants under Mild Salinity with Different Salts. Acta Physiol. Plant. 2018, 40, 194. [Google Scholar] [CrossRef]
- Ebrahimi, M.; Souri, M.K.; Mousavi, A.; Sahebani, N. Biochar and Vermicompost Improve Growth and Physiological Traits of Eggplant (Solanum melongena L.) under Deficit Irrigation. Chem. Biol. Technol. Agric. 2021, 8, 19. [Google Scholar] [CrossRef]
- Singh, O.; Kasana, A.; Bhardwaj, P. Understanding Energy and Groundwater Irrigation Nexus for Sustainability over a Highly Irrigated Ecosystem of North Western India. Appl. Water Sci. 2022, 12, 44. [Google Scholar] [CrossRef]
- Solangi, G.S.; Shah, S.A.; Alharbi, R.S.; Panhwar, S.; Keerio, H.A.; Kim, T.-W.; Memon, J.A.; Bughio, A.D. Investigation of Irrigation Water Requirements for Major Crops Using CROPWAT Model Based on Climate Data. Water 2022, 14, 2578. [Google Scholar] [CrossRef]
- Jangre, N.; Sinha, J.; Raj, J. Kamalkant Estimation of Crop Water Requirement of Kharif Maize Crop Using CROPWAT 8.0 Model in Bilaspur District. Int. J. Environ. Clim. Change 2022, 12, 597–606. [Google Scholar] [CrossRef]
- He, L.; Rosa, L. Solutions to Agricultural Green Water Scarcity under Climate Change. PNAS Nexus 2023, 2, pgad117. [Google Scholar] [CrossRef] [PubMed]
- Razmjoo, A.; Ghazanfari, A.; Østergaard, P.A.; Jahangiri, M.; Sumper, A.; Ahmadzadeh, S.; Eslamipoor, R. Moving Toward the Expansion of Energy Storage Systems in Renewable Energy Systems—A Techno-Institutional Investigation with Artificial Intelligence Consideration. Sustainability 2024, 16, 9926. [Google Scholar] [CrossRef]
- Eslamipoor, R. Contractual Mechanisms for Coordinating a Sustainable Supply Chain With Carbon Emission Reduction. Bus. Strategy Environ. 2025. [Google Scholar] [CrossRef]
- GISGeography. Map of Alberta—Cities and Roads. 2021. Available online: https://gisgeography.com/alberta-map/ (accessed on 24 May 2025).
- Saddle Hills 10 Years Precipitation Accumulation, Saddle Hills County. Available online: https://www.saddlehills.ab.ca/news/posts/moisture-update-april-17-2024/ (accessed on 24 May 2025).
- Wilson, E. Alberta Is Canada’s Primary Destination for Wind and Solar Energy Investment; Canadian Renewable Energy Association: Ottawa, ON, Canda, 2020. [Google Scholar]
- FAO. Chapter 4—Determination of ETo. Available online: https://www.fao.org/4/X0490E/x0490e08.htm (accessed on 24 May 2025).
- Khan, Z.A.; Imran, M.; Umer, J.; Ahmed, S.; Diemuodeke, O.E.; Abdelatif, A.O. Assessing Crop Water Requirements and a Case for Renewable-Energy-Powered Pumping System for Wheat, Cotton, and Sorghum Crops in Sudan. Energies 2021, 14, 8133. [Google Scholar] [CrossRef]
- Government of Canada. Historical Climate Data—Climate-Environment and Climate Change Canada. Available online: https://climate.weather.gc.ca/index_e.html (accessed on 24 May 2025).
- Homer Energy. How HOMER Calculates Wind Turbine Power Output. Available online: https://homerenergy.com/products/pro/docs/3.15/how_homer_calculates_wind_turbine_power_output.html (accessed on 24 May 2025).
- Ur Rashid, M.; Ullah, I.; Mehran, M.; Baharom, M.N.R.; Khan, F. Techno-Economic Analysis of Grid-Connected Hybrid Renewable Energy System for Remote Areas Electrification Using Homer Pro. J. Electr. Eng. Technol. 2022, 17, 981–997. [Google Scholar] [CrossRef]
- NASA POWER. Prediction of Worldwide Energy Resources. Available online: https://power.larc.nasa.gov/ (accessed on 24 May 2025).
- Osterwald, C.R. Translation of Device Performance Measurements to Reference Conditions. Sol. Cells 1986, 18, 269–279. [Google Scholar] [CrossRef]
- FAO. CropWat|Land & Water|Food and Agriculture Organization of the United Nations. Available online: https://www.fao.org/land-water/databases-and-software/cropwat/en/ (accessed on 24 May 2025).
- Alleckna, M. Here’s What Alberta Electricity Rates Look Like Right Now. 2019. Available online: https://energyrates.ca/here-is-what-alberta-electricity-rates-look-like-right-now/ (accessed on 24 May 2025).
- Government of Canada. The Federal Carbon Pollution Pricing Benchmark. Available online: https://www.canada.ca/en/environment-climate-change/services/climate-change/pricing-pollution-how-it-will-work/carbon-pollution-pricing-federal-benchmark-information.html (accessed on 24 May 2025).
Disclaimer/Publisher’s Note: The statements, opinions and data contained in all publications are solely those of the individual author(s) and contributor(s) and not of MDPI and/or the editor(s). MDPI and/or the editor(s) disclaim responsibility for any injury to people or property resulting from any ideas, methods, instructions or products referred to in the content. |
© 2025 by the authors. Licensee MDPI, Basel, Switzerland. This article is an open access article distributed under the terms and conditions of the Creative Commons Attribution (CC BY) license (https://creativecommons.org/licenses/by/4.0/).