Article

Unveiling the Hydrogen Diffusion During Degradation of Silicon Solar Cells

1
Department of Materials Science and Engineering, Korea University, Seoul 02841, Republic of Korea
2
Graduate School of Energy and Environment, Korea University, Seoul 02841, Republic of Korea
*
Author to whom correspondence should be addressed.
Energies 2025, 18(12), 3090; https://doi.org/10.3390/en18123090
Submission received: 12 May 2025 / Revised: 30 May 2025 / Accepted: 5 June 2025 / Published: 12 June 2025
(This article belongs to the Special Issue Solar Energy and Resource Utilization—2nd Edition)

Abstract

We investigated monocrystalline passivated emitter rear contact cells for light- and elevated-temperature-induced degradation. Among the cell performance factors, a short current density results in a significant decrease in the short term. The quantum efficiency is also affected by carrier recombination-active defects, especially in the case of the reference cell, which has a decreased quantum efficiency across the wavelength, unlike the commercial cell. The front side of the cell has a diffuse hydrogen distribution, and it is related to LeTID. We observe how the hydrogen changes during each process and the changes in the profile during the degradation. The hydrogen appears to redistribute within the silicon wafer and saturate at a certain equilibrium state. The hydrogen distribution is correlated with the changes in the lifetime and, finally, short current density. Regeneration occurs depending on the hydrogen concentration within the emitter, and the closer the concentration is to saturation, the less degradation occurs.

1. Introduction

Photovoltaic (PV) energy is the fastest-growing renewable energy, accounting for more than 80% of the newly increased renewable energy production as of 2024 [1]. Among them, crystalline silicon-based solar cells account for 97% of the total PV energy portion, with high conversion efficiency and stability [2]. Over the past 30 years, the efficiency of crystalline silicon solar cells has increased by 3%p [3], but the efficiency decreases due to degradation during outdoor operation of solar cells by up to 3%p (~12.7%rel) [4]. The efficiency of solar cells decreases during operation due to many degradation phenomena, such as light-induced degradation (LID), light- and elevated-temperature-induced degradation (LeTID), and potential-induced degradation (PID) [5,6]. LeTID, which has recently attracted attention, occurs in almost all types of wafers [7,8,9,10], and the cause is believed to be hydrogen diffused during the process [7,11,12,13,14,15,16,17,18,19]. However, as the wafer thickness has decreased [20] and the wafer characteristics improved [21], the degradation was significantly reduced, and in particular, it has been almost eliminated through the firing process [22,23,24,25,26,27,28,29]. Recently, it has also been reported that LeTID and surface degradation are almost non-existent below a certain hydrogen amount [30]. However, as LeTID was found in the LID experiment [31], it is important to clearly understand the LeTID mechanism. It was mainly studied in a p-type silicon PERC cell, and degradation occurred in all factors of Voc, Jsc, and FF [11,32,33,34,35]. The decrease in FF and Jsc is notable [24], and in the case of Jsc, there was a decrease in both short-wavelength and long-wavelength quantum efficiency (QE) [21,32]. Therefore, we can see that the defect of LeTID is close to the front and back surfaces, which is related to the passivation layer [9,36].
Therefore, in this study, we compared Jsc, which mostly changes the solar cells' factor, before and after degradation through QE analysis and compared the difference between commercial cells, that is, cells with and without the Anti-LeTID process. We confirmed the location of the LeTID phenomenon at the cell level by wavelength range. By directly observing how the hydrogen near the surface behaves in a degradation environment, we identified a more fundamental principle of LeTID. We analyzed when hydrogen diffusion occurs during the solar cell manufacturing process and how the hydrogen profile changes in a degradation environment by comparing it with the carrier lifetime. Through the relationship between hydrogen and degradation, the relationship between the current LeTID removal method and the hydrogen profile can be identified, which can be an important clue to a more comprehensive understanding of degradation and hydrogen.

2. Experimental Section

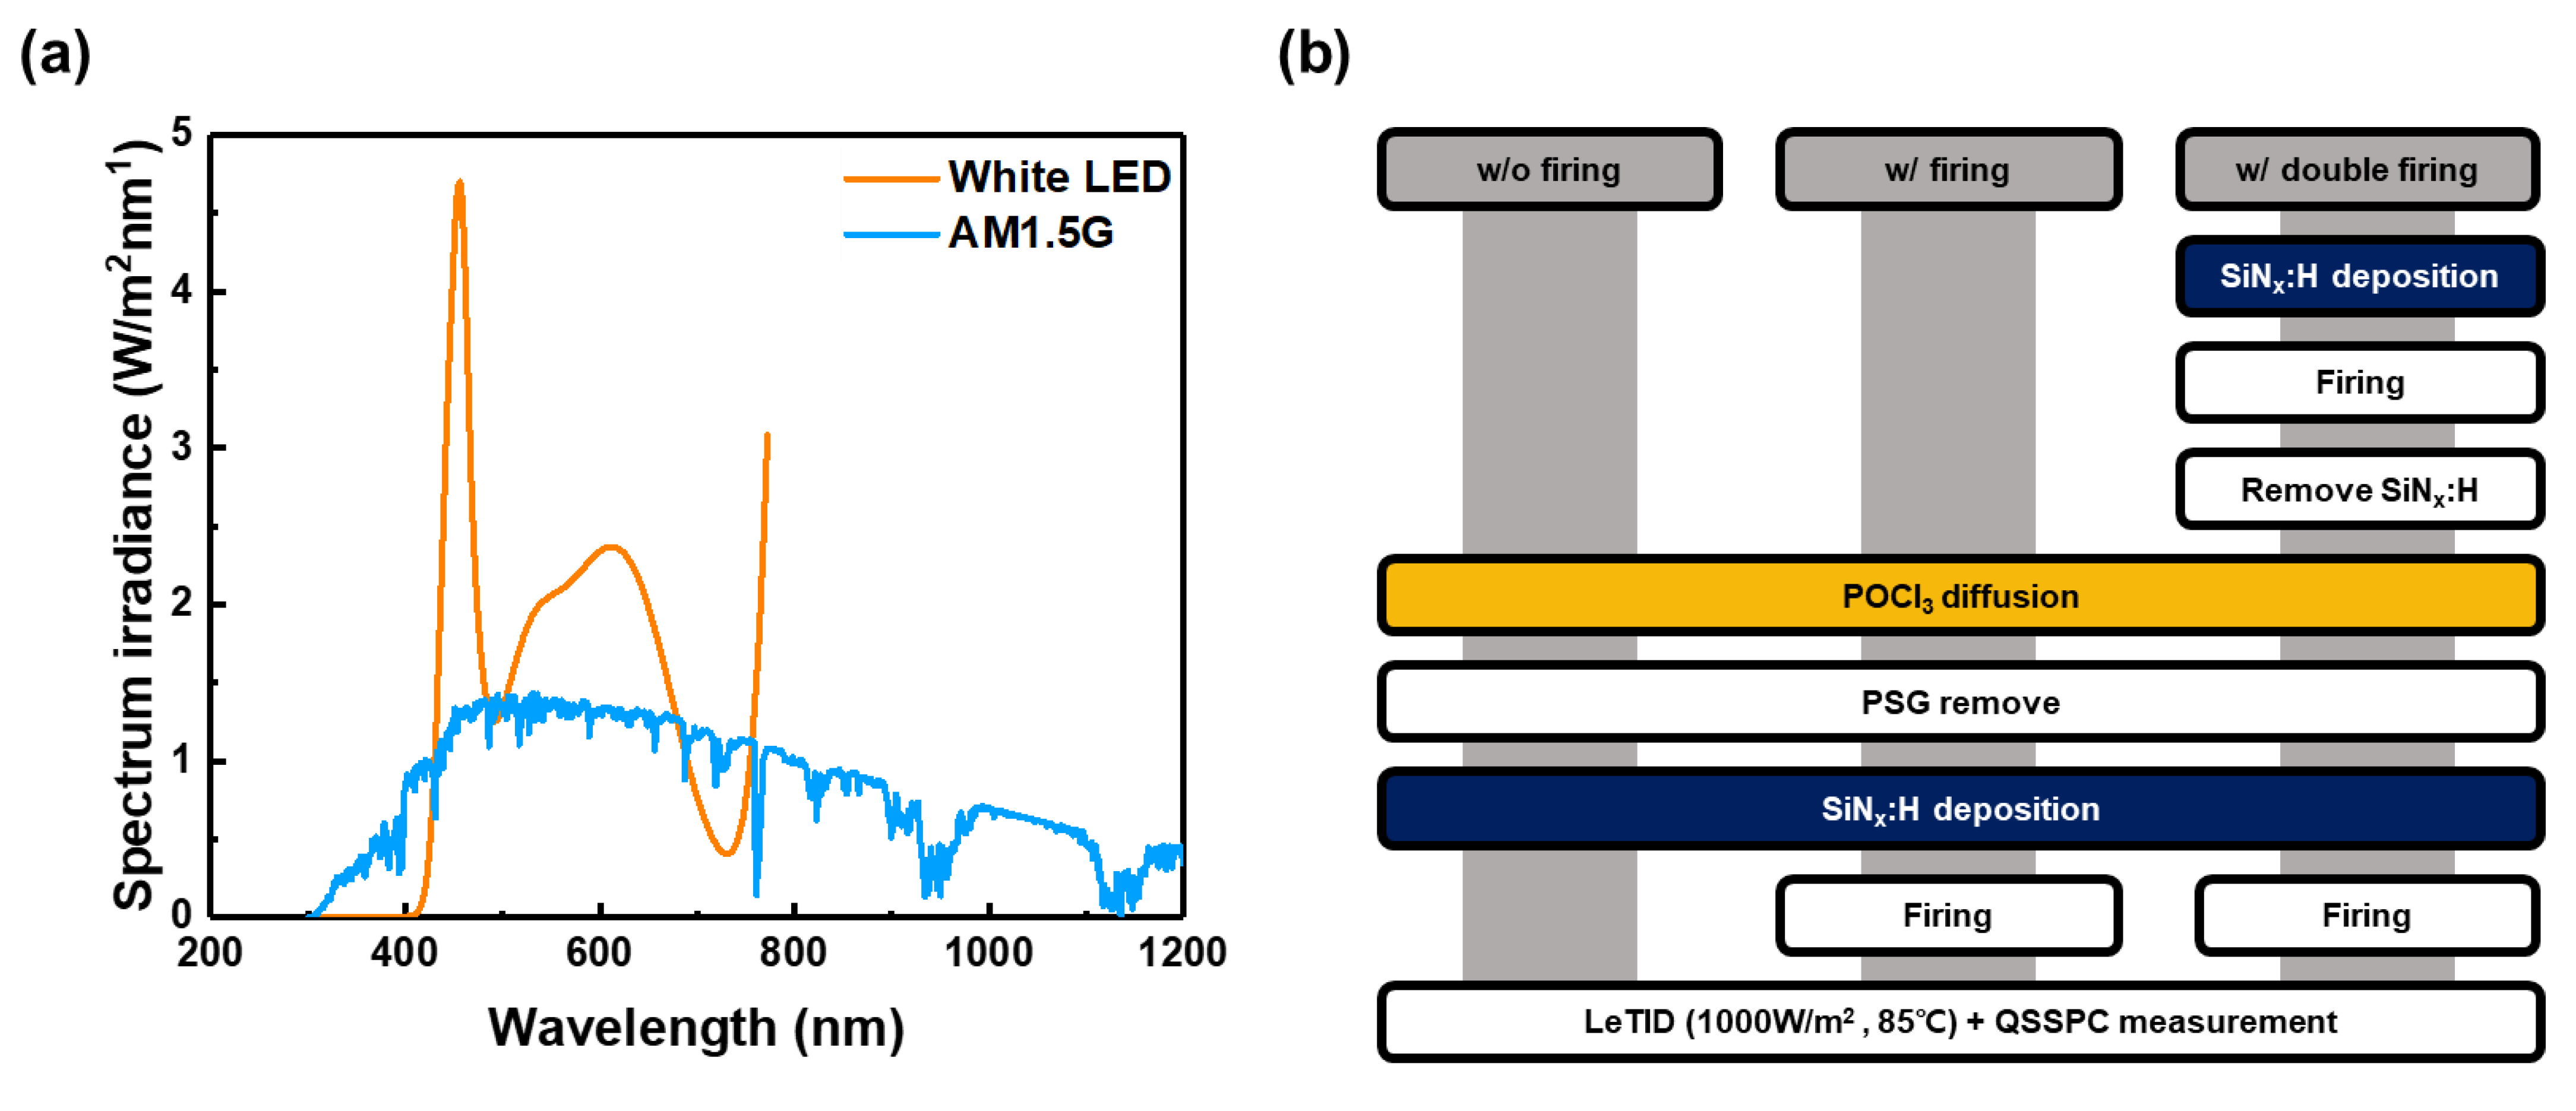
2.1. Sample Preparation

The Czochralski (Cz) boron-doped Si wafer is M2-size (156.75 × 156.75 mm) with similar resistivity (2.2 ± 0.2 Ω∙cm). The wafers had a thickness of 180 ± 5 μm. The saw damage etching is performed by KOH solution before the RCA cleaning process. Subsequently, the wafers were placed in a furnace tube with a high temperature (870 °C, POCl3 and O2 gas) to form an emitter (80 Ω/sq). The phosphosilicate glass layer of the samples was removed by dilute HF. SiNx:H was deposited by using plasma-enhanced chemical vapor deposition (Tes Co., Ltd. 2374-36 Jungbudaero, Yangji-Myun, Cheoin-Gu, Yongin-Si, Gyeonggi-Do, Republic of Korea). The SiNx:H deposition conditions were as follows: 500 sccm SiH, 200 sccm NH3, 2000 sccm N2, and 150 sccm hydrogen at a temperature of 420 °C with a plasma power of 40 W. The firing process is conducted by a rapid thermal process (SNTEK, RTP5000, 176-25, Seotan 2-Ro Seotan-Myeon, Pyeongtaek-Si, Gyeonggi-Do, Republic of Korea), followed by annealing (peak temperature = 700 °C, N2:O2 flow = 0.7:0.3). Finally, the wafers were cut into 40 × 40 mm samples for the lifetime experiment. Before the firing process, the electrodes are screen-printed on the same wafer, and a reference cell is produced through the same firing process [37].

2.2. Measurement

The LeTID tester for the degradation test of the fabricated samples consisted of a solar simulator with a light source, a thermal controller, and a Keithley source meter (2651A). The light source of the LeTID tester (white LED, Class A < ±2%, 1000 W/m2, WWSIM-2001, Woowon Tech, 19th Floor, Parkview Tower, 248 Jeongjail-ro, Bundang-du, Seongnam-si, Gyeonggi-do, Republic of Korea) is shown in Figure 1a. The light wavelength range is 400–775 nm, which is more concentrated in the visible wavelength range than the solar spectrum represented by air mass 1.5 global (AM1.5G), and there is less light in the infrared wavelength range. The thermal controller can be controlled by setting the board temperature on which the sample is placed, which was set to 85 °C. In addition, the degradation of the solar cell was measured in situ with a Keithley source meter (2651A) using a 5 BusBar (BB) probe, and Voc and Jsc were automatically adjusted according to the temperature and light source. QE is measured from 300 to 1200 nm.
The injection-dependent lifetime was evaluated using quasi-steady-state photoconductance (QSSPC, Sinton instrument lifetime tester WCT-120) for over 1000 h. The effective lifetime is measured at 20 °C and typically reported at an excess carrier concentration of Δn = 1 × 10¹⁴–1 × 1016 cm−3. The apparent defect concentration (N*app) can be calculated from
N a p p * t = 1 τ t 1 τ t = 0
where τ(t) is the measured carrier effective lifetime at time t, and τ (t = 0) is the initial lifetime before degradation. The inverse of the effective lifetime is used for the recombination-active defect-affected SRH recombination. The hydrogen concentration was determined using dynamic SIMS (D-SIMS; 4FE7, AMETEK Korea, 105 Gwanggyo-ro, Yeongtong-gu, Suwon-si, Gyeonggi-do, Republic of Korea). Quantitative analysis was performed using the standard specimen. The hydrogen concentration in Si can be calculated as
C s t a n d a r d = R S F × I d o p a n t , s t a n d a r d I m a t r i x , s t a n d a r d ,   C B = R S F × I B ,   s a m p l e I S i , s a m p l e
where RSF is the relative sensitivity factor, which is the conversion factor from the secondary ion intensity to the atom concentration; Cstandard is the atom concentration in the standard specimen; CB is the atom concentration in the sample; and Intensity(I) is the impurity isotope secondary ion intensity in counts of the doping atom and matrix intensity measured using D-SIMS. The surface morphology of the silicon wafer, relative to the dynamic SIMS sputtering beam, can have a considerable impact on the measured location of the maximum point. However, it was not possible to completely quantitatively analyze the hydrogen in the textured silicon with these factors, and comparative analysis was performed on the same sample and measurement. The thickness and refractive index of the SiNx layer were measured using an ellipsometer (Rudolph AutoEL from Entrepix, 4717 E Hilton Avenue Ste 200, Phoenix, AZ, USA).

3. Results and Discussion

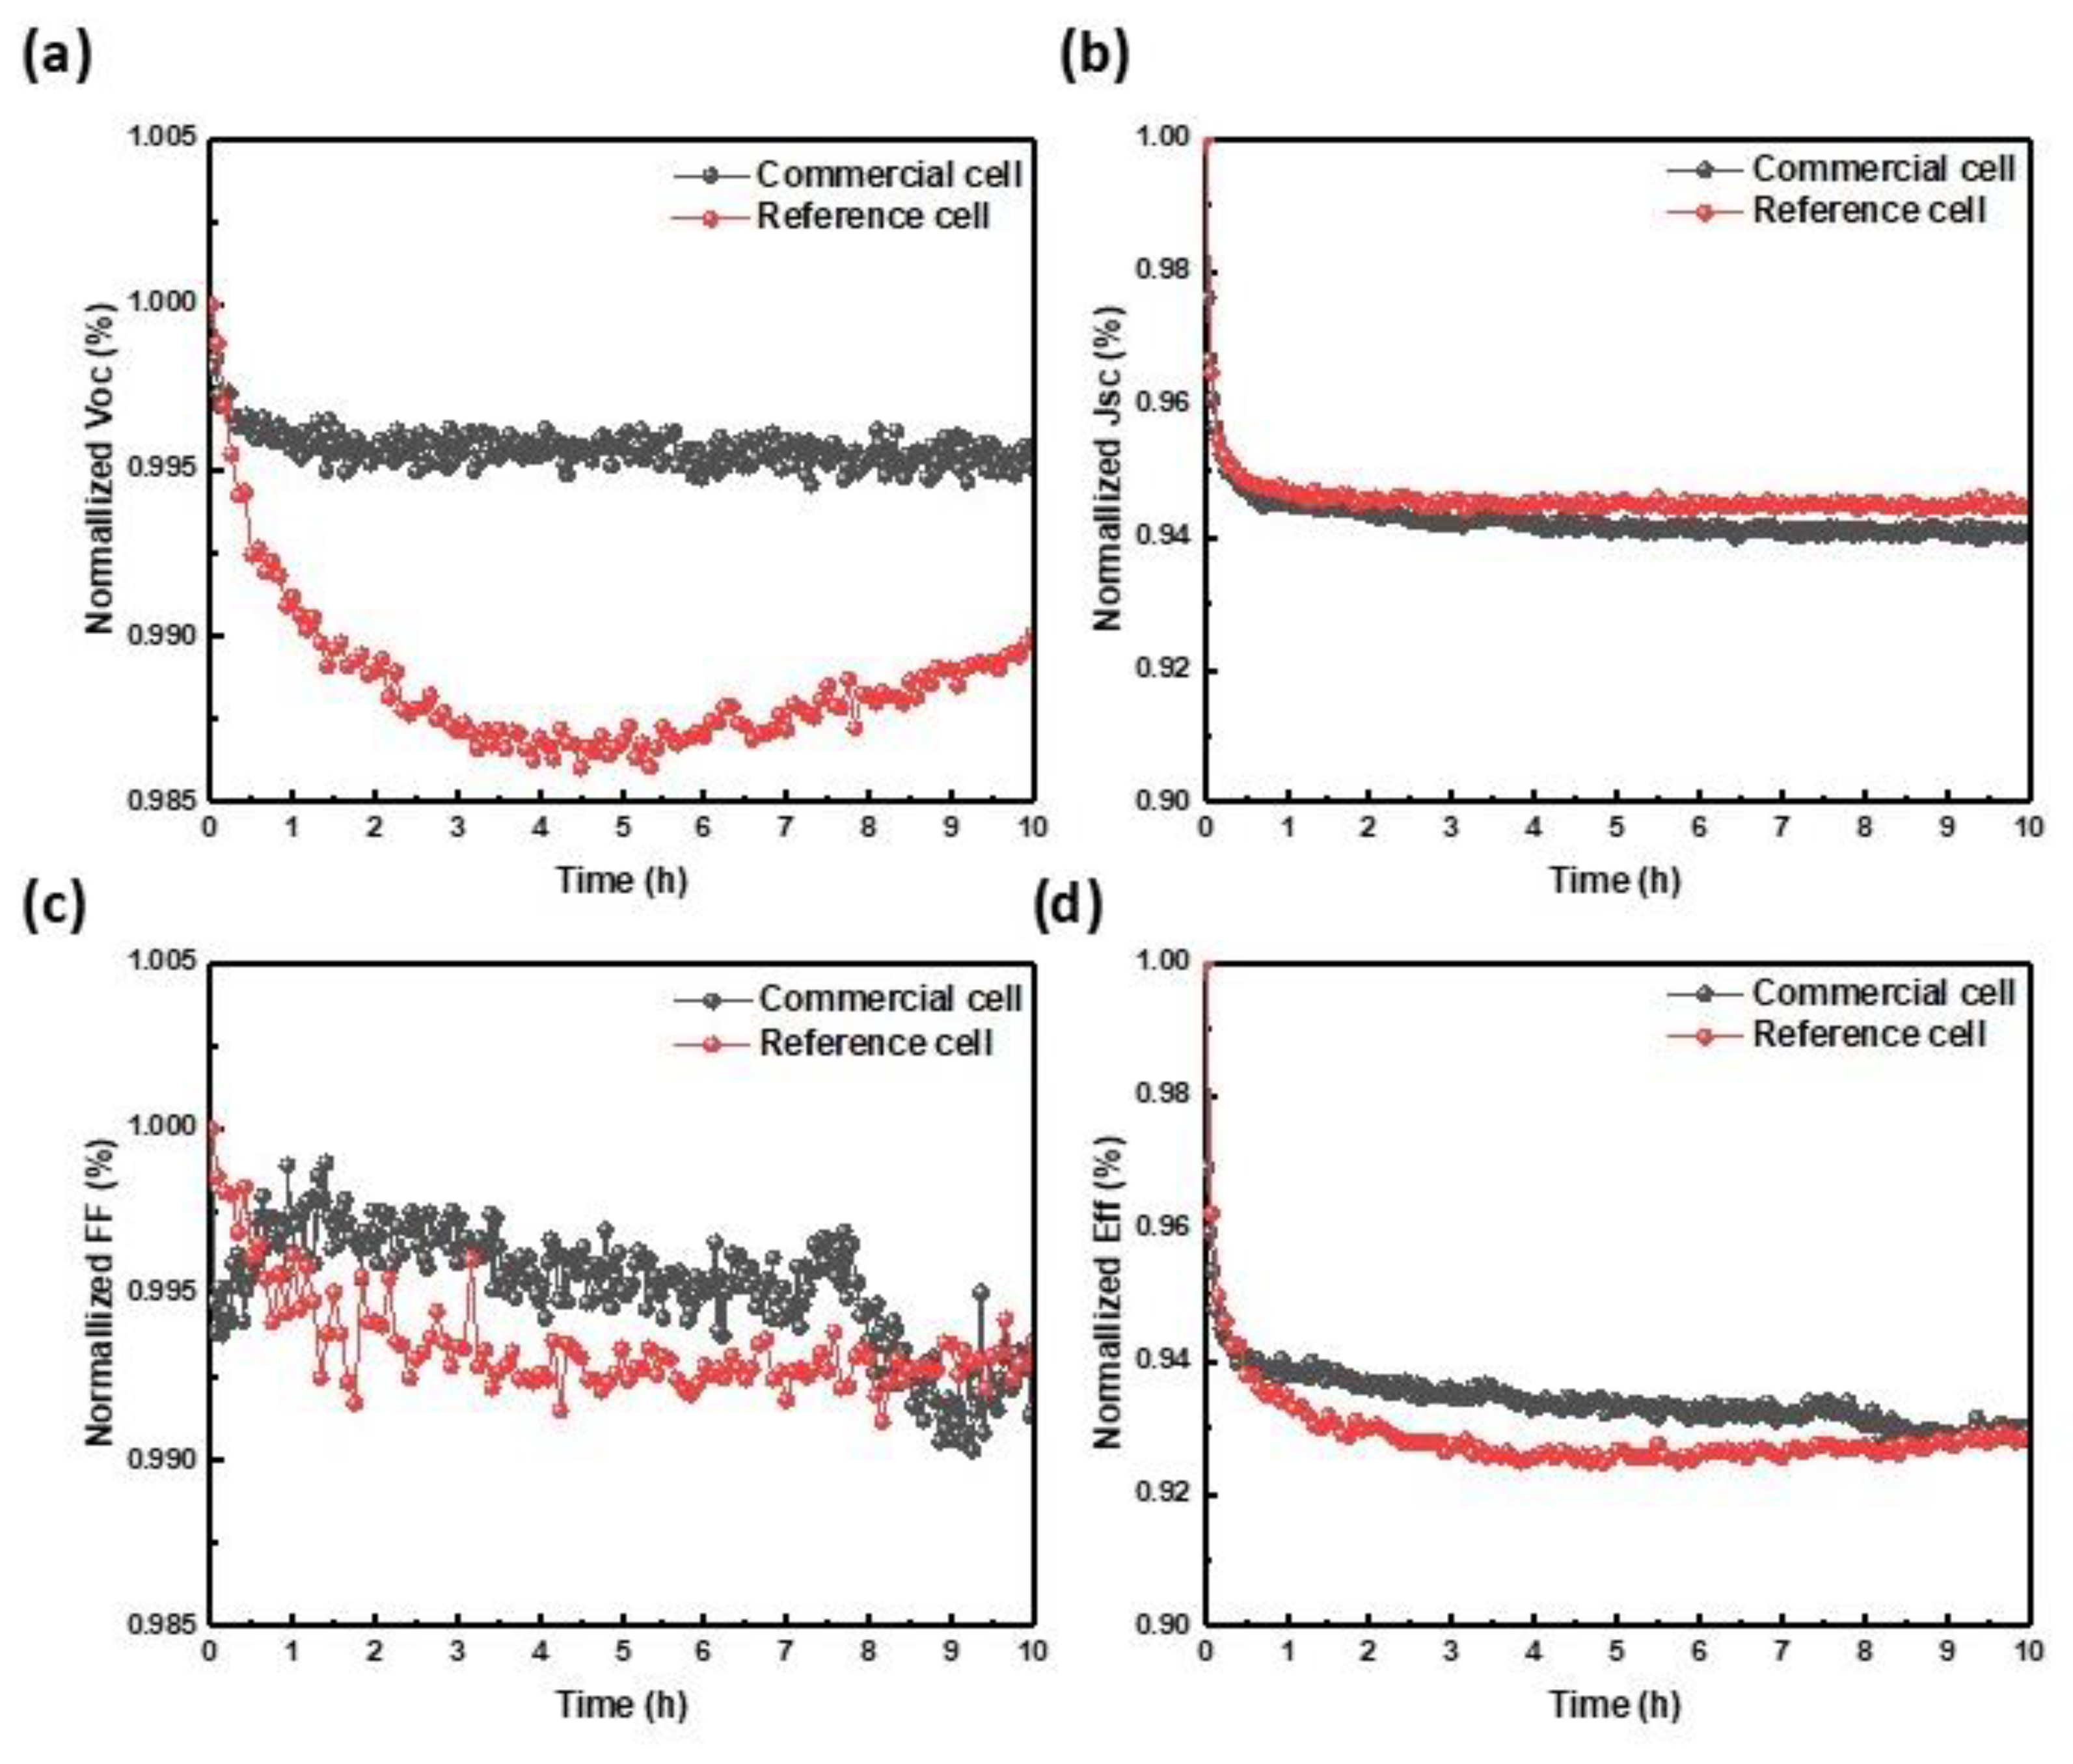
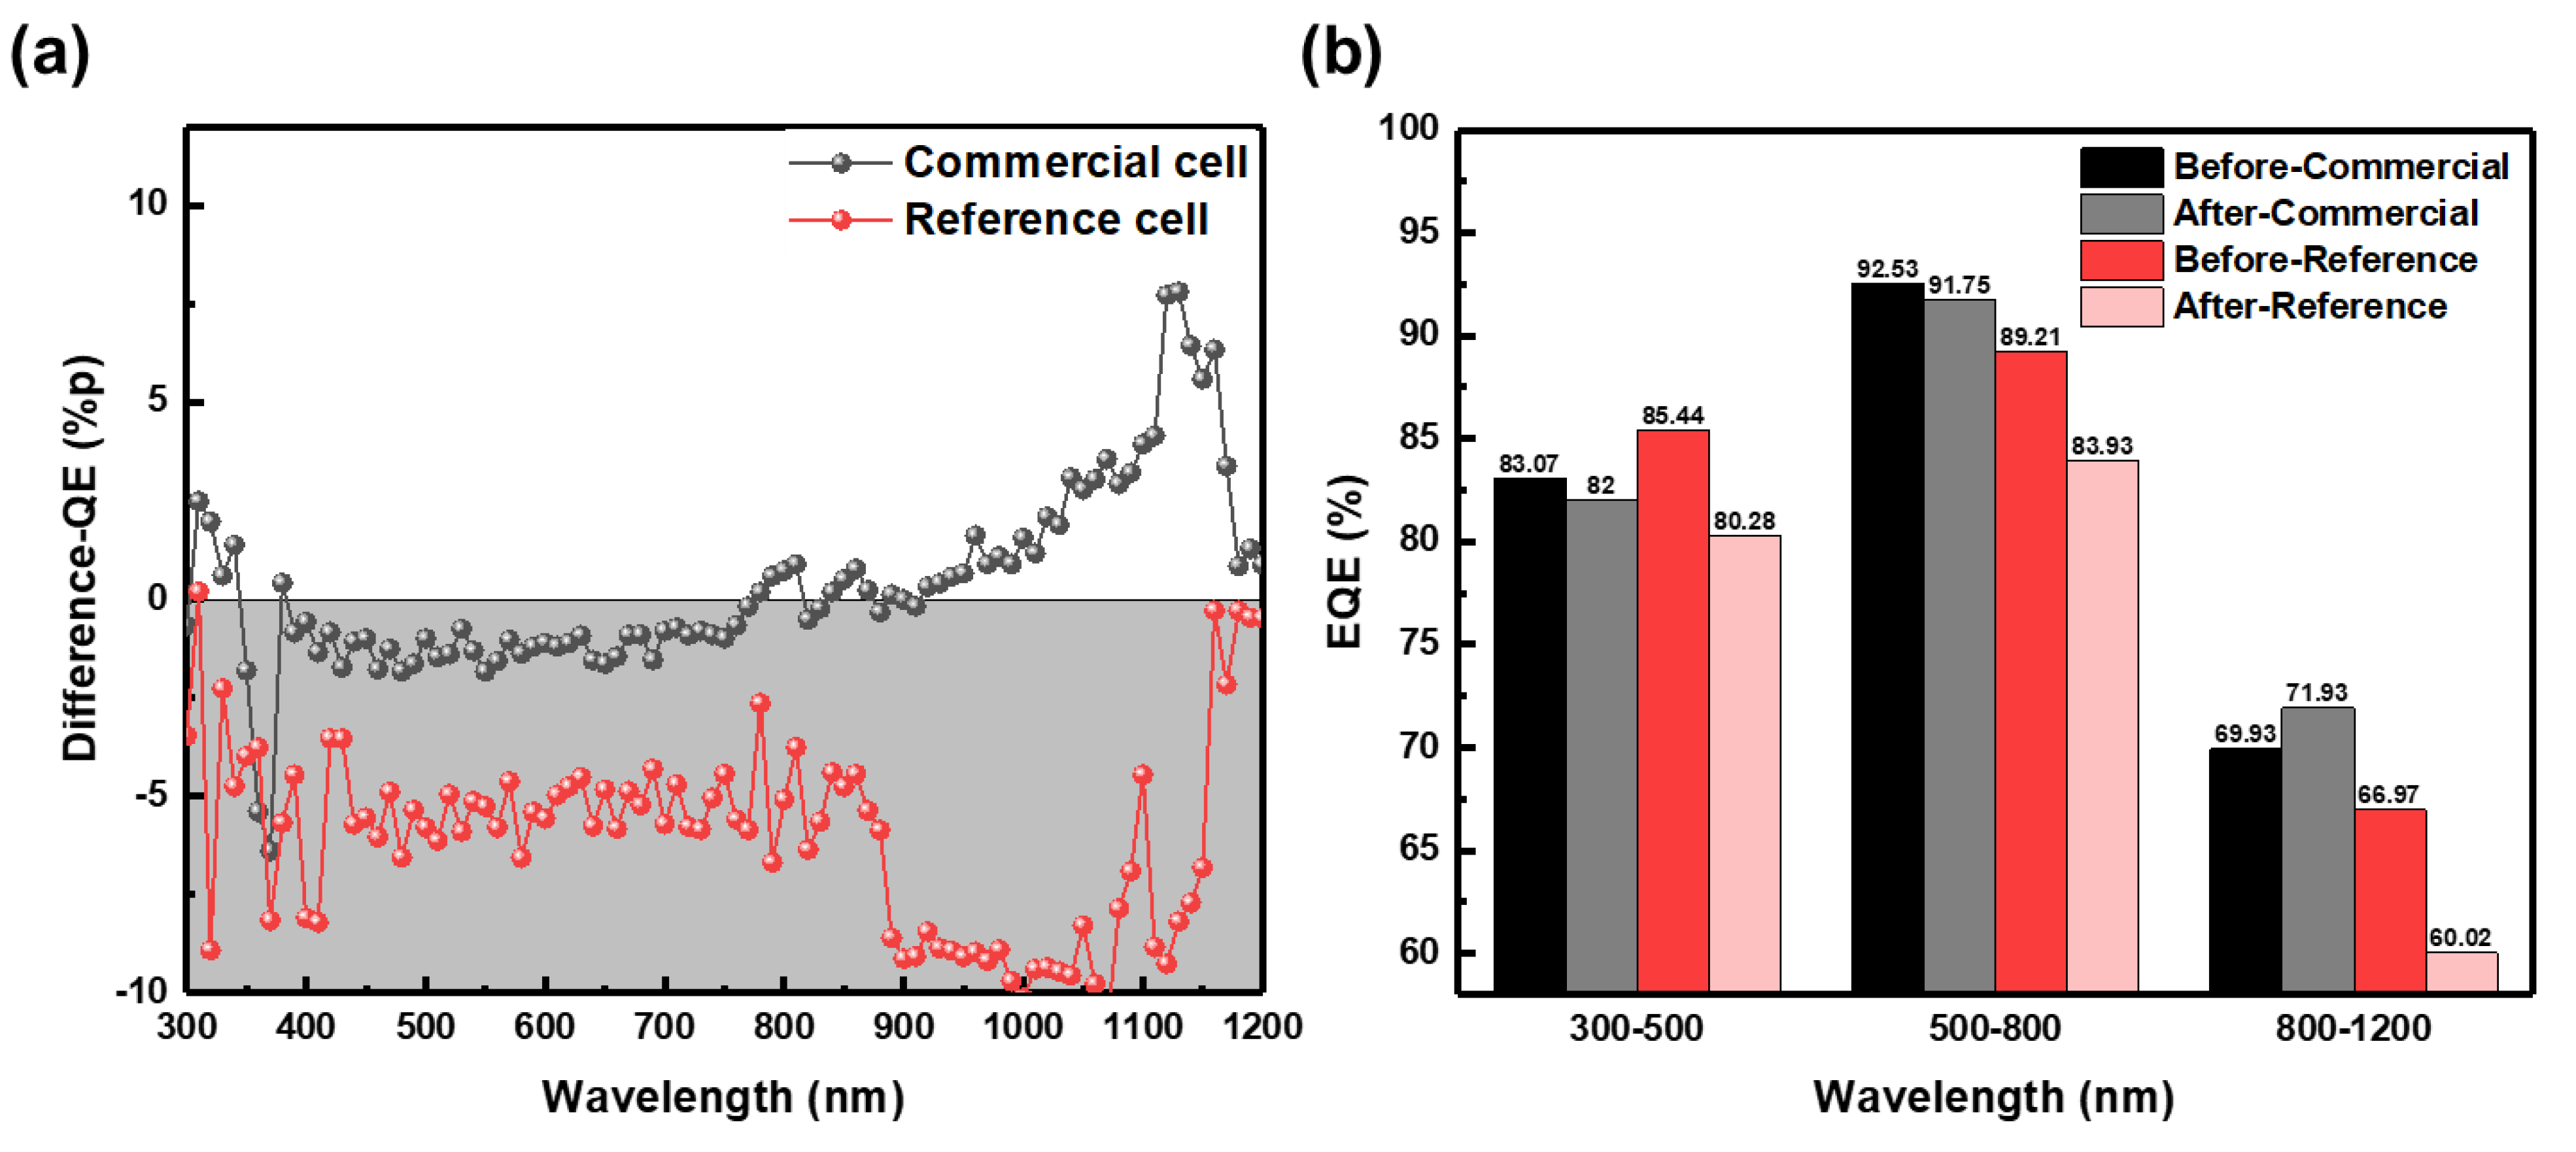
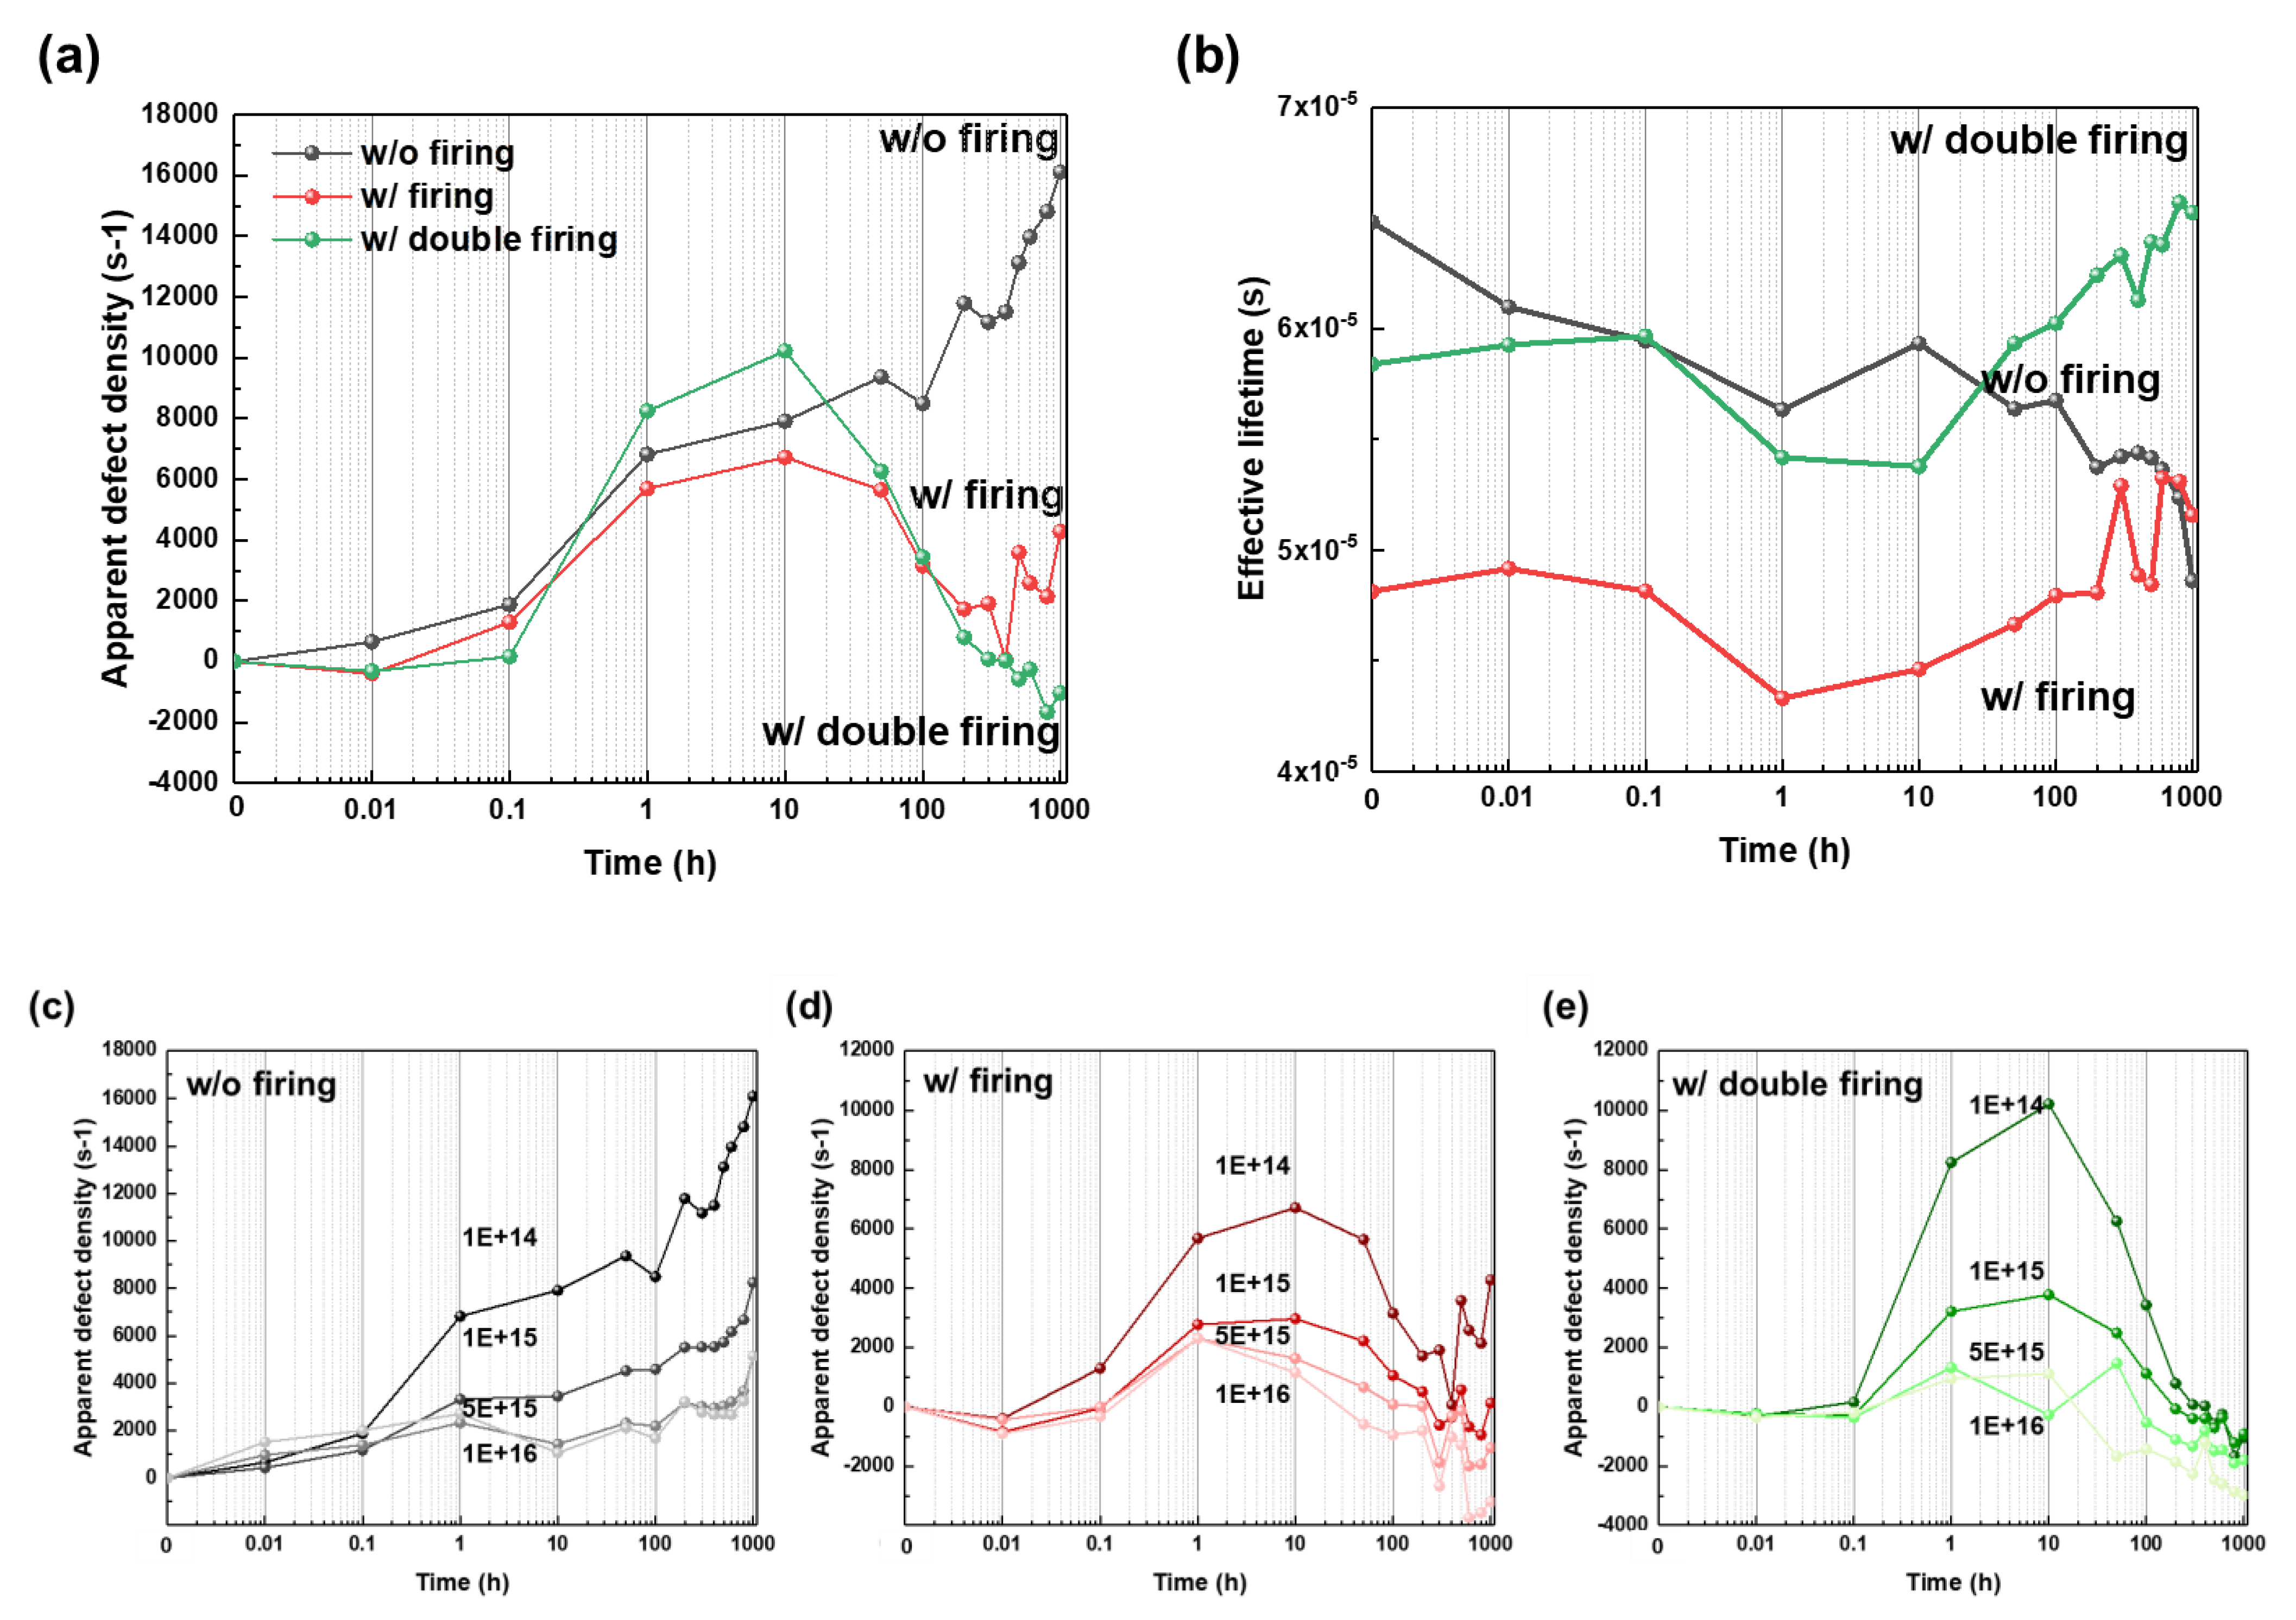
3.1. Commercial Cell Degradation

Figure 2a–d shows the changes in degradation of commercial and reference cells in the LeTID environment by dividing them into each cell parameter. In the case of the commercial cell, there is an initial decrease in Voc and FF due to the temperature effect, and after Voc and FF also decrease by less than 1%. Therefore, it seems that the decrease in efficiency is almost due to Jsc drop. Reference cells also have a similar tendency to FF and Jsc. However, the Voc decreases significantly compared to the commercial cell during the first 10 h in the LeTID environment. It shows a recovery pattern by regeneration occurring at about 5 h. Although it is not shown in the figure in the text, the reason why the degradation time was set short was because the sample showed the most degradation at around 10 h when it was maximally degraded for 200 h in Figure S1.
This result means that the photo-generated carrier collection efficiency is reduced by the influence of LeTID. This suggests that the reference cell is more vulnerable to LeTID. Because the commercial cell may have additionally included an anti-LeTID process such as a change in the firing process or light soaking. To further analyze the cause of the Jsc degradation, QE was measured and compared, as shown in Figure 3.
Assuming that there is no change in the reflectance of the sample due to the LeTID environment, it is reasonable to think that the trends of external quantum efficiency (EQE) and internal quantum efficiency (IQE) are the same. Only EQE measurement can quantify the photo-generated carrier concentration and collection probability without reflectance measurement. Figure 3a measures how the EQE value of each cell changes before and after LeTID. Positive numbers on the y-axis indicate an increase, and negative numbers indicate a decrease. The commercial cell shows a slight decrease in the short and medium wavelength ranges but a significant increase in the long wavelength range. The reference cell shows a decrease in almost all wavelengths, and the difference from the commercial cell is clearly shown in the long wavelength range, especially. Figure 3b shows the change in the average value by wavelength. The commercial cell showed a decrease of 1.07%p in the short wavelength band and about 0.67%p in the medium wavelength band, but a 2%p increase was observed in the long wavelength band. Unlike the commercial cell, the reference cell showed a large decrease of 7%p in the wavelength range of 800–1200 nm due to the large loss at 900–1100 nm. This is similar to the results seen in previous literature [20]. Therefore, we will try to check the difference on the front surface, which is a short wavelength. Interestingly, the decrease in Jsc occurred in the commercial cell in Figure 2 but not in the QE results. Of course, since the I-V is an in-situ result, it was continuously measured at 85 °C, so the defects shown in LeTID may have a greater effect at 85 °C. Therefore, for a more detailed analysis, the measurements were made while applying a bias to the QE.
In Table 1, the QE value of the commercial cell does not change before and after the degradation. However, when the reverse voltage is applied, the overall QE value also decreases rapidly between 0.4 and 0.5 V due to degradation. This indicates a decrease in Vmpp, which seems to be due to the increase in the bulk defect or J0 of the surface. Interestingly, it has a lower QE value than the reference cell at 0.6 V, despite the commercial cells showing high QE values at the initial state. The QE value of the reference cell shows a noticeable decrease at 0.2–0.4 V, and the decrease is larger than that of the commercial cell. It seems that this is probably due to more defects in the bulk. However, even with this measurement, the clear cause of the cell degradation and Jsc decrease cannot be identified.

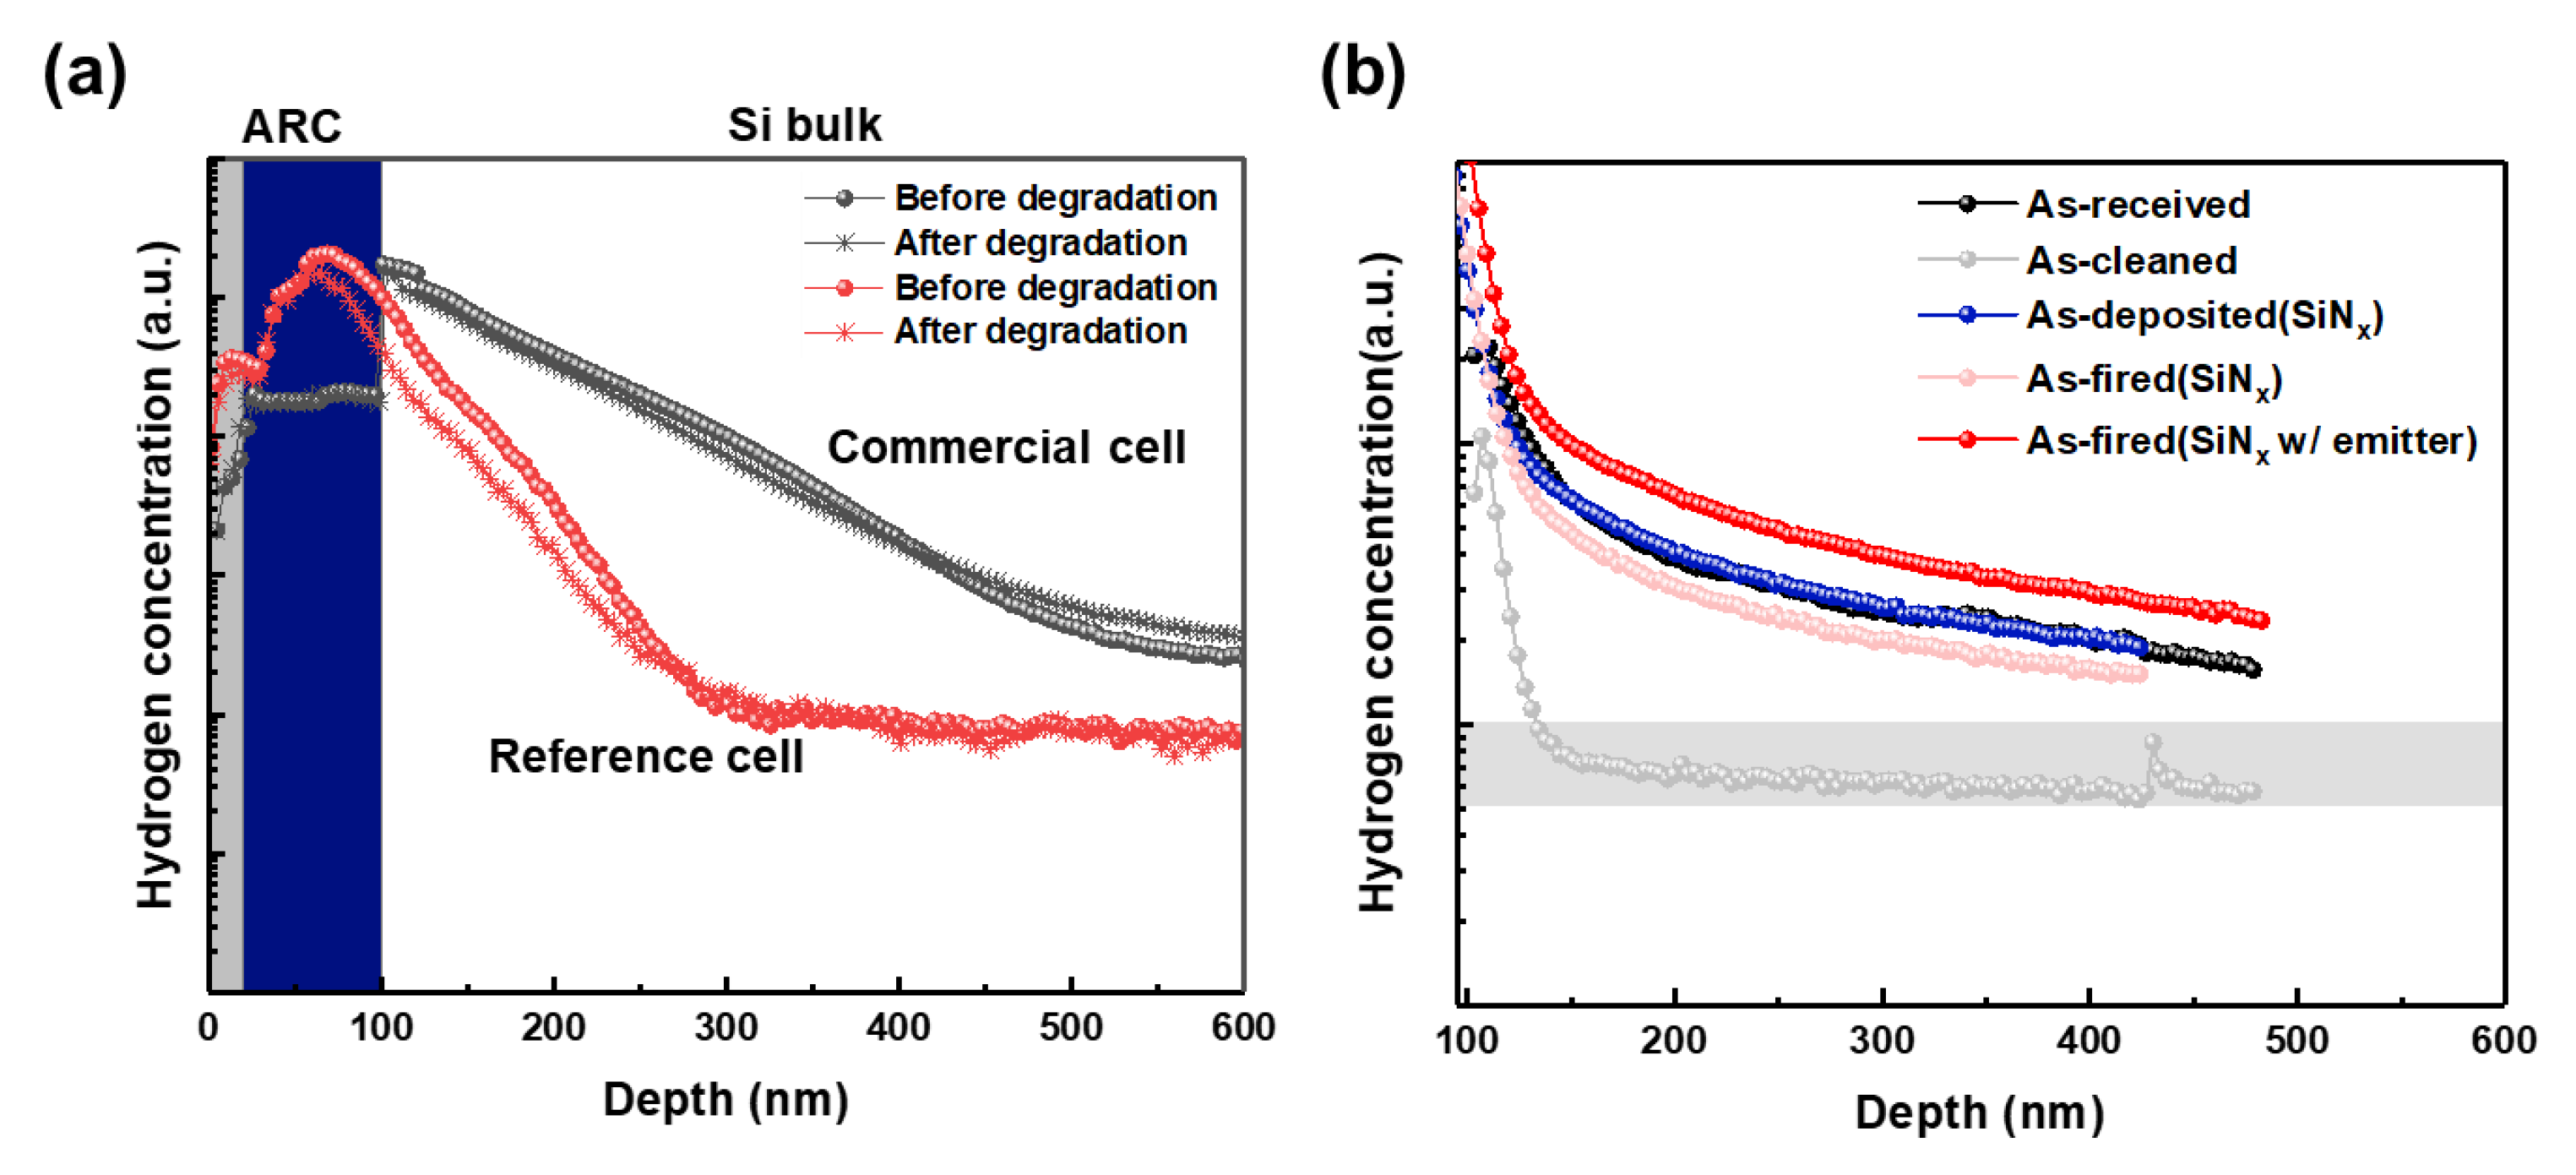
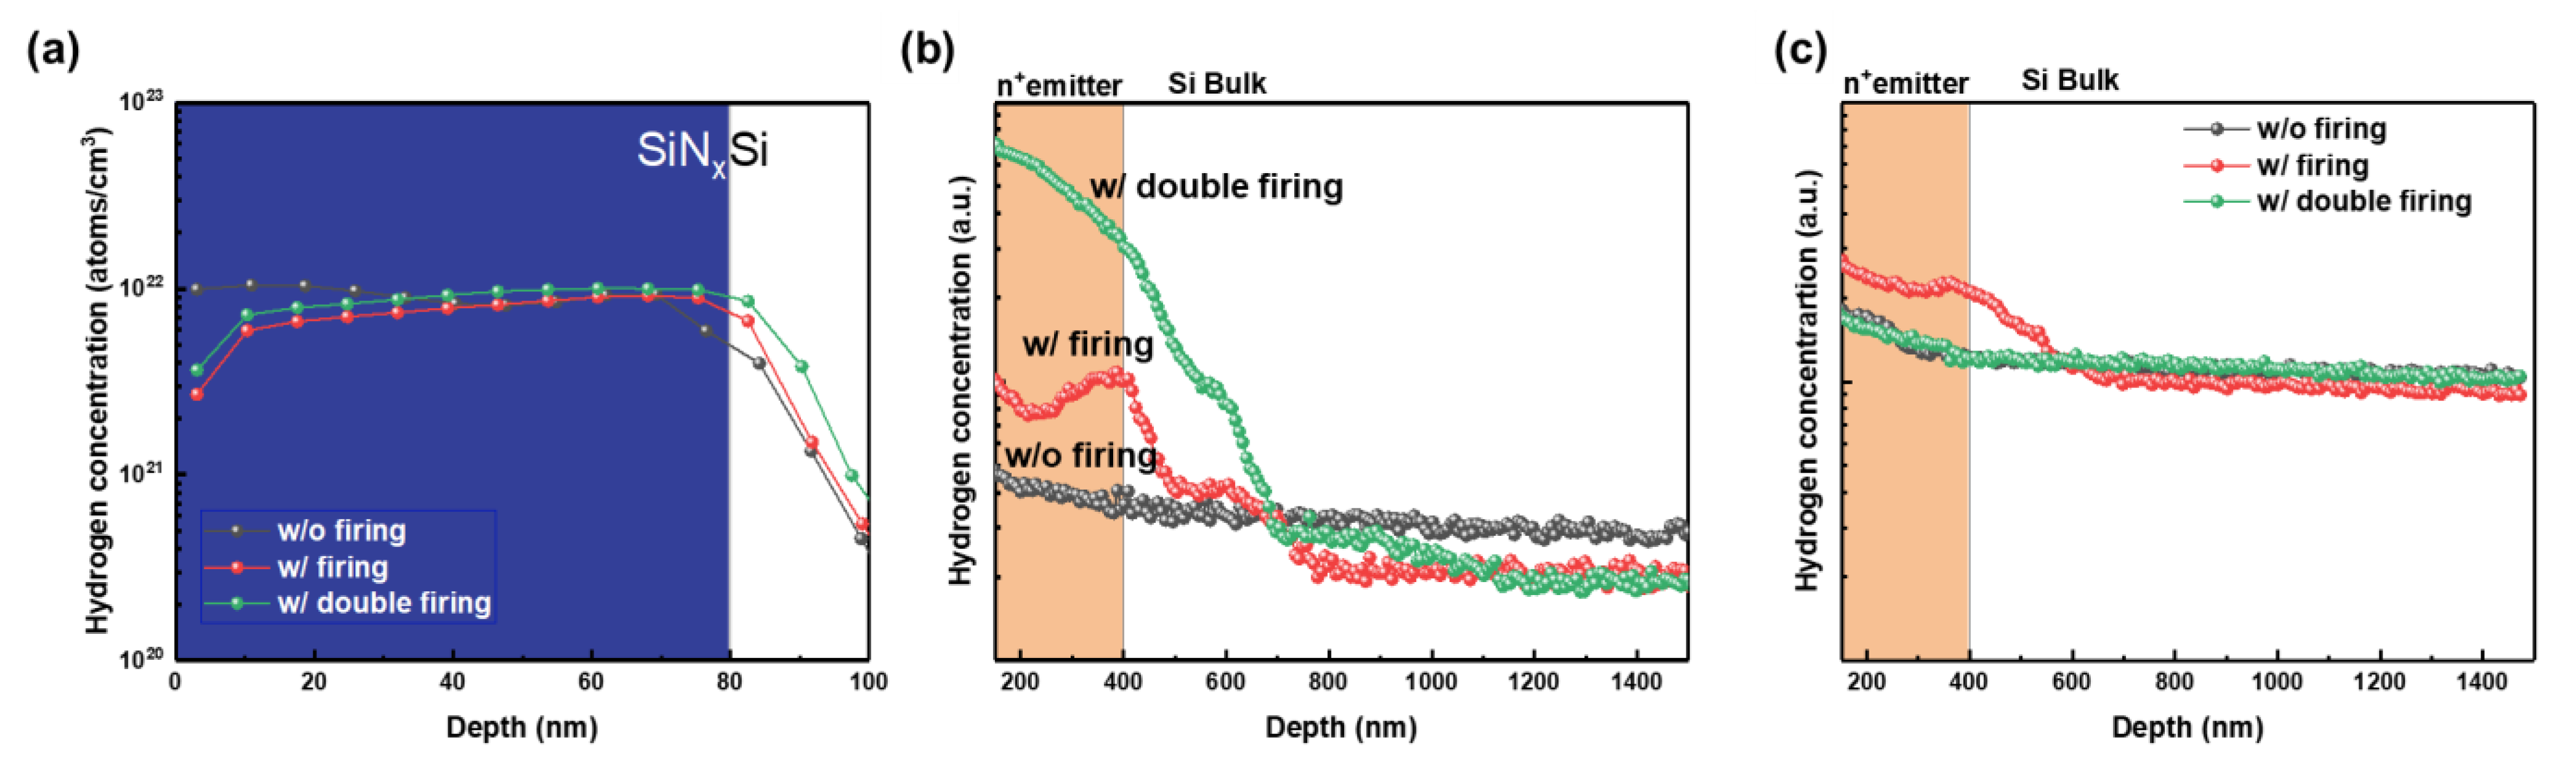
3.2. Quantitative Hydrogen Analysis

Figure 4a shows the hydrogen profiles near the front surface of the commercial cell and the reference cell before and after degradation. The thickness of the front anti-reflection coating (ARC) layer of the Reference and commercial cells is different. Because, in the SIMS measurement, the concentration peaks represent the interface by the matrix effect. Compared to the commercial cell, the hydrogen concentration of the reference cell is reduced, and most of the hydrogen profile changes are shown on the surface just below the SiNx:H, not the bulk. In contrast, the commercial cell shows little change in the diffusion graph itself, and rather, the concentration in the bulk increases slightly after degradation. In addition, the diffusion amount itself is qualitatively higher in the commercial cell, even after passing the saturation point.
Figure 4b shows the hydrogen profiles that change with the silicon solar cell fabrication process. After cleaning the silicon wafer, the surface and bulk hydrogen contents decrease compared to before the cleaning process (as received). And it shows the saturated profile with zero slope, unlike diffusion profiles. After SiNx:H deposition, the hydrogen concentration returns to the level of the concentration profile before cleaning. It shows the same amount of hydrogen concentration as the as-received sample, with the SiNx:H layer shifted by 80 nm calculated. The hydrogen concentration is measured to decrease slightly during the firing process above 700 °C. Considering that the hydrogen concentration in a typical solar cell is 1 × 10¹⁴–1× 10¹⁶/cm−3 [16,29], this difference is not so much that the amount of hydrogen increase due to the firing process is dominant compared to the SiNx:H deposition process. However, it is confirmed that the hydrogen concentration increases compared to the firing process in the presence of a typical emitter, which is similar to the existing literature that the firing process is necessary as an additional factor for hydrogen diffusion. Although it has been shown in much literature that hydrogen diffused from SiNx:H is the primary cause of LeTID, the hydrogen concentration can also be increased by plasma deposition at high temperatures, and additional hydrogen concentration can be obtained during the sintering process.
Figure 5a shows the hydrogen concentration in the SiNx:H layer of the samples that were conducted according to the experimental flow shown in Figure 1b. The hydrogen concentration of the SiNx:H layer does not change significantly due to firing, and as can be seen in Figure S2, there is no significant change in the hydrogen concentration of the SiNx:H layer before and after degradation. This suggests that there is no change in the refractive index of the SiNx:H layer, and thus, it can explain the correlation between the EQE data and the IQE data previously claimed in Section 3.1. In addition, looking at the hydrogen profile in Figure 5a, we can see that the slope is different depending on the presence or absence of firing, which is presumed to be out-diffusion.
Figure 5b shows the hydrogen concentration distribution before degradation, and we can see that the amount of hydrogen increases with the firing process. As can be seen in Figure 4b, the firing co-occurrence in the presence of an emitter caused the greatest hydrogen diffusion, and in addition, the w/double firing sample showed the greatest amount of hydrogen. The emitter thickness is estimated to be approximately 300 nm. Approximately 300 nm depth corresponds to the junction depth where phosphorus and boron concentrations are equal based on the dopant (~1.0 × 1016 cm−3) in S.I. This is likely due to the slight hill-like shape of the firing sample in Figure 5b, creating a hydrogen peak in the depletion region. It appears that a hydrogen aggregation region is formed in the depletion region of the n+ emitter and the p-type wafer, like the interface. Figure 5c shows the hydrogen profiles of each sample after 1000 h of thermal annealing; all of them are saturated at a certain concentration. The hydrogen concentration decreased in w/double firing samples just below the SiNx:H layer but increased in other samples. This implies that one of two things occurs: Either hydrogen diffuses from the SiNx:H layer, or hydrogen diffuses from the bulk to the surface. Of these two, the latter case appears to be a more convincing mechanism when compared with the existing literature and the pre- and post-diffusion of the SiNx:H layer in Figure S2.
Figure 6a shows the variation of the apparent defect density using the lifetime change in the LeTID environment for 1000 h. After 1000 h, the results can be largely divided into two groups: The w/o firing sample is one group, and the w/firing and double firing samples are the other. The w/o firing has more defects and shorter lifetimes than the initial state. On the other hand, the second group has fewer defects than the initial amount. All samples show degradation for 1 h. In addition, the w/o firing sample exhibiting hydrogen-deficient samples shows a higher level of degradation without regeneration. The second group, consisting of hydrogen-rich samples, shows degradation and regeneration. Comparing processes #2 and #4, the degradation is suppressed in process #4. The more the hydrogen profile has a gradient along the emitter, such as the commercial cell in Figure 4, the more immune to LeTID it is. It may not necessarily be the case that excessive hydrogen worsens LeTID.
Figure 6b shows the absolute lifetime. The initial lifetime of the w/o firing sample and the w/w/firing sample is higher in the w/o firing sample, but the lifetimes of the two samples become almost similar during 1000 h of degradation. In the case of the w/double firing, the initial lifetime is slightly lower than the w/o firing sample, but it recovers after 10 h and shows the highest lifetime. It even has a longer lifetime than the initial lifetime. Although firing is thought to be the main cause of LeTID, considering the hydrogen concentration distribution and the decrease in lifetime, it is thought that the hydrogen diffused by the high-temperature PECVD, as shown in Figure 4b, also affects the degradation. In addition, the lifetime change according to the MCD was analyzed to determine the presence or absence of regeneration.
If the QSSPC results are divided according to MCD, the degree of degradation of the sample can be seen more clearly. For each sample, the smaller the MCD value, the larger the apparent defect density value. In particular, in the case of w/o firing samples, a very large degradation phenomenon is shown to the extent that the y-axis is different. However, in MCDs above 5 × 10¹⁵, not much degradation is shown. Therefore, in the case of the w/o firing sample, it seems to have an effect on LID rather than LeTID. This is because in the case where there is very little hydrogen, it seems to be vulnerable to B-O complexes and therefore vulnerable to bulk defects, as can be seen in the case of low MCD. In the case of the w/o firing sample, it can be seen that it shows two or more degradation phenomena compared to other samples, since it shows a regeneration phenomenon at 10 h at high MCD.
In the case of the w/firing and w/double firing samples, it seems that the faster the hydrogen concentration in the emitter, the faster the degradation, but the faster the regeneration phenomenon is shown before 10 h. The w/firing sample with a constant hydrogen concentration shows the least maximum degradation phenomenon. Therefore, the degradation can be reduced by optimizing the hydrogenation process and firing process that control the amount of hydrogen on the surface, and it is also necessary to calculate the amount of saturated hydrogen required for the bulk and apply it to the passivation process.

4. Conclusions

In conclusion, this study focused on directly measuring the hydrogen depth profile to elucidate the specific relationship between the hydrogen profile and degradation due to LeTID. A significant loss of Jsc was observed during the first 10 h of degradation, which contributed most to the overall efficiency reduction. The commercial cell showed less short-wavelength QE decrease compared to the reference cell. This was due to the front side of the cell, especially the emitter region, where the hydrogen profile in the emitter under the degradation environment of the commercial cell showed little change. In contrast, the hydrogen profile in the emitter environment of the reference cell showed a change. Based on this, we hypothesized that the hydrogen profile plays a key role in the Jsc loss associated with LeTID. To verify this, degradation tests were performed on samples with various hydrogen profiles obtained through changes in the solar cell process. We confirmed that the high-temperature plasma process increased hydrogen diffusion during the firing and that additional diffusion occurred throughout the firing stage. In addition, after 1000 h of LeTID exposure, hydrogen was observed to migrate from the bulk to the surface, and the surface areas of almost all samples reached the saturated equilibrium hydrogen concentration. In particular, the lower the difference between the initial released hydrogen concentration and the equilibrium concentration, the lower the degree of degradation, especially in terms of Jsc loss. Since regeneration generally starts after the degradation reaches saturation (approximately 10 h), less degraded samples showed improved regeneration potential. These results suggest that implementing an optimized equilibrium hydrogen concentration through process control can improve both LeTID and LID resistance and passivation quality. However, these characteristics have limitations in that they cannot interpret the reversible phenomenon due to dark annealing, which is one of the major characteristics of degradation.

Supplementary Materials

The following supporting information can be downloaded at: https://www.mdpi.com/article/10.3390/en18123090/s1, Figure S1. Efficiency degradation of reference cell for 200 h; Figure S2. Cell efficiency parameter degradation of reference cell for 200 h; Figure S3. Hydrogen profile measured by D-SIMS in SiNx:H/Si interface. (a) Processing, (b) before degradation, and (c) after degradation. Figure S3b matches Figure 5a in the paper; Figure S4. Phosphorus profile measured by D-SIMS: the concentration measurement limitation of D-SIMS is 1E17 cm−3, and the junction depth is considered 300 nm; Figure S5. Lifetime change for 1000 h with MCD (1 × 10¹⁴–1 × 10¹⁶).

Author Contributions

Conceptualization, M.S.; methodology, M.S.; validation, Y.G.; data curation, Y.G.; writing—original draft preparation, M.S.; writing—review and editing, Y.G.; supervision, D.K.; project administration, Y.K.; funding acquisition, D.K. All authors have read and agreed to the published version of the manuscript.

Funding

This research received no external funding.

Data Availability Statement

The data used in this study are provided in the text and its Supporting Information.

Acknowledgments

This research was supported by the New & Renewable Energy Core Tech-nology Program of the Korea Institute of Energy Technology Evaluation and Planning (KETEP) and supported by the Ministry of Trade, Industry, and Energy of the Republic of Korea (No. RS-2023-00236715) and This research was supported by the Korea Evaluation Institute of Industrial Technology (KEIT, grant no. 20015762) of the Ministry of Trade, Industry and Energy (MOTIE; and the Development Program of the Korea Institute of Energy Research.

Conflicts of Interest

The authors declare that they have no known competing financial interests or personal relationships that could have appeared to influence the work reported in this paper.

Declaration of generative AI and AI-assisted technologies in the writing process

During the preparation of this work, the author(s) used ChatGPT in order to check English grammar. After using this ChatGPT, the author reviewed and edited the content as needed and take(s) full responsibility for the publication’s content.

References

  1. Walburga Hemetsberger, M.S. Sonia Dunlop. In Global Market Outlook; Intersolar Europe, Global Solar Council (GSC): Munich, Germany, 2025; pp. 6–12. [Google Scholar]
  2. Fischer, M. International Technology Roadmap for Photovoltaics, 15th ed.; VDMA: Frankfurt, Germany, 2024. [Google Scholar]
  3. NREL Best Research-Cell Efficiency Chart. Available online: https://www.nrel.gov/pv/cell-efficiency (accessed on 12 May 2025).
  4. Chan, C.E.; Payne, D.N.R.; Hallam, B.J.; Abbott, M.D.; Fung, T.H.; Wenham, A.M. Rapid Stabilization of High-Performance Multicrystalline P-type Silicon PERC Cells. IEEE J. Photovolt. 2016, 6, 1473–1479. [Google Scholar] [CrossRef]
  5. Lee, S.; Lee, K.D.; Bae, S.; Kang, Y.; Kim, D.; Lee, H.-S. Prevention of potential-induced degradation using a moisture barrier in crystalline silicon photovoltaic modules. Prog. Photovolt. Res. Appl. 2024, 32, 390–398. [Google Scholar] [CrossRef]
  6. Lindroos, J.; Savin, H. Review of light-induced degradation in crystalline silicon solar cells. Sol. Energy Mater. Sol. Cells 2016, 147, 115–126. [Google Scholar] [CrossRef]
  7. Petter, K.; Hubener, K.; Kersten, F.; Bartzsch, M.; Fertig, F.; Kloter, B.; Muller, J. Dependence of LeTID on brick height for different wafer suppliers with several resistivities and dopants. Int. Work. Cryst. Silicon Sol. Cells 2016, 6, 1–17. [Google Scholar]
  8. Chen, D.; Hamer, P.; Kim, M.; Chan, C.; nee Wenham, A.C.; Rougieux, F.; Zhang, Y.; Abbott, M.; Hallam, B. Hydrogen-induced degradation: Explaining the mechanism behind light- and elevated temperature-induced degradation in n- and p-type silicon. Sol. Energy Mater. Sol. Cells 2020, 207, 110353. [Google Scholar] [CrossRef]
  9. Winter, M.; Bordihn, S.; Peibst, R.; Brendel, R.; Schmidt, J. Degradation and Regeneration of n+-Doped Poly-Si Surface Passivation on p-Type and n-Type Cz-Si Under Illumination and Dark Annealing. IEEE J. Photovolt. 2020, 10, 423–430. [Google Scholar] [CrossRef]
  10. Zerfaß, R.; Simon, J.; Herguth, A.; Hahn, G. Impact of Hydrogen in Ga-Doped Silicon on Maximum LeTID Defect Density. Sol. RRL 2023, 7, 2300501. [Google Scholar] [CrossRef]
  11. Kersten, F.; Engelhart, P.; Ploigt, H.-C.; Stekolnikov, A.; Lindner, T.; Stenzel, F.; Bartzsch, M.; Szpeth, A.; Petter, K.; Heitmann, J.; et al. Degradation of multicrystalline silicon solar cells and modules after illumination at elevated temperature. Sol. Energy Mater. Sol. Cells 2015, 142, 83–86. [Google Scholar] [CrossRef]
  12. Niewelt, T.; Selinger, M.; Grant, N.E.; Kwapil, W.; Murphy, J.D.; Schubert, M.C. Light-induced activation and deactivation of bulk defects in boron-doped float-zone silicon. J. Appl. Phys. 2017, 121, 185702. [Google Scholar] [CrossRef]
  13. Varshney, U.; Abbott, M.; Ciesla, A.; Chen, D.; Liu, S.; Sen, C. Evaluating the Impact of SiNx Thickness on Lifetime Degradation in Silicon. IEEE J. Photovolt. 2019, 9, 601–607. [Google Scholar] [CrossRef]
  14. nee Wenham, A.C.; Wenham, S.; Chen, R.; Chan, C.; Chen, D.; Hallam, B. Hydrogen-Induced Degradation. In Proceedings of the 2018 IEEE 7th World Conference on Photovoltaic Energy Conversion (WCPEC) (A Joint Conference of 45th IEEE PVSC, 28th PVSEC & 34th EU PVSEC), Waikoloa, HI, USA, 10–15 June 2018. [Google Scholar]
  15. Sio, H.C.; Wang, H.; Wang, Q.; Sun, C.; Chen, W.; Jin, H.; Macdonald, D. Light and elevated temperature induced degradation in p-type and n-type cast-grown multicrystalline and mono-like silicon. Sol. Energy Mater. Sol. Cells 2018, 182, 98–104. [Google Scholar] [CrossRef]
  16. Hammann, B.; Rodrigues, P.V.; Aßmann, N.; Kwapil, W.; Schindler, F.; Schubert, M.C.; Glunz, S.W. Deciphering the Role of Hydrogen in the Degradation of Silicon Solar Cells under Light and Elevated Temperature. Sol. RRL 2024, 8, 2400457. [Google Scholar] [CrossRef]
  17. Schön, J.; Hamer, P.; Hammann, B.; Zechner, C.; Kwapil, W.; Schubert, M.C. Hydrogen in Silicon Solar Cells: The Role of Diffusion. Sol. RRL 2025, 9, 2400668. [Google Scholar] [CrossRef]
  18. Jordan, D.; Sulas-Kern, D.B.; Jonhston, S.; Moutinho, H.R.; Xiao, C.; Jiang, C.S.; Young, M.; Norman, A.G.; Deline, C.; Repins, I.; et al. High Efficiency Silicon Module Degradation—From Atoms to Systems: Preprint; National Renewable Energy Lab. (NREL): Golden, CO, USA, 2020. [Google Scholar]
  19. Ma, S.; Gao, P.; Xu, J.; Li, W.; Guo, Y.; Qiao, D.; Ma, B.; Yuan, W.; Ye, T. Light and elevated temperature induced degradation (LeTID) of N-type TOPCon solar cells. Solar Energy 2025, 296, 113573. [Google Scholar] [CrossRef]
  20. Bredemeier, D.; Walter, D.C.; Schmidt, J. Possible Candidates for Impurities in mc-Si Wafers Responsible for Light-Induced Lifetime Degradation and Regeneration. Sol. RRL 2018, 2, 1700159. [Google Scholar] [CrossRef]
  21. Maischner, F.; Maus, S.; Greulich, J.; Lohmuller, S.; Lohmuller, E.; Saint-Cast, P.; Ourinson, D.; Vahlman, H.; Hergert, K.; Riepe, S. LeTID mitigation via an adapted firing process in p-type PERC cells from SMART cast-monocrystalline, Czochralski and high-performance multicrystalline silicon. Prog. Photovolt. Res. Appl. 2022, 30, 123–131. [Google Scholar] [CrossRef]
  22. Chakraborty, S.; Huang, Y.; Wilson, M.; Aberle, A.G.; Li, J.B. Mitigating Light and Elevated Temperature Induced Degradation in Multicrystalline Silicon Wafers and PERC Solar Cells Using Phosphorus Diffusion Gettering. Phys. Status Solidi A 2018, 215, 1800160. [Google Scholar] [CrossRef]
  23. Zuschlag, A.; Skorka, D.; Hahn, G. Degradation and regeneration in mc-Si after different gettering steps. Prog. Photovolt. Res. Appl. 2017, 25, 545–552. [Google Scholar] [CrossRef]
  24. Sharma, R.; Chong, A.P.; Li, J.B.; Aberle, A.G.; Huang, Y. Role of post-metallization anneal sequence and forming gas anneal to mitigate light and elevated temperature induced degradation of multicrystalline silicon solar cells. Sol. Energy Mater. Sol. Cells 2019, 195, 160–167. [Google Scholar] [CrossRef]
  25. Wang, L.; Koh, D.; Hamer, P.; Pollard, M.; Chan, C. Suppression of LeTID in p-Type Multi-Crystalline PERC Silicon Solar Cells by Biased Annealing Process; AIP Publishing: Melville, NY, USA, 2022. [Google Scholar]
  26. Varshney, U.; Hallam, B.; Hamer, P.; Ciesla, A.; Chen, D.; Liu, S. Controlling Light- and Elevated-Temperature-Induced Degradation With Thin Film Barrier Layers. IEEE J. Photovolt. 2020, 10, 19–27. [Google Scholar] [CrossRef]
  27. Wang, Z.; Shen, H.; Hu, D.; Wei, Q.; Ni, Z.; Li, Y.; Sun, L.; Qian, H. Influence of double current injection annealing on anti-LID effect in mono-like cast silicon PERC solar cells. J. Mater. Sci. Mater. Electron. 2020, 31, 3221–3227. [Google Scholar] [CrossRef]
  28. Sen, C.; Chan, C.; Hamer, P.; Wright, M.; Varshney, U.; Liu, S.; Chen, D.; Samadi, A.; Ciesla, A.; Chong, C.; et al. Annealing prior to contact firing: A potential new approach to suppress LeTID. Sol. Energy Mater. Sol. Cells 2019, 200, 109938. [Google Scholar] [CrossRef]
  29. Eberle, R.; Kwapil, W.; Schindler, F.; Schubert, M.C.; Glunz, S.W. Impact of the firing temperature profile on light induced degradation of multicrystalline silicon. Phys. Status Solidi (RRL)–Rapid Res. Lett. 2016, 10, 861–865. [Google Scholar] [CrossRef]
  30. Hammann, B.; Schindler, F.; Schon, J.; Kwapil, W.; Schubert, M.C.; Glunz, S.W. Review on hydrogen in silicon solar cells: From its origin to its detrimental effects. Solar Energy Mater. Sol. Cells 2025, 282, 113432. [Google Scholar]
  31. Ramspeck, K.; Zimmermann, S.; Nagel, H.; Metz, A.; Gassenbauer, Y.; Birkmann, B.; Seidl, A. Light induced degradation of rear passivated mc-Si solar cells. In Proceedings of the 27th European Photovoltaic Solar Energy Conference and Exhibition, Frankfurt, Germany, 24–28 September 2012. [Google Scholar]
  32. Resmi, E.; KSreejith, P.; Kottantharayil, A. Analysis of variation in recombination characteristics due to light and heat in industrial silicon solar cells. Sol. Energy 2023, 252, 127–133. [Google Scholar]
  33. Fokuhl, E.; Naeem, T.; Schmid, A.; Gebhardt, P.; Geipel, T.; Philipp, D. LeTID—A comparison of test methods on module level. In Proceedings of the In 36th European PV Solar Energy Conference and Exhibition, Marseille, France, 9–13 September 2019. [Google Scholar]
  34. Chan, C.; Fung, T.H.; Abbott, M.; Payne, D.; Wenham, A.; Hallam, B.; Chen, R.; Wenham, S. Modulation of Carrier-Induced Defect Kinetics in Multi-Crystalline Silicon PERC Cells Through Dark Annealing. Sol. RRL 2017, 1, 1600028. [Google Scholar] [CrossRef]
  35. Zhang, D.; Yao, Z.; Wu, J.; Jiang, F. Application of current injection to LeTID monitoring in industrial PERC cell production. In Proceedings of the 2020 47th IEEE Photovoltaic Specialists Conference (PVSC), Calgary, AB, Canada, 15 June–21 August 2020. [Google Scholar]
  36. Sperber, D.; Graf, A.; Skorka, D.; Herguth, A.; Hahn, G. Degradation of Surface Passivation on Crystalline Silicon and Its Impact on Light-Induced Degradation Experiments. IEEE J. Photovolt. 2017, 7, 1627–1634. [Google Scholar] [CrossRef]
  37. Choi, D.; Park, H.; Bae, S.; Shin, S.H.; Han, H.; Kloter, B.; Kim, D.; Lee, H.-S.; Kang, Y. Lowering firing temperature of a p-type passivated emitter rear contact Si solar cell via current injection. Sol. Energy Mater. Sol. Cells 2022, 239, 111587. [Google Scholar] [CrossRef]
Figure 1. (a) Comparison of spectral irradiance of AM1.5G and the white LED used in this paper according to wavelength. (b) The process flow of the lifetime sample is used to figure out the hydrogen distribution and degradation.
Energies 18 03090 g001
Figure 2. Degradation comparison between commercial and reference cells in LeTID environment. The change of cell performance parameters over the light soaking time normalized (a) open circuit voltage, (b) short current density, (c) fill factor, and (d) efficiency.
Energies 18 03090 g002
Figure 3. (a) QE value by wavelength before and after degradation. (b) Changes due to QE value degradation for each wavelength range: Short wavelength range (300–500 nm), middle wavelength range (500–800 nm), and long wavelength range (800–1200 nm).
Energies 18 03090 g003
Figure 4. (a) Hydrogen profile of commercial and reference cells before and after degradation. A double anti-reflection layer is located on the front of the cells. The thickness seems to be different. (b) Shift of hydrogen profile for solar cell manufacturing processes by dynamic SIMS. ‘As-received’ and ‘As-cleaned’ samples were shifted to match the thickness of the SiNx film to 80 nm.
Energies 18 03090 g004
Figure 5. (a) The hydrogen profile changes in the SiNx layer. Hydrogen profile (b) before degradation and (c) after degradation.
Energies 18 03090 g005
Figure 6. (a) Apparent defect density of sample with log-scale of x-axis, (b) Absolute lifetime over time (1000 W/m2, 85 °C, 1000 h, MCD = 1 × 1014 cm−3). The apparent defect density of the sample with various MCDs, (c) w/o firing, (d) w/firing, and (e) w/double firing.
Energies 18 03090 g006
Table 1. Changes in QE value depending on applied bias.
Applied Bias (V)00.20.40.50.6
Before
Commercial
39.0139.1935.5126.2615.44
After
Commercial
39.0139.0437.7728.8514.78
Difference0−0.15−2.26−2.59−0.66
Before
Reference
37.4638.6835.6928.7016.85
After
Reference
34.6834.6930.6725.2714.71
Difference−2.78−3.99−5.02−3.43−2.14
Disclaimer/Publisher’s Note: The statements, opinions and data contained in all publications are solely those of the individual author(s) and contributor(s) and not of MDPI and/or the editor(s). MDPI and/or the editor(s) disclaim responsibility for any injury to people or property resulting from any ideas, methods, instructions or products referred to in the content.

