1. Introduction
In the past decade, offshore wind power has expanded significantly around the world. Compared with onshore wind, offshore wind provides several advantages, such as access to larger available installation areas, more stable wind resources, and greater scalability for large-scale projects. These benefits have solidified the role of offshore wind power as a key pillar of national energy transition strategies around the world. In particular, offshore wind is increasingly recognized as a major solution for achieving carbon neutrality, with its installed capacity growing steadily, a trend driven by supportive government policies and rising market demand.
The U.S. Department of Energy (DoE) reports that the global offshore wind capacity exceeded 59 GW by the end of 2022, marking a yearly increase of more than 10% [
1]. The Global Wind Energy Council projects that an additional 380 GW of offshore wind capacity will be installed by 2032 [
2]. In Asia, new offshore wind projects are progressing rapidly, particularly in China, South Korea, and Taiwan, whereas in Europe, developments are expanding from the traditional North Sea cluster to the Baltic and Mediterranean regions [
3]. According to the International Energy Agency, offshore wind will be a leading driver of global renewable energy growth in the coming decade, with the market projected to grow more than three-fold [
4]. Furthermore, Grand View Research estimates that the offshore wind sector will maintain a compound annual growth rate of 7.97% through 2030, driving increased demand for related infrastructure [
5].
This growing trend highlights the critical importance of offshore substations (OSSs) in windfarm development. To integrate offshore wind power into onshore grids, voltage step-up and stable transmission through OSS is essential to maintain grid reliability and efficiency. OSS increases medium-voltage electricity from windfarm turbines to high-voltage levels before it is transmitted to onshore grids via submarine cables. They are typically equipped with transformers, circuit breakers, cooling systems, and control systems. These systems must meet stringent technical and environmental durability requirements because of the harsh marine environment.
The National Renewable Energy Laboratory (NREL) reports that OSS accounts for approximately 15–20% of the total capital expenditure (CAPEX) in offshore wind projects, making them a major cost component that significantly affects both initial investment and operational economics [
6]. NREL further emphasizes that OSS design and placement strategies are critical for minimizing project costs and ensuring stable power transmission [
7]. Key factors such as transformer configuration and capacity, platform design, and submarine cable layout substantially affect system efficiency.
These elements directly influence not only the upfront installation costs but also the long-term operational expenditure (OPEX), system reliability, and failure risk. Therefore, an optimized OSS design strategy that simultaneously considers both economic and technical aspects is essential. Specifically, because of the inaccessibility and extended repair timelines in offshore environments, transformer failures can significantly increase the Expected Energy Not Supplied (EENS). This makes the transformer configuration a critical determinant of the overall profitability of offshore wind projects.
Previous studies on OSS design have primarily focused on enhancing the technical performance of individual components, analyzing equipment reliability, and optimizing platform structures. For instance, Kazmi et al. [
8] analyzed the costs associated with the transformer loading rates and thermal capacity in OSS, and Geißler et al. [
9] proposed structural designs optimized for high-capacity transformers in offshore environments. Yoon et al. [
10] evaluated suitable transformer capacities for domestic offshore wind sites, and Sun et al. [
11] conducted a reliability and economic evaluation of offshore wind power collection systems by integrating transformer failure probability and power loss into a probabilistic assessment framework. However, most of these studies lack a quantitative trade-off analysis between economic feasibility and reliability, particularly concerning transformer capacity and quantity. In addition, comprehensive economic evaluations integrating EENS with operation and maintenance (O&M) costs remain underexplored.
This study performs a lifecycle economic assessment by defining key design variables, such as offshore windfarm capacity, transmission distance, number of substations, number of transformers per substation, and transformer capacity ratios. The evaluation framework integrates multiple cost factors, including equipment failure probability, repair time, unit installation cost, transmission losses, EENS, and O&M costs.
To ensure comprehensive optimization, the analysis incorporates realistic engineering constraints, including topside structural mass limits, transformer rating thresholds, and cable ampacity bounds. A key trade-off analyzed in this study lies in the balance between increased capital expenditure—caused by adding more transformers and substations—and the resulting benefits in system reliability and supply security. Specifically, additional transformers reduce EENS under failure scenarios, while a higher number of substations can decrease transmission losses and reduce cable costs over long distances.
This study proposes an optimization framework that evaluates these trade-offs quantitatively, identifying the most cost-effective number of transformers and capacity ratios per substation while validating the economic feasibility of configuration strategies under realistic constraints.
To ensure the clarity and focus of the proposed framework, this study concentrates exclusively on HVAC-based offshore substation configurations, which represent the most prevalent topology in current deployments. While High-Voltage Direct Current (HVDC) transmission can offer cost and efficiency advantages in large-scale offshore wind farms—particularly when transmission distances exceed 150–200 km—it was excluded from this analysis. HVAC remains widely adopted in projects with moderate transmission distances or decentralized grid connections, due to its simpler system integration, mature infrastructure, and compatibility with existing onshore grids [
12]. Future work may extend the proposed framework to hybrid or HVDC-based substation systems, enabling broader applicability across diverse offshore wind scenarios.
2. Overview of Offshore Substation Configuration and Deployment
2.1. Configuration of Offshore Windfarms
The configuration of offshore windfarms depends on the total capacity and spatial layout.
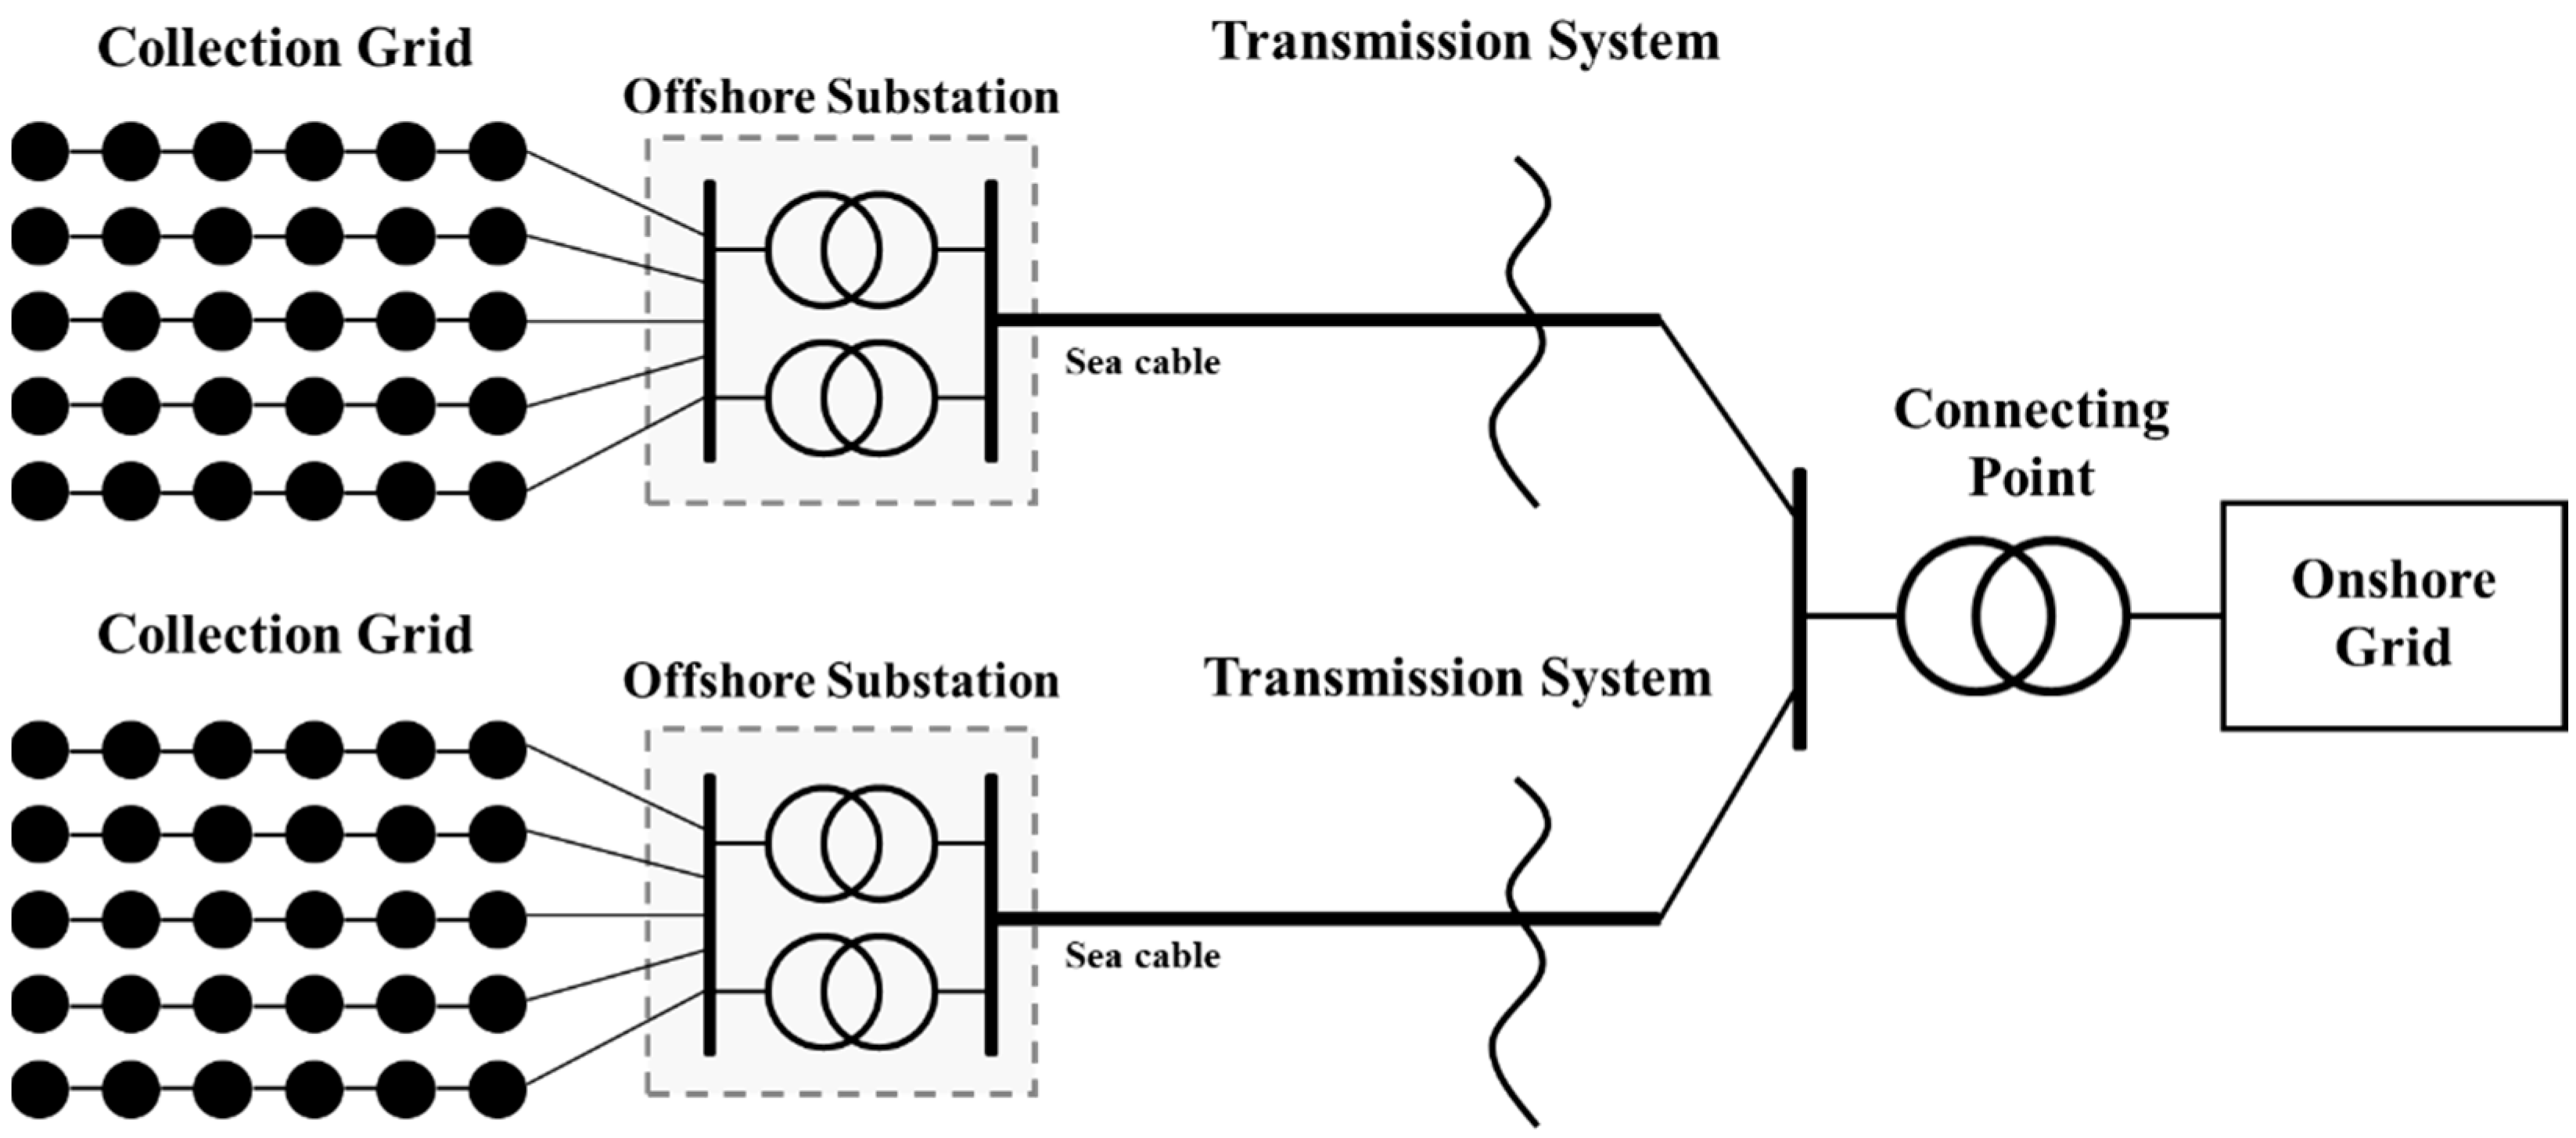
Figure 1 illustrates a typical offshore windfarm comprising multiple wind turbines and two OSSs. In general, an offshore windfarm consists of three main components: an internal collection grid interconnecting wind turbines, an OSS for voltage step-up, and an external transmission network that delivers power from the OSS to the onshore grid connection point [
13].
The collection grid aggregates the power generated by individual wind turbines within the offshore windfarm—typically at 33 kV or 66 kV—and channels it via submarine cables to the OSS. The OSS increases the voltage to approximately 220 kV, making it suitable for long-distance transmission. The high-voltage power is then transmitted through the external transmission network via submarine cables to the onshore grid connection point, where it is integrated into the onshore power system for distribution to end users.
As offshore windfarms expand in scale, their internal power networks and electrical equipment also increase. Large-scale projects often employ multiple OSSs operating in parallel to minimize power losses and enhance reliability during equipment failures. Therefore, optimizing the number and internal configuration of substations is essential to ensure the economic viability and operational reliability of offshore wind power systems.
2.2. Configuration and Components of the Offshore Substations
As previously mentioned, OSSs are critical infrastructure in offshore windfarms, and they are responsible for aggregating, stepping up, and transmitting power to the onshore grid. They integrate high-voltage electrical equipment with structural support systems.
Figure 2 shows the configuration and internal layout of the OSS.
Figure 2a shows a typical structural layout, while
Figure 2b illustrates the internal equipment arrangement of the Kriegers Flak OSS [
14]. Although OSSs are structurally complex systems, this study focuses on evaluating the technical and economic characteristics of key components associated with windfarm capacity.
The major components of OSSs include transformers, high-voltage switchgear, shunt reactors, control and monitoring systems, and structural elements (e.g., topside, substructure, and foundation). Each component significantly impacts the overall cost-effectiveness of the substation.
Transformers increase the medium voltage generated by wind turbines to high-voltage levels suitable for long-distance transmission via export cables. The number and primary capacity of transformers determine the substation capacity and redundancy. However, increasing the number of transformers leads to nonlinear growth in the topside weight, along with additional cooling and control systems, ultimately increasing CAPEX.
High-voltage switchgear protects the system by isolating faults. Expanding the number of transformers proportionally increases the switchgear requirements, requiring more topside space and increasing both the design complexity and OPEX.
Shunt reactors are essential for suppressing the reactive power generated by long-distance subsea cables and maintaining voltage stability. Their size and rating depend on the cable parameters and distance.
The control and monitoring systems manage the real-time operation of the electrical equipment. Adding more components amplifies system complexity and data management demands.
The topside supports all major electrical components and grows heavier as the number and capacity of transformers increase, thereby increasing manufacturing, transportation, and installation costs. The substructure (typically a jacket or monopile foundation) is fixed to the seabed and supports the topside. Its design and cost depend on topside weight and environmental conditions.
2.3. Representative Deployment Cases
With the rapid growth in offshore wind development, numerous OSSs have been deployed globally, providing insights into common design practices and configuration trends.
Table 1 summarizes the representative cases of OSS installations [
15,
16]. Most projects employ one or two transformers, with installed capacities typically ranging from 100% to 130% of the windfarm’s total capacity. This margin ensures transmission continuity during transformer failure and provides sufficient redundancy.
Previous studies have proposed several approaches to optimize offshore substation configurations. Robak and Raczowski [
14] outlined key design considerations for offshore wind electrical infrastructure, including platform structures, equipment layouts, and maintenance requirements. Henderson [
17] quantitatively analyzed the trade-off between asset redundancy and investment cost, and proposed strategies for improving the reliability of offshore electrical systems. Zhang et al. [
18] developed a mixed-integer nonlinear programming model to optimize substation configuration and cable layout, aiming to minimize both transmission losses and installation costs while accounting for the trade-off between the number of substations and system complexity.
These studies indicate that OSS configurations must balance multiple factors, such as CAPEX, reliability, and operational performance. However, previous studies often focused on individual components, neglecting a comprehensive optimization framework that simultaneously considers Ed CAPEX, OPEX, and EENS.
To address this gap, this study establishes a range of substation and transformer configuration combinations, evaluating their lifecycle economic performance by incorporating CAPEX, OPEX, and EENS. This approach identifies optimal configurations based on windfarm capacity, transmission distance, and transformer redundancy ratios while quantitatively assessing the impact of key design parameters on the overall cost structure.
3. Proposed Optimization Methodology for Offshore Substation Design
This section presents a design methodology for optimizing the OSS transformer capacity and configuration through economic evaluation. The proposed approach integrates multiple cost components influenced by key design parameters, such as the total windfarm capacity, transmission distance, number of OSSs, number of transformers per substation, and individual transformer capacity ratios.
The evaluation framework comprises three major cost categories. First, CAPEX includes procurement and installation costs for transformers, offshore platforms, shunt reactors, and subsea cables, along with associated logistics and marine operations. Second, the OPEX comprises periodic maintenance costs and energy loss due to transmission inefficiencies, which vary with the OSS units and system configuration. Third, EENS represents the revenue loss caused by transformer failures, estimated using failure probabilities and average repair time.
All cost components are calculated over a 20-year project lifetime via the Net Present Value (NPV) method to enable comparative cost assessment. Scenario-based simulations evaluate various transformer quantity and capacity combinations, quantifying trade-offs between system reliability and economic performance. By integrating failure risks and operational efficiency, the proposed framework enhances conventional rule-based designs, enabling more resilient and cost-effective substation configurations. All simulations were performed using MATLAB (2023a) and Microsoft Excel and the parameters used are summarized in
Table A1 in the
Appendix A.
3.1. Evaluation of CAPEX Based on the Offshore Substation Configuration
CAPEX for OSSs constitutes the largest portion of the total lifecycle cost (LCC) and is typically determined during early design stages. Offshore wind projects are high-cost, high-risk investments, where CAPEX directly influences economic feasibility and project viability. Therefore, a thorough assessment of the cost components and influencing factors during the initial substation design phases is essential.
In this study, CAPEX was divided into key components: power transformers, offshore platforms, shunt reactors, submarine cables, and transportation costs. Each component was scaled linearly or nonlinearly depending on the design variables.
3.1.1. Offshore Power Transformer
In OSSs, power transformers are critical for stable power transmission, significantly influencing the overall system design and economic feasibility. The CAPEX for a transformer includes not only the purchase cost but also the installation cost, cooling/protection systems, and interconnection with other components. These costs vary substantially with transformer capacity and quantity. In offshore environments, where stringent constraints are given to offshore environments, optimizing transformer configurations economically is imperative.
Based on the regression analysis of various industrial reports and technical literature [
19,
20,
21,
22,
23], the cost of an offshore power transformer is modeled as follows:
where
denotes the cost of a single transformer (k€), and
is the transformer capacity (MVA). However, in practical OSS designs, increasing the number of transformers increases the costs associated with the platform area, auxiliary systems (e.g., cooling), structural reinforcement, and construction complexity. Hence, a simple linear summation of unit costs may underestimate total investment. To address this, a cost adjustment factor reflecting auxiliary cost escalation is applied:
Here,
represents the total transformer cost (k€),
is the number of transformers,
is the total substation capacity (MVA), and
is the multiplier reflecting auxiliary cost increases due to multiple units. Previous studies [
24,
25,
26,
27] document that auxiliary-system expenses on offshore substations rise with transformer count, and AACE RP 18R-97 recommends installation costs of 10–20% for electrical machinery; based on these findings, we conservatively adopt
for the 2–4 unit configurations studied. Configurations exceeding four units may require nonlinear adjustments to account for platform rearrangement and structural reinforcement.
Moreover, an increase in transformer capacity or quantity proportionally affects the total system weight, directly impacting the structural cost of the offshore platform due to stringent weight constraints in marine installations. The transformer loss was scaled with the rated capacity raised to 0.75th power under fixed design and material assumptions based on the U.S. DoE [
28]. Transformer losses primarily comprise no-load and load losses, which are dependent on electrical steel mass and copper conductor volume, respectively. Consequently, core materials such as steel and copper increase with capacity, as does the required oil volume and structural framing.
As summarized in
Table 2, electrical steel and copper account for approximately 56% of the total transformer weight, while transformer oil and structural steel comprise an additional 38%. The overall transformer weight is estimated as follows:
where
denotes the transformer weight (tonnes),
is the reference transformer weight, and
is its rated capacity. This study employs a 300 MVA, 230–115 kV transformer weighing 330 tonnes, reported by the U.S. DoE, as the reference model [
29].
In practice, 220 kV offshore transformers are generally available in a wide capacity range between 30 and 600 MVA, as reported by industry and academic sources. To ensure practical applicability, the proposed model considers the same capacity range for analysis.
3.1.2. Shunt Reactor
The shunt reactor is a critical component installed in parallel at OSSs to compensate for the charging reactive power generated by submarine cables in offshore windfarms. In the cable sections connecting to the onshore grid, issues such as voltage rise and excessive reactive power due to charging current can occur. If these effects are not properly mitigated, they can reduce system stability and cause equipment overloading.
Typically, reactive power compensation is considered when the cable utilization drops below 85% (i.e., when reactive power reaches approximately 15% of the transmitted power rating) [
30]. The charging current generated by a submarine cable can be calculated as a function of transmission distance and voltage as follows:
where
is the charging current (A),
is the system frequency (Hz),
is the cable capacitance (F/km),
is the cable length (km), and
is the line-to-ground voltage (V). The corresponding charging reactive power is defined as follows:
where
is the charging reactive power (Mvar). Consequently, the reactive power reduces the effective active power transfer capacity of the cable. Based on the international literature [
31], the unit cost of reactive power compensation was assumed to be 0.031 (MUSD/Mvar) in this study.
Shunt reactors, which are commonly used as compensation devices, are structurally similar to power transformers, but feature simplified configurations, typically lacking tap changers and using basic core/winding configurations. The weight was estimated to be approximately two–thirds that of a transformer with equivalent power ratings. This weighting factor was adopted in this study to evaluate platform structural impacts [
12].
3.1.3. Offshore Platform
As previously discussed, offshore platforms are essential infrastructures for transmitting electricity from offshore windfarms to onshore grids. Given its marine installation, selecting an appropriate substructure is crucial. Typically, the platform type is determined by water depth: fixed structures are used in depths up to 60 m, and floating structures are used in deeper waters.
A 2022 industry report indicates that approximately 99% of global offshore windfarms still employ fixed-bottom platforms, as floating solutions remain in early-stage development. Fixed structures are categorized into gravity-based, monopile, jacket, and tripod types, depending on the seabed conditions and depth, with jacket-type platforms being the most common for depths between 30 and 60 m.
In this study, a water depth of 40 m is assumed, with the substructure modeled as a jacket-type foundation. The cost of a jacket structure depends on the topside load and water depth. This study employs the empirical formulas proposed by DNV to quantitatively estimate the costs of each component. The cost of the topside, jacket, and foundation structures is calculated as follows [
32]:
where
,
, and
represent the cost (MUSD) of the topside, jacket, and foundation, respectively.
To quantify the offshore platform costs, this study utilizes empirical models derived from industry data and reported by DNV. These formulas enable cost estimation of major structural components as a function of topside weight and water depth, providing practical applicability in early-stage conceptual design.
The topside cost, , is modeled to increase linearly with the topside weight , as heavier equipment and structures require greater fabrication and installation efforts. The jacket structure cost, , also depends on the jacket weight , which is indirectly influenced by both the topside mass and water depth. Equation (7) provides an empirical relationship for the jacket weight based on these parameters. Furthermore, the foundation or pile cost, , includes the base installation and anchoring cost, which scales with the combined weight of topside and jacket structures. The nonlinear exponent in Equation (9) reflects the disproportionate cost increase with larger, heavier structures in deeper water conditions.
These models, though simplified, have been validated against North Sea project benchmarks and are suitable for preliminary techno-economic analysis. Their inclusion in this study allows for scenario-based simulations that incorporate key physical constraints such as transformer quantity, structural redundancy, and site-specific depth conditions.
The topside structure, which accommodates and protects the major electrical components, is typically made of reinforced steel and is closely related to the total weight of the installed equipment. During the early design stage, the topside weight structure was assumed to be approximately equal to the weight of the electrical equipment. This assumption simplifies the design and allows a proportional estimation of the structural impacts based on the equipment weight. As system capacity increases, equipment size and quantity increase, elevating topside weight nonlinearly and amplifying substructure and foundation design complexity.
In most projects, the topside is preassembled onshore and lifted onto the jacket foundation using a heavy lift vessel. In this process, the total topside weight is a critical parameter that influences the installation strategy and design specifications. For example, the topside of the Hornsea Project One OSS weighed approximately 3000 tonnes, the Kriegers Flak HVAC substation weighed approximately 3300 tonnes, and the Veja Mate substation weighed approximately 3200 tonnes. These values provide a practical reference for estimating the typical topside weight range of HVAC-based OSSs. These weight ranges reflect a comprehensive consideration of the lifting capacity, offshore stability, and structural safety margins.
Increasing the topside weight introduces challenges such as hook height limitations, sling arrangement, and dynamic stability, often necessitating split-lift operations instead of single-lift installation [
32,
33]. These complexities increase installation risks and costs. In addition, standards DNV-ST-0145 [
34] emphasize that heavier topside weights concentrate stress on jacket structures, reducing fatigue life and requiring enhanced structural analysis and reinforcement. Heavier topsides also heighten weather sensitivity, narrowing installation windows, and increasing the risk of project delays.
To mitigate these issues, this study limits the topside weight to approximately 4000 tonnes per HVAC substation platform, ensuring feasible and reliable design and installation. This threshold aligns with industry benchmarks and validates the economic analysis.
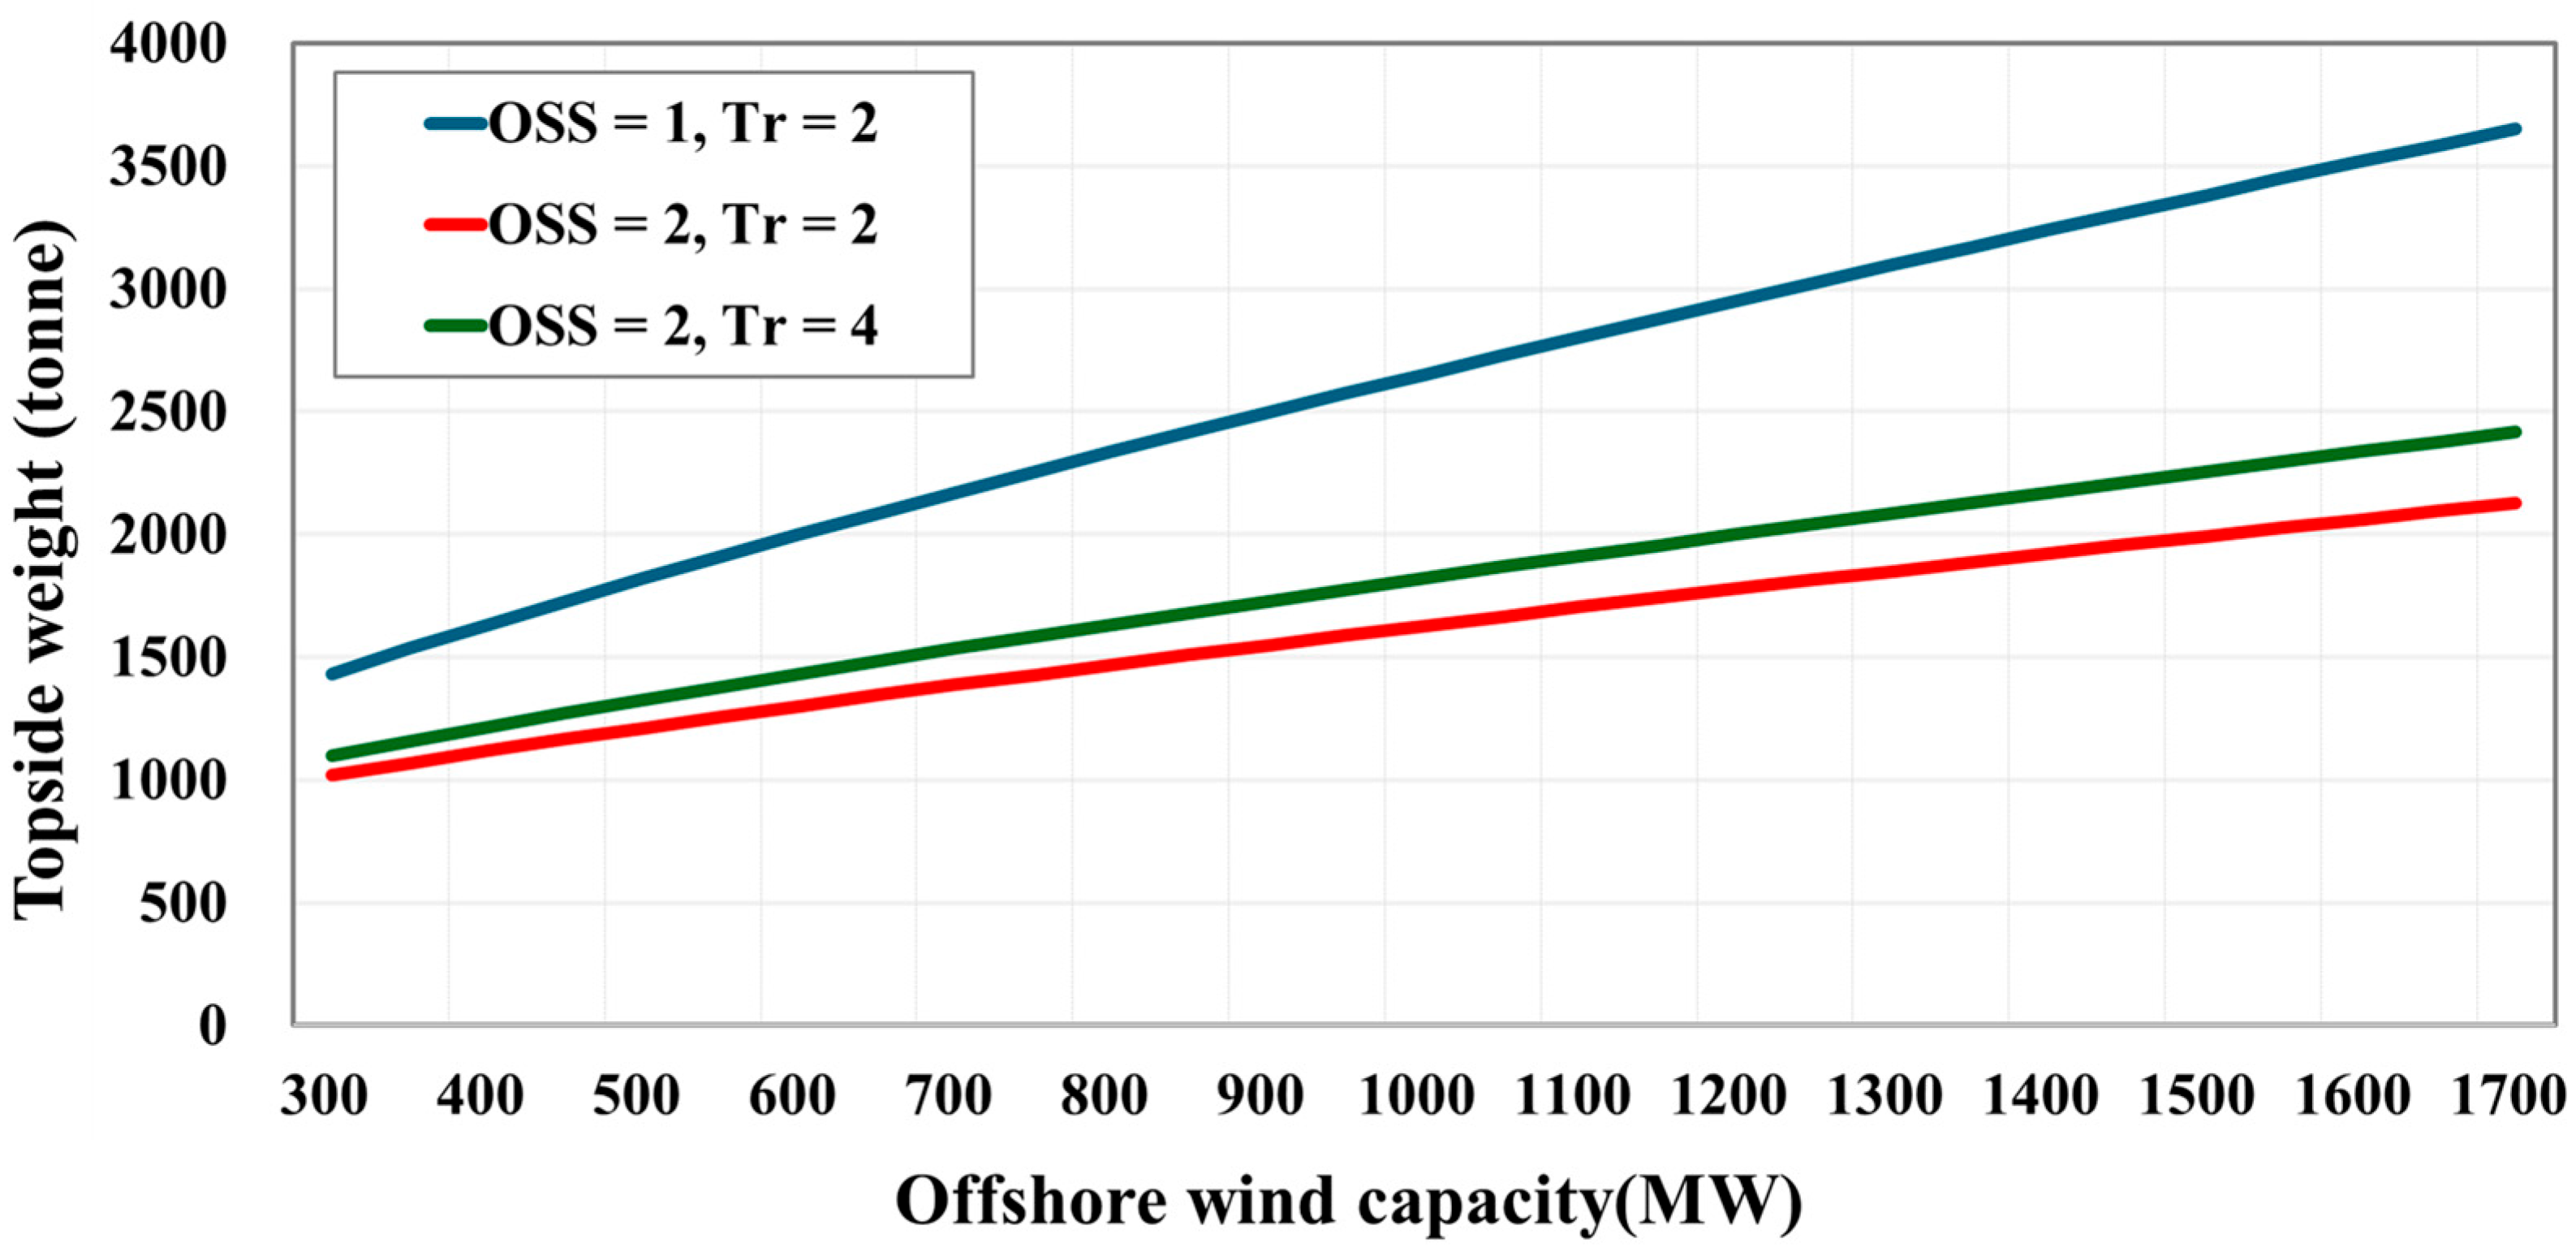
Figure 3 presents the estimated topside weights for different configurations based on the OSS and transformer quantities.
Deploying a single OSS results in a significant increase in topside weight, exceeding 3500 tonnes for a 1700 MW configuration. In contrast, distributing the capacity across two OSS units achieves a more moderate weight increase. Increasing the number of transformers while maintaining two OSS platforms leads to a gradual increase in the topside weight.
3.1.4. Subsea Cable
Subsea cables are essential components for transmitting electricity from offshore windfarms to onshore grids. The investment cost depends on parameters such as the cable length, cross-sectional area, rated current, voltage level, and number of cable circuits. In this study, four transmission distance scenarios were considered (50, 100, 150, and 200 km) to assess cable investment costs from OSSs to the onshore grid.
The selected cable was an HVAC subsea cable with a nominal voltage of 220 kV and a cross-sectional area of 1000 mm
2. The detailed electrical characteristics are summarized in
Table 3.
The number of cables required is based on the transmission capacity of the OSS. Typically, the thermal limits of the insulation material, which dictate the cable’s rated current, determine the maximum allowable capacity. This is because the heat generated from the resistive losses in the cable must be kept within safe limits to prevent insulation failure.
The current for each substation is calculated using the following equation:
where,
is the substation current (A),
is the windfarm capacity (MW),
is the number of OSSs, and
is the power factor (0.95). Based on this current, the required number of parallel cable circuits
can be estimated as follows:
The rated current of the cable,
, is 942 A. Based on this, the total cost of the submarine cables can be calculated as follows:
where
is the unit cost per kilometer of the cable. This approach enables quantitative analysis of the impact of transmission distance, system capacity, and the number of OSSs on the total investment cost of submarine cables.
3.2. Evaluation of the OPEX Based on the Offshore Substation Configuration
The OPEX of OSSs represents recurring costs throughout the project lifecycle, directly affecting the long-term economic viability of offshore wind projects. Unlike CAPEX, OPEX arises continuously during operations such as equipment maintenance, inspections, and repairs. These costs can vary significantly based on the operational strategy and system configuration.
In this study, OSS OPEX is categorized into two components: (i) The O&M cost of the transformers and associated equipment depends on the system configuration, inspection intervals, and failure rates. (ii) The transmission loss costs in submarine cables are determined by the transmission distance, load current, and number of parallel circuits. The energy losses are converted into monetary values to reflect their economic impact.
Assuming a 20-year operational lifespan for an offshore wind project, the total OPEX incurred over this period is converted into an NPV to quantitatively evaluate its economic implications.
3.2.1. O&M Cost
The O&M cost of offshore wind projects is one of the most significant long-term expenses throughout their lifecycle. OSS O&M costs include not only the inspection and maintenance of key components such as transformers, circuit breakers, cooling systems, and communication equipment but also the vessel operating costs required to access offshore platforms. In particular, harsh offshore environments lead to higher operational costs than onshore facilities due to limited accessibility, weather-related delays, and prolonged repair durations. According to the Guide to Offshore Windfarm, the annual OSS O&M costs for fixed-bottom offshore wind projects is approximately GBP 75,000 per MW [
35,
36].
In this study, the OSS O&M costs were categorized into three components: vessel operating cost, substation structure maintenance cost, and power system maintenance cost. Vessel operating costs refer to the expenses for accessing, inspecting, and conducting emergency repairs for OSSs. As the number of substations increases, the number of inspection and repair targets also increases, leading to additional costs. Therefore, a 50% increase in vessel operating costs is assumed for each additional OSS.
The structural maintenance cost of the substations includes the inspection and repair of the topsides and jacket structures supporting the electrical equipment. These costs scale proportionally with the number and capacity of the OSSs. The maintenance cost of the power system is determined by the number of transformers. Annual maintenance costs per transformer are calculated separately and aggregated based on the total number of units.
The total annual O&M cost of the OSS system is calculated using the following equation:
where
is the total O&M cost,
is the vessel operating cost,
is the substation structure O&M cost,
is the power system maintenance cost, and
is the number of transformers.
These costs were calculated on the basis of the itemized cost structure presented in the Guide to an Offshore Windfarm, with each component derived from the proportion of CAPEX allocated to balance-of-plant maintenance.
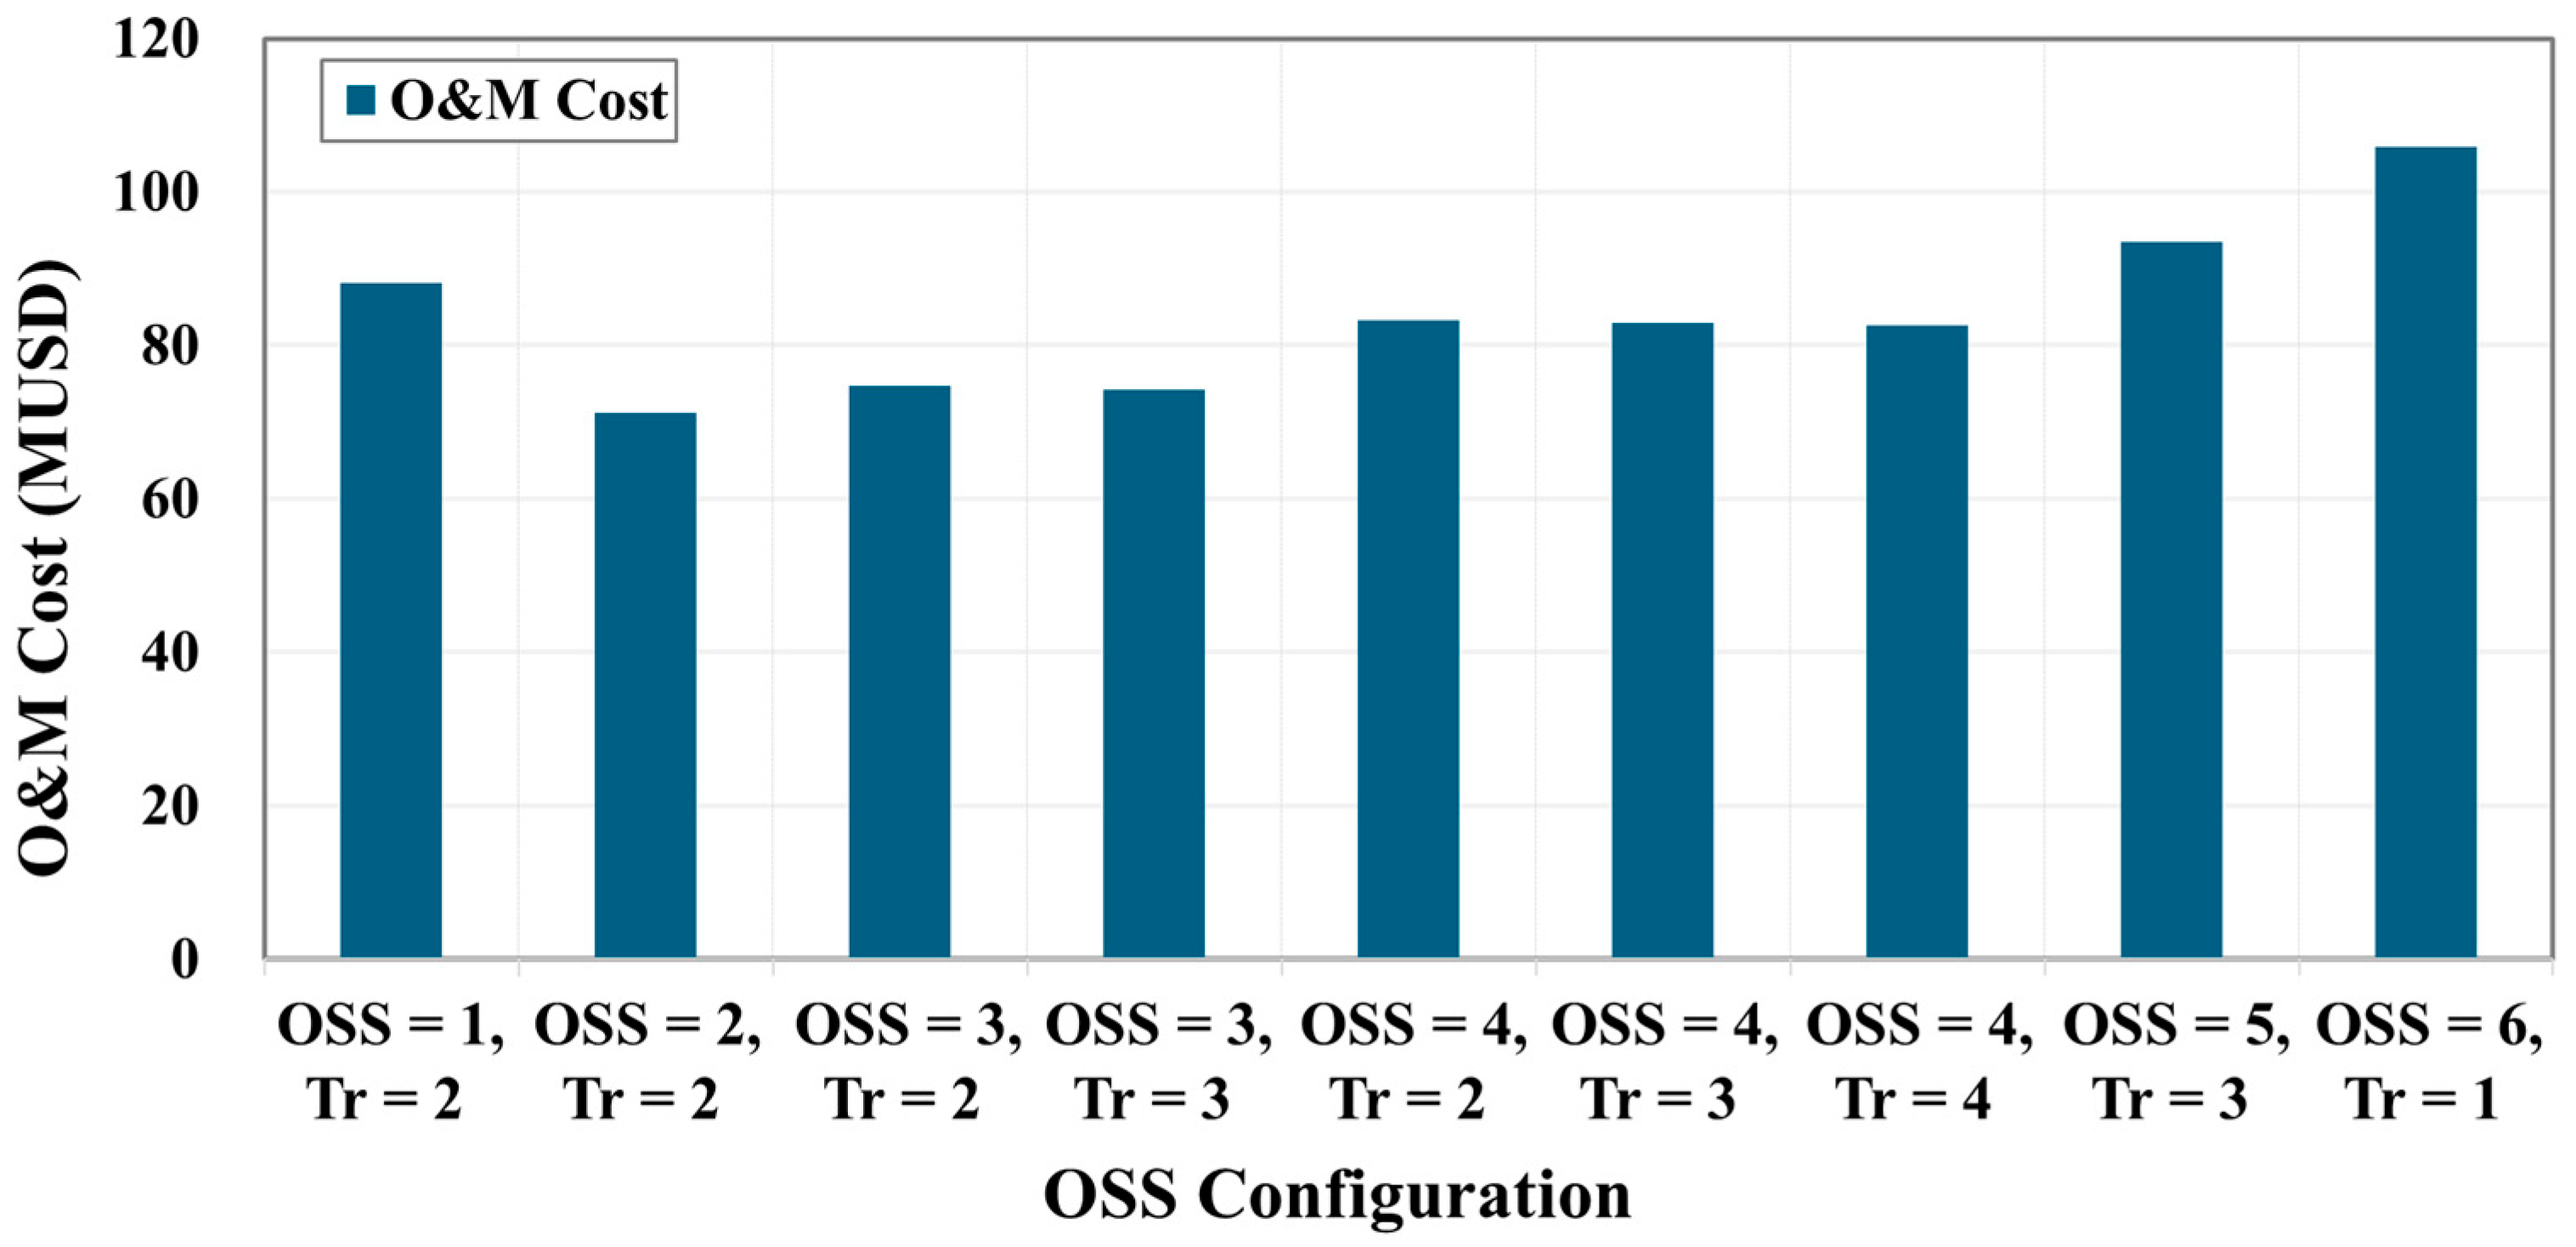
Figure 4 presents the annual O&M cost for a 1000 MW offshore windfarm, according to the number of OSSs and transformers per substation. The O&M costs vary depending on the number of substations and transformers. For a single OSS with two transformers, the vessel operation cost remains relatively low, but the O&M cost associated with the substation structure and transformers is relatively high because of their proportional dependence on capacity. As the number of OSS increases, the total O&M cost also increases.
3.2.2. Cable Loss
Cable loss results primarily from the heat generated by the resistance of the cable as the electric current flows through it. This type of loss, also known as resistive or
loss, is proportional to the square of the current, cable resistance, and transmission distance. The power loss can be expressed as follows:
where
is the power loss (MW),
is the cable resistance per kilometer (Ω/km),
is the transmission distance (km),
is the substation current (A), and
is the number of cable circuits.
To convert this power loss into an economic cost, the offshore wind energy utilization rate, energy sales price, and project lifetime are considered. The annual cable loss cost is calculated as follows [
30]:
where
is the annual cost of transmission losses,
is the offshore wind utilization rate (assumed to be 0.4), and
is the offshore electricity sale price. In this study,
is set to 0.00012 MUSD/MWh, which corresponds to 155 KRW/kWh—the average industrial electricity sales price in Korea [
37]. As electricity prices can vary across countries and time periods, this parameter is intended as a reference value and can be adjusted for different regional applications.
3.3. Evaluation of the Expected Energy Not Supplied
In the economic assessment of offshore wind power systems, the EENS quantifies energy losses caused by power supply interruptions due to equipment reliability and availability issues. EENS estimates the expected energy undelivered over a specific period, accounting for power outages from equipment failures, maintenance delays, and adverse weather conditions.
Offshore windfarms face harsher environmental conditions and limited accessibility than onshore systems, leading to longer repair times and higher EENS values. In particular, transformer failures in OSSs can significantly affect power transmission across the entire windfarm, making transformer reliability and availability critical parameters in EENS evaluation [
38,
39].
EENS is generally calculated using the following equation:
where
is the rated power of the windfarm (MW), and
is the annual unavailability duration of the equipment (h/year). The resulting EENS value is converted into an economic loss by multiplying it by the energy price, which directly affects the project’s economics.
EENS is widely used for reliability evaluation of offshore wind systems. For example, Bala et al. analyzed EENS across various offshore wind collection network configurations to assess the impact of system architecture on overall reliability in their study presented at the IEEE PEMWA conference [
40]. Comprehensive surveys have addressed maintenance strategies in offshore wind systems using EENS [
38]. In this study, EENS was calculated based on the number of transformers in the OSS, their failure rate, and average repair time. The unavailability of each transformer is defined as follows [
41]:
where
is the annual unavailability of a transformer,
is the average failure rate (failures/year), and MTTR is the mean time to repair (hours). According to operational data and probabilistic studies, transformer failure rates in offshore wind farms typically range between 0.02 and 0.042 failures per year, depending on wind farm capacity, environmental conditions, and site accessibility [
42,
43]. In line with conservative design practices and consistent with industry-reported values, this study adopts a failure rate of 0.02 failures/year and a mean time to repair (MTTR) of 2160 h (approximately 90 days) as suggested in [
42].
Assuming sequential transformer failures, the unavailable capacity was estimated based on the number of transformers and their capacities. If the remaining available capacity falls below the windfarm capacity, the shortage is calculated as the unavailable power.
As observed in many commercial offshore wind projects, the total transformer capacity is typically configured to be 100–130% of the rated transmission capacity. To account for the partial operation capability during failures, this study simulates various transformer overcapacity scenarios (up to 170%). Increasing the number of transformers reduces the impact of a single failure on the overall power delivery, significantly reducing EENS.
The annual unavailable capacity is calculated as follows:
where
is the annual unavailable power (MW),
is the number of transformers,
is the windfarm capacity, and
is the capacity of each transformer. If the remaining available capacity falls below the windfarm requirement, the shortfall is counted as unavailable power and accumulated across all failure scenarios.
Finally, the annual cost of not supplied energy is calculated as follows:
where
represents the supply disruption cost (MUSD/year). This cost is highly sensitive to the number of transformers, transformer overcapacity, and repair duration.
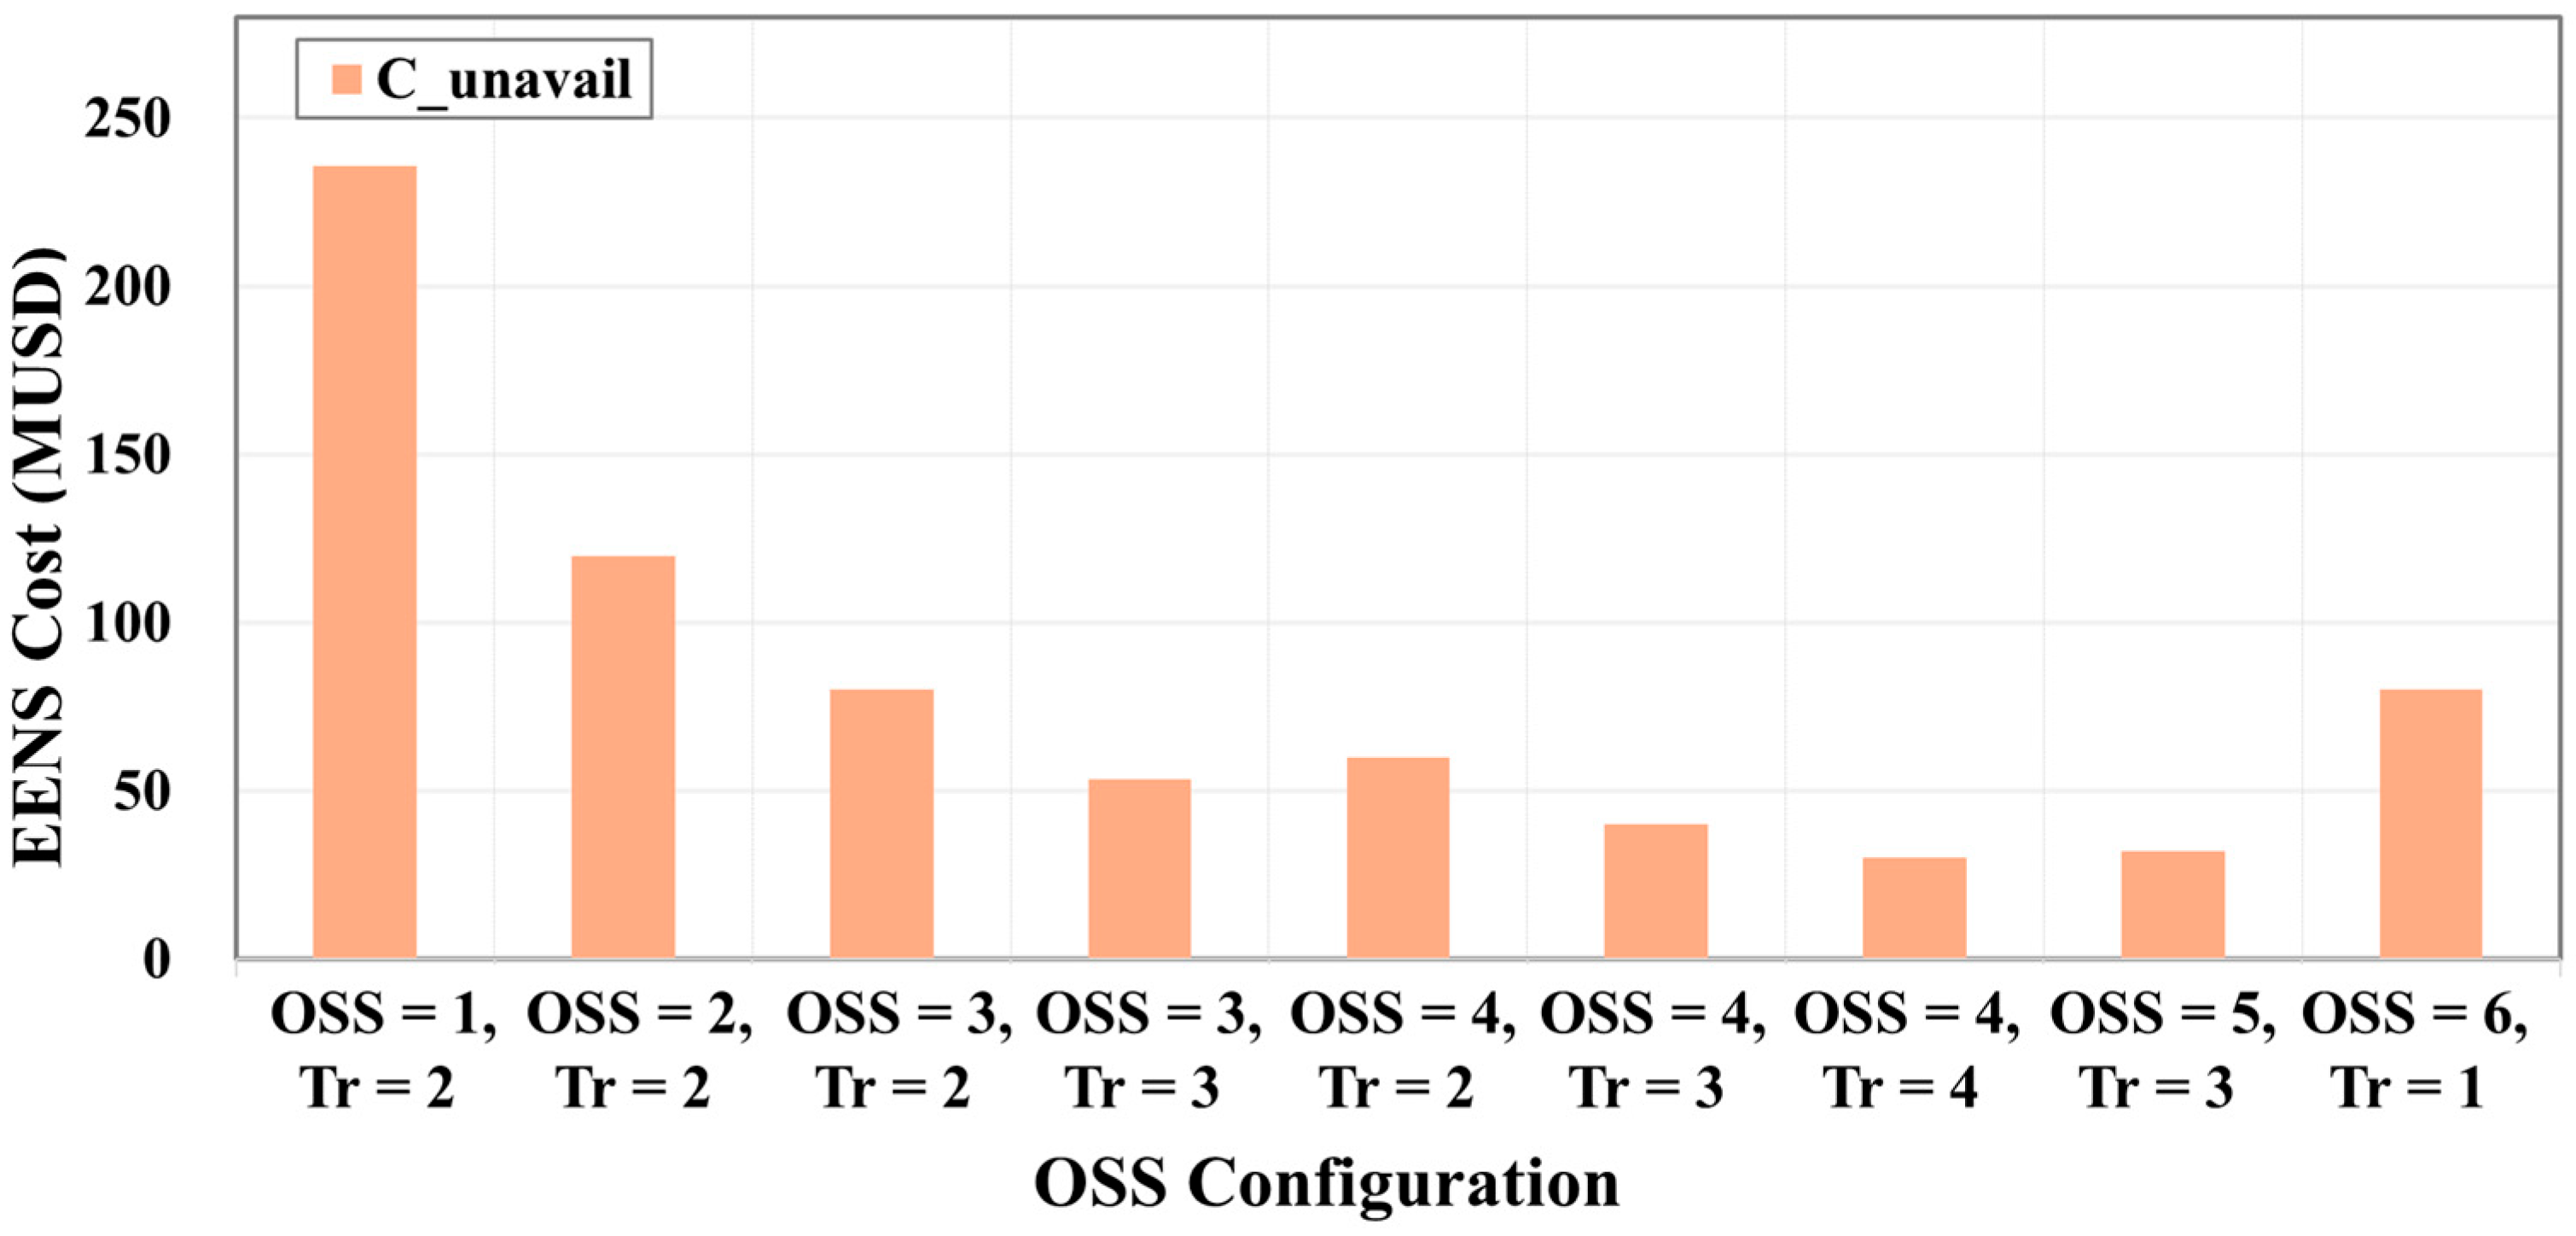
Figure 5 illustrates the calculated EENS costs for a 1000 MW offshore windfarm based on different configurations of the OSS count and the number of transformers per OSS. The results demonstrate that increasing the number of OSSs and transformers significantly reduces EENS cost because of the improved system reliability and redundancy. This highlights the importance of considering repair delays in harsh offshore environments when designing OSSs.
4. Economic Analysis-Based Optimization of the Offshore Substation Configuration
As offshore windfarms scale up in capacity and transmission distances increase, the configuration of OSSs becomes a critical factor influencing overall project economics. Specifically, design parameters such as the number of substations, transformers per substation, and transformer overcapacity ratio have a complex impact on CAPEX, OPEX, and EENS due to transformer failures.
This study performs a quantitative economic analysis of various OSS configurations to identify the optimal design combination that minimizes the total LCCs. Based on realistic configuration scenarios, the analysis evaluates the full cost structure under the following conditions:
Windfarm capacity: 500–3000 MW (in 500 MW increments)
Transmission distance: 50–200 km (in 50 km increments)
Substation transformer overcapacity ratio: 100–170%
Number of OSSs: 1–8
Number of transformers per substation: 1–4
The total cost structure of the OSS system varies significantly based on the configuration of key variables. In particular, increasing the number of transformers significantly reduced EENS costs. For each scenario, the investment, operating, and supply disruption costs were calculated, and the trade-offs among these cost components were quantitatively assessed.
Specifically, increasing the number of transformers and the overcapacity ratio increased both CAPEX and OPEX. However, this configuration improves system reliability and significantly reduces EENS, thereby reducing the total LCCs. Conversely, increasing the number of substations disperses the same number of transformers across multiple platforms, thus reducing the topside structures, jacket fabrication, and installation costs. In addition, more substations enable more parallel submarine cable circuits, thereby reducing transmission losses and the associated economic impacts. Thus, optimizing OSS configurations requires balancing not only individual cost factors but also their synergistic interactions.
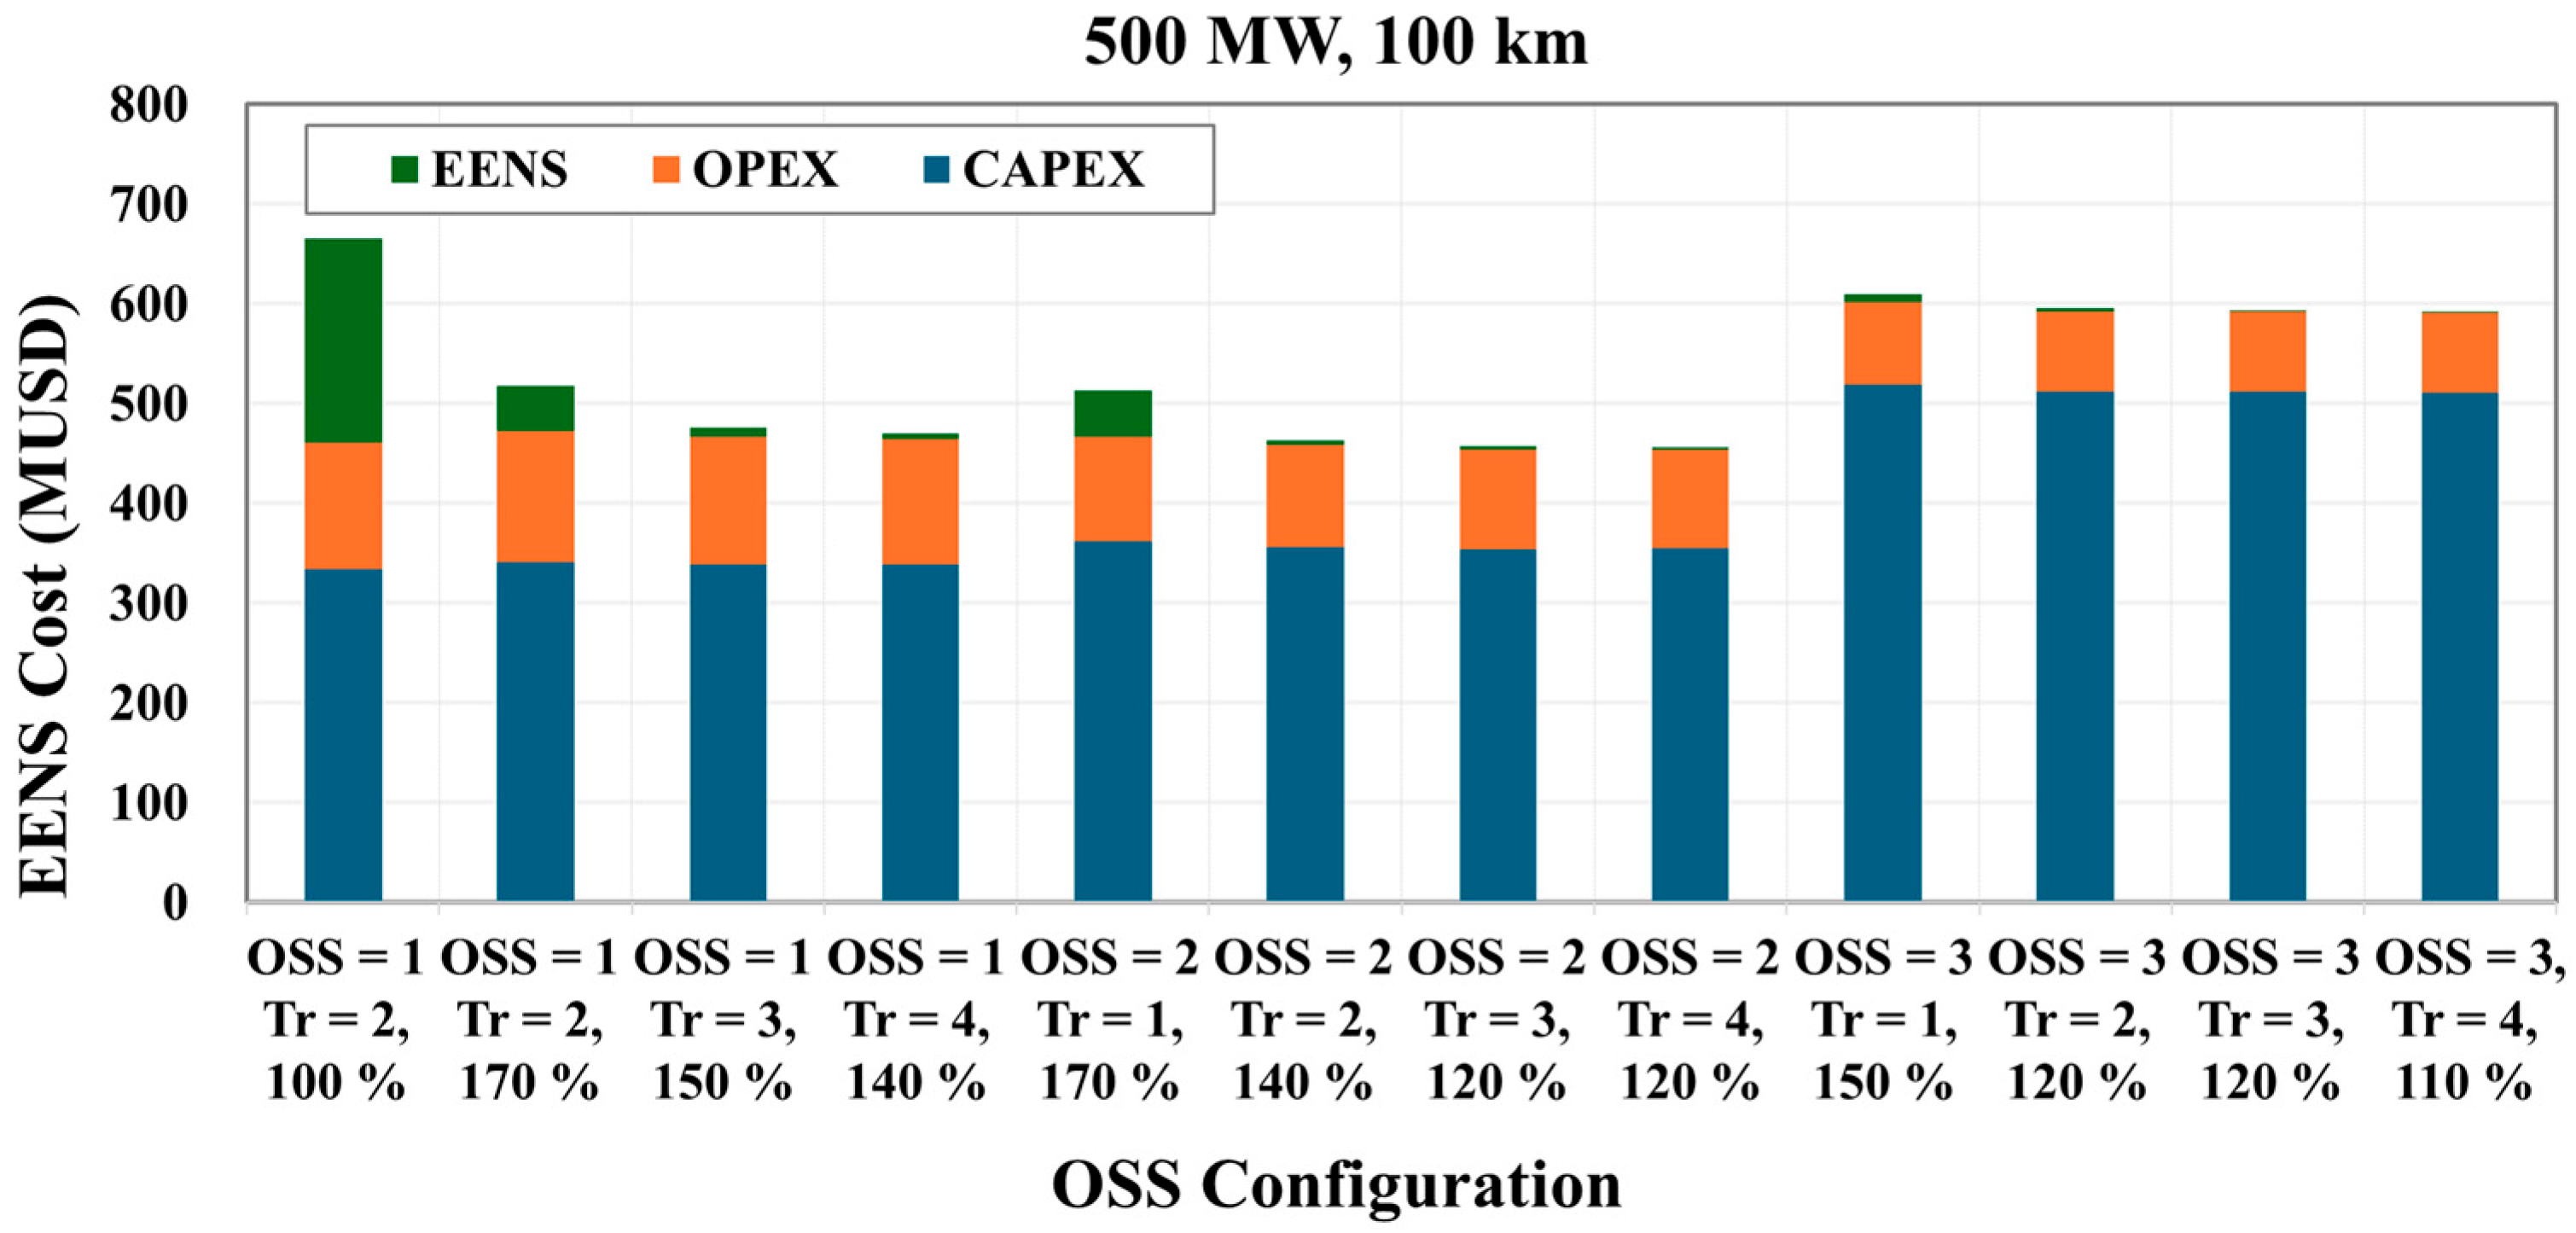
For a 500 MW offshore windfarm with a 100 km transmission distance,
Figure 6 presents the total cost results—including CAPEX, OPEX, and EENS—according to various configurations of OSSs and transformers (Tr) per substation. As illustrated, configurations with a single transformer exhibited significantly higher EENS, indicating low system reliability due to a lack of redundancy. As the number of transformers increases, EENS decreases sharply and becomes negligible beyond a certain threshold. Conversely, CAPEX and OPEX gradually increase due to the increased investment and maintenance costs associated with additional equipment.
The most cost-effective configuration for this scenario was obtained with two OSSs equipped with three transformers each and a 120% capacity redundancy. This configuration minimizes the total LCCs by ensuring optimal trade-offs among investment, operational costs, and supply reliability. These results demonstrate that even for moderate-capacity offshore windfarms, appropriate configuration substations and transformers can achieve both economic efficiency and system reliability.
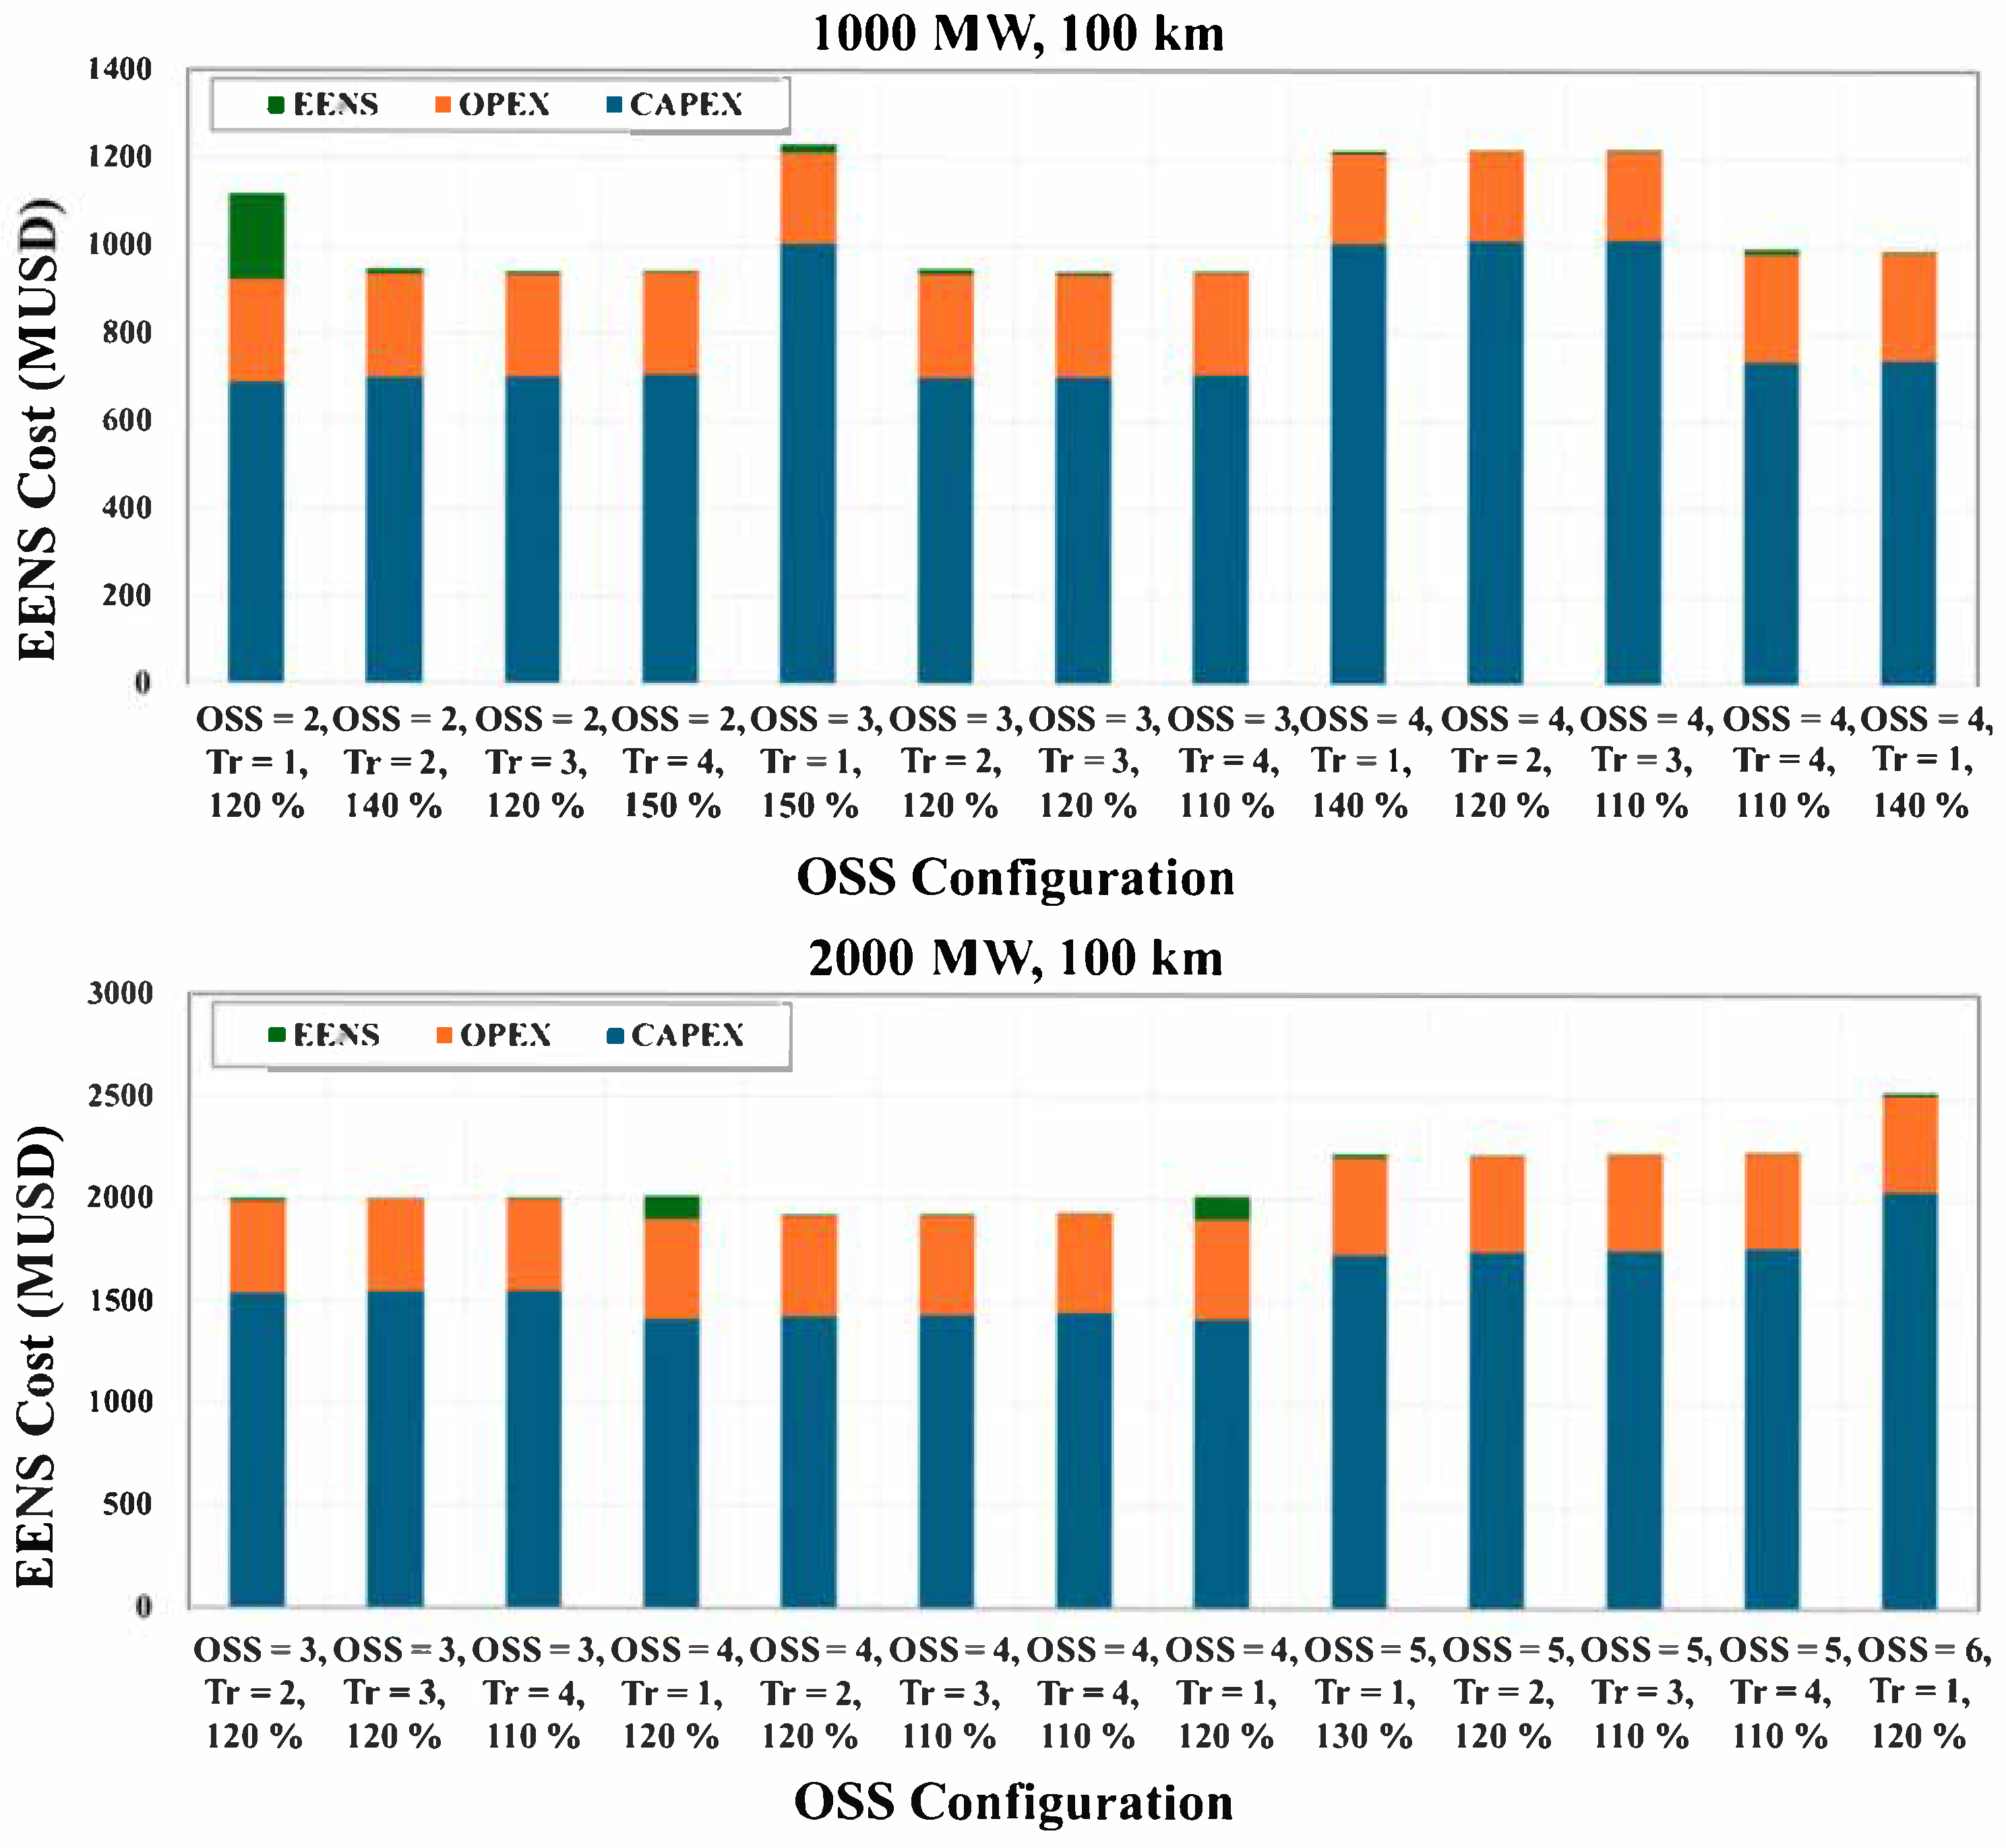
Figure 7 illustrates the total cost of various OSS configurations for windfarm capacities of 1000 and 2000 MW. For the 1000 MW case, the most economical configuration was two substations with three transformers each. In the scenario with two substations and only one transformer per substation, the EENS costs were high; however, as the number of transformers increased, the total costs decreased. However, when four transformers were installed, the increase in CAPEX and OPEX outweighed the marginal benefit from the reduced EENS, thereby diminishing the cost-effectiveness. Furthermore, the configuration with three substations incurred a higher cost than the four-substation setups, which were constrained by submarine cable capacity limits.
For the 2000 MW case, the most economical configuration was obtained with four substations, each equipped with two transformers. As the windfarm capacity increases, the transmission losses and EENS risks due to transformer failures become more significant. The load distribution across additional substations improved long-term economic performance. Although increasing the number of substations increases initial investment costs, the resulting reductions in losses and EENS costs offset these increases, leading to a more cost-effective configuration.
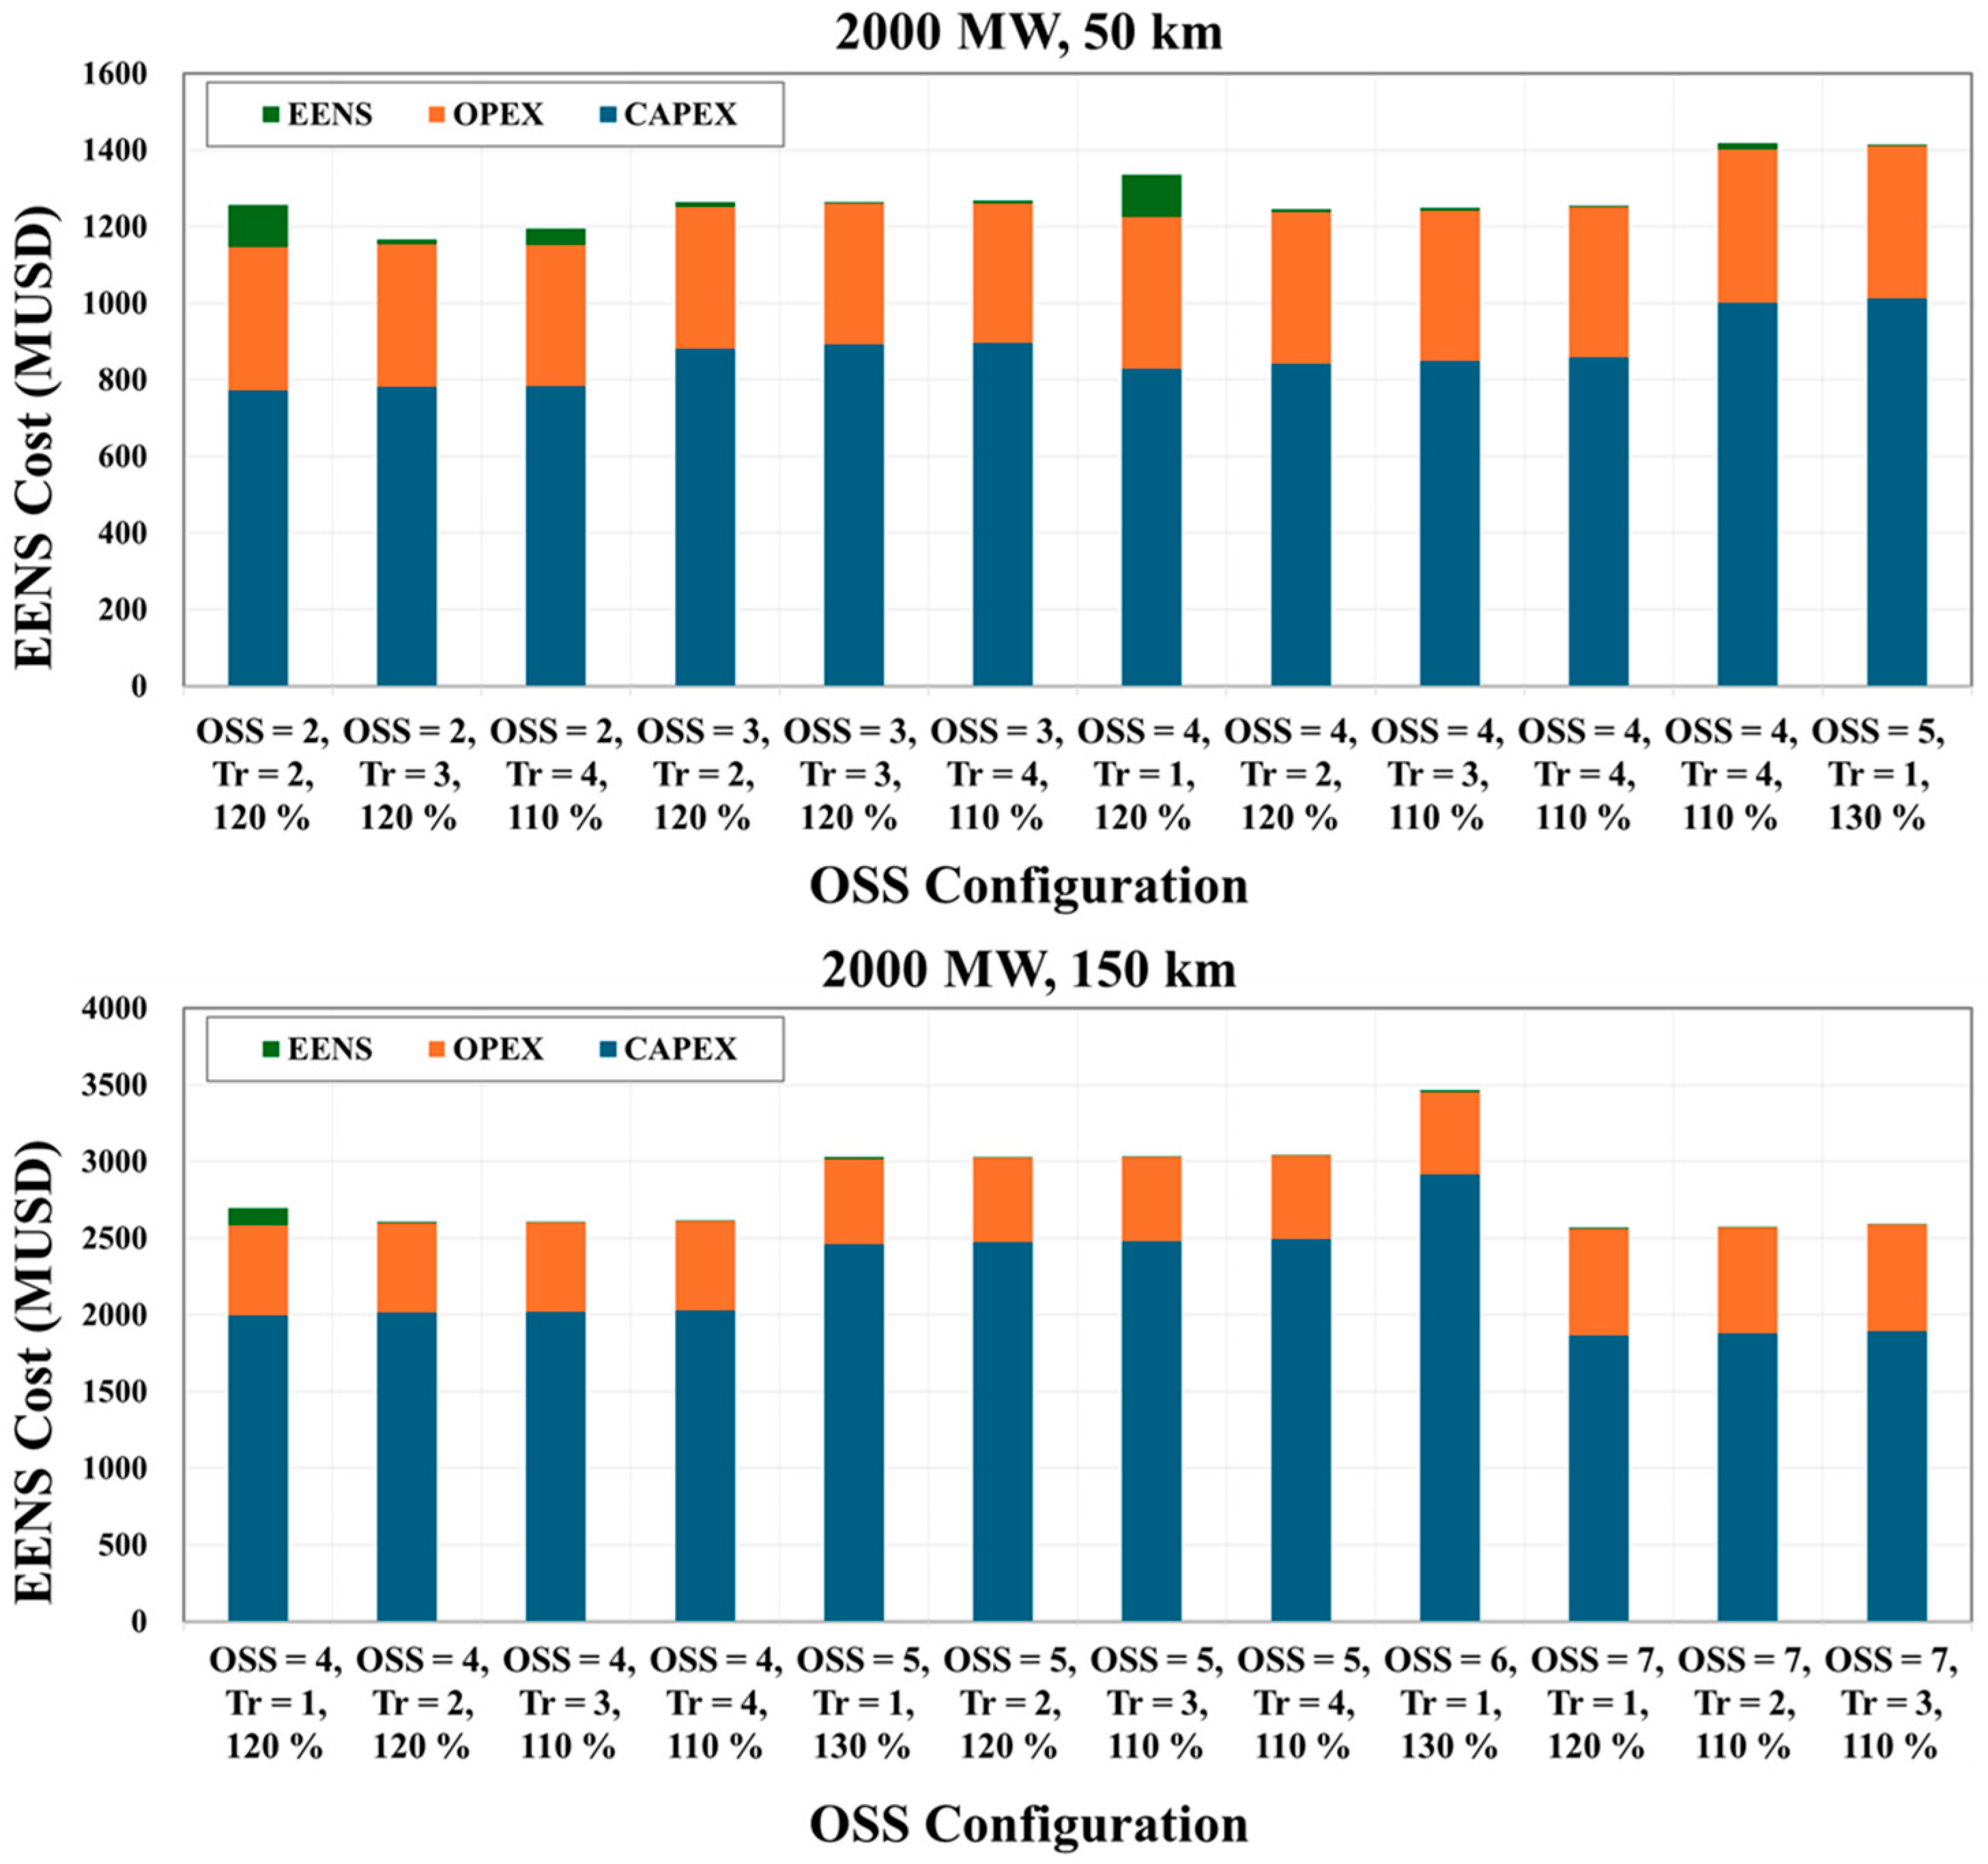
Figure 8 presents the optimal OSS configurations for a 2000 MW offshore windfarm, comparing two transmission distances: 50 and 150 km. When the transmission distance is relatively short (50 km), the most cost-effective configuration is two OSSs, each equipped with three transformers. This approach reduces initial investment costs by minimizing the number of substations while maximizing the number of transformers per substation.
In contrast, for longer transmission distances (150 km), transmission losses and cable-related costs have a significant impact. In this case, the distribution capacity across several OSSs was the most economical configuration. This approach avoids exceeding the rated current limit of submarine cables while minimizing the total number of cables required.
Figure 9 presents a comprehensive analysis of the total minimum cost and corresponding optimal OSS configurations across varying wind farm capacities and transmission distances. In
Figure 9a, the surface plot visualizes the total minimum cost, which includes CAPEX, OPEX, and EENS components, under each scenario. The cost increases with both capacity and distance, with a notably steeper gradient observed in high-capacity and long-distance scenarios. In particular, projects exceeding 2000 MW and 150 km in transmission distance exhibit a nonlinear cost increase, primarily due to elevated cable investment and transmission losses.
Figure 9b displays the optimal number of OSSs and the number of transformers per substation derived from the configuration analysis. For wind farm capacities ranging from 500 MW to 1000 MW, the optimal configuration remains relatively consistent regardless of distance, typically consisting of one or two substations with four transformers per OSS. However, for capacities of 1500 MW and above, the optimal number of substations increases with transmission distance. When the transmission distance exceeds 150 km at capacities of 2000 MW or higher, the cost advantage shifts toward configurations with a greater number of OSSs, which effectively reduce cable length, avoid transformer overload, and mitigate EENS risk. These results highlight the importance of jointly considering system capacity and distance when determining the most cost-effective OSS layout.
These findings indicate that in large-scale offshore windfarms, the optimal combination of substation and transformer varies considerably. For shorter transmission distances, configurations with fewer substations and more transformers per platform effectively reduce initial investment costs. However, as the distance increases, distributing the load across more substations becomes more economical for suppressing transmission losses.
Therefore, OSS design necessitates an integrated optimization approach that accounts for the interactions among windfarm capacity, transmission distance, transmission losses, supply reliability, and capital expenditures.
Table 4 summarizes the optimal OSS configurations derived from the economic analysis.
5. Conclusions
This study proposes a cost-minimization strategy for the optimal configuration of OSSs in response to the growing scale of offshore windfarms and extended transmission distances. Unlike previous research that focused primarily on aggregated cost estimation, this study offers a detailed evaluation by disaggregating cost components and integrating technical constraints.
To accurately assess CAPEX, transformer costs, transformer weights, the associated increase in topside structural weight, and jacket foundation costs were calculated. The topside weight was dynamically modeled based on transformer quantity and redundancy levels, while design constraints, such as the topside weight and transformer capacity, were incorporated using parameters derived from actual OSS projects.
For OPEX, this study independently evaluated substation operation, inspection costs, and vessel operating expenses. The analysis accounted for nonlinear changes in the inspection intervals and maintenance costs as the number of substations and transformers varied. The OPEX was quantified using a ratio based on the CAPEX, accounting for the increased maintenance complexity due to the addition of more transformers.
The EENS was estimated based on the transformer failure rates, capacities, and substation configurations. The economic loss from unserved energy due to transformer failures was simulated across varying redundancy levels, enabling the analysis of the trade-off between increased redundancy and reduced supply disruption risks.
The optimization results indicate that for lower-capacity windfarms, minimizing the number of substations and transformers yields the most cost-effective configuration, with the transmission distance having a negligible impact. In contrast, high-capacity projects, particularly those with long-distance transmission, achieve greater long-term cost efficiency by distributing substations to reduce unit load, thereby mitigating cable costs, transmission losses, and EENS risks. This study demonstrates that an integrated optimization approach—encompassing CAPEX, OPEX, and supply disruption costs—is essential for the economic design of OSS and verifies the proposed methodology’s effectiveness through scenario-based simulations.
While this study identifies key variables and conducts an economic evaluation to determine optimal OSS configurations, several parameters—such as transformer failure rates, repair times, and O&M costs—were based on industry-average values. In practice, transformer failure rates may increase over time as equipment ages, repair times can vary significantly with marine conditions, and O&M or installation costs are dependent on environmental and grid-specific factors. Future research will address these limitations by integrating probabilistic failure models over the asset lifecycle and simulating real-world offshore environments to develop a more robust and practical optimization framework.
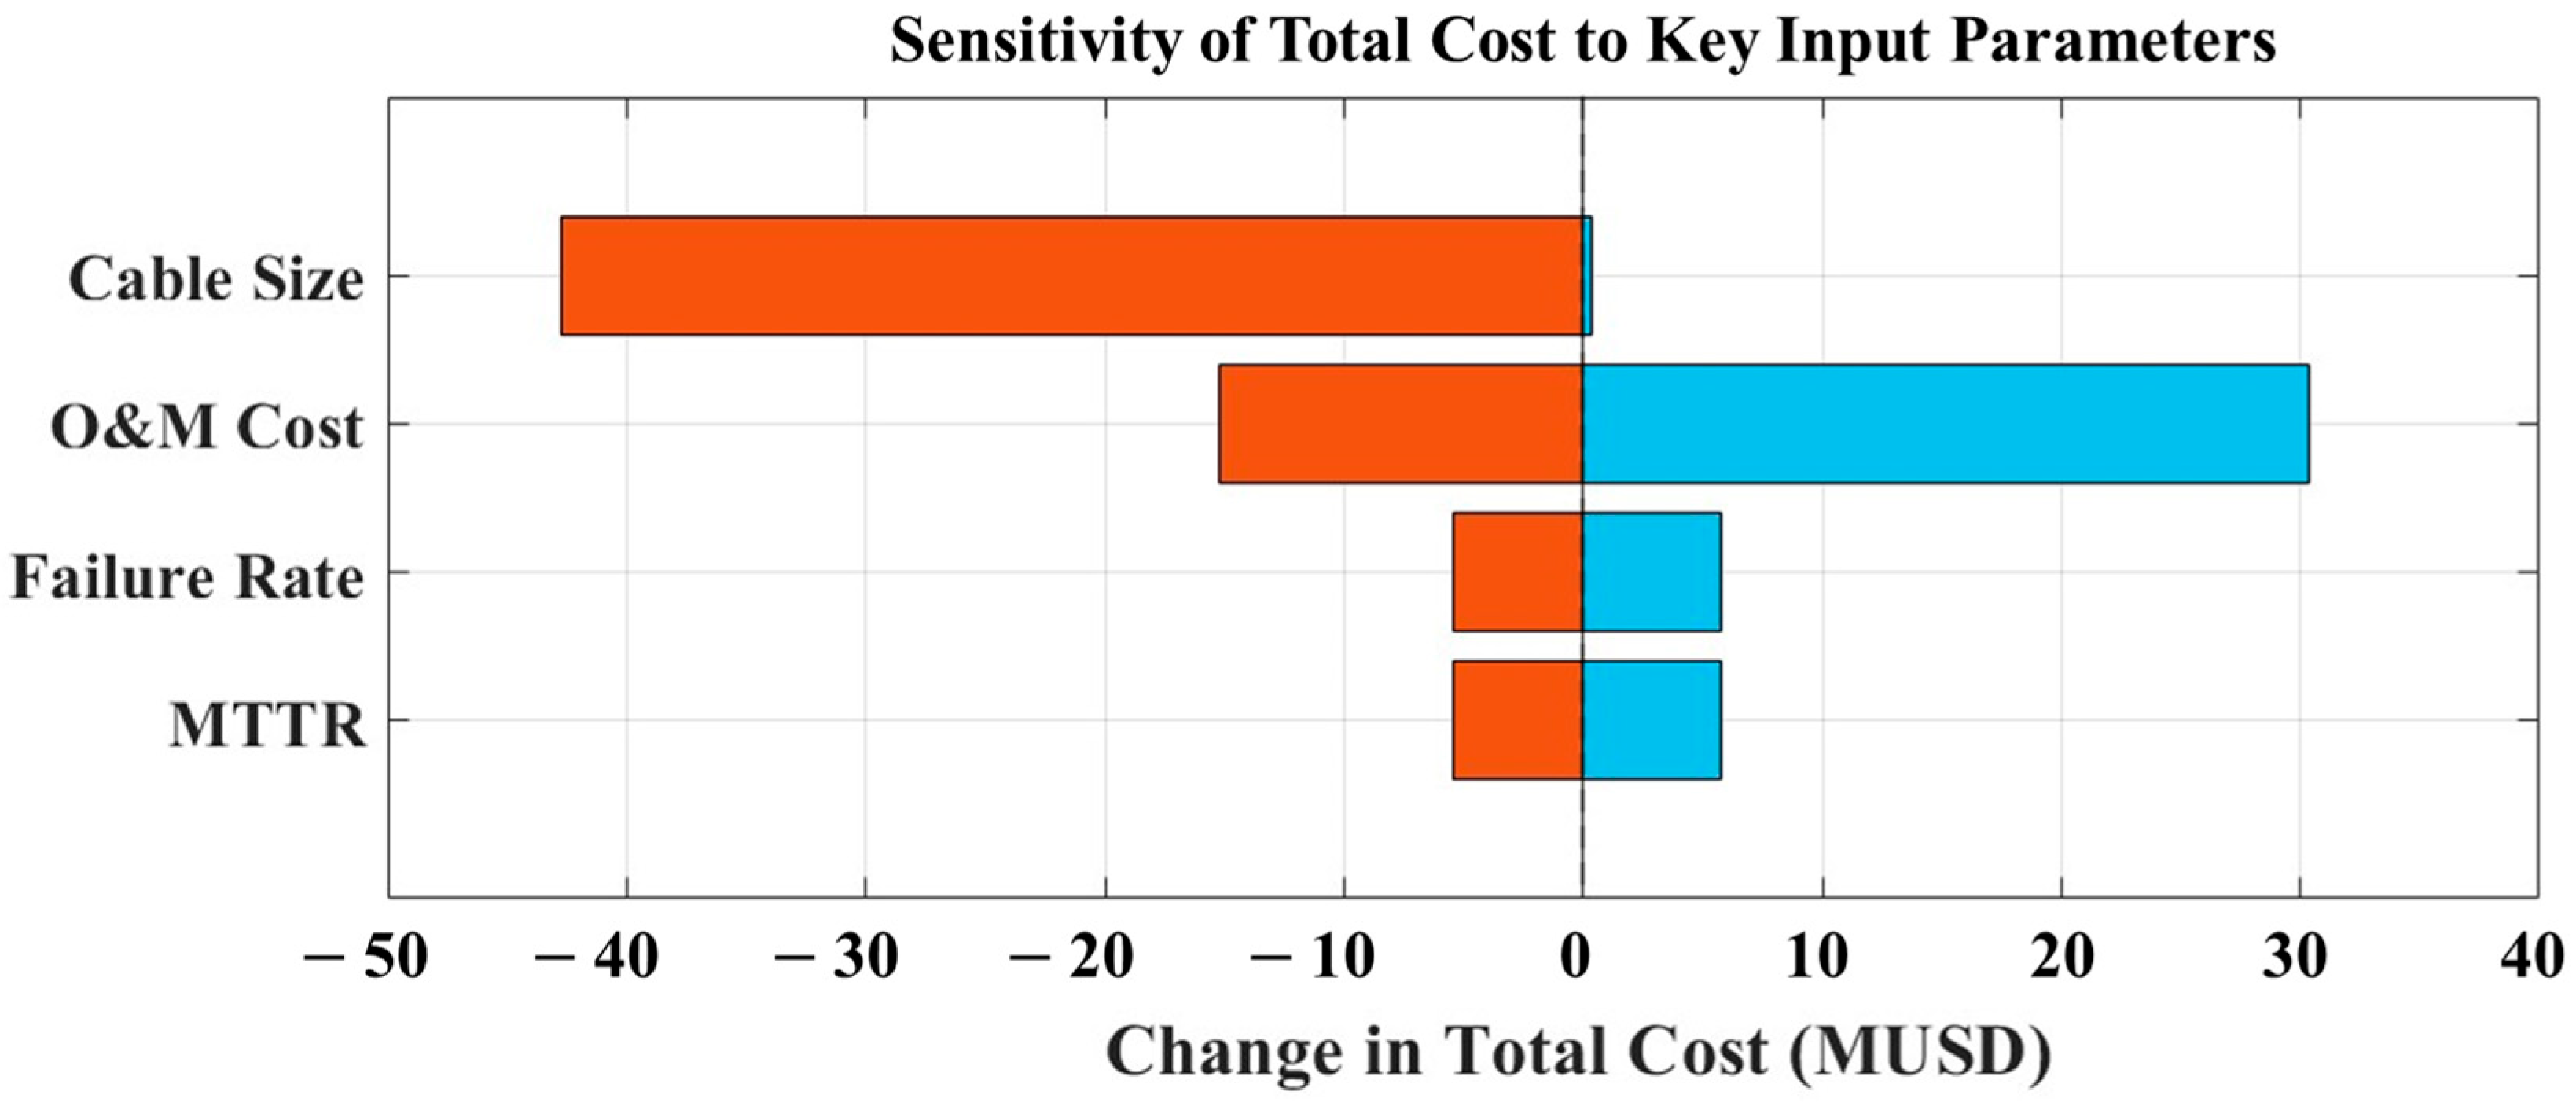
These assumptions can influence the simulation results; for instance, higher O&M costs may discourage configurations with multiple substations or transformers, while increased failure rates or prolonged repair times may favor more redundant configurations to reduce EENS. Accordingly, sensitivity-based validation of these parameters will be considered in future studies. In addition, a sensitivity analysis was conducted to assess the relative impact of key input parameters on the total cost. This analysis focused on a representative case of a 1000 MW offshore wind farm located 100 km from shore. As shown in
Figure 10, cable size exhibited the greatest influence on the total cost, followed by O&M cost, failure rate, and MTTR. However, the overall variation in total cost remained within a narrow margin of approximately 1–4% from the base scenario. This indicates that while certain parameters have a more pronounced impact, the overall optimization framework remains relatively robust under parameter uncertainty. Future studies will incorporate more comprehensive sensitivity analyses using high-resolution input data and probabilistic models to enhance the accuracy and reliability of the proposed configuration methodology.


