Article

Fuzzy-Based Fitness–Distance Balance Snow Ablation Optimizer Algorithm for Optimal Generation Planning in Power Systems

1
Department of Electrical and Energy, Tosya Vocational School, Kastamonu University, 37302 Kastamonu, Turkey
2
Department of Electrical Engineering, Faculty of Engineering and Natural Sciences, Bandirma Onyedi Eylul University, 10200 Bandirma, Turkey
3
Postgraduate Education Institute, Bandirma Onyedi Eylül University, 10200 Bandirma, Turkey
4
Department of Electrical and Electronics Engineering, Faculty of Engineering, Duzce University, 81620 Duzce, Turkey
5
Department of Electrical and Energy, Amasya Technical Sciences Vocational School, Amasya University, 05000 Amasya, Turkey
6
Department of Electrical and Energy, Akdagmadeni Vocational School, Yozgat Bozok University, 66100 Yozgat, Turkey
*
Author to whom correspondence should be addressed.
Energies 2025, 18(12), 3048; https://doi.org/10.3390/en18123048
Submission received: 21 April 2025 / Revised: 4 June 2025 / Accepted: 6 June 2025 / Published: 9 June 2025

Abstract

Economic dispatch (ED) is one of the most important problems in terms of energy planning, management, and operation in power systems. This study presents a snow ablation optimizer (SAO) algorithm developed with the fuzzy-based fitness–distance balance (FFDB) method for solving ED problems in small-, medium- and large-scale electric power systems and determining the optimal operating values of fossil fuel thermal generation units. The FFDB-based SAO algorithm (FFDBSAO) controls early convergence problems through balancing exploration–exploitation and improves the solving of high-dimensional optimization problems. In the light of extensive experimental studies conducted on CEC2020, CEC2022, and classical benchmark test functions, the FFDBSAO2 algorithm has shown superior performance against its competitors. Wilcoxon and Friedman’s statistical analysis results confirm the performance and efficiency of the algorithm. Moreover, the proposed algorithm significantly reduces total fuel cost by optimizing fossil fuel thermal generation units. According to the results, the scalability and robustness of the algorithm make it a valuable tool for solving large-scale optimization problems in the planning of electric power systems.

1. Introduction

The increasing global demand for electricity has rendered energy resource management imperative. The demand for energy arises from the growth of industry, population growth, and the integration of new technologies. Power plants depend on fossil fuels to meet demand and significantly threaten the environment by leading to pollution. Both researchers and energy planners are focusing on ways to generate cost-effective electricity while causing the least damage to the environment. One of the leading problem’s studied in energy planning is the economic dispatch (ED) problem, which attempts to solve the distribution of allocated power generation in an optimal and economically efficient way while simultaneously fulfilling the entire electricity demand. The ultimate goal of ED is to find the best and most cost-effective allocation of production resources for generating units to meet the demand. However, all functional restrictions, including production limits of generators, system dependability, and other operational constraints, must be considered [1].
The economic dispatch (ED) problem requires considering various important physical and operational constraints to show how power generation works properly. Even though early models chose quadratic or piecewise quadratic functions for costs, assuming a smoothly rising curve, today’s evidence shows that real systems are much more complicated [2]. The valve-point effect (VPE) is an important constraint since it causes the cost curves to be rippled because of the physical properties of steam valves in fossil fuel plants. The result is cost functions that are not smooth and are thus far more difficult to optimize. Another important constraint is the prohibited operating zones (POZs), which are power output ranges that must not be exceeded. In addition, having multiple-fuel (MF) options means it is challenging to solve the ED problem, as the generators can switch between types that vary in their cost and efficiency. The result is that the piecewise cost function has segments where it is not convex. Lastly, ramp-rate (RR) limits keep the equipment healthy and the system stable by limiting how fast a generator can increase or decrease its output. In this context, the aforementioned practical constraints of ED create a complicated nonlinear and non-convex problem that must be solved [3].
To date, researchers have proposed various innovative methods for solving ED problems, including classical methods and metaheuristics approaches. Classical methods have historically resolved the economic dispatch (ED) problem by offering analytical and computational techniques that enable the reduction of generation costs while simultaneously satisfying system demand, taking the input/output characteristics of generating units as a quadratic function and ignoring other constraints [1]. Techniques such as integer programming [4], mixed-integer linear programming [5], linear programming [6], nonlinear programming [7], dynamic programming [8], and the Lagrange multipliers method [9] work well when cost functions are smooth, convex, and differentiable. However, in real-world scenarios involving complex constraints such as VPE, POZs, RR limits, and MF options, these methods struggle due to the nonlinear, non-convex, and non-smooth nature of the problem. Furthermore, they frequently fail in large-scale systems, revealing difficulties like early convergence and restricted flexibility when handling inequality constraints. As a result, these techniques are computationally effective for small, easily solved problems. However, they fall short for ED problems that require advanced methods to represent the complexities of real-world power generation [2]. As a result, metaheuristic search algorithms (MHS) have emerged, offering more reliable and flexible solutions for today’s complex ED problems despite their computational complexity.
Over the past decade, many MHS algorithms have been applied by researchers to solve ED problems, such as particle swarm optimization [10], differential evolution [11], cuckoo search optimization [12], the backtracking search algorithm [13], the water cycle algorithm [14], the hybrid bat algorithm [15], phasor particle swarm optimization [16], turbulent flow of water-based optimization [17], and so on. On the other hand, MHS algorithms have been modified and improved while searching for the optimal solution for the ED problem; for example, hybrid algorithms such as shuffled differential evolution [2], the modified harmony search method [3], the improved harmony search algorithm [18], enhanced particle swarm optimization [19], the adaptive real coded genetic algorithm [20], the improved differential evolution algorithm [21], improved particle swarm optimization [22], the modified artificial bee colony algorithm [23], the chaos mutation firefly algorithm [24], the modified cuckoo search algorithm [25], multi-population differential evolution [26], the modified social spider algorithm [27], the augmented Lagrange–Hopfield network [28], oppositional invasive weed optimization [29], and so on. Table 1 summarizes some relevant research studies using MHS algorithms to solve the ED problem.
When Table 1 is examined, the studies can generally be evaluated under four headings: (i) operational constraints used in the ED problem, (ii) the case studies examined in the ED problem, (iii) whether the results obtained from the method used to solve the ED problem were evaluated with any statistical analysis method, and (iv) whether stability analysis was applied to evaluate the success of the method/methods in solving the ED problem. In line with these headings, three research questions emerge, which are the subject of this study, and they are explained below:
  • Can a method provide optimal solutions for different ED case studies? When the studies given in Table 1 are examined, it is seen that all of the constraints considered are included in 8 of 24 studies [16,17,24,33,34,35,43,48]. In addition, different scales of test systems, from small to large, have been preferred for the ED problem depending on the number of generators. Considering the constraints in the ED problem makes it a non-convex and non-smooth power system planning problem and makes its solution quite difficult and complex. For this reason, many MHS algorithms have been used by researchers in the literature to solve the ED problem. It has been shown that the performances of these algorithms are insufficient, and improved versions of them have been proposed. According to the studies in Table 1, a proposed/improved algorithm has been tested in a maximum of 13 case studies [48]. In other studies, less than 10 case studies have been considered in general, and it is not clear whether the algorithms are sufficient to solve the ED problem.
  • Have statistical analysis methods been used to verify the performance of an algorithm used to solve the ED problem? The fact that an algorithm has achieved the optimal result for solving a problem is not enough to verify its performance alone. Therefore, when the algorithms are applied to a problem, they are run multiple times. The results obtained from multiple runs of the algorithms are evaluated using non-parametric statistical test methods, and the algorithms are compared in terms of performance. The Friedman and Wilcoxon signed-rank tests are the most commonly used of these test methods. When examining the studies in Table 1, it is seen that only the Wilcoxon test was used in the studies in [30,34,35,39,44] for the performance evaluation of the proposed/used method(s) in solving the ED problem. On the other hand, only the Friedman test was used in the study in [26]. This is insufficient for proving the algorithms’ performance in solving the ED problem.
  • Has stability analysis been used to demonstrate the success of the proposed method for solving the ED problem? In order to apply statistical analysis methods, at least two algorithms must be applied to the problem. Therefore, a stability analysis determines the algorithm’s success in finding the optimal result for solving a problem. At this point, the algorithm is checked to see whether the optimal solution has been found. If the optimal solution is found, the maximum number of fitness functions, or the number of iterations and the elapsed time, are recorded. Thus, the algorithm’s success in finding the optimal solution is determined. None of the studies conducted to find a solution to the ED problem in the literature have used stability analysis to prove the algorithm’s success.
In this study, the snow ablation optimizer (SAO) algorithm, which was proposed in the literature by Deng and Liu in 2023 [49] and has attracted considerable attention from researchers, was applied to solve the ED problem. When the performance of the SAO algorithm on the ED problem was examined, it was seen that it faced the problem of becoming stuck in local solution traps due to the insufficient balance between exploration and exploitation. Therefore, it failed to obtain the optimal solution. In order to eliminate this disadvantage, the fitness–distance balance (FDB) method, which was first proposed in the literature by Kahraman et al. in 2020 [50], was used for the selection of guide solution candidates in both the exploration and exploitation stages of the SAO algorithm. In the FDB method, each candidate’s fitness and distance values to the best solution are considered when selecting guide solution candidates. Thus, the FDB method contributes to the improvement of the performance of the algorithm by preventing the determination of possible solution candidates that cause early convergence in the search space of an optimization problem and do not contribute to the process of searching for the optimal solution and participate in the subsequent solution search process. However, due to the insufficient improvement achieved by applying the FDB method to the SAO algorithm, the fuzzy-based FDB (FFDB) method, an improved version of the FDB method, has been hybridized with the SAO algorithm. The FFDB method, introduced to the literature by Yu et al. [33], eliminates the dependency of weight coefficient determination in FDB methodologies based on user experience. In this method, a dynamic adaptive strategy controls the balance of exploration and exploitation through an appropriate distance mechanism. Thus, the researchers applied FFDB to the SAO to develop the FFDBSAO, which exhibits better reliability and performance speed in large-scale complex optimization tasks while reducing the probability of premature convergence.
The key contributions and novelties of this study are summarized as follows:
An improved version of the SAO algorithm using the FFDB method (FFDBSAO) is proposed to solve the ED problem.
The performance of the FFDBSAO algorithm against the SAO is proved for solving the unconstrained benchmark problem suites. The FFDBSAO and SAO algorithms are applied to solve the CEC2020, CEC2022, and classical benchmark problem suites.
A comprehensive evaluation is carried out to validate the FFDBSAO algorithm over the benchmark problem suites. Statistical analyses, including Friedman and Wilcoxon tests, convergence analysis, scalability analysis, and exploration and exploitation behavior analysis, are applied.
A highly competitive and robust algorithm is proposed in the literature to solve the ED problem. Eighteen ED case studies are considered to demonstrate the proposed algorithms’ effectiveness.
For the first time, a stability analysis is performed on the ED case studies to confirm the proposed FFDBSAO algorithm’s performance over the base SAO algorithm.
The article is organized and presented according to the following sections.
Section 2 details the mathematical model of the economic load dispatch problem, one of the power system planning problems, as an optimization problem.
Section 3 presents the implementation phase of the SAO and the proposed FFDB variations to the SAO algorithm in detail.
Section 4 gives the tuning parameters in detail so that simulation studies can be conducted fairly.
Section 5 presents the simulation studies for the SAO and its proposed FFDB variations. In this section, the simulation studies are carried out in two stages. In the first stage, the algorithms’ performance is tested on the CEC2020, CEC2022, and classical benchmark test suites and discussed in detail. In the second stage, the SAO and its proposed FFDB variations are applied to the ED problem, one of the power system problems, and the obtained results are compared with other results in the literature.
The Results section, where the findings obtained from the simulation studies are discussed in detail and suggestions for future studies are given, is presented in Section 6.

2. Formulation of the Economic Dispatch Problem

Power system experts classify the ED problem as a crucial matter within power system planning, standing as one of the most significant operational and planning problems in power systems. The primary goal of this problem is to minimize the total fuel cost by operating the fossil fuel thermal generation units in a manner that satisfies the specified equality and inequality constraints. The solution to the ED problem has become increasingly complex due to the inclusion of constraints such as the VPE, RR limit, POZs, and generation capacity limit. The mathematical model of the ED problem is elaborated upon below [51].
min k = 1 N G F t h P k = k = 1 N G a k + b k P k + c k P k 2
The mathematical modeling of the fuel cost as a quadratic function in generating units containing fossil fuels is shown in Equation (1). Fth can be defined as the cost of electricity production in dollars per hour by thermal production units. ak, bk, and ck are expressed as fuel cost coefficients of the k-th generating unit. NG represents the total number of fossil fuel generating units. Pk is defined as the active power produced by the k-th unit. By adding a sine function representing the VPE of the generator in the power system to Equation (1), the production cost function is obtained, as in Equation (2) [52].
min k = 1 N G F t h P k = k = 1 N G a k + b k P k + c k P k 2 + d k × sin e k × P k min P k
Here, dk and ek represent the VPE cost coefficients of the k-th generator. Pkmin represents the minimum active power value of the k-th fossil fuel generation unit. Figure 1 shows the fuel cost curve depending on the active power outputs of the fossil fuel thermal generation units.

2.1. ED Problem Constraints

2.1.1. Power Balance Equation Limits

In the ED problem, the mathematical model is created so that the freedom constraints meet the sum of the active power values produced from the production units, the demand power, and the active power loss in the system. This model is given in Equation (3) [51]. PD represents the total power demanded in the system, and PL is the total transmission line losses.
k = 1 N G P k P D + P L = 0
The mathematical equation created using the Kroon loss formula to calculate the transmission line loss is given in Equation (4) [53]. The loss matrices used in calculating the transmission line loss under normal operating conditions are shown as Bmn, B0m, and B00.
P L = m = 1 N G n = 1 N G P m B m n P n + m = 1 N G B 0 m P m + B 00

2.1.2. Generation Units’ Limits

The lower and upper limits of the generation units are specified by Equation (5) [51]. Pkmin, Pkmax, and Pk represent the minimum, maximum, and current power values of the k-th generation unit, respectively.
P k min P k P k max

2.1.3. Ramp-Rate Limits of the Generation Units

The complexity of the problem is increased when including the RR limits of the generators in the ED problem, as shown in Equation (6) [54]. This rate is used when the generators do not allow their output power to change too much between two consecutive periods. The current operating limit Pk is set by the previous active power output Pk0 and the up-ramp limit URk and down-ramp limit DRk of the active power output of the k-th generating unit.
max P k min , P k 0 D R k P k min P k m a x , P k 0 + U R k

2.1.4. Prohibited Operating Zones of the Generation Units

This constraint is applied in the ED problem to avoid unused active power outputs of the generating units due to instability or physical problems. The POZ is modeled using the mathematical expression shown in Equation (7) [54]. The lower and upper limits of the forbidden zones are shown by Pkl and Pku. The forbidden zone operating model of fossil fuel generating units is shown graphically in Figure 1.
P k P k min P k P k , 1 l P k , 1 u P k P k , 2 l P k , N P Z u P k P k max

2.1.5. Multiple-Fuel-Type Modeling for the Generation Units

In the ED problem, generating units need more than one type of fuel to produce active power at different power levels. This is explained by the mathematical expression shown in the equation [55]. The cost coefficients of the production units are expressed with ak, bk, ck, dk, and ek, while N represents the number of fuel types. Pk,Nmin and Pk,Nmax indicate the minimum and maximum active power production limit values of the generating units depending on the fuel type. When the VPE does not occur, the problem is evaluated as a classical quartic cost function.
F t h P k = a k , 1 + b k , 1 P k + c k , 1 P k 2 + d k , 1 × sin e k , 1 × P k , 1 min P k , P k , 1 min P k P k , 1 max a k , 2 + b k , 2 P k + c k , 2 P k 2 + d k , 2 × sin e k , 2 × P k , 2 min P k , P k , 2 min P k P k , 2 max a k , N + b k , N P k + c k , N P k 2 + d k , N × sin e k , N × P k , N min P k , P k , N min P k P k , N max

3. Method

3.1. Snow Ablation Optimizer

The snow ablation optimizer (SAO) is a population-based metaheuristic algorithm inspired by physical phenomena such as sublimation, melting, and evaporation, which Deng and Liu [49] presented in a study in 2023. In the algorithm, mathematical modeling of these three physical phenomena takes place at the initial population, exploration, exploitation, and binary population stages.

3.1.1. Creating the Algorithm’s Initial Population

The possible solution candidate space that population-based metaheuristic optimization algorithms use during the optimization process starts with a randomly generated initial population. The possible solution space is represented as a matrix of size M × N as shown in Equation (9). The population number is M and the number of parameters or variables to be optimized in the possible solution candidate is N. The LB and UB vectors show each variable’s lower and upper bound values [49,56,57,58,59].
Y = r a n d 0 , 1 × U B L B + L B Y = y 1 , 1 y 1 , s y 1 , s + 1 y 1 , N y r , 1 y r , s y r , s + 1 y r , N y r + 1 , 1 y r + 1 , s y r + 1 , s + 1 y r + 1 , N y M , 1 y M , s y M , s + 1 y M , N

3.1.2. Algorithm’s Exploration Section

In this process of the algorithm, when snow or water turns into vapor through sublimation or evaporation, water molecules move irregularly in space. The simulation of molecular irregular motion in space uses Brownian motion models. This model allows solution candidates in the population to explore valuable and potentially solution-rich regions in the optimal solution space. The mathematical model of Brownian motion is shown in Equation (10) [49].
f B W y ; 0 , 1 = 2 π 1 2 e y 2 2
The location update of possible solution candidates in the solution space in the exploration part of the algorithm is formulated as follows:
Y j g + 1 = E l i t e p o o l g + B W j g β 1 × Y b e s t g Y j g + 1 β 1 × Y ¯ g Y j g
Here, g represents the number of iterations; BW is the random number vector generated due to the Brownian motion; β1 explains the random number among [0, 1]; Ybest is the best value in each iteration; Yj(g) defines the location of the j-th individual in the g-th iteration; Y ¯ (g) identifies the location of the center of mass of the entire population in the search space; a randomly selected individual from the elite set is modeled by Elitepool(g). The mathematical models of Y ¯ (g) and Elitepool(g) are shown in the following equations:
Y ¯ g = 1 M j = 1 M Y j g
E l i t e p o o l Y b e s t g , Y 2 n d g , Y 3 r d g , Y ¯ c g
Y ¯ c g = 1 M 1 c = 1 M 1 Y c g
The second and third best solutions in the solution space of the problem are shown by Y2nd(g) and Y3rd(g). Y ¯ c (g) represents the location of the center of mass of the elite population consisting of solution candidates in the top 50% of the fitness values of the solution space in the g-th iteration.

3.1.3. Algorithm’s Exploitation Section

Snow turns into liquid water with the melting process. Water molecules that tend to cluster are simulated in the SAO algorithm as an exploitation operator that aims to determine the solution candidates with the best value near the best individual in the solution space. Equation (15) shows the mathematical model of this operator [49].
Y j g + 1 = M × Y b e s t g + B W j g β 2 × Y b e s t g Y j g + 1 β 2 × Y ¯ g Y j g
β2 represents a random number in the range [−1, 1]. The snowmelt rate (M) is formulated by Equation (16).
M = D D F × T g
DDF indicates the degree-day factor. This value varies between 0.35 and 0.6. T(g) indicates the average daily temperature value. gm indicates the maximum iteration number. DDF and T(g) are mathematically formulated using Equations (17) and (18).
D D F = 0.35 + 0.25 × exp g g m 1 exp 1
T g = exp g g m

3.1.4. Algorithm’s Dual-Population Mechanism

The dual-population method is used to balance between the exploitation and exploration features of the SAO algorithm. This method increases the ability of the SAO algorithm to converge to the optimal solution in solving an optimization problem, depending on the design steps. This method divides the population created for the solution space into two semi-subpopulations (Y1 and Y2). N1 and N2 represent the numbers of the Y1 and Y2 populations. While the individuals in the Y1 population use the exploration method to create new solution candidates, the individuals in the Y2 population use the exploitation method. The mathematical expression of this situation is given in Equation (20). During the iteration process of the algorithm, the number of N2 decreases by 1 in the next iteration within the dual-population mechanism, while the number of N1 increases by 1 [49].
N 1 = N 2 = M 2 N 1 = N 1 + 1 , N 2 = N 2 1 , i f N 1 M
Y j g + 1 = E l i t e p o o l g + B W j g β 1 × Y b e s t g Y j g + 1 β 1 × Y ¯ g Y j g M × Y b e s t g + B W j g β 2 × Y b e s t g Y j g + 1 β 2 × Y ¯ g Y j g
The pseudo-code explaining the operation process of the dual-population method used in the SAO algorithm is shown below as Algorithm 1.
Algorithm 1. Pseudo-code of dual-population mechanism process
1-  Determine the setting parameter (M, g, gm, N).
N1 = N2 = 0.5 M
2-  While g < gm
3-    If N1 < M
4-    N1 = N1 + 1, N2 = N2 − 1
5-    end
6-    g = g + 1
7-  end

3.2. Modeling of the Selection Operator for Metaheuristic Algorithms

In this section, the fitness–distance balance method is presented. It was developed for metaheuristic algorithms and presented in the literature by Kahraman et al. [50] in 2020. It is referenced in approximately two hundred scientific studies. Moreover, to eliminate this method’s existing disadvantages, the fuzzy fitness–distance balance (FFDB) method [60] will be discussed and introduced in detail.

3.2.1. Fitness–Distance Balance Selection Operator

Kahraman et al. presented a selection operator called FDB to improve the exploration–exploitation features used in the algorithm design process and increase metaheuristic algorithms’ success in finding the global solution [50]. This operator uses the fitness values of the solution candidates and the population of solution candidates as input parameters. The pseudo-code explaining the flow of the method in detail is given in detail below as Algorithm 2 [61,62,63,64,65,66].
Algorithm 2. The pseudo-code of the FDB method.
1- Start
2- Call the fitness values (F) and possible solution candidates (Pi) from the parent file. Set a value between [0.4, 0.6] for the weight coefficient w.
3-  for i = 1:M do
4-     Calculate the distance between Pi and Pbest according to the equation below.
5-      P y 11 y 1 N x M 1 x M N M × N , F = f 1 f M M × 1
i = 1 M , P i P b e s t , D P i = x 1 P i x 1 P b e s t 2 + x 2 P i x 2 P b e s t 2 + + x M P i x M P b e s t 2
6-     Update the distance vector Dp according to the following equation.
D P d 1 d M M x 1
7-  end for
8-  for i = 1:M do
9-     Normalize the distance and fitness vectors in the range [0, 1].
10-     Calculate the FDB scores of each solution candidate according to the following mathematical expression.
i = 1 M P i , S P i = w × n o r m F P i + 1 w × n o r m D P i
11-     Using the FDB score values obtained from each solution candidate, create the FDB score vector expressed mathematically below.
S P s 1 s M M x 1
12-  end for
13-  Determine the solution candidates to be included in the algorithm’s search process of the optimal solution according to FDB scores.
14- end

3.2.2. The Fuzzy Fitness–Distance Balance Selection Operator

The FDB is a global selection mechanism that aims to increase the performance of metaheuristic algorithms in the optimization process. This method is used to evaluate the quality of possible solution candidates in the solution space during the optimization process and to improve optimization processes. The FDB method generally depends on the fitness values of solution candidates in an optimization problem and their distances to the global solution. The method aims to establish a balance between these two parameters. In other words, it aims to establish a balanced relationship between the fitness values of the solution candidates closest to the global solution point in the solution space and the distances of other solution candidates. Weighting the fitness and distance values is of critical importance for the success of the algorithm. It is critical to adjust the weight coefficient (w) used appropriately between the fitness and distance values for the FDB score. Suppose the weight coefficient (w) excessively depends on the distance metric. In that case, the FDB method may have difficulty reaching the global solution point by focusing on specific regions in the solution search space.
In the FDB method, which contributes to increasing the performance of exploitation–exploration features in metaheuristic algorithms, instead of the user determining the weight coefficient (w) used in the calculation of the score, a fuzzy logic method has been proposed to adaptively determine the weight coefficient (w) [60]. The user effect in determining the FDB score has been eliminated with fuzzy logic. The advantages of using fuzzy logic in the application process of the FDB method are more evident in analysis decision processes. Fuzzy logic is an important tool in modeling uncertainties, balancing multi-purpose objectives, and solving complex problems in optimization algorithms. The optimization algorithms benefit from the flexibility and intuitive features and simple application of this scheme, which delivers essential advantages. The design steps of the fuzzy-based FDB method used in the SAO algorithm are expressed as follows. In the optimization process, the fitness value (FV) of the solution candidate in the solution space and the change in this value (CFV) are determined as the input parameters of the fuzzy-based FDB method. The output parameter of this method is defined as the weight parameter (w) used in calculating the FDB score. The inputs of the fuzzy theorem are subjected to normalization using Equations (21) and (22) in the range [0, 1].
F V n o r m = F V F V min F V max F V min
C F V n o r m = C F V C F V min C F V max C F V min
FVnorm, FVmin, FVmax, and FV denote the normalized, minimum, maximum, and fitness values, respectively. Similarly, the change in normalized fitness values is explained by CFVnorm, the minimum change by CFVmin, the maximum change by CFVmax, and the change in fitness values by CFV. Fuzzy set theory includes three main design steps [67,68,69,70]:
Fuzzification: This is where the input and output parameters are fuzzified.
Decision making: This represents the knowledge base, including the database and rule base.
Defuzzification: This is where the output parameter is converted to a real-world value.
In this study, the membership values in the triangular membership function selected for the input–output values are computed using Equation (23). Figure 2 shows the triangular membership functions used for the input–output parameters.
μ x = max min x x 1 x 2 x 1 , x 3 x x 3 x 2 , 0
The creation of the rule base constitutes a crucial aspect when implementing decision-making mechanisms under fuzzy theory. Table 2 presents the fuzzy theory rule table that enables obtaining output membership values from input membership values.
The rules of fuzzy theory in the FDB method are demonstrated through the input and output triangular membership functions through linguistic definitions of Z (positive), S (positive small), M (positive medium), B (positive big), and R (positive very big).
Rule 1: if FVnorm is Z and CFVnorm is Z, then w is M;
Rule 2: if FVnorm is Z and CFVnorm is S, then w is M;
.
.
.
Rule 7: if FVnorm is S and CFVnorm is S, then w is M;
Rule 8: if FVnorm is S and CFVnorm is M, then w is S;
Rule 9: if FVnorm is S and CFVnorm is B, then w is S;
.
.
.
Rule 23: if FVnorm is R and CFVnorm is M, then w is B;
Rule 24: if FVnorm is R and CFVnorm is B, then w is R;
Rule 25: if FVnorm is R and CFVnorm is R, then w is R.
This study utilized the center-of-area method among defuzzification methods to obtain a clear output through the following mathematical formula:
d u = i = 1 n μ i d u d u i i = 1 n μ i d u
The pseudo-code of the FFDB method is given in detail below as Algorithm 3.
Algorithm 3. The pseudo-code of the FFDB method.
1- Start
2- Call the fitness values (F) and possible solution candidates (Pi) from the parent file.
3-  for i = 1:M do
4-    Calculate the distance between Pi and Pbest according to the equation below
P y 11 y 1 N x M 1 x M N M × N , F = f 1 f M M × 1
i = 1 M , P i P b e s t , D P i = x 1 P i x 1 P b e s t 2 + x 2 P i x 2 P b e s t 2 + + x M P i x M P b e s t 2
5-    Update the distance vector Dp according to the following equation
D P d 1 d M M x 1
6-  end for
7-  for i = 1:M do
8-    Normalize the distance and fitness vectors in the range [0, 1].
9-    Apply the fuzzy logic method.
10-    Normalize the fitness values and the changes in fitness values according to the following mathematical expressions.
F V n o r m = F V F V min F V max F V min , C F V n o r m = C F V C F V min C F V max C F V min
11-    Create the triangle membership functions for the input and output values, as shown in Figure 2. Calculate the membership values according to the equation below.
μ x = max min x x 1 x 2 x 1 , x 3 x x 3 x 2 , 0
12-    Create the rule base using Table 2.
13-    Apply the defuzzification method according to the following mathematical expression using the value of the output degree of ownership obtained according to the rule table.
w F F D B = d u = i = 1 n μ i d u d u i i = 1 n μ i d u
14-    Calculate the FDB scores of each solution candidate according to the following mathematical expression.
i = 1 M P i , S P i = w F F D B × n o r m F P i + 1 w F F D B × n o r m D P i
15-    Using the FDB score values obtained from each solution candidate, create the FDB score vector expressed mathematically below.
S P s 1 s M M x 1
16-    end for
17-    Determine the solution candidates to be included in the algorithm’s search process of optimal solution according to FDB scores.
18- end
In order to improve the exploration–exploitation properties of the SAO algorithm in solving optimization problems, the FFDB method was applied to the equations shown in Table 3. These are expressed as equations in which these properties are defined in the exploration–exploitation sections of the basic SAO algorithm.

4. Simulation Settings

In this study, the CEC2020, CEC2022, and classical 50 benchmark suites are considered. The performance comparison of the SAO, FFDBSAO1, and FFDBSAO2 algorithms is performed on these benchmark problems. The settings of the simulation studies can be expressed as follows.
i.
The termination criterion of the optimization process is the maximum number of fitness function evaluations (maxFEs). By selecting maxFEs as the termination criterion, a fair comparison environment is created when searching for the global solution value of all optimization algorithms used. maxFEs is 10000xDim for the CEC2020 and CEC2022 benchmark packages and 1000*Dim for the classical benchmark functions. Dim is defined as the size of the problem.
ii.
The convergence performance of the optimization algorithms to the optimal solution was investigated using different dimensions for both the classical and CEC benchmark suites.
iii.
The optimization algorithms were executed 51 times across each test problem on the classical, CEC2020, and CEC2022 benchmark datasets. The success levels of the algorithms used became more meaningful through non-parametric Wilcoxon and Friedman statistical tests, which produced results from the execution of the optimization algorithms.
Two different simulation studies were conducted to determine the performance and success levels of the SAO, FFDBSAO1, and FFDBSAO2 algorithms in finding the optimal solution points of the determined problems.
a.
The first simulation involved running the SAO, FFDBSAO1, and FFDBSAO2 optimization algorithms on three separate independent benchmark datasets to evaluate the results and identify the top-performing algorithm.
b.
The second simulation included the application of the SAO, FFDBSAO1, and FFDBSAO2 algorithms to the ED problem, one of the most important planning and operation problems of power systems, and comparing the obtained results with those from the literature.

5. Experimental Study

In this section, the performance of two versions of the SAO algorithm (FFDBSAO1 and FFDBSAO2) was investigated on the benchmark suites and the ED problem. Moreover, it is the section where the results obtained from the simulation studies are presented, evaluated, and discussed in detail.

5.1. Application of SAO and Its Variants to Different Benchmark Suites

The size of the search space is one of the most important parameters affecting the success of the algorithms and the finding of the global solution point of a problem by the optimization algorithms. Considering this situation, the simulation studies evaluated the problems on three benchmark datasets of different dimensions. To create a fair comparison environment, the tuning parameters of the FFDBSAO1 and FFDBSAO2 were the same as the basic SAO algorithm. Each benchmark test function underwent 51 runs.

5.1.1. Statistical Analysis

The non-parametric Wilcoxon and Friedman tests were used to statistically evaluate the simulation results obtained by applying the SAO, FFDBSAO1, and FFDBSAO2 algorithms to the classical, CEC2020, and CEC2022 benchmark suites. The Friedman test results provided a guide for determining the best optimization algorithm among those used in solving the benchmark suites. The Friedman scores of the algorithms used in solving each function for all benchmark suites and different dimensions are shown graphically in Figures S1–S3 in the Supplementary File.
Radar plots for the Friedman analysis of the CEC2020 benchmark functions, a comparative evaluation of the algorithms on different problem sizes (D = 5, D = 10, D = 15, D = 20, and D = 30), are shown in Figure S1. A smaller enclosed area in these plots represents better overall performance as it shows a lower Friedman ranking among the benchmark functions (F1 to F10). An analysis of all the dimensions showed that the FFDBSAO2 used the smallest area, demonstrating that its performance was superior to and more stable than the SAO and FFDBSAO1.
The FFDBSAO2 algorithm implemented a compact exploration of the search spaces for problems consisting of small dimensions (D = 5 and D = 10) while maintaining successful control over optimization difficulties and keeping variability at a minimum. The SAO algorithm demonstrated a higher spread and function-specific performance weakness compared to the FFDBSAO1 and FFDBSAO2 algorithms. The ranking efficiency of SAO radically decreased proportionally to an increase in dimensionality for cases regarding D = 15, D = 20, and D = 30, while SAO occupied the widest space area. The FFDBSAO1 implementation performed well against other optimization algorithms but did not exceed the FFDBSAO2 since it maintained the most efficient Friedman rankings. The FFDBSAO2 algorithm was the most compact solution, proving its effectiveness when dealing with large-scale optimization tasks.
Friedman analysis radar plots for the CEC2022 benchmark test functions, i.e., a comparative evaluation of the SAO, FFDBSAO1, and FFDBSAO2 algorithms for problem sizes D = 10 and D = 20, are shown in Figure S2. For D = 10, the FFDBSAO2 algorithm maintained a compact and enclosed area, demonstrating its ability to achieve better rankings among the benchmark functions. The SAO algorithm demonstrated the largest performance variability because it produced significant result variations for different functions, creating inconsistent outcomes.
The FFDBSAO1 ranked between the SAO and FFDBSAO2 regarding algorithmic performance since it drew a smaller closed space than the SAO while being larger than the FFDBSAO2. For D = 20, FFDBSAO2 reduced and maintained the smallest closed area, demonstrating efficient high-dimensional optimization capabilities. The SAO algorithm expanded in complexity, which decreased its stability substantially, while its sorting efficiency plummeted when the problem size increased. The sorting performance of the FFDBSAO1 stayed steady, but this algorithm did not achieve better outcomes than the FFDBSAO2 in terms of overall sorting operations. The FFDBSAO2 demonstrated the highest capability to handle growing dimensionality because the SAO showed more pronounced performance variations, but the FFDBSAO1 maintained stability equivalent to that of the FFDBSAO2. According to the Friedman analysis, the FFDBSAO2 achieved the best results and scalability when solving the CEC2022 benchmark suite. All results showed that the method was effective in solving medium- and high-dimensional optimizations.
Figure S3 contains radar plots of the Friedman test, which provide a comprehensive evaluation of the SAO and both versions of the FFDBSAO against classical benchmark functions. The SAO algorithm demonstrated the largest covered area, while the benchmark function performance of different optimization algorithms varied substantially. Moreover, the plots indicate that the SAO algorithm had difficulty maintaining consistent rankings and lacked reliability when applied to different optimization problems. The FFDBSAO1 algorithm performed moderately well because it covered a smaller area than the SAO but remained larger than the FFDBSAO2. The performance of the FFDBSAO1 demonstrated balance; however, it failed to secure top rankings throughout the entire set of test functions. The FFDBSAO2 demonstrated effective rankings across classical benchmark functions because it maintained the smallest and most compact solution area in all tests. On the other hand, the FFDBSAO2 provided the most reliable performance over diverse functions because of its compact size area.
Considering the Friedman scores in these figures, the average Friedman results of the algorithms in each dimension are given in Table 4. According to the average results in Table 4, the final Friedman value and ranking of the algorithms are given in the table’s rightmost column. The Friedman scores prove that the proposed FFDBSAO2 algorithm was the most successful among the optimization algorithms. Moreover, the algorithm with the worst performance in solving each function in the benchmark packages was the basic SAO. In other words, it can be seen from the tables where the Friedman scores are given that the algorithm with the best Friedman scores in solving each function in the four benchmark suites is the proposed FFDBSAO2 algorithm.
The evaluation results of the FFDBSAO1 and FFDBSAO2 compared to the SAO can be best interpreted using the concepts of the no free lunch (NFL) theorem [71] from optimization research. The NFL theorem demonstrates that no optimization methods hold superior performance against other approaches in all possible optimization tasks. An optimization algorithm functions according to the optimization problem’s design principles, so any improvement in one problem class leads to degradation in another. Based on this theorem, the Wilcoxon pairwise comparison strategy was used to evaluate the FFDBSAO1 and FFDBSAO2 against the SAO as the baseline algorithm, as shown in Table 5. We applied our analysis to three sets of problems: CEC2020, CEC2022, and classic benchmark problem suites. The +/=/− notation of Table 5 shows the number of cases where the FFBSAO1 and FFDBSAO2 perform better, equal, or worse than the SAO.
FFDBSAO1 and FFDBSAO2 maintained competitive relationships in CEC2020 regarding dimensions (D = 5, 10, 15, 20, 30). While the FFDBSAO1 had six victories, three draws, and one loss for D = 5, the FFDBSAO2 performed better with seven wins, two draws, and one loss. The conditions became progressively more balanced when measuring D = 10, with 5/5/0 outcomes for FFDBSAO1, and its ranking position remained strong. The FFDBSAO2 performed better than the FFDBSAO1 in handling higher-dimensional problems since it achieved more wins and draws at D = 20 (6/4/0) and D = 30 (5/4/1).
Both the FFDBSAO1 and FFDBSAO2 excelled beyond the SAO’s performance for CEC2022 by achieving 9/2/1 for D = 10. The FFDBSAO2 achieved complete victory, with 10/2/0 for D = 20 without experiencing any defeats, while the FFDBSAO1 achieved 9/3/0. The statistical performance indicators indicated that the FFDBSAO2 outperformed the SAO and achieved superior results to the FFDBSAO1.
The detection of the FFDBSAO2 in classical benchmark problem performance showed its superior nature. Classic 23 indicates that FFDBSAO2 exceeded FFDBSAO1 by scoring 13/6/2, whereas FFDBSAO1 performed with 7/8/8 across the test. The classic 27 data demonstrate how FFDBSAO2 surpassed FFDBSAO1 by obtaining a score of 20/6/1 compared to its competitor’s 19/6/2 score. The comprehensive aggregate evaluation demonstrated that FFBSAO2 dominated FFDBSAO1 since it accumulated 84 wins but only 32 draws and 8 losses while FFDBSAO1 recorded 69 wins, 42 draws, and 13 losses.
The Wilcoxon statistical comparison establishes that an MHS algorithm is restricted in its use as a stand-alone solution. The NFL theorem supports the present findings since multiple optimization techniques have both ties and losses when evaluated across varying problem sizes. In some problem structures, the FFDBSAO1 matched the success rates of the SAO but it fell short of the FFDBSAO2 in delivering general top performance. Since universal best practice algorithms do not exist, problem specifications should determine which optimization technique choice is preferable.
The experimental data from this research study validates the NFL theorem, which states that optimization algorithms must be assessed within particular problem domains. The benchmark performance metrics demonstrated a higher statistical strength for
FFDBSAO2 compared to both SAO and FFDBDSAO1, although these advantages existed only in specific situations. In other words, the FFDBSAO2 algorithm achieved the most robust and statistically significant improvements over SAO. This makes the FFDBSAO2 algorithm the preferred method for solving particularly complex optimization problems. According to the results obtained from solving the benchmarking problems, the statistical analysis shows that the FFDBSAO2 algorithm improved the performance of the basic SAO algorithm. Moreover, the proposed approach proved superior to the SAO and FFDBSAO1 algorithms’ in finding the optimal solution in the simulation studies.

5.1.2. Evaluation of the Convergence Performances of the Algorithms

In order to better understand the ability of the optimization algorithm to search for the optimal solution point and to converge, the results obtained in the solution of an optimization problem should be converged and the boxplot analyzed. Considering this situation, in this section, where the convergence performances of the algorithms are evaluated, the convergence curves and boxplot graphics of the SAO, FFDBSAO1, and FFDBSAO2 algorithms are presented. The optimization algorithms used were tested on different test function types to solve the classical benchmark problem package, the CEC2020 and CEC2022 benchmark suites.
The convergence curves of the algorithms were selected from the unimodal, basic, hybrid, and composition function types for the CEC benchmark suites, and are presented in Figures S4–S8. Figure S10 shows the convergence curve of the selected unimodal and multimodal problem types from the classical benchmark problem suite. When the figures are examined in detail, it can be seen in Figure S4 that the approach proposed for the CEC 2020 benchmark package was more successful than the other algorithms in minimizing the function error value according to maxFEs. Figure S5 stands out as the convergence curve where the success of the algorithms in finding the best fitness value is shown depending on the number of iterations. Moreover, these convergence curves verify the performance of the proposed approach depending on the curves in Figure S4. Boxplot graphs created based on the best fitness values obtained as a result of 51 runs present the success of the algorithms in converging to the optimal solution in detail. Boxplot graphs of the SAO, FFDBSAO1, and FFDBSAO2 algorithms for the selected functions in the CEC2020 benchmark suite are given in Figure S6.
Figure S6 proves that the FFDBSAO2 algorithm succeeded more than the others in converging to the optimal solution for 51 runs for the selected functions. In other words, the standard deviation value of the FFDBSAO2 algorithm was lower than the standard deviation values of the SAO and FFDBSAO1 algorithms. Figures S7 and S8 depict the available data of MaxFEs and iteration-dependent convergence for the algorithms running on selected functions from the CEC2022 benchmark suite. These curves were plotted for problem dimensions of 10 and 20. When Figure S7 was examined for a problem size of 10, the convergence success of the FFDBSAO2 approach to the optimal solution in the unimodal and basic problem types was better than the FFDBSAO1 and SAO algorithms. Although the three algorithms showed close performance in hybrid and composition problem types, the FFDBSAO2 was slightly ahead of the others. When the problem size was 20, the FFDBSAO2 and FFDBSAO1 showed close performance in the unimodal and basic problem types. In the hybrid and composition problem types, the three algorithms also showed close performance in convergence to the optimal solution. Figure S8 presents the convergence curves of the algorithms to the optimal solution on an iteration basis. These curves verify the results of the convergence curves obtained according to maxFEs in Figure S7 on an iteration basis.
Moreover, the boxplot graphs drawn depending on the values obtained by the optimization algorithms as a result of 51 runs in all problem types are given in Figure S9. According to Figure S9, the FFDBSAO2 algorithm was more successful in converging to the optimal solution than the SAO and FFDBSAO1 algorithms in all problem types. The convergence curves of all algorithms according to maxFEs for the selected functions in the unimodal and multimodal problem types of the classic benchmark suite are detailed in Figure S10. It is seen from Figure S10 that the success of the FFDBSAO2 in converging to the optimal solution was better than the SAO and FFDBSAO1 algorithms.
In other words, the FFDBSAO2 algorithm searches for the optimal solution value more effectively than the other algorithms without becoming stuck in local solution traps in both the unimodal and multimodal problem types. The boxplot graphs of the algorithms for the selected unimodal and multimodal problem types are given in Figure S11. It can be seen from Figure S11 that the FFDBSAO2 converged to the optimal solution effectively by avoiding the local solution traps more effectively than the other algorithms. In other words, the FFDBSAO2 algorithm was more successful in solving classical benchmark problems than the SAO and FFDBSAO1 algorithms.

5.1.3. A Scalability Analysis of the Algorithms

In this study, the scalability and applicability of the SAO, FFDBSAO1, and FFDBSAO2 algorithms were evaluated, and the results are presented in Tables S1 and S2 in the Supplementary File. According to the results presented in the tables, at the end of the optimization process, the FFDBSAO2 algorithm consistently obtained the lowest average value in multiple benchmark test functions and different working dimensions. These findings reveal that the FFDBSAO2 method is the most efficient optimization method among the three since it shows good performance. By maintaining its efficiency levels, the method shows better scaling characteristics when the problem becomes more complicated and is fit for use in many spheres of real-world optimization. The FFDBSAO2 delivers efficient performance throughout all the tested dimensions since its operational efficiency remains stable for problems ranging from small to large dimensions. The mean performance values of the FFDBSAO2 remain stable when the problem dimensions fluctuate. However, both the SAO and FFDBSAO1 substantially deteriorate in efficiency with increased problem dimensions. The exceptional capabilities of the FFDBSAO2 allow it to tackle problems with multiple dimensions that would make standard search methods ineffective due to a growth in complexity. The standard deviation values obtained from the FFDBSAO2 maintain consistency due to the stable convergence of the algorithm that yields consistent performance in different situations.
The ability of the FFDBSAO2 algorithm to reach minimum mean values across multiple dimensions makes it the best optimization tool to solve extensive real-world optimization issues across diverse scientific fields. The FFDBSAO2 demonstrates effective search space navigation capabilities through benchmark test suite solutions, which enables it to find optimal solutions while maintaining minimum computational requirements. The reliability of the FFDBSAO2 when solving optimization problems is based on its ability to repeatedly reach optimal solutions. The SAO algorithm shows effective performance in reduced-dimensional cases, yet the FFDBSAO1 manages to bring together both stability and accurate results. The superiority of the FFDBSAO2 algorithm across low and high dimensions proves its status as the most adaptably scalable optimization method when compared to both the SAO and FFSBSAO1.

5.1.4. Exploration and Exploitation Behavior Analysis

Exploration and exploitation assessment constitutes the vital component needed to determine search efficiency together with convergence behavior and robustness of algorithms that resolve complicated optimization challenges. The optimization algorithm becomes more efficient at searching the search space when these two properties exist in good proportion. Adaptive methods developed for optimization algorithms maintain their capacity to enhance performance through better exploration and exploitation balance, which results in effective metaheuristic algorithms for various real-world scientific optimization problems. Dimension-based diversity measurement plays a critical role in evaluating the performance of the exploration and exploitation properties of optimization algorithms. Considering this situation, the calculation of the exploration and exploitation values of optimization algorithms is achieved using the mathematical expressions shown in the following equations [72,73,74,75]:
D i v b = 1 N k c = 1 N k m e d i a n y b y c b
D i v I T = 1 D i m b = 1 D i m D i v b
where Divb is the average population diversity of the b-th dimension and ycb is the c-th iteration of the b-th dimension. Nk is the number of solution candidates in the population and the median of the b-th dimension in this population is defined as median(yb). DivIT is the average population diversity of the IT-th iteration. Using Equations (25) and (26), the percentage exploration (Explr) and exploitation (Explt) values are calculated [72]. Here, Divmax is the maximum value of population diversity across all iterations.
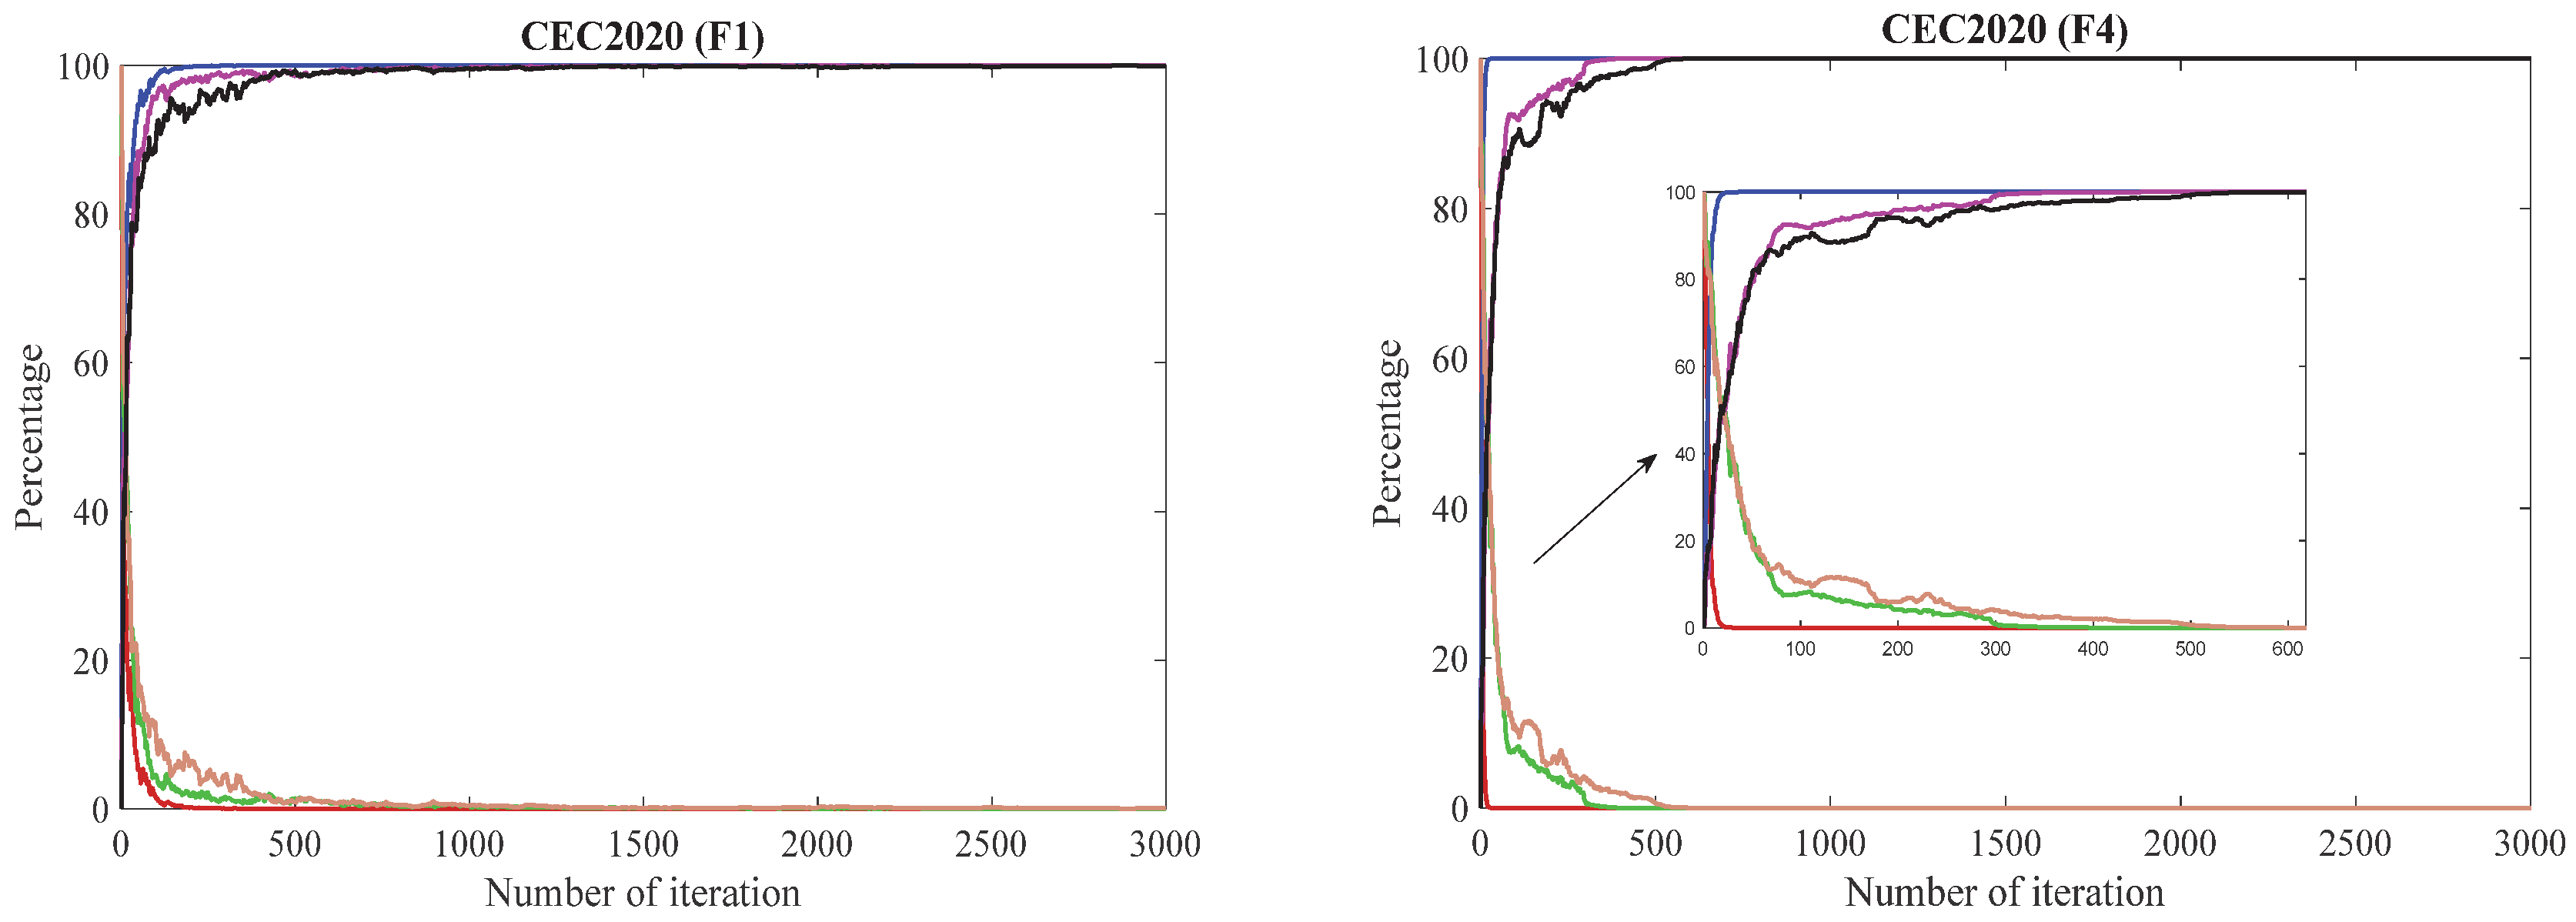
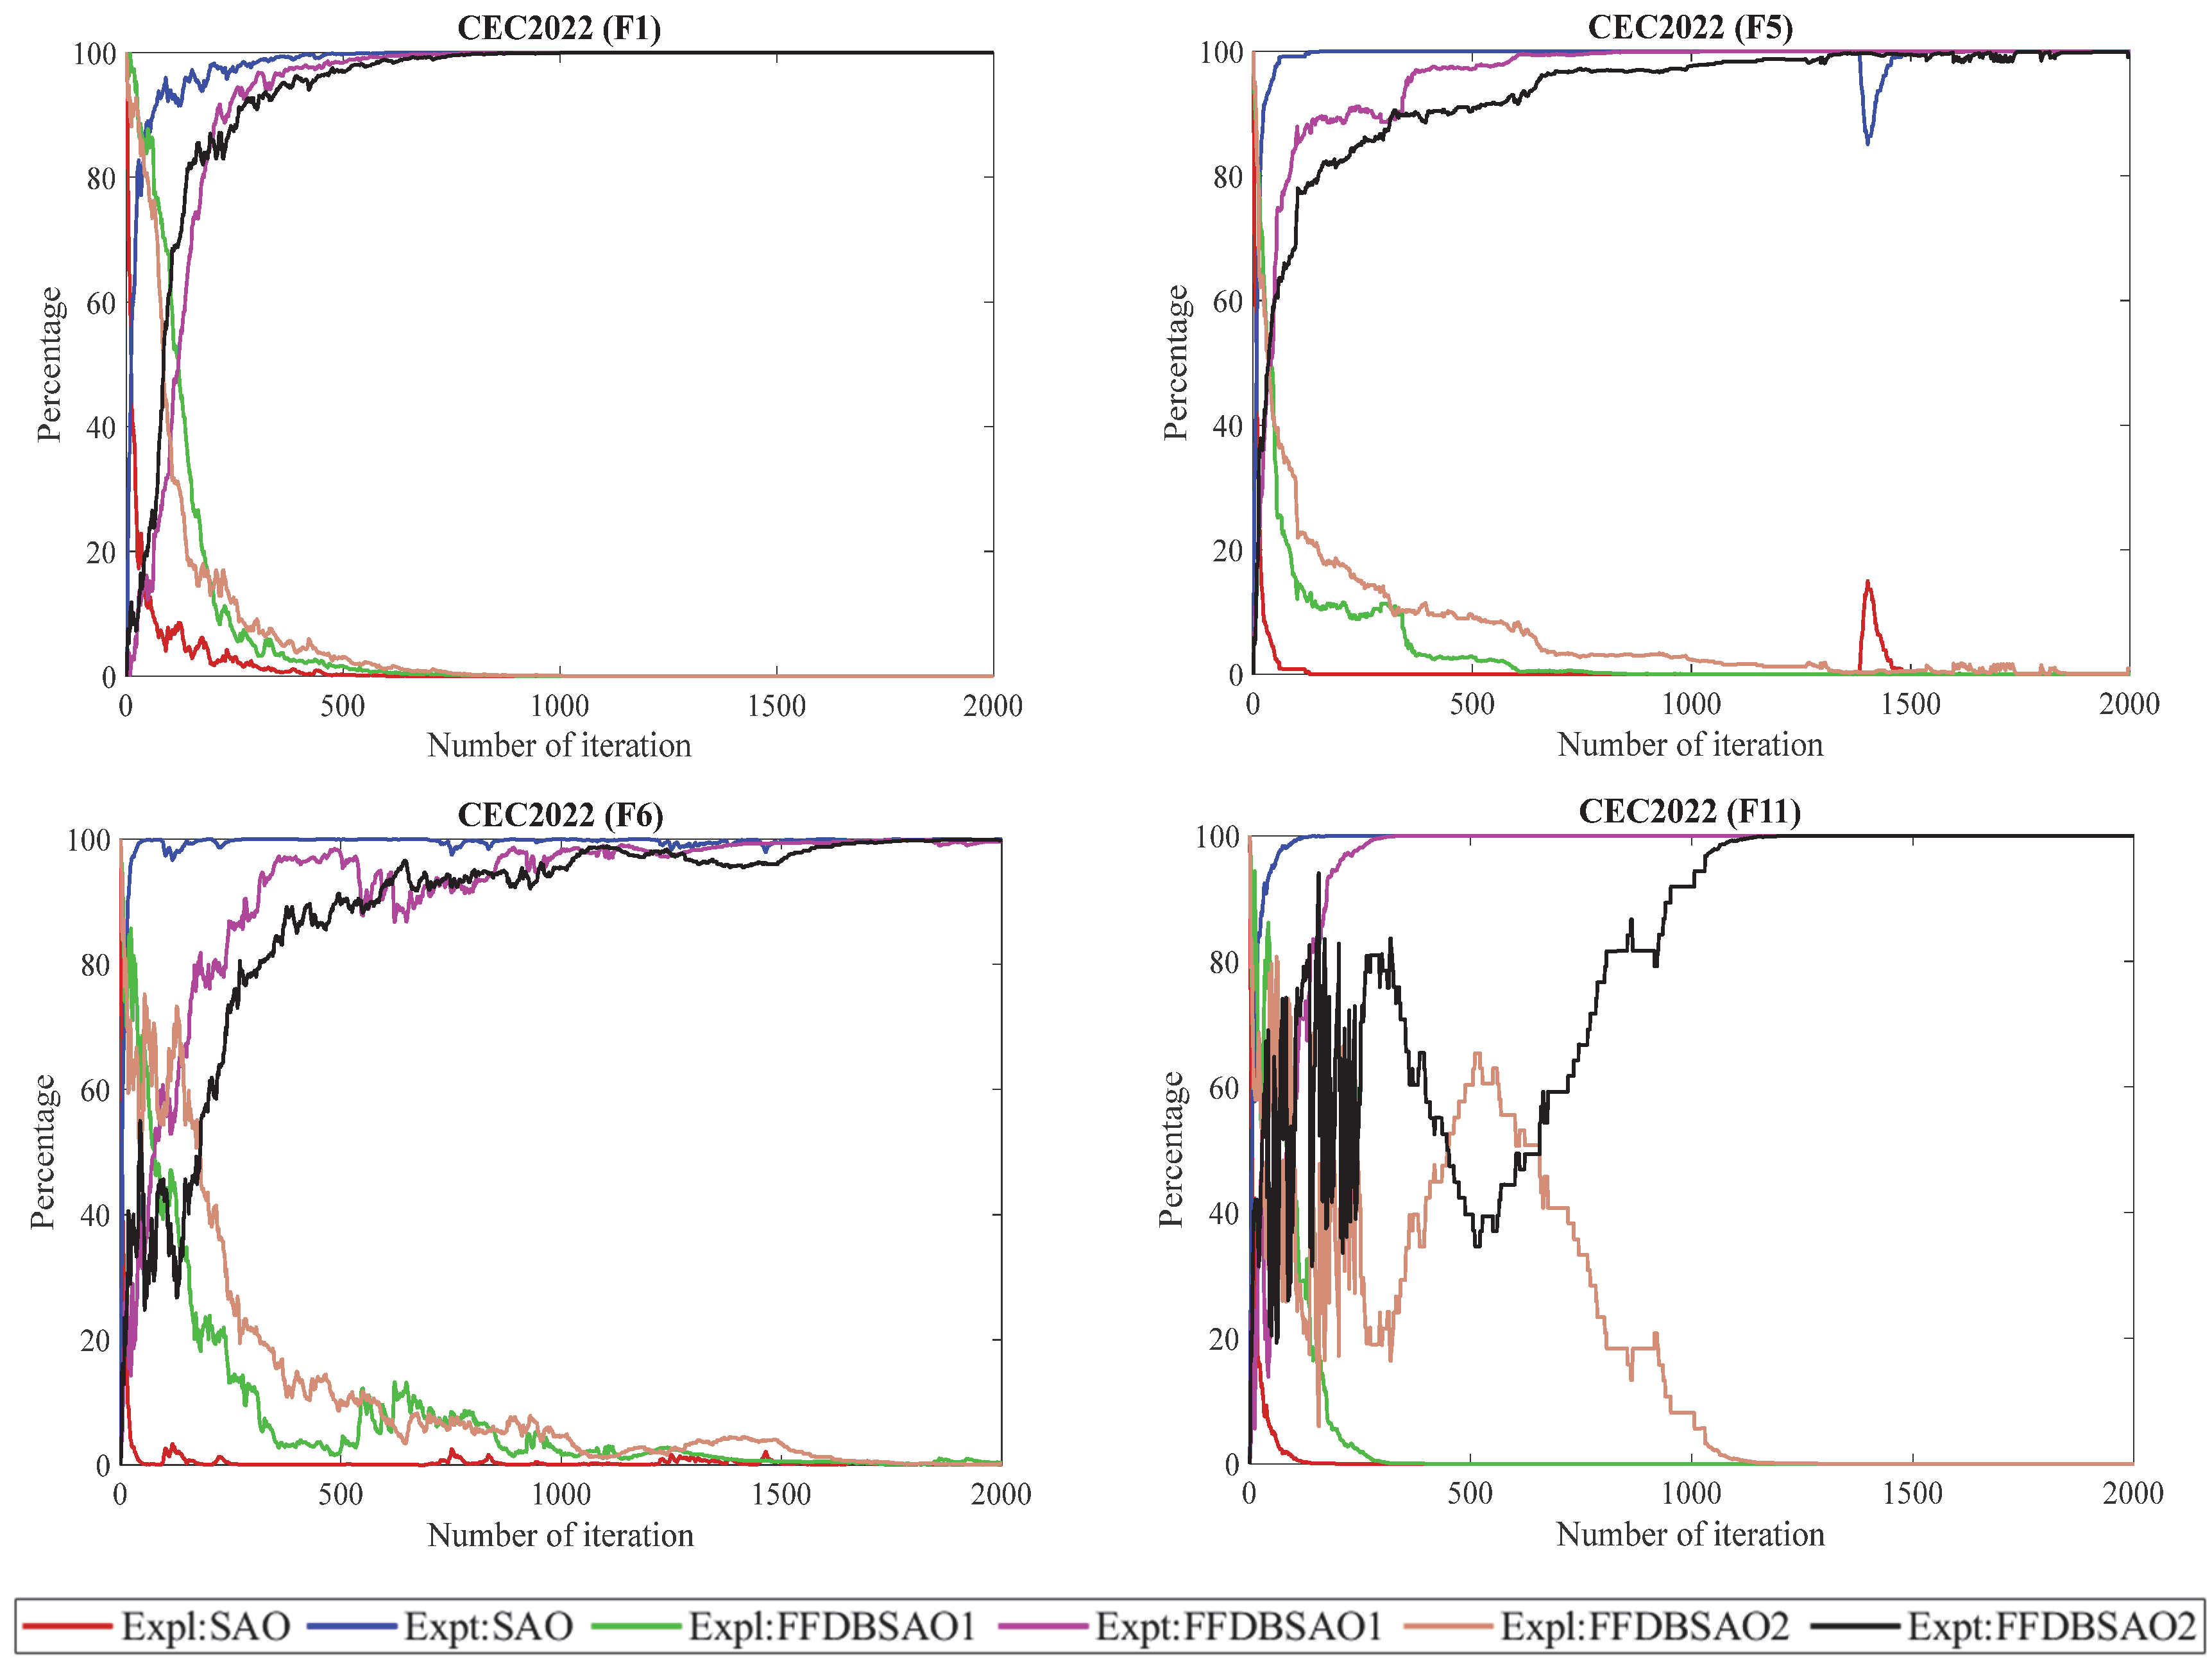
E x p l r % = D i v I T D i v max × 100
E x p l t % = D i v I T D i v max D i v max × 100
Figure 3 and Figure 4 show the percentage change curves of the exploration and exploitation features of the SAO, FFDBSAO1, and FFDBSAO2 algorithms in each iteration during the solution of the optimization problem on the 30-dimensional CEC2020 and 20-dimensional CEC2022 benchmark functions. The figures demonstrate the investigation of the optimization algorithm behaviors during exploration and exploitation as they handle different problems in the CEC2020 and CEC2022 benchmark test functions. A meaningful comparison between basic SAO and the developed FFDBSAO1, along with FFDBSAO2, is made to evaluate their performance in reaching the optimal solution.
Among the CEC2020 and CEC2022 benchmark test functions, the F1 function is defined as a unimodal test function. In this type of function, the exploration process of the SAO algorithm ends quickly, while the exploitation process increases rapidly and exhibits unstable behavior in the phase of finding the optimal solution. The FFDBSAO1 and FFDBSAO2 algorithms started the optimization process with dynamic exploration behavior. The FFDBSAO2 algorithm took longer to solve the F1 function in both benchmark test suites than the FFDBSAO1 algorithm, which shows that the algorithm successfully performs the exploitation process without becoming stuck in local solution traps, unlike the other algorithms, when searching for the optimal solution.
Among the CEC2020 and CEC2022 benchmark test functions, the F4 and F5 functions are defined as basic test functions. For the F4 function in CEC2020, it is seen in Figure 3 that the FFDBSAO2 algorithm exhibits a more balanced exploration and exploitation behavior than the SAO and FFDBSAO1 algorithms in searching for the optimal solution. For the F5 function in CEC2022, it is evident that the FFDBSAO2 algorithm exhibits the best exploration and exploitation behavior and is the algorithm with the least risk of early convergence without becoming stuck in local solution traps. While the SAO algorithm is the algorithm with the worst performance in solving this problem in terms of exploration and exploitation behaviors, it is seen in Figure 4 that the FFDBSAO1 algorithm lags behind the FFDBSAO2 algorithm. However, it exhibits a balanced exploration and exploitation behavior.
Both the CEC2020 and CEC2022 benchmark suites include hybrid function types in their F7 and F6 solutions. The self-adjusting search approach of the FFDBSAO2 can be observed in Figure 3, which depicts FFDBSAO2’s exploration and exploitation movements according to problem complexity during the solution search process. The algorithm demonstrates ongoing exploration behavior, which prevents it from becoming stuck in local suboptimal regions. The FFDBSAO2 algorithm operates with a minimized risk of reaching suboptimal results too early in the search process. The solution methods applied by the SAO and FFDBSAO1 match the FFDBSAO2 when dealing with this function, yet the algorithm’s exploration–exploitation equilibrium operates at a lower level than that of the FFDBSAO2. The optimization process of function F6, shown in Figure 4, displayed dynamic balance between exploration and exploitation by the algorithms. At the beginning of the optimization process, the FFDBSAO2 emphasized exploration more than the other algorithms. The FFDBSAO2 algorithm began its solution search by investigating a wide range of search areas during the initial optimization period until it established its optimal search area. Over time, the longer gradual transition to the exploitation process compared to the SAO and FFDBSAO1 algorithms shows that the FFDBSAO2 algorithm successfully transitioned from the global search process to the local optimization process, allowing for the discovery of promising solutions.
The F10 and F11 functions in the CEC2020 and CEC2022 benchmark test suites are expressed as composition function types. For the F10 function, the FFDBSAO2 algorithm gradually transitions from exploration to exploitation in a balanced way. It is seen in Figure 3 that the FFDBSAO2 algorithm continues to search for quality solutions around the optimal solution point after switching to the exploitation process and has a lower risk of early convergence compared to the SAO and FFDBSAO1 algorithms. For the F11 function, there are fluctuations in the exploration and exploitation characteristics of the FFDBSAO2 algorithm, which shows that the algorithm performs a balanced and powerful search to find the optimal solution. Thus, the FFDBSAO2 algorithm effectively improves solutions and exhibits convergence behavior towards optimum or near-optimum values. In solving this problem, although the FFDBSAO1 algorithm performs a balanced search in the exploration and exploitation process, it lags behind the FFDBSAO2 algorithm in terms of performance in finding the optimum solution. The SAO algorithm entered the early convergence process with weak exploration and exploitation behavior.
Usually, the success of optimization techniques depends on keeping a suitable balance between exploration and exploitation. A well-designed optimization algorithm guarantees that exploration is adequate to explore several areas of the solution space while switching to exploitation at the correct moment to expedite convergence. Figure 3 and Figure 4 underline the need for adaptive methods in optimization since various functions in the CEC2020 and CEC2022 benchmark test suites call for distinct exploration–exploitation strategies. The obtained results show that, by including more efficient exploration and exploitation characteristics than the SAO and FFDBSAO1 algorithms, the FFDBSAO2 method is more successful in converging to the optimal solution.

5.2. Application of the Proposed FFDBSAO Algorithm to the Economic Dispatch Problem

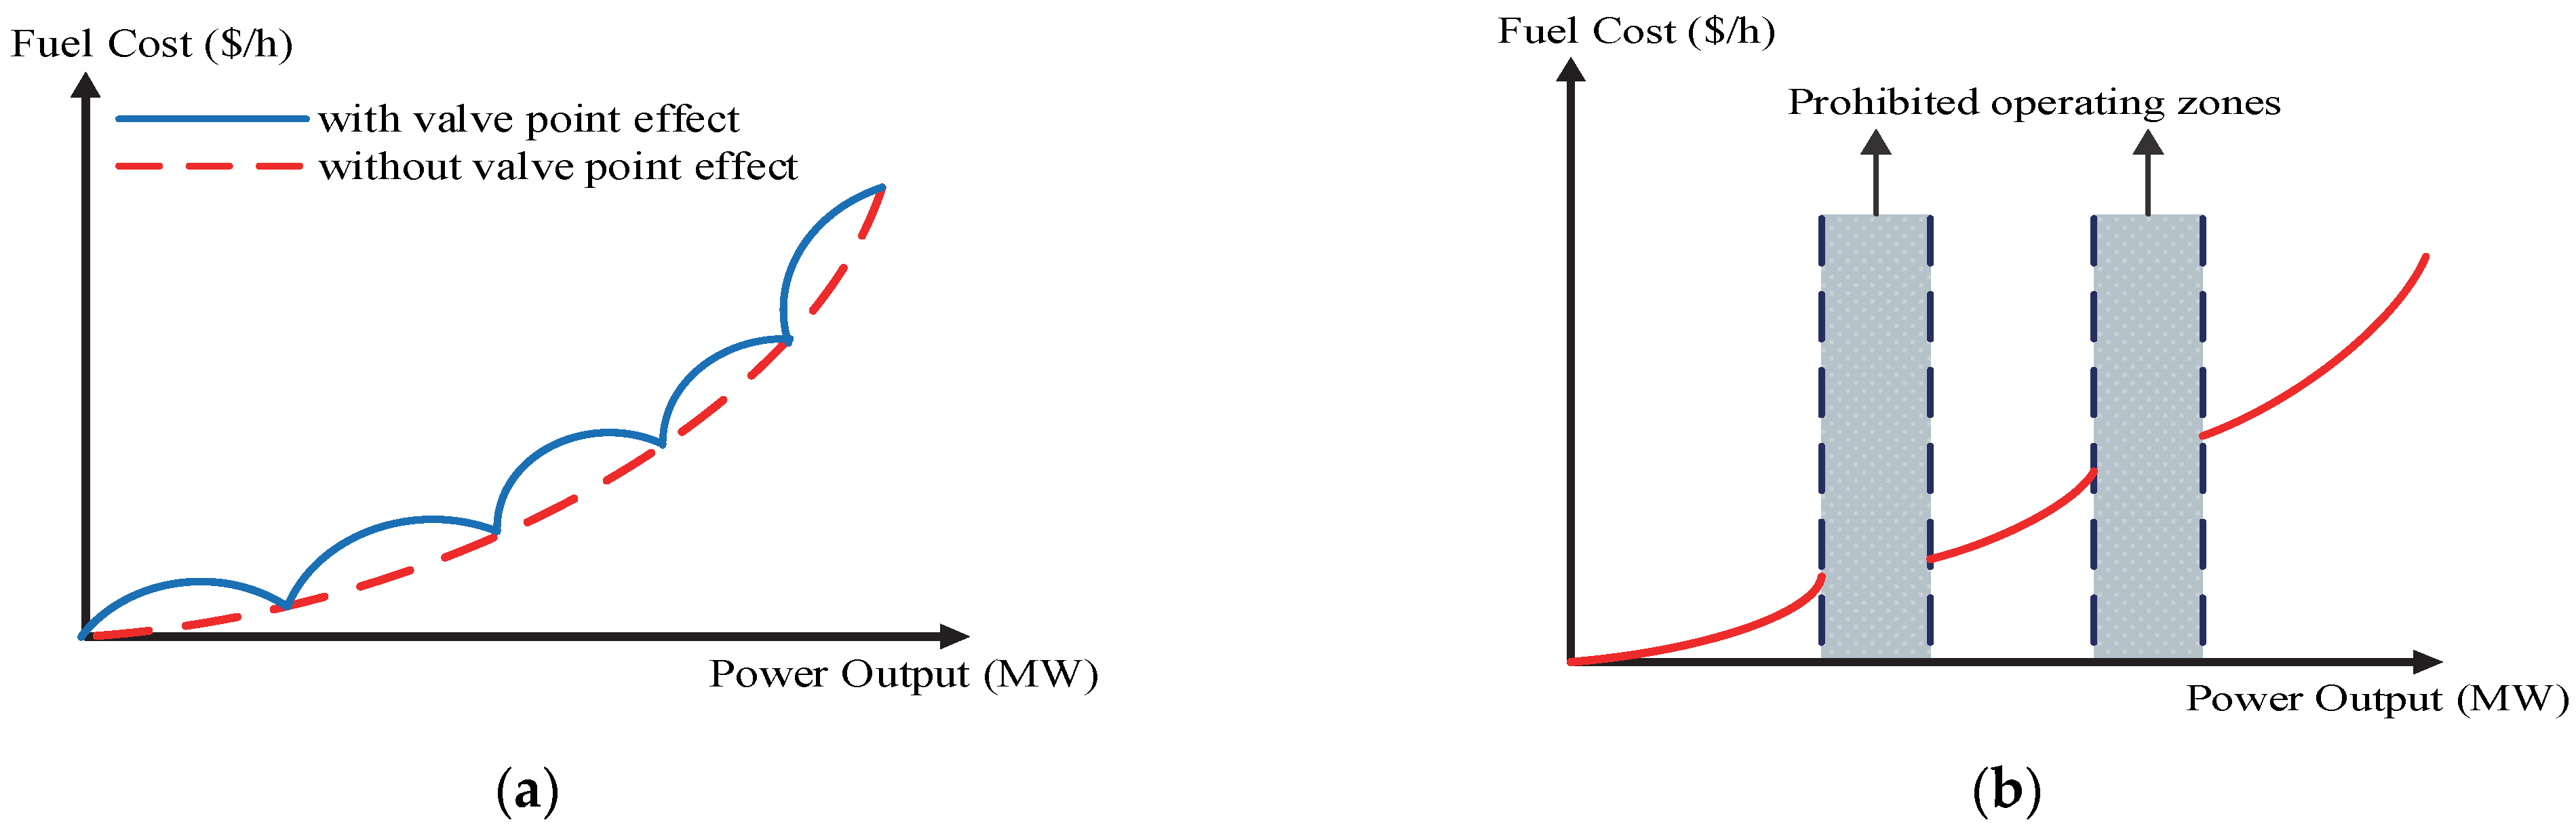
Variants of the FFDBSAO algorithm were used to try to solve the ED problem, which is one of the most important planning and operation problems in power systems, and a comparison of the results of the SAO algorithm with the results of existing algorithms in the literature is presented in this subsection. The results of the 11 best algorithms from the literature for each test case are presented in tables and discussed. Table 6 shows the test systems used in solving the ED problem, the number of generators included in the test systems, the demand power of the systems, and the type of objective function to be minimized.
Test System 1: This includes six generators, where TL, RR, and POZs are considered. The system parameters are extracted from [54]. Table S3 shows the values of the production units and total operating cost obtained as a result of the optimization process of SAO, as well as the proposed FFDBSAO1 and FFDBSAO2 algorithms. When the generator values of the FFDBSAO2 algorithm were substituted into the total fuel cost equation, it was computed as USD 15,444.1884/h. Also, when the generator values were substituted, they met the equality limits. Table 7 presents the results of the 11 best algorithms from the literature and the results of the used SAO, FFDBSAO1, and FFDBSAO2 algorithms. The result of the proposed FFDBSAO2 approach was USD 5.4216/h, USD 5.6116/h, and USD 5.7016/h less than the results of the three best results in the literature, the RCBA, LM, and ST-IRDPSO algorithms, respectively.
Test Systems 2–3: Test systems 2 and 3 have ten generators and the total demand is 2700 MW. The difference between the two test systems is that VPE is not considered in test system 2, while VPE is considered in test system 3. The system parameters are extracted from [55]. The results of the control variables obtained from the SAO, FFDBSAO1, and FFDBSAO2 algorithms as a result of the optimization process are given in Table S4. The results of the SAO, FFDBSAO1, and FFDBSAO2 algorithms are presented in Table 8, along with the best 12 results presented in the literature for both test systems. The FFDBSAO2 algorithm achieved the optimal value for both test systems when compared to the other algorithms in the literature. Moreover, for test system 2, the FFDBSAO2 algorithm met the equality bounds with an error value of 1 × 10⁻⁴ when calculating the minimum fuel cost. For test system 3, it found the equality bound with an error value of zero and found the optimal solution value. This result proves that the algorithm effectively found the optimal solution.
Test System 4: This includes 13 generators, where only VPE is considered. The test system is evaluated at 1800 MW and 2520 MW conditions and at two different values of the coefficient to be used in the VPE of the third generator. The system parameters are taken from [48]. Thus, simulation studies were carried out by considering test system 4 in four different ways.
Test system 4.1 shows the operating situation where the requested power is 1800 MW, and the coefficient value, including the VPE of the third generator, is taken as 200. The generator values obtained from FFDBSAO2 are given in detail in Table S5. For test system 4.1, Table 9 compares the results of the SAO, FFDBSAO1, and FFDBSAO2 algorithms with the results of the 13 best algorithms presented in the literature. The FFDBSAO2 algorithm stands out as the best algorithm from the literature comparison.
Test system 4.2 defines a system with the same generator fuel cost coefficients and a demanded power value of 2520 MW. The generator values obtained as a result of the simulation study carried out under these conditions are given in Table S5. These generator values fulfilled the power balance equality constraint with a 1 × 10⁻⁴ error value inside the predefined limit values. The comparison with the literature findings showed that SAO, FFDBSAO1, and FFDBSAO2 competed against the ten best algorithms from the literature-based studies on this test system. The FFDBSAO2 algorithm ranked third in achieving the optimal value, as shown in Table S5.
In test system 4.3, the demanded power value is 1800 MW, and the third generator’s VPE coefficient value is 150. Table S5 presents the results of the simulation studies carried out based on this system. According to the literature comparison, the FFDBSAO2 algorithm obtained a value USD 0.0061/h higher than the best result in the literature. These results prove that the FFDBSAO2 algorithm effectively converged to a value better than the best value in the literature.
In test system 4.4, the coefficient value of the VPE of the third generator remained the same as in test system 4.3, while the demanded power value was increased to 2520 MW. The results obtained from test system 4.4 are given in Table S5. When the literature comparison in Table 9 is examined, the FFDBSAO2 algorithm approaches the previous six best algorithms with an error value of 3.3107 × 10⁻⁶%. This result shows that the FFDBSAO2 is a successful algorithm in finding the optimal result, similar to other algorithms in the literature.
Test System 5: This includes 13 generators, where TL and VPE are considered. While this test system met the demand power of 2520 MW, the third production unit was evaluated at two different values within the system’s cost coefficients. In addition, the coefficients in the loss matrix to calculate TL were considered in three ways. The test system was examined under four scenarios according to all these conditions. The test system parameters were taken from the relevant reference [48].
For test system 5.1, a simulation study was conducted by accepting the demanded power of 2520 MW, and the cost coefficient of VPE of the third generator was 200. Here, the values of the production units optimized by the SAO, FFDBSAO1, and FFDBSAO2 algorithms are listed in Table S6. A comparison with the literature is given in Table 10. According to the comparison results, the FFDBSAO2 algorithm yielded the best value among the results of the other algorithms presented in the literature.
For test system 5.2, while all system data remain the same for test system 5.2, the coefficient value of −0.0017 for production unit no. 11 in the loss matrix is changed to 0.0017. The optimized generator values considering these system parameters are shown in Table S6, and the literature comparison is listed in Table 10. The comparison results show that FFDBSAO2 improved on the best value in the literature by USD 1.1429/h.
For test system 5.3, the values of two parameters in the loss matrix changed. The results of the FFDBSAO2 are presented in the fourth column of Table S6. Moreover, Table 10 shows that the total cost value obtained from the FFDBSAO2 was better than for the others presented in the literature comparison.
For test system 5.4, the VPE cost coefficient value of the third generator number was accepted as 150. The results from the simulation study are given in the fifth column of Table S6. According to the comparison results in Table 10, the FFDBSAO2 algorithm found USD 24,512.1812/h, improving on the best value in the literature by USD 0.2488/h.
Test System 6: This includes 15 generators, where the operational constraints are TL, RR, and POZs. Test system 6 is evaluated in two ways, and the system’s parameters are taken from [48]. At the end of the optimization process, the values of the production units obtained by FFDBSAO2 are presented in Table S7. For test system 6.1, when the optimized parameters were substituted into the fitness function and recalculated, it was seen that the FFDBSAO2 satisfied all inequality limits. Table 11 shows the results of the 15 best algorithms in the literature. The FFDBSAO2 algorithm found the total production cost value as USD 32,692.3980/h, which was USD 8.812/h less than the result of the ESSA algorithm, the best result in the literature. For test system 6.2, simulation studies were conducted by changing the RR values of the second and fifth generators. The generator values obtained from FFDBSAO2 are shown in Table S7. A comparison of the six best algorithms in the literature is presented in Table 11. Accordingly, FFDBSAO2 showed a significant performance by finding a total fuel cost value of USD 6.6081/h less than the algorithm with the best value in the literature.
Test System 7: The system has 20 generation units, where only TL is considered. The system parameters are extracted from [53]. The optimal production values obtained by the FFDBSAO2 algorithm are tabulated in Table S8. The FFDBSAO2 provided the inequality limits when substituting these values into the fitness function. The results of the SAO, FFDBSAO1, and FFDBSAO2 algorithms are compared with those of the 13 best algorithms in the literature, which are presented in Table 12. When examining Table 12, the FFDBSAO2 algorithm obtained results closer to those of the algorithms listed before it, with an average of 3.36233 × 10⁻⁶%.
Test System 8: The test system consists of 40 production units with eight-valve points. Here, three different scenarios were created by changing the fuel cost coefficients of the production units. The system parameters are obtained from [48]. The optimal values of the production units obtained from the FFDBSAO2 for test systems 8.1, 8.2, and 8.3 are in Table S9. Moreover, the literature comparison for these test systems is presented in Table 13. According to these tables, for test system 8.1, the FFDBSAO2 algorithm showed remarkable success, finding a value close to the optimal result in the literature. For test system 8.2, the required power value and inequality limits were met when the optimal values in Table S9 were returned to the system. According to the comparison results, the FFDBSAO2 achieved a value better than any presented in the literature. For test system 8.3, the comparison results presented in Table 13 show that the FFDBSAO2 yielded the best value in the literature.
Test System 9: A large-scale power system with 110 generators is considered. The parameters of this system are taken from [48]. The values of the production units obtained from the FFDBSAO2 are presented in Table S10. A comparison of the total fuel cost values obtained from the SAO, FFDBSAO1, FFDBSAO2, and the results of nine algorithms presented in the literature is given in Table 14. The FFDBSAO2 stands out as the algorithm closest to the best value presented by the HcSCA algorithm in the literature, with an error value of USD 0.0078/h. This result shows the solution’s quality and the proposed approach’s success.

5.2.1. Convergence and Statistical Analysis of the Optimization Algorithms for ED Problem

The SAO, FFDBSAO1, and FFDBSAO2 algorithms used for solving the ED problem were run 30 times for each test system. The statistical evaluation of the obtained results is presented in Table S11. The minimum, mean, maximum, and standard deviation values presented in Table S11 were examined, and the FFDBSAO2 algorithm achieved a significant superiority over the FFDBSAO1 and SAO algorithms. The results obtained from the simulation studies conducted for the operating conditions in each test system were evaluated using the non-parametric Wilcoxon signed-rank test. This test evaluates whether the median difference between the observations in paired samples is different from zero. In other words, it is a robust and versatile tool for comparing paired data for parametric tests. Two algorithms, named algorithm “C” and algorithm “D”, are used to perform this test. The application steps of this test are as follows.
  • Take the sum of the fitness values obtained during 30 independent runs of the two algorithms selected for comparison.
  • Calculate W+, the sum of simulation rankings for which algorithm C outperforms algorithm D in 30 independent runs.
  • Calculate W−, the sum of simulation rankings for which algorithm C performs worse than algorithm D in 30 independent runs.
  • The p-value is calculated to make the results obtained from this test more meaningful and to show their importance. If this value is smaller than the determined significance level, it is expressed as strong evidence against H0.
In other words, if the p-value is smaller than the determined significance level value due to this test, the H0 hypothesis is rejected, which means that the difference between the two measurements is significant. If it is larger than the significance level value, the H0 hypothesis is accepted. In this study, the significance level is taken as σ = 0.05. The results obtained from this test are given in Table 15. A strong statistical trend emerged after examining the non-parametric statistical results obtained from 18 simulation studies. In many of the simulation studies, the FFDBSAO2 algorithm performed significantly better than the other algorithm, as expressed by the significant difference between W+ and W− and a very low p-value. According to the results obtained from test system 1, the FFDBSAO2 outperformed the FFDBSAO1, as seen in a W− value of 1 compared to W+ of 464; the p-value is 1.9209 × 10⁻⁶, which led to the rejection of H0. The pairwise rank test comparison of the FFDBSAO2 algorithm with SAO, with W+ of 465 and W− value of 0, indicates that the FFDBSAO2 performed much better than SAO. The p-value is 1.7344 × 10⁻⁶, which allows for the rejection of H0. The results confirm that the FFDBSAO2 frequently outperformed the FFDBSAO1 and SAO. The downward trend in p-values across the various test cases emphasizes the reliability of these findings. The statistically significant differences in most comparisons ensure that the observed performance changes are not due to random chance but reflect meaningful algorithmic improvements.
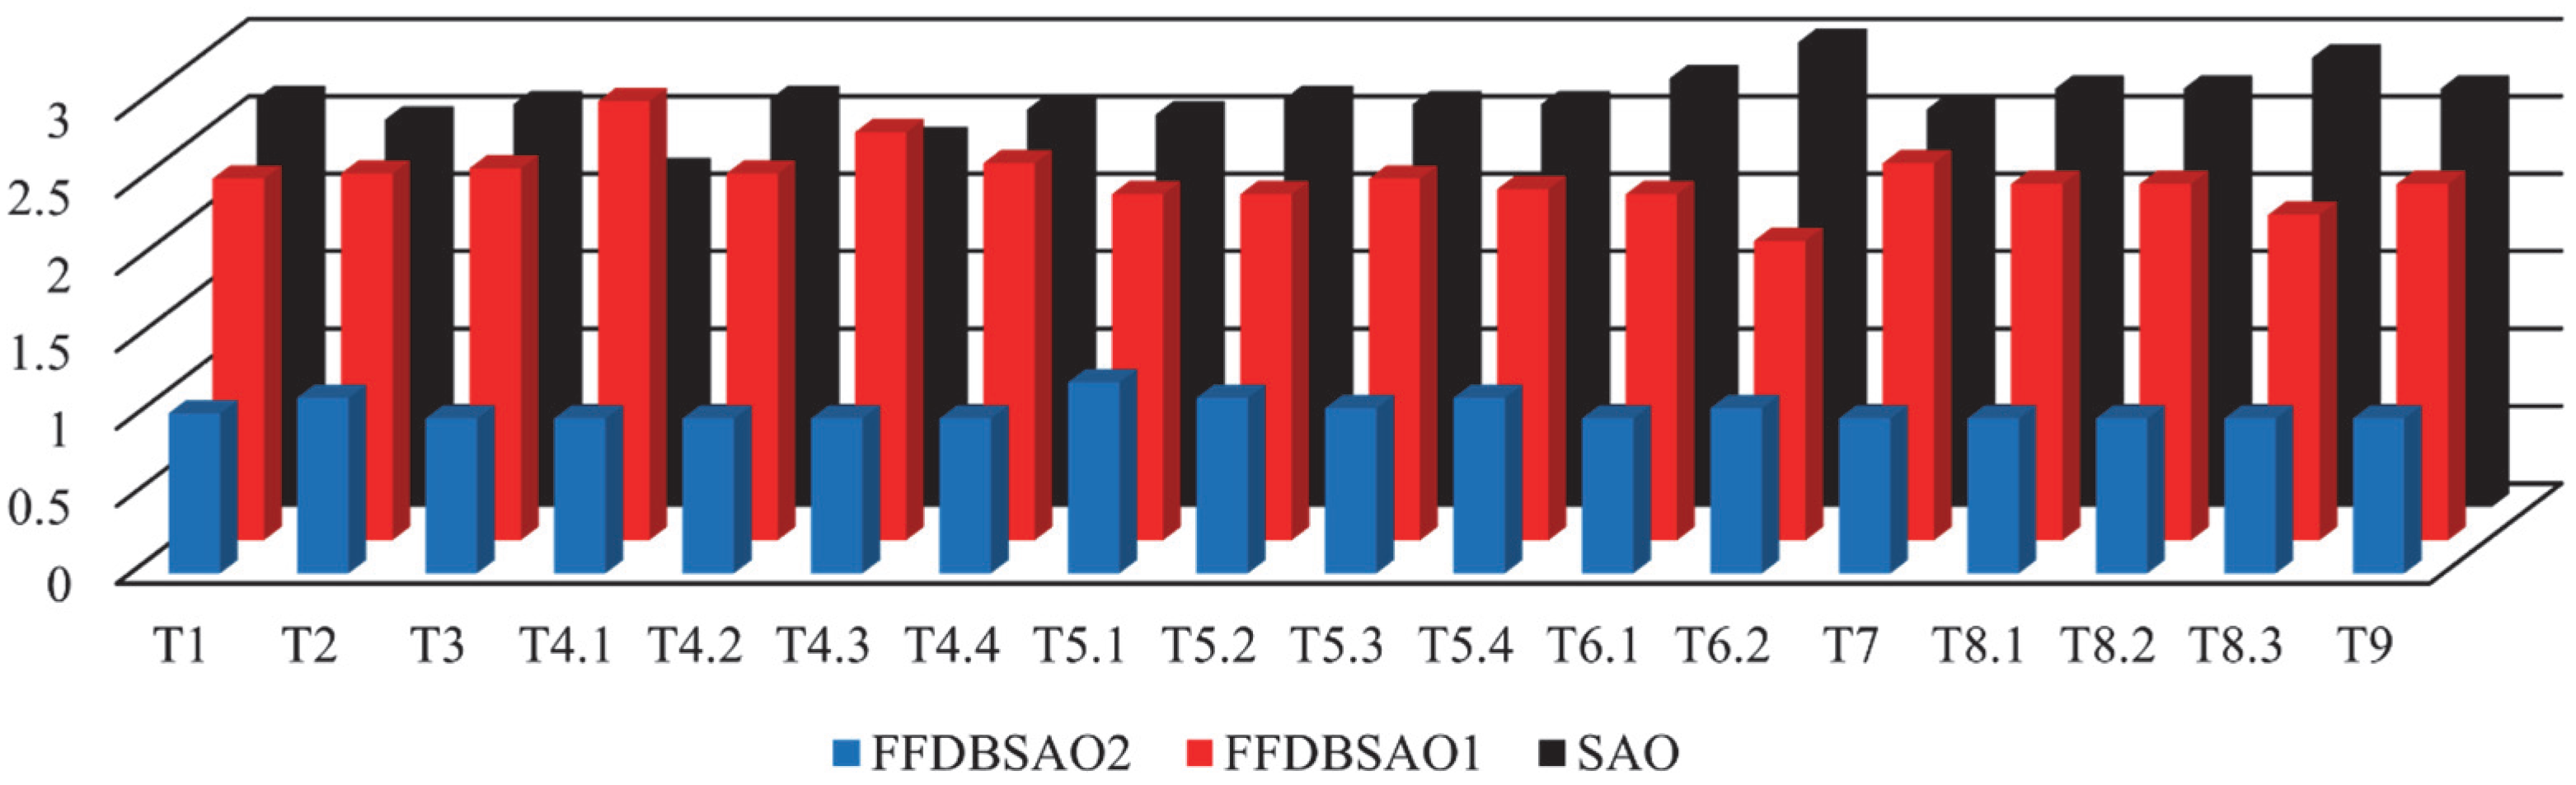
Moreover, the results obtained from the algorithms in 30 independent runs were subjected to a different statistical evaluation using Friedman analysis, one of the non-parametric statistical analysis methods. The Friedman scores obtained from 18 case studies are given in Figure 5. When Figure 5 is examined, it is seen that the Friedman scores of the FFDBSAO2 algorithm for each simulation run are overwhelmingly superior to the scores of the other algorithms.
Figure S12 presents the convergence graphs of the SAO, FFDBSAO1, and FFDBSAO2 for ED test cases. These graphs show how algorithm efficiency relates to operating cost development according to the fitness evaluation counts. All the test cases demonstrated that the FFDBSAO2 reached the optimal operating cost in the shortest possible time. The FFDBSAO2 achieved efficient cost reduction through its ability to complete its search within a restricted function evaluation range. Some test cases revealed that the SAO stopped progressing prematurely due to its inability to adjust the solution. The FFDBSAO1 algorithm exhibited a satisfactory performance level that exceeded SAO and came behind the superior FFDBSAO2. When the convergence graphs are examined in terms of final operating costs, the FFDBSAO2 algorithm showed strong optimization performance by reaching the lowest values among all the test cases. While the FFDBSAO1 reached competitive cost levels, it required significantly more fitness function evaluations to achieve this. On the other hand, the SAO struggled to reach a similar performance, as seen in test cases 5.4, 6.2, and 9, where it remained relatively stagnant. The effectiveness of the performances of these algorithms becomes more evident in different test cases; in lower-cost test cases such as test cases 2 and 3, all algorithms exhibited relatively close convergence trends, while the proposed FFDBSAO2 algorithm outperformed other algorithms in efficiency. In higher-cost test cases such as test cases 8.1 and 8.2, the FFDBSAO2 achieved a significantly lower operating cost in fewer evaluations, proving that its performance in convergence to the optimum point was better than the other algorithms. It is clear from Figure S12 that despite the differences in problem complexity, the FFDBSAO2 algorithm consistently outperformed the other algorithms.
The performance on the ED problem shows visible links through box plots in Figure S13 for SAO, FFDBSAO1, and FFDBSAO2 for all test cases. Figure S13 expresses average operating cost distributions from multiple runs to show how changes in the fitness function affect stability during convergence, and the resilience of the methods. Consistent with a stable optimization performance, the FFDBSAO2 method routinely achieved the lowest median total cost in all test systems. The FFDBSAO2 algorithm demonstrated high stability as shown by its minimum interquartile range, indicating low result variability. Analysis of the plots indicates that the FFDBSAO consistently found high-quality solutions because extreme outliers do not appear in the data. The FFDBSAO2 boxplot shows compression at the low end during multiple test cases, thus enhancing solution quality by achieving optimal results with minimal deviation. The performance of the FFDBSAO1 stands between the SAO and FFDBSAO2 since it had lower costs than the SAO but did not equal the FFDBSAO2’s efficiency. However, the FFDBSAO1 showed a significant decreasing trend in the fitness function value, indicating that it improved over time, although it was not as efficient as FFDBSAO2. On the other hand, the SAO had the highest median value in almost all the test systems, as seen in Figure S2. This made it the least efficient algorithm among the three algorithms.

5.2.2. Stability Analysis of the Optimization Algorithms for ED Problem

In this section, a stability analysis was applied to show the accuracy and reliability of the FFDBSAO2 algorithm in solving the ED problem compared to the FFDBSAO1 and SAO algorithms. Stability analysis is a method used in the literature to evaluate the performance of an algorithm in solving an optimization problem. It provides a comprehensive evaluation of the performance of an algorithm, measuring its efficiency, reliability, and computational cost [51,121].
It is beneficial for evaluating different algorithms and determining which is better for an optimization problem. While evaluating the performance of algorithms, three performance metrics, success rate, the average iteration number, and the average search time, are considered. The definitions of these metrics are given below.
Success rate (SR, %): This is defined as the percentage of successful runs (NSR) from the total runs (NR) where the algorithm can obtain a feasible solution [121]. For an optimization problem, a high SR percentage indicates that the algorithm is a more accurate method, while a low SR percentage indicates that the algorithm is not reliable. It is computed using Equation (29).
S R % = N S R N R × 100
Average iteration number (AIT): This can be defined as the average number of iterations for which the algorithm finds a feasible solution for multiple runs [121]. Low iteration values mean the algorithm converges quickly to a feasible solution. The AIT is calculated with Equation (30), where only the iteration numbers of the successful runs are considered in the calculation.
A I T = 1 N S R m = 1 N S R i t e r a t i o n m
Average search time (AST): The search time (st) is the duration required for an algorithm to obtain a feasible solution. The AST is the average time of the algorithm’s successful runs across multiple runs [121]. It is computed as
A S T = 1 N S R m = 1 N S R s t m
In this study, the eighteen ED case studies were considered and solved using the FFDBSAO2, FFDBSAO1, and SAO algorithms. The stability analysis results obtained from these algorithms are presented in Table 16.
Assessment of SR values: According to Table 16, among the three algorithms, the FFDBSAO2 established itself as the most proficient algorithm, with an 86.67% average SR value, because it successfully generated solutions across all case studies. The high SR value indicates that the FFDBSAO2 was the most dependable solution for these optimization problems. The average SR values for the FFDBSAO1 and SAO were much lower, at 26.48% and 29.44%, respectively. The SR values of the success rate for the FFDBSAO1 and SAO confirmed that their solutions were unreliable because no sufficient solutions were discovered in several iterations. The FFDBSAO2 demonstrated consistently high SR values through individual test case observations because it found feasible solutions in all 100% of the examined case studies. Moreover, the FFDBSAO1 and SAO failed to discover feasible solutions since they recorded 0% SR values in test systems 6.2, 8.1, 8.2, 8.3, and 9. Therefore, the FFDBSAO1 and SAO showed unreliable performance because their solutions remained inconsistent, making them unfit for stable practical optimization requirements.
Assessment of AST values: When evaluating AST values, it is important to note that a lower MST is good only if SR is high; otherwise, the algorithm finds solutions fast in rare cases but mostly fails. From Table 16, the FFDBSAO1 and SAO had lower AST values, with averages of 2.60 and 2.16 s, respectively, showing that they solved problems rapidly when they did succeed. However, because their SR values were low, their speed advantage was less significant because they failed to solve most case studies. On the other hand, the FFDBSAO2, with an AST of 9.59 s, took somewhat longer to converge but had a substantially better chance of success.
Assessment of AIT values: From Table 16, the FFDBSAO2 was the most efficient in terms of iterations because it balanced feasibility and computational cost. The FFDBSAO1 and SAO took longer to converge, and since their SR was low, this suggests that they often failed despite running many iterations. With an average of 940.27 iterations per successful run, FFDBSAO2 had the lowest AIT value of the three algorithms. This proves that, in comparison to the other algorithms, FFDBSAO2 was computationally efficient since it needed fewer iterations to arrive at a workable solution. The SAO and FFDBSAO1 showed higher average AIT values than the FFDBSAO2. With low success rates, the FFDBSAO1 and SAO’s higher MIT values indicate that they were unreliable and inefficient even when they succeeded.
Consequently, the FFDBSAO1 demonstrated better reliability, efficiency, and computational cost performance than FFDBSAO1 and SAO according to the stability analysis results. The FFDBSAO1 demonstrated the most reliable performance because it achieved an 86.67% SR value and operated with 940.27 iterations and a 9.59 s search time. The search times of the FFDBSAO1 and SAO were short, but their stability was compromised because of their inadequate success rates and excessive use of iterations. Practical implementations requiring dependable and steady performance should employ the FFDBSAO2 as the preferred algorithm.

6. Conclusions

This study presents an improvement of the SAO algorithm integrated with the FFDB method for solving the ED problem in small-, medium-, and large-scale power systems involving fossil fuel thermal generation units. According to the findings obtained in the study, the following conclusions are reached.
  • The results reveal the improved performance of the FFDBSAO algorithm in solving the ED problem in power systems of different scales. Since the SAO algorithm becomes stuck in local solution traps in different optimization problems, the FFDB method is used to dynamically balance the exploration and exploitation features of the algorithm, prevent premature convergence, and strengthen its adaptability to different optimization problems. The performance of the FFDBSAO algorithm was tested on CEC2020, CEC2022, and classic benchmark test functions. The simulation results of the SAO and its variations were evaluated using the Wilcoxon and Friedman statistical methods. According to the evaluation results, the FFDBSAO2 lost 8 out of 124 problems against the SAO algorithm, tied in 32, and won in 84. Moreover, the FFDBSAO2 performed better in solving benchmark problems, with a 67.7419% winning percentage and a 6.4516% losing percentage against the SAO algorithm. In addition, regarding scalability, the FFDBSAO2 algorithm was a strong alternative to the computational difficulties encountered by traditional optimization methods in solving optimization problems of different sizes. When the FFDBSAO2 algorithm was evaluated regarding the development of exploration and exploitation features, the FFDBSAO2 algorithm exhibited superior performance compared to other algorithms in reaching the optimal solution by minimizing the risk of premature convergence, especially in complex and high-dimensional problems. Thanks to adaptive exploration and exploitation strategies, it maintained its effectiveness in the global search process and performed more sensitive improvements around the optimal solutions.
  • The most important advantage of the FFDBSAO2 algorithm is its scalability, exploration, and exploitation features in benchmark test functions. The FFDBSAO2 algorithm was used for optimal planning of fossil fuel thermal generation units, including different inequality constraints in small-, medium-, and large-scale power systems. The superior performance of the FFDBSAO2 algorithm in ED problems was provided by its advanced exploration and exploitation mechanisms, as well as fast and stable convergence ability. According to the stability analysis results, while the FFDBSAO2 achieved 86.67% success, the SAO obtained 29.44% success on the 18 case studies.
  • The Wilcoxon signed-rank test and Friedman analysis results showed that the algorithm was statistically significantly superior to the other methods. The convergence and box plots proved that the FFDBSAO2 achieved lower operating costs faster and produced stable solutions. These contributions provided the FFDBSAO2 algorithm with the ability to increase computational efficiency and improve solution quality in optimization processes compared to the SAO and FFDBSAO1 algorithms.
  • The successful results obtained by the FFDBSAO2 algorithm indicate that it can be an alternative method for solving different optimization problems in future studies. The superior scalability of the FFDBSAO2 algorithm improves its usability in different scientific and engineering fields by outperforming both SAO and FFDBSAO1 algorithms on benchmark test functions and high-dimensional optimization problems. The dynamic balancing ability in its exploration and exploitation mechanisms makes the algorithm an important solution for solving more complex and multimodal optimization problems. The proposed algorithm is useful in many energy system and financial modeling applications because of its low running expense and quick problem-solving ability in complex power system planning problems such as ED problems. Hybrid optimization methods must integrate uncertainty handling features into FFDBSAO2 for implementation on different computing platforms. Future investigations will improve the effectiveness of optimization research by combining FFDBSAO2 with generation optimization methods.

Supplementary Materials

The following supporting information can be downloaded at: https://www.mdpi.com/article/10.3390/en18123048/s1, Figure S1: Friedman scores for CEC2020 benchmark suite of all algorithms; Figure S2: Friedman scores for CEC2022 benchmark functions of optimization algorithms; Figure S3: Friedman scores for the classic 23 and classic 27 benchmark functions of all algorithms; Figure S4: Convergence curves of the algorithms according to maxFEs for selected CEC2020 functions; Figure S5: Convergence curves of the algorithms by iteration for selected CEC 2020 functions; Figure S6: Boxplot graphs of all algorithms for selected CEC2020 functions; Figure S7: Convergence curves of all algorithms according to maxFEs for selected CEC2022 functions; Figure S8: Convergence curves of the algorithms by iteration for selected CEC 2020 functions; Figure S9: Boxplots of all algorithms for selected CEC2022 functions; Figure S10: Convergence curves of all algorithms according to maxFEs for selected classic 27 benchmark functions; Figure S11: Boxplots of all algorithms for selected classic 27 benchmark functions; Figure S12: Convergence curves of optimization algorithms for all test systems; Figure S13: Boxplot of optimization algorithms for all test systems Table S1: Mean and standard deviation values of all algorithms for CEC2020 benchmark test functions; Table S2: Mean and standard deviation values of all algorithms for CEC2022 benchmark test functions; Table S3: The results obtained from SAO, FFDBSAO1, and FFDBSAO2 algorithms for Test System 1; Table S4: The results obtained from SAO, FFDBSAO1, and FFDBSAO2 algorithms for Test Systems 2 and 3; Table S5: The results obtained from FFDBSAO2 algorithm for Test Systems 4.1, 4.2, 4.3, and 4.4; Table S6: The results obtained from FFDBSAO2 algorithm for Test Systems 5.1, 5.2, 5.3, and 5.4; Table S7: The results obtained from FFDBSAO2 algorithm for Test Systems 6.1 and 6.2; Table S8: The results obtained from FFDBSAO2 algorithm for Test System 7; Table S9: The results obtained from FFDBSAO2 algorithm for Test Systems 8.1, 8.2, and 8.3; Table S10: The results obtained from FFDBSAO2 algorithm for Test System 9; Table S11: The statistical results of SAO, FFDBSAO1, and FFDBSAO2 algorithms for all test systems.

Author Contributions

Conceptualization, M.D., S.D. and B.O.; methodology, M.D. and S.D.; software, M.D. and S.D.; validation, S.D., M.K.D. and U.G.; formal analysis, M.D., S.D. and B.O.; investigation, M.D., S.D., B.O., Y.B., D.E., M.K.D., U.G., B.E.A., H.U. and E.K.; resources, M.D., B.E.A., Y.B., H.U. and E.K.; data curation, M.D., S.D. and B.O.; writing—original draft preparation, M.D., S.D., Y.B. and E.K.; writing—review and editing, M.D., B.O., U.G. and H.U.; visualization, M.D., S.D. and M.K.D.; supervision, S.D. and B.O.; project administration, S.D. All authors have read and agreed to the published version of the manuscript.

Funding

This research received no external funding.

Data Availability Statement

The data presented in this study are available on request from the corresponding author.

Conflicts of Interest

The authors declare no conflict of interest.

References

  1. Kunya, A.B.; Abubakar, A.S.; Yusuf, S.S. Review of economic dispatch in multi-area power system: State-of-the-art and future prospective. Electr. Power Syst. Res. 2023, 217, 109089. [Google Scholar] [CrossRef]
  2. Vaisakh, K.; Reddy, A.S. MSFLA/GHS/SFLA-GHS/SDE algorithms for economic dispatch problem considering multiple fuels and valve point loadings. Appl. Soft Comput. 2013, 13, 4281–4291. [Google Scholar] [CrossRef]
  3. Jeddi, B.; Vahidinasab, V. A modified harmony search method for environmental/economic load dispatch of real-world power systems. Energy Convers. Manag. 2014, 78, 661–675. [Google Scholar] [CrossRef]
  4. Garver, L.L. Power Generation Scheduling by Integer Programming—Development of Theory. Trans. Am. Inst. Electr. Eng. Part III Power Appar. Syst. 1962, 81, 730–734. [Google Scholar] [CrossRef]
  5. Carrión, M.; Arroyo, J.M. A computationally efficient mixed-integer linear formulation for the thermal unit commitment problem. IEEE Trans. Power Syst. 2006, 21, 1371–1378. [Google Scholar] [CrossRef]
  6. Wood, A.J.; Wollenberg, B.F.; Sheblé, G.B. Power Generation, Operation, and Control, 3rd ed.; Wiley: Hoboken, NJ, USA, 2013. [Google Scholar]
  7. Sasson, A.M. Nonlinear programming solutions for load-flow, minimum-loss, and economic dispatching problems. IEEE Trans. Power Appar. Syst. 1969, PAS-88, 399–409. [Google Scholar] [CrossRef]
  8. Lowery, P.G. Generating unit commitment by dynamic programming. IEEE Trans. Power Appar. Syst. 1966, PAS-85, 422–426. [Google Scholar] [CrossRef]
  9. Bard, J.F. Short-term scheduling of thermal-electric generators using Lagrangian relaxation. Oper. Res. 1988, 36, 756–766. [Google Scholar] [CrossRef]
  10. Park, J.B.; Lee, K.S.; Shin, J.R.; Lee, K.Y. A particle swarm optimization for economic dispatch with nonsmooth cost functions. IEEE Trans. Power Syst. 2005, 20, 34–42. [Google Scholar] [CrossRef]
  11. Noman, N.; Iba, H. Differential evolution for economic load dispatch problems. Electr. Power Syst. Res. 2008, 78, 1322–1331. [Google Scholar] [CrossRef]
  12. Sahoo, S.; Dash, K.M.; Prusty, R.C.; Barisal, A.K. Comparative analysis of optimal load dispatch through evolutionary algorithms. Ain Shams Eng. J. 2015, 6, 107–120. [Google Scholar] [CrossRef]
  13. Modiri-Delshad, M.; Kaboli, S.H.A.; Taslimi-Renani, E.; Rahim, N.A. Backtracking search algorithm for solving economic dispatch problems with valve-point effects and multiple fuel options. Energy 2016, 116, 637–649. [Google Scholar] [CrossRef]
  14. Elhameed, M.A.; El-Fergany, A.D. Water cycle algorithm-based economic dispatcher for sequential and simultaneous objectives including practical constraints. Appl. Soft Comput. 2017, 58, 145–154. [Google Scholar] [CrossRef]
  15. Liang, H.; Liu, Y.; Shen, Y.; Li, F.; Man, Y. A hybrid bat algorithm for economic dispatch with random wind power. IEEE Trans. Power Syst. 2018, 33, 5052–5061. [Google Scholar] [CrossRef]
  16. Gholamghasemi, M.; Akbari, E.; Asadpoor, M.B.; Ghasemi, M. A new solution to the non-convex economic load dispatch problems using phasor particle swarm optimization. Appl. Soft Comput. 2019, 79, 111–124. [Google Scholar] [CrossRef]
  17. Ghasemi, M.; Davoudkhani, I.F.; Akbari, E.; Rahimnejad, A.; Ghavidel, S.; Li, L. A novel and effective optimization algorithm for global optimization and its engineering applications: Turbulent Flow of Water-based Optimization (TFWO). Eng. Appl. Artif. Intell. 2020, 92, 103666. [Google Scholar] [CrossRef]
  18. dos Santos Coelho, L.; Mariani, V.C. An improved harmony search algorithm for power economic load dispatch. Energy Convers. Manag. 2009, 50, 2522–2526. [Google Scholar] [CrossRef]
  19. Qin, Q.; Cheng, S.; Chu, X.; Lei, X.; Shi, Y. Solving non-convex/non-smooth economic load dispatch problems via an enhanced particle swarm optimization. Appl. Soft Comput. 2017, 59, 229–242. [Google Scholar] [CrossRef]
  20. Amjady, N.; Nasiri-Rad, H. Solution of nonconvex and nonsmooth economic dispatch by a new adaptive real coded genetic algorithm. Expert Syst. Appl. 2010, 37, 5239–5245. [Google Scholar] [CrossRef]
  21. Zou, D.; Li, S.; Wang, G.G.; Li, Z.; Ouyang, H. An improved differential evolution algorithm for the economic load dispatch problems with or without valve-point effects. Appl. Energy 2016, 181, 375–390. [Google Scholar] [CrossRef]
  22. Barisal, A.K. Dynamic search space squeezing strategy based intelligent algorithm solutions to economic dispatch with multiple fuels. Int. J. Electr. Power Energy Syst. 2013, 45, 50–59. [Google Scholar] [CrossRef]
  23. Secui, D.C. A new modified artificial bee colony algorithm for the economic dispatch problem. Energy Convers. Manag. 2015, 89, 43–62. [Google Scholar] [CrossRef]
  24. Yang, Y.; Wei, B.; Liu, H.; Zhang, Y.; Zhao, J.; Manla, E. Chaos firefly algorithm with self-adaptation mutation mechanism for solving large-scale economic dispatch with valve-point effects and multiple fuel options. IEEE Access 2018, 6, 45907–45922. [Google Scholar] [CrossRef]
  25. Zhao, J.; Liu, S.; Zhou, M.; Guo, X.; Qi, L. Modified cuckoo search algorithm to solve economic power dispatch optimization problems. IEEE/CAA J. Autom. Sin. 2018, 5, 794–806. [Google Scholar] [CrossRef]
  26. Li, X.; Zhang, H.; Lu, Z. A differential evolution algorithm based on multi-population for economic dispatch problems with valve-point effects. IEEE Access 2019, 7, 95585–95609. [Google Scholar] [CrossRef]
  27. Elsayed, W.T.; Hegazy, Y.G.; Bendary, F.M.; El-Bages, M.S. Modified social spider algorithm for solving the economic dispatch problem. Eng. Sci. Technol. Int. J. 2016, 19, 1672–1681. [Google Scholar] [CrossRef]
  28. Dieu, V.N.; Ongsakul, W.; Polprasert, J. The augmented Lagrange Hopfield network for economic dispatch with multiple fuel options. Math. Comput. Model. 2013, 57, 30–39. [Google Scholar] [CrossRef]
  29. Barisal, A.K.; Prusty, R.C. Large scale economic dispatch of power systems using oppositional invasive weed optimization. Appl. Soft Comput. 2015, 29, 122–137. [Google Scholar] [CrossRef]
  30. Kumar, M.; Dhillon, J.S. Hybrid artificial algae algorithm for economic load dispatch. Appl. Soft Comput. 2018, 71, 89–109. [Google Scholar] [CrossRef]
  31. Al-Betar, M.A.; Awadallah, M.A.; Khader, A.T.; Bolaji, A.L.; Almomani, A. Economic load dispatch problems with valve-point loading using natural updated harmony search. Neural Comput. Appl. 2016, 29, 767–781. [Google Scholar] [CrossRef]
  32. Pradhan, M.; Roy, P.K.; Pal, T. Oppositional based grey wolf optimization algorithm for economic dispatch problem of power system. Ain Shams Eng. J. 2018, 9, 2015–2025. [Google Scholar] [CrossRef]
  33. Yu, J.T.; Kim, C.H.; Wadood, A.; Khurshaid, T.; Rhee, S.B. Jaya algorithm with self-adaptive multi-population and Lévy flights for solving economic load dispatch problems. IEEE Access 2019, 7, 21372–21384. [Google Scholar] [CrossRef]
  34. Zhang, Q.; Zou, D.; Duan, N.; Shen, X. An adaptive differential evolutionary algorithm incorporating multiple mutation strategies for the economic load dispatch problem. Appl. Soft Comput. 2019, 78, 641–669. [Google Scholar] [CrossRef]
  35. Kumar, M.; Dhillon, J.S. A conglomerated ion-motion and crisscross search optimizer for electric power load dispatch. Appl. Soft Comput. 2019, 83, 105641. [Google Scholar] [CrossRef]
  36. Zheng, Z.X.; Li, J.Q.; Sang, H.Y. A hybrid invasive weed optimization algorithm for the economic load dispatch problem in power systems. Math. Biosci. Eng. 2019, 16, 2775–2794. [Google Scholar] [CrossRef]
  37. Huang, Z.; Zhao, J.; Qi, L.; Gao, Z.; Duan, H. Comprehensive learning cuckoo search with chaos-lambda method for solving economic dispatch problems. Appl. Intell. 2020, 50, 2779–2799. [Google Scholar] [CrossRef]
  38. Tabassum, M.F.; Saeed, M.; Chaudhry, N.A.; Ali, J.; Farman, M.; Akram, S. Evolutionary simplex adaptive Hooke-Jeeves algorithm for economic load dispatch problem considering valve point loading effects. Ain Shams Eng. J. 2021, 12, 1001–1015. [Google Scholar] [CrossRef]
  39. Kaur, G.; Dhillon, J.S. Economic power generation scheduling exploiting hill-climbed Sine–Cosine algorithm. Appl. Soft Comput. 2021, 111, 107690. [Google Scholar] [CrossRef]
  40. Hassan, M.H.; Kamel, S.; Abualigah, L.; Eid, A. Development and application of slime mould algorithm for optimal economic emission dispatch. Expert Syst. Appl. 2021, 182, 115205. [Google Scholar] [CrossRef]
  41. Xu, S.; Xiong, G.; Mohamed, A.W.; Bouchekara, H.R. Forgetting velocity based improved comprehensive learning particle swarm optimization for non-convex economic dispatch problems with valve-point effects and multi-fuel options. Energy 2022, 256, 124511. [Google Scholar] [CrossRef]
  42. Vedik, B.; Naveen, P.; Shiva, C.K. A novel disruption based symbiotic organisms search to solve economic dispatch. Evol. Intell. 2020, 15, 255–290. [Google Scholar] [CrossRef]
  43. Kumar, A.; Thakur, M.; Mittal, G. Planning optimal power dispatch schedule using constrained ant colony optimization. Appl. Soft Comput. 2022, 115, 108132. [Google Scholar] [CrossRef]
  44. Liu, Q.; Xiong, G.; Fu, X.; Mohamed, A.W.; Zhang, J.; Al-Betar, M.A.; Chen, H.; Chen, J.; Xu, S. Hybridizing gaining–sharing knowledge and differential evolution for large-scale power system economic dispatch problems. J. Comput. Des. Eng. 2023, 10, 615–631. [Google Scholar] [CrossRef]
  45. Abbas, G.; Khan, I.A.; Ashraf, N.; Raza, M.T.; Rashad, M.; Muzzammel, R. On employing a constrained nonlinear optimizer to constrained economic dispatch problems. Sustainability 2023, 15, 9924. [Google Scholar] [CrossRef]
  46. Al-Betar, M.A.; Awadallah, M.A.; Zitar, R.A.; Assaleh, K. Economic load dispatch using memetic sine cosine algorithm. J. Ambient Intell. Humaniz. Comput. 2022, 14, 11685–11713. [Google Scholar] [CrossRef] [PubMed]
  47. Braik, M.S.; Awadallah, M.A.; Al-Betar, M.A.; Hammouri, A.I.; Zitar, R.A. A non-convex economic load dispatch problem using chameleon swarm algorithm with roulette wheel and Lévy flight methods. Appl. Intell. 2023, 53, 17508–17547. [Google Scholar] [CrossRef]
  48. Visutarrom, T.; Chiang, T.C. Economic dispatch using metaheuristics: Algorithms, problems, and solutions. Appl. Soft Comput. 2024, 150, 110891. [Google Scholar] [CrossRef]
  49. Deng, L.; Liu, S. Snow ablation optimizer: A novel metaheuristic technique for numerical optimization and engineering design. Expert Syst. Appl. 2023, 225, 120069. [Google Scholar] [CrossRef]
  50. Kahraman, H.T.; Aras, S.; Gedikli, E. Fitness-distance balance (FDB): A new selection method for meta-heuristic search algorithms. Knowl.-Based Syst. 2020, 190, 105169. [Google Scholar] [CrossRef]
  51. Orero, S.O.; Irving, M.R. Large scale unit commitment using a hybrid genetic algorithm. Int. J. Electr. Power Energy Syst. 1997, 19, 45–55. [Google Scholar] [CrossRef]
  52. Sinha, N.; Chakrabati, R.; Chattopadhyay, P.K. Evolutionary programming techniques for economic load dispatch. IEEE Trans. Evol. Comput. 2003, 7, 83–94. [Google Scholar] [CrossRef]
  53. Su, C.T.; Lin, C.T. New approach with a Hopfield modeling framework to economic dispatch. IEEE Trans. Power Syst. 2000, 15, 541–545. [Google Scholar]
  54. Gaing, Z.L. Particle swarm optimization to solving the economic dispatch considering the generator constraints. IEEE Trans. Power Syst. 2003, 18, 1187–1195. [Google Scholar] [CrossRef]
  55. Chiang, C.L. Improved genetic algorithm for power economic dispatch of units with valve-point effects and multiple fuels. IEEE Trans. Power Syst. 2005, 20, 1690–1699. [Google Scholar] [CrossRef]
  56. Jia, H.; You, F.; Wu, D.; Rao, H.; Wu, H.; Abualigah, L. Improved snow ablation optimizer with heat transfer and condensation strategy for global optimization problem. J. Comput. Des. Eng. 2023, 10, 2177–2199. [Google Scholar] [CrossRef]
  57. Xiao, Y.; Cui, H.; Hussien, A.G.; Hashim, F.A. MSAO: A multi-strategy boosted snow ablation optimizer for global optimization and real-world engineering applications. Adv. Eng. Inform. 2024, 61, 102464. [Google Scholar] [CrossRef]
  58. Abd Elaziz, M.; Al-qaness, M.A.A.; Ibrahim, R.A.; Ewees, A.A.; Shrahili, M. Multilevel thresholding aerial image segmentation using comprehensive learning-based snow ablation optimizer with double attractors. Egypt. Inform. J. 2024, 27, 100500. [Google Scholar] [CrossRef]
  59. Zhong, R.; Zhang, C.; Yu, J. Improved snow ablation optimization for multilevel threshold image segmentation. Clust. Comput. 2025, 28, 16. [Google Scholar] [CrossRef]
  60. Ozkaya, B.; Duman, S.; Isen, E. Enhanced manta ray foraging optimization algorithm involving fuzzy-based fitness-distance balance method for estimation of unidentified parameters of PEMFC model. Electr. Eng. 2024. [Google Scholar] [CrossRef]
  61. Ebbed, M.; Ali, S.; Kassem, A.M.; Hassem, M.; Kamel, S.; Hussien, A.G.; Jurado, F.; Mohamed, E.A. Solving stochastic optimal reactive power dispatch using an Adaptive Beluga Whale optimization considering uncertainties of renewable energy resources and the load growth. Ain Shams Eng. J. 2024, 15, 102762. [Google Scholar] [CrossRef]
  62. Liu, Q.; Zhang, C.; Li, Z.; Peng, T.; Zhang, Z.; Du, D.; Nazir, M.S. Multi-strategy adaptive guidance differential evolution algorithm using fitness-distance balance and opposition-based learning for constrained global optimization of photovoltaic cells and modules. Appl. Energy 2024, 353, 122032. [Google Scholar] [CrossRef]
  63. Wang, Z.; Peng, T.; Zhang, X.; Chen, J.; Qian, S.; Zhang, C. Enhancing multi-step short-term solar radiation forecasting based on optimized generalized regularized extreme learning machine and multi-scale Gaussian data augmentation technique. Appl. Energy 2025, 377, 124708. [Google Scholar] [CrossRef]
  64. Guvenc, U.; Duman, S.; Kahraman, H.T.; Aras, S.; Kati, M. Fitness distance balance based adaptive guided differential evolution algorithm for security-constrained optimal power flow problem incorporating renewable energy sources. Appl. Soft Comput. 2021, 108, 107421. [Google Scholar] [CrossRef]
  65. Duman, S.; Kahraman, H.T.; Sonmez, Y.; Guvenc, U.; Kati, M.; Aras, S. A powerful meta-heuristic search algorithm for solving global optimization and real-world solar photovoltaic parameter estimation problems. Eng. Appl. Artif. Intell. 2022, 111, 104763. [Google Scholar] [CrossRef]
  66. Bakir, H.; Guvenc, U.; Kahraman, H.T.; Duman, S. Improved Lévy flight distribution algorithm with FDB-based guiding mechanism for AVR system optimal design. Comput. Ind. Eng. 2022, 168, 108032. [Google Scholar] [CrossRef]
  67. Duman, S.; Yorukeren, N.; Altas, I.H. A novel modified hybrid PSOGSA based on fuzzy logic for non-convex economic dispatch problem with valve-point effect. Int. J. Electr. Power Energy Syst. 2015, 64, 121–135. [Google Scholar] [CrossRef]
  68. Niknam, T.; Mojarrad, H.D.; Meymand, H.Z. Non-smooth economic dispatch computation by fuzzy and self adaptive particle swarm optimization. Appl. Soft Comput. 2011, 11, 2805–2817. [Google Scholar] [CrossRef]
  69. Joorabian, M.; Afzalan, E. Optimal power flow under both normal and contingent operation conditions using the hybrid fuzzy particle swarm optimisation and Nelder–Mead algorithm (HFPSO–NM). Appl. Soft Comput. 2014, 14, 623–633. [Google Scholar] [CrossRef]
  70. Ramachandran, M.; Mirjalili, S.; Ramalingam, M.M.; Gnanakkan, C.A.R.C.; Parvathysankar, D.S.; Sundaram, A. A ranking-based fuzzy adaptive hybrid crow search algorithm for combined heat and power economic dispatch. Expert Syst. Appl. 2022, 197, 116625. [Google Scholar] [CrossRef]
  71. Wolpert, D.H.; Macready, W.G. No Free Lunch Theorems for Optimization. IEEE Trans. Evol. Comput. 1997, 1, 67–82. [Google Scholar] [CrossRef]
  72. Hussain, K.; Salleh, M.N.M.; Cheng, S.; Shi, Y. On the exploration and exploitation in popular swarm-based metaheuristic algorithms. Neural Comput. Appl. 2018, 31, 7665–7683. [Google Scholar] [CrossRef]
  73. Sowmya, R.; Premkumar, M.; Jangir, P. Newton-Raphson-based optimizer: A new population-based metaheuristic algorithm for continuous optimization problems. Eng. Appl. Artif. Intell. 2024, 128, 107532. [Google Scholar] [CrossRef]
  74. Gao, Y.; Zhang, J.; Wang, Y.; Wang, J.; Qin, L. Love Evolution Algorithm: A stimulus–value–role theory-inspired evolutionary algorithm for global optimization. J. Supercomput. 2024, 80, 1346–12407. [Google Scholar]
  75. Zhao, W.; Wang, L.; Zhang, Z.; Fan, H.; Zhang, J.; Mirjalili, S.; Khodadadi, M.; Cao, Q. Electric eel foraging optimization: A new bio-inspired optimizer for engineering applications. Expert Syst. Appl. 2024, 238, 122200. [Google Scholar] [CrossRef]
  76. Secui, D.C.; Bendea, G.; Cristina, H.O.R.A. A modified harmony search algorithm for the economic dispatch problem. Stud. Inform. Control 2014, 23, 143–152. [Google Scholar] [CrossRef]
  77. Goni, M.O.F.; Nahiduzzaman, M.; Anower, M.S.; Kamwa, I.; Muyeen, S.M. Integration of machine learning with economic energy scheduling. Int. J. Electr. Power Energy Syst. 2022, 142, 108343. [Google Scholar] [CrossRef]
  78. Elsayed, W.T.; Hegazy, Y.G.; El-Bages, M.S.; Bendary, F.M. Improved random drift particle swarm optimization with self-adaptive mechanism for solving the power economic dispatch problem. IEEE Trans. Ind. Inform. 2017, 13, 1017–1026. [Google Scholar] [CrossRef]
  79. Wang, L.; Li, L.P. An effective differential harmony search algorithm for solving non-convex economic load dispatch problems. Int. J. Electr. Power Energy Syst. 2013, 44, 832–843. [Google Scholar] [CrossRef]
  80. Balamurugan, R.; Subramanian, S. Hybrid integer coded differential evolution–dynamic programming approach for economic load dispatch with multiple fuel options. Energy Convers. Manag. 2008, 49, 608–614. [Google Scholar] [CrossRef]
  81. Amjady, N.; Nasiri-Rad, H. Nonconvex economic dispatch with AC constraints by a new real coded genetic algorithm. IEEE Trans. Power Syst. 2009, 24, 1489–1502. [Google Scholar] [CrossRef]
  82. Lin, C.E.; Viviani, G.L. Hierarchical economic dispatch for piecewise quadratic cost functions. IEEE Trans. Power Appar. Syst. 1984, PAS-103, 1170–1175. [Google Scholar] [CrossRef]
  83. Ghasemi, M.; Taghizadeh, M.; Ghavidel, S.; Abbasian, A. Colonial competitive differential evolution: An experimental study for optimal economic load dispatch. Appl. Soft Comput. 2016, 40, 342–363. [Google Scholar] [CrossRef]
  84. Park, J.H.; Kim, Y.S.; Eom, I.K.; Lee, K.Y. Economic load dispatch for piecewise quadratic cost function using Hopfield neural network. IEEE Trans. Power Syst. 1993, 8, 1030–1038. [Google Scholar] [CrossRef]
  85. Moradi-Dalvand, M.; Mohammadi-Ivatloo, B.; Najafi, A.; Rabiee, A. Continuous quick group search optimizer for solving non-convex economic dispatch problems. Electr. Power Syst. Res. 2012, 93, 93–105. [Google Scholar] [CrossRef]
  86. Lee, K.Y.; Sode-Yome, A.; Park, J.H. Adaptive Hopfield neural networks for economic load dispatch. IEEE Trans. Power Syst. 1998, 13, 519–526. [Google Scholar] [CrossRef]
  87. Park, J.B.; Jeong, Y.W.; Shin, J.R.; Lee, K.Y. An improved particle swarm optimization for nonconvex economic dispatch problems. IEEE Trans. Power Syst. 2010, 25, 156–166. [Google Scholar] [CrossRef]
  88. Chen, J.; Zheng, J.; Wu, P.; Zhang, L.; Wu, Q. Dynamic particle swarm optimizer with escaping prey for solving constrained non-convex and piecewise optimization problems. Expert Syst. Appl. 2017, 86, 208–223. [Google Scholar] [CrossRef]
  89. Hosseinnezhad, V.; Babaei, E. Economic load dispatch using θ-PSO. Int. J. Electr. Power Energy Syst. 2013, 49, 160–169. [Google Scholar] [CrossRef]
  90. Nguyen, T.T.; Vo, D.N. The application of one rank cuckoo search algorithm for solving economic load dispatch problems. Appl. Soft Comput. 2015, 37, 763–773. [Google Scholar] [CrossRef]
  91. Chen, C.; Zou, D.; Li, C. Improved jaya algorithm for economic dispatch considering valve-point effect and multi-fuel options. IEEE Access 2020, 8, 84981–84995. [Google Scholar] [CrossRef]
  92. Cai, J.; Li, Q.; Li, L.; Peng, H.; Yang, Y. A hybrid CPSO–SQP method for economic dispatch considering the valve-point effects. Energy Convers. Manag. 2012, 53, 175–181. [Google Scholar] [CrossRef]
  93. Adarsh, B.R.; Raghunathan, T.; Jayabarathi, T.; Yang, X.S. Economic dispatch using chaotic bat algorithm. Energy 2016, 96, 666–675. [Google Scholar] [CrossRef]
  94. Kansal, V.; Dhillon, J.S. Emended salp swarm algorithm for multiobjective electric power dispatch problem. Appl. Soft Comput. 2020, 90, 106172. [Google Scholar] [CrossRef]
  95. Rajput, N.; Chaudhary, V.; Dubey, H.M.; Pandit, M. Optimal generation scheduling of thermal system using biologically inspired grasshopper algorithm. In Proceedings of the 2017 2nd International Conference on Telecommunication and Networks (TEL-NET), Noida, India, 10–11 August 2017. [Google Scholar]
  96. Victoire, T.A.A.; Jeyakumar, A.E. Hybrid PSO–SQP for economic dispatch with valve-point effect. Electr. Power Syst. Res. 2004, 71, 51–59. [Google Scholar] [CrossRef]
  97. Xiong, G.; Shi, D.; Duan, X. Multi-strategy ensemble biogeography-based optimization for economic dispatch problems. Appl. Energy 2013, 111, 801–811. [Google Scholar] [CrossRef]
  98. Pan, S.; Jian, J.; Chen, H.; Yang, L. A full mixed-integer linear programming formulation for economic dispatch with valve-point effects, transmission loss and prohibited operating zones. Electr. Power Syst. Res. 2020, 180, 106061. [Google Scholar] [CrossRef]
  99. dos Santos Coelho, L.; Bora, T.C.; Mariani, V.C. Differential evolution based on truncated Lévy-type flights and population diversity measure to solve economic load dispatch problems. Int. J. Electr. Power Energy Syst. 2014, 57, 178–188. [Google Scholar] [CrossRef]
  100. Al-Betar, M.A.; Awadallah, M.A.; Khader, A.T.; Bolaji, A.L. Tournament-based harmony search algorithm for non-convex economic load dispatch problem. Appl. Soft Comput. 2016, 47, 449–459. [Google Scholar] [CrossRef]
  101. Neto, J.X.V.; Reynoso-Meza, G.; Ruppel, T.H.; Mariani, V.C.; dos Santos Coelho, L. Solving non-smooth economic dispatch by a new combination of continuous GRASP algorithm and differential evolution. Int. J. Electr. Power Energy Syst. 2017, 84, 13–24. [Google Scholar] [CrossRef]
  102. Amjady, N.; Sharifzadeh, H. Solution of non-convex economic dispatch problem considering valve loading effect by a new modified differential evolution algorithm. Int. J. Electr. Power Energy Syst. 2010, 32, 893–903. [Google Scholar] [CrossRef]
  103. dos Santos Coelho, L.; Souza, R.C.T.; Mariani, V.C. Improved differential evolution approach based on cultural algorithm and diversity measure applied to solve economic load dispatch problems. Math. Comput. Simul. 2009, 79, 3136–3147. [Google Scholar] [CrossRef]
  104. Sailesh Babu, G.S.; Das, D.B.; Patvardhan, C. Real-parameter quantum evolutionary algorithm for economic load dispatch. IET Gener. Transm. Distrib. 2008, 2, 22–31. [Google Scholar] [CrossRef]
  105. Wang, S.K.; Chiou, J.P.; Liu, C.W. Non-smooth/non-convex economic dispatch by a novel hybrid differential evolution algorithm. IET Gener. Transm. Distrib. 2007, 1, 793–803. [Google Scholar] [CrossRef]
  106. Reddy, A.S.; Vaisakh, K. Shuffled differential evolution for large scale economic dispatch. Electr. Power Syst. Res. 2013, 96, 237–245. [Google Scholar] [CrossRef]
  107. Abdullah, M.N.; Abu Bakar, A.H.; Rahim, N.A.; Moklis, H. Economic load dispatch with nonsmooth cost functions using evolutionary particle swarm optimization. IEEJ Trans. Electr. Electron. Eng. 2013, 8, 30–37. [Google Scholar] [CrossRef]
  108. Sayah, S.; Hamouda, A. A hybrid differential evolution algorithm based on particle swarm optimization for nonconvex economic dispatch problems. Appl. Soft Comput. 2013, 13, 1608–1619. [Google Scholar] [CrossRef]
  109. Balamurugan, R.; Subramanian, S. An improved dynamic programming approach to economic power dispatch with generator constraints and transmission losses. J. Electr. Eng. Technol. 2008, 3, 320–330. [Google Scholar] [CrossRef]
  110. Chalermchaiarbha, S.; Ongsakul, W. Stochastic weight trade-off particle swarm optimization for nonconvex economic dispatch. Energy Convers. Manag. 2013, 70, 66–75. [Google Scholar] [CrossRef]
  111. Abdullah, M.N.; Bakar, A.H.A.; Rahim, N.A.; Mokhlis, H.; Illias, H.A.; Jamian, J.J. Modified particle swarm optimization with time varying acceleration coefficients for economic load dispatch with generator constraints. J. Electr. Eng. Technol. 2014, 9, 15–26. [Google Scholar] [CrossRef]
  112. Adhinarayanan, T.; Sydulu, M. Efficient lambda logic based optimisation procedure to solve the large scale generator constrained economic dispatch problem. J. Electr. Eng. Technol. 2009, 4, 301–309. [Google Scholar] [CrossRef]
  113. Bhattacharya, A.; Chattopadhyay, P.K. Biogeography-based optimization for different economic load dispatch problems. IEEE Trans. Power Syst. 2010, 25, 1064–1077. [Google Scholar] [CrossRef]
  114. Jadhav, H.T.; Roy, R. Effect of turbine wake on optimal generation schedule and transmission losses in wind integrated power system. Sustain. Energy Technol. Assess. 2014, 7, 123–135. [Google Scholar] [CrossRef]
  115. Basu, M. Improved differential evolution for economic dispatch. Int. J. Electr. Power Energy Syst. 2014, 63, 855–861. [Google Scholar] [CrossRef]
  116. Basu, M. Modified particle swarm optimization for nonconvex economic dispatch problems. Int. J. Electr. Power Energy Syst. 2015, 69, 304–312. [Google Scholar] [CrossRef]
  117. Basu, M. Fast convergence evolutionary programming for economic dispatch problems. IET Gener. Transm. Distrib. 2017, 11, 4009–4017. [Google Scholar] [CrossRef]
  118. Jadoun, V.K.; Gupta, N.; Niazi, K.R.; Swarnkar, A. Dynamically controlled particle swarm optimization for large-scale nonconvex economic dispatch problems. Int. Trans. Electr. Energy Syst. 2014, 25, 3060–3074. [Google Scholar] [CrossRef]
  119. Coelho, L.S.; Mariani, V.C. Combining of chaotic differential evolution and quadratic programming for economic dispatch optimization with valve-point effect. IEEE Trans. Power Syst. 2006, 21, 989–996. [Google Scholar] [CrossRef]
  120. Hassan, M.H.; Kamel, S.; Jurado, F.; Ebeed, M.; Elnaggar, M.F. Economic load dispatch solution of large-scale power systems using an enhanced beluga whale optimizer. Alex. Eng. J. 2023, 72, 573–591. [Google Scholar] [CrossRef]
  121. Ozkaya, B.; Duman, S.; Kahraman, H.T.; Guvenc, U. Optimal solution of the combined heat and power economic dispatch problem by adaptive fitness-distance balance based artificial rabbits optimization algorithm. Expert Syst. Appl. 2024, 238, 122272. [Google Scholar] [CrossRef]
Figure 1. Fuel cost curves of the generation units: (a) with and without VPE; (b) with POZs.
Energies 18 03048 g001
Figure 2. (a,b): Triangle membership functions of the input values and (c) triangle membership function of the output value.
Energies 18 03048 g002
Figure 3. Exploration–exploitation behavior curves of all algorithms for selected CEC2020 benchmark suite.
Energies 18 03048 g003aEnergies 18 03048 g003b
Figure 4. Exploration–exploitation behavior curves of all algorithms for selected CEC2022 benchmark suite.
Energies 18 03048 g004
Figure 5. Bar graphs of the Friedman scores of the algorithms for each test system.
Energies 18 03048 g005
Table 1. Taxonomy of MHS algorithms for solving the ED problem.
Ref.YearMethodConstraintsCase StudiesStatistical AnalysisStability Analysis
MFVPETLRRPOZ
[24]2018CMFA √6 units with POZs, RR, and TL; 15 units with VPE, POZs, RR, and TL; 10 units with VPE, RR, and MF; 80 units and MF and VPE; and 160 units with MF and VPE (5 case studies).XX
[25]2018 MCSA X6 units with POZs, TL, and RR; 13 units with VPE; 13 units with VPE and TL; 20 units with TL; and 40 units with VPE (5 case studies).XX
[30]2018HAAAXX13 units with VPE; 40 units with VPE; 40 units with VPE and TL; 80 units with VPE; and 140 units with VPE and POZs (5 case studies).WilcoxonX
[31]2018NGHS, NPHS, NTHS, and
NRHS
XXXX3 units, 13 units for 1800 MW and 2520 MW, and 40 units. For all cases, the VPE was considered (4 case studies).XX
[32]2018OGWOXX13 unit with VPE; 40 units with VPE; 140 units with VPE, POZs, and RR; and 160 units with VPE (4 case studies).XX
[16]2019 PPSO10 units with MF; 10 units with MF and VPE; 15 units with POZs and TL; 15 units with POZs, TL, and RR; 40 units with VPE; 80 units with VPE; and 140 units (7 case studies).XX
[26]2019 MPDEX13 units with VPE; 13 units with VPE and TL; 40 units with VPE; 40 units with VPE and TL; 80 units with VPE and POZs; and 140 units with VPE and RR (6 case studies).FriedmanX
[33]2019Jaya-SML6 units with RR, TL, and POZs; 10 units with VPE and MF; 13 units with VPE; 15 units with RR, TL, and POZs; and 40 units with VPE (5 case studies).XX
[34]2019ADE-MMS6 units with TL for 2834 MW and 1200 MW; 10 units with VPE and TL; 13 units with VPE; 15 units with TL, POZs, and RR; 20 units with TL; 38 units; 40 units with VPE, 140 units with VPE, RR, and MF; and 160 units with VPE and MF (10 case studies).WilcoxonX
[35]2019C-MIMO-CSO 10 units with VPE and MF; 15 units with TL, RR, and POZs; 40 units with VPE and MF; 40 units with VPE; 40 units with VPE and TL; and 140 units with VPE and POZs (6 case studies).WilcoxonX
[36]2019HIWOX15 units with POZs, RR, and TL; 40 units with VPE and TL; 80 units with VPE; 110 units; 140 units with VPE; and 160 units with VPE (6 case studies).XX
[17]2020TFWO10 units with MF and VPE; 15 units with TL, RR, and POZs; 80 units with VPE; and 110 units with RR (4 case studies).XX
[37]2020CLCSX15 units with POZs, RR, and TL; 40 unit with VPE; 80 units with VPE and POZs; 140 units with VPE and POZs; and 160 units with VPE and POZs (5 case studies).XX
[38]2021ESAHJXXXX3 units; 6 units; 13 units for 1800 MW and 2520 MW; 15 units; and 40 units (6 case studies).XX
[39]2021HcSCAX15 units with POZs, RR, and TL; 40 units with VPE; 40 units with VPE and TL; 40 units with VPE, TL, and POZs; 80 units with VPE; 80 units with VPE and TL; 110 units; 110 units with TL; 140 units with VPE; and 140 units with VPE, POZs, and RR (10 case studies).WilcoxonX
[40]2021ISMAXXX6 units with TL; 10 units with TL and VPE; 11 units; 40 units with VPE; and 110 units (5 case studies).XX
[41]2022FV-ICLPSO XXX10 units with MF and VPE; 13 units with VPE; 40 units with VPE; 80 units with VPE and MF; 120 units with VPE; 160, 320, and 640 units with VPE and MF (8 case studies).XX
[42]2022DSOSX3 units; 3 units with VPE and TL; 5 units with VPE and TL; 6 units with VPE and TL; 6 units with POZs, RR, and TL; 13 units with VPE and TL; 15 units with POZs, RR, and TL; 18 units; 20 units with TL; 38 units; and 110 units (11 case studies).XX
[43]2022ACO-LD3 units with VPE; 6 units; 10 units with VPE and MF; 15 units with TL, RR, and POZs; 20 units with TL; 40 units with VPE (10 case studies).XX
[44]2023GSK-DEX15 units with RR, POZs, and TL; 38 units; 40 units with VPE; 120 units with VPE; 110 units; and 330 units (6 case studies).WilcoxonX
[45]2023IPMXXXX3 units with and without VPE; 10 units; 13 units with and without VPE; 38 units; and 40 units with VPE (7 case studies).XX
[46]2023SCA-βHCXX3 units with VPE; 6 units with RR and POZs; 13 units with VPE for 1800 MW and 2520 MW; 15 units with RR and POZs; and 40 units with VPE (6 case studies).XX
[47]2023ECSAXXXX3 units; 13 units; 40 units; 80 units; and 140 units. For all cases, the VPE was considered (5 case studies).XX
[48]2024L-HMDE6 units with TL; 10 units with MF; 10 units with MF and VPE; 13 units with VPE; 13 units with VPE and TL; 15 units with TL; 20 units with TL; 40 units with VPE; 110 units; 140 units with VPE, RR, and POZs; 140 units with VPE and POZs; 140 units with RR and POZs; and 160 units with MF and VPE (13 case studies).XX
This studyFFDBSAO6 units with TL, RR, and POZs; 10 units with MF; 10 units with VPE and MF; 13 units with VPE for two different system parameters and 1800 MW; 13 units with VPE for two different system parameters and 2520 MW; 13 units with VPE and TL for four different system parameters; 15 units with TL, RR, and POZs for two different system parameters; 40 units with VPE for three different system parameters; and 110 units (18 case studies).Friedman and Wilcoxon
Table 2. The rule table used to obtain the output parameter (weight (w)).
FVnorm ZSMBR
CFVnorm
ZMMMSS
SMMSSZ
MMSZBB
BSZZBR
RZZBRR
Table 3. The FFDB variations of the SAO algorithm.
EquationThe Equations to Which FFDB Is Applied in the SAO AlgorithmFFDB Version
Equation (11)—(Section 3.1.2 exploration section) Y j g + 1 = E l i t e p o o l g + B W F F D B j g β 1 × Y b e s t g Y F F D B j g + 1 β 1 × Y ¯ g Y F F D B j g FFDBSAO1
Equation (12)—(Section 3.1.3 exploitation section) Y j g + 1 = M × Y b e s t g + B W F F D B j g β 2 × Y b e s t g Y F F D B j g + 1 β 2 × Y ¯ g Y F F D B j g FFDBSAO2
Table 4. The Freidman scores of all algorithms for CEC2020, CEC2022, and classic benchmark suites.
Benchmark SuiteDimensionsAlgorithmsBenchmark SuiteDimensionsAlgorithms
SAOFFDBSAO1FFDBSAO2SAOFFDBSAO1FFDBSAO2
CEC2020D = 52.2117651.9009801.887255CEC2022D = 102.4035951.8423201.754085
D =102.3264711.8852941.788235D = 202.5310461.7982031.670752
D =152.3754901.8617651.762745Benchmark
suite
Algorithms
D = 202.3117651.8980391.790196SAOFFDBSAO1FFDBSAO2
D = 302.2803921.9431371.776471Classic 232.1935212.2408351.565644
The mean of Friedman score2.3011771.8978431.801100Classic 272.6550471.9157591.429194
The mean of Friedman score2.4458021.9157591.604919
The mean of Friedman score (general score)2.3734891.9235611.703010
Table 5. The Wilcoxon pairwise results of all algorithms for CEC2020, CEC2022, and classic benchmark suites.
vs. SAO
+/=/−
CEC2020CEC2022Classic 23Classic 27Total Evaluation
D = 5D = 10D = 15D = 20D = 30D = 10D = 20
FFDBSAO16/3/15/5/06/4/04/6/04/5/19/2/19/3/07/8/819/6/269/42/13
FFDBSAO27/2/17/3/07/3/06/4/05/4/19/2/110/2/013/6/420/6/184/32/8
Table 6. The operating conditions for each test system used in the ED problem.
Test SystemNumber of GeneratorsPower Demand (MW)TLQuadratic FunctionVPERRPOZMF
161263--
2102700----
3102700----
4.1131800-----
4.2132520-----
4.3131800-----
4.4132520-----
5.1132520----
5.2132520----
5.3132520----
5.4132520----
6.1152630--
6.2152630--
7202500----
8.14010,500-----
8.24010,500-----
8.34010,500-----
911015,000-----
Table 15. Wilcoxon signed-rank test results of optimization algorithms for all test systems.
Test SystemFFDBSAO2 vs. FFDBSAO1FFDBSAO2 vs. SAOTest SystemFFDBSAO2 vs. FFDBSAO1FFDBSAO2 vs. SAO
W+Wp-ValueH0W+Wp-ValueH0W+Wp-ValueH0W+Wp-ValueH0
146411.9209 × 10−6No46501.7344 × 10−6No5.345783.8822 × 10−6No46501.7344 × 10−6No
2428375.7924 × 10−5No431344.4493 × 10−5No5.4449168.4461 × 10−6No46142.6033 × 10−6No
346501.7344 × 10−6No46501.7344 × 10−6No6.146501.7344 × 10−6No46501.7344 × 10−6No
4.146501.7344 × 10−6No46501.7344 × 10−6No6.2452136.3391 × 10−6No46501.7344 × 10−6No
4.246501.7344 × 10−6No46501.7344 × 10−6No746501.7344 × 10−6No46501.7344 × 10−6No
4.346501.7344 × 10−6No46501.7344 × 10−6No8.146501.7344 × 10−6No46501.7344 × 10−6No
4.446501.7344 × 10−6No46501.7344 × 10−6No8.246501.7344 × 10−6No46501.7344 × 10−6No
5.1442231.6394 × 10−5No46142.6033 × 10−6No8.346501.7344 × 10−6No46501.7344 × 10−6No
5.2432334.0715 × 10−5No46232.3234 × 10−6No946501.7344 × 10−6No46501.7344 × 10−6No
Table 16. Stability analysis results of the FFDBSAO2, FFDBSAO1, and SAO algorithms.
Test SystemFFDBSAO2FFDBSAO1SAO
NSRSR (%)ASTAITNSRSR (%)ASTAITNSRSR (%)ASTAIT
12583.3310.881077.042066.672.15731.901550.003.131253.93
22273.3312.051173.051343.333.391252.38620.003.561532.83
32893.334.10427.86826.672.10722.25310.003.831462.67
4.130100.004.21402.23930.004.901707.222893.333.441279.32
4.230100.007.48760.101136.672.161208.45723.332.751288.14
4.330100.007.90809.90826.673.251492.882893.332.431165.43
4.430100.004.67460.831756.672.911230.351653.332.841331.38
5.130100.006.98709.101240.003.311489.671136.672.771251.09
5.22583.338.99913.921860.003.771488.72930.004.041681.22
5.32996.679.09789.6926.675.851763.5000.000.000.00
5.41860.0012.271297.671550.003.291344.671756.672.201237.65
6.12066.6713.371258.65930.005.631668.671860.004.941835.89
6.22273.3314.071324.9100.00--00.000.000.00
71756.6712.021267.8213.334.001741.0013.332.871846.00
8.12893.3312.001109.5000.00--00.000.000.00
8.22583.3315.001441.0800.00--00.000.000.00
8.32996.6710.411016.8600.00--00.000.000.00
930100.007.12684.7000.00--00.000.000.00
AVG26.0086.679.59940.277.9426.482.60991.208.8329.442.16953.64
Table 7. Comparison with algorithms from the literature for test system 1.
AlgorithmMin. (USD/h)AlgorithmMin. (USD/h)
FFDBSAO215,444.1884MABC [23]15,449.90
FFDBSAO115,445.3755MCSA [25]15,449.90
SAO15,448.6580MHS [76]15,449.90
RCBA [15]15,449.61CMFA [24]15,449.90
LM [77]15,449.80BSA [13]15,449.90
ST-IRDPSO [78]15,449.89DHS [79]15,449.90
L-HMDE [48]15,449.90MSSA [27]15,449.90
Table 8. Comparison with algorithms from the literature for test systems 2 and 3.
Test System 2Test System 3
AlgorithmMin. (USD/h)AlgorithmMin. (USD/h)AlgorithmMin. (USD/h)AlgorithmMin. (USD/h)
FFDBSAO2623.8095IGA-MU [55]623.81FFDBSAO2622.8288ARCGA [20]623.83
L-HMDE [48]623.81MPSO [10]623.81SDE [2]623.83TFWO [17]623.83
IPSO [22]623.81FFDBSAO1623.8676L-HMDE [48]623.83PPSO [16]623.83
ICDEDP [80]623.81SAO624.0819IODPSO-L [19]623.83RCGA [81]623.83
SDE [2]623.81HM [82]625.18DHS [79]623.83CCEDE [83]623.83
DE [11]623.81MHNN [84]626.12CQGSO [85]623.83CMFA [24]623.83
ALHN [28]623.81AHNN [86]626.24CCPSO [87]623.83FFDBSAO1624.7114
PPSO [16]623.81 DPSOEP [88]623.83SAO625.5705
Table 9. Comparison with algorithms from the literature for test systems 4.1, 4.2, 4.3, and 4.4.
Test System 4.1Test System 4.2
AlgorithmMin. (USD/h)AlgorithmMin. (USD/h)AlgorithmMin. (USD/h)AlgorithmMin. (USD/h)
FFDBSAO217,963.8298ϴ-PSO [89]17,963.83Jaya-SML [33]24,169.91ORCSA [90]24,169.92
MABC [23]17,963.83DE [11]17,963.83Ijaya [91]24,169.91CPSO-SQP [92]24,190.97
MPDE [26]17,963.83CBA [93]17,963.83FFDBSAO224,169.9177FDBSAO124,196.7272
ESSA [94]17,963.83GSO [95]17,963.83DE [11]24,169.92PSO-SQP [96]24,261.05
HAAA [30]17,963.83ORCSA [90]17,963.83MABC [23] 24,169.92SAO24,327.5664
MsEBBO [97]17,963.83FMILP [98]17,963.83MCSA [25]24,169.92IPM [45]24,383.46
FV-ICLPSO [41]17,963.83FFDBSAO1 18,170.9881L-HMDE [48]24,169.92
L-HMDE [48]17,963.83SAO 18,171.0347
Test System 4.3Test System 4.4
AlgorithmMin. (USD/h)AlgorithmMin. (USD/h)AlgorithmMin. (USD/h)AlgorithmMin. (USD/h)
ESAHJ [38]17,960.36DEL [99]17,960.37IDE [21]24,164.05NRHS [31]24,164.06
FFDBSAO217,960.3661SCA-βHC [46]17,960.39IODPSO-G [19]24,164.05THS [100]24,164.06
MPDE [26]17,960.37C-GRASP-SaDE [101]17,960.39L-HMDE [48]24,164.05ESAHJ [38]24,164.06
DHS [79]17,960.37MDE [102]17,960.39DHS [79]24,164.05SCA-βHC [46]24,164.09
L-HMDE [48]17,960.37CDEMD [103]17,961.94ECSA [47]24,164.05ADE-MMS [34]24,164.12
IDE [21]17,960.37FFDBSAO1 18,103.6837RQEA [104]24,164.05SAO24,224.4991
IHS [18]17,960.37SAO18,118.7257FFDBSAO224,164.0508FFDBSAO124,231.2566
Table 10. Comparison with algorithms from the literature for test systems 5.1, 5.2, 5.3, and 5.4.
Test System 5.1Test System 5.2
AlgorithmMin. (USD/h)AlgorithmMin. (USD/h)AlgorithmMin. (USD/h)AlgorithmMin. (USD/h)
FFDBSAO224,514.3913DSOS [42]24,514.88FFDBSAO224,514.0871FPSOGSA [67]24,515.36
MCSA [25]24,514.88Self-tuning [105]24,560.08
L-HMDE [48]24,514.88MHSA [3]24,585.36MPDE [26]24,515.23FFDBSAO124,534.2708
MABC [23]24,514.88FFDBSAO124,603.7177
MPDE [26]24,514.88SAO24,742.2932L-HMDE [48]24,515.23SAO24,693.5422
SDE [106]24,514.88FMILP [95]24,515.23
Test System 5.3Test System 5.4
AlgorithmMin. (USD/h)AlgorithmMin. (USD/h)AlgorithmMin. (USD/h)AlgorithmMin. (USD/h)
FFDBSAO224,514.3907OIWO [29]24,514.83FFDBSAO224,512.1812OGWO [32]24,512.72
L-HMDE [48]24,514.82FFDBSAO124,558.2114MPDE [26]24,512.43FFDBSAO124,521.0916
MPDE [26]24,514.82SAO24,709.1549L-HMDE [48]24,512.43SAO24,688.5062
Table 11. Comparison with algorithms from the literature for test systems 6.1 and 6.2.
Test System 6.1Test System 6.2
AlgorithmMin. (USD/h)AlgorithmMin. (USD/h)AlgorithmMin. (USD/h)
FFDBSAO232,692.3980EPSO [107]32,704.83FFDBSAO232,582.2019
ESSA [89]32,701.21MDE [101]32,704.90FFDBSAO132,582.2316
CLCS-CLM [37]32,704.45Jaya-SML [33]32,706.36DEPSO [108]32,588.81
L-HMDE [48]32,704.45CACO-LD-AP [43]32,706.38DE [11]32,588.87
CTPSO [85]32,704.45Ijaya [96]32,706.62L-HMDE [48]32,588.92
BSA [13]32,704.45CSO [12]32,706.66DHS [79]32,588.92
WCA [14]32,704.45IPSO [22]32,706.66IDP [109]32,590.00
SWT-PSO [110]32,704.45FFDBSAO32,781.0026SAO32,744.3877
MPSO-TVAC [111]32,704.47SAO32,815.7962PSO [54]33,020.00
Table 12. Comparison with algorithms from the literature for test system 7.
AlgorithmMin. (USD/h)AlgorithmMin. (USD/h)
ADE-MMS [34]62,456.51HNN [53]62,456.63
ORCSA [94]62,456.63λ-Logic Based [112]62,456.63
L-HMDE [48]62,456.63FMILP [95]62,456.63
MCSA [25]62,456.63FFDBSAO262,456.6364
CQGSO [84]62,456.63BBO [113]]62,456.79
CBA [92]62,456.63SAO62,469.7797
GABC [114]62,456.63FFDBSAO162,471.0048
CACO-LD-AP [43]62,456.63
Table 13. Comparison with algorithms from the literature for test systems 8.1, 8.2, and 8.3.
Test System 8.1Test System 8.2Test System 8.3
AlgorithmMin. (USD/h)AlgorithmMin. (USD/h)MPDE [26]121,403.54FFDBSAO2121,360.7875
ESSA [89]121,412.50CCEDE [88]121,412.54L-HMDE [48]121,403.54L-HMDE [48]121,369.08
C-MIMO-CSO [35]121,412.50FPSOGSA [67]121,412.54DHS [79]121,403.54IDE [115]121,370.13
CCPSO [85]121,403.54ADE-MMS [34]121,370.82
MsEBBO [90]121,412.53MCSA [25]121,412.54FFDBSAO2121,403.5437MPSO [116]121,379.43
CACO-LD-AP [43]121,412.53SDE [105]121,412.54HAAA [30]121,403.70FCEP [117]121,393.00
GSK-DE [44]121,412.53L-HMDE [48]121,412.54HcSCA [39]121,403.87FFDBSAO1123,808.9478
FFDBSAO2121,412.5399FV-ICLPSO [41]121,412.54IDE [21]121,411.49SAO124,930.7007
PPSO [16]121,412.54DCPSO [118]121,412.54DEC-SQP [119]121,741.98
MPDE [26]121,412.54FFDBSAO1123,660.0455IPM [45]122,264.88
CLCS-CLM [37]121,412.54SAO124,891.4969FFDBSAO1124,256.0655
SAO124,882.4969
Table 14. Comparison with algorithms from the literature for test system 9.
AlgorithmMin. (USD/h)AlgorithmMin. (USD/h)AlgorithmMin. (USD/h)
HcSCA [39]197,988.17TFWO [17]197,988.18ISMA [40]198,565.90
FFDBSAO2197,988.1778HIWO [36]197,988.19EBWO [120]199,417.20
L-HMDE [48]197,988.18OIWO [29]197,989.14FFDBSAO1207,682.4129
GSK-DE [44]197,988.18DSOS [42]198,007.60SAO208,711.4829
Disclaimer/Publisher’s Note: The statements, opinions and data contained in all publications are solely those of the individual author(s) and contributor(s) and not of MDPI and/or the editor(s). MDPI and/or the editor(s) disclaim responsibility for any injury to people or property resulting from any ideas, methods, instructions or products referred to in the content.

