Article

Hydrogen Production from Winery Wastewater Through a Dual-Chamber Microbial Electrolysis Cell

by
Ana Baía
1,2,
Alonso I. Arroyo-Escoto
3,4,5,
Nuno Ramos
1,2,
Bilel Abdelkarim
1,
Marta Pereira
2,
Maria C. Fernandes
3,4,
Yifeng Zhang
6 and
Annabel Fernandes
1,2,*
1
Fiber Materials and Environmental Technologies (FibEnTech-UBI), Universidade da Beira Interior, R. Marquês de D’Ávila e Bolama, 6201-001 Covilhã, Portugal
2
Department of Chemistry, Universidade da Beira Interior, R. Marquês de D’Ávila e Bolama, 6201-001 Covilhã, Portugal
3
Alentejo Biotechnology Center for Agriculture and Agro-Food (CEBAL), Polytechnic Institute of Beja (IPBeja), Apartado 6158, 7801-908 Beja, Portugal
4
Mediterranean Institute for Agriculture, Environment and Development & CHANGE—Global Change and Sustainability Institute, CEBAL—Centro de Biotecnologia Agrícola e Agro-Alimentar do Alentejo, 7801-908 Beja, Portugal
5
Mediterranean Institute for Agriculture, Environment and Development & CHANGE—Global Change and Sustainability Institute, Institute for Advanced Studies and Research (IIFA), University of Évora, Polo da Mitra, Ap. 94, 7006-554 Évora, Portugal
6
Department of Environmental and Resources Engineering, Technical University of Denmark (DTU), Bygningstorvet, Building 115, 2800 Kongens Lyngby, Denmark
*
Author to whom correspondence should be addressed.
Energies 2025, 18(12), 3043; https://doi.org/10.3390/en18123043
Submission received: 24 April 2025 / Revised: 24 May 2025 / Accepted: 7 June 2025 / Published: 9 June 2025
(This article belongs to the Special Issue Advanced Materials and Technologies for Hydrogen Evolution)

Abstract

This study explores the feasibility of producing biohydrogen from winery wastewater using a dual-chamber microbial electrolysis cell (MEC). A mixed microbial consortium pre-adapted to heavy-metal environments and enriched with Geobacter sulfurreducens was anaerobically cultivated from diverse waste streams. Over 5000 h of development, the MEC system was progressively adapted to winery wastewater, enabling long-term electrochemical stability and high organic matter degradation. Upon winery wastewater addition (5% v/v), the system achieved a sustained hydrogen production rate of (0.7 ± 0.3) L H2 L−1 d−1, with an average current density of (60 ± 4) A m−3, and COD removal efficiency exceeding 55%, highlighting the system’s resilience despite the presence of inhibitory compounds. Coulombic efficiency and cathodic hydrogen recovery reached (75 ± 4)% and (87 ± 5)%, respectively. Electrochemical impedance spectroscopy provided mechanistic insight into charge transfer and biofilm development, correlating resistive parameters with biological adaptation. These findings demonstrate the potential of MECs to simultaneously treat agro-industrial wastewaters and recover energy in the form of hydrogen, supporting circular resource management strategies.

1. Introduction

The overdemand for water resources has increased with the exponential rise of socioeconomic activities worldwide. The unsustainable and often unregulated exploitation of water reserves, to satisfy the growing needs of industrial, agricultural, and domestic sectors, poses significant environmental and anthropogenic risks [1]. In response, considerable research efforts have been directed toward developing and optimizing wastewater treatment and reuse strategies.
Most wastewater treatment processes are energy-intensive, rendering the cost of wastewater reuse economically challenging [2]. Integrating wastewater treatment with energy recovery presents a promising avenue toward sustainable resource management [3]. Depending on the wastewater characteristics, substantial quantities of chemical and thermal energy can be harnessed through several recovery technologies. For instance, microbial fuel cells enable the direct generation of electricity from the oxidation of organic matter present in wastewater [4]. Algal biofuel systems exploit the nutrient content of wastewater to cultivate algae, which can subsequently be processed into renewable biofuels [5]. Anaerobic digestion is particularly notable for its ability to convert organic substrates into biogas, which can be utilized for electricity generation and heating purposes [6,7,8]. Furthermore, the anaerobic digestion process can also yield green hydrogen as a byproduct, offering a highly energy-efficient and low-carbon alternative for clean energy production [8,9].
Microbial electrolysis cell (MEC) is an advanced bioelectrochemical system, capable of degrading wastewater organic matter while producing biohydrogen, based on the implementation of anaerobic digestion. With a minimal external energy input, MEC offers a sustainable energy recovery solution [10,11]. Recent studies have demonstrated MEC potential for biohydrogen production from various organic wastewaters. Utilizing livestock wastewater and food waste as substrates in an MEC system, Kim et al. [12] reported a hydrogen production rate (HPR) and chemical oxygen demand (COD) removal of 4.6 L L−1 d−1 and 62%, respectively. In a different study, brewery wastewater, food wastewater, and livestock wastewater were used to evaluate the biohydrogen production at a bipolar membrane MEC [13]. Livestock wastewater demonstrated the most stable current density and HPR (≈10 L L−1 d−1), while brewery wastewater exhibited a favorable performance that was attributed to its high alcohol content. Murugaiyan et al. [14] used distillery wastewater to evaluate the performance of different cathode materials for H2 production through MEC. A maximum HPR and COD removal of 2.3 mmol L−1 d−1 and 52%, respectively, were achieved utilizing a zinc ferrite/green graphene oxide nanocomposite cathode. Treating sugar-based industrial wastewater, Guerrero-Sodric et al. [9] found that Ni-foam cathodes significantly enhance hydrogen production and energy efficiency, compared to stainless-steel wool cathodes, due to higher cathode surface that reduces overall ohmic resistance. Those authors also reported that the syntrophic consortium of exoelectrogenic and fermentative bacteria used, predominantly Geobacter and Bacteroides, is well-suited to transform complex organic matter into hydrogen. Nonetheless, studies performed by Amanze et al. [15] and Shi et al. [16] showed that selective enrichment of electroactive consortia from metal-contaminated environments (e.g., Ni2+, Cu2+, Cd2+) enhances extracellular electron-transfer pathways, yielding more resilient biofilms under anaerobic conditions. These metal-adapted communities exhibit lower charge transfer resistance and deliver significantly higher current densities than non-adapted consortia.
Electrochemical impedance spectroscopy (EIS) has emerged as a powerful diagnostic tool for characterizing MEC performance. It enables real-time monitoring of biofilm dynamics by translating complex microbia–electrochemical interactions into quantifiable parameters. Recent studies demonstrated the efficacy of EIS in optimizing MEC by correlating impedance features with operational variables and biofilm development stages. Timmerman et al. [11] linked 80% of resistance variance to changes in buffer concentration, flow rate, and applied electric potential, while Kanellos et al. [17] used spectral shifts to detect diffusion limitations in biocathodic CH4 synthesis. Other studies have correlated EIS signals with membrane fouling, microbial community shifts, and substrate depletion, highlighting EIS as a predictive tool for process optimization [18,19,20]. Continuous MEC experiments lasting 3000–4300 h, monitored by phase-resolved EIS, have begun to map distinct biofilm stages (colonization, maturation, and aging) and to correlate shifts in charge transfer resistance and double layer capacitance with performance metrics [21,22]. Still, to the best of the authors’ knowledge, no study has combined ultra-long-term operation (>5000 h) with high-resolution EIS in an MEC system processing real agro-industrial wastewater.
The present study describes the development of an MEC system for the anaerobic degradation of winery wastewater and proton utilization for H2 production via electrochemical pathways. The utilization of microbial consortia pre-adapted to heavy-metal environments, such as those retrieved from mining wastewater (MWW) and sanitary landfill leachate (SLL), was evaluated, aiming at accelerating organic-acid degradation and enhancing hydrogen generation, compared with a conventional MEC inoculum, operating under a long-term EIS-guided regime. A progressive feeding strategy was adopted to ensure immediate compatibility with the preconditioned consortia and enhanced organic-acid conversion rates, maximizing proton generation for hydrogen evolution. This scalable strategy has been shown, at pilot scale, to accelerate biofilm acclimation and to sustain coulombic efficiencies above 65% [23], supporting the progressive adaptation of the heavy-metal-conditioned consortia to real winery wastewater. The synergy between (i) metal-conditioned microbial consortia, (ii) EIS-guided operation over more than 5000 h, and (iii) gradual process intensification constitutes the key innovation of the present work, filling a gap between short-term laboratory demonstrations and the robust and data-rich operation demanded for industrial deployment of MEC technology.

2. Materials and Methods

2.1. Microbial Consortia

The microbial consortia utilized in this study were retrieved from three types of waste streams: SLL, MWW, and municipal sewage sludge (MSS), as described in Table 1. After collection, the samples were refrigerated to preserve microbial integrity. For microbial growth, the consortia of each sample were cultivated, under strict anaerobic and controlled temperature conditions, in a nutrient broth acetate fumarate (NBAF) media, prepared as described elsewhere with 30 mM sodium acetate and 40 mM sodium fumarate [24], enriched with yeast extract 0.5 g L−1 and cysteine 0.12 g L−1. A sample volume of 5 mL was inoculated into 70 mL of enriched NBAF medium, sparged with a mixture of N2/CO2 in an 80/20 ratio for 15 min, to create anaerobic conditions, and sterilized by autoclaving (Tuttnauer Autoclave-Steam Sterilizer, Breda, The Netherlands) at 121 °C for 20 min [25]. The consortia were then incubated in a thermostatic cabinet (Liebherr Thermostatic Cabinet, Bischofshofen, Austria) at a constant temperature of 36 °C, under static conditions. This process was routinely repeated during three months over periods of five days, which was sufficient to encourage the proliferation and enrichment of microbial populations. Then, the three microbial consortia, obtained from SLL, MWW, and MSS, were blended (Table 1), using 10 mL of each, and inoculated into 40 mL of enriched NBAF medium, as described above. Before inoculation in the MEC’s anodic chamber, 30 mL of this mixed microbial consortia was combined with 15 mL of Geobacter sulfurreducens PCA (Table 1), grown and maintained as described elsewhere [24].

2.2. MEC Experiments

MEC experiments were run, in duplicate (MEC1 and MEC2), at 1 L capacity custom-made dual-chamber H-cell membrane reactors, purchased from Laborspirit (Santo Antão do Tojal, Portugal). Figure 1 presents a structural diagram of the MEC system used. A CXM-200 (CMI-7000) cation exchange membrane (CEM) (Ambifirst, Moita, Portugal) was placed between the anodic and cathodic chambers. Before being used, the CEM was immersed in a 5% NaCl solution, with a pH of 6.53 ± 0.05, for 12 h, to allow the membrane to hydrate and expand. A carbon-felt piece (Carbone Loraine, Paris, France), with dimensions of 10 cm (length) × 2.5 cm (width) × 0.5 cm (thickness), was used as an anode in the anodic compartment, while a stainless-steel plate, with identical dimensions to those of the anode, was adopted as a cathode in the cathodic chamber. An Ag/AgCl reference electrode (+0.2 V vs standard hydrogen electrode, SHE), purchased from VWR International (Amadora, Portugal), was placed in the anodic chamber. The cells were operated under strict anaerobic conditions, in batch mode, with no stirring, at room temperature, which was kept at 28 °C.
The anodic chamber was inoculated with 30 mL (4.3% v/v) of mixed microbial consortia enriched with Geobacter sulfurreducens PCA, obtained as described in Section 2.1. The anodic compartment was operated with 700 mL of useful volume. Initially, and during the biofilm development, a solution containing nutrient broth acetate media with 30 mM sodium acetate [24], yeast extract 0.5 g L−1, and cysteine 0.12 g L−1 was utilized. For MEC development, the fumarate, an electron acceptor, was removed from the nutrient broth medium to allow biofilm development. At 15-day intervals, corresponding to near-complete depletion of acetate, the content of the anodic chamber was renewed, retaining 30 mL as the new inoculum and adding 670 mL of fresh nutrient broth acetate media enriched with yeast extract and cysteine. As the biofilm matured, the rate of acetate consumption increased. Once this rate had doubled compared to the initial values, approximately after 5000 h of experiment, the medium in the anodic chamber was supplemented with winery wastewater (5% v/v), collected from the Adega do Fundão (Fundão, Portugal). Before utilization, the winery wastewater sample was sparged with a mixture of N2/CO2 in an 80/20 ratio for 5 min and sterilized by autoclaving at 121 °C for 20 min. This sample had a COD of 120 g L−1 and a pH of 4.62.
The cathodic chamber operated with 700 mL of a phosphate buffer solution (pH~6.5). Whenever the content of the anodic chamber was renewed, the solution in the cathodic compartment was also replaced by a fresh one.
A GW, Lab DC, model GPS-3030D (0–30 V, 0–3 A), purchased from ILC (Lisbon, Portugal), was used as the power supply. The anodic potential was controlled with an Autolab PGSTAT302N potentiostat (Gomensoro Potencial Zero, Lisboa, Portugal) at +0.25 V vs. SHE through a three-electrode configuration.
Both anodic and cathodic chambers were equipped with gas bags (Skypia bag AA-1, GL Sciences, Tokyo, Japan), used to sample the gas phase. Sampling ports sealed with butyl rubber stoppers and aluminum crimps were used to sample the liquid phase.

2.3. Analytical Determinations

Microbial consortia growth was monitored by measuring the optical density at 600 nm (OD600), using a UV-visible spectrophotometer Thermo Scientific Evolution 201 (Paralab, Valbom, Portugal). The concentration of acetate was measured using a Shimadzu Nexera high-performance liquid chromatography (HPLC) system (Izasa Scientific, Carnaxide, Portugal) equipped with a refractive index detector (RID-20A). The analysis was conducted with an Aminex HPX-87H anion exchange column (Bio-Rad, CA, USA), using a 5 mM H2SO4 mobile phase at a flow rate of 0.6 mL min−1 and an oven temperature of 50 °C. COD determination followed the closed reflux and titrimetric methods [26]. pH was measured with a Metler Toledo N154, purchased from MT Brandão (Porto, Portugal). The H2 evolved from the cathodic chamber was analyzed using a SCION 8300 GC gas chromatograph (Specanalítica, Carcavelos, Portugal) equipped with a thermal conductivity detector. The H2 volume evolved was estimated from the volume of the headspace in the cathodic chamber, the volume of gas in the gas bag, and the ratio of hydrogen measured by GC [27]. HPR, in L L−1 d−1, was estimated from the volume of H2 generated, the volume of solution in the anodic and cathodic chambers (1.4 L), and the time period of the measurement [27].

2.4. Electrochemical Impedance Spectroscopy Acquisition and Modeling

EIS measurements were performed periodically and only after the open-circuit potential (OCP) had stabilized (|dE/dt| < 50 mV h−1). A 10 mV (rms) perturbation was applied around the instantaneous OCP, sweeping from 100 kHz to 100 mHz with 10 points per decade. All EIS spectra were imported and processed in Python 3.13.3 using the impedance.py library [28], following its official application programming interface [29]. A fully automated analysis pipeline was implemented to ensure reproducibility and objective model selection.
Raw impedance files (.csv) were ingested via impedance.py.io. Frequency and complex impedance columns were auto-parsed and concatenated. Each spectrum was fitted to the chosen equivalent circuit topology using the Levenberg–Marquardt algorithm in impedance.py’s custom circuit fit method. For robustness, each fit was repeated ≥5 times with randomized initial parameter guesses. The solution with the lowest χ2 (goodness-of-fit metric) was retained. Parametric confidence intervals (95%) were computed by nonparametric bootstrap (n = 2000) via impedance.py.statistics.bootstrap. Fit metrics (χ2, AIC, BIC) were calculated using impedance.py.statistics.calculate_bic. Transitions between nested circuit topologies required Bayesian Information Criterion ΔBIC > 10 to justify added complexity. This programmatic workflow, entirely based on impedance.py [28], enabled rapid re-evaluation of alternative circuit hypotheses and traceable parameter reporting across all time points.

3. Results and Discussion

3.1. MEC Development and Operation
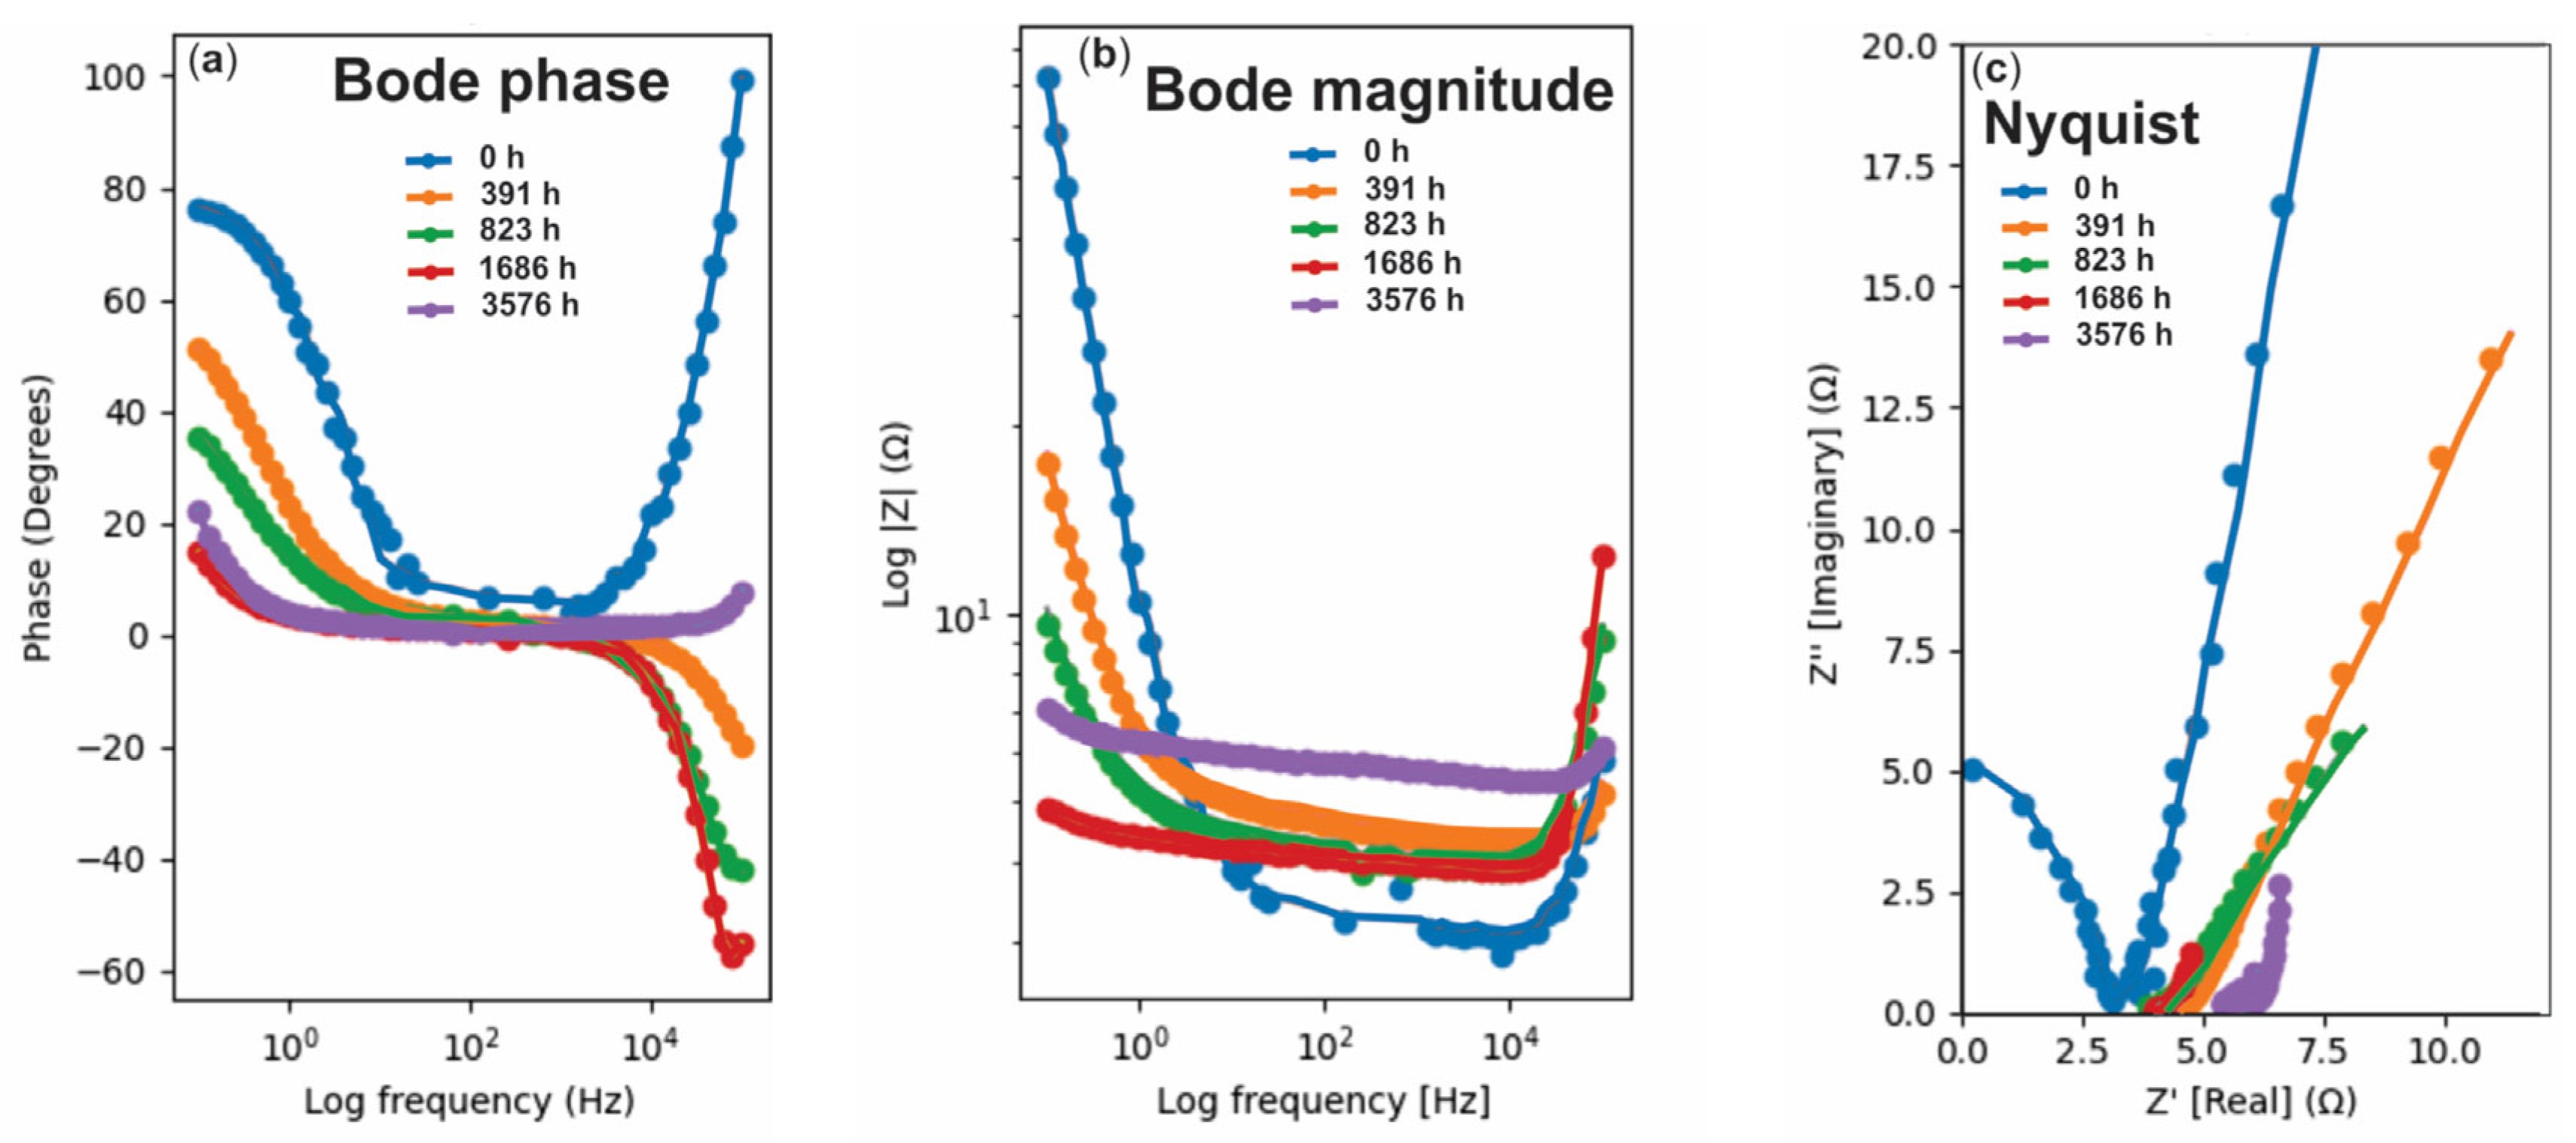
Figure 2 provides the temporal evolution of key parameters during the MEC development and operation. Two distinct phases are shown, before and after the supplementation of the anodic solution with winery wastewater (5% v/v). During the biofilm establishment and before the winery wastewater addition, OD600 results (Figure 2a) display repeated cycles of growth and decline, corresponding to the periodic culture media renewal (marked by blue triangles in the figure). This pattern suggests active microbial metabolism, with growth cycles being driven by substrate exhaustion followed by renewal, stimulating microbial activity. Following the introduction of winery wastewater, OD600 results initially exhibit fluctuations before stabilizing into a modestly declining trend. This behavior likely reflects a stress response elicited by the complex composition of the wastewater, requiring microbial adaptation to novel carbon sources and altered environmental conditions. The nature of this adaptive response varies between MEC1 and MEC2 and must be understood in the adaptative capacity of the consortia to their own chamber, even when conditions are completely identical at the macroscopical level. In both systems, bacterial activity persists until approximately 6000 h, proving consistent bacterial development and adaptation to the different applied voltage imposition and marking selective conditions for improved organic matter degradation. However, in MEC1, microbial activity progressively declines, ultimately reaching an OD600 of 0.2, indicative of suboptimal growth conditions attributed to the specific constituents of the wastewater. Conversely, MEC2 demonstrates a sustained increase in OD600, suggesting more favorable adaptation and enhanced microbial proliferation, even under the same conditions.
Acetate degradation serves as a key indicator of organic matter consumption. Before the introduction of winery wastewater, acetate degradation displays a cyclical pattern, likely driven by periodic nutrient availability and microbial growth dynamics (Figure 2b). Peaks in acetate degradation correlate with increases in OD600, underscoring the close relationship between microbial activity and substrate availability. Following the transition to winery wastewater, acetate degradation stabilizes at an elevated baseline, suggesting a more continuous and sustained breakdown of organic matter. This stabilization likely reflects the more consistent carbon input provided by the complex mixture of organic acids present in winery wastewater (e.g., tartaric, malic, and acetic acids), which supports prolonged microbial metabolism. Despite this overall improvement, degradation efficiency exhibits minor fluctuations, particularly in MEC1, indicating the presence of recalcitrant compounds that resist microbial processing. In contrast, MEC2 demonstrates more efficient degradation, likely due to a microbial community better adapted to the complex matrix of winery wastewater, enabling synergistic breakdown of otherwise resistant compounds. As a result, the availability of degradable substrates is enhanced in MEC2, contributing to a more effective and sustained degradation process compared to MEC1.
The anode potential was recorded every 24 h and used to calculate the anode potential variation (ΔE) over a 24 h period, which reflects the changes occurring at the anode over time. Figure 2c illustrates this variation throughout the entire development and operational period of the MEC systems, as it reflects microbial electron transfer activity, which influences and is crucial for biohydrogen production. During the biofilm development, ΔE exhibits significant fluctuations, suggesting dynamic changes in microbial electron transfer efficiency. This variability might be associated with shifts in microbial populations or metabolic pathways in response to substrate availability and applied electric potential. Upon the addition of winery wastewater, ΔE stabilizes, which may indicate a more established electroactive microbial community with consistent electron transfer. The observed trend suggests that winery wastewater supports stable electrochemical activity, which is favorable for biohydrogen production. Figure 2d presents the variation in the electric potential supplemented to the cathode by the external energy input (Esupp). As can be seen, Esupp variation closely follows microbial growth and acetate degradation patterns. This correlation suggests that microbial metabolic activity directly influences the external electric potential requirements. A gradual decline in Esupp after transitioning to winery wastewater is observed, which may indicate that the microbial community has adapted to the new substrate, leading to a reduced energy demand for maintaining electrochemical activity. This observation is significant, as it suggests improved electron transfer efficiency under winery wastewater conditions, potentially enhancing biohydrogen production.
The OCP provides insight into the electrochemical activity of the microbial community. During the initial stages of biofilm formation, OCP measurements exhibit recurrent fluctuations, indicative of microbial metabolic cycles. As the biofilm matures, the OCP progressively decreases and eventually stabilizes at more neutral values, a trend that persists even following the introduction of winery wastewater, displaying the capacity of the consortia to improved oxidative conditions. This decline may be attributed to structural changes within the biofilm or a shift in the dominant electroactive microbial populations. The subsequent stabilization of the OCP suggests the establishment of a new electrochemical equilibrium, wherein the microbial community effectively metabolizes the complex substrates present in winery wastewater while maintaining stable electron transfer dynamics.
Figure 3 illustrates the relationship between ΔE, acetate degradation (calculated as the difference between initial and final acetate concentrations), and Esupp, for both MEC systems (MEC1 and MEC2), as well as a heatmap of correlations between the system parameters OD600, OCP, Esupp, ΔE, and acetate degradation (Acdeg). In Figure 3a, corresponding to MEC1, the acetate degradation (green symbols) reaches maximum values of approximately 500 mg L−1. Esupp (represented in orange) remains relatively stable, predominantly between 0.4 and 0.5 V. A high-density cluster of degradation data (blue symbols) is centered around ΔE ≈ 0 V. This concentration of data implies that optimal acetate degradation occurs near neutral ΔE values. Conversely, more negative ΔE values are associated with reduced degradation efficiency, indicating the importance of maintaining a small positive ΔE for enhanced system performance.
Figure 3b presents the results from MEC2, where acetate degradation exhibits greater variability, reaching values around 850 mg L−1. Similar to MEC1, Esupp in MEC2 is relatively stable, varying narrowly between 0.4 and 0.5 V. The majority of degradation values cluster around ΔE ≈ 0 V, as observed for MEC1. This reinforces the hypothesis that optimal microbial activity and degradation efficiency occur within a narrow ΔE range. Beyond this range, performance appears to either plateau or decline.
From Figure 3c, it can be inferred that OD600 has a moderate positive correlation with ΔE (r = 0.46), suggesting a link between microbial growth and electrochemical activity. However, OD600 is negatively correlated with acetate degradation (r = −0.40), indicating that higher microbial density does not necessarily correspond with improved organic matter degradation.
A positive correlation is observed between OCP and Esupp (r = 0.64), reflecting their mutual dependence as indicators of the system’s electrochemical environment. In contrast, ΔE is negatively correlated with both OCP (r = −0.68) and Esupp (r = −0.52), implying that increased potential differences may impair system energy efficiency. Acetate degradation exhibits weak correlations with OCP (r = 0.20), Esupp (r = 0.02), and ΔE (r = −0.20), highlighting the multifactorial nature of substrate degradation dynamics in MEC systems.
Overall, Figure 3 underscores the complex interplay between microbial and electrochemical parameters in MEC systems. Acetate degradation appears to be maximized near ΔE ≈ 0 V, with relatively constant Esupp values. While electrochemical parameters contribute to system performance, microbial growth (OD600) emerges as a more direct predictor of degradation efficiency. These findings highlight the importance of integrating biological and electrochemical monitoring to optimize MEC performance, particularly for the treatment of complex waste streams such as winery wastewater.
Although MEC1 and MEC2 were operated under identical experimental conditions, their performance diverged, with MEC1 exhibiting lower microbial activity and substrate degradation. This variability between the two MEC systems is explained by variations in microbial community assembly and dynamics. According to Leicester et al. [30], when using mixed inocula in replica reactors under replicated conditions, different communities emerge capable of different levels of metabolism. Small differences in microbial colonization can lead to divergent community structures due to competitive or cooperative dynamics. The interplay between fermentative bacteria and electrogenic microbes is critical for efficient substrate degradation and electron transfer. Thus, differences in the establishment and stability of these syntrophic relationships can result in varying performance [31]. Given the operational and biological performance indicators attained, MEC2 was considered for further electrochemical analyses, as it emerges as the more robust system.

3.2. EIS Analysis

Aiming to disclose the underlying interfacial and transport processes that governed the bioelectrochemical performance, EIS analysis was performed at key operating points. Unlike steady-state polarization or cyclic voltammetry, EIS provides frequency-dependent information on charge transfer, mass transport, and capacitive behavior, allowing the distinguishing of bulk ohmic limitations, electron-transfer resistance at both the nascent and mature biofilm electrode interfaces, and substrate diffusion dynamics within the evolving extracellular polymeric matrix. Impedance spectra were collected almost daily, although only representative stages of the experiments are shown. Fitting these spectra with equivalent-circuit models enables quantitative comparison of evolving resistive and capacitive components across phases. This approach clarifies how internal and external charge-transfer pathways emerge and guides the selection of optimal applied potentials and hydraulic retention times for subsequent winery wastewater experiments.
In the anodic chamber, the bacteria formed a biofilm that, initially, created a thin layer on the anode, increasing resistance in the early stages. As the biofilm proliferated and reached maturity, it enhanced energy production, leading to increased conductivity at the anode interface. Figure 4 presents the Bode diagrams, phase (°/Z) and magnitude (|Z|), and the Nyquist representation corresponding to the open-circuit spectra of the cell acquired at five representative stages of the experiments: 0, 391, 823, 1686, and 3576 h, as the winery wastewater media inclusion forced the system to be displayed outside the frequency window. These spectra form a concise chronology of the electrochemical maturation of the biofilm. Although not every time-point is shown, the chosen set spans the three mechanistic regimes identified: incipient colonization, growth/thickening, and late-stage reorganization.
Compared to Nyquist representation, Bode plots present some advantages, as follows:
(1)
When several spectra separated by thousands of hours are superimposed, Nyquist loci of successive measurements overlap strongly in the high-frequency quarter circle, masking subtle shifts in the solution resistance and high-frequency constant phase element (CPE) exponents. Plotting |Z| and °/Z against log f allows each spectrum to be displayed without overlapping.
(2)
At the Bode representation, absolute values and phase angles are separated vertically, so small but systematic drifts remain visible. Also, many kinetic/diffusive phenomena manifest as frequency windows rather than individual semicircles (e.g., Gerischer behavior, finite length diffusion, adsorption inductance).
(3)
In a Bode plot, the frequency at which the phase minimum occurs, or the plateau in |Z|, can be read directly and compared with calculated time constants (τ = ½ π fmin).
(4)
As the experiments cover 105 Hz decades, at the extreme ends, the Nyquist real part converges towards the solution resistance or 0, making the tails nearly indistinguishable. On the Bode scale, the high-frequency inductive rise and the ultra-low-frequency diffusion plateau separate clearly, even when they change by <1 Ω.
From the Bode and Nyquist representations and analysis of the different MEC development periods (Figure 4), a stepwise equivalent circuit strategy was implemented to capture the temporal evolution of interfacial and transport phenomena. As the biofilm transitioned from a pristine carbon-felt interface to a millimeter-thick and highly structured conductor, progressively complex topologies were required, as described in Table 2.
Figure 5 provides a visual bridge between the biofilm’s morphological development and the electrical elements required to reproduce the impedance response at each stage. Bulk ohmic resistance (R0) represents ionic conduction through the electrolyte, membrane, and external wiring. Its value sets the high-frequency intercept in the Bode magnitude plot and remains nearly invariant, confirming that subsequent spectral changes originate within the biofilm rather than in the spacer or fluid phase.
During the initial colonization stage (Figure 5a), a monolayer of electroactive cells adsorbs on the carbon-felt, establishing the first electron transfer interface. The resistance R1 quantifies the kinetic barrier to electron exchange across this nascent biofilm/electrode contact, whereas the constant-phase element CPE1 represents the distributed double-layer capacitance generated by redox proteins, adsorbed metabolites, and surface heterogeneity. As the basal biofilm consolidates, R1 decreases, and the CPE1 phase angle shifts toward ideal capacitive behavior, reflecting improved electronic coupling. The pristine felt offers little tortuosity, so the acetate and buffer ions initially diffuse almost one-dimensionally through the thin biomass. This scenario produces the +45° phase tail captured by the finite-length Warburg element (Wo, fixed exponent p = 0.5). Wo dominates the low-frequency impedance until cellular proliferation increases film thickness and spatial heterogeneity.
By 391 h (Figure 5b), the biofilm exhibits a distinct second relaxation in both magnitude and phase plots. This new feature signals the appearance of a metabolically active outer layer enriched in extracellular polymeric substances (EPS). Electron transfer now proceeds in series: first across the inner basal layer (R1), then across the outer EPS-rich surface (R2). CPE2 reflects the additional double-layer capacitance at this biofilm/solution boundary, and its pseudocapacitive exponent records increasing roughness and heterogeneity of the EPS matrix. At 823 h (Figure 5c), substrate gradients and electron transfer reactions interlink, producing a mixed reaction diffusion impedance that no longer follows the ±45° Warburg law. The Gerischer element (G) accommodates this coupling. Its time constant (T_G) mirrors the mean residence time of acetate within metabolically active pores, while its phase signature (30−40°) determines a regime where reaction kinetics and mass transport are inseparable.
After prolonged operation and post-winery wastewater exposure (≥1320 h, Figure 5d,e), trace phenolics and pigments infiltrate the matrix, thickening EPS and partially clogging diffusion channels. The ultra-low-frequency tail approaches an exponent below 0.5, indicating anomalously slow proton or phenolic transport. A residual Warburg (Ws) is therefore invoked to fit the tail, encapsulating these extremely sluggish processes without over-parameterizing the model.
A summary of the fitted circuit elements across all the analyzed time points using the topologies described in Table 2 is presented in Table 3. These data, together with the Bode and Nyquist plots (Figure 4), provide an integrated view of the electrokinetic evolution of the biofilm and explain why the five equivalent-circuit topologies selected for fitting (Table 2) become successively necessary throughout the >5000 h run.
At 0 h, the spectrum is well described by Model code 1 (Table 2), whose single RC branch and finite-length Warburg element reproduce the high-frequency crest and the +70° low-frequency plateau visible in the phase plot. The corresponding Nyquist panel displays a single depressed semicircle (diameter~2.4 Ω) followed by a steep 70° tail, corroborating the dominance of R1‖CPE1 and incipient diffusion. Quantitatively, R1 is large (2.35 Ω) and the Warburg coefficient T_Wo is around 10 Ω s−0.5, typical of a pristine carbon-felt interface. For all finite-length Warburg elements, the exponent was fixed at p = 0.5. Hence, only the coefficient T_Wo (in Ω s−0.5) is reported. A variable exponent is used and listed only when the data display anomalous diffusion, requiring a generalized Warburg description.
By 391 h, the downward shift of the |Z| minimum and the nascent negative trough in the phase trace reveal a second relaxation process. This additional process is also evident as a low-frequency semicircle in the Nyquist plot. These features dictate the adoption of Model code 2 (Table 2), adding the [R2‖CPE2] branch, with R2 around 0.10 Ω. Continued thickening of the film to 823 h tilts the diffusion tail from +45° to 30°, while the magnitude curve develops a shallow inductive rise above 10 kHz. Only Model code 3 (Table 2), where the Warburg is replaced by a Gerischer element, reproduces this mixed reaction-diffusion behavior, with T_G around 4.7 s. In Nyquist space, the tail becomes more curved and shallower, matching the Gerischer signature.
When the biofilm reaches millimeter thickness (1320–2520 h), the system is consistently fitted with Model code 4 (Table 2). The Bode-phase minimum drifts to higher frequencies and the low-frequency magnitude rebounds, indicating shortened diffusion paths inside gas channels, but increased outer-layer resistance. Model code 4, therefore, reinstates the finite-length Warburg, whose coefficient contracts to T_Wo around 0.4 Ω s−0.5, while R2 rises by an order of magnitude. Nyquist plots at 1686 and 3576 h show a stable high-frequency semicircle (~0.3 Ω) and a classic 45° tail, confirming sustained finite-length diffusion without additional inductive hooks.
The final dataset, at 5102 h, was acquired after switching to winery wastewater and, therefore, lies outside the frequency window displayed in Figure 4. Nevertheless, the fitted Model code 5 (Table 2) with the results presented in Table 3 reveals the impact of winery wastewater introduction. Phenolic inhibitors and proton scarcity drive R1 and R2 even higher (18.8 Ω and 57 Ω, respectively), requiring a long Gerischer element (T_G = 11.7 s, n = 0.32) and a residual semi-infinite Warburg (Z0 = 30 Ω, τ = 67 s) to reproduce the broadened low-frequency response.
The integration of Nyquist, Bode magnitude, and Bode phase diagrams (Figure 4) with the equivalent circuit topologies outlined in Table 2 settles the sequence of kinetic regimes associated with colonization, channel formation, and, ultimately, winery wastewater-induced performance decay. Every shift in crest position, trough depth, or inductive rise observed in Figure 4 is mirrored by changes in the parameters of Table 3, underscoring the robustness of the stepwise modeling strategy across the entire experiment.
The impedance signatures identified at each stage can be directly translated into actionable operational guidance when interpreted alongside biological and biochemical data. During the start-up window (0–400 h), the spectrum is dominated by the single R1‖CPE1 branch, confirming that electron transfer is constrained at the double layer. The low acetate oxidation and OD600 values observed indicate insufficient endogenous mediators that should be provided by the biofilm. Applying exogenous low-level potentials would reduce the double-layer time constant and accelerate colonization. With the onset of the growth phase (400–1300 h), the emergence of the R2‖CPE2 branch alongside the Gerischer-like tail shows that diffusion and outer-layer electron hopping become comparable. This transition aligns with the sharpest decline in acetate concentration and a pronounced increase in OD600, signifying intense EPS secretion. At this stage, gentle recirculation or pulsatile flow is critical for maintaining R2 below 1 Ω and supporting high coulombic efficiency. In the mature regime (1300–5000 h), the contracted Warburg constant indicates evolved electron transfer pathways that bypass conventional diffusion. Interventions such as periodic shear detachment can reopen blocked channels and sustain current densities above 1.5 A m−2. Following winery wastewater supplementation (≥5000 h), EIS reveals an eight-fold increase in both R1 and R2, along with a ten-second Gerischer constant. Partial acidification of the catholyte or in situ buffering could restore charge-transfer kinetics and recover up to one-third of lost power.
EIS linked acetate degradation and pH and OD600 variations to the evolving physicochemical architecture of the biofilm. The sequential transition from Model codes 1 to 5 tracks (i) the collapse of charge-transfer resistances during colonization, (ii) the rise of mixed reaction-diffusion during thickening, and (iii) the deterioration under phenolic stress. By integrating Nyquist and Bode-driven diagnostics, a coherent narrative connecting interfacial electron transfer to macroscopic cell performance was constructed, validating the experimental design and reinforcing the mechanistic basis of all subsequent conclusions.

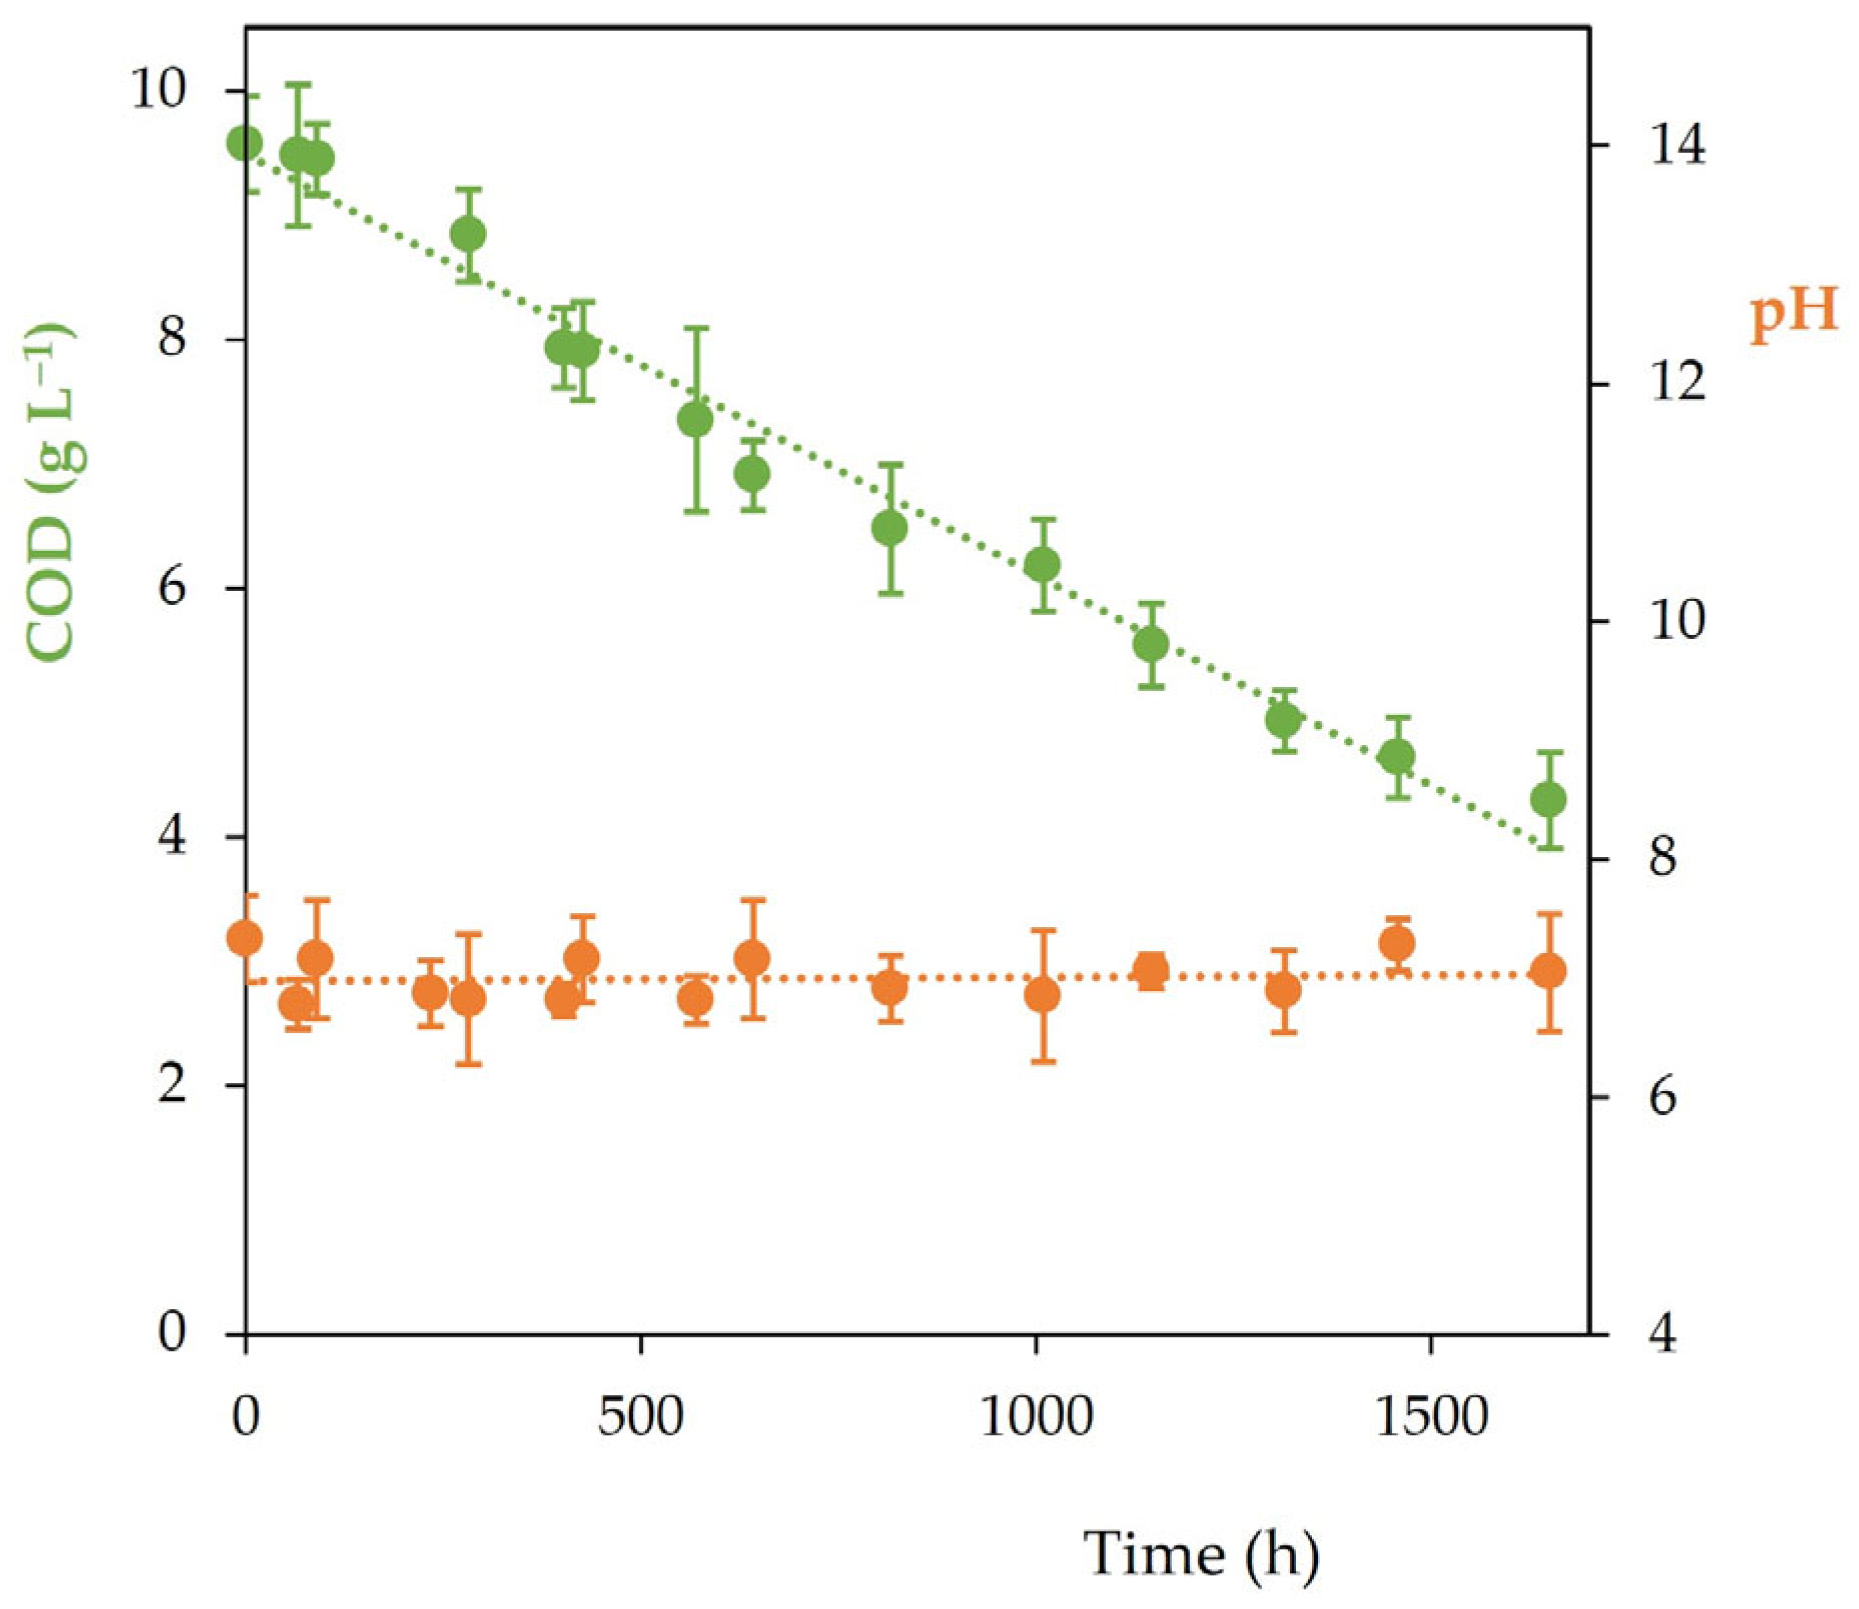
3.3. Winery Wastewater Degradation and Hydrogen Production

Figure 6 illustrates the COD decay and pH variation with time, at the anodic chamber, following the introduction of winery wastewater (5% v/v) in the MEC system. A clear and progressive decline in COD concentration is observed over time, indicating effective biodegradation of organic matter within the system. This reduction follows a nearly linear trend, reflecting sustained microbial metabolic activity, likely driven by the electroactive biofilm and associated syntrophic microbial communities. In approximately 1500 h of operation, the COD decreased by more than 5 g L−1 (~55%), confirming the system’s robustness and capacity to treat organic-rich effluents such as winery wastewater. Winery wastewaters are known for their high variability in composition and elevated organic load, which can challenge biological treatment processes. However, the observed degradation profile is consistent with findings from previous studies, which reported enhanced organic matter removal in MEC systems enriched with microbial consortia adapted to such matrices [32,33]. These consortia typically include a combination of fermentative bacteria, exoelectrogens (e.g., Geobacter spp.), and syntrophic partners capable of efficiently decomposing complex organic fractions into simpler compounds and electrons, which are then transferred to the anode.
The pH at the anodic chamber remained relatively stable throughout the experimental period, with only minor fluctuations around neutrality (pH~7). This indicates that the buffering capacity of the medium was sufficient to mitigate acidification from volatile fatty acids accumulation or alkalinization from proton consumption at the cathode or other microbial processes. pH stability is crucial in MEC, as extreme pH shifts can inhibit electroactive microbial activity and compromise electron transfer mechanisms. The lack of significant pH drift underlines the robustness of the system’s design and operation, ensuring optimal conditions for continuous bioelectrochemical performance.
In addition to COD removal, biohydrogen production was evaluated as a key performance metric. Following the introduction of winery wastewater, the system sustained an average HPR of (0.7 ± 0.3) L H2 L−1 d−1, with an average current density of (60 ± 4) A m−3. Coulombic efficiency and cathodic hydrogen recovery were, respectively, (75 ± 4)% and (87 ± 5)%. Although the HPR decreased compared to the HPR observed before the addition of the winery wastewater (1.9 ± 0.2) L H2 L−1 d−1, it remains within the range reported in the literature for similar MEC configurations treating high-strength wastewaters (Table 4). The reduction in HPR may be attributed to the complex composition of the winery wastewater, which includes polyphenols and other inhibitory compounds known to affect microbial electron transfer and metabolic pathways. Ethanol, phenolic compounds, and volatile fatty acids have been shown to significantly hinder microbial metabolic activity, leading to impaired degradation of organic matter, with consequent reduction in the generation of electrons and protons [34]. In this regard, Kanellos et al. [35] found that increasing the applied potential in MEC enhances the removal efficiency of phenolic compounds, thereby mitigating their inhibitory effect. According to the authors, this adjustment led to improved degradation of organic matter and increased hydrogen production in the cathodic chamber. A different strategy could involve the addition of specific microbial strains capable of responding more effectively to the inhibitory effect of these compounds.
The observed decrease in H2 production after adding the winery wastewater can also be explained in the context of the cathodic hydrogen evolution kinetics. At the applied experimental conditions, the cathodic reaction is primarily the hydrogen evolution reaction (HER, Equation (1)) [36].
2 H + + 2 e H 2 g ,
The electrons generated in the anodic chamber pass through an external circuit and reduce with protons to form hydrogen gas in the cathodic chamber. The complexity and slower degradation of winery wastewater reduce anodic current generation, thus supplying fewer electrons to the cathode. With lower electron input, the cathode potential becomes less negative, making the thermodynamic driving force for the HER weaker, and increasing the overpotential barrier for H2 evolution [37]. On the other hand, the slower microbial activity, besides increasing ohmic and charge transfer resistances, diminishes proton availability for HER, also enhancing possible mass transport limitations [36].
Despite the decrease in the HPR after the winery wastewater addition, the continued hydrogen evolution demonstrates the system’s capacity to balance organic degradation and energy recovery even under variable influent conditions.
Table 4. Comparison of MEC performance with the literature regarding H2 production.
InoculumAnodeCathodeMembraneHPR (L H2 L−1 d−1)References
Mixed microbial cultureCarbon-feltStainless-steelCXM-2000.7This study
Activated sludgeGraphite granulesInert polyethyleneNafion-1170.55−0.66 [38]
Activated sludgeGraphite feltsPt/C inkNeosepta AMX5.2 [12]
Wastewater sludgeCarbon feltNi/Co/Carbon clothBPM21.0 [13]
Mixed microbial cultureGranular graphiteStainless-steel CMI1.28 [39]
Food wasteCarbon-feltPt-coated TiAMI-700195.6[40]
Overall, the combined observations of efficient COD removal, stable anodic pH, and sustained hydrogen production underscore the operational resilience and versatility of the MEC system operating with a microbial consortia pre-adapted to heavy-metal environments. These findings reinforce the potential of MEC as a viable technology for the simultaneous treatment and valorization of agro-industrial wastewaters, offering a sustainable pathway toward waste-to-energy conversion.

4. Conclusions

This study demonstrates that a dual-chamber MEC, inoculated with tailored microbial consortia, can effectively degrade winery wastewater while producing biohydrogen. The system sustained hydrogen production at an average rate of (0.7 ± 0.3) L H2 L−1 d−1 and achieved a current density of (60 ± 4) A m−3, with coulombic efficiency and cathodic hydrogen recovery values of 75% and 87%, respectively. These values confirm effective electron transfer and energy recovery, despite the presence of inhibitory compounds such as polyphenols. EIS was instrumental in diagnosing biofilm evolution, quantifying charge-transfer resistances, and predicting shifts in system performance. Compared to other studies using synthetic or less complex substrates, this work highlights the robust performance of MECs in real, high-strength agro-industrial wastewaters. Unlike short-term trials, the >5000-h continuous operation adds valuable insight into the long-term stability and adaptability of electroactive consortia. Future research should explore system scale-up, cathode material enhancements to reduce overpotentials, and strategies to mitigate phenolic inhibition, including bioaugmentation and advanced electrochemical control. The integration of real-time EIS diagnostics with microbial community analysis offers a promising pathway for predictive control and optimization in large-scale bioelectrochemical systems.

Author Contributions

Conceptualization, A.F. and M.C.F.; methodology, A.I.A.-E. and Y.Z.; software, A.I.A.-E.; validation, A.F. and M.C.F.; formal analysis, A.F.; investigation, A.B., N.R. and M.P.; data curation, A.B. and A.I.A.-E.; writing—original draft preparation, A.B. and B.A.; writing—review and editing, A.F.; visualization, B.A.; supervision, A.F. and M.C.F.; project administration, A.F.; funding acquisition, A.F. All authors have read and agreed to the published version of the manuscript.

Funding

This research was funded by Fundação para a Ciência e a Tecnologia, FCT, projects UIDB/00195/2020 (https://doi.org/10.54499/UIDB/00195/2020), CHANGE (https://doi.org/10.54499/LA/P/0121/2020), MED (https://doi.org/10.54499/UIDB/05183/2020; https://doi.org/10.54499/UIDP/05183/2020), 2022.02566.PTDC-Wine4H2 (https://doi.org/10.54499/2022.02566.PTDC); PhD grants 2022.11077.BD (A. Baía) and UI/BD/153579/2022 (A.I. Arroyo-Escoto); and research contract CEECINST/00016/2021/CP2828/CT0006 awarded to A. Fernandes under the scope of the CEEC Institutional 2021 (https://doi.org/10.54499/CEECINST/00016/2021/CP2828/CT0006).

Data Availability Statement

The original contributions presented in this study are included in the article. Further inquiries can be directed to the corresponding author.

Acknowledgments

The authors are very grateful for the support granted by the Research Unit of Fiber Materials and Environmental Technologies (FibEnTech-UBI), through the Project reference UIDB/00195/2020, funded by the Fundação para a Ciência e a Tecnologia (FCT), IP/MCTES through national funds (PIDDAC). Furthermore, the authors wish to praise the guidance and helpful collaboration of Ana Lopes, who recently passed away, in this research work and, simultaneously, pay tribute to her for her dedication to the FibEnTech-UBI and Wine4H2 project.

Conflicts of Interest

The authors declare no conflicts of interest. The funders had no role in the design of the study; in the collection, analyses, or interpretation of data; in the writing of the manuscript; or in the decision to publish the results.

Abbreviations

The following abbreviations are used in this manuscript:
AcdegAcetate degradation
CEMCation exchange membrane
CODChemical oxygen demand
CPEConstant phase element
EISElectrochemical impedance spectroscopy
EPSExtracellular polymeric substances
EsuppElectric potential supplemented to the cathode
GCGas chromatograph
HERHydrogen evolution reaction
HPLCHigh-performance liquid chromatography
HPRHydrogen-production rate
MECMicrobial electrolysis cell
MSSMunicipal sewage sludge
MWWMining wastewater
NBAFNutrient broth acetate fumarate
OCPOpen-circuit potential
OD600Optical density at 600 nm
RCResistor-capacitor
SHEStandard hydrogen electrode
SLLSanitary landfill leachate
TWarburg time constant
ΔEAnode potential variation

References

  1. Padhiary, M.; Kumar, R. Assessing the environmental impacts of agriculture, industrial operations, and mining on agro-ecosystems. In Smart Internet of Things for Environment and Healthcare; Mallick, P.K., Tuba, M., Eds.; Springer Nature Switzerland: Cham, Switzerland, 2024; pp. 107–126. [Google Scholar] [CrossRef]
  2. Salgot, M.; Folch, M. Wastewater treatment and water reuse. Curr. Opin. Environ. Sci. Health 2018, 2, 64–74. [Google Scholar] [CrossRef]
  3. Wang, D.; Chen, S.; Lai, S.; Dai, W.; Yang, L.; Deng, L.; Luo, S.L. Advanced municipal wastewater treatment and simultaneous energy/resource recovery via photo [electro] catalysis. Chin. Chem. Lett. 2023, 34, 107861. [Google Scholar] [CrossRef]
  4. El Mekawy, A.; Hegab, H.M.; Alsafar, H.; Yousef, A.F.; Banat, F.; Hasan, S.W. Bacterial nanotechnology: The intersection impact of bacteriology and nanotechnology on the wastewater treatment sector. J. Environ. Chem. Eng. 2023, 11, 109212. [Google Scholar] [CrossRef]
  5. Yaashikaa, P.R.; Devi, M.K.; Kumar, P.S.; Rangasamy, G.; Rajendran, S.; Xiao, L. A review on pretreatment methods, photobioreactor design and metabolic engineering approaches of algal biomass for enhanced biohydrogen production. Int. J. Hydrogen Energy 2023, 48, 21110–21127. [Google Scholar] [CrossRef]
  6. Uddin, M.M.; Wright, M.M. Anaerobic digestion fundamentals, challenges, and technological advances. Phys. Sci. Rev. 2023, 8, 2819–2837. [Google Scholar] [CrossRef]
  7. Abanades, S.; Abbaspour, H.; Ahmadi, A.; Das, B.; Ehyaei, M.A.; Esmaeilion, F.; Silveira, J.L. A conceptual review of sustainable electrical power generation from biogas. Energy Sci. Eng. 2022, 10, 630–655. [Google Scholar] [CrossRef]
  8. Yerassyl, D.; Jin, Y.; Zhanar, S.; Aigul, K.; Saltanat, Y. The current status and lost biogas production potential of Kazakhstan from anaerobic digestion of livestock and poultry manure. Energies 2022, 15, 3270. [Google Scholar] [CrossRef]
  9. Guerrero-Sodric, O.; Baeza, J.A.; Guisasola, A. Enhancing bioelectrochemical hydrogen production from industrial wastewater using Ni-foam cathodes in a microbial electrolysis cell pilot plant. Water Res. 2024, 256, 121616. [Google Scholar] [CrossRef]
  10. Marandola, C.; Cristiani, L.; Zeppilli, M.; Villano, M.; Majone, M.; Fantini, E.; Marone, A. Harvesting Biofuels with Microbial Electrochemical Technologies (METs): State of the Art and Future Challenges. In Wastewater Exploitation: From Microbial Activity to Energy; Springer: Cham, Switzerland, 2024; pp. 305–348. [Google Scholar]
  11. Timmerman, L.R.; Raghavan, S.; Borole, A.P. Advancing Microbial Electrolysis Technology via Impedance Spectroscopy and Multi-Variate Analysis. Front. Energy Res. 2022, 10, 756900. [Google Scholar] [CrossRef]
  12. Kim, H.-J.; Nam, J.-Y.; Kim, H.-W.; Jwa, E. Evaluation of a mixture of livestock wastewater and food waste as a substrate in a continuous-flow microbial electrolysis cell. Sci. Total Environ. 2024, 955, 176884. [Google Scholar] [CrossRef]
  13. Jwa, E.; Kim, S.; Jeong, N.; Han, S.; Song, M.J.; Kang, S.; Nam, J.-Y. Enhanced hydrogen production in zero-gap bipolar membrane microbial electrolysis with binderless cathodes in real wastewater. Chem. Eng. J. 2025, 509, 161416. [Google Scholar] [CrossRef]
  14. Murugaiyan, J.; Narayanan, A.; Mohamed, S.N. Influence of zinc ferrite nanocomposites for enhancing biohydrogen production during distillery wastewater treatment in microbial electrolysis cell. Fuel 2025, 392, 134872. [Google Scholar] [CrossRef]
  15. Amanze, C.; Zheng, X.; Anaman, R.; Wu, X.; Fosua, B.A.; Xiao, S.; Xia, M.; Ai, C.; Yu, R.; Wu, X.; et al. Effect of nickel (II) on the performance of anodic electroactive biofilms in bioelectrochemical systems. Water Res. 2022, 222, 118889. [Google Scholar] [CrossRef] [PubMed]
  16. Shi, X.; Duan, Z.; Wang, J.; Zhou, W.; Jiang, M.; Li, T.; Ma, H.; Zhu, X. Simultaneous removal of multiple heavy metals using single-chamber microbial electrolysis cells with biocathode in a micro-aerobic environment. Chemosphere 2023, 318, 137982. [Google Scholar] [CrossRef]
  17. Kanellos, G.; Kyriakopoulos, D.; Lyberatos, G.; Tremouli, A. Electrochemical characterization of a microbial electrolysis cell during the bio-electrochemical conversion of CO2 to CH4. Biochem. Eng. J. 2022, 182, 108431. [Google Scholar] [CrossRef]
  18. Dubrovin, I.A.; Hirsch, L.O.; Chiliveru, A.; Jukanti, A.; Rozenfeld, S.; Schechter, A.; Cahan, R. Microbial electrolysis cells based on a bacterial anode encapsulated with a dialysis bag including graphite particles. Microorganisms 2024, 12, 1345. [Google Scholar] [CrossRef] [PubMed]
  19. Wang, L.; Wu, Y.; You, Z.; Bao, H.; Zhang, L.; Wang, J. Electrochemical impedance spectroscopy (EIS) reveals the role of microbial fuel cell-ceramic membrane bioreactor (MFC-CMBR): Electricity utilization and membrane fouling. Water Res. 2022, 222, 117037. [Google Scholar] [CrossRef]
  20. Fathima, A.; Ilankoon, I.M.S.K.; Zhang, Y.; Chong, M.N. Scaling up of dual-chamber microbial electrochemical systems—An appraisal using systems design approach. Sci. Total Environ. 2024, 912, 169186. [Google Scholar] [CrossRef] [PubMed]
  21. Guerrero-Sodric, O.; Baeza, J.A.; Guisasola, A. Exploring key operational factors for improving hydrogen production in a pilot-scale microbial electrolysis cell treating urban wastewater. Chem. Eng. J. 2023, 469, 144001. [Google Scholar] [CrossRef]
  22. Yavarinasab, A.; He, J.; Mookherjee, A.; Krishnan, N.; Pestana, L.R.; Fusco, D.; Bizzotto, D.; Tropini, C. Electrogenic dynamics of biofilm formation: Correlation between genetic expression and electrochemical activity in Bacillus subtilis. Biosens. Bioelectron. 2025, 276, 117218. [Google Scholar] [CrossRef]
  23. Mais, L.; Rodríguez, J.; Campana, R.; Melis, N.; Vacca, A.; Mascia, M. Modelling and EIS characterization of a tubular microbial fuel cell with slip-cast ceramic membrane. J. Power Sources 2025, 630, 236143. [Google Scholar] [CrossRef]
  24. Huerta-Miranda, G.A.; Arroyo-Escoto, A.I.; Burgos, X.; Juárez, K.; Miranda-Hernández, M. Influence of the major pilA transcriptional regulator in electrochemical responses of Geobacter sulfureducens PilR-deficient mutant biofilm formed on FTO electrodes. Bioelectrochemistry 2019, 127, 145–153. [Google Scholar] [CrossRef]
  25. O’Brien, J.P.; Malvankar, N.S. A Simple and Low-Cost Procedure for Growing Geobacter sulfurreducens Cell Cultures and Biofilms in Bioelectrochemical Systems. Curr. Protoc. Microbiol. 2016, 43, A-4K. [Google Scholar] [CrossRef] [PubMed]
  26. American Public Health Association; American Water Works Association; Water Environment Federation. Standard Methods for the Examination of Water and Wastewater, 24th ed.; Lipps, W.C., Braun-Howland, E.B., Baxter, T.E., Eds.; APHA Press: Washington, DC, USA, 2023; ISBN 978-0875532998. [Google Scholar]
  27. Ochiai, I.; Harada, T.; Jomori, S.; Kouzuma, A.; Watanabe, K. Bioaugmentation of microbial electrolysis cells with Geobacter sulfurreducens YM18 for enhanced hydrogen production from starch. Bioresour. Technol. 2023, 386, 129508. [Google Scholar] [CrossRef]
  28. Murbach, M.D.; Gerwe, B.; Dawson-Elli, N.; Tsui, L.K. impedance.py: A Python package for electrochemical impedance analysis. J. Open Source Softw. 2020, 5, 2349. [Google Scholar] [CrossRef]
  29. Ibrahim, K.; Sabathiel, S.; Farooq, F.; Hofer, G.; Bergmann, A.; Heer, R. An empirical model for state of charge estimation based on electrochemical impedance spectroscopy. In Proceedings of the 2024 IEEE International Conference on Electrical Systems for Aircraft, Railway, Ship Propulsion and Road Vehicles & International Transportation Electrification Conference (ESARS-ITEC), Naples, Italy, 26–29 November 2024; pp. 1–6. [Google Scholar]
  30. Leicester, D.D.; Settle, S.; McCann, C.M.; Heidrich, E.S. Investigating variability in microbial fuel cells. Appl. Environ. Microbiol. 2023, 89, e02181-22. [Google Scholar] [CrossRef]
  31. Santoro, C.; Babanova, S.; Cristiani, P.; Artyushkova, K.; Atanassov, P.; Bergel, A.; Bretschger, O.; Brown, R.K.; Carpenter, K.; Colombo, A.; et al. How comparable are microbial electrochemical systems around the globe? An electrochemical and microbiological cross-laboratory study. ChemSusChem 2021, 14, 2313. [Google Scholar] [CrossRef]
  32. Cheng, D.; Ngo, H.H.; Guo, W.; Chang, S.W.; Nguyen, D.D.; Zhang, S.; Hoang, N.B. Impact factors and novel strategies for improving biohydrogen production in microbial electrolysis cells. Bioresour. Technol. 2022, 346, 126588. [Google Scholar] [CrossRef]
  33. Rabaey, K.; Rozendal, R.A. Microbial electrosynthesis revisiting the electrical route for microbial production. Nat. Rev. Microbiol. 2010, 8, 706–716. [Google Scholar] [CrossRef] [PubMed]
  34. Sharma, P.; Melkania, U. Effect of phenolic compounds on hydrogen production from municipal solid waste. Waste Manag. 2018, 78, 115–123. [Google Scholar] [CrossRef]
  35. Kanellos, G.; Monokrousou, E.; Tremouli, A.; Lyberatos, G. Treatment of two-phase olive mill waste and degradation of phenolic compounds with simultaneous bio-electrochemical conversion of CO2 to CH4 using a microbial electrolysis cell. Sustain. Chem. Pharm. 2024, 39, 101589. [Google Scholar] [CrossRef]
  36. Jensen, L.S.; Kaul, C.; Juncker, N.B.; Thomsen, M.H.; Chaturvedi, T. Biohydrogen production in microbial electrolysis cells utilizing organic residue feedstock: A review. Energies 2022, 15, 8396. [Google Scholar] [CrossRef]
  37. Tang, J.; Bian, Y.; Jin, S.; Sun, D.; Ren, Z.J. Cathode material development in the past decade for H2 production from microbial electrolysis cells. ACS Environ. Au 2022, 2, 20–29. [Google Scholar] [CrossRef]
  38. Cristiani, L.; Zeppilli, M.; Feriaud, D.; Marandola, C.; Papini, M.P.; Da Silva, S.; Erable, B.; Villano, M. Enhancing energy efficiency and H2 production in lab-scale dual chamber microbial electrolysis cells: A focus on catholyte composition and voltage losses. J. Environ. Chem. Eng. 2024, 12, 111782. [Google Scholar] [CrossRef]
  39. Marchetti, A.; Moreno, M.C.; Lauri, R.; Zeppilli, M. Hydrogen production through efficient organic matter oxidation performed by microbial electrolysis cells. Processes 2025, 13, 1231. [Google Scholar] [CrossRef]
  40. Kim, D.; Choi, Y.; Cha, J.; Park, H.; Baek, G.; Lee, C. Pre-fermentation and filtration pretreatments enhance hydrogen production from food waste through microbial electrolysis cell. Bioresour. Technol. 2025, 424, 132267. [Google Scholar] [CrossRef]
Figure 1. Schematic diagram of the MEC system used in the study.
Energies 18 03043 g001
Figure 2. (a) Optical density at 600 nm, (b) acetate concentration, (c) anode electric potential variation, (d) electric potential supplemented to the cathode, and (e) open-circuit potential evolution along the MEC development and operation, before (green area) and after (orange area) winery wastewater addition.
Energies 18 03043 g002
Figure 3. Relationship between acetate degradation (green symbols) and electric potential supplemented to the cathode (Esupp—orange symbols) versus the anode electric potential variation (ΔE) in (a) MEC1 and (b) MEC2. (c) Heatmap of correlations between optical density at 600 nm (OD600), open-circuit potential (OCP), electric potential supplemented to the cathode, anode electric potential variation, and acetate degradation (Acdeg). The scripts were developed in Python using pandas, numpy, and scipy.stats libraries.
Energies 18 03043 g003
Figure 4. (a) Bode phase, (b) Bode magnitude, and (c) Nyquist plots at representative biofilm development stages (0–3576 h).
Energies 18 03043 g004
Figure 5. Morphological progression of the anodic biofilm overlaid with the equivalent circuit topology selected for EIS fitting at each stage (Model codes 1–5 from Table 2): (a) initial colonization (0 h), (b) after 391 h, (c) at 823 h, (d) between 1320−3576 h, and (e) post-winery wastewater exposure (5102 h). R0: ohmic resistance of the solution and cell connections; R1: charge transfer resistance at the inner biofilm/electrode interface; CPE1: constant phase element modeling double-layer capacitance dispersion at the inner interface; Wo: finite-length Warburg element representing substrate diffusion limitations within the biofilm; R2: charge transfer resistance at the outer biofilm/bulk solution interface; CPE2: constant phase element associated with the outer interface; G: Gerischer element modeling coupled diffusion-reaction within a porous or reactive biofilm domain; Ws: residual Warburg element representing long-time scale diffusion phenomena or slow ionic transport.
Energies 18 03043 g005
Figure 6. Chemical oxygen demand decay and pH variation with time, at the anodic chamber, following the introduction of winery wastewater (5% v/v) in the MEC system.
Energies 18 03043 g006
Table 1. Microbial consortia and MEC inoculum composition.
Microbial Consortia
SourceCollection SiteDosage Ratio
Sanitary landfill leachateIntermunicipal sanitary landfill of Associação de Municípios do Alentejo Central, Vila Ruiva, Portugal1/3
Mining wastewaterMina de São Domingos, Mértola, Portugal1/3
Municipal sewage sludgeMunicipal wastewater treatment plant of Beja, Portugal1/3
MEC Inoculum
CompositionSourceDosage Ratio
Microbial consortiaDeveloped in this study2/3
Geobacter sulfurreducens PCAAmbifirst, Moita, Portugal1/3
Table 2. Topology model selection according to MEC mechanistic needs during time development.
Model CodeTopologyApplied Time (h)Justification
1R0–[R1‖CPE1]–Wo0Single interfacial process + incipient diffusion
2R0–[R1‖CPE1]–[R2‖CPE2]–Wo391The second time constant appears as the biofilm forms
3R0–[R1‖CPE1]–[R2‖CPE2]–G823Warburg tail becomes Gerischer due to coupled reaction-diffusion
4R0–[R1‖CPE1]–[R2‖CPE2]–Wo1320–3576Thick, but still semi-infinite, diffusion in mature film
5R0–[R1‖CPE1]–[R2‖CPE2]–G–Ws5102Reaction-diffusion + very slow residual semi-infinite transport
R0: ohmic resistance of the solution and cell connections; R1: charge transfer resistance at the inner biofilm/electrode interface; CPE1: constant phase element modeling double-layer capacitance dispersion at the inner interface; Wo: finite-length Warburg element representing substrate diffusion limitations within the biofilm; R2: charge transfer resistance at the outer biofilm/bulk solution interface; CPE2: constant phase element associated with the outer interface; G: Gerischer element modeling coupled diffusion-reaction within a porous or reactive biofilm domain; Ws: residual Warburg element representing long-time scale diffusion phenomena or slow ionic transport.
Table 3. Summary of fitted circuit elements across all analyzed time points (0–5102 h) using model codes 1–5 described in Table 2.
t (h)R0 (Ω)R1 (Ω)Q1 (S sn)n1R2 (Ω)Q2 (S sn)n2Diffusive ElementMSE (Ω2)MSE_w (Ω2)
05.0 × 10−12.41.6 × 10−61.0Wo (T = 10 Ω s−0.5, p = 0.40)5.5 × 10−11.3 × 10−2
3913.21.01.0 × 10−66.0 × 10−11.0 × 10−11.0 × 10−75.0 × 10−1Wo (T = 9.30 Ω s−0.5)7.5 × 10−14.0 × 10−1
8233.91.0 × 10−41.0 × 10−66.0 × 10−11.0 × 10−41.0 × 10−75.0 × 10⁻¹G (T = 4.66 Ω s−0.5)2.8 × 10−15.6 × 10−2
13202.43.5 × 10−11.0 × 10−19.4 × 10−15.05.4 × 10−81.0Wo (T = 1.53 Ω s−0.5)1.8 × 10−12.2 × 10−3
16863.83.2 × 10−12.5 × 10−27.0 × 10−11.6 × 10−31.0 × 10−85.0 × 10⁻¹Wo (T = 0.40 Ω s−0.5)6.4 × 10−16.6 × 10−3
25206.06.1 × 10−11.0 × 10−28.5 × 10−11.0 × 10−26.1 × 10−59.9 × 10⁻¹Wo (T = 1.79 Ω s−0.5)1.7 × 10−13.1 × 10−3
35765.3 × 10−13.2 × 10−13.8 × 10−38.4 × 10−15.04.1 × 10−81.0Wo (T = 1.66 Ω s−0.5, p = 0.97)1.4 × 10−23.8 × 10−3
51021.5 × 10−11.9 × 107.6 × 10−44.5 × 10−15.7 × 101.1 × 10−81.0G (T = 11.7 Ω s−0.5, n = 0.32) + Ws (Z0 = 30.6 Ω, τ = 66.7 s)9.5 × 10−23.6 × 10−3
R0: ohmic resistance of the solution and cell connections; R1: charge transfer resistance at the inner biofilm/electrode interface; Q1: pseudo-capacitance (pre-exponential) of the inner constant-phase element (CPE1); n1: exponent of CPE1; R2: charge transfer resistance at the outer biofilm/bulk solution interface; Q2: pseudo-capacitance of the outer constant-phase element (CPE2); n2: exponent of CPE2; MSE: unweighted mean-square error of the non-linear least-squares fit; MSE_w: weighted mean-square error (each data point weighted by inverse variance); Wo: finite-length Warburg element representing substrate diffusion limitations within the biofilm; T: Warburg or Gerischer coefficient; p: exponent of the finite-length Warburg element; G: Gerischer element modeling coupled diffusion-reaction within a porous or reactive biofilm domain; n: exponent of the Gerischer element; Ws: residual Warburg element representing long-time scale diffusion phenomena or slow ionic transport; Z0: characteristic resistance of the residual semi-infinite Warburg element (Ws); τ: time constant associated with the residual Warburg element.
Disclaimer/Publisher’s Note: The statements, opinions and data contained in all publications are solely those of the individual author(s) and contributor(s) and not of MDPI and/or the editor(s). MDPI and/or the editor(s) disclaim responsibility for any injury to people or property resulting from any ideas, methods, instructions or products referred to in the content.

