5.1. Characteristic Impedance Analysis of Shield Breakage of Multi-Core Nuclear I&C Cables Based on Theoretical Calculations
The actual parameters of the existing cross-linked polyolefin nuclear I&C cables are derived based on the distributed parameter calculation model derived in the previous section. The characteristic impedance of intact multi-core nuclear I&C cables is calculated using MATLAB 2020b according to different center frequencies. For multi-core cables with different numbers of cores and different core sizes, the eccentricity spacing is inconsistent. Within the range of actual core sizes of the actual nuclear I&C cables, the variation curves of the characteristic impedance with the eccentricity spacing of the normal state partial-core line at a frequency of 10 MHz can be obtained for different partial-core spacings, as shown in
Figure 7.
It can be found in
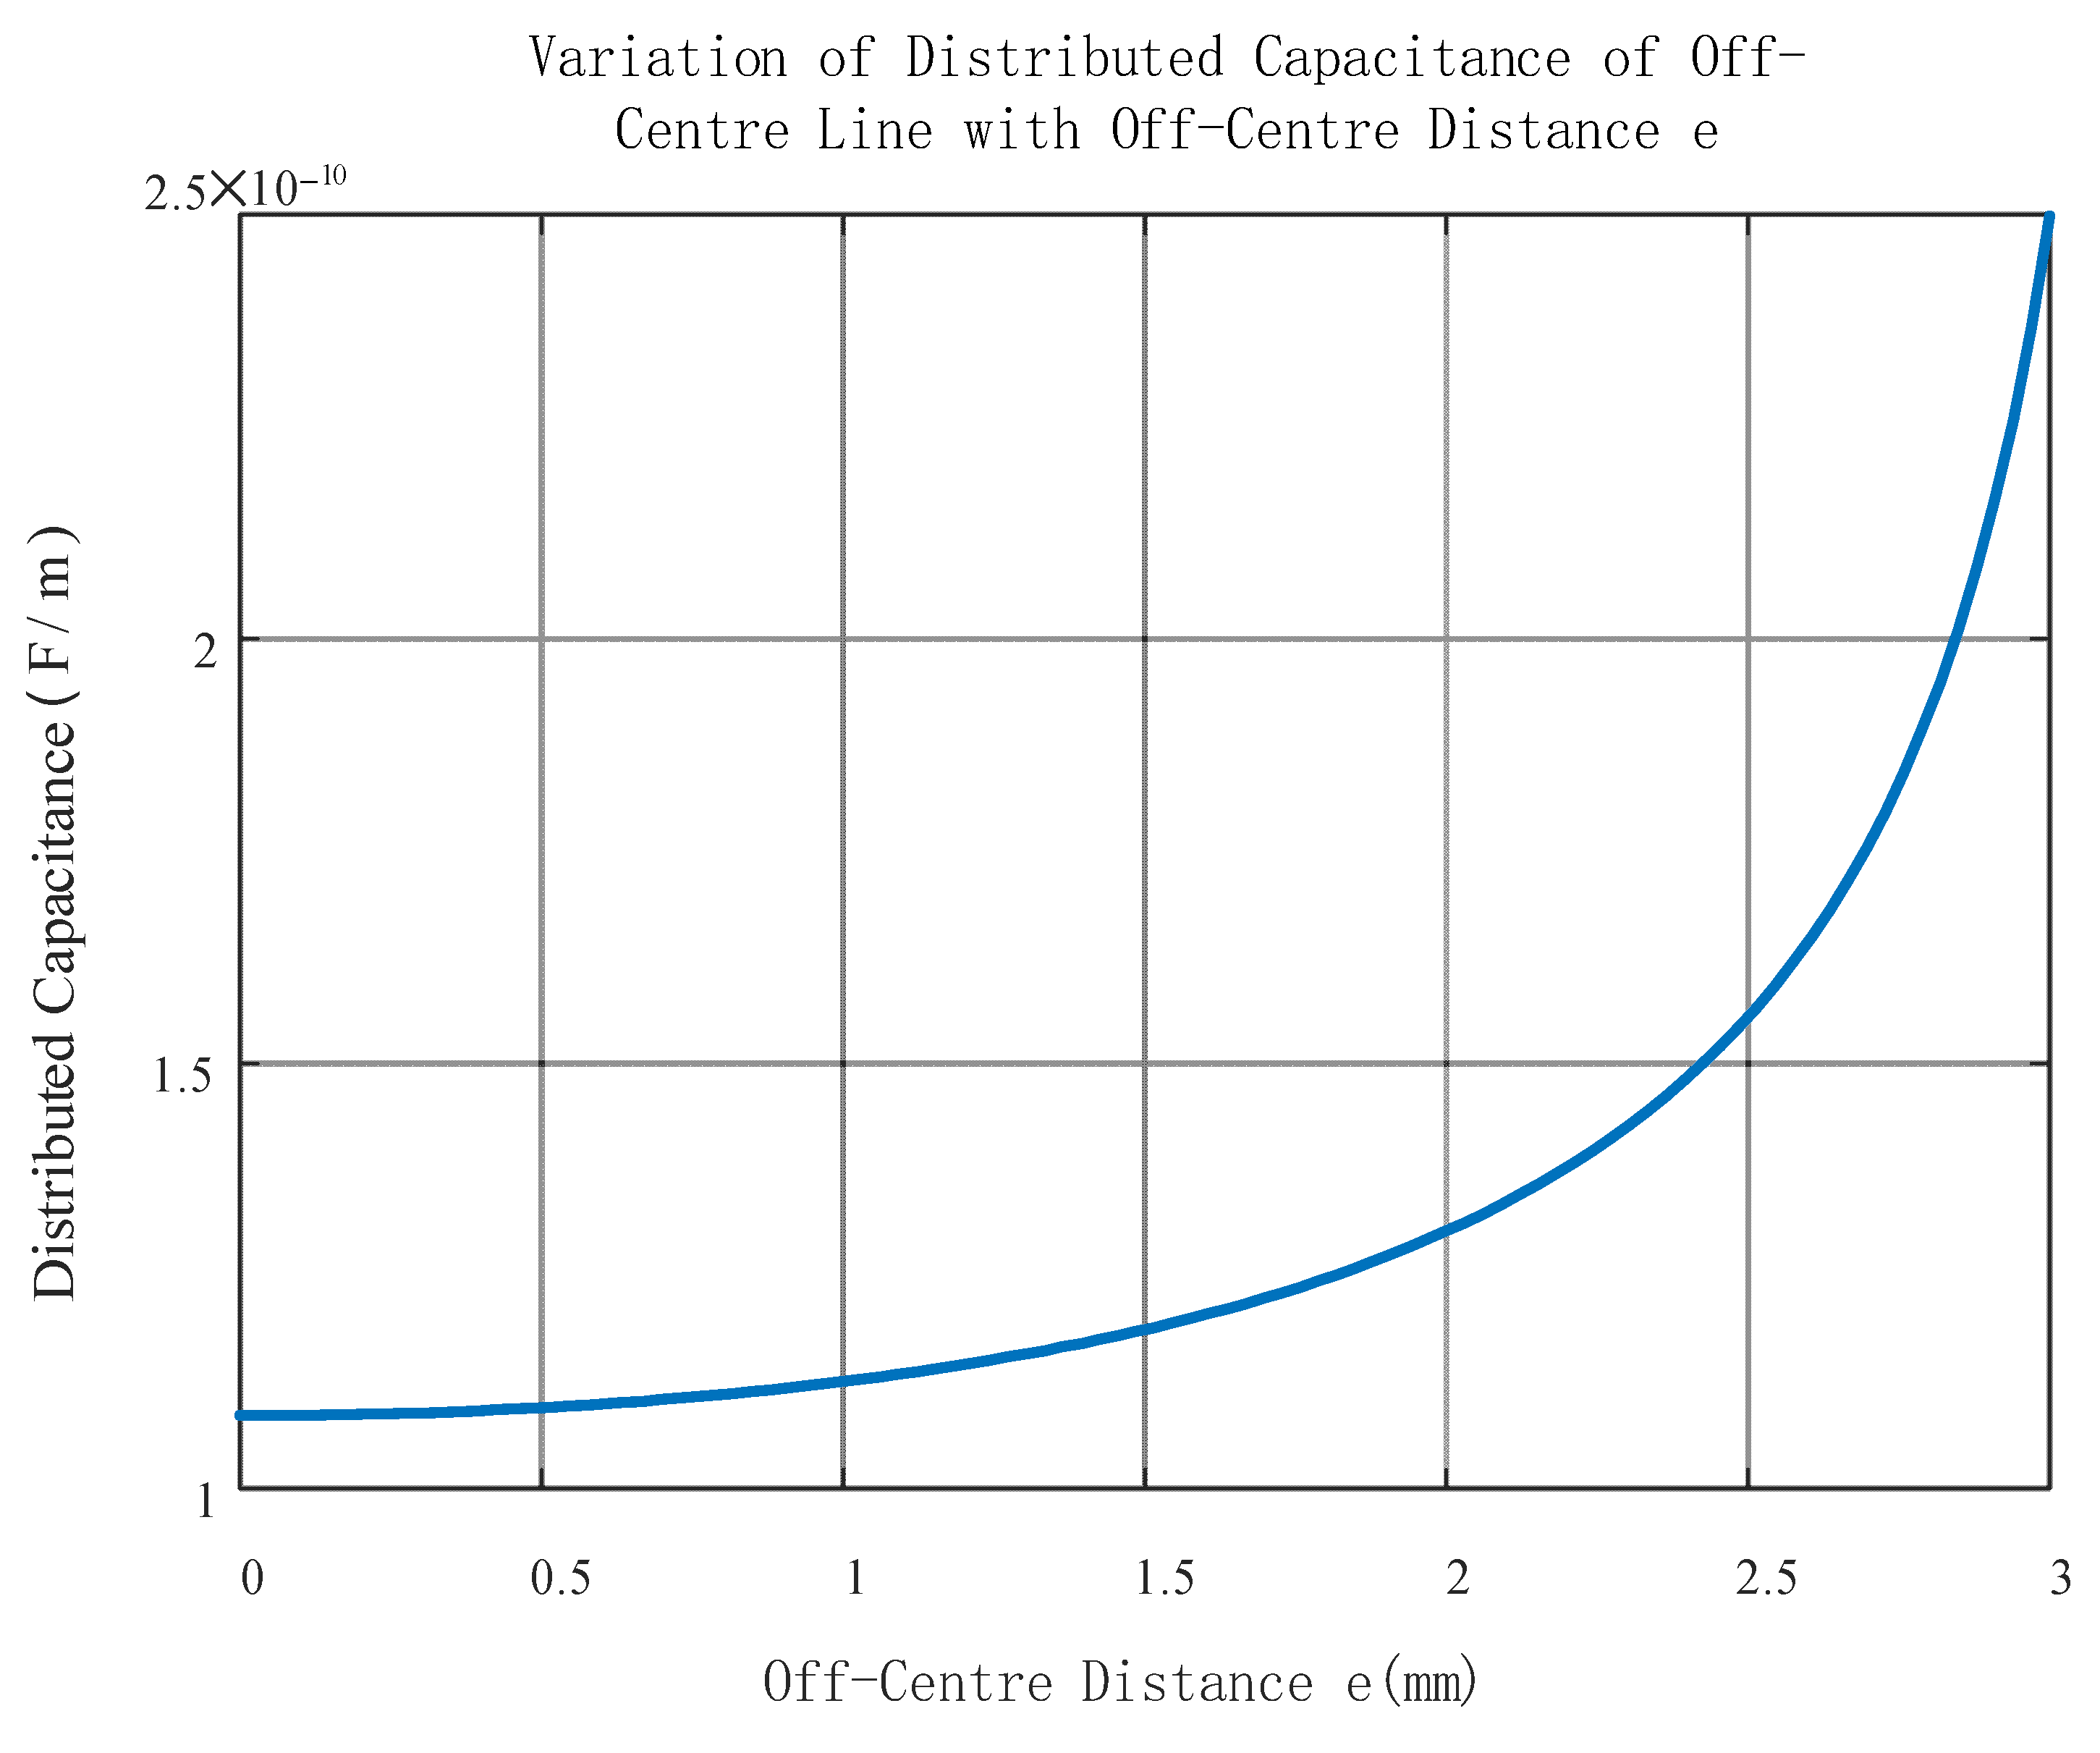
Figure 7 that the larger the off-core distance of the inner conductor is, the smaller its characteristic impedance value is. The closer the core is to the edge of the shield, the faster its characteristic impedance decreases. In the high-frequency band, the dominant element of the characteristic impedance is the distributed capacitance, and the variation curve of the distributed capacitance with the offset core distance at 10 MHz is shown in
Figure 8. As the offset distance increases, the electromagnetic coupling between the inner conductor of the core and the outer shield is weakened, and the spacing between the inner and outer conductors is shorter. So, the distributed capacitance increases, and therefore the characteristic impedance decreases with the increase in the offset distance.
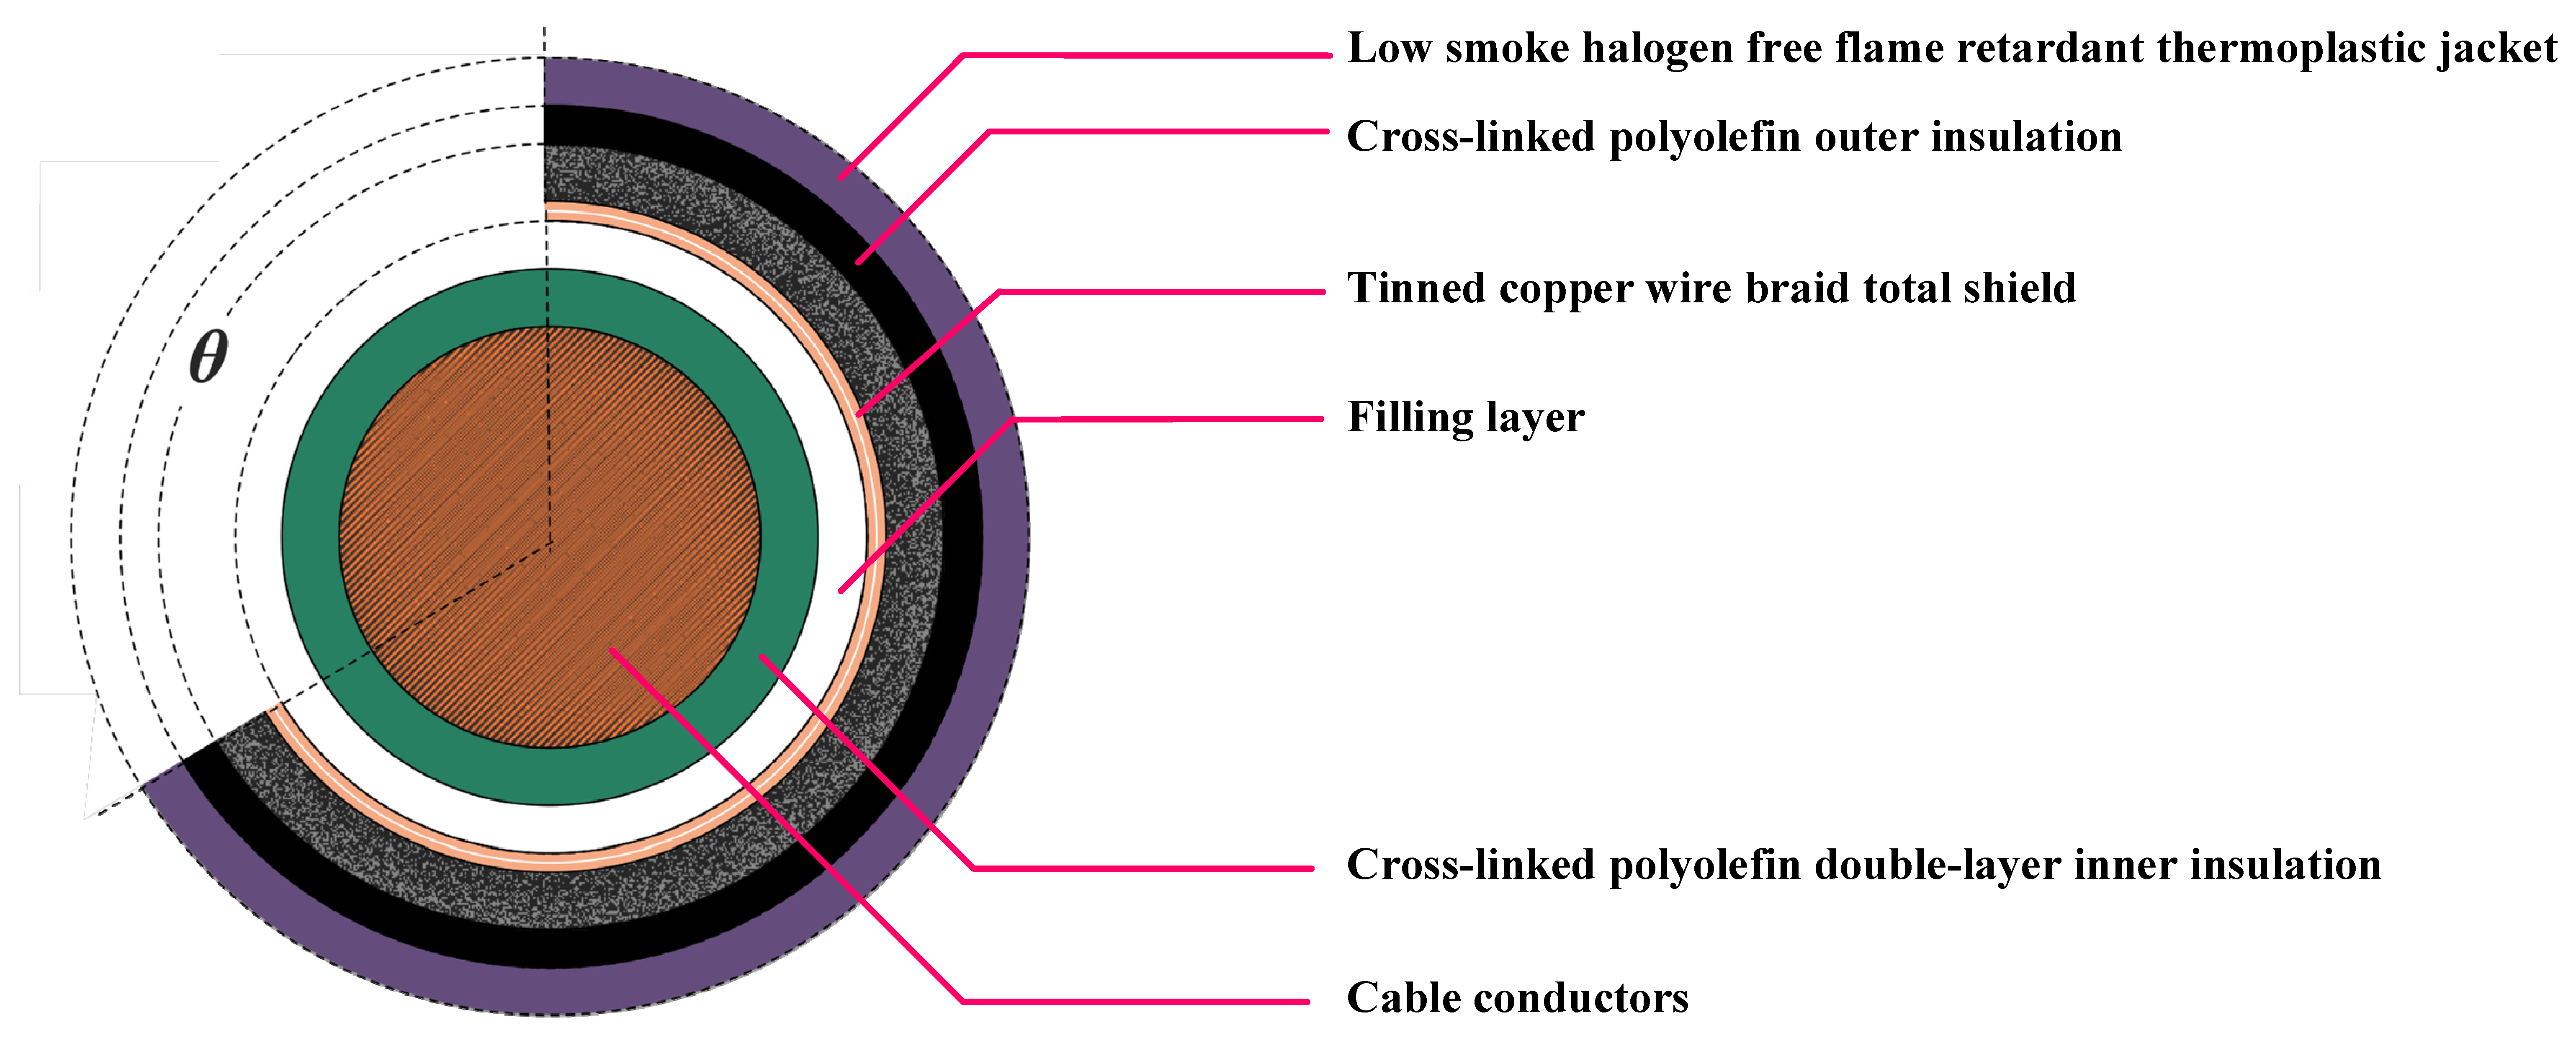
According to the size of the actual spare four-core nuclear I&C cables studied in this paper, it is determined that the offset core distance
e = 2.57 mm, in which the curve of the characteristic impedance of the offset core nuclear I&C cables with the change in frequency can be obtained. The horizontal axis is displayed in logarithmic scale, as shown in
Figure 9. When the frequency increases, its characteristic impedance gradually decreases and gradually stabilizes at 37.795 Ω.
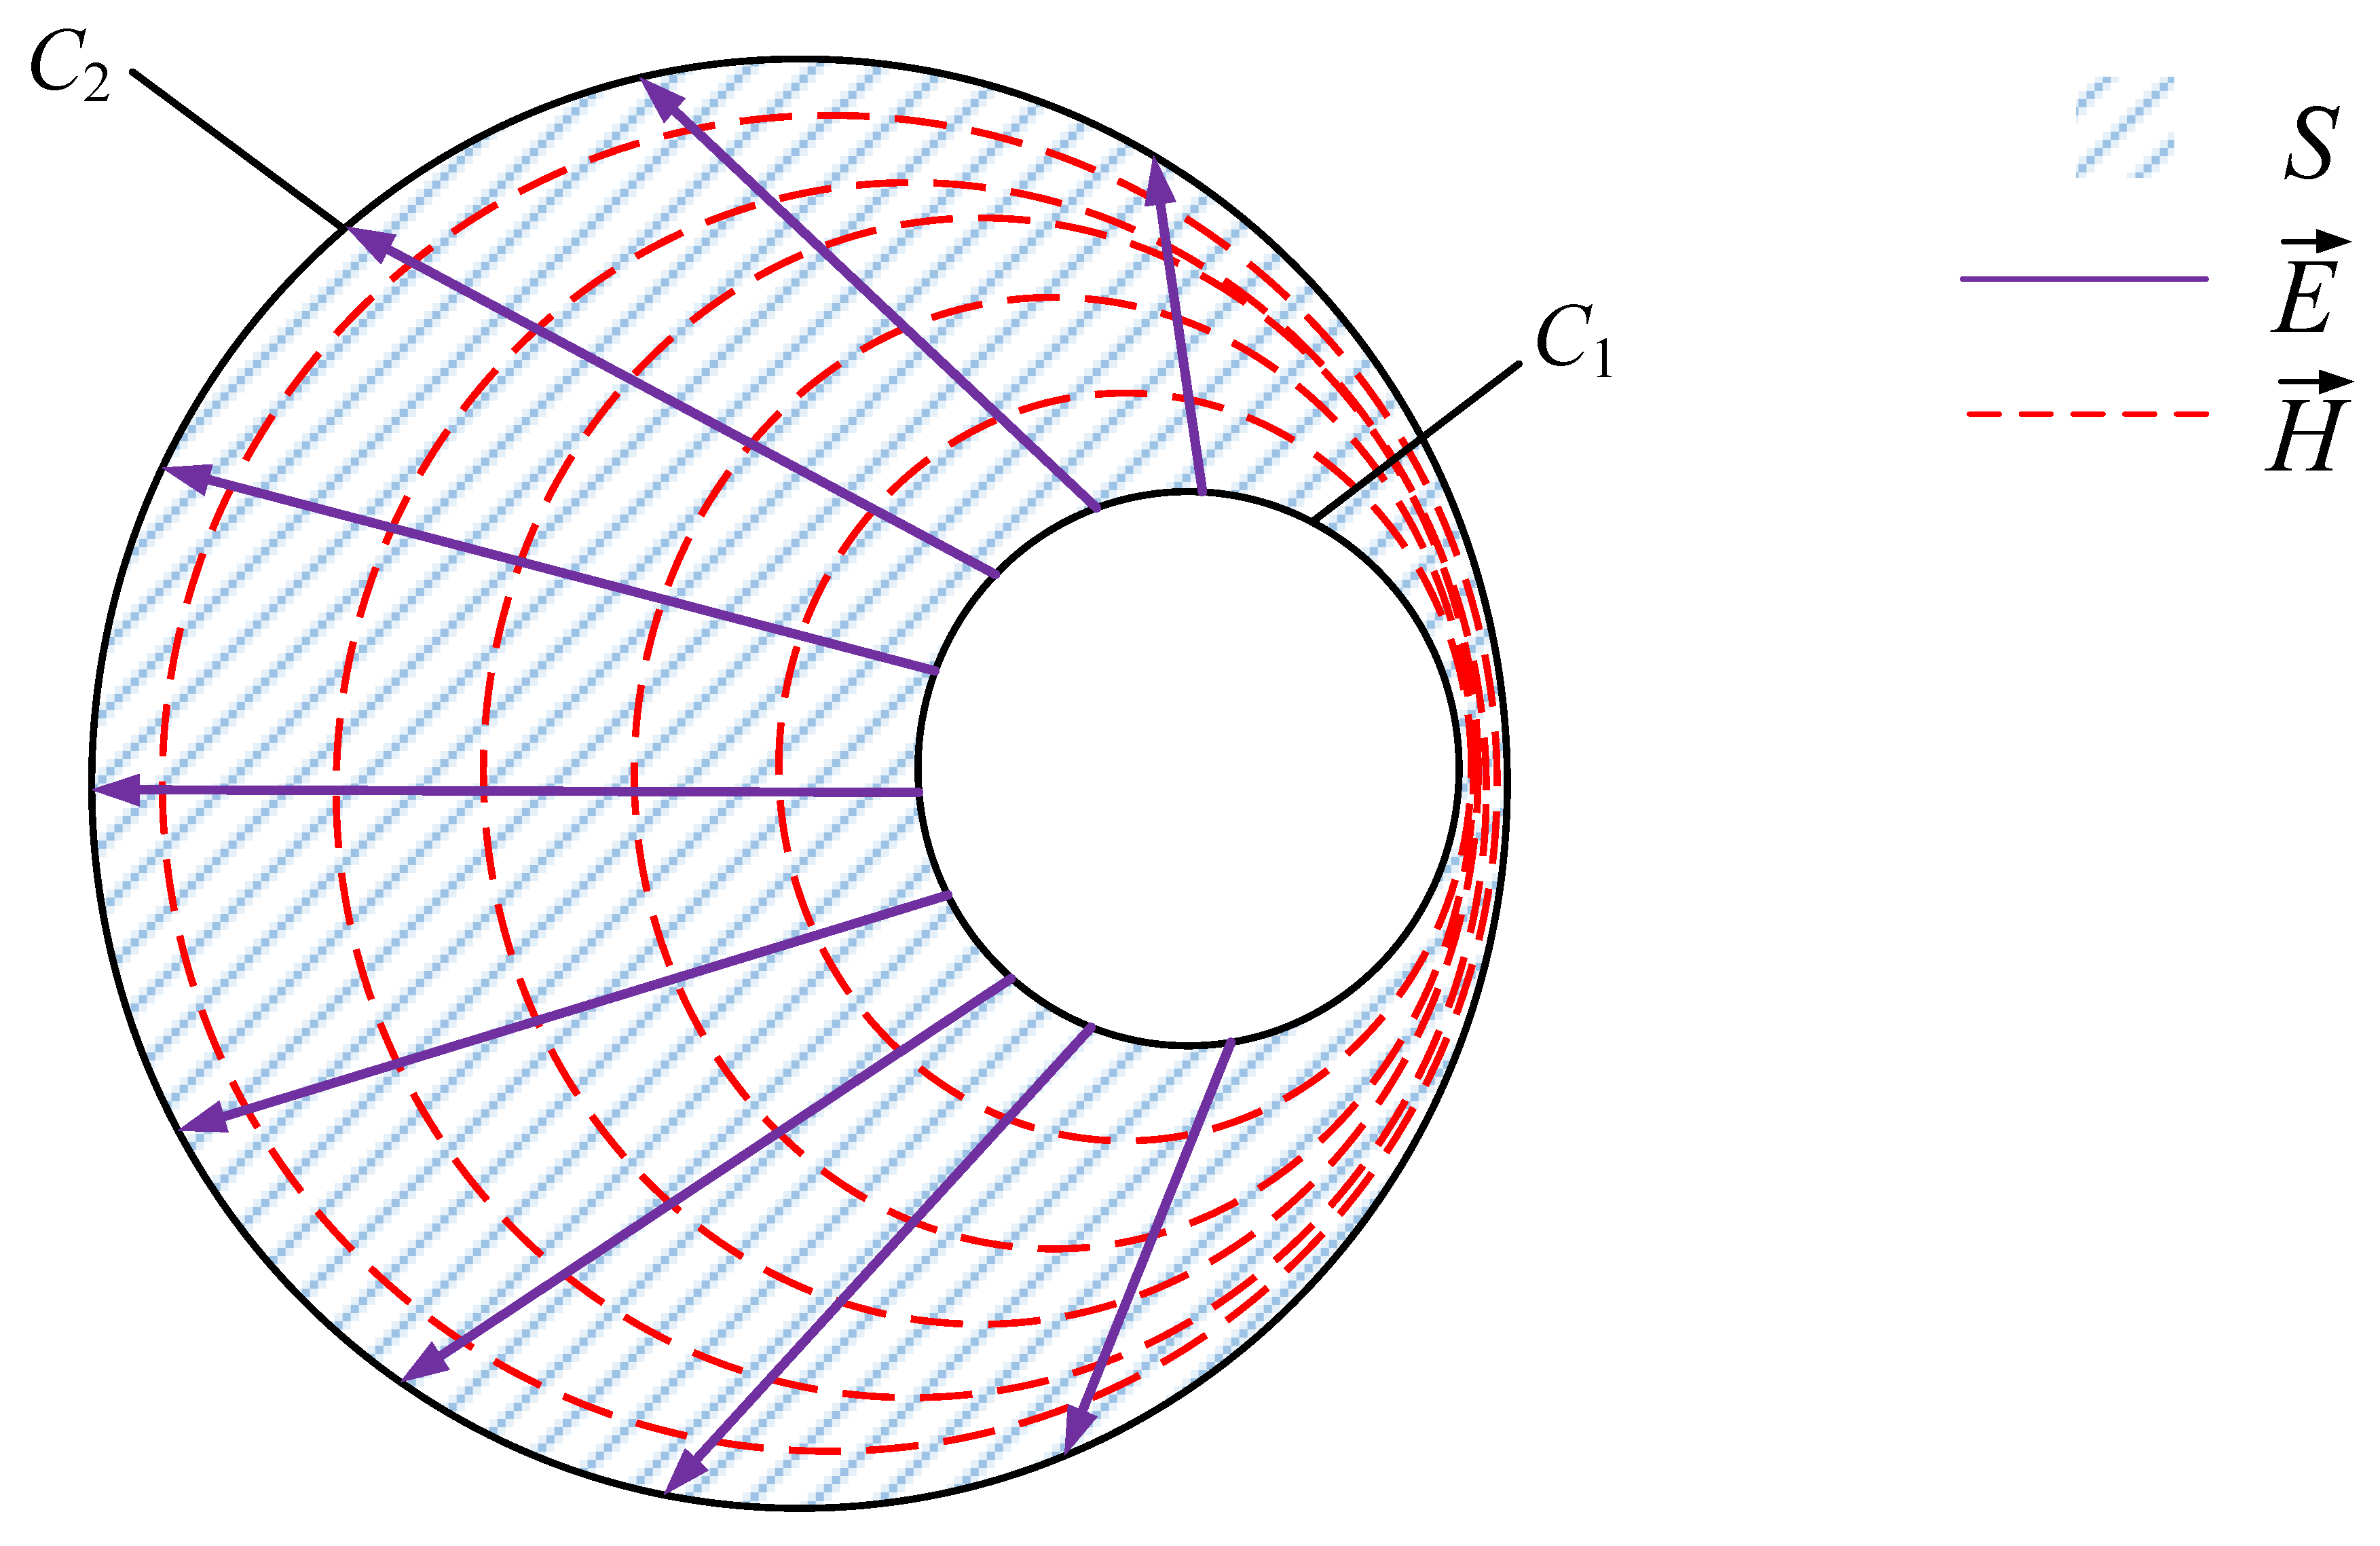
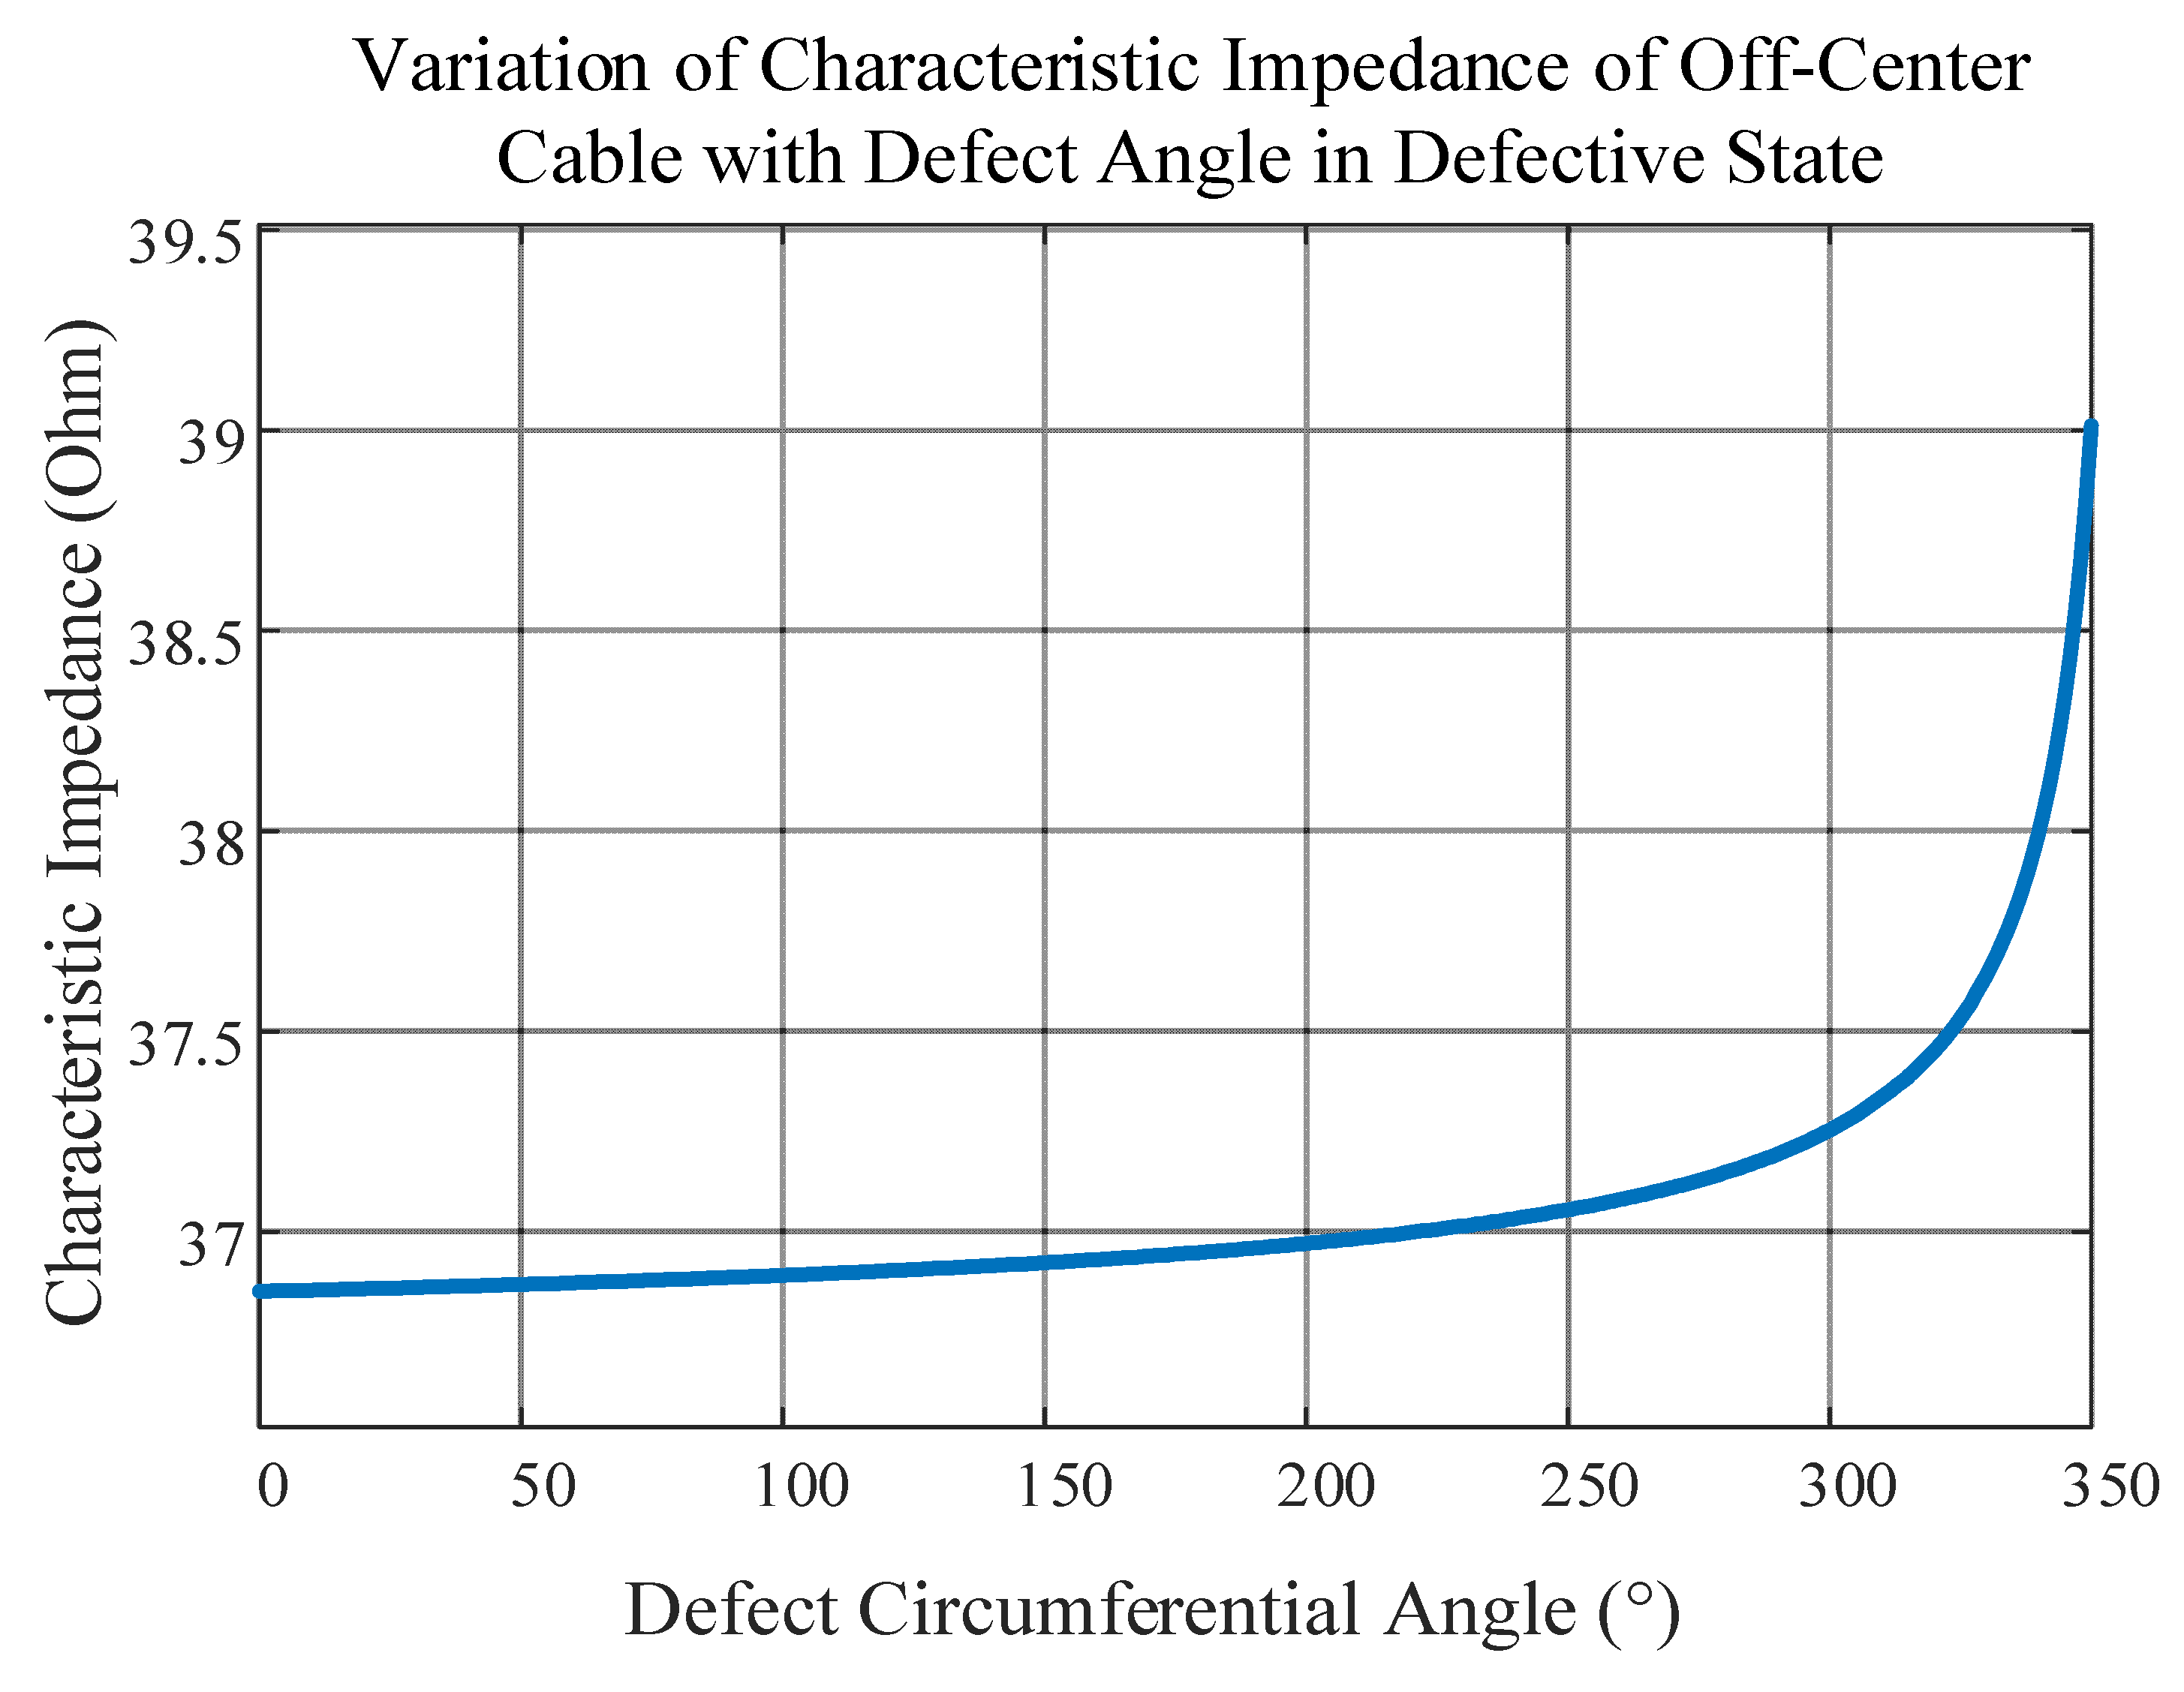
In order to measure the effect of different severities of cable outer shield breakage on the signal transmission characteristics, the variation curves of quasi-coaxial characteristic impedance values with the defect circumferential angle
θ at a frequency of 10 MHz are calculated, as shown in
Figure 10. With the established cable distributed parameter model for a specific defect circumferential angle, the breakage coefficient changes as
θ increases, resulting in a corresponding increase in the characteristic impedance at that location.
5.2. Characteristic Impedance Analysis of Shield Breakage of Nuclear I&C Cables Based on Finite Element Simulation
In order to explore the correctness of the simplified mathematical modeling of the characteristic impedance of I&C cables, to carry out more accurate physical modeling and obtain the error of the simplified mathematical model and the physical simulation model, in view of the defects of the shielding layer breakage, the four-core crosslinked polyolefin I&C cables are selected as the object of study, and a two-dimensional model of the biased-core I&C cables and the four-core I&C cables are constructed using finite-element simulation software. And then the finite-element method is used to carry out the electromagnetic field- temperature field coupling simulation using the finite element method.
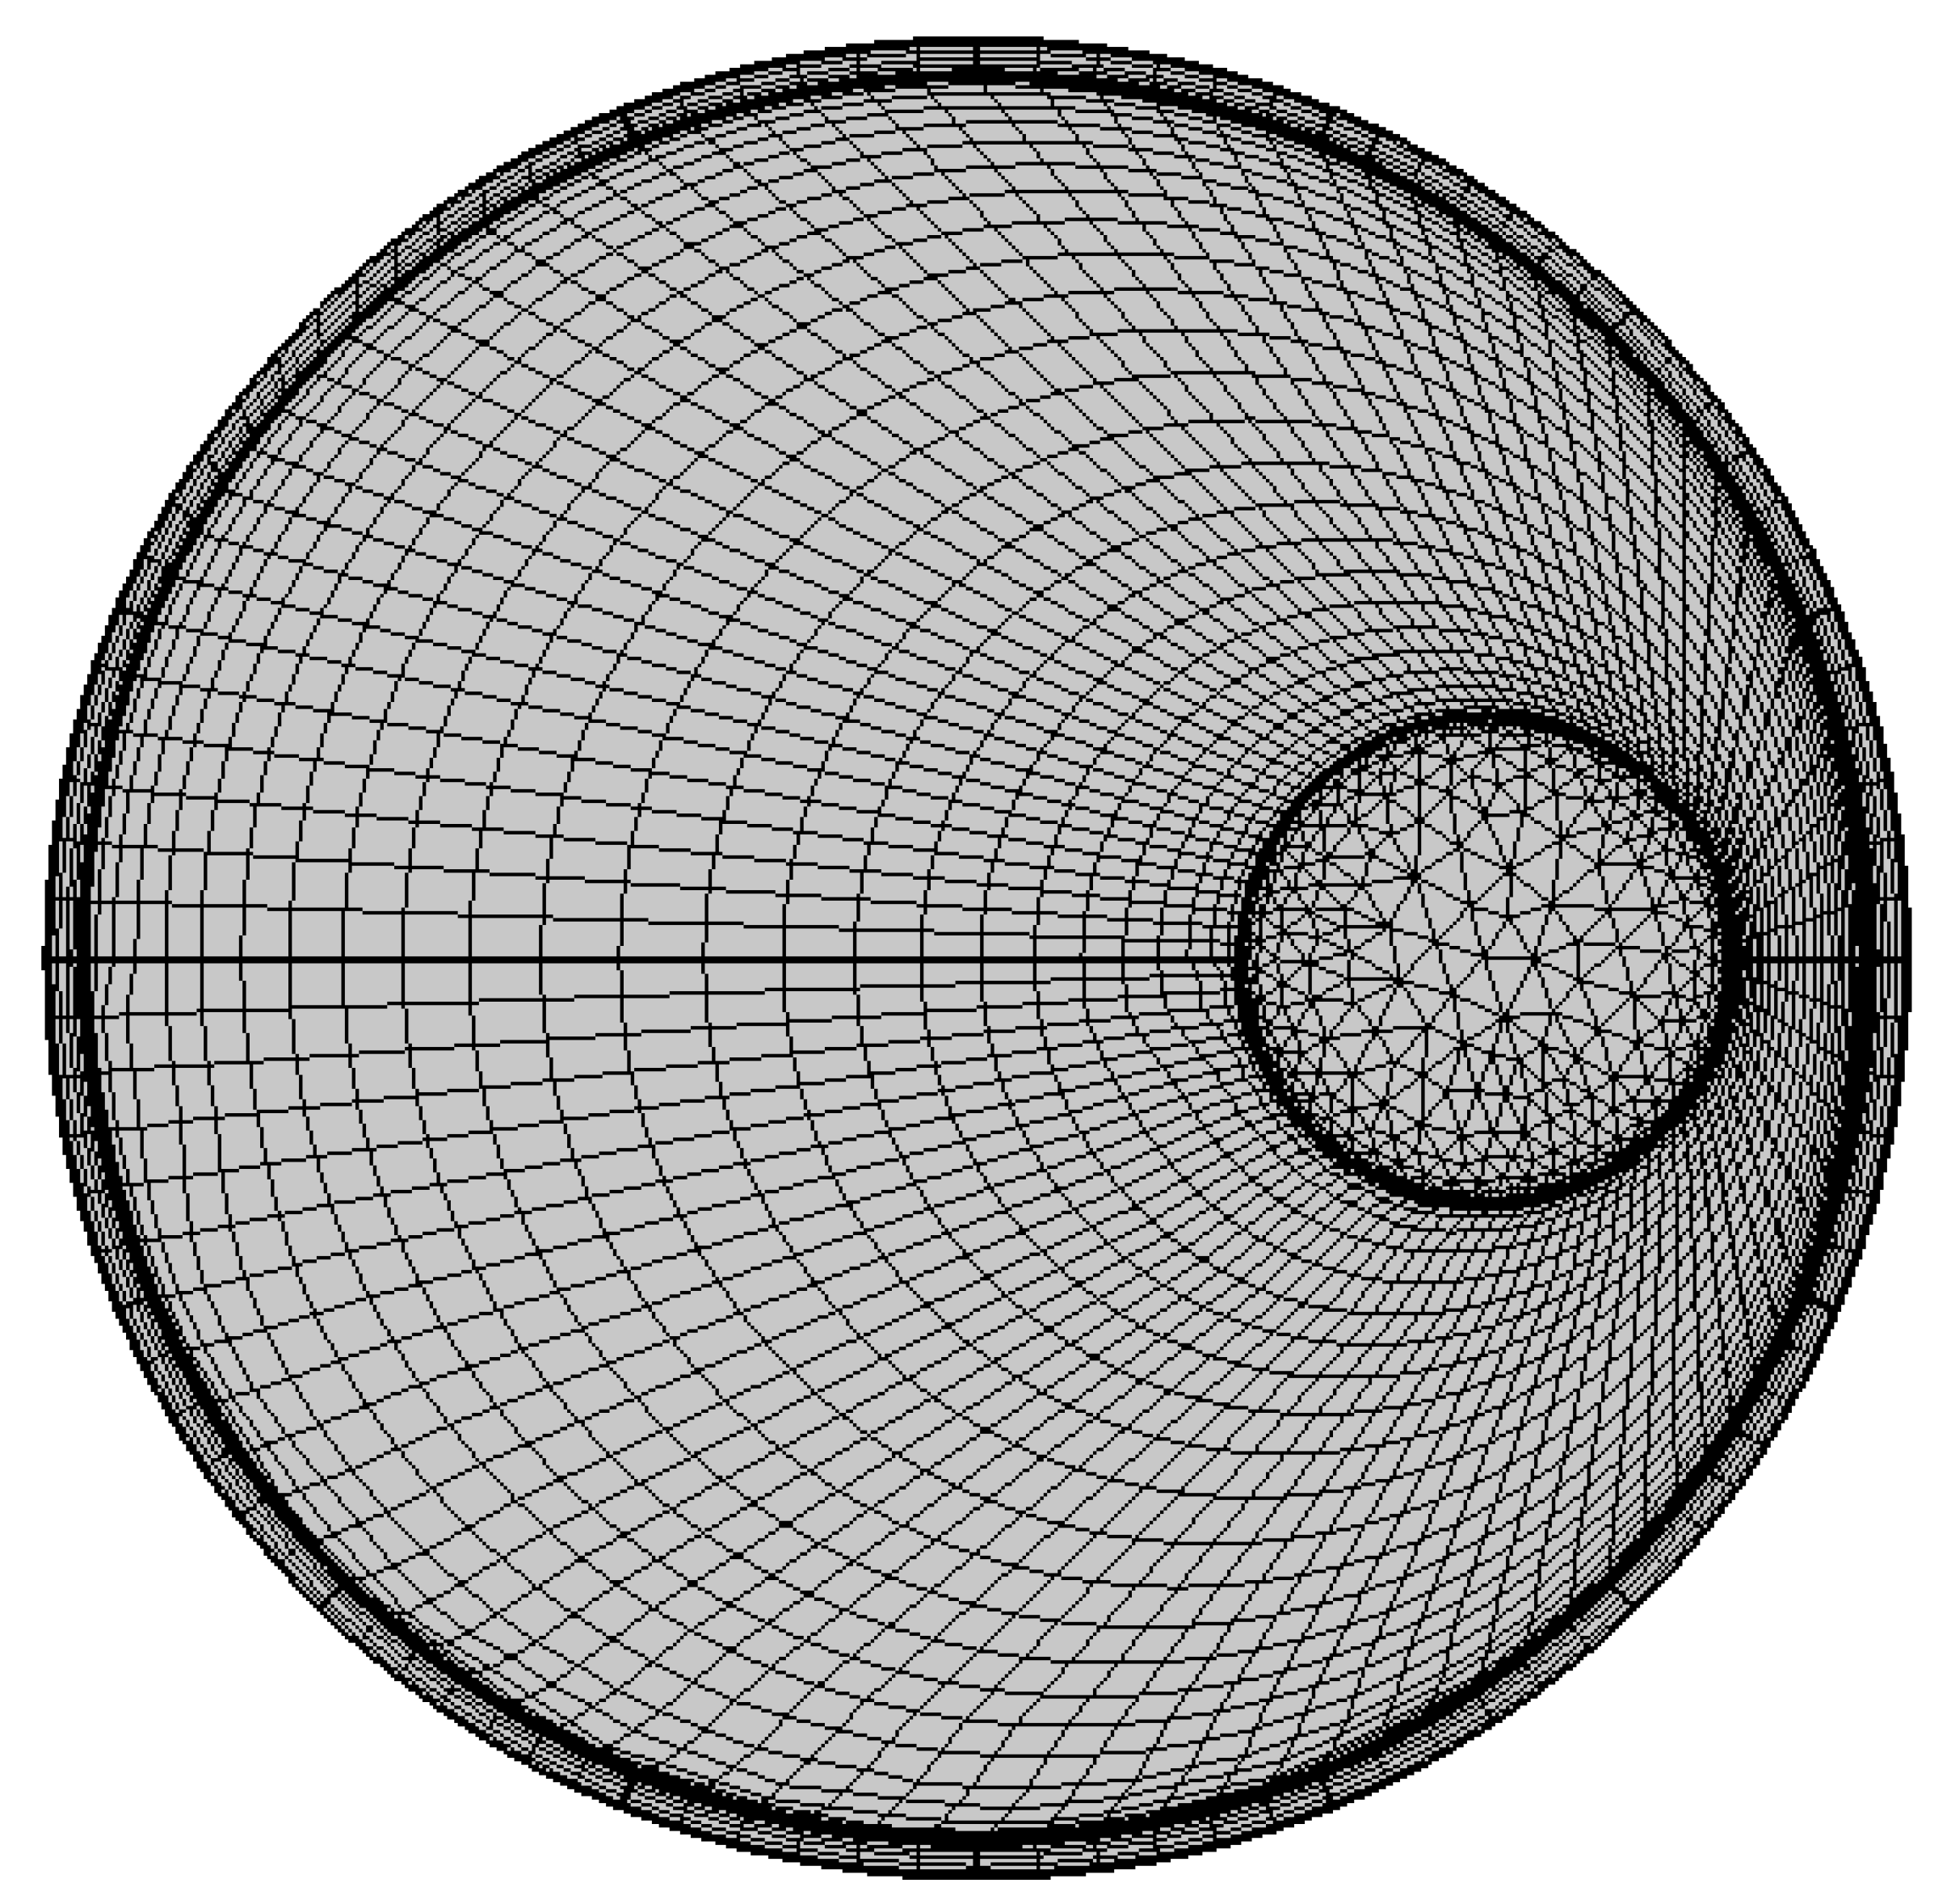
For the quasi-coaxial cable structure, a two-dimensional model can be built in the finite element simulation software, with it taking the core conductor into account, and that the outer shield is filled with cross-linked polyolefin insulating material between the layers, as shown in
Figure 11.
In this case, for the actual spare nuclear I&C cables, a piece of the cable section was cut out using a tool and its specific geometrical dimensions were measured, including the radius of each layer of the cable structure as well as the length of the cable. The various parameters used for the cable structure in the simulation modeling are shown in
Table 1. The dimensional parameters and some environmental variables configured for the simulation structure are shown in
Table 2.
After determining the dimensional structure, material properties and environmental parameters of the nuclear I&C cables, the magnetic field (mf) and electric field (ec) are introduced to set the electromagnetic properties of each structure of the cables, including the domain circling of Ampere’s Loop Laws and the Current Conservation Laws. Finish the boundary setting of the magnetic and electric insulation, the setting of the electromagnetic initial value for each domain, the setting of determining the energizing coils and the termination with the grounding. Finally, electromagnetic wave and frequency domain fields (emw) are added for the domain circling of the fluctuation equations and impedance boundary condition setting to establish the dynamic link between the variables in the frequency and electromagnetic fields.
Once the conditions for each field are set, the relevant physical field interfaces can be invoked to calculate each parameter in the distributed parameter model using the underlying universal equations, and finally, the characteristic impedance values are calculated. The parallel conductance and capacitance can be derived based on the current interface, and the conductor can be considered as a system with a uniform potential. In order to construct the physical field, a voltage U0 is applied to the inner conductor while the outer conductor is grounded. In this way, the potential distribution in the dielectric can be solved.
In order to perform finite element analysis efficiently, the created simulation model must be properly meshed. This process is aimed at decomposing the complex model into multiple simple units, thus facilitating the computational analysis. The quality of meshing has a direct impact on the accuracy and efficiency of the computational results. Too high a meshing density may significantly increase the computational effort and thus prolong the processing time; conversely, too sparse a mesh may weaken the accuracy and convergence of the computation. Therefore, according to the core placement characteristics of the quasi-coaxial cable, the mesh is partitioned using free triangles for the inner conductors of the core, and the mesh is mapped using guidelines for the other regions, as shown in
Figure 11.
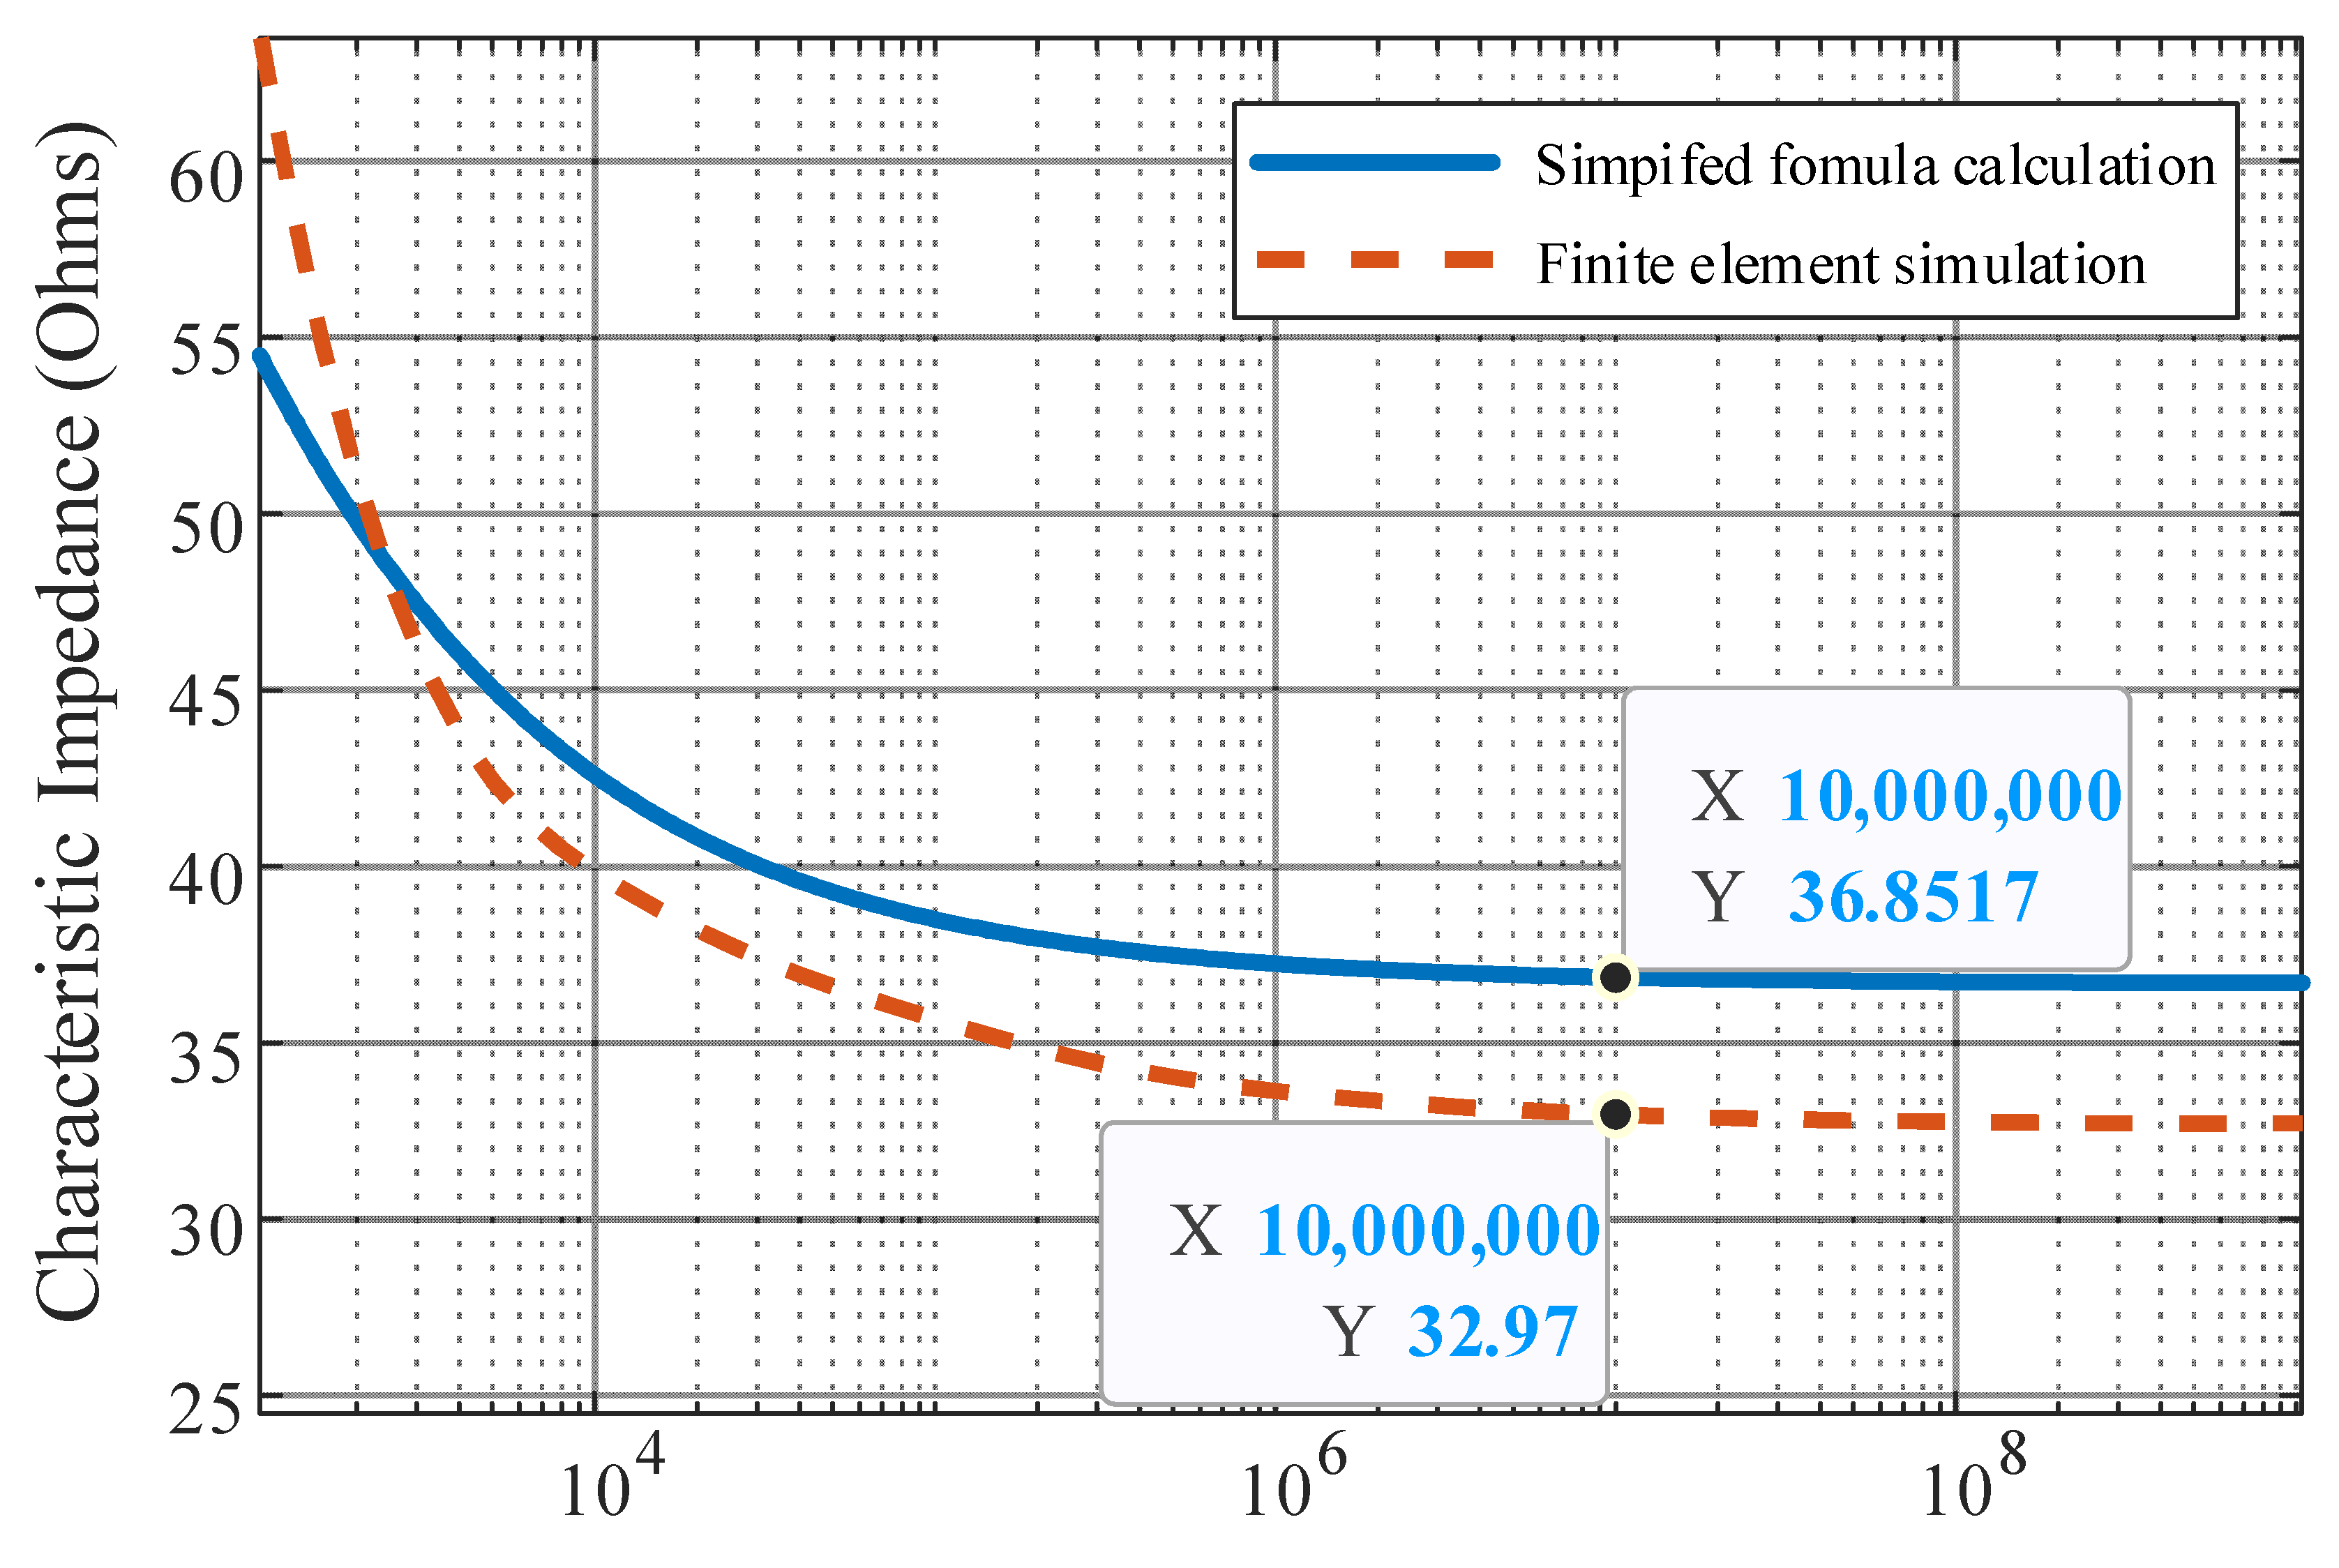
Through the finite element calculation, the variation curve of the characteristic impedance value with the frequency of nuclear I&C cables under the partial core structure can be obtained, as shown in
Figure 12, and the theoretically calculated curves are added together in the figure for comparison.
It can be found that the trend in the characteristic impedance calculated by finite element simulation is consistent with the theoretical curve, which can reach stability in the high-frequency band. The theoretical value is 3.88 Ω different from the simulated value at 10 MHz of frequency, so it can be assumed that the simplified formula derived is basically correct.
In a multi-core nuclear I&C cable with a common shield, after energizing in one core, the conductors of other cores will cause certain crosstalk [
23,
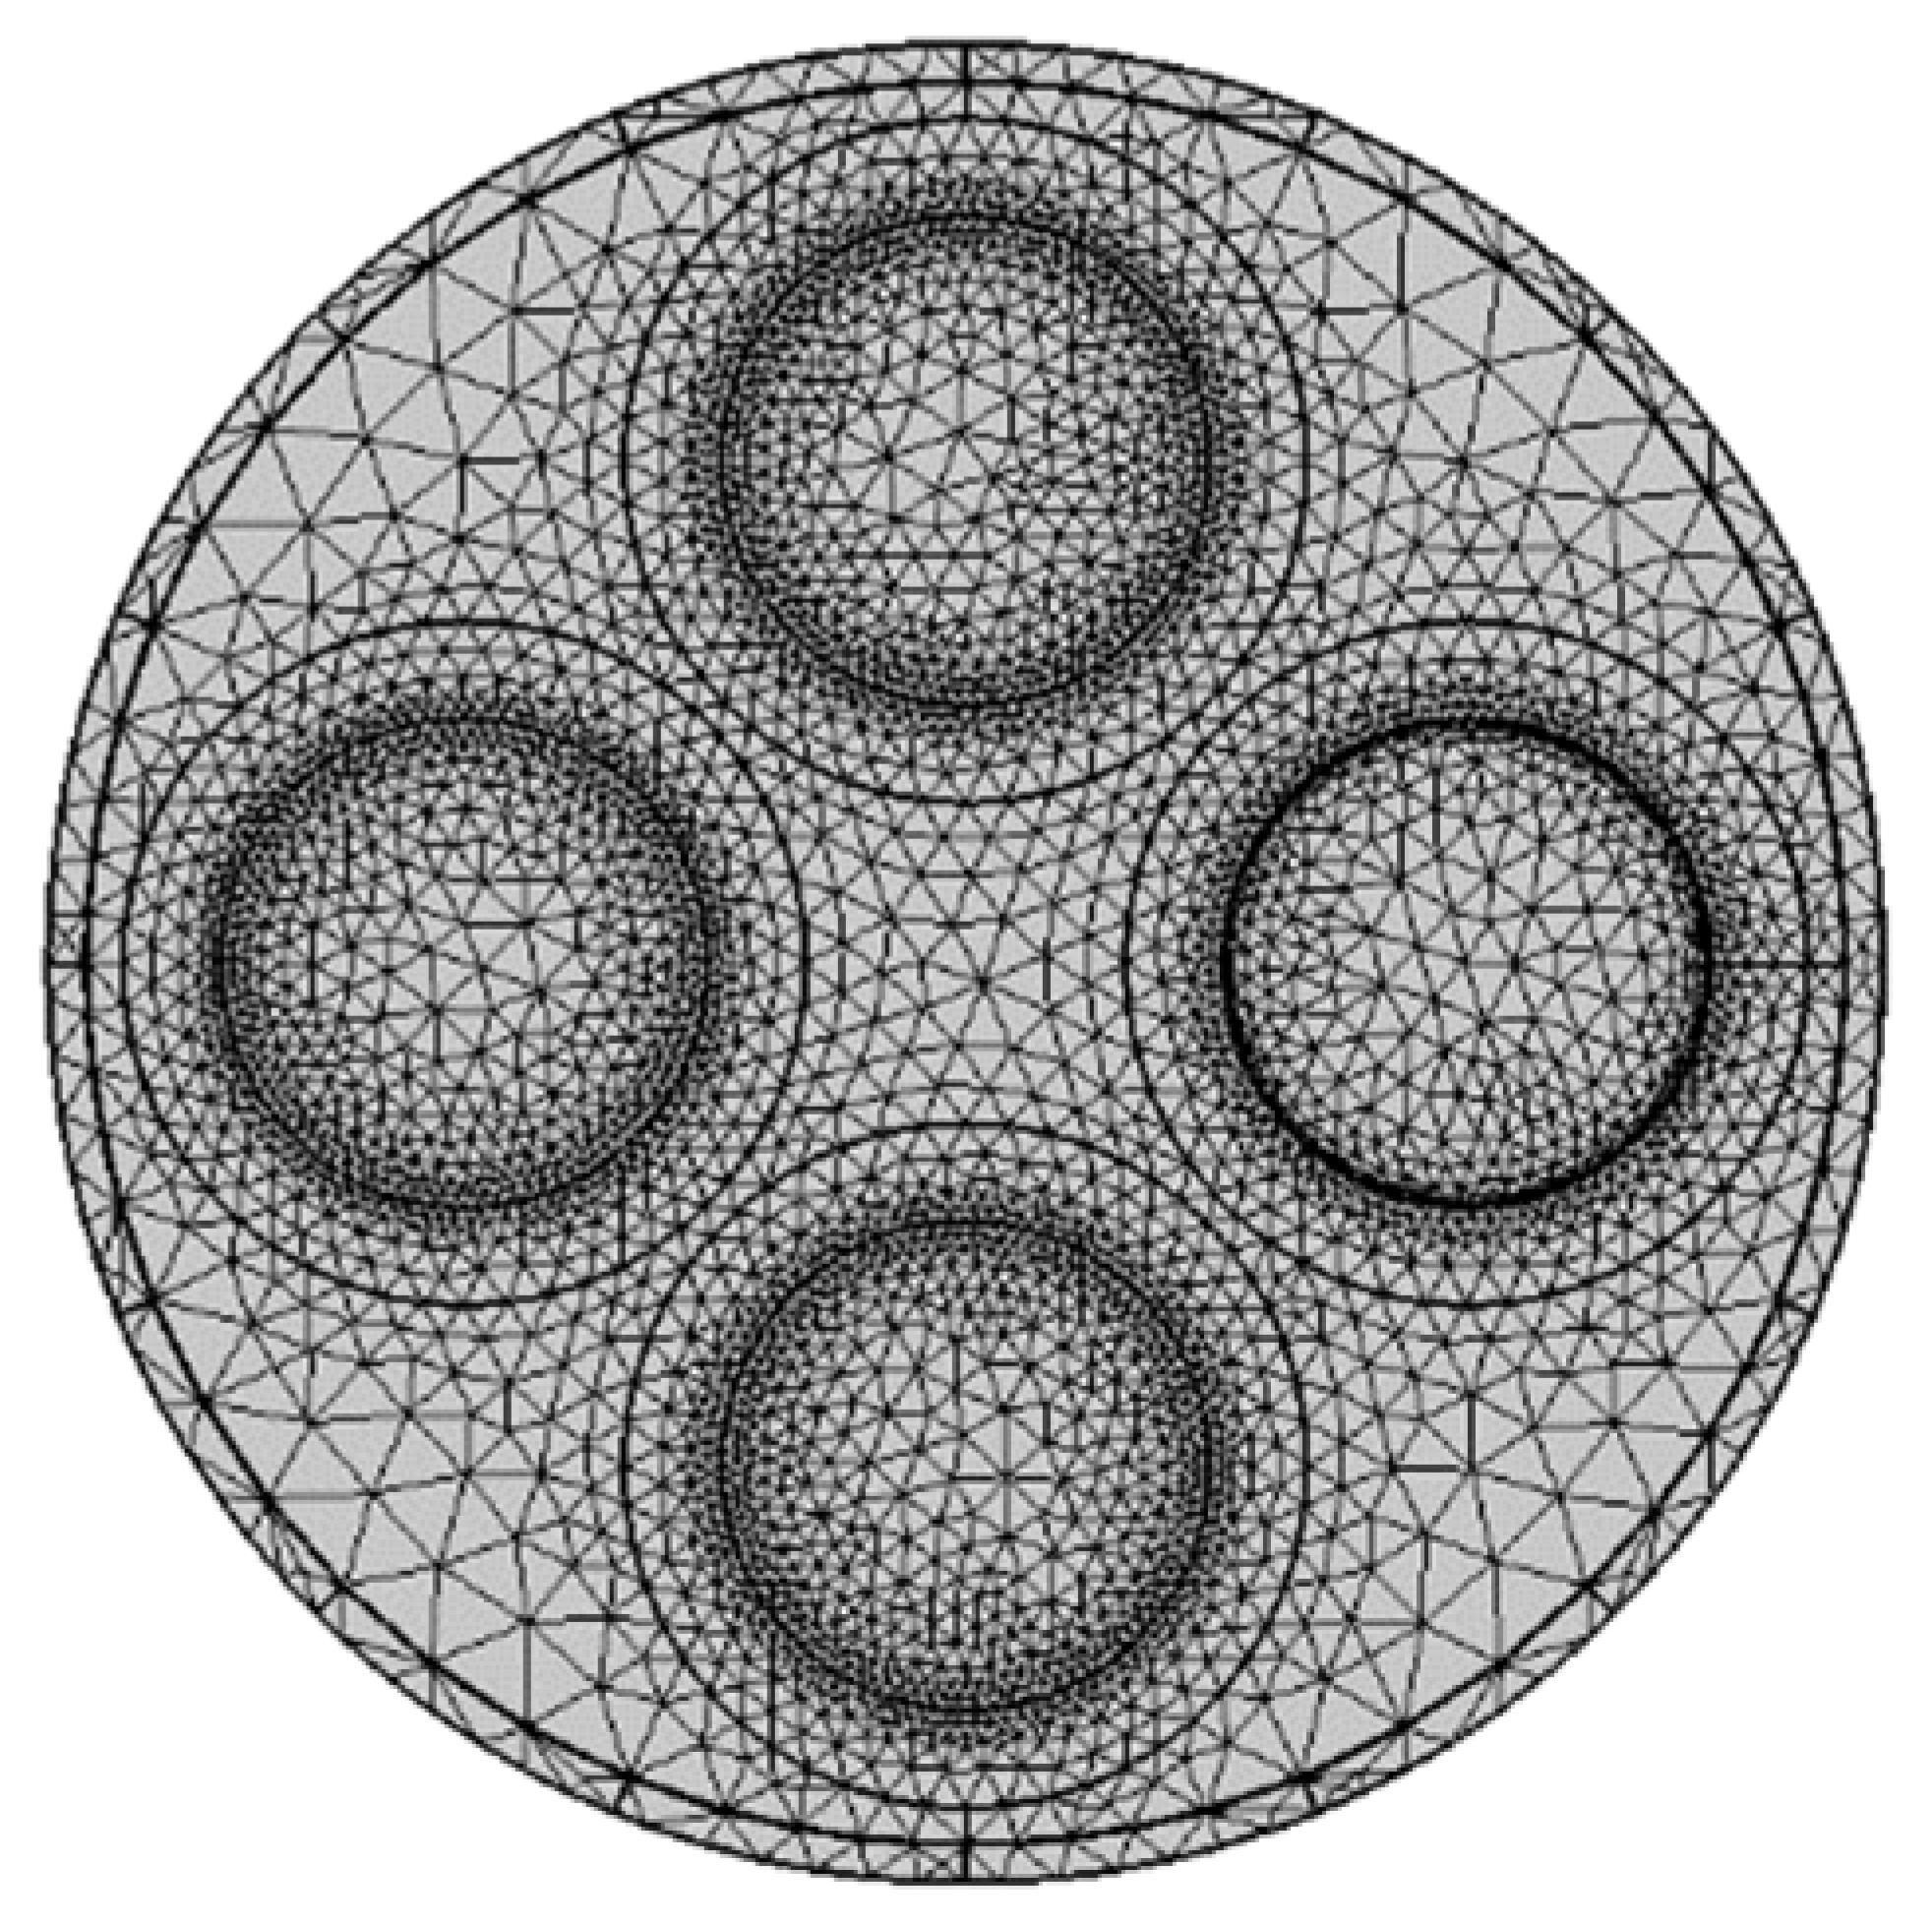
24], and the specific electromagnetic field distribution will be different. In order to more accurately simulate the characteristic impedance of the actual nuclear I&C cables, a two-dimensional model of the cross-section of a four-core cable is constructed in the following manner, as shown in
Figure 13. The filler material properties and related dimensions are shown in
Table 3 and
Table 4.
Due to the detection environment of the time-frequency domain detection method, it is necessary to energize only one of the cores of the four-core cable in the electric field node, so that it forms an electrical circuit with the shield. For the cable model with a multi-core structure, in order to facilitate the handling of the filler layer, the simulation uses free triangles to split the mesh for all domains, as shown in
Figure 13.
The characteristic impedance of one of the cores of the four-core cable under normal conditions is obtained by using finite element calculations using the interfaces and formulas discussed above, and its curve with its frequency is shown in
Figure 14. Among them, the values of the characteristic impedance at each frequency for three different calculation scenarios are shown in
Table 5.
It can be found that the stable characteristic impedance in the high-frequency band is 1.68 Ω lower than that of the single-core quasi-coaxial structure after taking into account the specific multi-core structure, which is caused by several factors. Firstly, in multi-core cables, high-frequency signals circulate between the through-core and the reverse loop of the outer shield. The non-through-core generates weak currents due to electromagnetic induction, which increases the capacitive effect on each conductor due to the fact that the multiple conductors are relatively close to each other. Secondly, the presence of multiple conductors will reduce the magnetic chain coupling between the energized core and the outer shield, so it will slightly reduce the mutual inductance effect per unit length. However, the effect of inductance on the characteristic impedance is usually less pronounced than that of capacitance. If the distance between the energized core of the multi-core cable relative to the center and the eccentricity of the quasi-coaxial line are equal, the characteristic impedance of the multi-core cable is generally lower than that of the single-core cable.
In order to verify the correctness of the characteristic impedance of the four-core cables calculated by simulation, the short section (1 m) of the spare four-core nuclear I&C cables of the actual nuclear power plant is detected by using the network analyzer of Steady Tech WK6500B for the detection of the characteristic impedance. The maximum detection frequency of this model of the network analyzer is 5 MHz, and the characteristic impedance value of this segment is obtained as 32.384 Ω. By checking the characteristic impedance values calculated by each method in
Table 5, the values calculated by each method and the error rate relative to the detection value of the network analyzer can be obtained in this frequency band, as shown in
Table 6. Among them, the values calculated by the finite element simulation of the biased-core line and the four-core line are closer to the detection results, and the errors of both are smaller and of equal magnitude.
It can be seen that the finite element simulation model constructed in this paper more correctly reflects real nuclear I&C cables, and is more capable of correctly calculating the characteristic impedance value of the four-core cable under specific working conditions. Taking into account that the actual spare cable storage time is longer, the metal conductor part may cause part of the oxidation, and a little aging phenomenon may also appear in the insulation layer, it is considered that the actual intact four-core nuclear I&C cable’s real characteristic impedance value should be smaller than the value detected by the network analyzer. It is considered that the four-core finite element simulation of the calculated value should be the closest to the real situation. Therefore, in the following shielding layer breakage, thermal stress is cited in the model and defect detection simulation experiments. For the cable characteristic impedance setting, we use the results calculated by the four-core finite element simulation model.
In order to investigate the effect of the breakage of the outer insulation shield of nuclear I&C cables on their characteristic impedance, the material properties of some outer conductors in the four-core cable model are changed to simulate the breakage of different severities and are associated with the defect circumferential angle
θ. The defect simulation rule is shown in
Figure 6, so that the outer insulation shield is in an axisymmetric structure with a unique axis of symmetry. Taking the defect simulation rule in
Figure 6 into account, the wire core, the jacket, and the circumferential angle of the broken defects are in the same axisymmetric structure, and there exists a unique axis of symmetry. In order to ensure the uniformity of the frequency, the simulation of different defect severities is set to be carried out in the environment with a frequency of 10 MHz. The effects of different defect circumferential angles on the characteristic impedance of four-core nuclear I&C cables can be obtained, as shown in
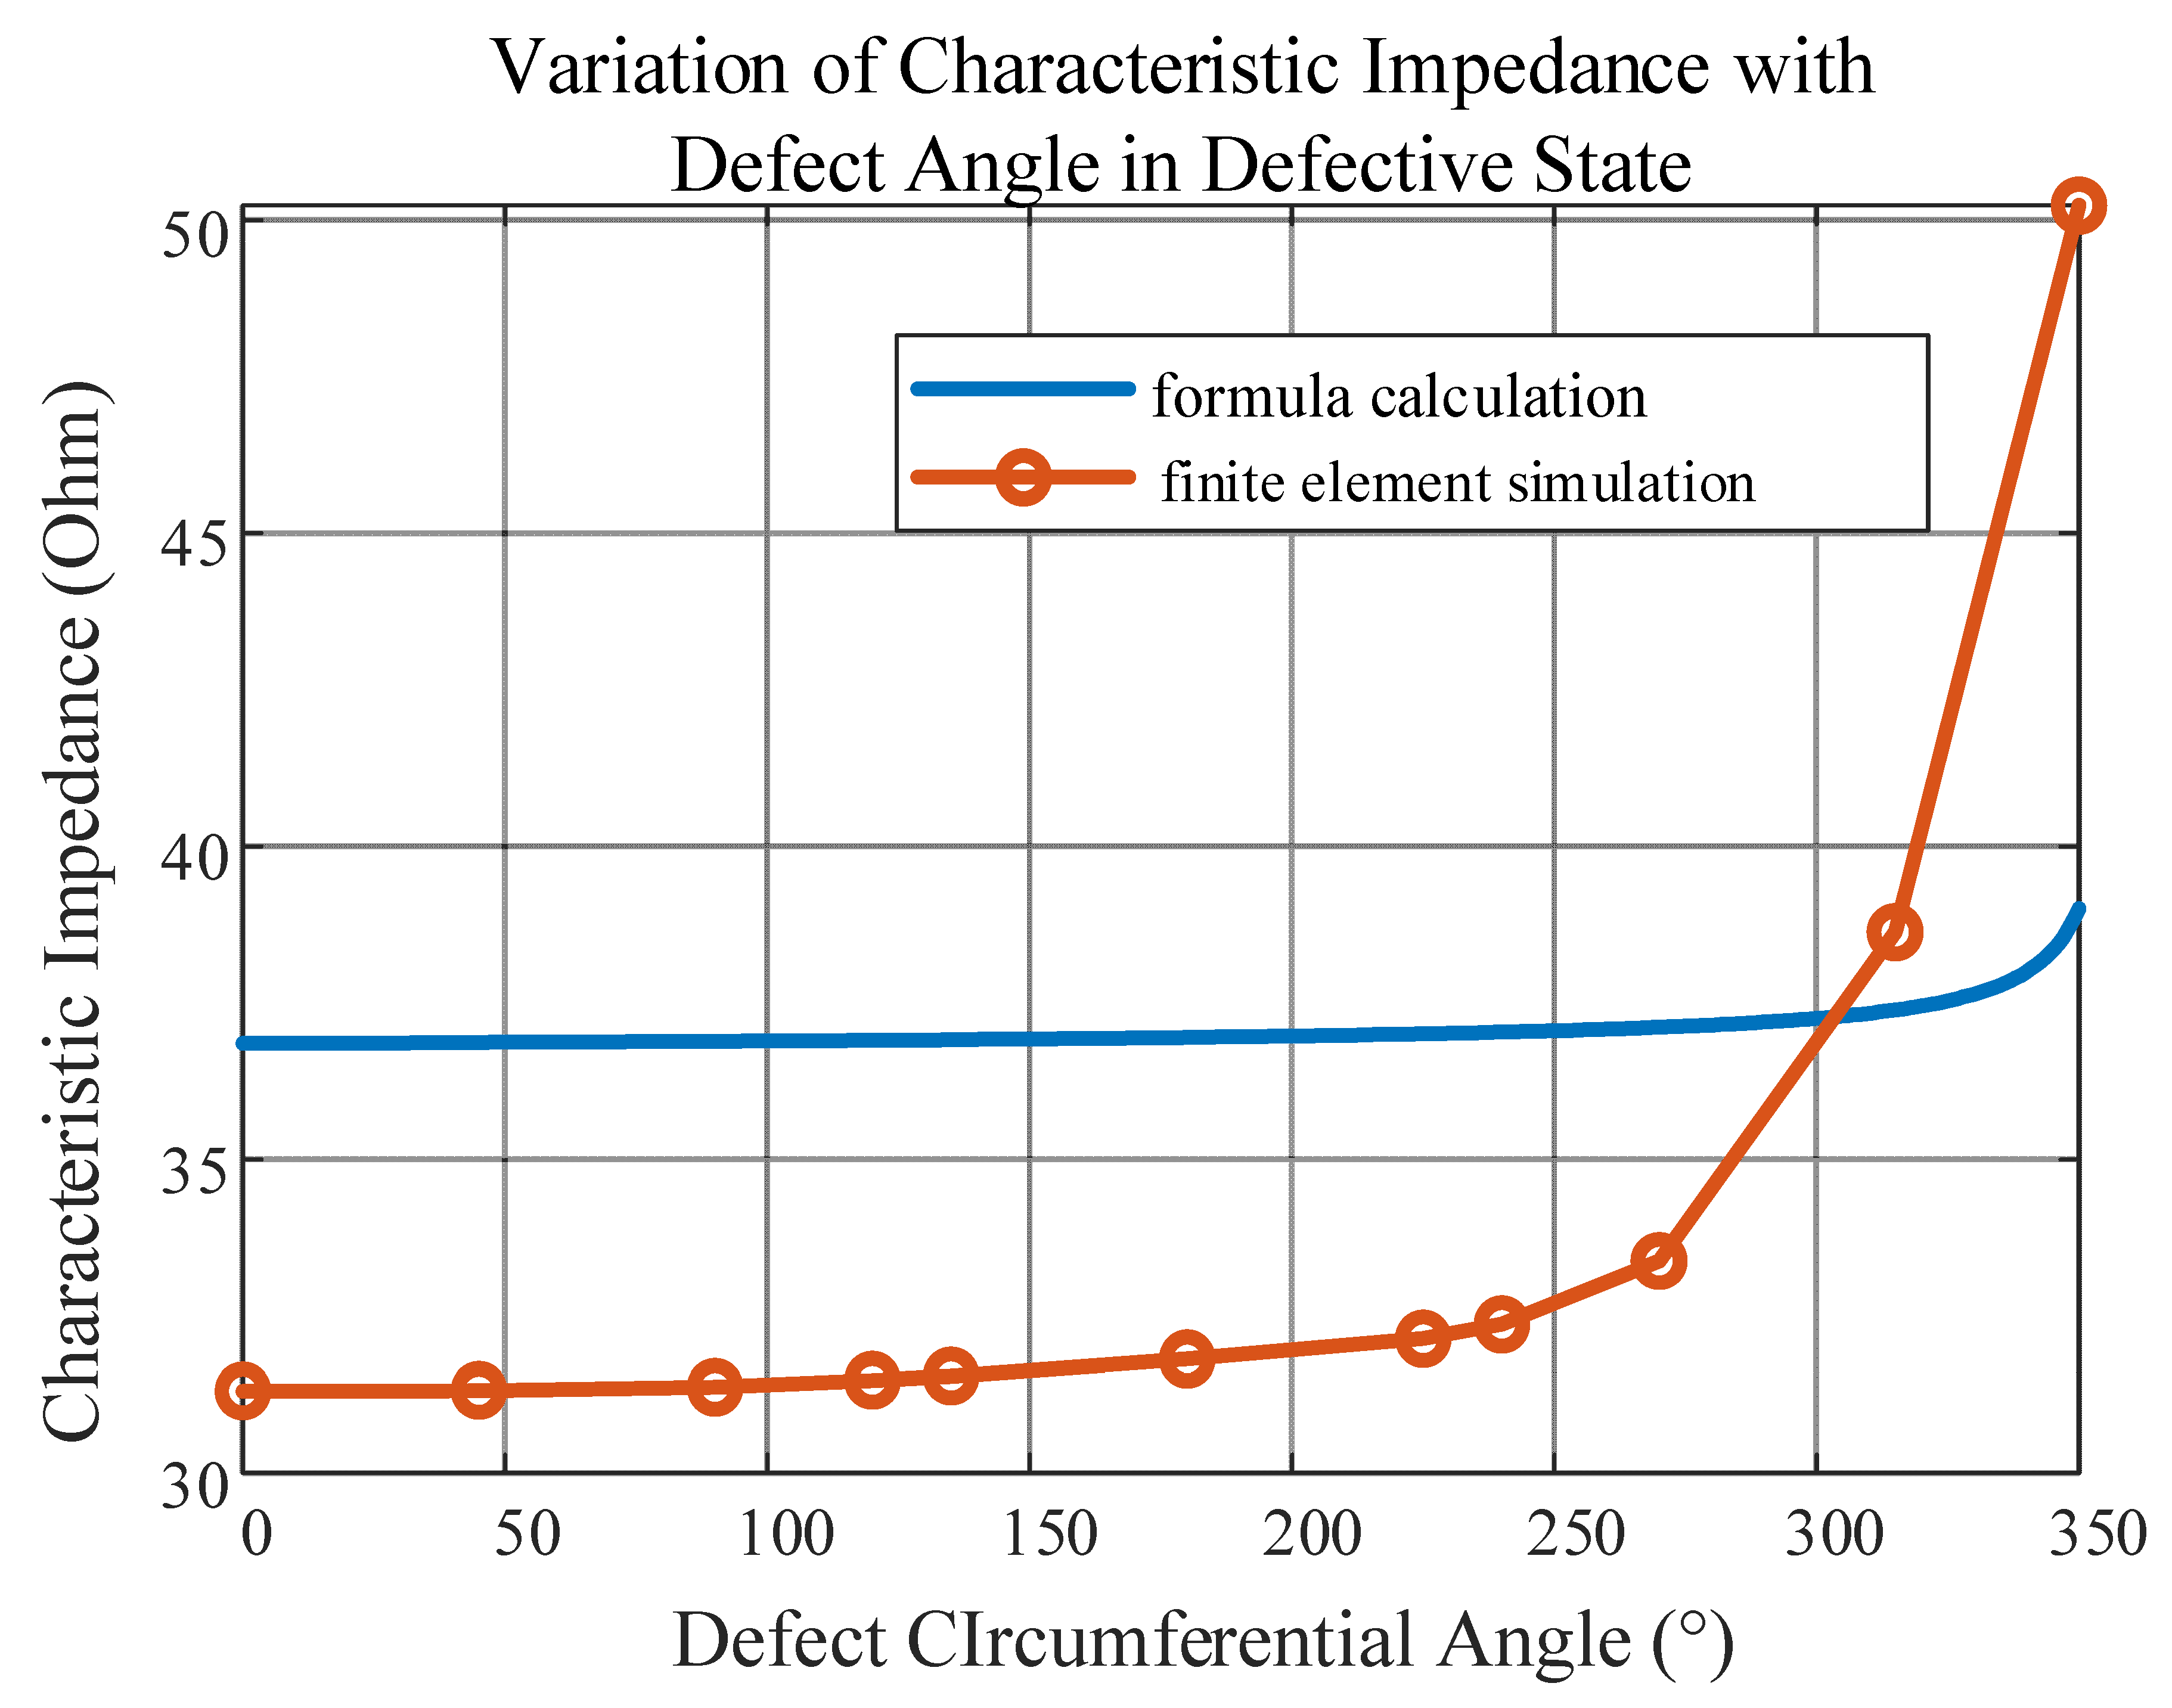
Figure 15. The data of the characteristic impedance values calculated by the simplified formula under damage and calculated by the finite element simulation are demonstrated in
Table 7.
From
Figure 15, it can be found that the simulated characteristic impedance value also increases with the increase in the defect circumferential angle
θ. When the defect circumferential angle is less than 270°, the difference between the calculated models is small, the difference can be controlled within 4 Ω, and the trend in change is the same.


