Article

Radiological Assessment of Coal Fly Ash from Polish Power and Cogeneration Plants: Implications for Energy Waste Management

by
Krzysztof Isajenko
1,
Barbara Piotrowska
1,
Mirosław Szyłak-Szydłowski
2,
Magdalena Reizer
2,*,
Katarzyna Maciejewska
2 and
Małgorzata Kwestarz
2
1
Central Laboratory for Radiological Protection, 7 Konwaliowa Street, 03-194 Warsaw, Poland
2
Faculty of Environmental Engineering, Warsaw University of Technology, Nowowiejska 20 Street, 00-653 Warsaw, Poland
*
Author to whom correspondence should be addressed.
Energies 2025, 18(12), 3010; https://doi.org/10.3390/en18123010
Submission received: 11 April 2025 / Revised: 26 May 2025 / Accepted: 4 June 2025 / Published: 6 June 2025

Abstract

:
The combustion of hard coal and lignite in power and combined heat and power plants generates significant amounts of coal fly ash (CFA), a waste material with variable properties. CFA naturally contains radionuclides, specifically naturally occurring radioactive materials (NORMs), which pose potential radiological risks to the environment and human health during their storage and utilization, including their incorporation into building materials. Although global research on the radionuclide content in CFA is available, there is a clear gap in detailed and current data specific to Central and Eastern Europe and notably, a lack of a systematic analysis investigating the influence of installed power plant capacity on the concentration profile of these radionuclides in the generated ash. This study aimed to fill this gap and provide crucial data for the Polish energy and environmental context. The objective was to evaluate the concentrations of selected radionuclides (232Th, 226Ra, and 40K) in coal fly ash samples collected between 2020 and 2023 from 19 Polish power and combined heat and power plants with varying capacities (categorized into four groups: S1–S4) and to assess the associated radiological risk. Radionuclide concentrations were determined using gamma spectrometry, and differences between groups were analyzed using non-parametric statistical methods, including PERMANOVA. The results demonstrated that plant capacity has a statistically significant influence on the concentration profiles of thorium and potassium but not radium. Calculated radiological hazard assessment factors (Raeq, Hex, Hin, IAED) revealed that although most samples fall near regulatory limits (e.g., 370 Bq kg−1 for Raeq), some exceed these limits, particularly in groups S1 (plants with a capacity less than 300 MW) and S4 (plants with a capacity higher than 300 MW). It was also found that the frequency of exceeding the annual effective dose limits (IAEDs) showed an increasing trend with the increasing installed capacity of the facility. These findings underscore the importance of plant capacity as a key factor to consider in the radiological risk assessment associated with coal fly ash. This study’s outcomes are crucial for informing environmental risk management strategies, guiding safe waste processing practices, and shaping environmental policies within the energy sector in Central and Eastern European countries, including Poland.

1. Introduction

Coal fly ash (CFA) is primarily generated during the combustion of hard coal and lignite in thermal power plants [1,2]. It is a heterogeneous material with properties that vary significantly based on the quality of the fuel and the combustion conditions [3,4,5]. It is estimated that global CFA production is approximately 600–800 million tons per year [6]. The most common disposal method of CFA at present is still landfill deposition. However, this practice not only leads to the inefficient use of resources but also contributes to escalating environmental pollution over time [7,8,9,10]. This increases the potential for environmental contamination and poses health risks to people living in the surrounding areas [11]. Fly ash waste, a by-product of fossil fuel combustion in thermal power plants and various industries, is generated on a global scale. This growing environmental concern poses significant challenges worldwide, including negative effects on human health [12]. Fly ash has found applications in various industries, including the production of cement, asbestos, bricks, and concrete, constructing embankments and roads, reclaiming mines, extracting valuable metals, and manufacturing ceramics, glass-ceramics, zeolites, adsorbents, and geopolymers, as well as, more recently, in agriculture [3,13,14,15,16,17]. Approximately 5% of the total ash produced by coal-fired power plants is utilized in the construction of residential buildings [18]. Beyond traditional uses, the recovery of valuable and critical metals from coal fly ash is gaining increasing importance and is an active research area. In recent years, fly ash has gained increasing attention not only as a waste material requiring careful management but also as a potential secondary resource. In particular, the recovery of critical raw materials such as rare earth elements (REEs), gallium, germanium, and other valuable trace metals from fly ash has emerged as a promising research direction. This approach supports the concept of the circular economy and offers a sustainable solution for reducing the dependence on primary sources of strategic materials.
Coal-fired power plants have long been overlooked as a potential source of radiation. However, similar to other forms of TENORMs (technologically enhanced naturally occurring radioactive materials), airborne emissions from coal-fired power plants raise radiological concerns [19]. CFA contains radioactive isotopes as impurities, making it a significant source of radioactivity. It includes naturally occurring primordial radionuclides such as uranium (238U, 235U), thorium (232Th), radium (226Ra), potassium (40K), and polonium (210P) [20]. Coal typically contains approximately 12–24 Bq kg−1 of 238U and 12–17 Bq kg−1 of 232Th. However, certain types of coal can have significantly higher concentrations of natural radionuclides [21,22]. The concentrations of radionuclides naturally occurring in CFA are generally 3 to 10 times higher than those found in coal [22,23,24,25]. The combustion of fuels releases various radionuclides into the surrounding environment, leading to radiological contamination in areas near power plants [26,27,28,29,30,31,32,33]. High-temperature combustion processes cause a significant enrichment of volatile elements and their isotopes, such as 210Pb and 210Po, in CFA. These isotopes are released into the surrounding environment, either bound to particulate matter or in the volatile phase of flue gases [34,35,36].
The natural radioactivity levels in CFA are two to five times higher than those in raw coal, as the combustion process oxidizes most of the carbonaceous matter in coal, concentrating the radionuclides in the by-product, CFA [37]. Uranium and radium compounds are typically released with flue gas through volatilization, then oxidized into less volatile forms that condense and adhere to the fly ash. Studies show that the radioactive emissions from CFA produced in a thermal power plant are 100 times higher than those from a nuclear power plant with the same energy generation capacity [38]. Fly ash emitted from stacks can remain airborne for extended periods, polluting the surrounding atmosphere with 238U, 232Th, and 40K [39]. Radionuclides released into the environment are deposited both through wet and dry precipitation near the source of emission. Additionally, they can be carried over long distances, including to remote areas, via atmospheric transport [40]. Spherical particles of fly ash, formed as a result of high-temperature processes occurring in oil shale power plant furnaces, have been identified at locations as far as 70 km from the emission source [41,42].
Openly dumped fly ash presents a radiation hazard due to the potential leaching of radionuclides into groundwater, ultimately contaminating drinking water sources. Its disposal and use in construction activities can also expose nearby individuals to radiation doses. Hence, analyzing and quantifying the natural radioactivity levels in fly ash and bottom ash is essential to assess the related environmental and health risks [37]. Within a 20-kilometer radius of a coal-fired power plant, the levels of 238U, 232Th, and 40K in the topsoil increase annually by approximately 0.03% to 0.12%, resembling typical natural concentrations found in soil [43]. For example, in Japan, fly ash with radioactivity levels below 8000 Bq kg−1 can be recycled for applications such as cement [44,45], ceramics [46], stone [47], and zeolite production [48], similar to conventional, municipal solid waste incineration fly ash [49].
Prolonged exposure to 238U, 232Th, and 40K can increase the risk of developing bone and cavity cancers [50,51]. Additionally, the inhalation of ash particles may irritate or obstruct the fine airways in the lungs, leading to conditions such as asthma and chronic bronchitis. Radium, a decay product of 238U, when ingested or inhaled, mimics calcium in metabolic processes and deposits in the bones. This accumulation can cause teeth fractures, anemia, cataracts, and various cancers. Similarly, exposure to thorium can result in cancers of the lungs, pancreas, liver, bones, and kidneys, as well as leukemia [52,53,54,55,56,57,58].
While numerous studies assessing radionuclide content in coal fly ash worldwide are available, there is a clear lack of detailed and up-to-date publications describing this situation in Poland. Additionally, most existing studies focus on general radionuclide concentrations or the influence of the coal’s origin or combustion technology. In the available literature, not many articles systematically investigating the dependence of radionuclide concentration on the installed capacity of power and combined heat and power plants have been found. Our study aims to fill this gap by providing crucial data specific to the national energy and environmental context regarding how this technological parameter might influence the radionuclide concentration profile. The urgency of this study stems from the continuous production of large volumes of fly ash, the potential environmental and health hazards associated with their storage and utilization, and the need to develop safe and compliant methods for managing this waste.
The novel character of the research lies in the systematic analysis of the relationship between the concentration of selected radionuclides and the installed capacity of power and combined heat and power plants in Poland. This specific technological correlation analysis within the Polish context has not been widely documented. The use of advanced statistical methods, such as PERMANOVA, allowed for a rigorous assessment of differences in the overall radionuclide concentration profile among groups of varying capacity.
The scientific contribution of the work includes providing detailed, up-to-date data on the concentrations of natural radionuclides in fly ash from the Polish energy sector and most importantly, demonstrating the influence of the plant capacity on the radionuclide concentration profiles. These results constitute new knowledge regarding the factors affecting the radiological composition of fly ash.
The aim of this study was to compare the content of selected radionuclides in coal fly ash from 6 power plants and 13 combined heat and power plants in Poland, differing in capacity. The sub-goal was to calculate radiological hazard assessment factors—including radiological risks and dose rates. The objectives of this study are critically important, as they enable a comprehensive assessment of the radiological risk associated with fly ash, support the development of safe technologies for processing industrial waste, and contribute to raising environmental protection standards in the energy sector.

2. Materials and Methods

2.1. Classification of Power Plants

The power plants (PPs) and combined heat and power plants (CHPs) were divided according to capacity into four groups:
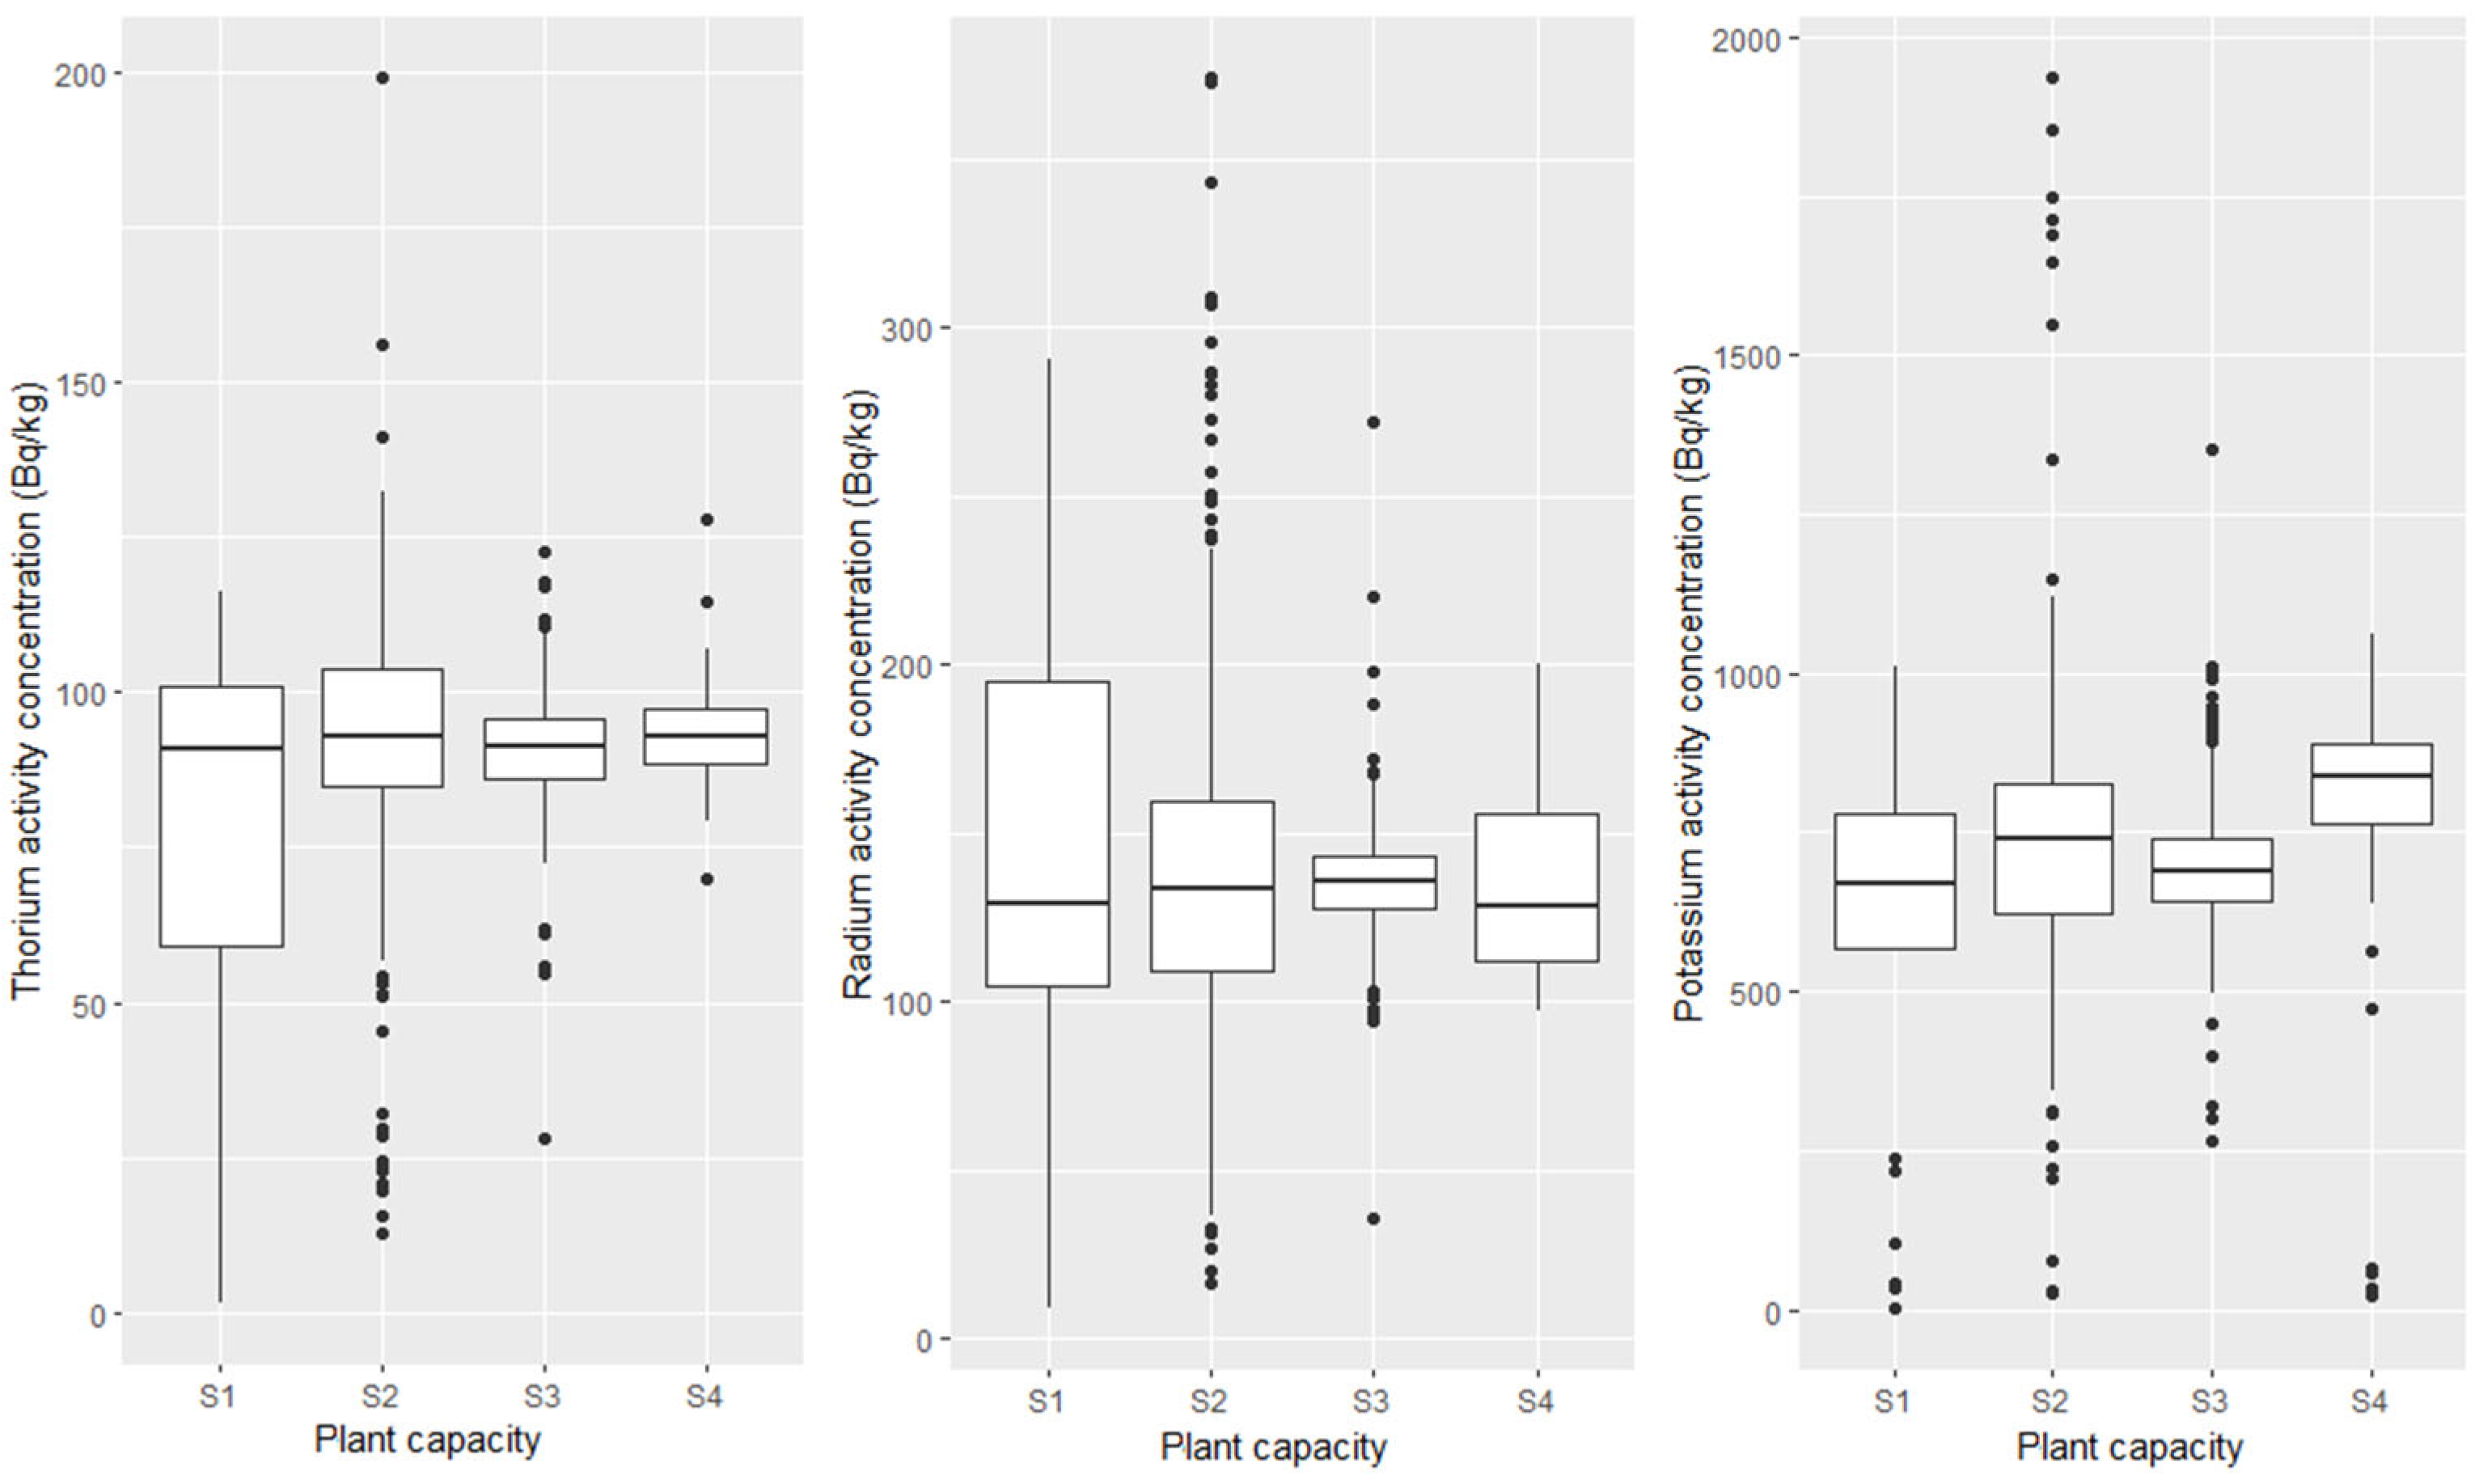
  • S1—less than 300 MW (3 CHPs, 33 samples);
  • S2—from 300 to 1000 MW (3 PPs and 4 CHPs, 252 samples);
  • S3—from 1000 to 3000 MW (2 PPs and 3 CHPs, 538 samples);
  • S4—more than 3000 MW (2 PPs, 83 samples).
Samples were collected between the years 2020 and 2023. In all the analyzed cases, the only fuel used was hard coal (bituminous coal), and the only dedusting technology employed at the studied power and CHP plants was an electrostatic precipitator.

2.2. Preparation of Samples for Gamma Spectrometry

For the gamma spectrometric analysis, coal fly ash (CFA) samples with particle sizes exceeding 2 mm were subjected to mechanical crushing and passed through certified 2 mm sieves to ensure uniformity. To determine the activity of 226Ra, measurements of its decay product 214Bi were used, requiring airtight sealing of the containers to prevent radon’s escape due to its volatility. The concentration of 232Th was assessed based on the activity of its daughter nuclide 208Tl. Each sample was analyzed nine times under consistent geometric conditions, and the final results represent the arithmetic mean of these replicates [59,60].

2.3. Gamma Spectrometry

Radioactivity measurements of the coal fly ash (CFA) samples were carried out using a MAZAR-type gamma spectrometer (POLON-IZOT Ltd., Warsaw, Poland), equipped with a 2 × 2″ NaI(Tl) scintillation detector. To reduce the influence of ambient background radiation, the detector was housed inside a shielding chamber constructed from lead bricks with a wall thickness of 50 mm. The MAZAR system enables a multi-range gamma analysis, allowing the identification and quantification of key naturally occurring radionuclides. Specifically, it is calibrated to measure the activities of 40K, 226Ra, and 232Th based on their characteristic gamma emissions. The gamma-ray detection system employed three distinct energy channels to identify and quantify radionuclides present in the samples. Calibration of the spectrometric system was achieved using volumetric reference materials containing 40K, 226Ra, and 232Th. Measurements of these standards, alongside a background matrix reference, enabled the computation of ten calibration coefficients using a matrix-based approach. The sample and standard containers were 1.5-L Marinelli beakers (POLON-IZOT Ltd., Warsaw, Poland). The spectrometer’s energy resolution ranged from 6% to 8%, depending on the energy range [61].

2.4. Radiological Hazard Assessment

2.4.1. Radiological Risks

This study utilized the radium equivalent activity (Raeq) and the external hazard index (Hex) to evaluate the potential radiological risks associated with using fly ash as a building material. These parameters can be determined following the methods outlined by Beretka and Mathew [62], as follows [22]:
Raeq = ARa + 1.43 × ATh + 0.077 × AK
Hex = ARa/370 + ATh/259 + AK/4810
where ARa, Ath, and AK are the activity concentrations of 226Ra, 232Th, and 40K in Bq kg−1, respectively.
Raeq is associated with both the external gamma radiation dose and the internal exposure caused by radon and its decay products. For building materials to be considered safe, the Raeq value should not exceed 370 Bq kg−1. Hex is derived from the Raeq formula, with its maximum permissible value (equal to unity) corresponding to the upper safety threshold of Raeq, which is 370 Bq kg−1 [22].
Radon and its short-lived decay products also present a risk to the respiratory system. The level of internal exposure to radon and its progeny is measured using the internal hazard index (Hin), which is determined by the following equation [62,63]:
Hin = ARa/185 + ATh/259 + AK/4810

2.4.2. Dose Rates, Activity Concentration Index, and Alpha Index

In this study, an effort was made to estimate the gamma radiation dose emitted from the CFA pond. Conversion factors were determined to translate the specific activities of 40K (AK), 226Ra (ARa), and 232Th (ATh) into absorbed gamma dose rates measured at a height of 1 m above the ground (in nGy h−1 per Bq kg−1). These conversion factors were calculated using the Monte Carlo method by Bhangare (2014), and the resulting equation is as follows [22]:
D (nGy h−1) = 0.0417 × AK + 0.462 × ARa + 0.604 × ATh
According to the guidelines [64,65,66,67], the absorbed dose rates (D) (nGy h−1) at the height of 1 m above the ground are assessed from the gamma radiation of 226Ra, 232Th, and 40K natural radionuclides supposed to be uniformly distributed in the ground. They are calculated as follows:
Din (nGy h−1) = 0.92 × ARa + 1.1 × ATh + 0.081 × AK
Dout (nGy h−1) = 0.4368 × ARa + 0.5993 × ATh + 0.0417 × AK
where Din and Dout are the indoor and outdoor air absorbed dose rates, respectively; ARa, ATh, Ak are activity concentrations of 226Ra, 232Th, and 40K radionuclides (Bq kg−1).
In order to estimate the annual effective dose rates, the conversion coefficient from the absorbed dose in the air to the effective dose (0.7 SvGy−1) and the outdoor occupancy factor (0.2) was used [22].
The effective dose rate was calculated using the formula
Eef (mSv year−1) = D (nGy h−1) × 8760 (h year−1) × 0.2 × 0.7 (Sv Gy−1) × 10−6
The outdoor and indoor annual effective dose Eout and Ein (mSv y−1) were calculated using the following equations [67,68]:
Ein (mSv y−1) = Din (Gy h−1) × 8760 (h) × 0.8 × 0.7 (Sv Gy−1) × 10−6
Eout (mSv y−1) = Dout (Gy h−1) × 8760 (h) × 0.2 × 0.7 (Sv Gy−1) × 10−6
where
0.7 Sv Gy−1—a conversion factor from Gy to Sv;
0.2—outdoor occupancy factor;
0.8—indoor occupancy factor [65,66,67,68,69].
The indoor annual effective dose (IAED) from gamma radiation emitted by terrestrial radionuclides in a building was calculated using the Markkanen model (CEN). This model evaluates the IAED based on gamma radiation exposure at the center of a standard room with no windows or doors, featuring concrete walls with dimensions of 3 m × 4 m × 5 m and a thickness of 0.2 m. The calculation incorporates a dose conversion factor of 0.7 Sv Gy−1 and an average indoor occupancy time of 7000 h per year [69,70]. The IAED (in mSv) was determined using the CEN formula provided in the references [71]:
IAED = [(281 + 16.3 × ρd − 0.0161 × (ρd)2) · ARa + (319 + 18.5 × ρd − 0.0178 × (ρd)2) × ATh + (22.3 + 1.28 × ρd − 0.00114 × (ρd)2) × AK] × 10−6
where
ρ—the density of the FA concrete (2300 kg m−3);
d—the thickness of the model room (0.2 m).
The Activity Concentration Index (ACI) is commonly employed to regulate excess gamma radiation originating from terrestrial radionuclides present in structural, decorative, or covering materials, as well as raw building materials. This regulation aims to restrict the external radiation exposure caused by materials containing elevated levels of natural radionuclides.
High annual effective doses (AEDs) or individual doses (IDs) are of particular concern and must be controlled. According to the EC report, AEDs exceeding 1 mSv from construction materials are rare but significant and cannot be disregarded from a radiation safety perspective. Consequently, the ACI, calculated based on the activity concentrations of radionuclides and AED or ID thresholds, serves as a screening tool for assessing the safety of ready-to-use building materials [71]. Considering the types and proportions of industrial by-products, such as CFA, blast furnace slag, bauxite, and phosphogypsum, utilized in construction materials, the ACI is determined using the formula provided in relevant studies [29,70,71,72]:
ACI = ((ARa)/(300 Bq kg−1) + (ATh)/(200 Bq kg−1) + (AK)/(3000 Bq kg−1)) × UR
where
ARa, Ath, and AK are the activity concentration (in Bq kg−1) of 226Ra, 232Th, and 40K measured in CFA samples, respectively
UR—the usage ratio or fraction of the building raw materials.
In the case of structural materials, an ACI value of ≤1 aligns with an AED not exceeding 1 mSv, while an ACI ≤ 0.5 corresponds to an AED of ≤0.3 mSv. For superficial (surface-level) building materials, ACI thresholds of ≤6 and ≤2 similarly relate to AED values of ≤1 mSv and ≤0.3 mSv, respectively [71].
The Alpha Index (AI) assesses the additional alpha radiation resulting from radon inhalation due to its release from building materials [73]. When the annual effective dose (AED) is less than 1 mSv or the radium concentration (ARa) is below 200 Bq kg−1, it is generally unlikely that indoor radon levels will surpass the recommended design threshold of 200 Bq m−3 set by the European Commission. The AI is determined using the following formula [72]:
AI = ARa/(200 Bq kg−1)
When the AI < 1, the 226Ra activity concentration measured in any building material does not exceed 200 Bq kg−1 [71,73].

2.4.3. Excess Lifetime Cancer Risks

The excess lifetime cancer risks (ELCRs) were calculated according to estimated values of the annual effective doses, as expressed in equations [65,66,67,74,75]:
ELCRin = Ein × DL × RF
ELCRout = Eout × DL × RF
ELCRext = ELCRin + ELCRout
where
ELCRin, ELCRout and ELCRext are excess lifetime cancer risks for indoor, outdoor, and external;
DL is the duration of life (70 years);
RF is the risk factor (Sv−1), fatal cancer risk per Sievert.
For stochastic effects, ICRP 60 proposed an RF value of 0.057 Sv−1 for the public [67].

2.5. Statistical Methods

2.5.1. Tests Used for Analysis

The Shapiro–Wilk test evaluates the normality of a dataset. It tests the null hypothesis that the data are drawn from a normally distributed population. A small p-value (below 0.05) indicates that the data deviate significantly from normality. Levene’s test was used to assess the equality of variances (homogeneity of variance) across different groups. It tests the null hypothesis that the variances are equal. A significant result suggests that at least one group has a different variance compared to the others.
The Kruskal–Wallis test is a non-parametric alternative to a one-way ANOVA. It compares the medians of three or more independent groups to determine if there are statistically significant differences among them. It does not assume a normal distribution, making it useful when that assumption is violated. After a significant Kruskal–Wallis test, Dunn’s test was used for pairwise comparisons between groups, adjusting the significance level to account for the problem of multiplicative testing.
The Bonferroni correction is applied to adjust the significance level for multiple comparisons, thereby reducing the likelihood of Type I errors (false positives) when testing multiple pairs. These tests are commonly used together to analyze data that may not meet the assumptions required for parametric tests, ensuring that the conclusions drawn are statistically robust.
To answer the question of whether the entire concentration profile (i.e., the combined vector of values for thorium, radium, and potassium) differs between groups with different plant capacities, a PERMANOVA test was used. This is a test that examines whether differences between groups are greater than differences within groups. It estimates the degree of difference through pseudo-F and p-value statistics and does not require strict assumptions about normality or homogeneity of variance, since it is based on permutations.

2.5.2. Statistical Rationale and Methodological Justification

All the applied statistical methods were selected based on a prior evaluation of the dataset’s distributional properties and variance structure. The Shapiro–Wilk test indicated that the distribution of radionuclide activity concentrations (226Ra, 232Th, and 40K) significantly deviates from normality (p < 0.05). Additionally, Levene’s test showed unequal variances among capacity groups. These findings justified the use of non-parametric methods, which are more robust and reliable under such conditions. The Kruskal–Wallis test, as a rank-based alternative to ANOVA, allowed a comparison of medians across groups without assuming a normal distribution. To identify specific intergroup differences, a post hoc analysis using Dunn’s test with Bonferroni correction was performed, minimizing the risk of Type I error due to multiple comparisons.
PERMANOVA (Permutational Multivariate Analysis of Variance) was employed to evaluate whether the multivariate profile of radionuclide concentrations differs significantly between plant capacity categories. PERMANOVA is particularly suited for ecological and environmental datasets where assumptions of multivariate normality and homogeneity of dispersions are often violated. The method uses permutation testing to assess significance, making it appropriate for the present study. Its use enabled the simultaneous evaluation of all three radionuclides as a multivariate response, enhancing the analytical depth beyond what univariate comparisons can offer. Results from ordination techniques such as PCA and NMDS further supported and visualized the multivariate patterns, allowing the interpretation of variable contributions and group separations.
This methodological framework ensures statistical rigor and transparency and supports the reliability of the derived conclusions.

3. Results

3.1. Dependence of Radionuclide Concentration on Power Plant Capacity

Figure 1 presents the radionuclide activity concentration depending on the capacity of the plant.
As a result of the Shapiro–Wilk test, the hypothesis of normality of the distribution of activity concentrations of radionuclides in each of the four groups (plant capacity) was rejected. In each case, the p-value was lower than the assumed significance level of 0.05—the distribution of the tested data set significantly deviates from the normal distribution. Also, in the case of the homogeneity of variance test (Levene’s), the p-value was lower than 0.05, indicating that the variances in the groups are not similar. The results of both tests ruled out the use of parametric methods, because of which non-parametric methods were chosen for further analysis.
The Kruskal–Wallis test was performed to check the comparison of median concentrations between groups. For the thorium concentration, significant differences between groups were observed (p < 0.05); for radium, there were no significant differences between groups (p > 0.05), while for the potassium concentration, clear and highly significant differences between groups (p ≈ 0) were observed. In cases where the Kruskal–Wallis test showed significant differences, Dunn’s multiple comparisons test with Bonferroni correction was performed.
In the case of thorium, before adjustment, the difference between S2 and S3 would have been considered significant (p < 0.05). However, after applying the Bonferroni correction, the p-value increased to about 0.099, which exceeds the standard level of 0.05. Therefore, the difference is no longer considered statistically significant after the correction. For the S3–S4 pair, as with the S2–S3 comparison, the difference was significant (p < 0.05) before adjustment, but after applying the Bonferroni adjustment, the p increases to about 0.171, meaning the difference is not statistically significant. In other cases, the difference between the groups is not statistically significant, both before and after adjustment. After applying the Bonferroni correction, the results show that there are no statistically significant differences between the groups in terms of the parameter under study (e.g., concentration), as none of the pairs show a corrected p-value of less than 0.05. As a conservative method, the Bonferroni correction increases the p-value in multiple tests, which in this case made the initially significant results (for S2–S3 and S3–S4) no longer significant.
After Bonferroni correction, the S2–S3, S1–S4, S2–S4, and S3–S4 groups show highly statistically significant differences in potassium concentration. A comparison of S1–S2 (p-adj = 0.107) and S1–S3 (p-adj = 1.000) shows no significant differences after adjustment. The PERMANOVA test results indicate that the group (capacity) has a statistically significant effect on the profile of the variables studied (thorium, radium, potassium concentrations). A p-value of 0.001 means that differences between groups are very unlikely to occur by chance.
Effect size: The “Capacity” variable explains about 4.93% of the total variation. Although this percentage is not high, in the context of studies of complex systems (e.g., environmental, ecological, or industrial) such a result can be interpreted as significant.
F-value: A high F-statistic (15.504) confirms that intergroup differences are relatively large compared to within-group variability.
Ordination—or dimensionality reduction, which visually represents the structure of the data—was used to examine which variables contribute most to the differences between groups. PCA (Principal Component Analysis) and NMDS (Non-Metric Multidimensional Scaling) are two popular approaches.
The cumulative proportion of variance shows how much of the total variation in the data is explained by the subsequent components. In this case, the first two components (PC1 and PC2) together explain about 80.67% of the variability, which means that they can be used for visualization and further analysis, retaining most of the information. PC1 is the most important component, explaining about 47% of the variance, suggesting that the main axis of variation in the data runs in this direction. PC2 additionally explains about 33.6% of the variance, which, together with PC1, adds up to more than 80% of the total variance. PC3 adds the remaining 19.3%, but in many applications, it is sufficient to consider only the first two components. To visualize the results of the PCA, a biplot was used allowing us to see both samples and vectors (loadings) of variables, which makes it easier to assess which variables contribute most to each principal component. Points represent individual samples (Figure 2).
Arrows represent variables (concentrations). The direction and length of the arrow indicates how strongly a variable correlates with a given principal component. Longer arrows indicate a greater contribution of a given variable.
NMDS is a nonlinear method that works well when the data do not meet the assumptions of linearity or normality.
The results of the envfit analysis indicate that the environmental vectors corresponding to the variables ATh, ARa, and AK are significantly associated with the spatial distribution of the samples in the NMDS ordination. Specifically, the variable AK (potassium) exhibits the strongest influence, with an R2 value of 0.7429, suggesting that approximately 74.3% of the variation in the ordination is explained by AK. In comparison, ARa (radium) and ATh (thorium) explain 40.4% and 36.6% of the variation, respectively.
The PERMANOVA results were presented graphically by visualizing the NMDS ordination based on the same distance matrix used for the PERMANOVA test; groups and different plant powers were labeled on the graph to show how the samples separate in ordination space and whether the differences between groups, detected statistically, also have a clear graphical picture (Figure 3).
The NMDS1 and NMDS2 coordinates for each vector reveal the direction in which each variable increases. The vector for ATh (with NMDS1 = −0.21673 and NMDS2 = 0.97623) indicates that changes in ATh are primarily associated with variations along the NMDS2 axis. Conversely, ARa, with coordinates (NMDS1 = −0.51976, NMDS2 = −0.85431), contributes negatively along both axes, implying that higher values of ARa correspond to shifts in the negative direction on both NMDS axes. The vector for AK, displaying coordinates (NMDS1 = 0.94929, NMDS2 = −0.31440), is strongly aligned with NMDS1, indicating that AK predominantly influences the variation along this axis.
All vectors are statistically significant (p = 0.001), as determined by 999 permutations, confirming that the observed relationships are highly unlikely to be due to chance. Overall, these findings suggest that the concentration of AK is the most critical factor driving the differences among the samples in the NMDS space, with ARa and ATh also making significant contributions, albeit to a lesser degree.

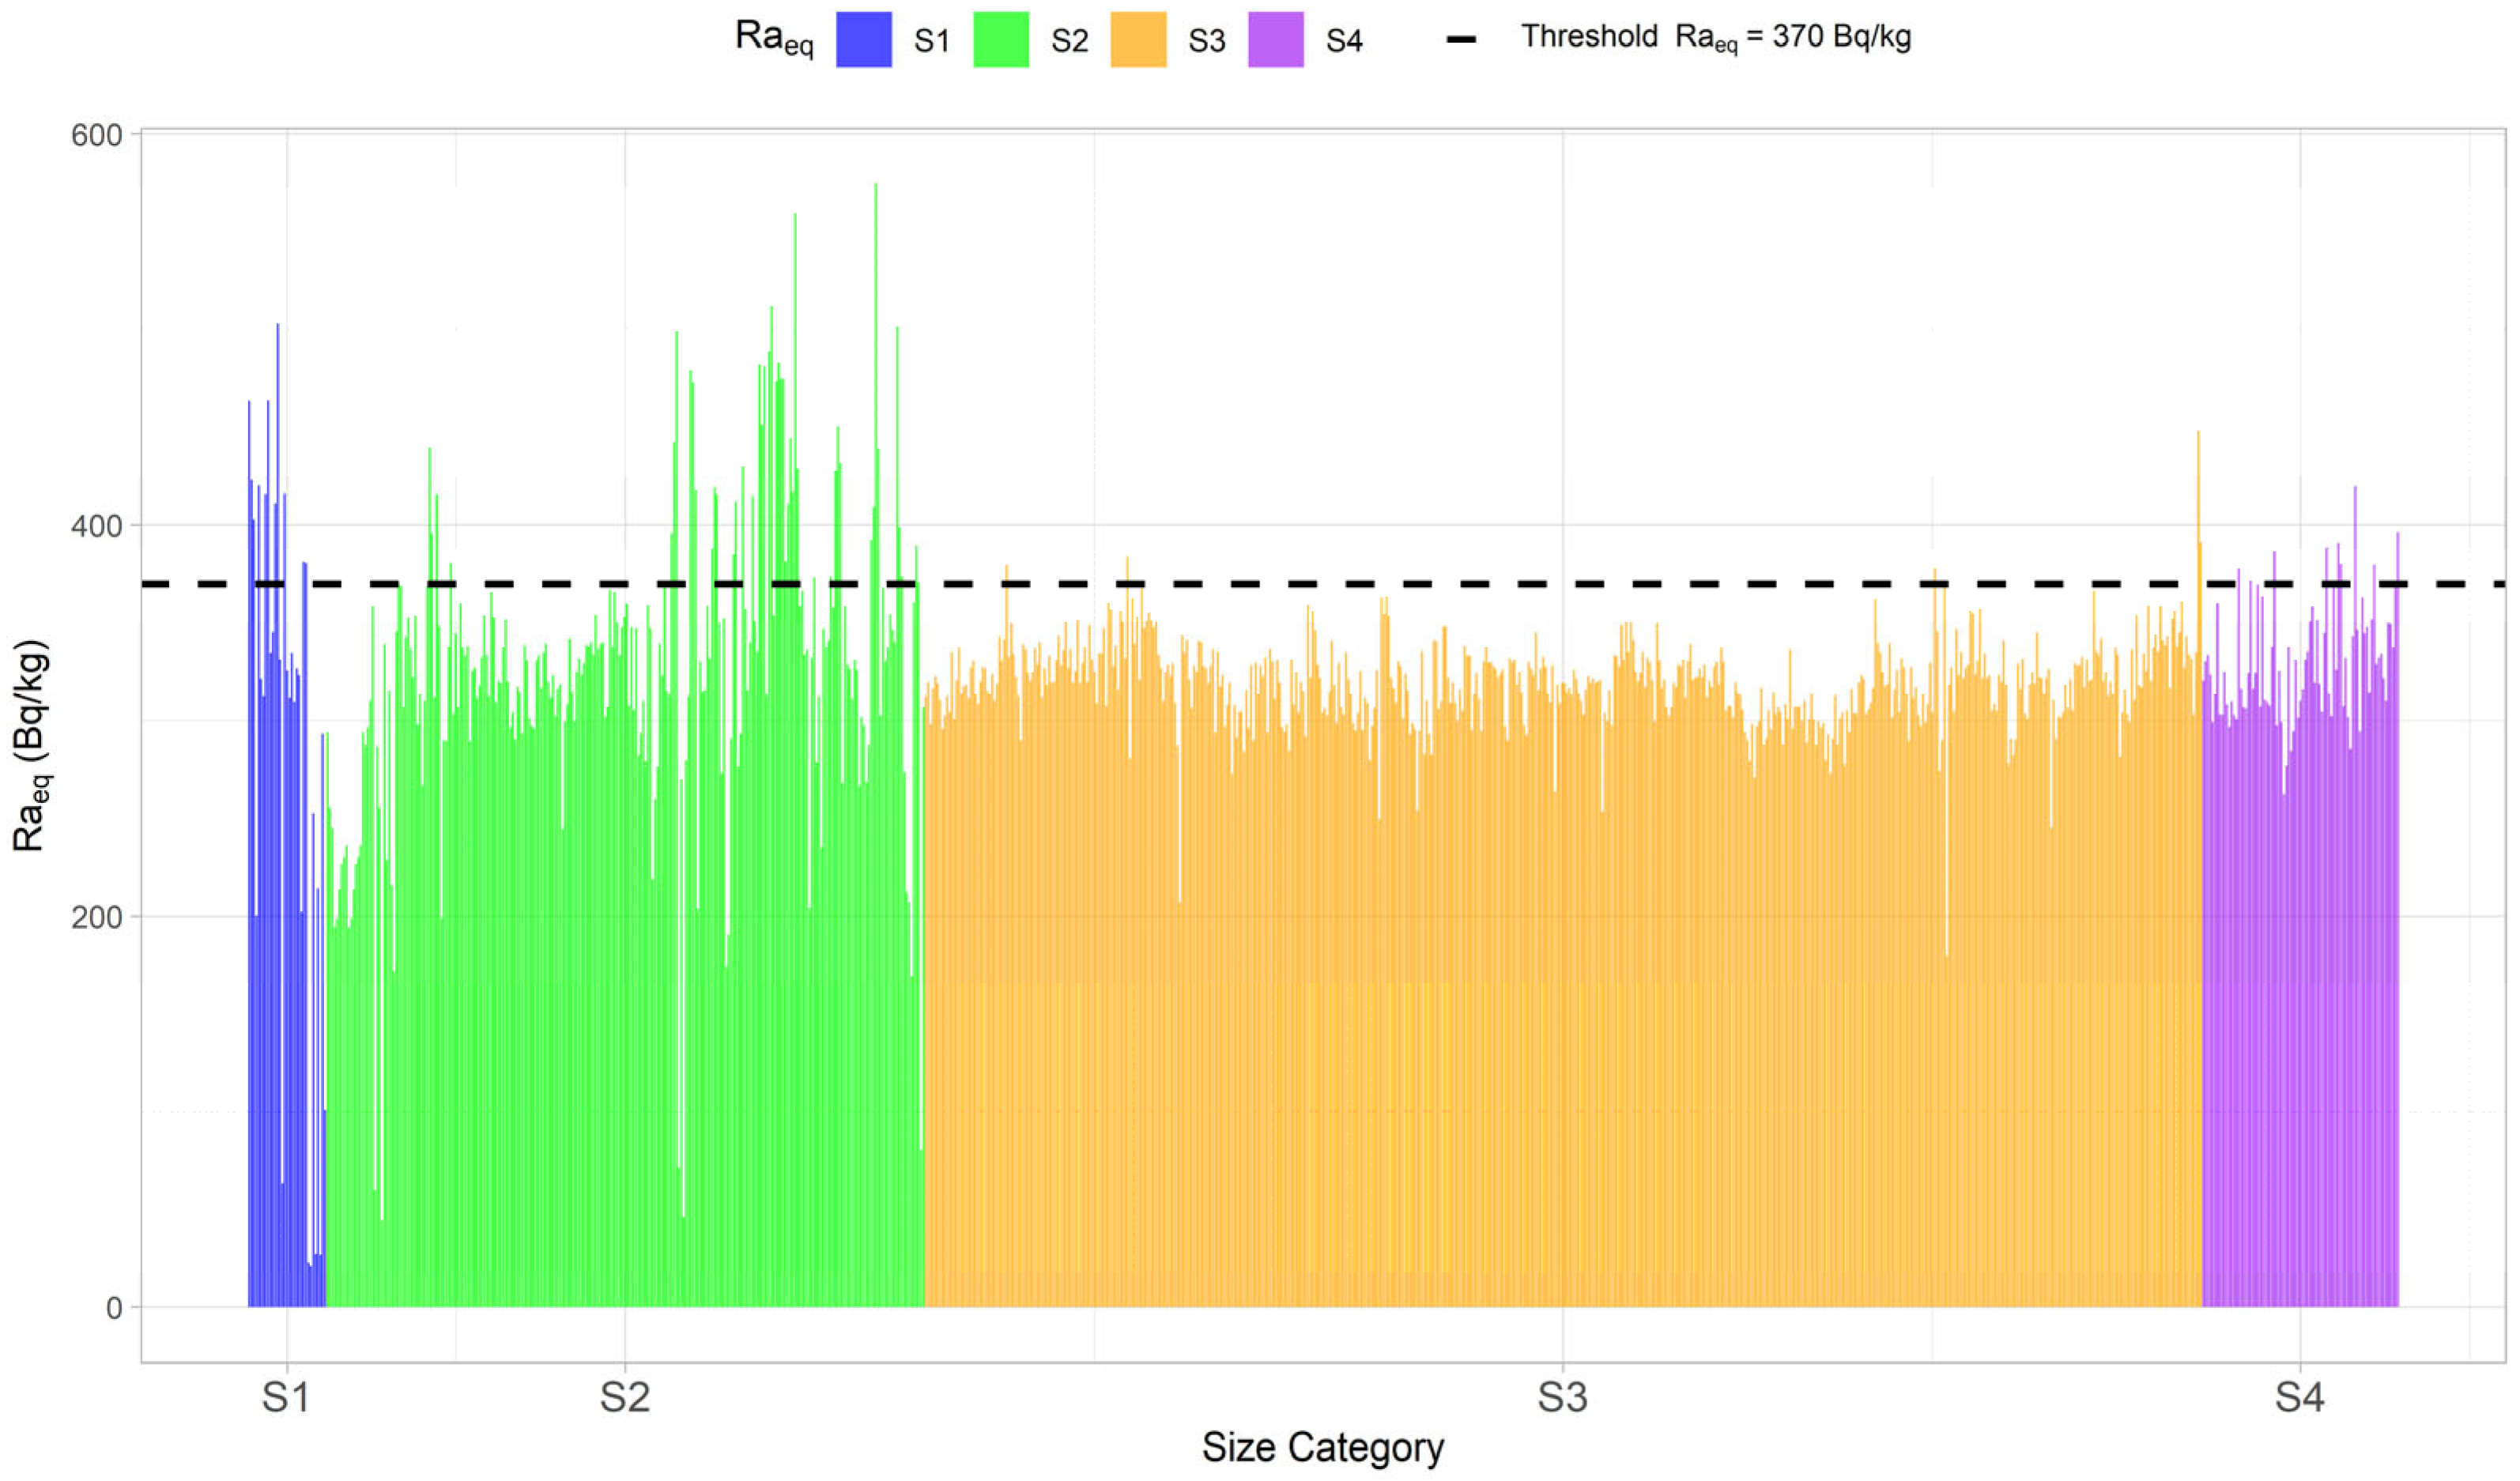
3.2. Radiological Hazard Assessment

3.2.1. Radiological Risks

Figure 4 contains Raeq values calculated from the studied plants’ 226Ra, 232Th, and 40K activity concentrations, divided by the variable “Size”. The dashed line indicates the value of 370 Bq kg−1, the maximum value allowed in building materials.
The calculated values of Raeq ranged from 20.86 to 547.6 Bq kg−1, with a median of 321.3 Bq kg−1, while the calculated values of Hex ranged from 0.06 to 1.93, with an average of 1.00. In the case of category S1, 33.3% of Raeq values were found to be above Bq kg−1 (11 out of 33 counts). For category S2, this proportion was 18.7% (47 out of 252); for category S3, 1.12% (6 out of 538); and for category S4, 13.3% (11 out of 83). For category S1, it was 69.7%. The Hin values were above 1, while for categories S2, S3 and S4, the Hin values were above 1—respectively, 84.1%, 98.7%, and 100%. The Hin should be less than unity to safely use material in constructing dwellings (Table 1).

3.2.2. Dose Rates, Activity Concentration Index, and Alpha Index

The absorbed dose rate at 1 m above ground D (nGy h−1 by Bq kg−1) and Din and Dout were calculated. Moreover, the effective dose rate (Eef) and the outdoor (Eout) and indoor (Ein) annual effective dose, as well as the indoor annual effective dose (IAED) from gamma radiation emitted by terrestrial radionuclides in a building rate, the Activity Concentration Index (ACI), and Alpha Index (AI) have been compiled in Table 2.
According to UNSCEAR (United Nations Scientific Committee on the Effects of Atomic Radiation), the global average IAED from terrestrial radionuclides is approximately 0.41 mSv/y. The ICRP recommends that the annual radiation dose for the general public should not exceed 1 mSv y−1, excluding medical and natural background radiation. The WHO and the European Commission (Radiation Protection 112) suggest that if the IAED exceeds 1 mSv y−1, control measures may be necessary, such as reducing the use of materials with a high radionuclide content. In buildings containing materials rich in radium, thorium, or potassium, the IAED may exceed 1–2 mSv y−1, requiring further assessment and potential mitigation strategies. For category S1, 72.7% of IAED values were above 1 mSv h−1. For category S2, this proportion was 88.5%; for category S3, 99.6%; for category S4, 100%.
When the AI is less than 1, the measured 226Ra activity concentration in any building material remains below 200 Bq kg−1. In category S1, 78.8% of IA values were lower than 1 mSv h−1. In S2, this percentage was 88.9%, while in S3 and S4, it reached 99.6% and 99.8%, respectively.

3.2.3. Excess Lifetime Cancer Risks

Table 3 contains the excess lifetime cancer risk (ELCR) values for indoor, outdoor, and external, divided by the variable “Size”.
The global average ELCR for natural radiation exposure is 0.29 × 10⁻³ (0.00029 or 0.029%) according to UNSCEAR. An acceptable ELCR level according to the ICRP is 1 × 10⁻³ (0.001 or 0.1%)—considered the upper threshold for permissible public exposure. The ELCR level considered hazardous is 1 × 10⁻² (0.01 or 1%) and above—this may indicate a significant radiological risk and the need for exposure reduction measures.

4. Discussion

Table 4 contains activity concentration values of chosen radionuclides determined in fly ashes by different authors worldwide.
Also, Lauer et al. (2017) [109] involved a comparative analysis of naturally occurring radioactive materials in uranium-rich coal samples and their corresponding coal combustion residues (CCRs), in relation to CCRs from the Beijing region and natural loess deposits in Northeastern China. The uranium-rich coals exhibited significantly elevated uranium concentrations, reaching up to 476 ppm, which were accompanied by notably low activity ratios of 232Th/238U and 228Ra/226Ra (≪1). Furthermore, a positive correlation was observed between 226Ra and 238U activities, as well as between 228Ra and 232Th activities. Additionally, 226Ra activity displayed a strong association with 210Pb activity across all the analyzed coal samples [109]. In comparison with worldwide literature values, the activity concentrations measured in the S1–S4 samples generally fall within or near the broad ranges reported for coal combustion residues in different regions. For example, many global studies cite mean values for 226Ra in the vicinity of 30–60 Bq kg−1, 232Th around 20–60 Bq kg−1, and 40K spanning approximately 200–600 Bq kg−1. The data from S1–S4 typically align with these intervals, although some samples, particularly for 226Ra, exhibit activity concentrations that exceed these averages. Such elevated values are not uncommon in the literature, as local geological conditions and coal composition can markedly influence radionuclide levels. A more detailed comparative perspective reveals that the activity concentrations of 226Ra, 232Th, and 40K in CFA from Polish power and CHP plants (especially in groups S1 and S4) are largely consistent with values reported in the international literature. For instance, studies conducted in India, China, Brazil, and Greece have shown a wide variability in CFA radionuclide content, depending not only on plant capacity but also on geological background, fuel composition, and pollution control strategies. In Brazil, values of 226Ra have reached up to 3773 Bq kg−1, while in China and Greece, average concentrations of 232Th often exceed 150 Bq kg−1, notably higher than the median values observed in this study. The variability observed between countries may be attributed to several factors: (i) the geological origin of the coal, which determines the initial NORM content—for example, uranium-rich coal basins in Brazil and India; (ii) combustion technology, particularly the use of pulverized coal boilers versus fluidized bed systems, which influence the partitioning and volatilization behavior of radionuclides; and (iii) pollution control technologies, such as high-efficiency electrostatic precipitators or fabric filters, which affect the particle-bound radionuclide capture rates. Furthermore, regulatory frameworks—such as permissible Raeq thresholds or building material standards—vary considerably between countries. For instance, Japan allows CFA use in cement only below 8000 Bq kg−1, while European standards define Raeq limits at 370 Bq kg−1. This influences both the classification of fly ash as hazardous and its subsequent utilization. Our results indicate that although Polish CFA falls within globally reported ranges, a significant portion of samples, particularly in the case of plants with a capacity less than 300 MW (group S1) and higher than 3000 MW (S4), approach or exceed these thresholds, especially in terms of Raeq, IAED, and Hex indices. This suggests that while Polish CFA is generally comparable in radiological profile to that from other countries, local assessments must account for national environmental conditions, energy infrastructure characteristics, and regulatory benchmarks. These findings reinforce the need for country-specific risk evaluation frameworks, while also enabling international comparability and potential standard harmonization. Moreover, the observed variations do not appear to correlate strictly with the installed capacity of the PP and CHP plants. While it is likely that higher-capacity facilities could yield higher radionuclide concentrations, multiple studies have demonstrated that the principal determinants include the origin and quality of the coal, the specific combustion technology, and the efficiency of particulate control systems. Consequently, even plants with relatively low capacities can exhibit elevated radionuclide concentrations if the coal source is enriched in naturally occurring radioactive materials. Conversely, large installations may generate residues with moderate activities if the coal and operational parameters favor a lower accumulation of radioactive elements. In this context, the results presented here are consistent with global findings, highlighting that a complex interplay of factors, rather than power plant capacity alone, governs the ultimate radionuclide content of coal combustion by-products.

5. Conclusions

In this study, the radiological hazard of coal fly ashes from power and cogeneration plants by analyzing the concentrations of thorium (232Th), radium (226Ra), and potassium (40K) across four capacity-based groups (S1: <300 MW, S2: 300–1000 MW, S3: 1000–3000 MW, S4: >3000 MW) was evaluated. Samples collected between 2020 and 2023 were analyzed using PERMANOVA, which revealed significant differences in the overall concentration profiles among the groups. Our findings indicate that the plant capacity has a discernible effect on the concentrations of thorium and, particularly, potassium, while no statistically significant differences were observed for radium. Notably, potassium concentrations exhibited marked differences between groups S2, S3, and S4, as well as between S1 and S4; however, the differences between S1–S2 and S1–S3 were not statistically significant after adjustments for multiple testing. Additionally, most S1 samples displayed values near or below the 370 Bq kg−1 threshold, most S3 samples were below this threshold, and most S4 samples clustered around it, with the greatest variability observed in the S3 group. These results underscore the importance of considering plant capacity when assessing the radiological risks associated with fly ash and have significant implications for environmental risk management and waste processing in the energy sector.
Our study addressed a gap in the literature by providing a detailed assessment of the radiological hazard associated with coal fly ash from Polish power and combined heat and power plants, with a specific focus on the influence of installed plant capacity. Using non-parametric methods, including PERMANOVA, we demonstrated that plant capacity has a statistically significant influence on the overall profile of radionuclide concentrations (thorium, radium, and potassium) and particularly on potassium concentration. While radium concentrations did not show statistically significant differences between capacity groups, significant differences were observed in potassium concentration among groups S2, S3, S4, and between S1 and S4 after Bonferroni correction for multiple comparisons. The PERMANOVA analysis results confirmed that the “Capacity” variable has a statistically significant impact on the profile of the studied variables.
The calculated radiological hazard assessment factors, such as Raeq and Hex, often approached or exceeded permissible limits for building materials, especially in groups S1 and S4. The internal hazard index (Hin) and annual effective doses (e.g., IAED) frequently exceeded reference levels. Importantly, the frequency of exceeding these levels, particularly IAEDs, showed an increasing trend with increasing installed plant capacity.
The main scientific contribution of this work is the confirmation of a statistically significant dependence between the installed capacity of power plants and the profile of radionuclide concentrations in fly ash, representing a novel approach in studying the factors influencing the radiological characteristics of energy waste. The study also provides valuable, current data for the Polish energy sector that can be used for risk assessment in Central and Eastern European countries.
The practical implications of the results are significant. The analysis of the dependence on plant capacity allows for a better understanding of the potential hazards associated with different types of power plants and can aid in developing more targeted waste management strategies. The findings underscore the need to consider capacity as a key parameter in radiological risk assessment and may suggest the necessity of implementing more stringent monitoring and control measures in the future, especially for higher-capacity installations. Our study provides strategically important results for shaping energy policy and environmental protection in Poland, particularly in the context of future sector developments. Moreover, by explicitly incorporating plant capacity as a stratification variable, this research introduces a novel methodological perspective: it links technological and operational scale (reflected by installed power output) with measurable radiological properties of waste. To our knowledge, this variable has rarely been examined in relation to radionuclide distribution patterns, despite its clear relevance to fuel throughput, combustion efficiency, and fly ash characteristics.
The dataset—comprising over 900 samples from 19 facilities over a three-year period—offers a statistically robust foundation for meta-analyses and regulatory benchmarking. These insights can guide decision-makers in optimizing monitoring frameworks and updating safety standards, especially for high-capacity plants with elevated hazard indices. The study also opens avenues for follow-up research, such as exploring correlations with combustion technology, ash composition, or emission control systems.
Calculating radiological hazard assessment factors, including radiological risk and dose rate indicators, allows for a thorough analysis of the potential consequences of exposure to these materials. Such an evaluation facilitates the development of appropriate waste management strategies and measures to minimize exposure, both for power plant workers and local communities, while also contributing to the establishment of environmental protection norms and standards. Furthermore, analyzing the results in relation to plant capacity enables the identification of potential correlations between the technological parameters of the installations and the radionuclide content. This may lead to the necessity of implementing more stringent monitoring and control measures in the future. Considering plans for constructing new power units and the dynamic changes occurring within the energy sector, the outcomes of such a study hold strategic importance for shaping energy policy and environmental protection.

Author Contributions

Conceptualization, K.I., M.S.-S., M.R. and M.K.; methodology, K.I., B.P., M.S.-S., M.R. and K.M.; software, M.S.-S., M.R. and K.M.; validation, K.I., M.S.-S., M.R. and K.M.; formal analysis, K.I., B.P., M.S.-S., M.R. and K.M.; investigation, K.I. and B.P.; resources, K.I. and B.P; data curation, K.I. and B.P.; writing—original draft preparation, M.S.-S. and M.R.; writing—review and editing, K.I., M.S.-S., M.R. and K.M.; visualization, M.S.-S.; supervision, K.I. and M.S.-S.; funding acquisition, M.R. and M.K. All authors have read and agreed to the published version of the manuscript.

Funding

This research received no external funding.

Data Availability Statement

The original contributions presented in this study are included in the article; further inquiries can be directed to the corresponding author.

Conflicts of Interest

The authors declare no conflicts of interest.

References

  1. Angaru, G.K.R.; Choi, Y.-L.; Lingamdinne, L.P.; Choi, J.-S.; Kim, D.-S.; Koduru, J.R.; Yang, J.-K.; Chang, Y.-Y. Facile Synthesis of Economical Feasible Fly Ash–Based Zeolite–Supported Nano Zerovalent Iron and Nickel Bimetallic Composite for the Potential Removal of Heavy Metals from Industrial Effluents. Chemosphere 2021, 267, 128889. [Google Scholar] [CrossRef] [PubMed]
  2. Arora, S.; Gosu, V.; Subbaramaiah, V.; Hameed, B.H. Lithium Loaded Coal Fly Ash as Sustainable and Effective Catalyst for the Synthesis of Glycerol Carbonate from Glycerol. J. Environ. Chem. Eng. 2021, 9, 105999. [Google Scholar] [CrossRef]
  3. Ahmaruzzaman, M. A Review on the Utilization of Fly Ash. Prog. Energy Combust. Sci. 2010, 36, 327–363. [Google Scholar] [CrossRef]
  4. Alterary, S.S.; Marei, N.H. Fly Ash Properties, Characterization, and Applications: A Review. J. King Saud Univ.-Sci. 2021, 33, 101536. [Google Scholar] [CrossRef]
  5. Doušová, B.; Pilař, L.; Koloušek, D.; Bedrnová, E.; Lhotka, M.; Maxová, K. Adsorption Properties of Fly Ash–Clay Composites from Central European Localities: Case Study. Appl. Clay Sci. 2024, 255, 107395. [Google Scholar] [CrossRef]
  6. Shi, Y.; Jiang, F.; Wang, R.; Yang, S.; Zhu, X.; Shen, Y. A mini review on the separation of Al, Fe and Ti elements from coal fly ash leachate. Int. J. Coal Sci. Technol. 2024, 11, 24. [Google Scholar] [CrossRef]
  7. Polowczyk, I.; Ulatowska, J.; Koźlecki, T.; Bastrzyk, A.; Sawiński, W. Studies on Removal of Boron from Aqueous Solution by Fly Ash Agglomerates. Desalination 2013, 310, 93–101. [Google Scholar] [CrossRef]
  8. Al-Ghouti, M.A.; Al-Degs, Y.S.; Ghrair, A.; Ziedan, M.; Khoury, H.; Abdelghani, J.I.; Khraisheh, M. Development of Industrially Viable Geopolymers from Treated Petroleum Fly Ash. J. Clean. Prod. 2021, 280, 124808. [Google Scholar] [CrossRef]
  9. Hussain, Z.; Chang, N.; Sun, J.; Xiang, S.; Ayaz, T.; Zhang, H.; Wang, H. Modification of Coal Fly Ash and Its Use as Low-Cost Adsorbent for the Removal of Directive, Acid and Reactive Dyes. J. Hazard. Mater. 2022, 422, 126778. [Google Scholar] [CrossRef]
  10. Li, Q.; Xiong, T.; Liao, J.; Zhang, Y. Explorations on Efficient Extraction of Uranium with Porous Coal Fly Ash Aerogels. Sci. Total Environ. 2022, 839, 156365. [Google Scholar] [CrossRef]
  11. Kravchenko, J.; Lyerly, H.K. The Impact of Coal-Powered Electrical Plants and Coal Ash Impoundments on the Health of Residential Communities. North Carol. Med. J. 2018, 79, 289–300. [Google Scholar] [CrossRef]
  12. Beig, G.; Chate, D.M.; Ghude, S.D.; Ali, K.; Satpute, T.; Sahu, S.K.; Parkhi, N.; Trimbake, H.K. Evaluating Population Exposure to Environmental Pollutants during Deepavali Fireworks Displays Using Air Quality Measurements of the SAFAR Network. Chemosphere 2013, 92, 116–124. [Google Scholar] [CrossRef] [PubMed]
  13. Asokan, P.; Saxena, M.; Asolekar, S.R. Coal Combustion Residues-Environmental Implications and Recycling Potentials. Resour. Conserv. Recycl. 2005, 43, 239–262. [Google Scholar] [CrossRef]
  14. Zacco, A.; Borgese, L.; Gianoncelli, A.; Struis, R.P.W.J.; Depero, L.E.; Bontempi, E. Review of Fly Ash Inertisation Treatments and Recycling. Environ. Chem. Lett. 2014, 12, 153–175. [Google Scholar] [CrossRef]
  15. Yao, Z.T.; Ji, X.S.; Sarker, P.K.; Tang, J.H.; Ge, L.Q.; Xia, M.S.; Xi, Y.Q. A Comprehensive Review on the Applications of Coal Fly Ash. Earth-Sci. Rev. 2015, 141, 105–121. [Google Scholar] [CrossRef]
  16. Temuujin, J.; Surenjav, E.; Ruescher, C.H.; Vahlbruch, J. Processing and Uses of Fly Ash Addressing Radioactivity (Critical Review). Chemosphere 2019, 216, 866–882. [Google Scholar] [CrossRef] [PubMed]
  17. Gupta, M.; Mahur, A.K.; Varshney, R.; Sonkawade, R.G.; Verma, K.D.; Prasad, R. Measurement of Natural Radioactivity and Radon Exhalation Rate in Fly Ash Samples from a Thermal Power Plant and Estimation of Radiation Doses. Radiat. Meas. 2013, 50, 160–165. [Google Scholar] [CrossRef]
  18. Vukanac, I.; Šešlak, B.; Kandić, A.; Čeliković, I.; Nikolić, N.M.; Milanović, T.; Obradović, Z.; Đurašević, M. A Comparison of Alpha-Particle and Gamma-Ray Spectrometry Methods for Determination of 235U, 238U and 226Ra Activity Concentration in Samples of Coal, Slag and Fly-Ash. Radiat. Phys. Chem. 2022, 193, 109933. [Google Scholar] [CrossRef]
  19. Zeevaert, T.; Sweeck, L.; Vanmarcke, H. The Radiological Impact from Airborne Routine Discharges of a Modern Coal-Fired Power Plant. J. Environ. Radioact. 2006, 85, 1–22. [Google Scholar] [CrossRef]
  20. Mondal, T.; Sengupta, D.; Mandal, A. Natural Radioactivity of Ash and Coal in Major Thermal Power Plants of West Bengal, India. Curr. Sci. 2006, 91, 1387–1393. [Google Scholar]
  21. Flues, M.; Camargo, I.M.C.; Silva, P.S.C.; Mazzilli, B.P. Radioactivity of Coal and Ashes from Figueira Coal Power Plant in Brazil. J. Radioanal. Nucl. Chem. 2006, 270, 597–602. [Google Scholar] [CrossRef]
  22. Bhangare, R.C.; Tiwari, M.; Ajmal, P.Y.; Sahu, S.K.; Pandit, G.G. Distribution of Natural Radioactivity in Coal and Combustion Residues of Thermal Power Plants. J. Radioanal. Nucl. Chem. 2014, 300, 17–22. [Google Scholar] [CrossRef]
  23. Almahayni, T.; Vanhoudt, N. Does Leaching of Naturally Occurring Radionuclides from Roadway Pavements Stabilised with Coal Fly Ash Have Negative Impacts on Groundwater Quality and Human Health? J. Hazard. Mater. 2018, 349, 128–134. [Google Scholar] [CrossRef] [PubMed]
  24. Lauer, N.; Hower, J.; Hsu-Kim, H.; Taggart, R.; Vengosh, A. Naturally Occurring Radioactive Materials in Coals and Coal Combustion Residuals in the United States. Environ. Sci. Technol. 2015, 49, 11227–11233. [Google Scholar] [CrossRef]
  25. Jamasali, Y.; Turhan, Ş. Measurement of Natural Radioactivity in Fly Ash from a Lignite-Fired Thermal Power Plant and Radiological Risk Assessment Using RESRAD Code. Environ. Forensics 2025, 26, 135–145. [Google Scholar] [CrossRef]
  26. Bem, H.; Wieczorkowski, P.; Budzanowski, M. Evaluation of Technologically Enhanced Natural Radiation near the Coal-Fired Power Plants in the Lodz Region of Poland. J. Environ. Radioact. 2002, 61, 191–201. [Google Scholar] [CrossRef]
  27. Dinis, M.L.; Fiúza, A.; Góis, J.; Carvalho, J.M.S.; Castro, A.C.M. Modeling Radionuclides Dispersion and Deposition Downwind of a Coal-Fired Power Plant. Procedia Earth Planet. Sci. 2014, 8, 59–63. [Google Scholar] [CrossRef]
  28. Flues, M.; Moraes, V.; Mazzilli, B.P. The Influence of a Coal-Fired Power Plant Operation on Radionuclide Concentrations in Soil. J. Environ. Radioact. 2002, 63, 285–294. [Google Scholar] [CrossRef]
  29. Hasani, F.; Shala, F.; Xhixha, G.; Xhixha, M.K.; Hodolli, G.; Kadiri, S.; Bylyku, E.; Cfarku, F. Naturally Occurring Radioactive Materials (NORMs) Generated from Lignite-Fired Power Plants in Kosovo. J. Environ. Radioact. 2014, 138, 156–161. [Google Scholar] [CrossRef]
  30. Papp, Z.; Dezso, Z.; Daróczy, S. Significant Radioactive Contamination of Soil around a Coal-Fired Thermal Power Plant. J. Environ. Radioact. 2002, 59, 191–205. [Google Scholar] [CrossRef]
  31. Sert, E.; Uğur, A.; Özden, B.; Saç, M.M.; Camgöz, B. Biomonitoring of 210Po and 210Pb Using Lichens and Mosses around Coal-Fired Power Plants in Western Turkey. J. Environ. Radioact. 2011, 102, 535–542. [Google Scholar] [CrossRef] [PubMed]
  32. Ugur, A.; Özden, B.; Saç, M.M.; Yener, G.; Altinbaş, Ü.; Kurucu, Y.; Bolca, M. Lichens and Mosses for Correlation between Trace Elements and 210Po in the Areas near Coal-Fired Power Plant at Yatağan, Turkey. J. Radioanal. Nucl. Chem. 2004, 259, 87–92. [Google Scholar] [CrossRef]
  33. Skoko, B.; Babić, D.; Marović, G.; Papić, S. Environmental Radiological Risk Assessment of a Coal Ash and Slag Disposal Site with the Use of the ERICA Tool. J. Environ. Radioact. 2019, 208–209, 106018. [Google Scholar] [CrossRef] [PubMed]
  34. Nowina-Konopka, M. Radiological Hazard from Coal-Fired Power Plants in Poland. Radiat. Prot. Dosim. 1993, 46, 171–180. [Google Scholar] [CrossRef]
  35. Sahu, S.K.; Tiwari, M.; Bhangare, R.C.; Pandit, G.G. Enrichment and Particle Size Dependence of Polonium and Other Naturally Occurring Radionuclides in Coal Ash. J. Environ. Radioact. 2014, 138, 421–426. [Google Scholar] [CrossRef]
  36. Vreček, P.; Benedik, L. 210Pb and 210Po in Fossil Fuel Combustion at the Šoštanj Thermal Power Plant (Slovenia). Czech. J. Phys. 2003, 53, A51–A55. [Google Scholar] [CrossRef]
  37. Pandit, G.G.; Sahu, S.K.; Puranik, V.D. Natural Radionuclides from Coal Fired Thermal Power Plants—Estimation of Atmospheric Release and Inhalation Risk. Radioprotection 2011, 46, S173–S179. [Google Scholar] [CrossRef]
  38. Zakaria, N.; Baan, R.; Kathiravale, S. Radiological Impact from Airborne Routine Discharges of Coal-Fired Power Plant. 2010. Available online: https://inis.iaea.org/records/dxn8a-6pa11 (accessed on 3 January 2025).
  39. Kovler, K.; Perevalov, A.; Steiner, V.; Metzger, L.A. Radon Exhalation of Cementitious Materials Made with Coal Fly Ash: Part 1—Scientific Background and Testing of the Cement and Fly Ash Emanation. J. Environ. Radioact. 2005, 82, 321–334. [Google Scholar] [CrossRef]
  40. Vaasma, T.; Kaasik, M.; Loosaar, J.; Kiisk, M.; Tkaczyk, A.H. Long-Term Modelling of Fly Ash and Radionuclide Emissions as Well as Deposition Fluxes Due to the Operation of Large Oil Shale-Fired Power Plants. J. Environ. Radioact. 2017, 178–179, 232–244. [Google Scholar] [CrossRef]
  41. Alliksaar, T.; Hörstedt, P.; Renberg, I. Characteristic Fly-Ash Particles from Oil-Shale Combustion Found in Lake Sediments. Water Air Soil Pollut. 1998, 104, 149–160. [Google Scholar] [CrossRef]
  42. Alliksaar, T. Application of Spherical Fly-Ash Particles to Study Spatial Deposition of Atmospheric Pollutants in North-Eastern Estonia. OS 2000, 17, 335. [Google Scholar] [CrossRef]
  43. Baig, K.S.; Yousaf, M. Coal Fired Power Plants: Emission Problems and Controlling Techniques. J. Earth Sci. Clim. Change 2017, 8, 404. [Google Scholar] [CrossRef]
  44. Aubert, J.E.; Husson, B.; Sarramone, N. Utilization of Municipal Solid Waste Incineration (MSWI) Fly Ash in Blended Cement: Part 1: Processing and Characterization of MSWI Fly Ash. J. Hazard. Mater. 2006, 136, 624–631. [Google Scholar] [CrossRef]
  45. Saikia, N.; Kato, S.; Kojima, T. Production of Cement Clinkers from Municipal Solid Waste Incineration (MSWI) Fly Ash. Waste Manag. 2007, 27, 1178–1189. [Google Scholar] [CrossRef] [PubMed]
  46. Qian, G.; Song, Y.; Zhang, C.; Xia, Y.; Zhang, H.; Chui, P. Diopside-Based Glass-Ceramics from MSW Fly Ash and Bottom Ash. Waste Manag. 2006, 26, 1462–1467. [Google Scholar] [CrossRef] [PubMed]
  47. Nishida, K.; Nagayoshi, Y.; Ota, H.; Nagasawa, H. Melting and Stone Production Using MSW Incinerated Ash. Waste Management 2001, 21, 443–449. [Google Scholar] [CrossRef] [PubMed]
  48. Fan, Y.; Zhang, F.-S.; Zhu, J.; Liu, Z. Effective Utilization of Waste Ash from MSW and Coal Co-Combustion Power Plant-Zeolite Synthesis. J. Hazard. Mater. 2008, 153, 382–388. [Google Scholar] [CrossRef]
  49. Ohbuchi, A.; Fujii, K.; Kasari, M.; Koike, Y. Characterization of Soluble and Insoluble Radioactive Cesium in Municipal Solid Waste Incineration Fly Ash. Chemosphere 2020, 248, 126007. [Google Scholar] [CrossRef]
  50. Qureshi, A.A.; Tariq, S.; Din, K.U.; Manzoor, S.; Calligaris, C.; Waheed, A. Evaluation of Excessive Lifetime Cancer Risk Due to Natural Radioactivity in the Rivers Sediments of Northern Pakistan. J. Radiat. Res. Appl. Sci. 2014, 7, 438–447. [Google Scholar] [CrossRef]
  51. Bulut, H.A.; Şahin, R. Radiological Characteristics of Self-Compacting Concretes Incorporating Fly Ash, Silica Fume, and Slag. J. Build. Eng. 2022, 58, 104987. [Google Scholar] [CrossRef]
  52. Taskin, H.; Karavus, M.; Ay, P.; Topuzoglu, A.; Hidiroglu, S.; Karahan, G. Radionuclide Concentrations in Soil and Lifetime Cancer Risk Due to Gamma Radioactivity in Kirklareli, Turkey. J. Environ. Radioact. 2009, 100, 49–53. [Google Scholar] [CrossRef]
  53. Alareqi, W.; Bobaker, A.; Alakili, I.; Majid, A.; Sarmani, S. Determination of Heavy Metals and Radionuclides in Coal and Industrial Fly Ash by Neutron Activation Analysis (NAA) and Gamma Spectrometry. Sains. Malays. 2019, 48, 1655–1660. [Google Scholar] [CrossRef]
  54. Mohamed, H.; Pauzi, A.M.; Ahmad, N.; Karim, N.A.; Wazir, M.N.U.I.; Zaiul Bahri, C.N.A.C.; Idris, M.I. Natural Radioactivity Analysis and Radiological Impact Assessment from a Coal Power Plant. Int. J. Radiat. Res. 2023, 21, 797–804. [Google Scholar] [CrossRef]
  55. Lim, S.M.; Choi, J.W.; Hong, M.H.; Jung, D.; Lee, C.Y.; Park, S.Y.; Shim, H.S.; Sheen, S.; Kwak, K.I.; Kang, D.R.; et al. Indoor Radon Exposure Increases Tumor Mutation Burden in Never-Smoker Patients with Lung Adenocarcinoma. Lung Cancer 2019, 131, 139–146. [Google Scholar] [CrossRef]
  56. Fuente, M.; Long, S.; Fenton, D.; Hung, L.C.; Goggins, J.; Foley, M. Review of Recent Radon Research in Ireland, OPTI-SDS Project and Its Impact on the National Radon Control Strategy. Appl. Radiat. Isot. 2020, 163, 109210. [Google Scholar] [CrossRef] [PubMed]
  57. Walczak, K.; Olszewski, J.; Politański, P.; Domeradzka-Gajda, K.; Kowalczyk, K.; Zmyślony, M.; Brodecki, M.; Stępnik, M. Residential Exposure to Radon and Levels of Histone γH2AX and DNA Damage in Peripheral Blood Lymphocytes of Residents of Kowary City Regions (Poland). Chemosphere 2020, 247, 125748. [Google Scholar] [CrossRef]
  58. Mishra, M.; Sahu, S.K.; Mangaraj, P.; Beig, G. Assessment of Hazardous Radionuclide Emission Due to Fly Ash from Fossil Fuel Combustion in Industrial Activities in India and Its Impact on Public. J. Environ. Manag. 2023, 328, 116908. [Google Scholar] [CrossRef] [PubMed]
  59. Łukaszek-Chmielewska, A.; Piotrowska, B.; Isajenko, K.; Lipiński, P.; Podleśna, A.; Lewicka, S.; Rachwał, M. A Study of Natural Radioactivity of Rock Meals Used for Soil Fertilization. CATENA 2024, 241, 107959. [Google Scholar] [CrossRef]
  60. Łukaszek-Chmielewska, A.; Girard, M.; Wojtkowski, K.; Isajenko, K.; Piotrowska, B. Analysis of Natural Radionuclide Concentrations in Selected Building Materials Available on the Domestic Market. SHS Web Conf. 2018, 57, 02003. [Google Scholar] [CrossRef]
  61. Kurek, K.; Isajenko, K.; Piotrowska, B.; Łukaszek-Chmielewska, A.; Lipiński, P. Impact of Legislative Change on the Classification of Raw Materials and Building Materials in Terms of Natural Radioactivity. ZN SGSP 2023, 1, 211–231. [Google Scholar] [CrossRef]
  62. Beretka, J.; Matthew, P.J. Natural Radioactivity of Australian Building Materials, Industrial Wastes and by-Products. Health Phys. 1985, 48, 87–95. [Google Scholar] [CrossRef]
  63. Feng, T.; Lu, X. Natural Radioactivity, Radon Exhalation Rate and Radiation Dose of Fly Ash Used as Building Materials in Xiangyang, China. Indoor Built Environ. 2015, 25, 626–634. [Google Scholar] [CrossRef]
  64. ISO 18589-1:2019; Measurement of Radioactivity in the Environment—Soil, Part 1: General Guidelines and Definitions. ISO: Geneva, Switzerland, 2019. Available online: https://www.iso.org/standard/71210.html (accessed on 3 January 2025).
  65. Abdullahi, S.; Ismail, A.F.; Samat, S. Determination of Indoor Doses and Excess Lifetime Cancer Risks Caused by Building Materials Containing Natural Radionuclides in Malaysia. Nucl. Eng. Technol. 2019, 51, 325–336. [Google Scholar] [CrossRef]
  66. Ahmed, R. Estimation of Excess Lifetime Cancer Risk and Radiation Hazard Indices in Southern Iraq. Environ. Earth Sci. 2017, 76, 303. [Google Scholar]
  67. Loan, T.T.H.; Ba, V.N.; Thien, B.N. Natural Radioactivity Level in Fly Ash Samples and Radiological Hazard at the Landfill Area of the Coal-Fired Power Plant Complex, Vietnam. Nucl. Eng. Technol. 2022, 54, 1431–1438. [Google Scholar] [CrossRef]
  68. Oladele, B.B.; Arogunjo, A.M.; Aladeniyi, K. Indoor and Outdoor Gamma Radiation Exposure Levels in Selected Residential Buildings across Ondo State, Nigeria. Int. J. Radiat. Res. 2018, 16, 363–370. [Google Scholar]
  69. Smetsers, R.C.G.M.; Tomas, J.M. A Practical Approach to Limit the Radiation Dose from Building Materials Applied in Dwellings, in Compliance with the Euratom Basic Safety Standards. J. Environ. Radioact. 2019, 196, 40–49. [Google Scholar] [CrossRef]
  70. Gezer, F.; Turhan, Ş.; Ufuktepe, Y. Radiometric Analysis of Micas Used in Many Industries and Evaluation of Radiological Hazards. Radiochim. Acta 2021, 109, 643–651. [Google Scholar] [CrossRef]
  71. Turhan, Ş.; Jamasali, Y. Evaluation of Radiological Health Risk Caused by the Use of Fly Ash in Cement and Concrete Production and Its Storage. Int. J. Environ. Health Res. 2024, 34, 3256–3271. [Google Scholar] [CrossRef]
  72. Kurnaz, A.; Turhan, Ş.; Metin, O.; Altıkulaç, A.; Duran, C. Evaluation of Terrestrial Radionuclide Levels and Concomitant Radiological Risks of Bentonites Used in Many Industries. Int. J. Environ. Health Res. 2023, 33, 1706–1715. [Google Scholar] [CrossRef]
  73. Righi, S.; Bruzzi, L. Natural Radioactivity and Radon Exhalation in Building Materials Used in Italian Dwellings. J. Environ. Radioact. 2006, 88, 158–170. [Google Scholar] [CrossRef] [PubMed]
  74. Loan, T.T.H.; Ba, V.N.; Van Thai Bang, N.; Thy, T.H.N.; Hong, H.T.Y.; Huy, N.Q. Natural Radioactivity and Radiological Health Hazard Assessment of Chemical Fertilizers in Viet Nam. J. Radioanal. Nucl. Chem. 2018, 316, 111–117. [Google Scholar] [CrossRef]
  75. Abojassim, A.; Mraity, H.; Husain, A.; Wood, M. Estimation of the Excess Lifetime Cancer Risk from Radon Exposure in Some Buildings of Kufa Technical Institute, Iraq. Nucl. Phys. At. Energy 2017, 18, 276–286. [Google Scholar] [CrossRef]
  76. Fardy, J.J.; McOrist, G.D.; Farrar, Y.J. Neutron Activation Analysis and Radioactivity Measurements of Australian Coals and Fly Ashes. J. Radioanal. Nucl. Chem. Artic. 1989, 133, 217–226. [Google Scholar] [CrossRef]
  77. Paul, D.; Haydar, M.A.; Hasan, M.; Ali, M.; Paul, D.; Haydar, M.; Islam, S. Natural Radioactivity and Assessment of Associated Radiation Hazards in Soil and Water Samples Collected from in and around of the Barapukuria 2 × 125 MW Coal Fired Thermal Power Plant, Dinajpur, Bangladesh. J. Nucl. Part. Phys. 2014, 4, 17–24. [Google Scholar] [CrossRef]
  78. Asaduzzaman, K.; Mannan, F.; Khandaker, M.; Farook, M.; Elkezza, A.; Amin, Y.; Sharma, S.; Abu Kassim, H. Assessment of Natural Radioactivity Levels and Potential Radiological Risks of Common Building Materials Used in Bangladeshi Dwellings. PLoS ONE 2015, 10, e0140667. [Google Scholar] [CrossRef]
  79. Fungaro, D.; Silva, P.; Campello, F.; Da Silva, C.; Izidoro, J. Evaluation of Radionuclide Contamination of Soil, Coal Ash and Zeolitic Materials from Figueira Thermoelectric Power Plant. Braz. J. Radiat. Sci. 2019, 7, 1–18. [Google Scholar] [CrossRef]
  80. Lu, X.; Jia, X.; Wang, F. Natural Radioactivity of Coal and Its By-Products in the Baoji Coal-Fired Power Plant, China. Curr. Sci. 2006, 91, 1508–1511. [Google Scholar]
  81. Lu, X.; Li, L.Y.; Wang, F.; Wang, L.; Zhang, X. Radiological Hazards of Coal and Ash Samples Collected from Xi’an Coal-Fired Power Plants of China. Environ. Earth Sci. 2012, 66, 1925–1932. [Google Scholar] [CrossRef]
  82. Sofilić, T.; Barišiae, D.; Sofiliae, U.; Ðurokoviae, M. Radioactivity of Some Building and Raw Materials Used in Croatia. Pol. J. Chem. Technol. 2011, 13, 23–27. [Google Scholar] [CrossRef]
  83. Vaasma, T.; Loosaar, J.; Gyakwaa, F.; Kiisk, M.; Özden, B.; Tkaczyk, A.H. Pb-210 and Po-210 Atmospheric Releases via Fly Ash from Oil Shale-Fired Power Plants. Environ. Pollut. 2017, 222, 210–218. [Google Scholar] [CrossRef]
  84. Vaasma, T.; Loosaar, J.; Kiisk, M.; Tkaczyk, A.H. Radionuclide Concentration Variations in the Fuel and Residues of Oil Shale-Fired Power Plants: Estimations of the Radiological Characteristics over a 2-Year Period. J. Environ. Radioact. 2017, 173, 25–33. [Google Scholar] [CrossRef] [PubMed]
  85. Vaasma, T.; Kiisk, M.; Meriste, T.; Tkaczyk, A.H. The Enrichment of Natural Radionuclides in Oil Shale-Fired Power Plants in Estonia—The Impact of New Circulating Fluidized Bed Technology. J. Environ. Radioact. 2014, 129, 133–139. [Google Scholar] [CrossRef] [PubMed]
  86. Smith, K.R.; Crockett, G.M.; Oatway, W.B. Radiological Impact on the UK Population of Industries Which Use or Produce Materials Containing Enhanced Levels of Naturally Occurring Radionuclides Part I: Coal-Fired Electricity Generation; NRBP: Chilton, UK, 2001; p. 87. [Google Scholar]
  87. Papastefanou, C. Radioactivity of Coals and Fly Ashes. J. Radioanal. Nucl. Chem. 2008, 275, 29–35. [Google Scholar] [CrossRef]
  88. Karangelos, D.J.; Petropoulos, N.P.; Anagnostakis, M.J.; Hinis, E.P.; Simopoulos, S.E. Radiological Characteristics and Investigation of the Radioactive Equilibrium in the Ashes Produced in Lignite-Fired Power Plants. J. Environ. Radioact. 2004, 77, 233–246. [Google Scholar] [CrossRef]
  89. Papastefanou, C. Radiological Impact from Atmospheric Releases of 226Ra from Coal-Fired Power Plants. J. Environ. Radioact. 1996, 32, 105–114. [Google Scholar] [CrossRef]
  90. Papaefthymiou, H.; Symeopoulos, B.; Soupioni, M. Neutron Activation Analysis and Natural Radioactivity Measurements of Lignite and Ashes from Megalopolis Basin, Greece. J. Radioanal. Nucl. Chem. 2007, 274, 123–130. [Google Scholar] [CrossRef]
  91. Papastefanou, C. Escaping Radioactivity from Coal-Fired Power Plants (CPPs) Due to Coal Burning and the Associated Hazards: A Review. J. Environ. Radioact. 2010, 101, 191–200. [Google Scholar] [CrossRef]
  92. Petropoulos, N.P.; Anagnostakis, M.J.; Simopoulos, S.E. Photon Attenuation, Natural Radioactivity Content and Radon Exhalation Rate of Building Materials. J. Environ. Radioact. 2002, 61, 257–269. [Google Scholar] [CrossRef]
  93. Kardos, R.; Sas, Z.; Hegedűs, M.; Shahrokhi, A.; Somlai, J.; Kovács, T. Radionuclide Content of NORM By-Products Originating from the Coal-Fired Power Plant in Oroszlány (Hungary). Radiat. Prot. Dosim. 2015, 167, 266–269. [Google Scholar] [CrossRef]
  94. Kumar, V.; Ramachandran, T.V.; Prasad, R. Natural Radioactivity of Indian Building Materials and By-Products. Appl. Radiat. Isot. 1999, 51, 93–96. [Google Scholar] [CrossRef] [PubMed]
  95. Mishra, U.C. Relative Radiation Hazards of Coal Based and Nuclear Power Plants; International Atomic Energy Agency (IAEA): Vienna, Austria, 1983; pp. 1–5. [Google Scholar]
  96. Singh, L.M.; Kumar, M.; Sahoo, B.K.; Sapra, B.K.; Kumar, R. Study of Natural Radioactivity, Radon Exhalation Rate and Radiation Doses in Coal and Flyash Samples from Thermal Power Plants, India. Phys. Procedia 2015, 80, 120–124. [Google Scholar] [CrossRef]
  97. Lalit, B.Y.; Ramachandran, T.V.; Mishra, U.C. Radiation Exposures Due to Coal-Fired Power Stations in India. Radiat. Prot. Dosim. 1986, 15, 197–202. [Google Scholar] [CrossRef]
  98. Vig, N.; Mor, S.; Khaiwal, R. The Multiple Value Characteristics of Fly Ash from Indian Coal Thermal Power Plants: A Review. Environ. Monit. Assess. 2022, 195, 33. [Google Scholar] [CrossRef]
  99. Jalil, S.; Rashid, M. Analysis of Natural Radioactivity in Coal and Ashes from a Coal Fired Power Plant. Chem. Eng. Trans. 2015, 45, 1549–1554. [Google Scholar] [CrossRef]
  100. Ademola, J.; Onyema, U. Assessment of Natural Radionuclides in Fly Ash Produced at Orji River Thermal Power Station, Nigeria and the Associated Radiological Impact. Nat. Sci. 2014, 6, 752–759. [Google Scholar] [CrossRef]
  101. Fidanchevski, E.; Angjusheva, B.; Jovanov, V.; Murtanovski, P.; Vladiceska, L.; Aluloska, N.S.; Nikolic, J.K.; Ipavec, A.; Šter, K.; Mrak, M.; et al. Technical and Radiological Characterisation of Fly Ash and Bottom Ash from Thermal Power Plant. J. Radioanal. Nucl. Chem. 2021, 330, 685–694. [Google Scholar] [CrossRef]
  102. Jankovic, M.; Todorovic, D.; Nikolic, J. Analysis of Natural Radionuclides in Coal, Slag and Ash in Coal-Fired Power Plants in Serbia. J. Min. Metall. Sect. B Metall. 2011, 47, 149–155. [Google Scholar] [CrossRef]
  103. Ignjatović, I.; Sas, Z.; Dragaš, J.; Somlai, J.; Kovács, T. Radiological and Material Characterization of High Volume Fly Ash Concrete. J. Environ. Radioact. 2017, 168, 38–45. [Google Scholar] [CrossRef]
  104. Charro, E.; Peña, V. Environmental Impact of Natural Radionuclides from a Coal-Fired Power Plant in Spain. Radiat. Prot. Dosim. 2013, 153, 485–495. [Google Scholar] [CrossRef]
  105. Turhan, Ş.; Parmaksız, A.; Köse, A.; Yüksel, A.; Arıkan, İ.H.; Yücel, B. Radiological Characteristics of Pulverized Fly Ashes Produced in Turkish Coal-Burning Thermal Power Plants. Fuel 2010, 89, 3892–3900. [Google Scholar] [CrossRef]
  106. Van Duong, P.; Thanh, V.T.; Dien, P.Q. Nguyen Thanh Binh Application of Nuclear Activation Analysis (NAA) and Low-Level Gamma Counting to Determine the Radionuclide and Trace Element-Pollutant Releases from Coal-Fired Power Plants in Vietnam. Sci. Total Environ. 1995, 173–174, 339–344. [Google Scholar] [CrossRef]
  107. Taylor-Lange, S.C.; Juenger, M.C.G.; Siegel, J.A. Radon Emanation Fractions from Concretes Containing Fly Ash and Metakaolin. Sci. Total Environ. 2014, 466–467, 1060–1065. [Google Scholar] [CrossRef] [PubMed]
  108. Nuccetelli, C.; Pontikes, Y.; Leonardi, F.; Trevisi, R. New Perspectives and Issues Arising from the Introduction of (NORM) Residues in Building Materials: A Critical Assessment on the Radiological Behaviour. Constr. Build. Mater. 2015, 82, 323–331. [Google Scholar] [CrossRef]
  109. Lauer, N.; Vengosh, A.; Dai, S. Naturally Occurring Radioactive Materials in Uranium-Rich Coals and Associated Coal Combustion Residues from China. Environ. Sci. Technol. 2017, 51, 13487–13493. [Google Scholar] [CrossRef]
Figure 1. Radionuclide (Thorium—left panel; Radium—middle panel; Potassium—right panel) activity concentration depending on the capacity of the plant.
Energies 18 03010 g001
Figure 2. Radionuclide activity concentration depending on plant capacity (PCA biplot). PC1, PC2—the first two components, which explain about 80.7% of the variability.
Energies 18 03010 g002
Figure 3. Radionuclide activity concentration depending on plant capacity (NMDS ordination). NMDS1, NMDS2—the primary axes resulting from Non-Metric Multidimensional Scaling. The purple ellipse represents the 95% confidence ellipse for group S1, illustrating the statistical spread and variability of its samples in the NMDS ordination space.
Energies 18 03010 g003
Figure 4. Raeq values divided by the variable “Size”. Dashed line—370 Bq kg−1, the maximum value allowed in building materials.
Energies 18 03010 g004
Table 1. Values of Raeq, Hex, and Hin divided by the variable “Size”.
Plant SizeTotal
S1S2S3S4
MinMaxMedMinMaxMedMinMaxMedMinMaxMedMinMaxMed
Raeq (Bq kg−1)20.950332644.757533018044832026242032420.9548321.2
Hex0.071.710.141.91.020.521.510.841.31.010.071.931.002
Hin0.082.11.220.172.61.250.5821.231.041.61.230.82.561.23
Abbreviations: Min: minimum, Max: maximum, Med: median.
Table 2. Values of dose rates (D, Din, Dout, Eef, Eout, Ein, IAED), Activity Concentration Index (ACI), and Alpha Index (AI) divided by the variable “Size”.
Size DDinDoutEefEinEoutIAEDACIAI
Unit(nGy h−1)(mSv y−1)--
S1Min9.5118.29.260.0120.0890.0110.0851.620.044
Max231.0448.0224.00.2842.200.2742.1034.31.45
Med149.0285.0146.00.1831.400.1791.3314.60.644
SD64.0123.062.00.0790.6060.0760.57810.10.389
S2Min19.938.019.20.0240.1860.0240.1778.660.082
Max264.0514.0254.00.3242.520.3122.42529.01.87
Med151.0289.0148.00.1861.420.1811.35174.00.667
SD35.468.734.10.0430.3370.0420.323107.00.283
S3Min89.7173.088.70.1100.8490.1090.797288.00.177
Max203.0392.0195.00.2491.920.2401.841267.01.36
Med147.0282.0143.00.1801.380.1751.31627.00.678
SD9.9318.99.490.0120.0930.1170.089182.00.078
S4Min117.0224.0113.00.1431.100.1391.05772.00.486
Max194.0372.0188.00.2371.820.2311.731334.01.00
Med150.0287.0146.00.1841.410.1791.34997.00.640
SD14.027.213.50.0170.1330.0171.128104.00.132
TotalMin9.5118.219.260.0120.0890.0110.0851.620.044
Max264.3514.4254.40.3242.520.3122.421334.01.87
Med147.5282.9143.60.1811.390.1761.32508.00.672
SD24.046.523.180.0290.2330.0280.218306.00.182
Table 3. Indoor (ELCRin), outdoor (ELCRout), and external (ELCRext) excess lifetime cancer risks, divided by the variable “Size”.
S1S2S3S4Total
MinMaxMedMinMaxMedMinMaxMedMinMaxMedMinMaxMed
UnitmSv−1 × 10⁻³
ELCRin0.48910.36.841.3548.017.323.697.748.858.099.474.00.48999.440.4
ELCRout0.0621.280.8720.1695.942.212.9812.26.197.3212.69.430.06212.65.13
ELCRext0.55111.67.721.5254.019.526.6110.055.065.3112.083.50.551112.045.5
Table 4. Review of the activity concentrations of chosen radionuclides worldwide.
Country
[Reference]
Plant
Capacity
Activity Concentration (Bq kg−1)Remarks
226Ra232Th40K238U
Australia [76]-59–11057–130170–61564–114-
Bangladesh [77]250 MW70.9115.3205.5--
Bangladesh [78]-117.8157.31463.3--
Belgium [19]2 units 500 MW total590–1100---FA in chimney
160–185FA caught by electro-filters
Brazil [28]10 MW1442–377343–124471–9681459–5198-
Brazil [79]162 MW66180489867.5210Pb: 806; 228Ra: 67
China [63]2000 MW90.3–165.683.9–145.6309.0–593.2-Exhalation rate (Eh) (Bqm−2 h−1): 4.7–20.5
-136.5–189.9123.6–202.4176.5–278.6-
China [80]660 MW76.1–165.7118.7–195.6261.5–520.8-
China [81]850 MW60.5–131.861.5–164.6155.9–316.1-Raeq: 169.3–384.0
900 MW46.4–148.059.3–153.9123.3–343.0Raeq: 139.7–388.6
Croatia [82]-53.354.4361.7-Raeq: 158.9
Estonia [83,84,85]2030 MW-12–2640050228Ra: 50
Great Britain [86]-40–70----
Greece [87]-142–605-204–382263–950228Ra: 27–68
210Pb: 133–428
Greece [88]4 units 850 MW total794–102850–55403–516899–1051210Pb: 1028–1322
Greece [89]600 MW142–165----
620 MW193–299
1200 MW430–495
1200 MW570–605
Greece [90]550 MW102059.1447998
Greece [91]-36650297
Greece [92]-273–137741–65143–661
Hungary [93]324 MW17855387-I-index (activity index): 1.00
India [17]2920 MW58.289.2301.2--
2100 MW84.198.8297.1
1720 MW83.1102.5334.1
1320 MW78.489.1362.7
1050 MW76.387.5288.1
840 MW81.8–177.3111.6–178.5365.9–495.9
810 MW78.586.5278.1
705 MW75.588.1286.4
460 MW79.296.3291.6
India [22]-60.7–105.719.8–125.143.6–199.867.3–116.2
India [94]1270 MW45.139.988.4 Raeq: 109.2
India [95]480 MW150.0133.2340.4-
India [95]600 MW865.8107.355.5
India [96]135 MW18.90–26.1226.65–44.55532.3–929.5-Raeq: 95.23–136.19
705 MW19.33–48.5618.89–87.60419.2–695.0Raeq: 92.60–175.96
India [97]4200 MW59.295.1507.0--
3390 MW64.0126.9370.0
1350 MW126.9138.0279.0
338 MW70.3118.4252.0
210 MW49.2106.2329.3
30 MW64126.9370.0
India [20]1260 MW111.4140.2350.7--
350 MW97.3107.5315.8
215 MW126.9106.3321.8
India [98]1260 MW695103342-
Kosovo [29]910 MW3030133-
Malaysia [99]2100 MW4844299-Raeq: 135; Hex: 0.40
Malaysia [54]3100 MW-50.2–134.57327.54–1114.4067.54–189.18Raeq (Bq kg−1):
Th: 467.42
K: 429.09
U: 164.55
Malaysia [53]2420 MW27.42134.41321.65152.71232U: 157.71
Nigeria [100]30 MW4149321--
Pakistan [50]-50.170.1533 -
Poland [26]-54.2–119.347.5–91.5448.5–758.094.0–184.6210Pb: 43.5–264.3
Republic of North Macedonia [101]675 MW143116719--
Serbia [102]1650 MW -Raeq: 182–308; Hex: 0.68
1360 MW Raeq: 105–152; Hex: 0.33
1240 MW Raeq: 102–325; Hex: 0.64
299 MW12072360Raeq: 170–316; Hex: 0.63
120 MW Raeq: 164–405; Hex: 0.68
Serbia [18]1650 MW114.4–118.8----
Serbia [103]1240 MW9066240 -
Spain [104]400 MW12888860--
Turkey [25]1355 MW291–853----
Turkey [51]457 MW24.6–899.718.2–47.2270.2–436.5-Raeq: 71.85–1000.76
Annual effective dose equivalent (mSv y−1): 42.02–532.12
Turkey [105]190 MW47.2–186.010.4–138.6123.0–815.0--Raeq: 72.5–400.6
210 MW87.0–575.975.0–212.028.0–2057.0Raeq: 269.1–812.1
300 MW20.0–229.050.0–217.090.0–2532.3Raeq: 158.4–665.4
320 MW103.4–248.055.3–113.084.7–342.6Raeq: 208.8–414.9
420 MW182.1–906.29.0–96.0112.0–1244.0Raeq: 212.0–968.3
429 MW117.0–790.0105.5–2740.025.3–2349.0Raeq: 374.4–1090.0
457 MW156.0–272016.0–158.098.0–1978.0Raeq: 259.8–2760.9
620 MW17.0–476.010.1–155.517.0–850.0Raeq: 51.9–684.2
630 MW341.0–1142.09.0–141.075.0–484.0Raeq: 376.1–1201.0
630 MW63.0–992.040.5–696.012.0–2062.0Raeq: 255.0–1710.5
1034 MW23.0–2398.038.0–279.013.4–2974.0Raeq: 187.6–2630.1
1320 MW70.0–166.048.0–204.0195.0–695.0Raeq: 174.9–402.7
1360 MW234.0–1245.011.0–127.061.0–1613.0Raeq: 254.4–1382.5
1440 MW117.0–431.110.0–77.065.7–371.5Raeq: 143.3–518.9
Vietnam [67]4244 MW779293893Radon dose: 5.27
Indoor external: 1.22
Internal: 0.16
Total effective dose equivalent: 6.65 mSv y−1
Vietnam [106]1040 MW14.3–37.583–461523–673--
330 MW11.0–30.370–370450–920
USA [107]-100–20023–125112–315--
EU average [108]-20780564--
World aver. [51]-3245420-Raeq: 370
Disclaimer/Publisher’s Note: The statements, opinions and data contained in all publications are solely those of the individual author(s) and contributor(s) and not of MDPI and/or the editor(s). MDPI and/or the editor(s) disclaim responsibility for any injury to people or property resulting from any ideas, methods, instructions or products referred to in the content.

