Article

Ground Heat Exchangers from Artificial Ground-Freezing Probes for Tunnel Excavations

by
Fawad Ahmed
1,
Nicola Massarotti
1,*,
Alessandro Mauro
2 and
Gennaro Normino
1
1
Department of Engineering, University of Naples “Parthenope”, Isola C4, Centro Direzionale, 80143 Naples, Italy
2
Department of Engineering, University of Campania Luigi Vanvitelli, Via Roma 29, 81031 Aversa, Italy
*
Author to whom correspondence should be addressed.
Energies 2025, 18(11), 2965; https://doi.org/10.3390/en18112965
Submission received: 14 May 2025 / Revised: 29 May 2025 / Accepted: 30 May 2025 / Published: 4 June 2025

Abstract

:
Ground-source heat pumps (GSHPs), despite their high efficiencies, are still not as cost-effective as air-source heat pumps, especially in urban environments, due to the necessity of drilling/excavation. Integrating GSHPs into existing geo-structures, such as underground tunnels, can play a vital role in reducing the overall costs of GSHP systems and promoting their use in cities. Tunnels can be realized through artificial ground freezing (AGF) by using probes for circulating the freezing fluid, which are left in the ground once the tunnel is completed. The novelty of the present work lies in the proposal of a sustainable reuse of AGF probes as ground heat exchangers (GHEs). The idea of converting AGF probes is both sustainable and cost-effective for GSHPs, as it can reduce installation costs by eliminating the drilling/excavation process. A test was performed for the first time in the Piazza Municipio metro station in Naples, Southern Italy, where several AGF probes, initially used for the construction of two tunnels, have then been converted into GHEs. The probes have been connected to a testing device called the energy box. The experiments included testing the heat transfer in the recovered AGF probes through cooling and heating operations. This work presents a numerical simulation of a test that has been validated against experimental results.

1. Introduction

The need to work and live in comfortable indoor environments with heating and cooling technologies is related to increasing energy consumption and environmental impact. Around 50% of the energy produced is consumed by such technologies, and in Europe, heating alone consumes 63% of the energy produced [1]. The use of fuels for energy production accounts for 30% of global greenhouse gas (GHG) emissions [2]. The many impacts associated with rising GHG emissions include climate change, sea level rise, extreme weather events, and ocean acidification [3]. The European Green Deal (EGD) aims to achieve carbon neutrality by 2050, including a 30% reduction in greenhouse gas emissions by 2030 compared to the 1990 levels [4]. In addition to reducing GHG emissions, the use of renewable energy is necessary to reduce dependence on fossil fuels, as at present, technologies running on conventional fuels are meeting most of the global energy demand [5]. Even though heating is more relevant in the European energy sector, as it still represents the largest contributor to energy consumption, the need for cooling will increase due to global warming. Therefore, the impact of space cooling/heating on energy networks must be reduced by using more efficient technologies.
Various sustainable technologies are being tested around the world to find viable alternatives to conventional heating/cooling. Solar and thermal protection (paint coatings), heat modulation techniques (natural ventilation in buildings), and heat dissipation (roof gardens) can have a good impact on reducing energy consumption in buildings [6], the same can be adopted for livestock farms to reduce their impact on the energy grids [7]. Hybrid green roofs can be used to improve cooling performance through a combination of evaporative cooling and radiation systems [8]. Solar cooling systems can be a substitute for conventional cooling systems [9]. Natural ventilation can be considered to improve the cooling loads of buildings [10]. Similarly, sustainable heating techniques like biomass heating [11,12,13], phase change materials [14], and solar thermal heating systems [15,16,17] are also being studied to reduce the heating loads of buildings in the heating sector. These technologies can reduce cooling/heating loads. However, there will still be the need for cooling the remaining loads.
Heat pumps, thanks to their energy efficiency, have been used because of their versatility of operation for cooling/heating and their reduced GHG emissions [18]. It is also worth noting that heat pumps can integrate different renewable sources to maximize performance [19]. In general, heat pumps can be categorized as ground-source and air-source heat pumps based on the source/sink categorization, which, in the first case, is the ground and, in the second case, is the outside ambient air. Table 1 presents a comparison between GSHP and ASHP in terms of the main factors that affect their employability.
GSHP systems are preferred because of their efficiency, and due to the stable temperature of the source throughout the year, low noise during operation and low maintenance costs. These characteristics are very important for cities. However, the main barrier to market entry for GSHP is the high cost of installation, which accounts for around 50% of the total cost of the system installation [31] and the difficulties of drilling in urban environments.
GSHP can also be connected with a stable temperature source, which can be any geo-structure (energy pile, energy tunnel, or energy wall) through vertical/horizontal loops laid in the ground [33]. From a European perspective, the presence of many geo-structures, such as underground metro tunnels connecting densely populated areas across cities, can be a suitable option for GSHP technology [34] to connect heat pumps to a low-enthalpy ground source for heating and cooling. The use of tunnels with GSHPs has been investigated by several researchers. Revesz et al. [35] studied different possibilities of interaction between underground railway tunnels and GSHPs in London and urged the need for a combined analysis of heat pump and tunnel. Davies et al. [36] also investigated the London Underground as a potential source of low-grade heat for heating and sink for cooling operations. The authors concluded that the system can be utilized for 0.9 MW of cooling, and it can be used to obtain 1.1 MW for heating operation with the help of a heat pump. Tong et al. [37] studied the metro tunnel with small pipes along the walls of the tunnel called capillary heat exchangers (CHE) for air-conditioning and obtained a heat transfer rate of 36.6 W per unit area for a fluid flow rate of 0.05 m/s. Mao et al. [38] performed the dynamic analysis using commercial software to study the combined effect of the hybrid subway-source heat pump system and found that the performance of the subway tunnel can be increased by 2.52% when put into hybrid operation with active and passive systems. In a subway tunnel in Qingdao (China) with CHE, Tong et al. [39] observed the heat transfer capacity per unit area for 7 h. of heating operation in winters was 45–80 W/m2, and for 14 h of cooling operation in summer was 100–110 W/m2. Ji et al. [40] studied the heat transfer performance of a CHE and estimated the average heat flux values at the lining to be 16 and 22 W during the heating and cooling operations, respectively. In another study, Ji et al. [41] analyzed the long-term performance of CHE for subway heat pump systems for 10 years and observed a distinct ‘thermal inertia’ phenomenon with continuous operation when the temperature wave is transmitted to the surrounding rocks of CHE. The authors observed the range for average heat transfer of CHE before and after the critical point and observed that, for the heating season, it was 11% to 46.16%, while for the cooling season, the range was 30.19% to 46.12%. Y. Yu et al. [42] summarized the strategies for the reduction of HVAC energy consumption for underground metro stations. Ji et al. [43] performed a TRNSYS-based study of a subway-source heat pump system (SSHPS) and validated their model against the experimental data to evaluate the long-term performance under varying internal heat source conditions between 0 to 240 W/m. They concluded that an increase in tunnel air temperature with higher heat loads occasionally exceeds the design limits. They recommended the integration of auxiliary systems for improved energy supply reliability. In another study, Ji et al. [44] presented an ANSYS-Fluent R23based numerical analysis of the tunnel lining CHEs in an SSHPS based on a Qingdao demonstration project. They concluded that heat transfer performance was greatly influenced by tunnel air temperature, CHE inlet temperature, and pipe length, while the inlet flow velocity had a minimal effect on CHE systems. The effect of groundwater seepage on the thermal performance of a CHE-based SSHPS was also numerically investigated by Ji et al. [45]. They concluded that high seepage velocity increases the heat exchange capacity by 450% in cooling and 320% in heating operations of CHEs.
Artificial ground freezing (AGF) is a technique used during tunnel construction that involves the circulation of a cryogenic substance. It may also be a cooling fluid, normally liquid nitrogen (LN), to solidify the ground above the excavation region. The schematic of the process is shown in Figure 1.
LN is passed through the copper pipes inserted in the ground above the desired excavation area. The freezing temperature of LN exchanged through copper pipes solidifies the water present in the ground. Because of this, the permeability of that area is reduced, which ultimately reduces the sub-surface water flow during the tunnel excavation [47]. After completion of the excavation, copper pipes are buried in the ground, and the rest of the system is disconnected.
The literature analysis provides evidence of the lack of research concerning the reuse of freezing probes as ground heat exchangers (GHEs). More research efforts are needed on the modeling and testing of such kinds of systems to demonstrate their efficiency.
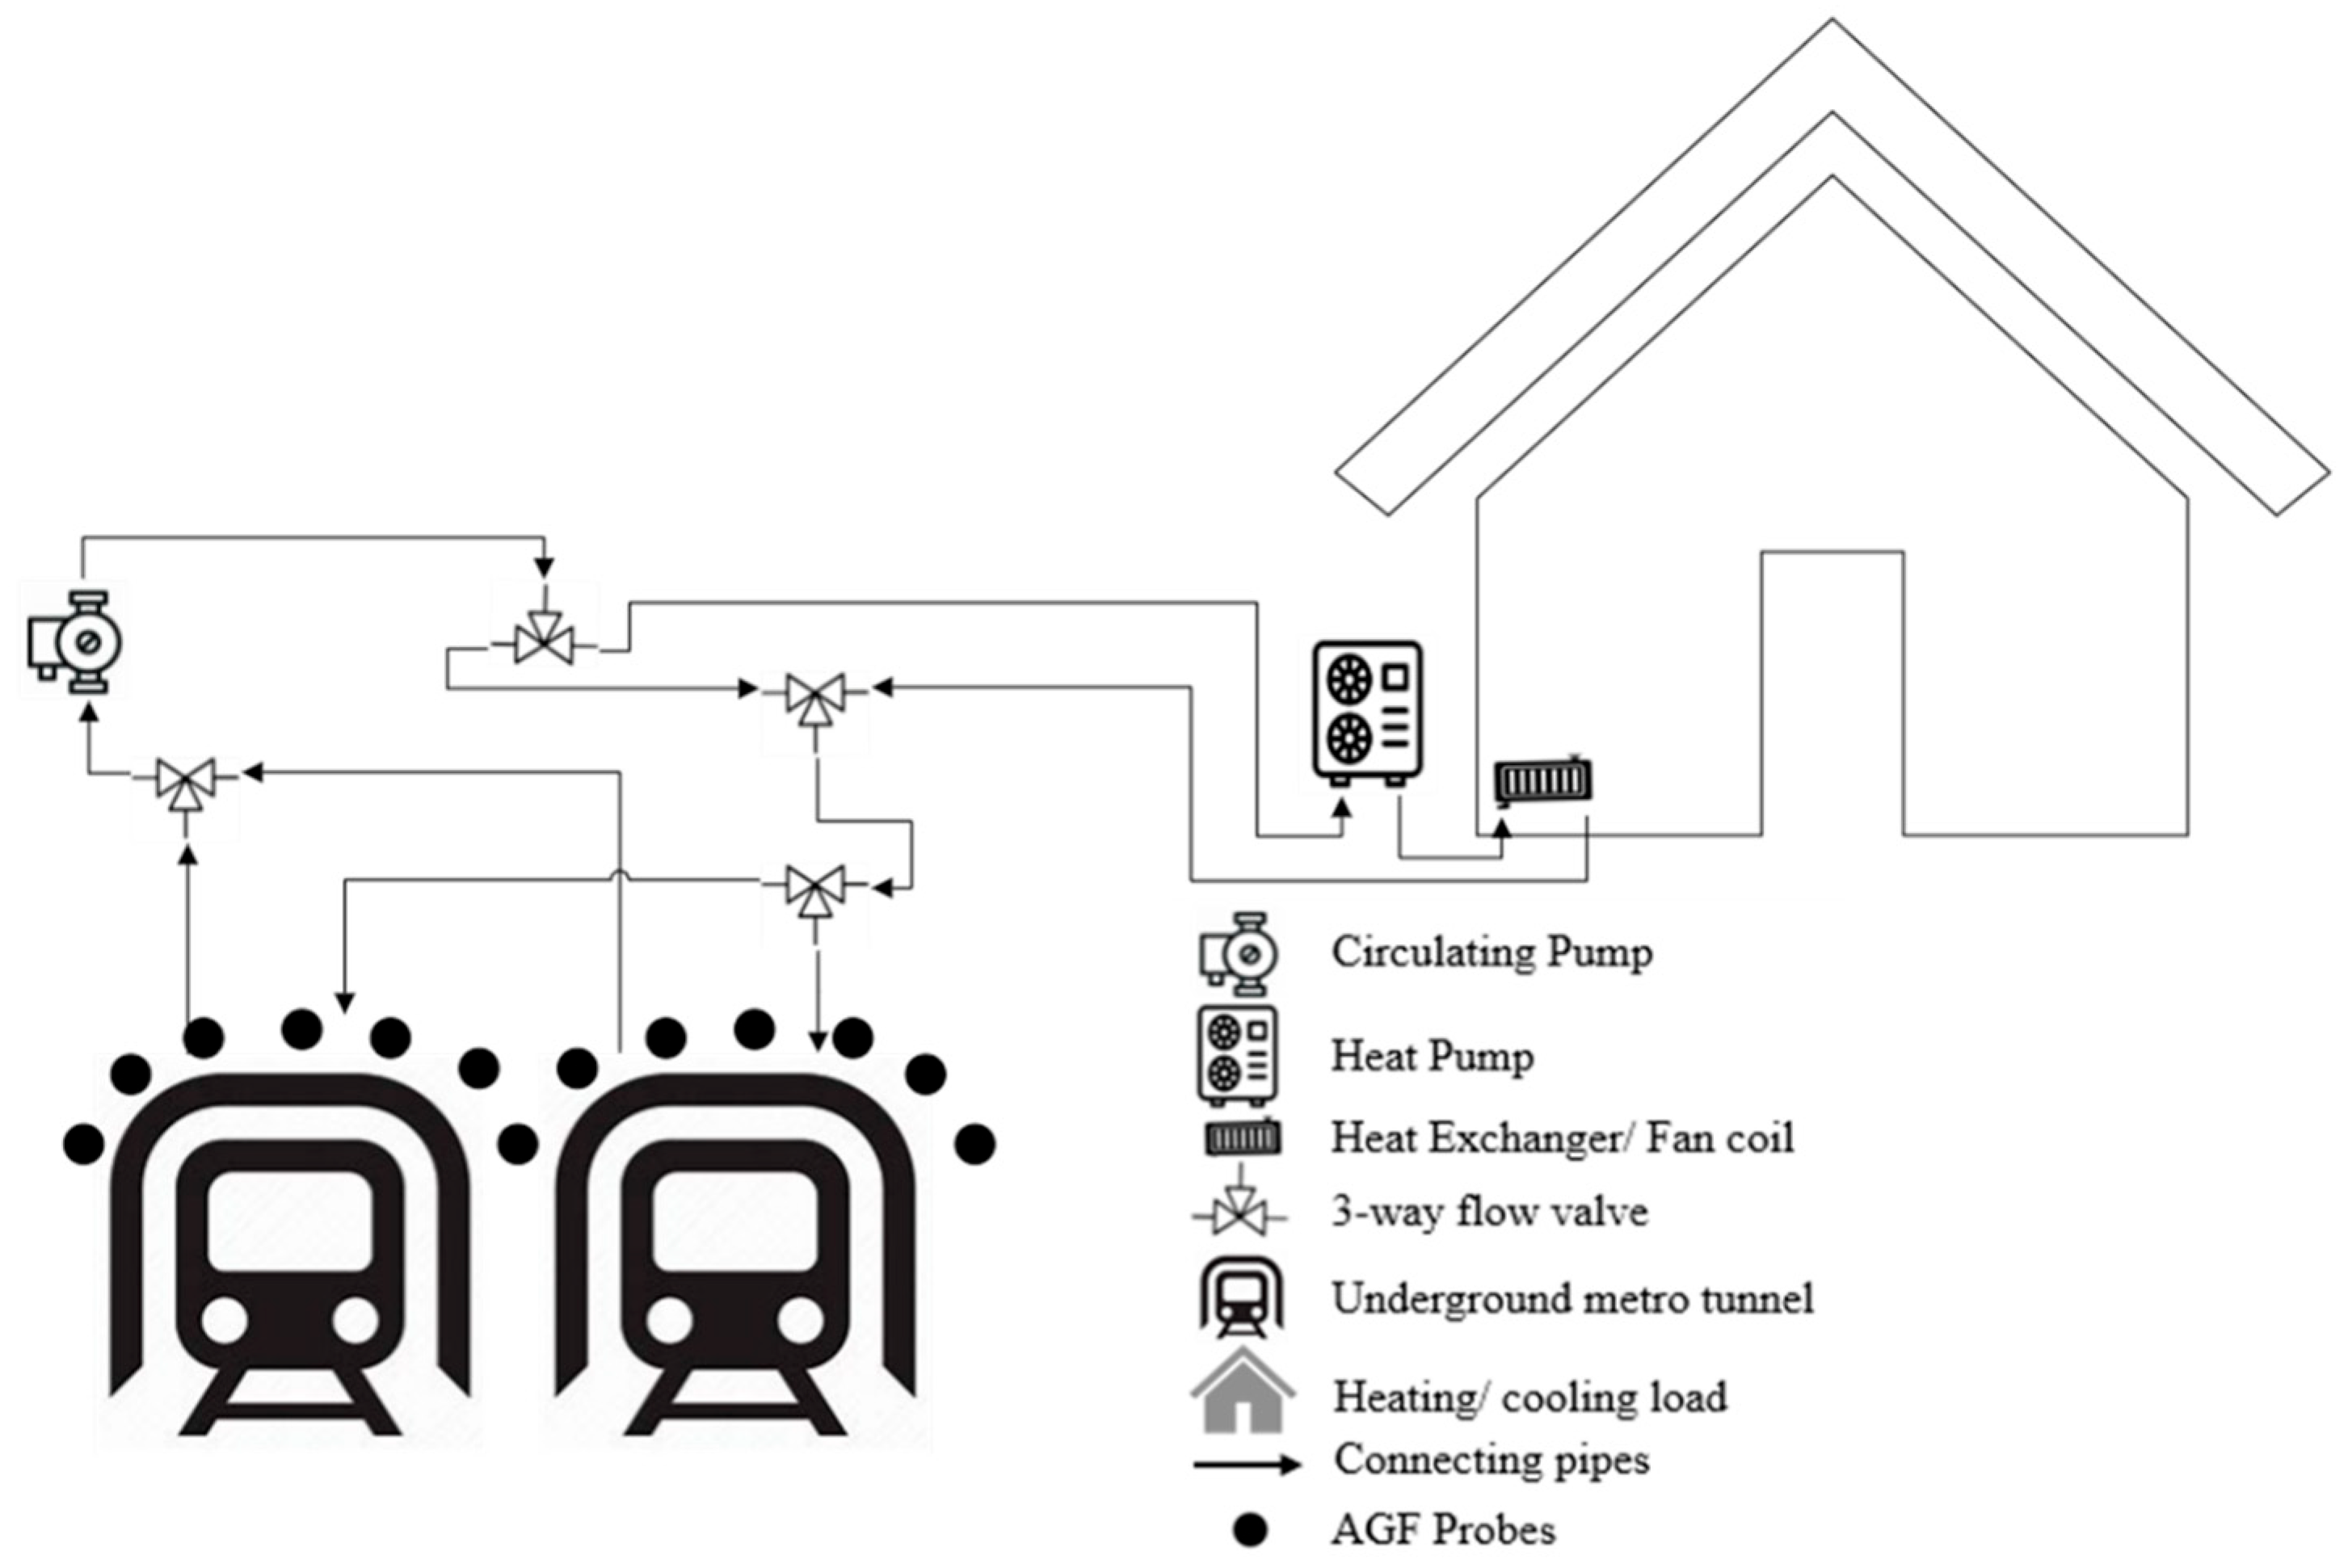
In Napoli, Southern Italy, the Piazza Municipio metro tunnels have been built using the AGF technique [48]. A number of copper probes were laid above the tunnel’s periphery, and LN was circulated in the probes until the groundwater was frozen [49,50]. After completion of the tunnel excavation, the service pipes providing LN2 were disconnected. Instead of burying these AGF probes in the ground, as per practice, these were converted into GHEs to exploit low-enthalpy geothermal energy for demonstration purposes. This paper examines the results of the demonstration for potential use of such ground probes as GHE for the integration of underground metro tunnels with a GSHP system [51]. The approach of converting abandoned AGF probes into GHE is proposed by the authors because of the significant economic impact, since drilling costs can be avoided, and the freezing probes can be effectively reused for a heating/cooling system. This type of innovative application would allow us to avoid about 50% of the cost of the GSHP, which is related to the drilling and installation of the heat exchange probes. The main motivation of the present geothermal system is to propose an alternative option for the installation of a GSHP in densely populated urban areas. The schematic of the system is described in Figure 2.
The experiments carried out by the authors at the underground station of Piazza Municipio metro station in Napoli, Southern Italy, represent a relevant case study of the application of such a sustainable approach to circular economy in the construction sector, by using efficient heating/cooling technology.
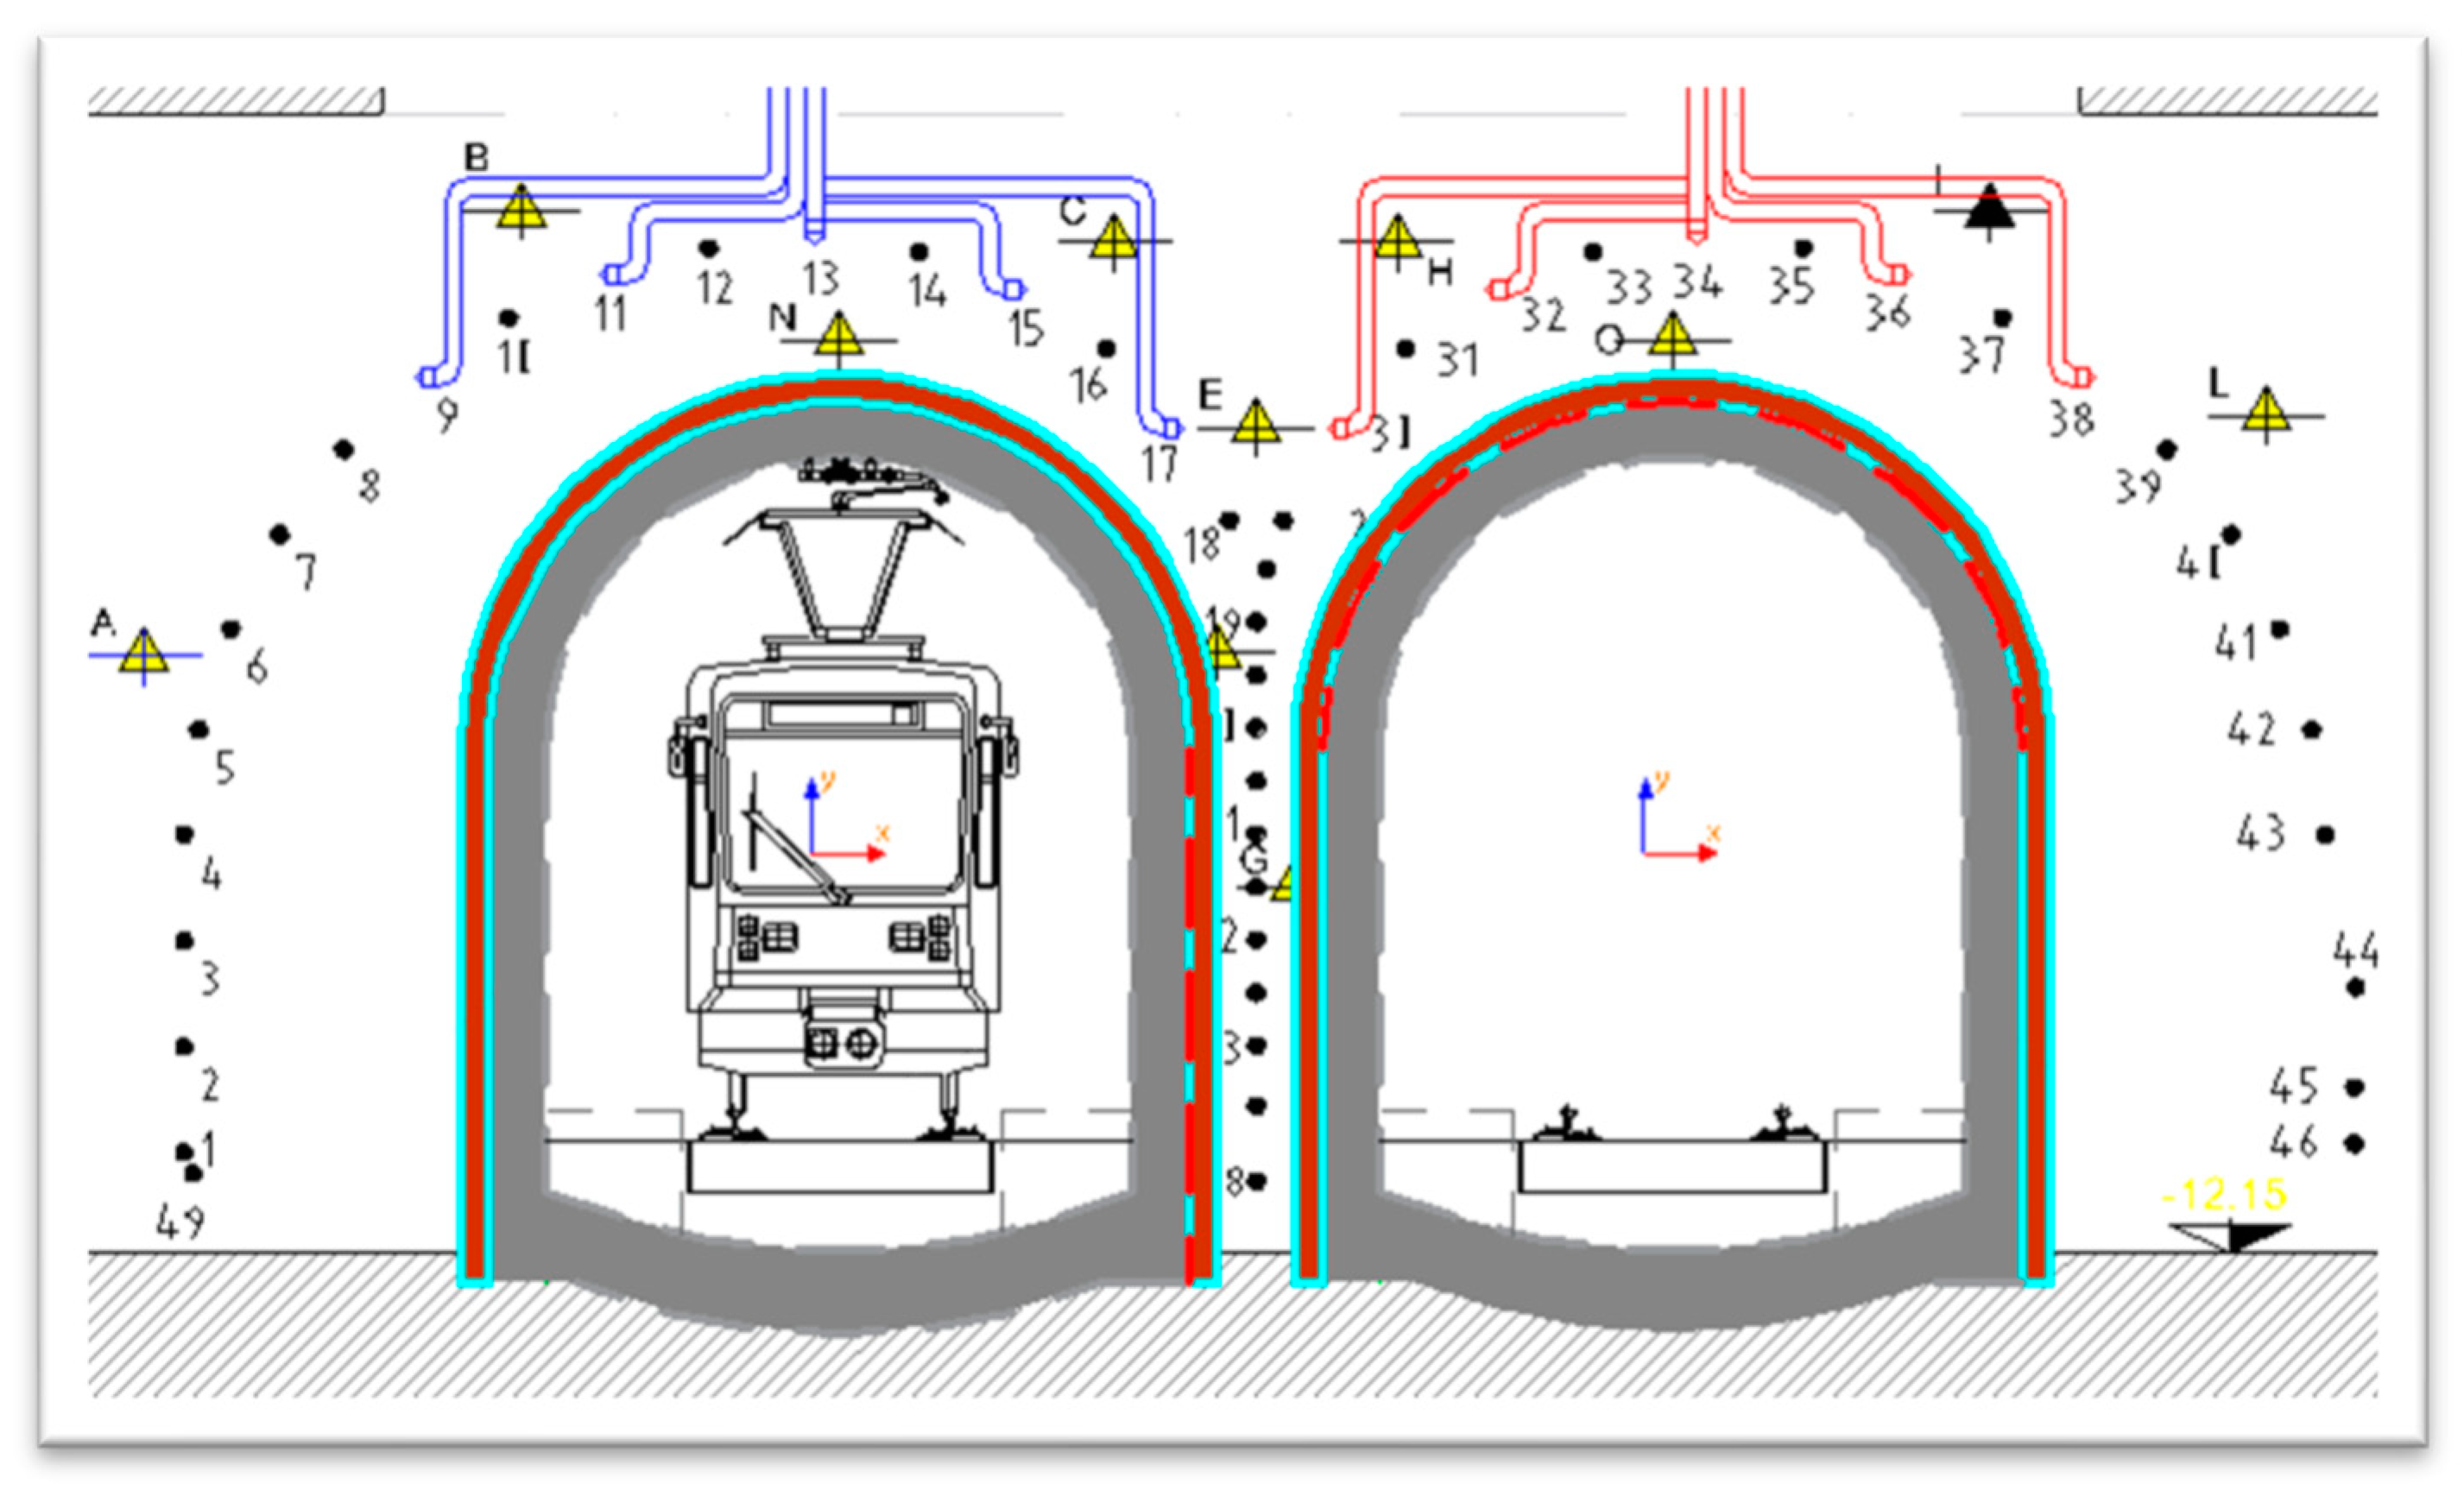
The arrangement of the AGF probes over two tunnels is shown in Figure 3. The probes are numbered from left to right, and eight of them (for the left tunnel probes, 9, 11, 13, 15, and 17, while for the right tunnel, 30, 32, 34, 36, and 38) are converted to test the heat exchange efficiency. The paper discusses the temperature variation and the effect of probes 9, 11, 13, and 15. In particular, the authors have tested the AGF probes used to construct the two tunnels, at a depth of 40 m below the ground surface [49], and developed a numerical model of the converted AGP probes to simulate the heating and cooling scenarios that were tested during the experiments. Section 2 describes the setup and equipment used during the experiments. Section 3 describes the governing equations and introduces the numerical model developed, while Section 4 presents the results and their discussion. Finally, Section 5 draws out the conclusion of the paper and the work that can be carried out in the future.

2. Experiment Setup

AGF technique is used to ease the construction of underground tunnels in many countries around the world [48,52]. Some of the copper AGF tubes, used to solidify the ground around the excavation area by reducing the permeability of the ground for tunnel construction at Piazza Municipio in Southern Italy, are converted into GHEs for these experiments. These pipes were left buried in the ground after the completion of tunnel construction.
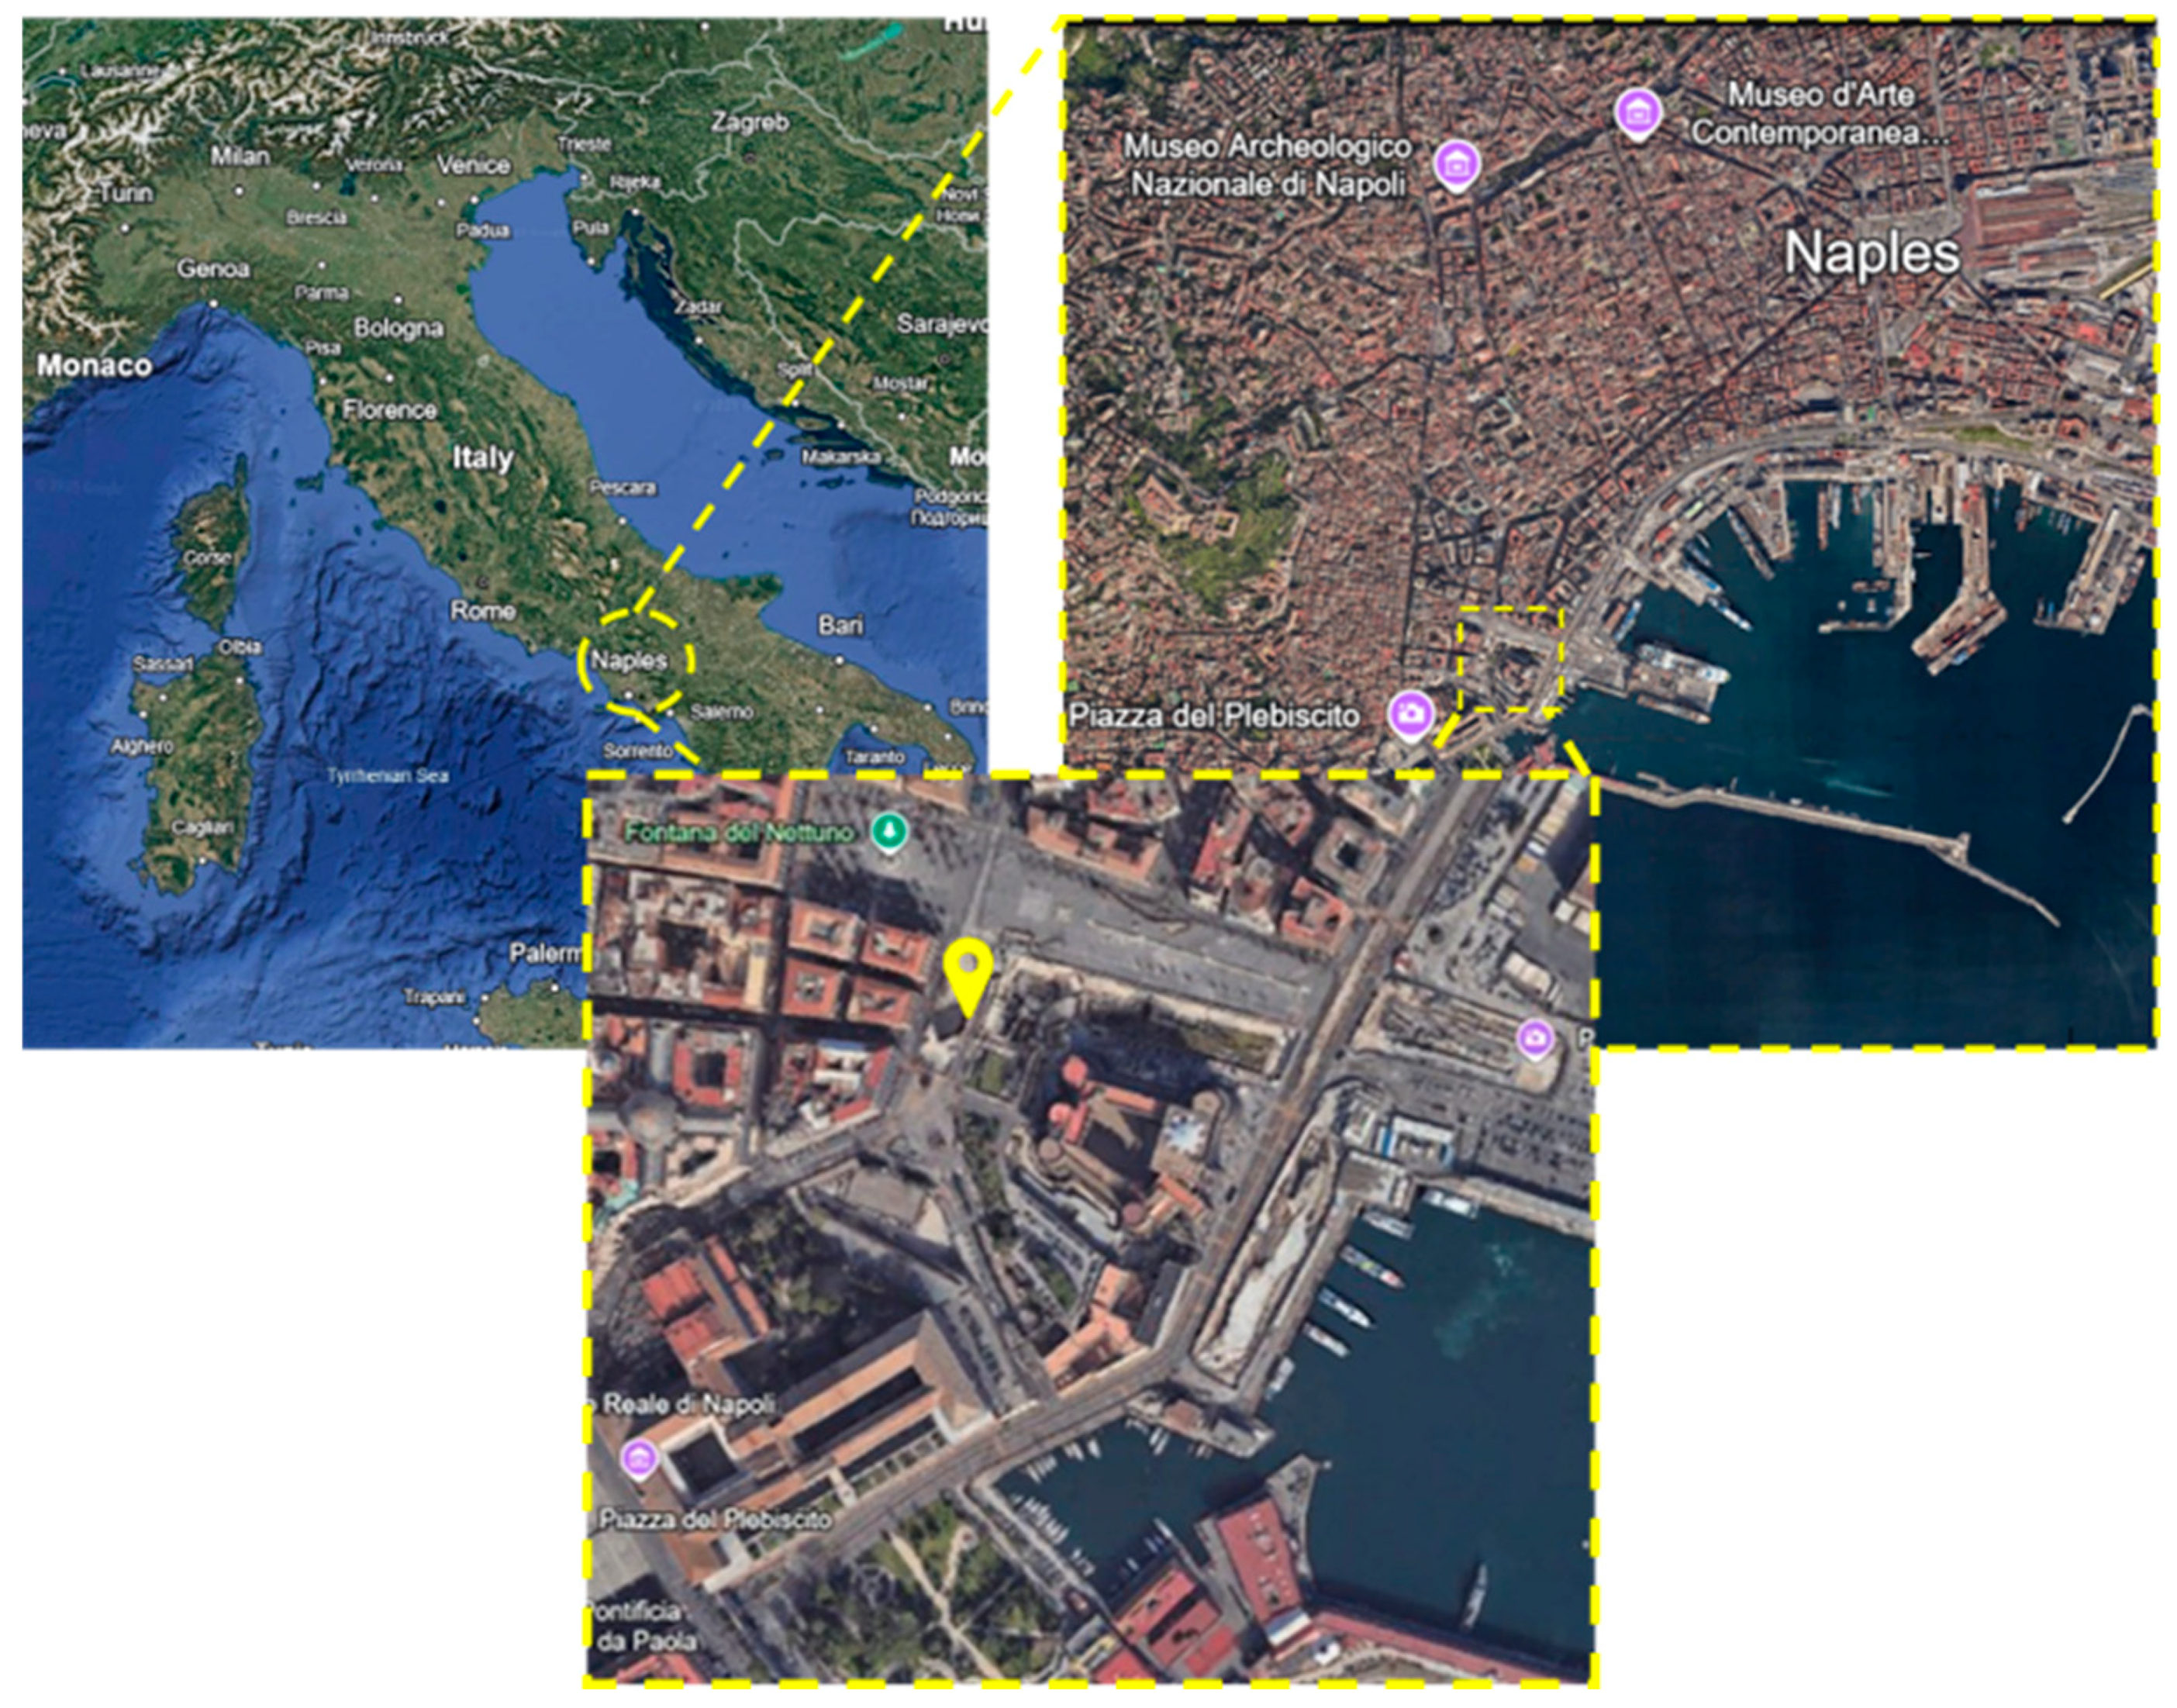
The novelty of the present work lies mainly in the reuse of the AGF probes and their transformation into GHEs that are capable of transferring heat to and from the ground for coupling with the GSHP. A detailed description of the experimental setup is given in this section. The length of the tunnels is about 40 m, and they are located 40 m below the street level. The cross-section of the tunnel is 3 m, and the total height of the tunnel is approximately 7 m. A total of 8 AGF probes were converted into GHEs on both tunnels, as mentioned in Figure 3. The 28 mm copper pipes used during the AGF have been changed to 32 mm HDPE and connected to the manifold, to obtain a coupling with a heat pump placed above the tunnel in a box with auxiliary systems and data acquisition systems, called the energy box. Figure 4 shows the test site.
Figure 5 shows the experimental arrangements at the site. The components in the Energy Box are a 20 kW heat pump with a maximum operating temperature of 55 °C and a maximum flow rate for the heat transfer fluid (HTF) of 12 m3/h (3.36 kg/s). Two steel tanks, insulated with polyurethane for energy storage, with a maximum operating pressure of 6 bars, are used to store water at a fixed temperature to represent the heating/cooling loads for the system. Apart from the equipment mentioned, there are various sensors to measure the flow and temperatures at different locations in the energy box.
Flowmeters (RIF100) and temperature probes (PT100) were used to measure the flow rates and temperature of the HTF, respectively. Flowmeters are present in the energy box, along with the control valves to adjust the flow in the system accordingly. Temperature sensors are connected to each ground probe to measure the temperature of the fluid at the outlet section. The placement of the temperature sensors at the construction site can also be seen in Figure 5.
Following the installation of the experimental test setup, a remote monitoring and management data system is used for data acquisition. The converted AGF probes’ data were recorded between June and November, after the construction of the tunnels. The flow rate of HTF was initially maintained at around 2000 l/h (0.56 kg/s) and then increased to around 4200 l/h (1.17 kg/s) once the system was stabilized. Furthermore, during the test, one tunnel was used as the source (extracting heat from the ground during heating mode) and the other was used for injecting heat (simulating cooling mode). The system was analyzed for cooling and heating applications by changing the HTF inlet temperature, and the response of the system was observed and recorded for analysis. The initial undisturbed ground temperature was 18.5 °C when the tests started. The cooling operation of the system was carried out for two months (July and August), with an inlet temperature of the HTF maintained around 26 °C in July and varied in the range of 23–35 °C in the month of August, to observe the cooling behavior of the tunnel. Similarly, to realize the heating operation (September to November), the inlet temperature of the HTF was maintained at 13 °C to observe the behavior of the tunnel as a heat source. In particular, the inlet is common for all the probes, while there are four measurements for the outlet temperature, with one for each probe, as mentioned above. The outlet temperature of the probes has been recorded and analyzed to evaluate the heat transferred between the HTF and the ground.
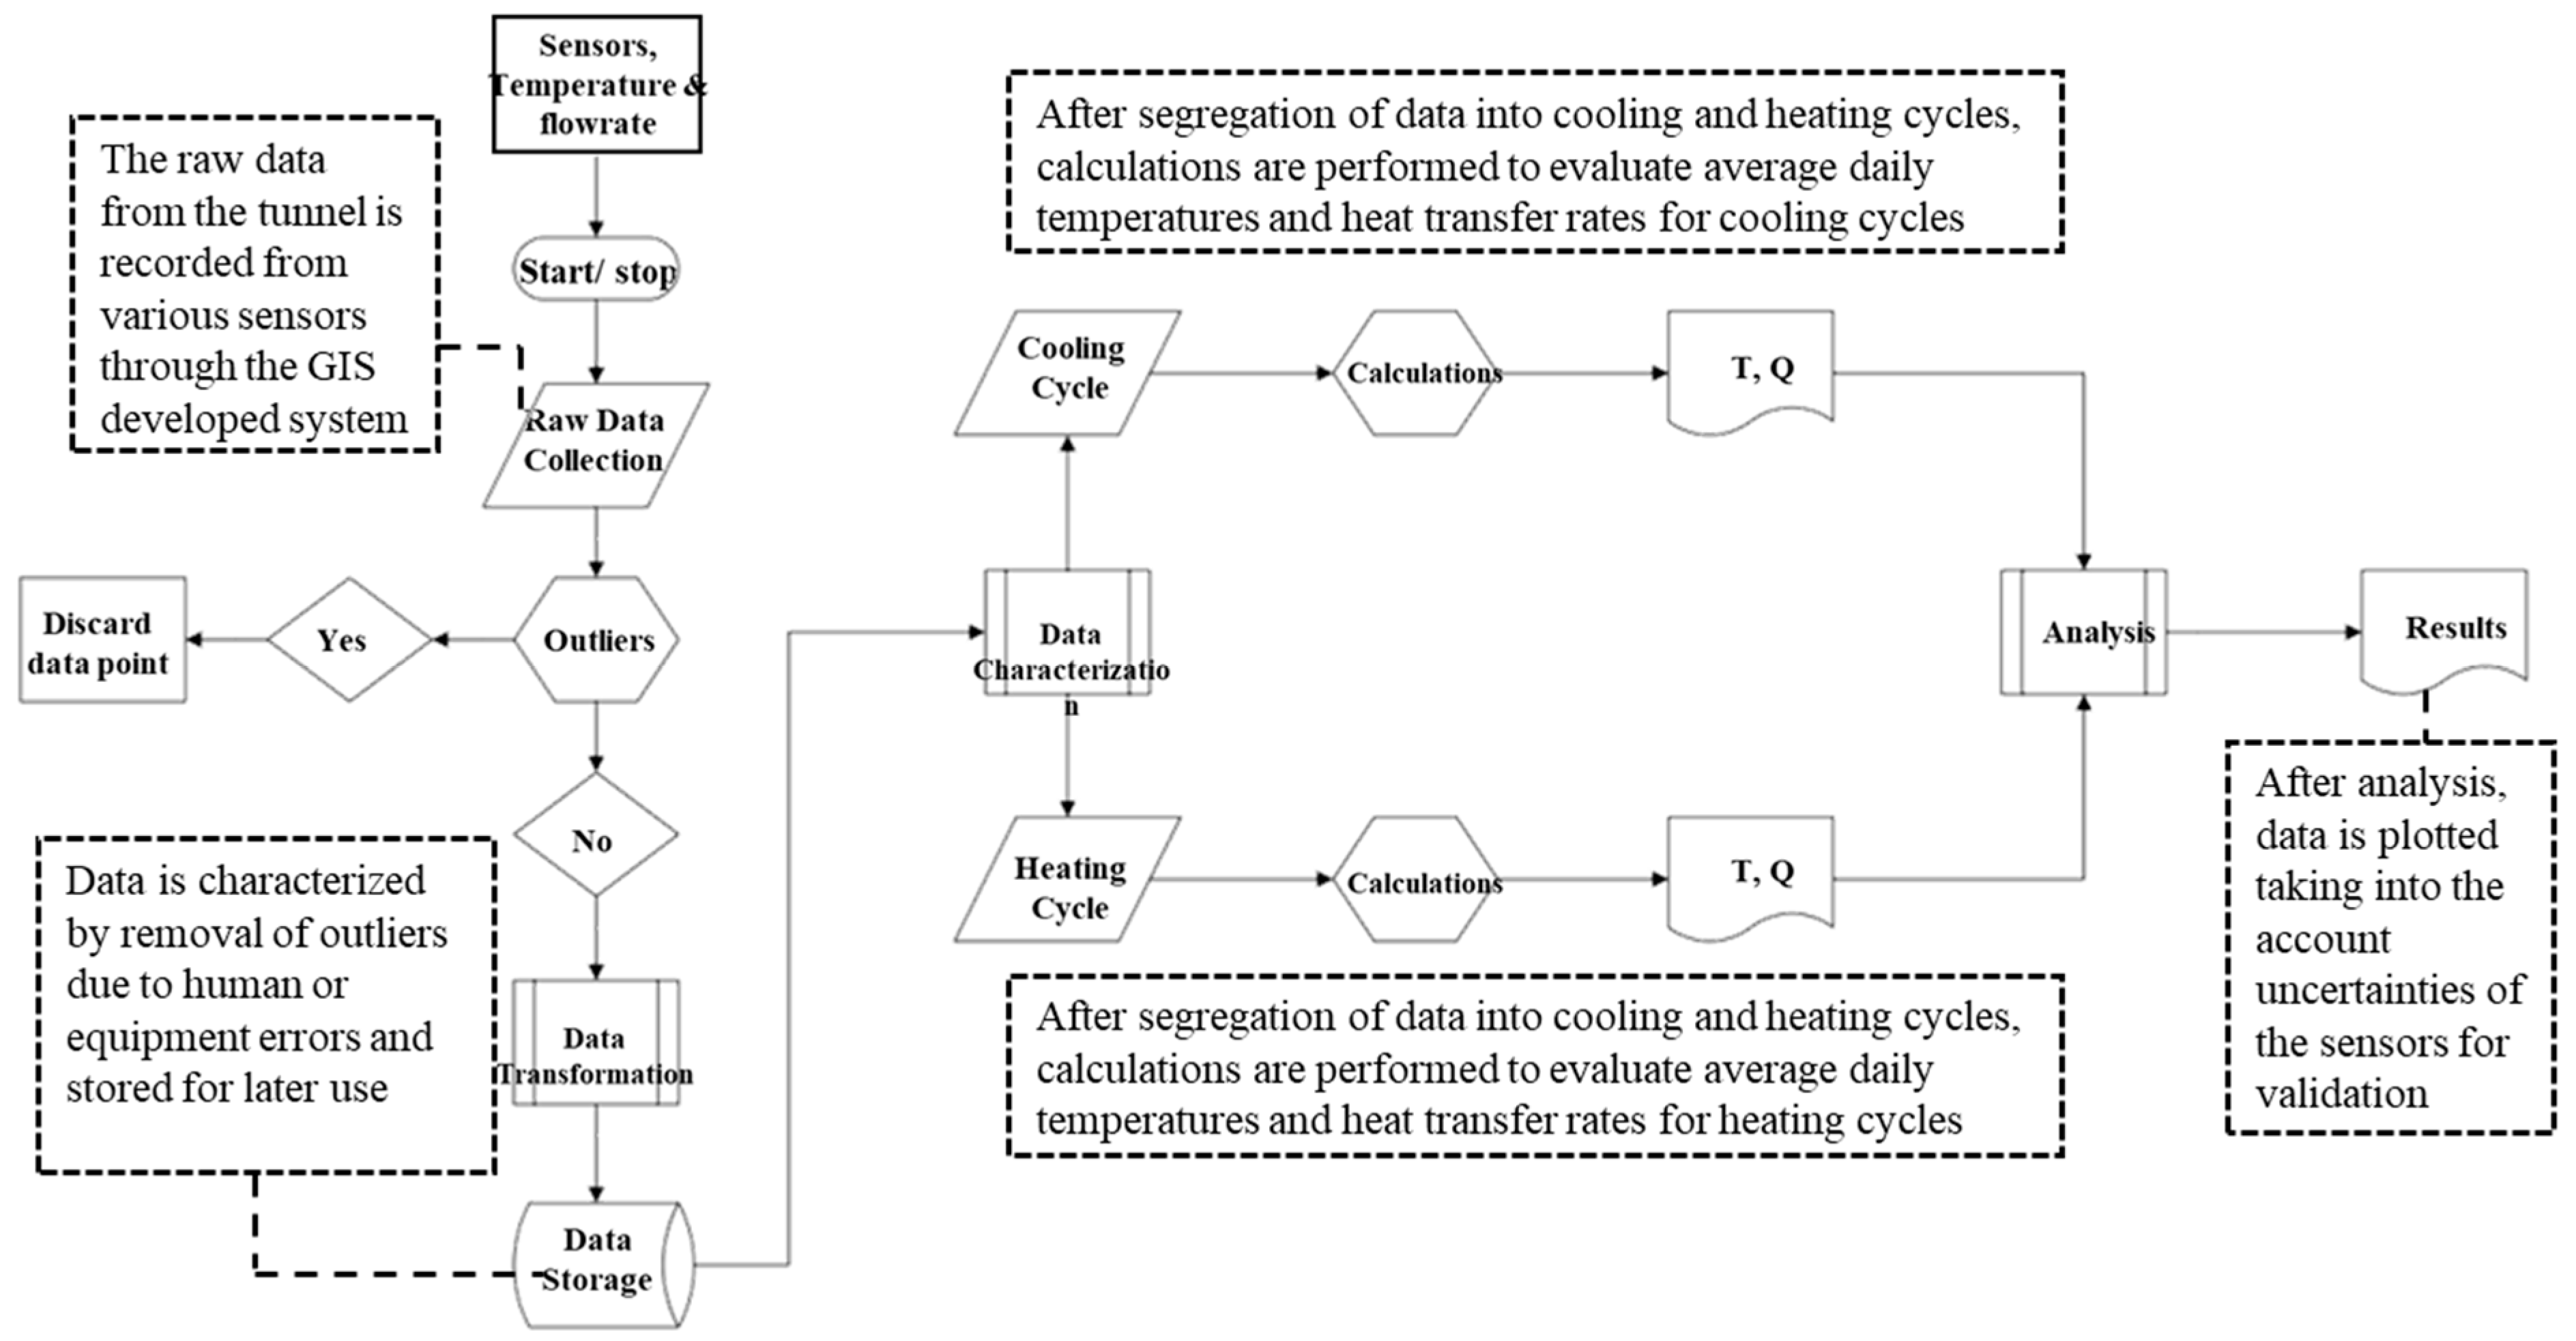
The data-sampling frequency of 30 s was used to obtain the values for the temperature and flow rates from the sensors installed to monitor the parameters of the HTF. The stored data was then filtered to remove outliers. To observe daily trends, raw data were aggregated by calculating the arithmetic mean over every 24 h, to obtain daily average values used for subsequent analysis. The measurement uncertainty associated with the experimental data is calculated using type ‘a’ and type ‘b’ measurement uncertainties [53]. Equation (2) is used to calculate the type ‘a’ uncertainty, while the type ‘b’ uncertainty was obtained from the temperature sensors’ manufacturer’s data sheet [54].
U T = k · u T = k · u a T 2 + u b T 2
u a T = σ N T   where   σ = i = 1 N x i x ¯ 2 N T 1
In Equation (1), UT is the combined uncertainty, which can be calculated by the data points, and the absolute uncertainty of the sensor, as shown by the equations. In this analysis, the confidence level (k = 2) of 95% has been adopted. Similarly, the uncertainty for the flowrate is also calculated, considering the uncertainties provided by the manufacturer’s data sheet [55].
U m ˙ = k · u m ˙ = k · u a m ˙ 2 + u b m ˙ 2
u a m ˙ = σ N m ˙   where   σ = i = 1 N x i x ¯ 2 N m ˙ 1
After calculations of uncertainties for both measuring quantities, the propagation of uncertainties for the heat transfer rate is calculated by Equation (5).
U Q ˙ = k · u Q ˙ = k ·   Q ˙ · U T T 2 + U m ˙ m ˙ 2
The data-processing workflow is shown in Figure 6.

3. Numerical Model

In this section, a 3D transient numerical model of the heat transfer in the probes, coupled with a 1D non-isothermal pipe flow is presented. The model is developed for the simulation of the experiments, and to develop a tool for analysis of the proposed reuseable AGF heat exchangers. The 3D domain of the model represents the soil over and near the tunnel, while the 1D non-isothermal pipe flow module has been used to model the flow and heat transfer to and from the HTF in the converted AGF probes. The numerical model is validated against the data obtained during the experimental campaign, and it is used to analyze the effects of the tunnel’s thermal activation on the adjacent ground temperature. Figure 7 shows the computational domain for numerical simulation with the actual picture of the tunnel showing the four converted AGF probes.

3.1. Mathematical Model

3.1.1. Heat Transfer Model in Soil Domain

The mathematical equation that describes the heat transfer phenomenon in the solid domain is basically the energy conservation equation and can be written as Equation (6), given below:
ρ s C p s T s t k s 2 T s = Q
In the above equation, ρ s (kg/m3) is the density of the material in the solid domain, Cps (J/(kg·K)) is the specific heat of the material in the solid domain at constant pressure, Ts (K) is the temperature, ks (W/(m·K)) is the thermal conductivity of the material in the solid region, and Q (W/m3) is the heat exchanged with the pipes.

3.1.2. Heat Transfer Model in Pipe

The mathematical model that describes heat transfer phenomena in the pipes in the proposed numerical model can be written as Equation (7), shown below:
ρ f A C p f T f t + ρ f A C p f u · T f = · A k f T f + 1 2 f D ρ A d h u 3 + Q w a l l
where ρ f (kg/m3) is the density of the fluid flowing through the pipes, A (m2) is the cross-sectional area of the pipe, Cpf (J/(kg·K)) is the specific heat capacity of the fluid at constant pressure, u (m/s) is the mean water velocity in the pipes, Tf (K) is its temperature, and kf (W/(m·K)) is its thermal conductivity. The second term on the right-hand side takes into account the frictional losses, and Qwall (W/m) is the heat transfer rate from the tube walls per unit length of the pipe. The heat transfer Qwall (W/m) between the tubes and the surrounding soil can be written as:
Q = Q w a l l A = h Z e f f T E X T T A
In the above equation (hZ)_eff is the effective value of the heat transfer coefficient between the water in the pipes and the surrounding soil, and TEXT is the temperature of the soil surrounding the pipes. The following assumptions have been made to solve the above mathematical model:
  • Water in the pipes behaves as an incompressible fluid;
  • Fluid flow in the pipes is assumed to be fully developed and one-dimensional;
  • A frictional pressure drop is taken into account during the solution;
  • The thermophysical properties of the materials are considered constant;
  • The model is solved for a total duration of the experiments, which is five months, by simulating both cooling and heating applications of the tunnel;
  • The heat transfer between the air in the tunnel and the surface of the tunnel is neglected.

3.2. Boundary and Initial Conditions

3.2.1. Boundary Conditions

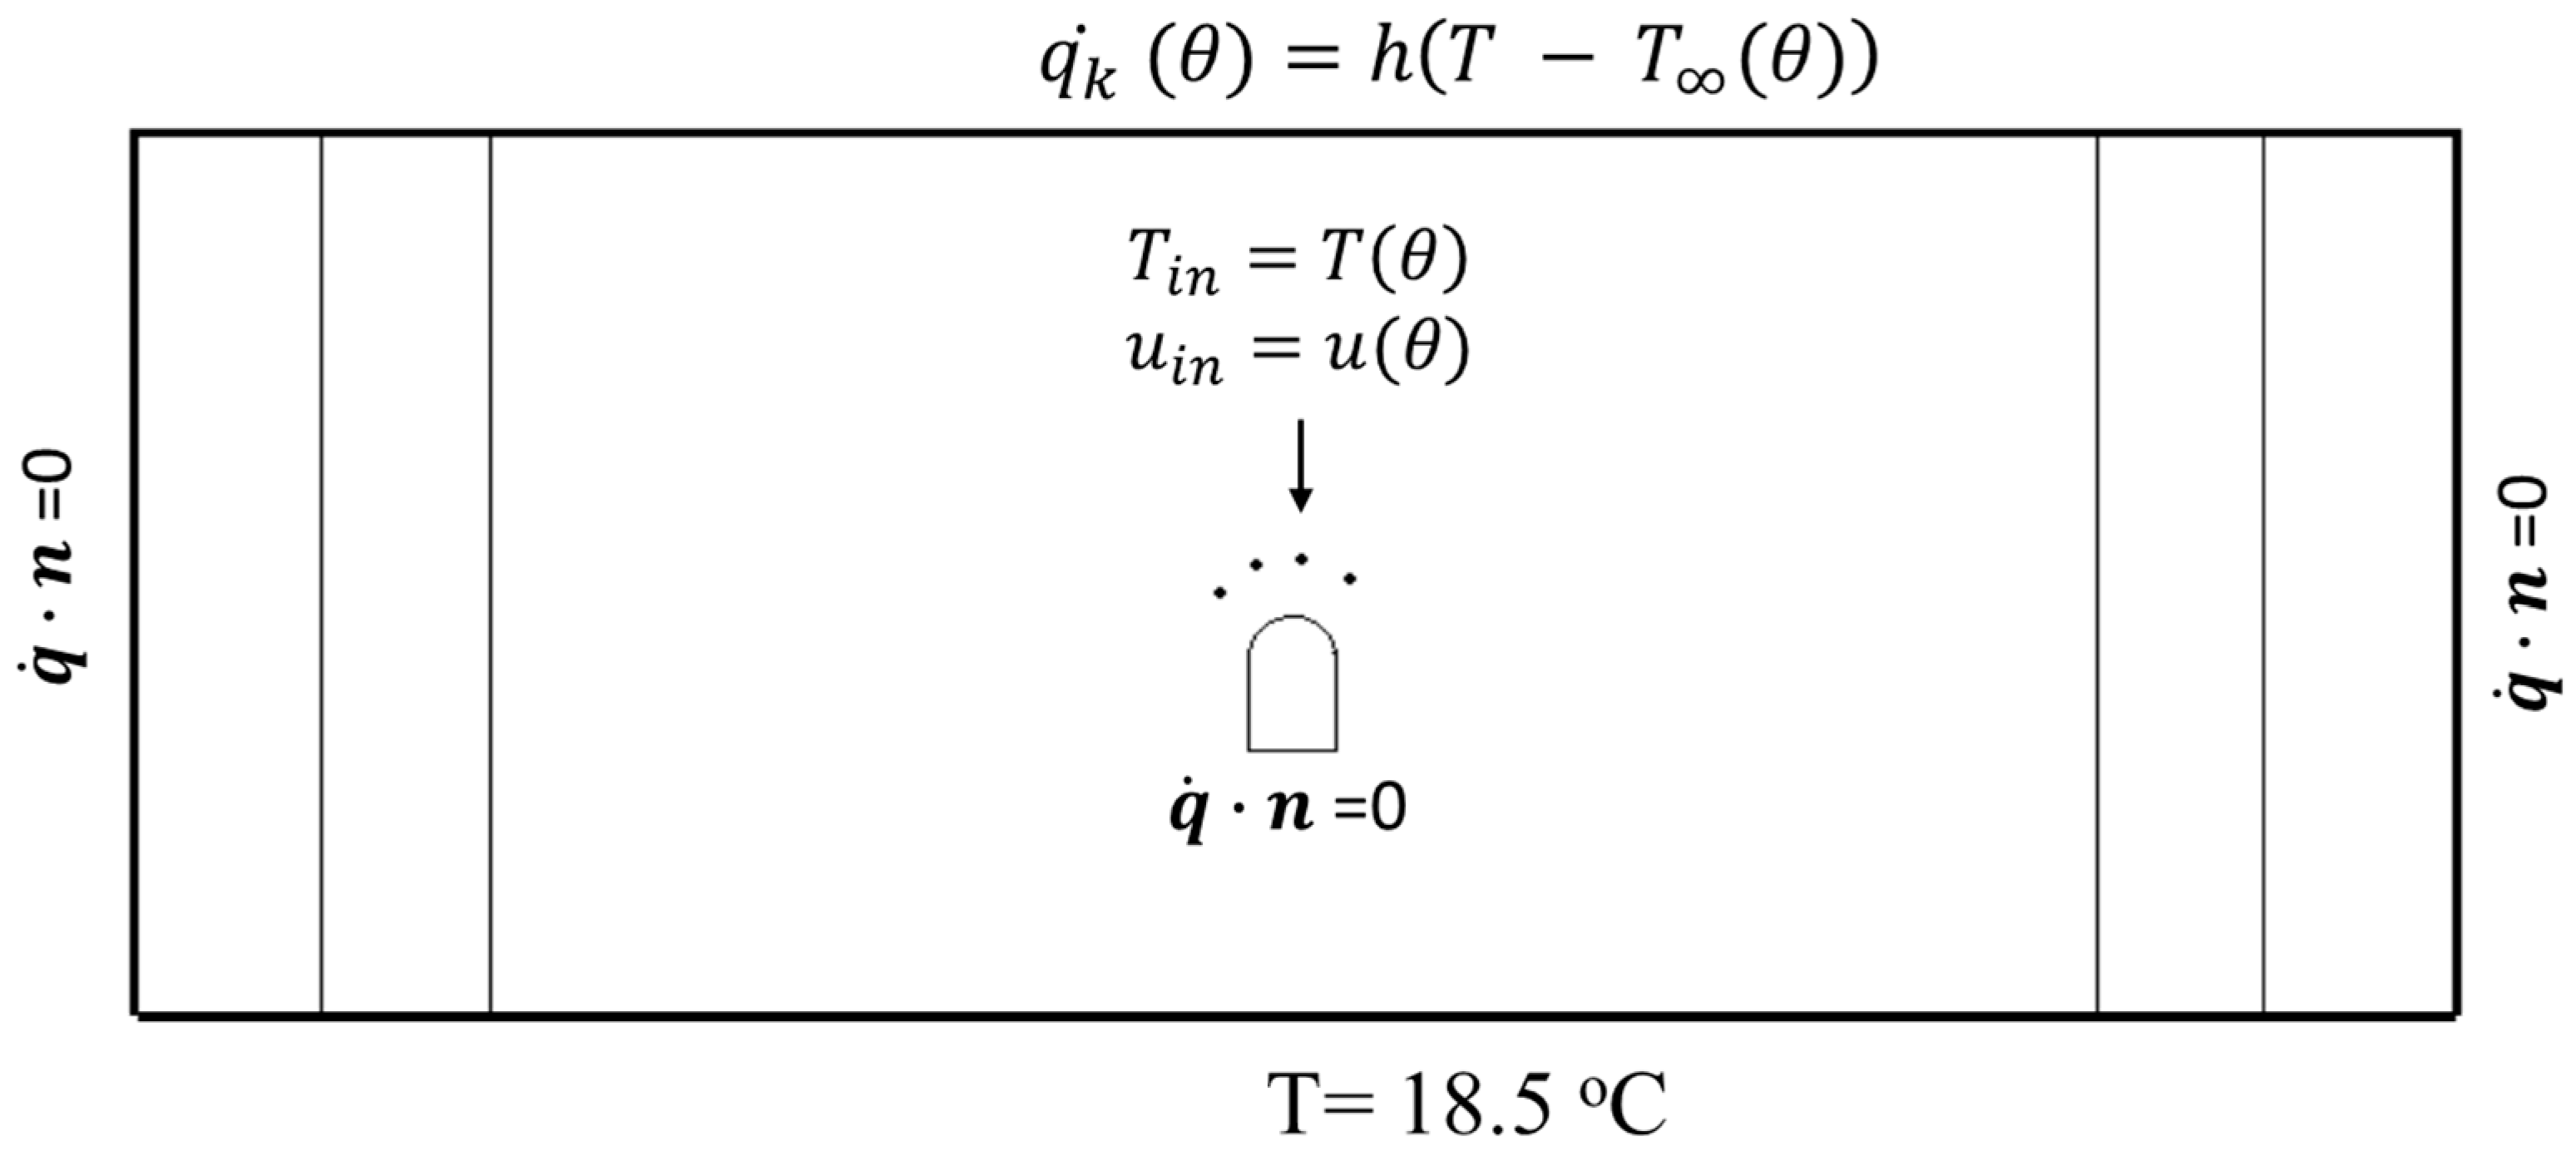
The boundary conditions to solve the model are shown in Figure 8 below.
It is worth noting that the boundary conditions are assumed to be as close as possible to the actual conditions measured during the experiments, for comparison with the data obtained during the experimental campaign. On both sides of the solid domain surrounding the tunnel, Neumann (adiabatic) boundary conditions are considered. This can be represented by Equation (9):
q ˙ ( θ ) · n = 0
At the bottom of the solid domain, the Dirichlet boundary condition (Tgrnd) is considered. The average soil temperature measured during the experimental campaign by the temperature sensors placed at different locations was used as the boundary condition at the bottom of the solid domain surrounding the tunnel and is considered constant throughout the simulations, at a value of:
Tgrnd = 18.5 °C
The upper surface of the solid domain surrounding the tunnel is in contact with the external environment, so a convective boundary condition was used, which can be represented as:
q k ˙ θ · n = h   · [ T T ( θ ) ]
In the above equation, T represents the boundary domain temperature, while T (θ) is the ambient temperature measured during the experimental campaign, and ‘h’ represents the convective heat transfer coefficient assumed to be constant for natural convection with a value of 4 W/m2K for the simulations [56]. The boundary conditions for the fluid flowing through the pipes are taken from the experimental data to ensure the reliability of the model for validation purposes. In particular, the inlet temperature for the HTF and its mass flow rate are imposed during the heating and cooling applications. Therefore, the model was given appropriate flow and temperature conditions for the inlet at the pipe flow module, as given in Equations (12) and (13):
Tin = T(θ)
uin = u(θ)
In the above equations, Tin represents the fluid inlet temperature, which is time-dependent and changes during the cooling/heating applications. The operating temperature range for the system is within the range of 12–36 °C. The inlet velocity, uin, is calculated based on the inlet mass flow rate for the HTF, which is also controlled during the operation within the range of 2000–4200 l/h.

3.2.2. Initial Conditions

The initial condition used for the solid domain surrounding the tunnel is assumed to be the average soil temperature measured during the experimental campaign. Therefore, the initial condition for the solid domain can be written as:
T θ = 0   =   T g r n d   =   18.5   ° C
The initial conditions for the pipe flow can be written as:
u θ = 0 = 0   m / s   and   T θ = 0   =   T i n   ° C
At the beginning of the experiment, there is no flow in the pipes, so the mass flow rate at the flow meter is zero, and the initial temperature of the HTF in the pipes is considered as the inlet temperature of the fluid.

3.2.3. Material Properties

The material properties used for the soil are those of Pozzolana, the material that was found in the domain during the excavation around the tunnel. The material properties were obtained from the available literature [57] and are presented in Table 2.

3.3. Mesh Sensitivity Analysis

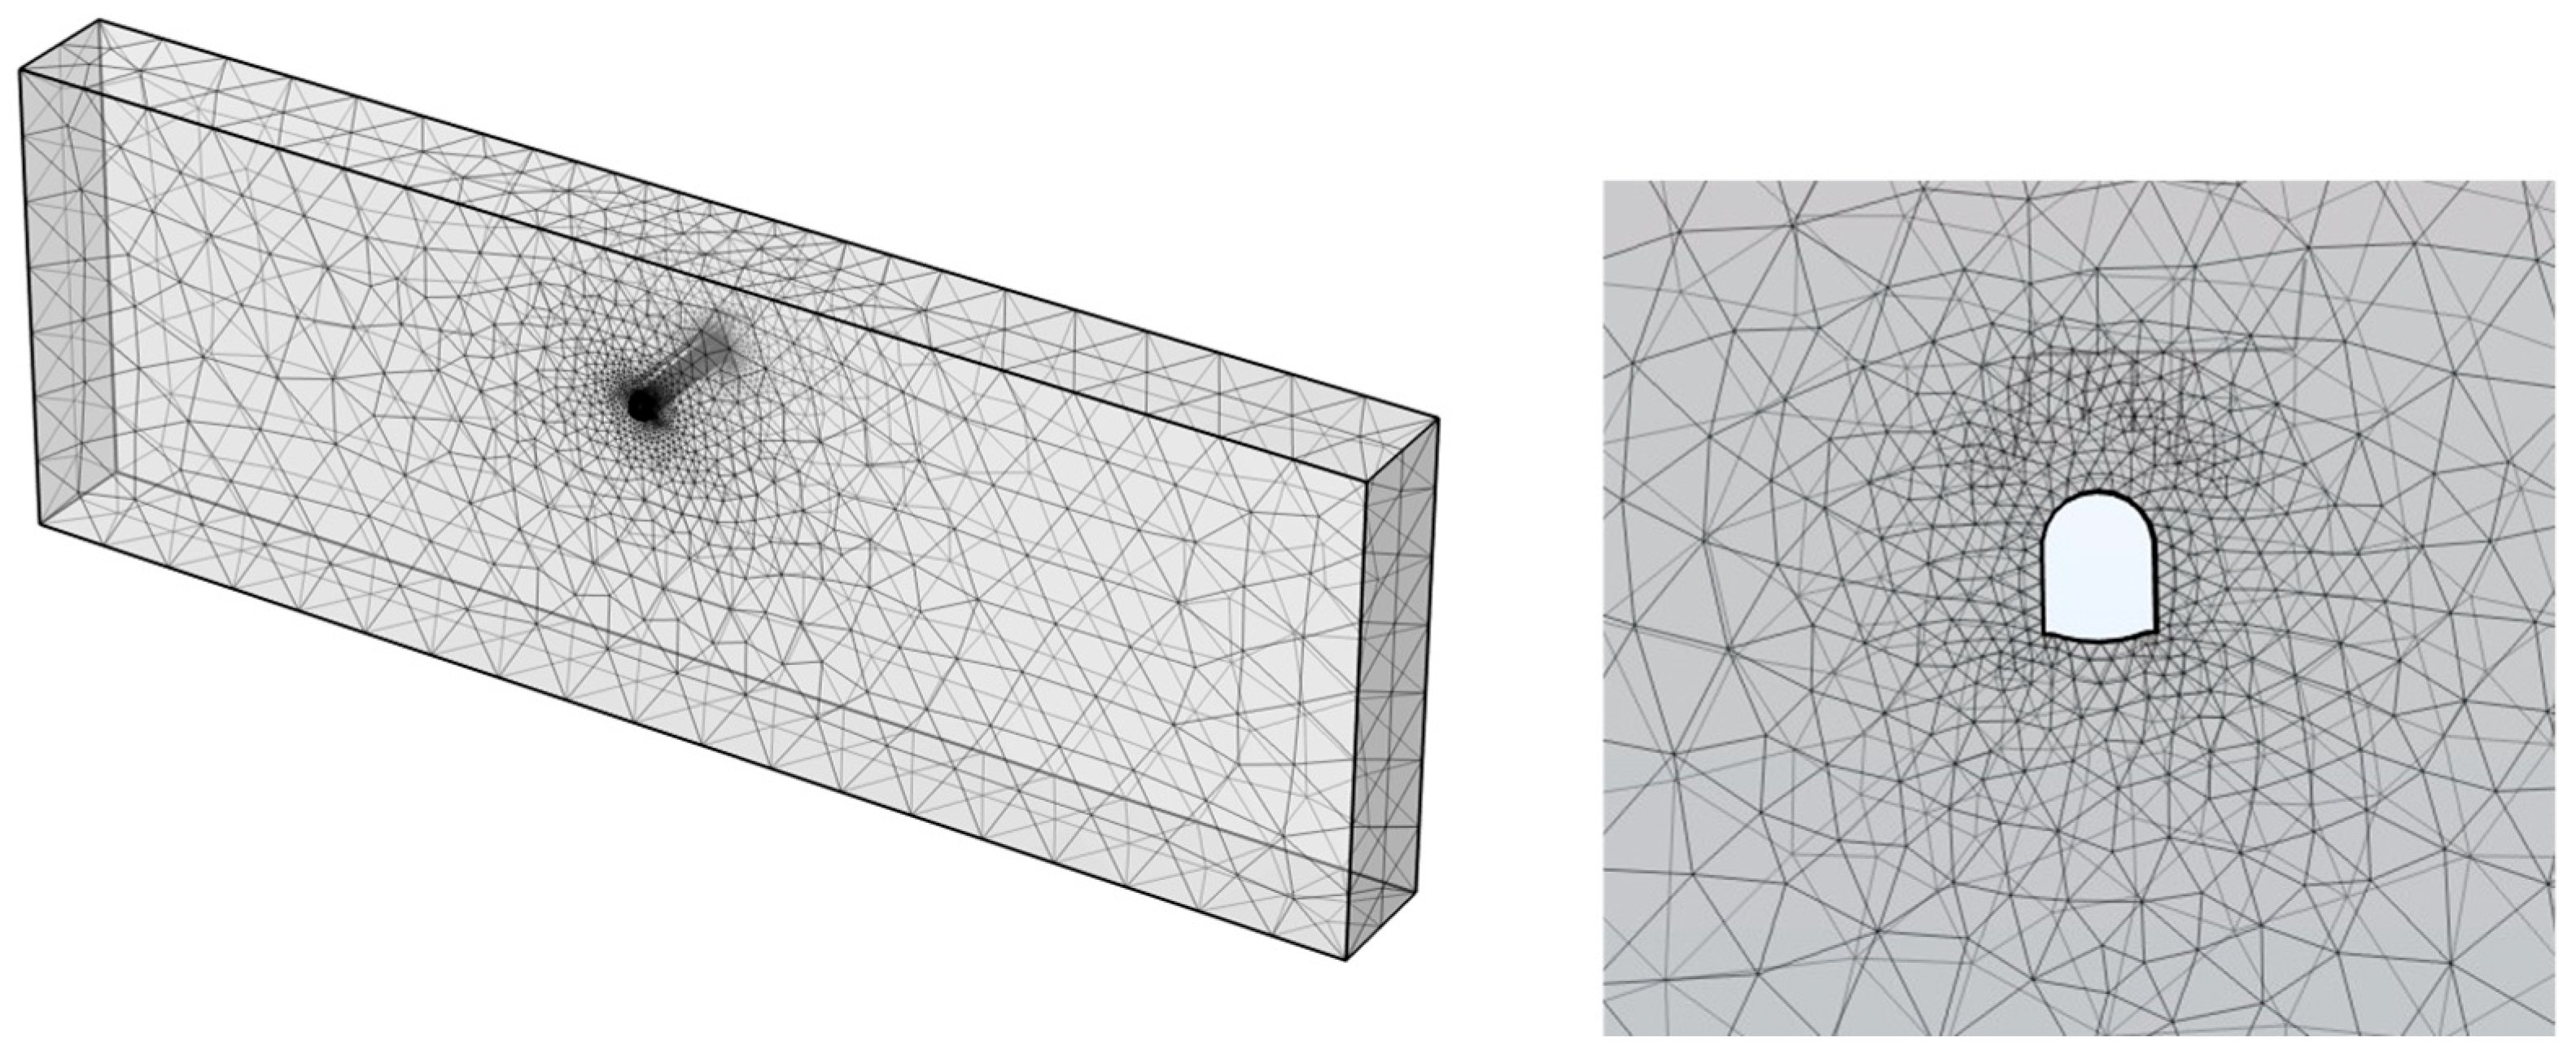
A mesh sensitivity analysis is a crucial step in finite-element analysis (FEA), as it is aimed at assessing the influence of mesh refinement on the simulation results. The distribution of the mesh elements can be seen in Figure 9 below:
The size of the elements in the domain becomes coarser away from the tunnel because the main gradients of the unknown parameters occur near the tunnel, as the probes are installed close to the tunnel. It is, therefore, necessary to have the fine elements close to the probes, so that the heat exchange between the probes and the surrounding soil can be accurately simulated.
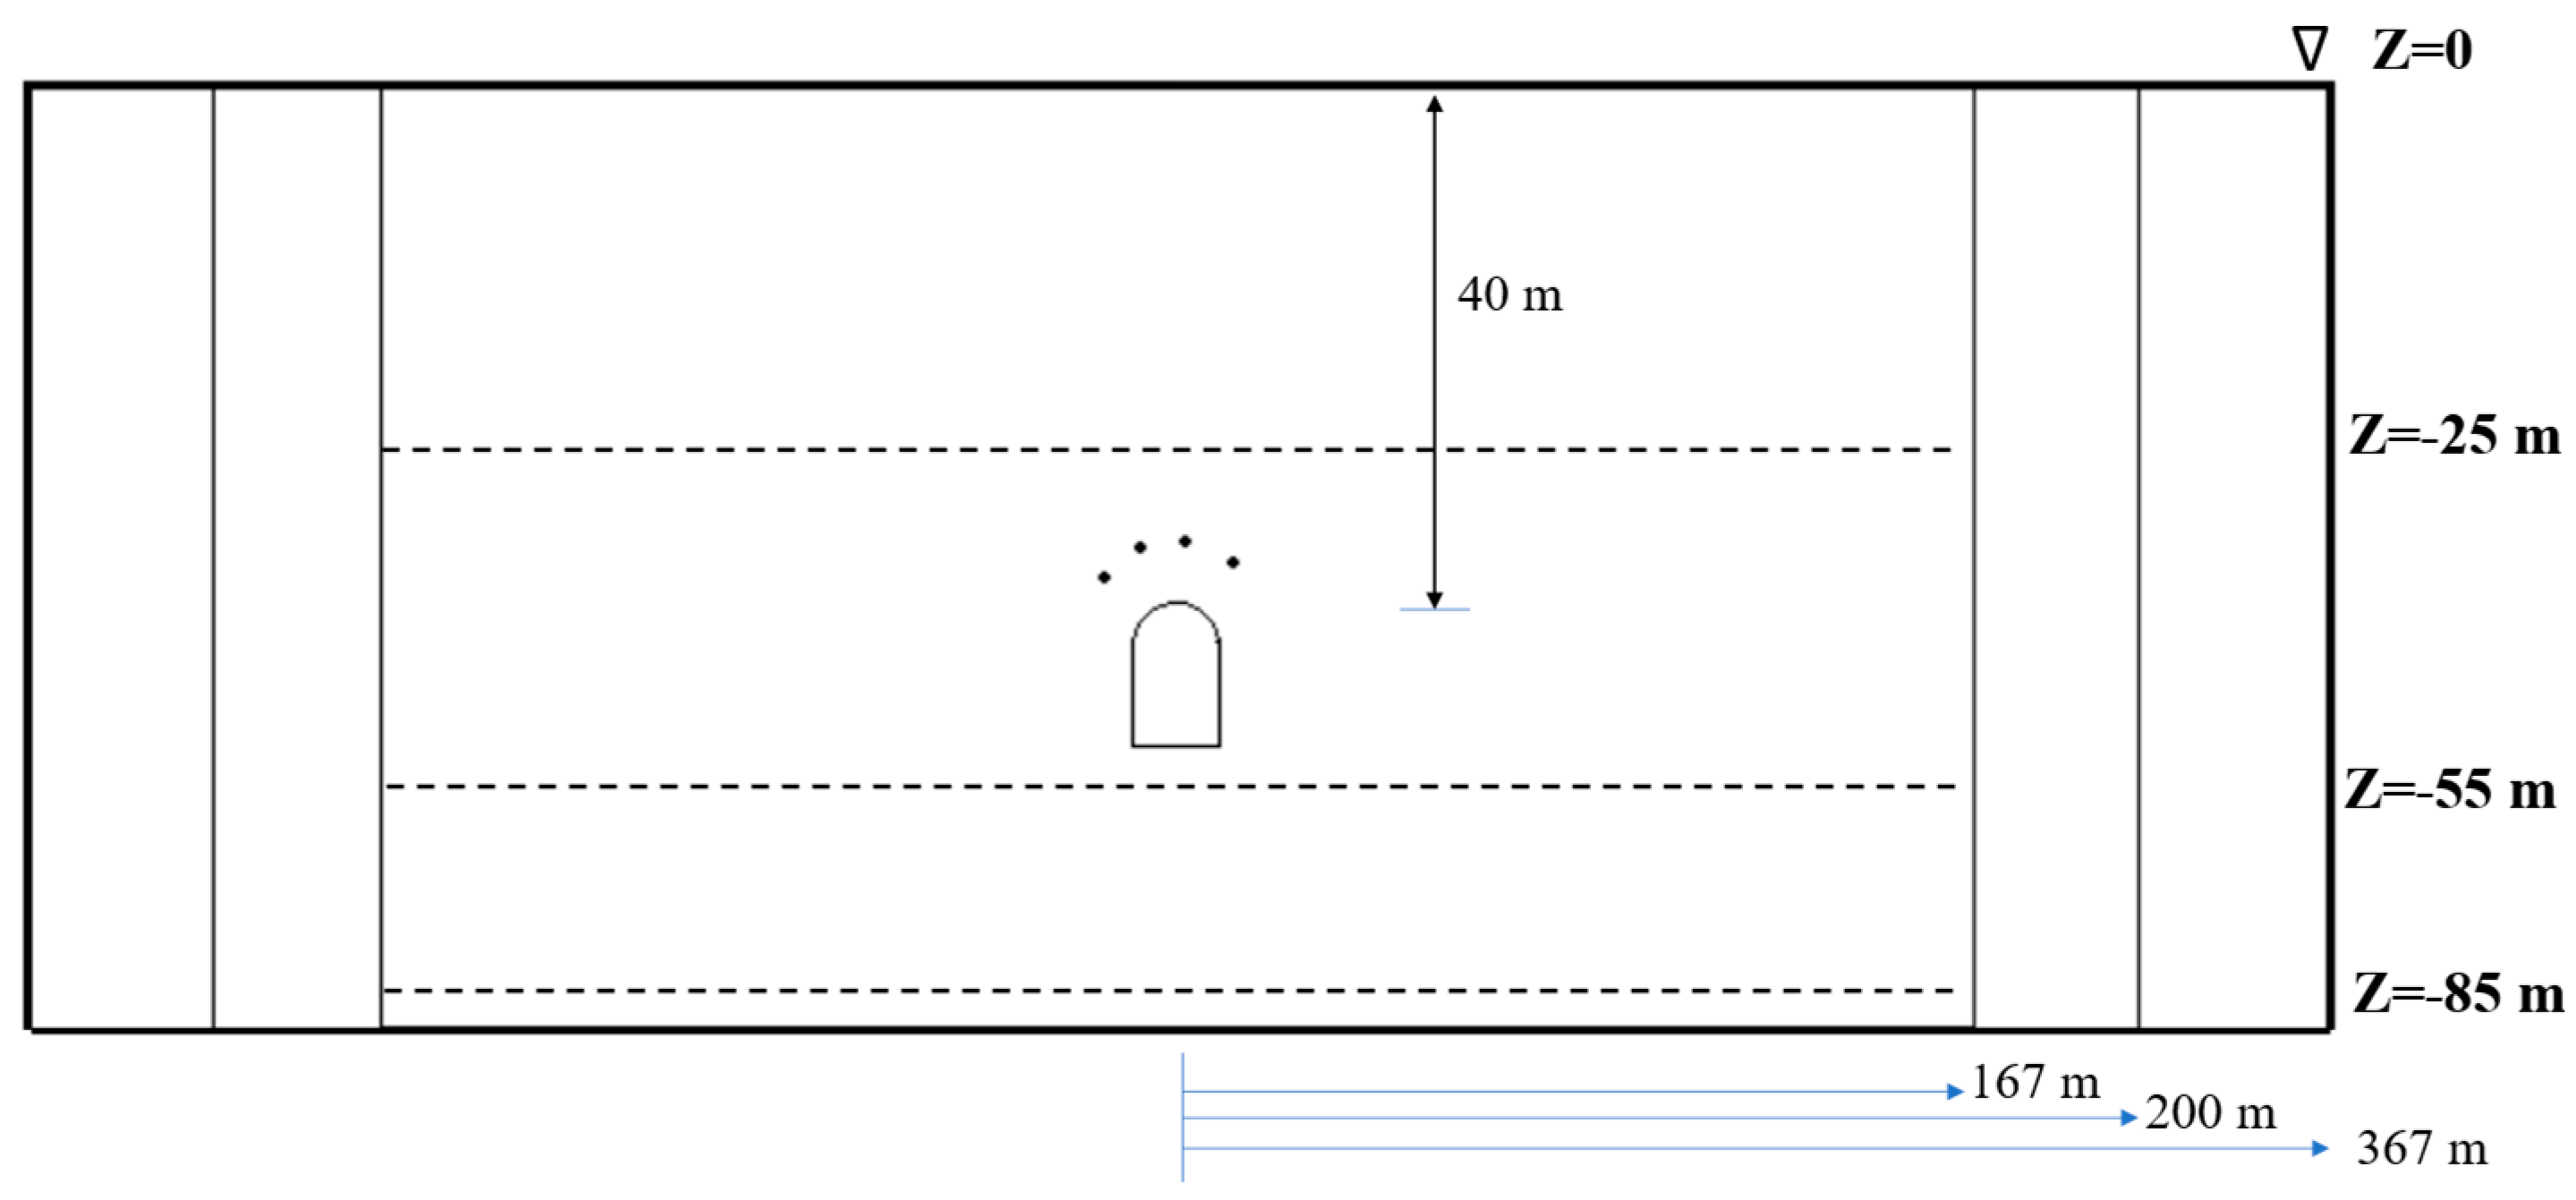
Another important aspect of the mesh analysis is the choice of an accurate domain size to avoid the direct influence of the boundary conditions on the simulation results. For this purpose, a domain independence analysis was carried out by comparing the different domain sizes with multiple section lines in a solid domain surrounding the tunnel. The same can be seen in Figure 10 below:
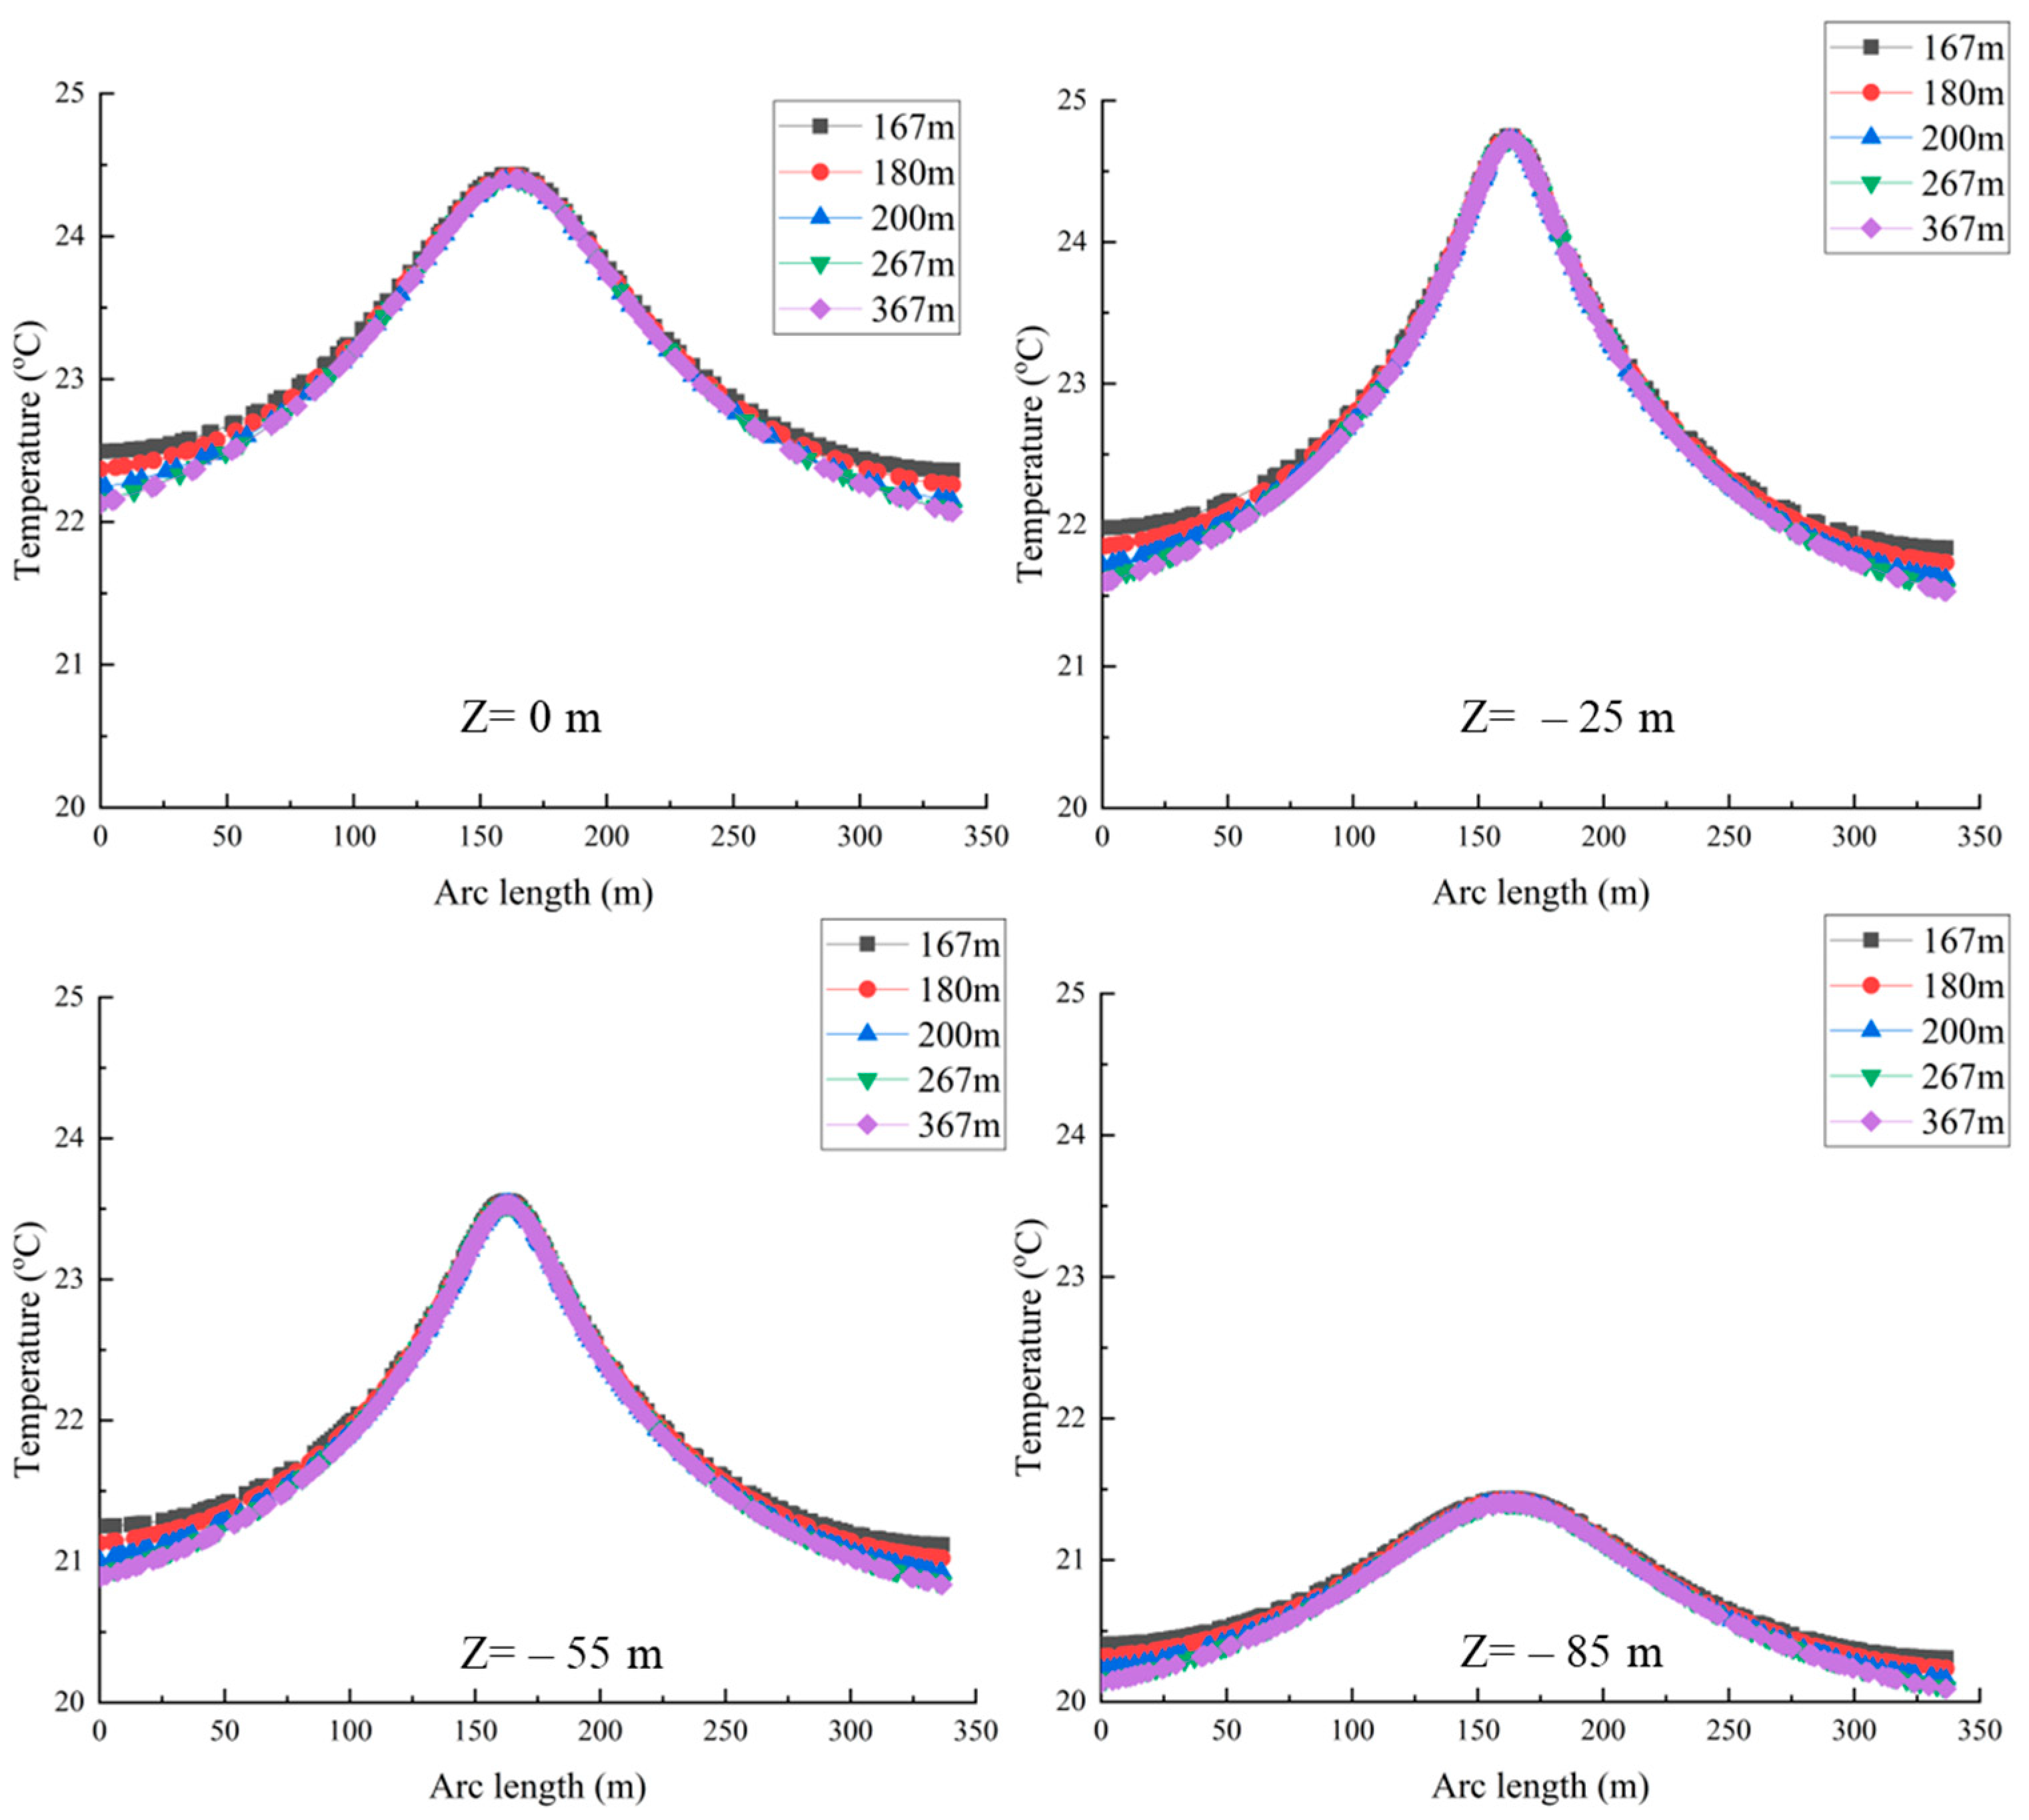
In the figure above, it can be seen that three different domain sizes are shown, and the temperature of the domain at depths of −25, −55, and −85 m near the probes is drawn to observe the temperatures to obtain a suitable domain for the simulation. In total, five different domain sizes, namely 167, 180, 200, 267, and 367 m, were compared. The domain temperatures are compared for the same arc length at z = 0, −25, −55, and −85 m, as shown in Figure 11 below:
From the plots, the temperatures calculated with the domain sizes of 200, 267, and 367 m are close enough to each other at all section lines in the domain. Therefore, the optimal domain size of 200 m was selected to reduce the computational time. Once the domain size was finalized, the grid independence analysis was carried out based on the average domain temperature for both the cooling and heating cycles. The details of the same are summarized in Table 3.
The appropriate grid was chosen based on the average domain temperatures during the cooling and heating cycles. In the simulations, the maximum probe inlet temperature for the cooling cycle and the minimum probe inlet temperature for the heating cycle were considered. The mesh with a temperature variation of less than <1% for both the cooling and heating cycles was adopted for the simulations. Mesh-type fine, indicated in Table 3, was therefore selected.

4. Results

This section presents the validation of the proposed model by comparing the experimental data with the simulation results. Two sub-sections discuss the use of the tunnel as a heat sink during the summer season, to obtain a cooling effect, and then the use of the same tunnel as a heat source during the winter season, to simulate heating operation. Therefore, this section describes the cooling and heating operation modes of the tunnel.

4.1. Cooling Mode

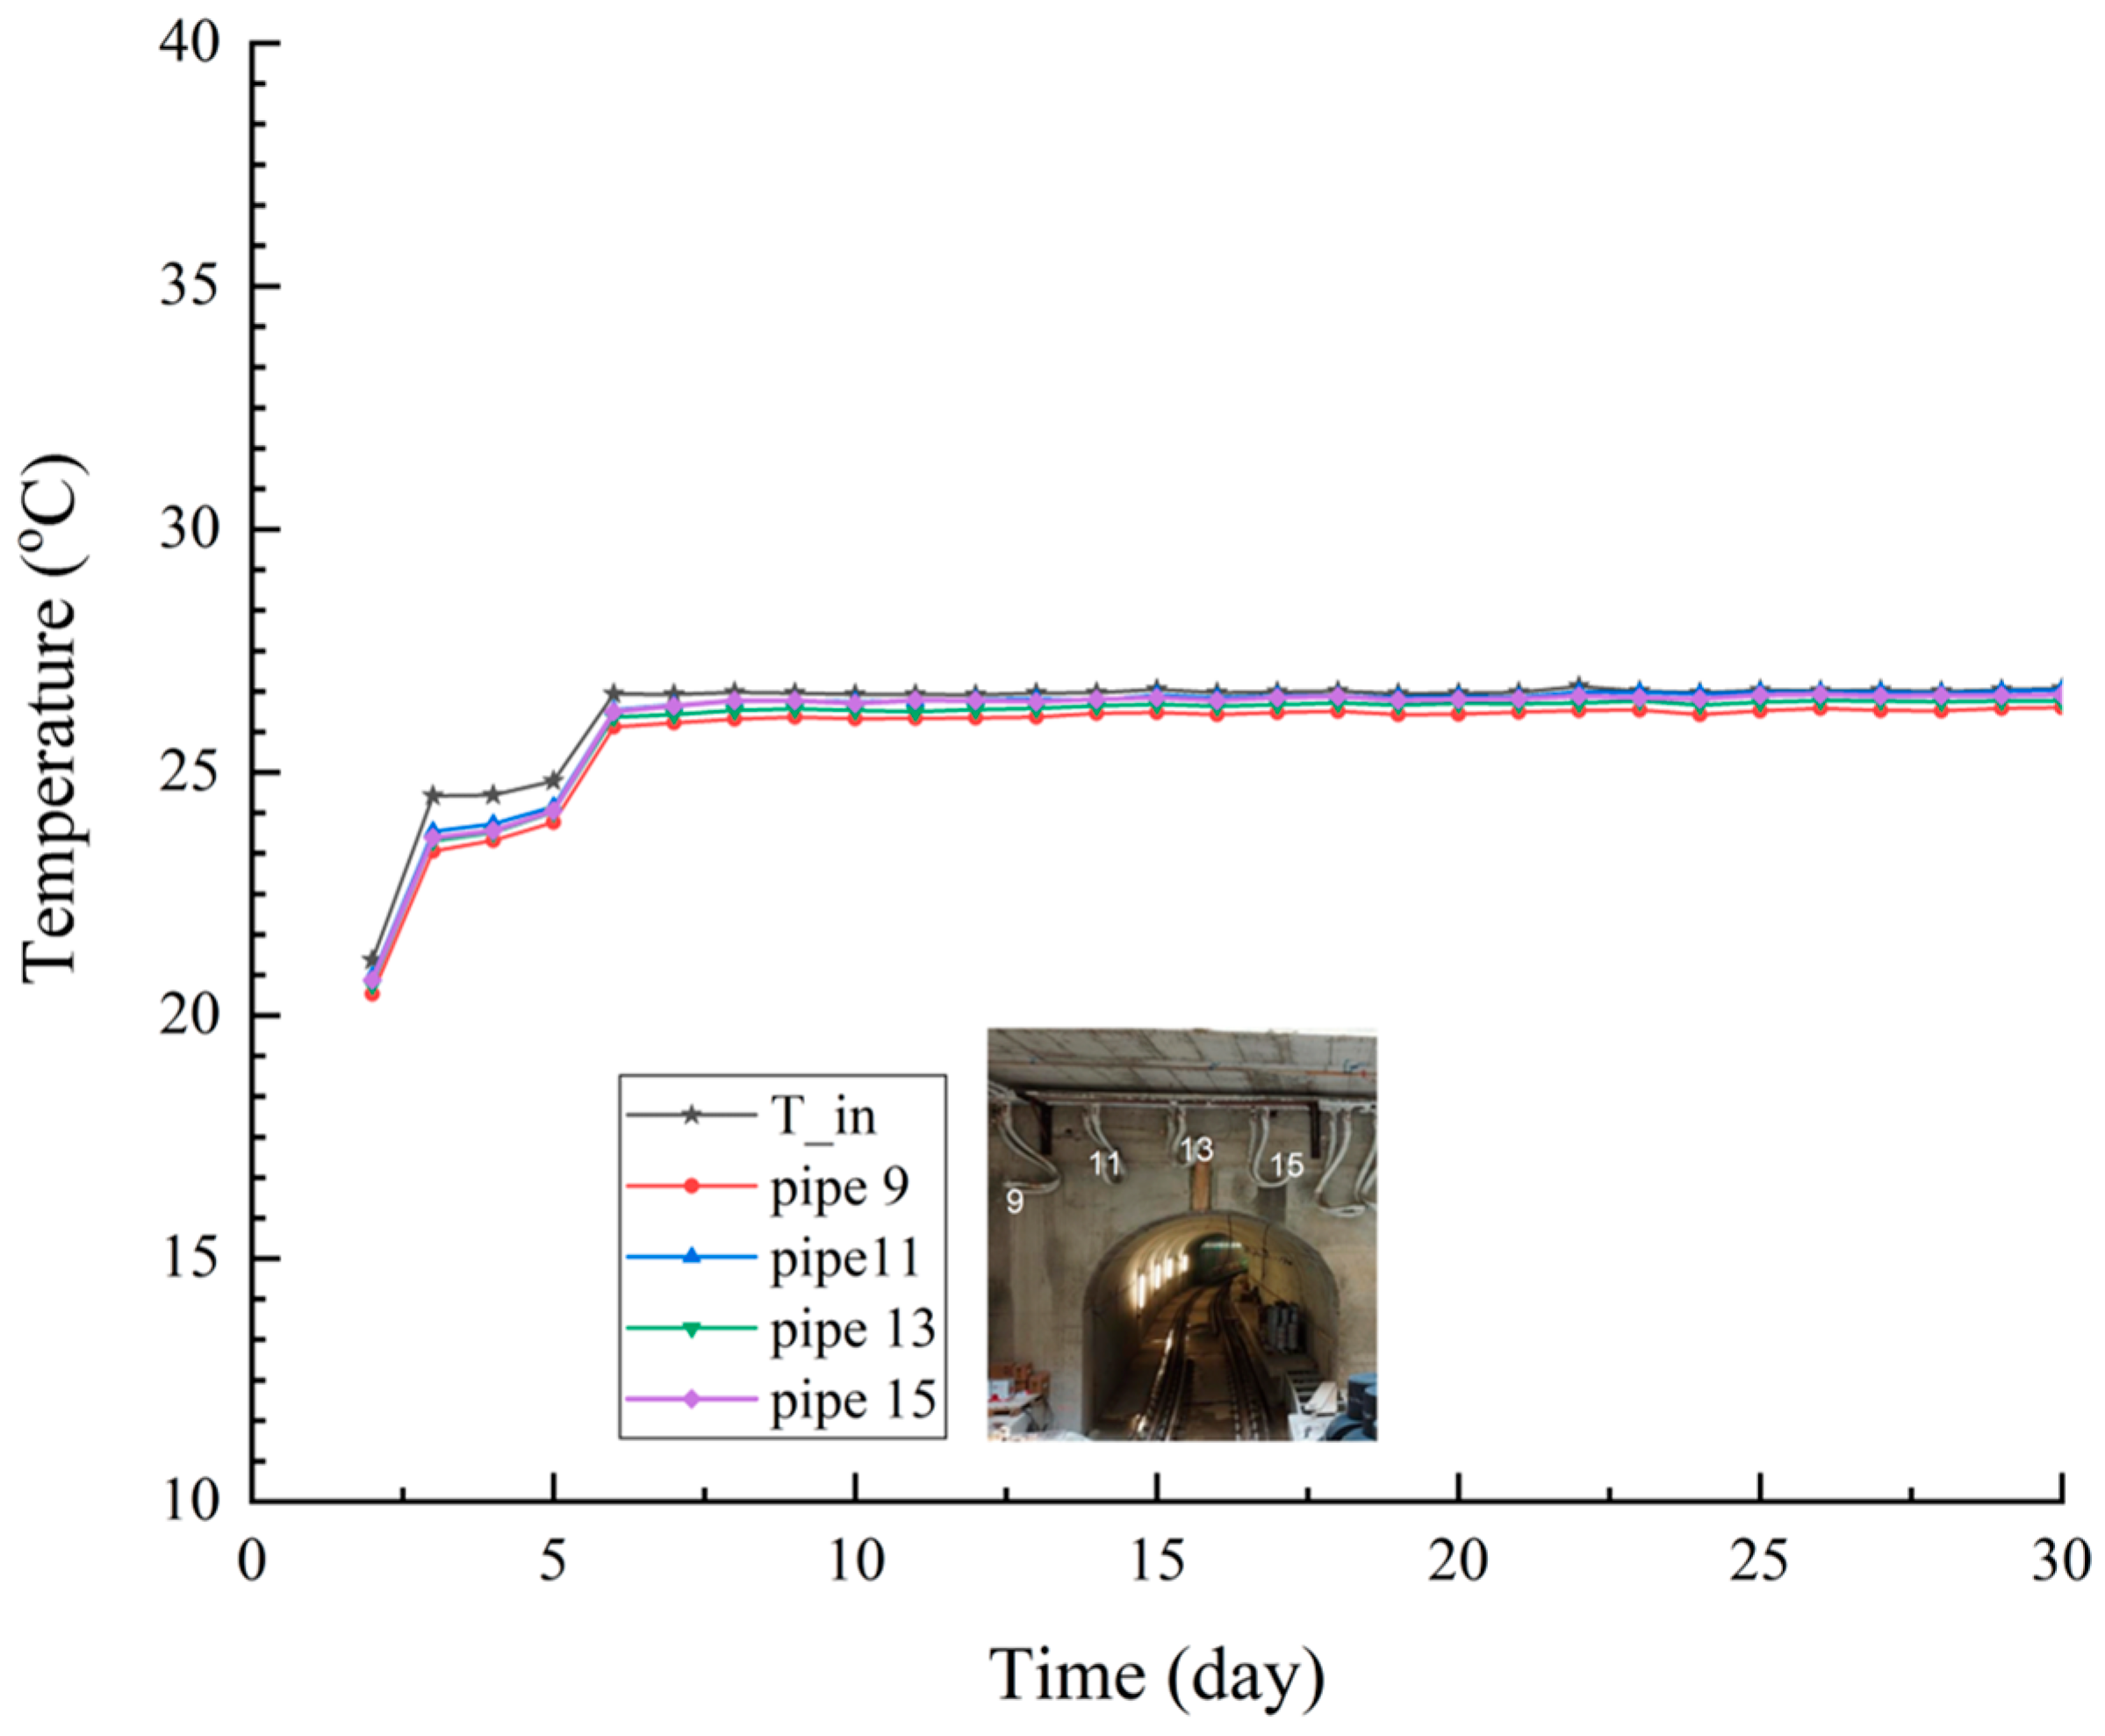
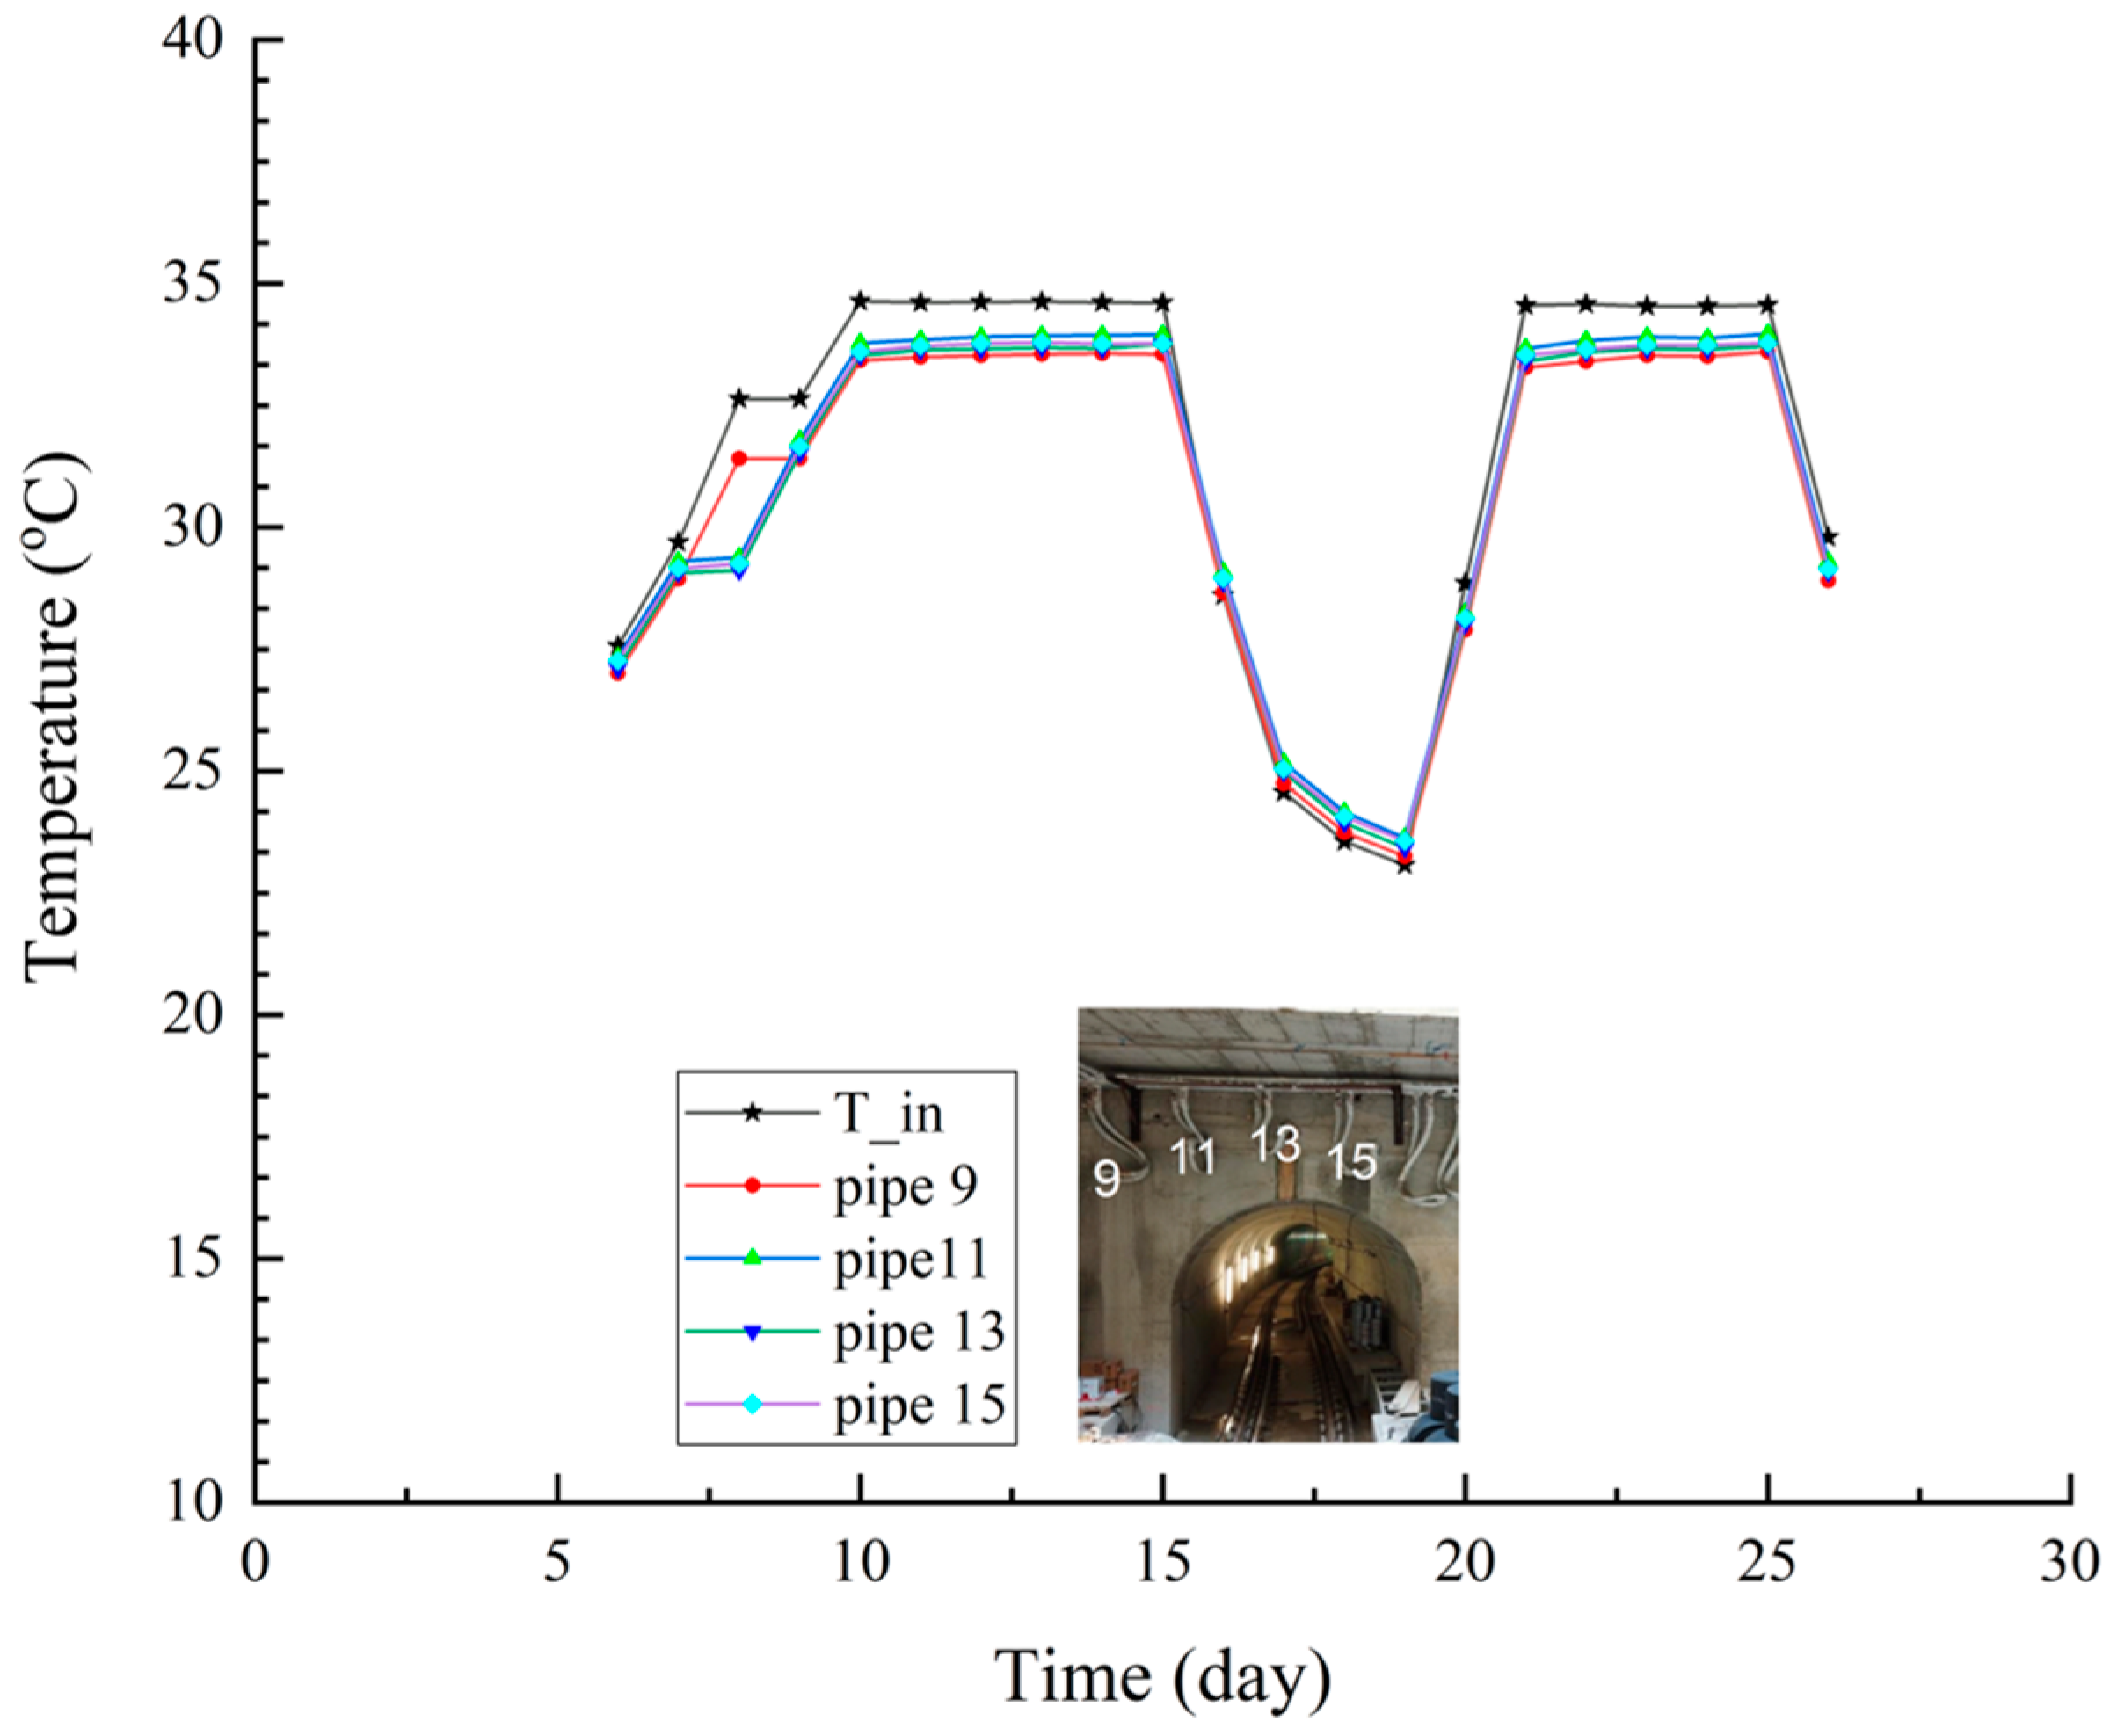
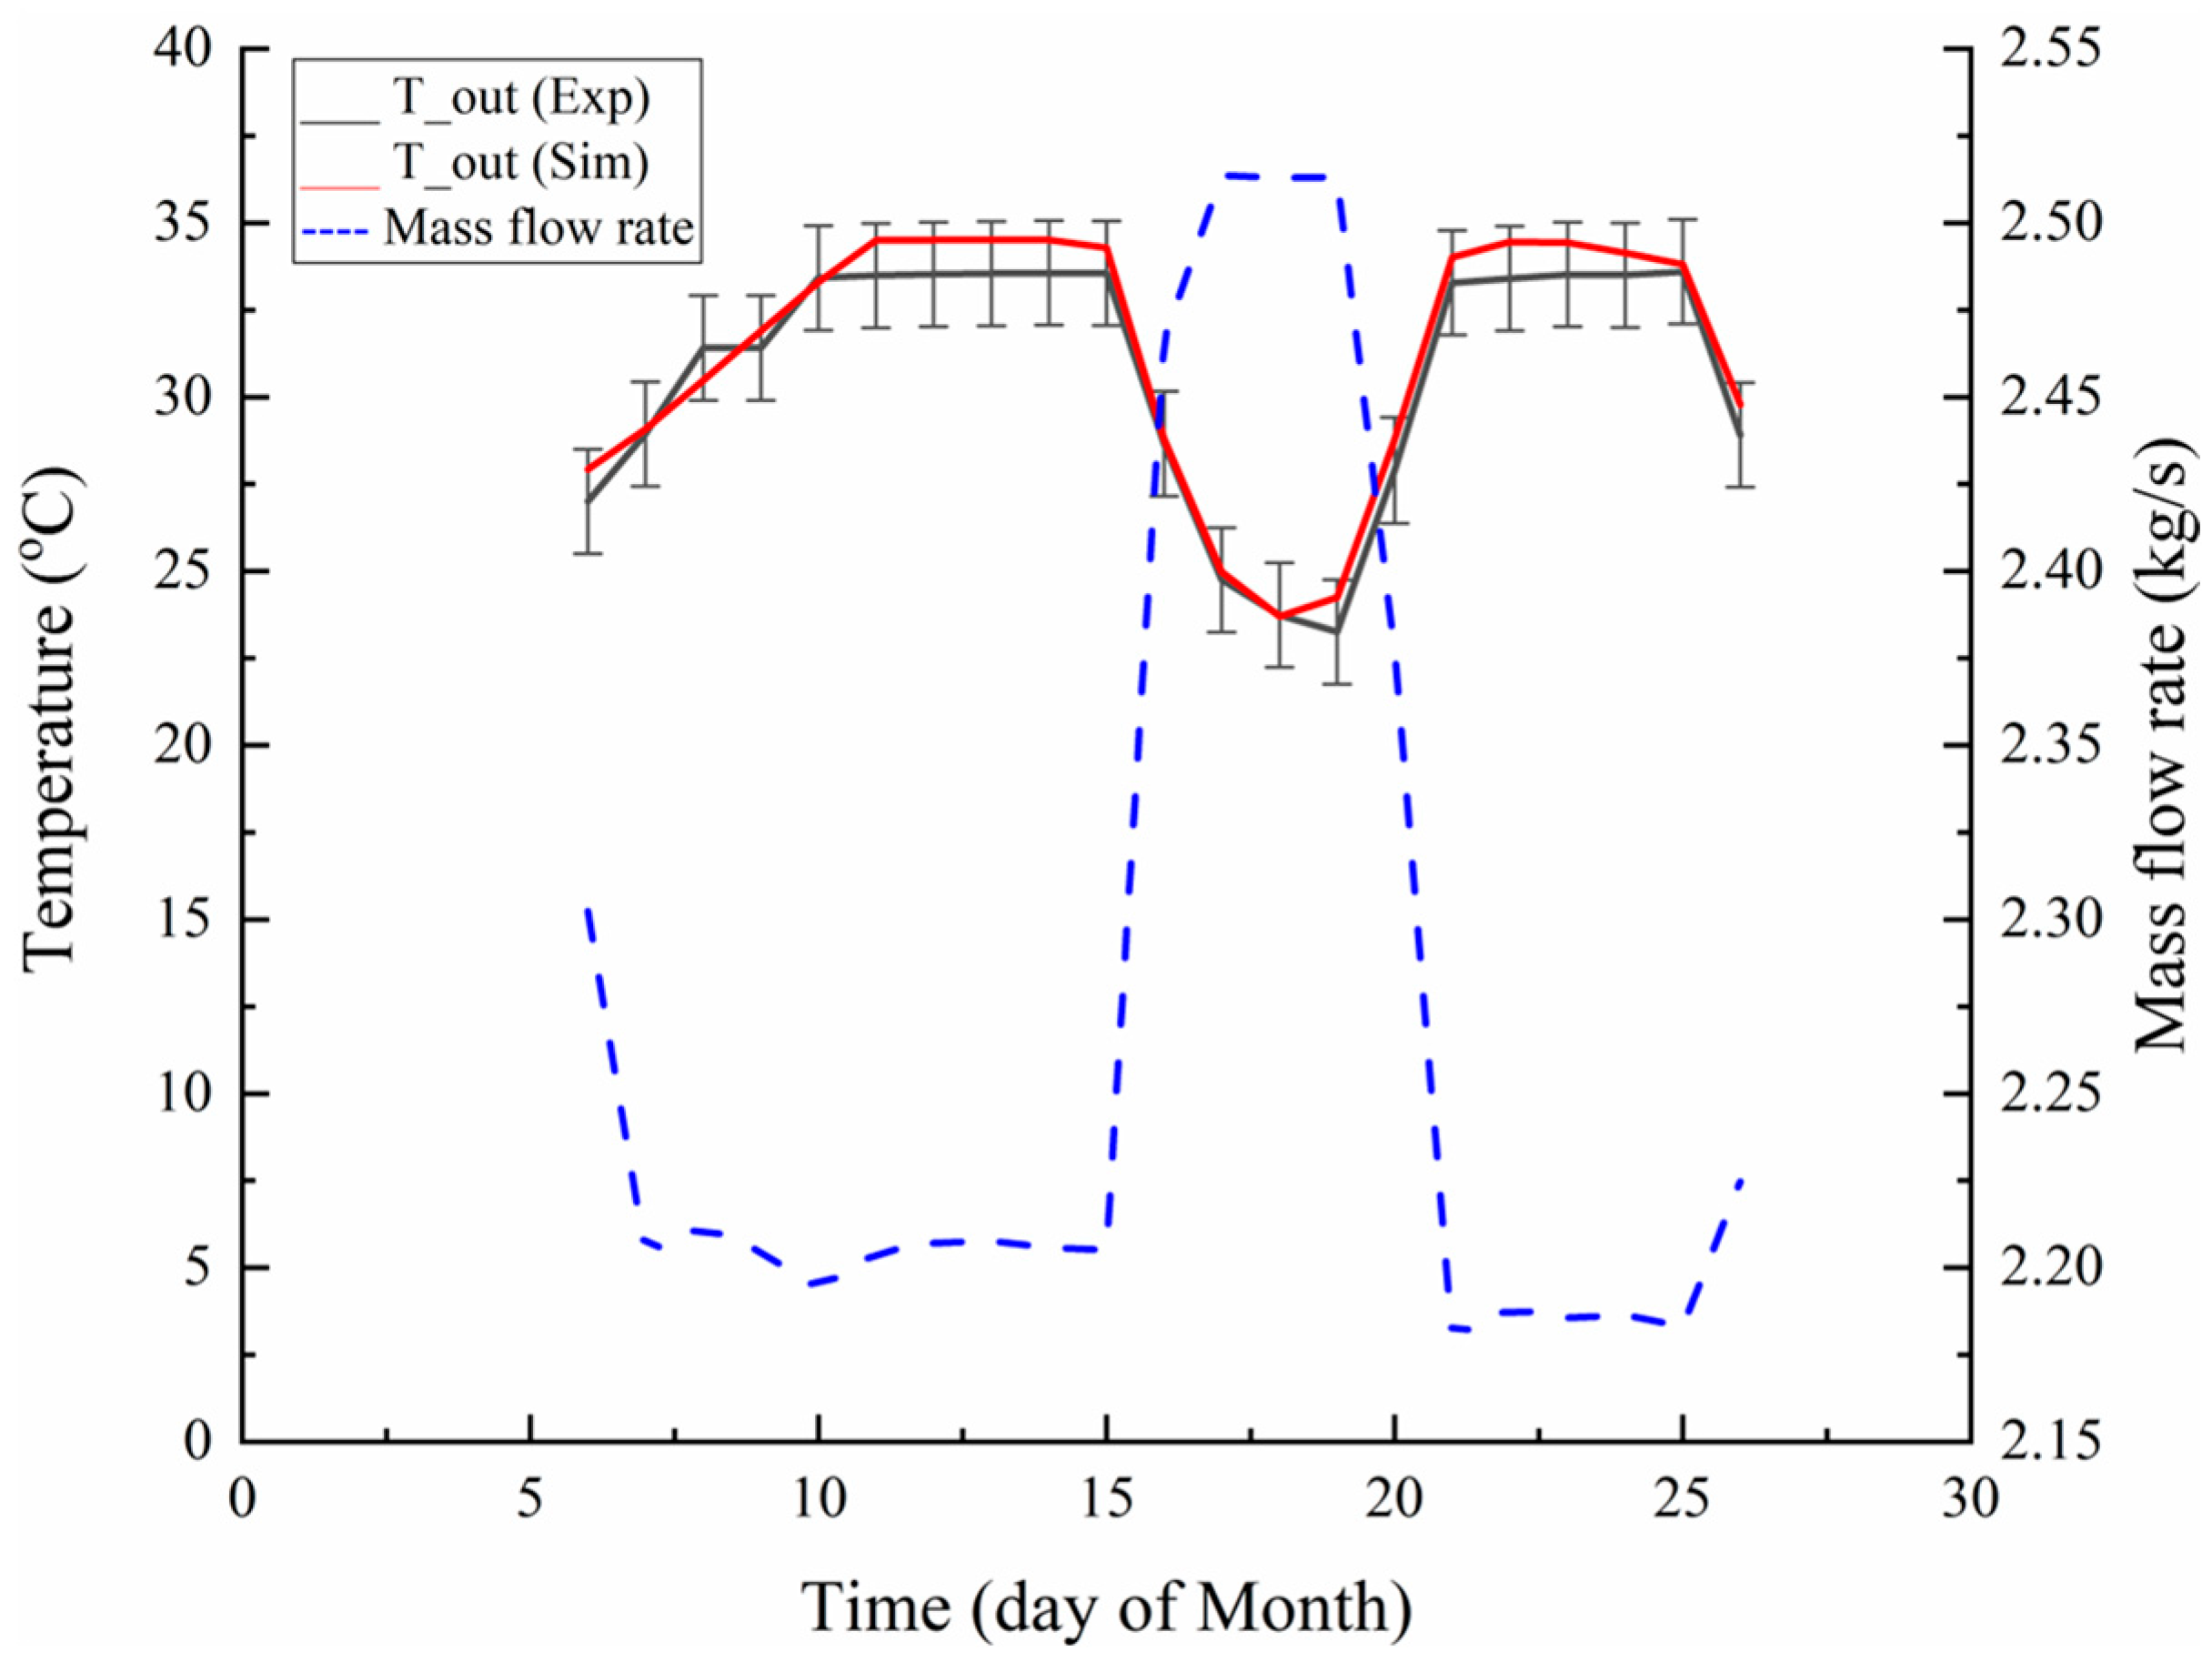
The tunnel has been used to simulate cooling during the months of July and August in Napoli, Southern Italy. The idea was to evaluate the heat exchange performance of the system when it interacts with the ground surrounding the tunnel, which has a significantly lower temperature with respect to the external air during these months. A temperature difference of 0.5 °C is observed between the inlet and outlet temperatures, due to heat transfer with the ground during the month of July. Similarly, during August, the inlet temperature and flow rate vary between 23 and 34 °C and 2.1 and 2.5 kg/s, respectively, through observing the system response at the outlet. The measured data have been compared to the model results to validate it. Figure 12 shows the variation in the outlet temperature when the mass flow rate is changed during the experimental campaign and in the proposed model to test the thermal response of the system.
The red continuous line in Figure 12 represents the outlet temperature of one of the probes, and the black continuous line is the experimental outlet temperature recorded during the experiments. The blue dotted line represents the variation in flow rate during the month. As expected, the reduced flow rate increased the outlet temperature and vice versa. The simulation results well-described the measured data.
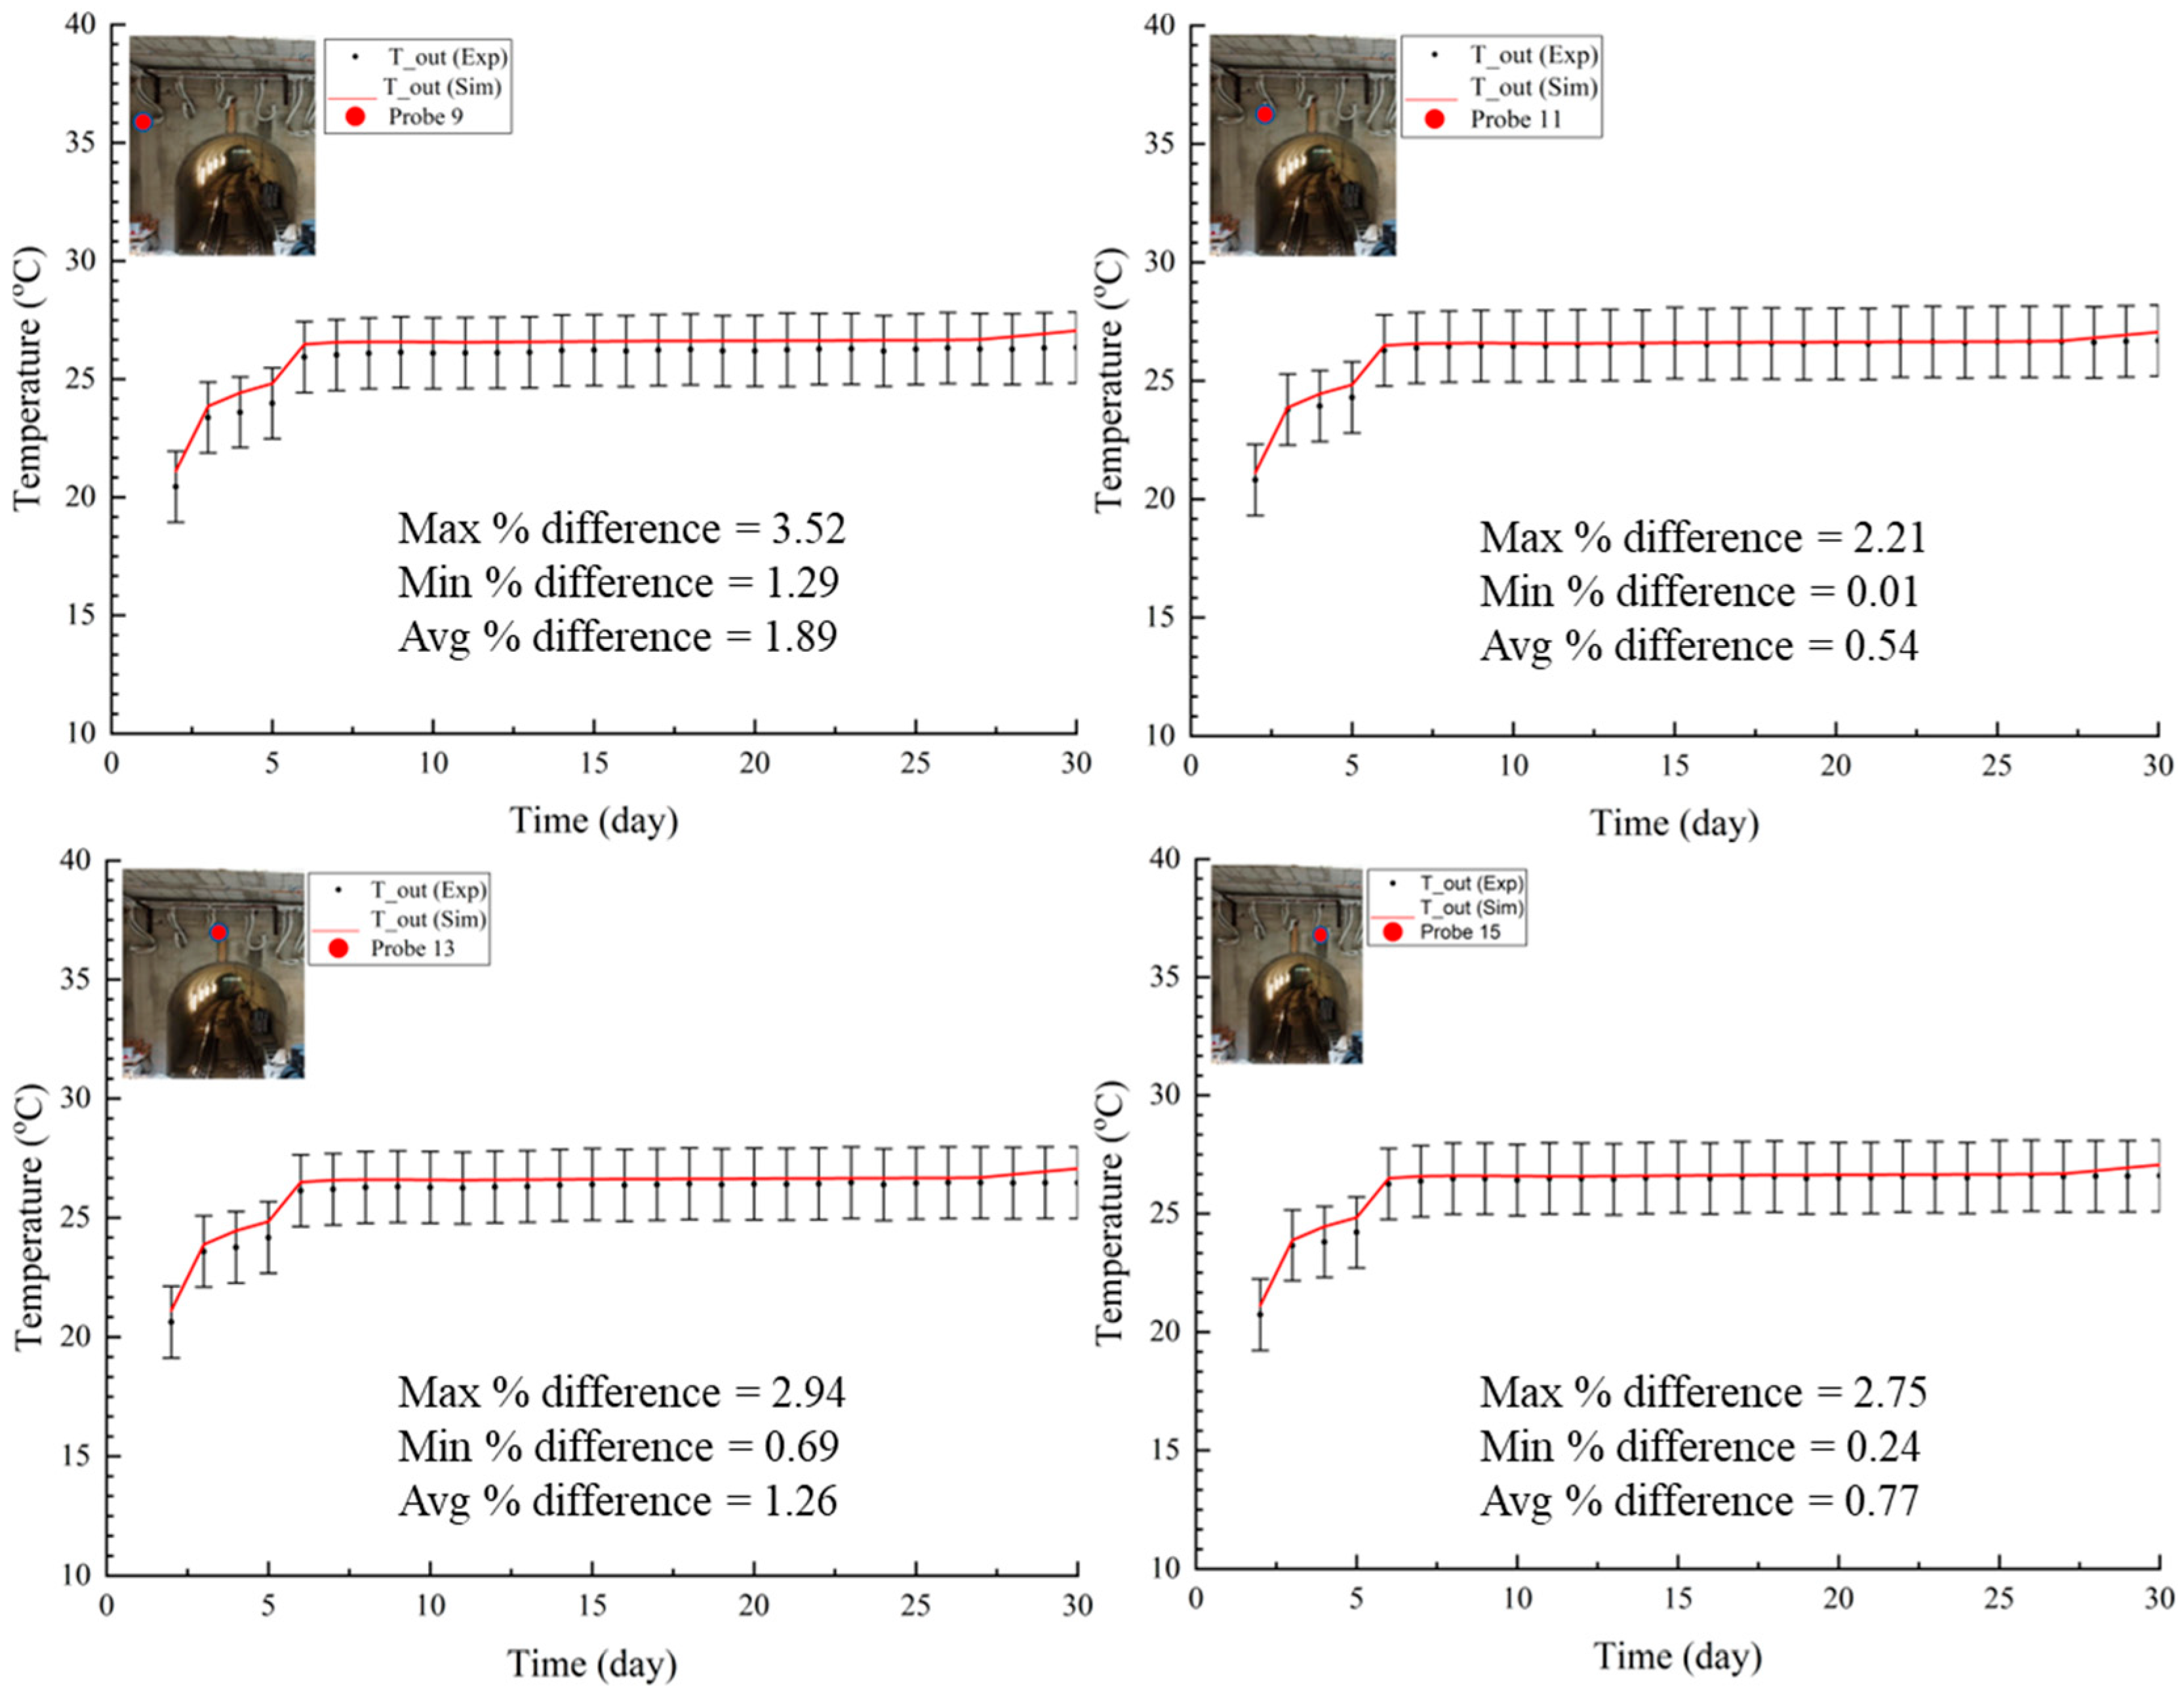
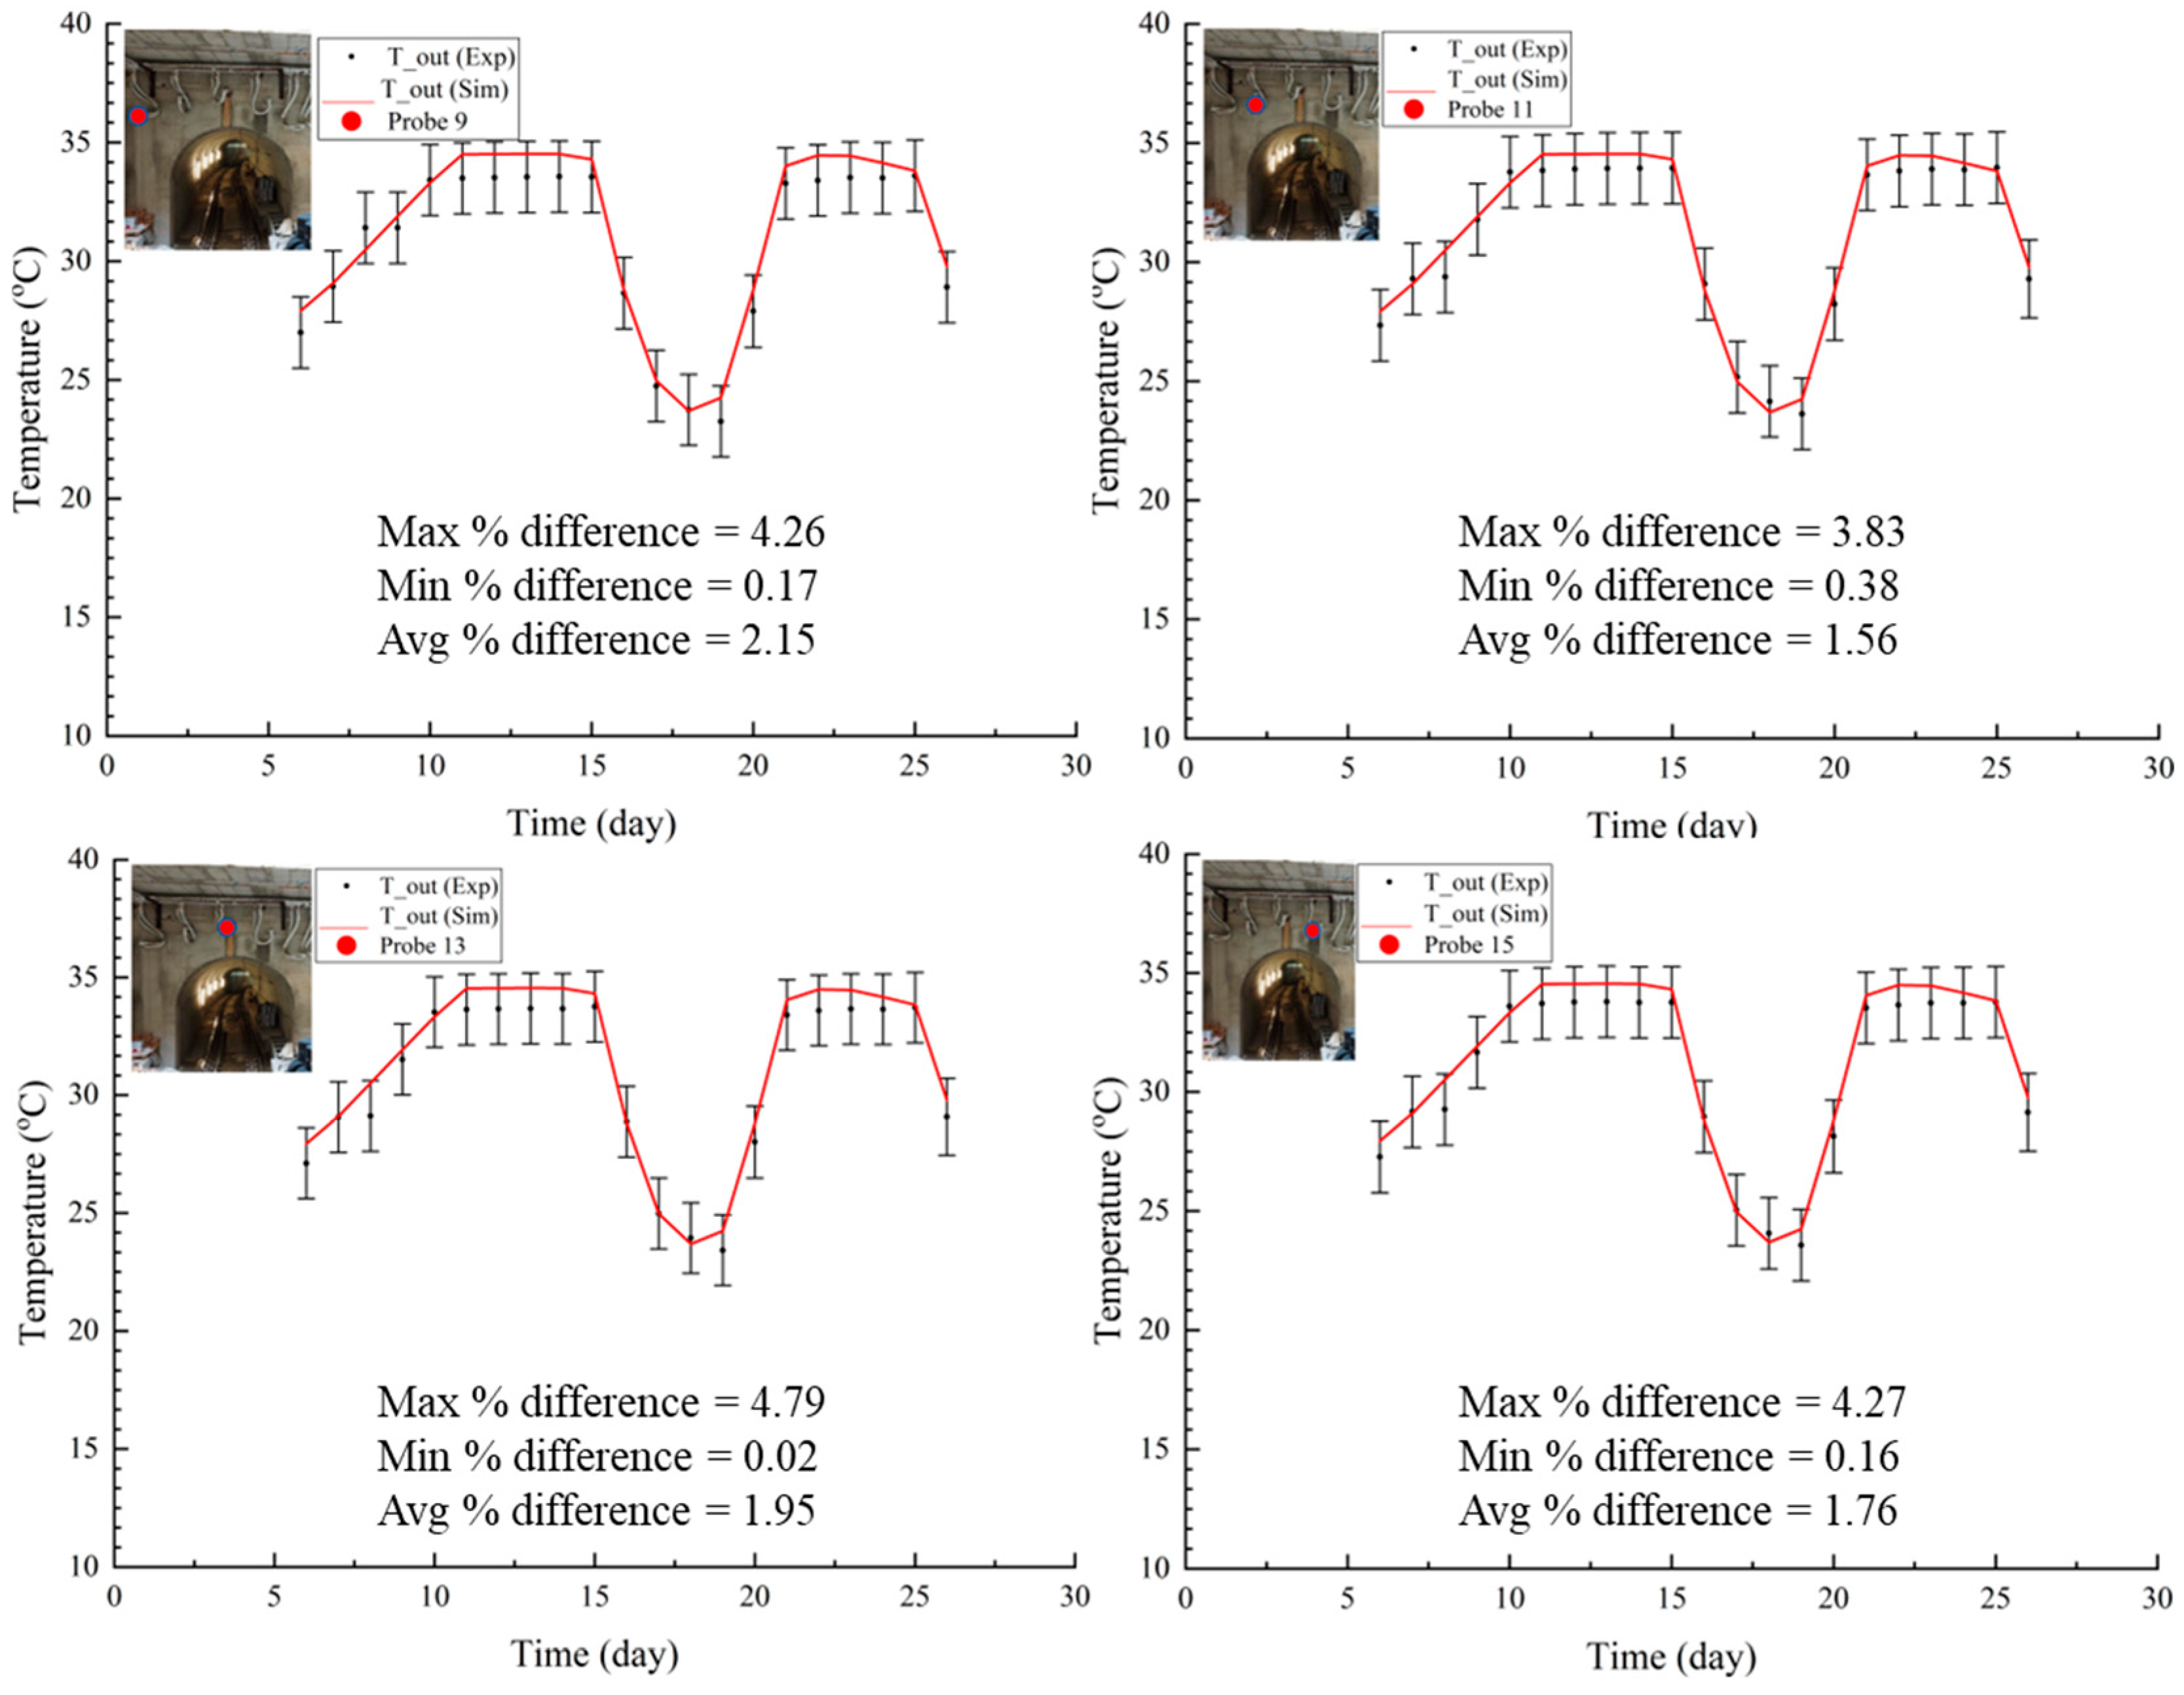
The graphs in Figure 13 and Figure 14 show the comparison between the computed and measured outlet temperatures for the months of July and August for the converted AGF pipes.
The experimental data is plotted with uncertainty, obtained for a 95% confidence level (k = 2). The modeling results (red continuous line) show good agreement with the experimental data. The maximum percentage difference between both values remained below 10%. The red dots in the Figure indicate the position of the probes near the tunnel.
As the cooling operation started in the month of July, the graphs show a slight hike, which shows the initial behavior of the system before achieving the constant inlet temperature of 26 °C for the rest of the month. To check the response of the system to varying conditions, the inlet temperature varied during the month of August. From the graphs in Figure 15, it can be observed that, for the month of August, the outlet temperatures for the converted AGF probes in the simulation model responded in the same way as those measured in the experimental campaign.
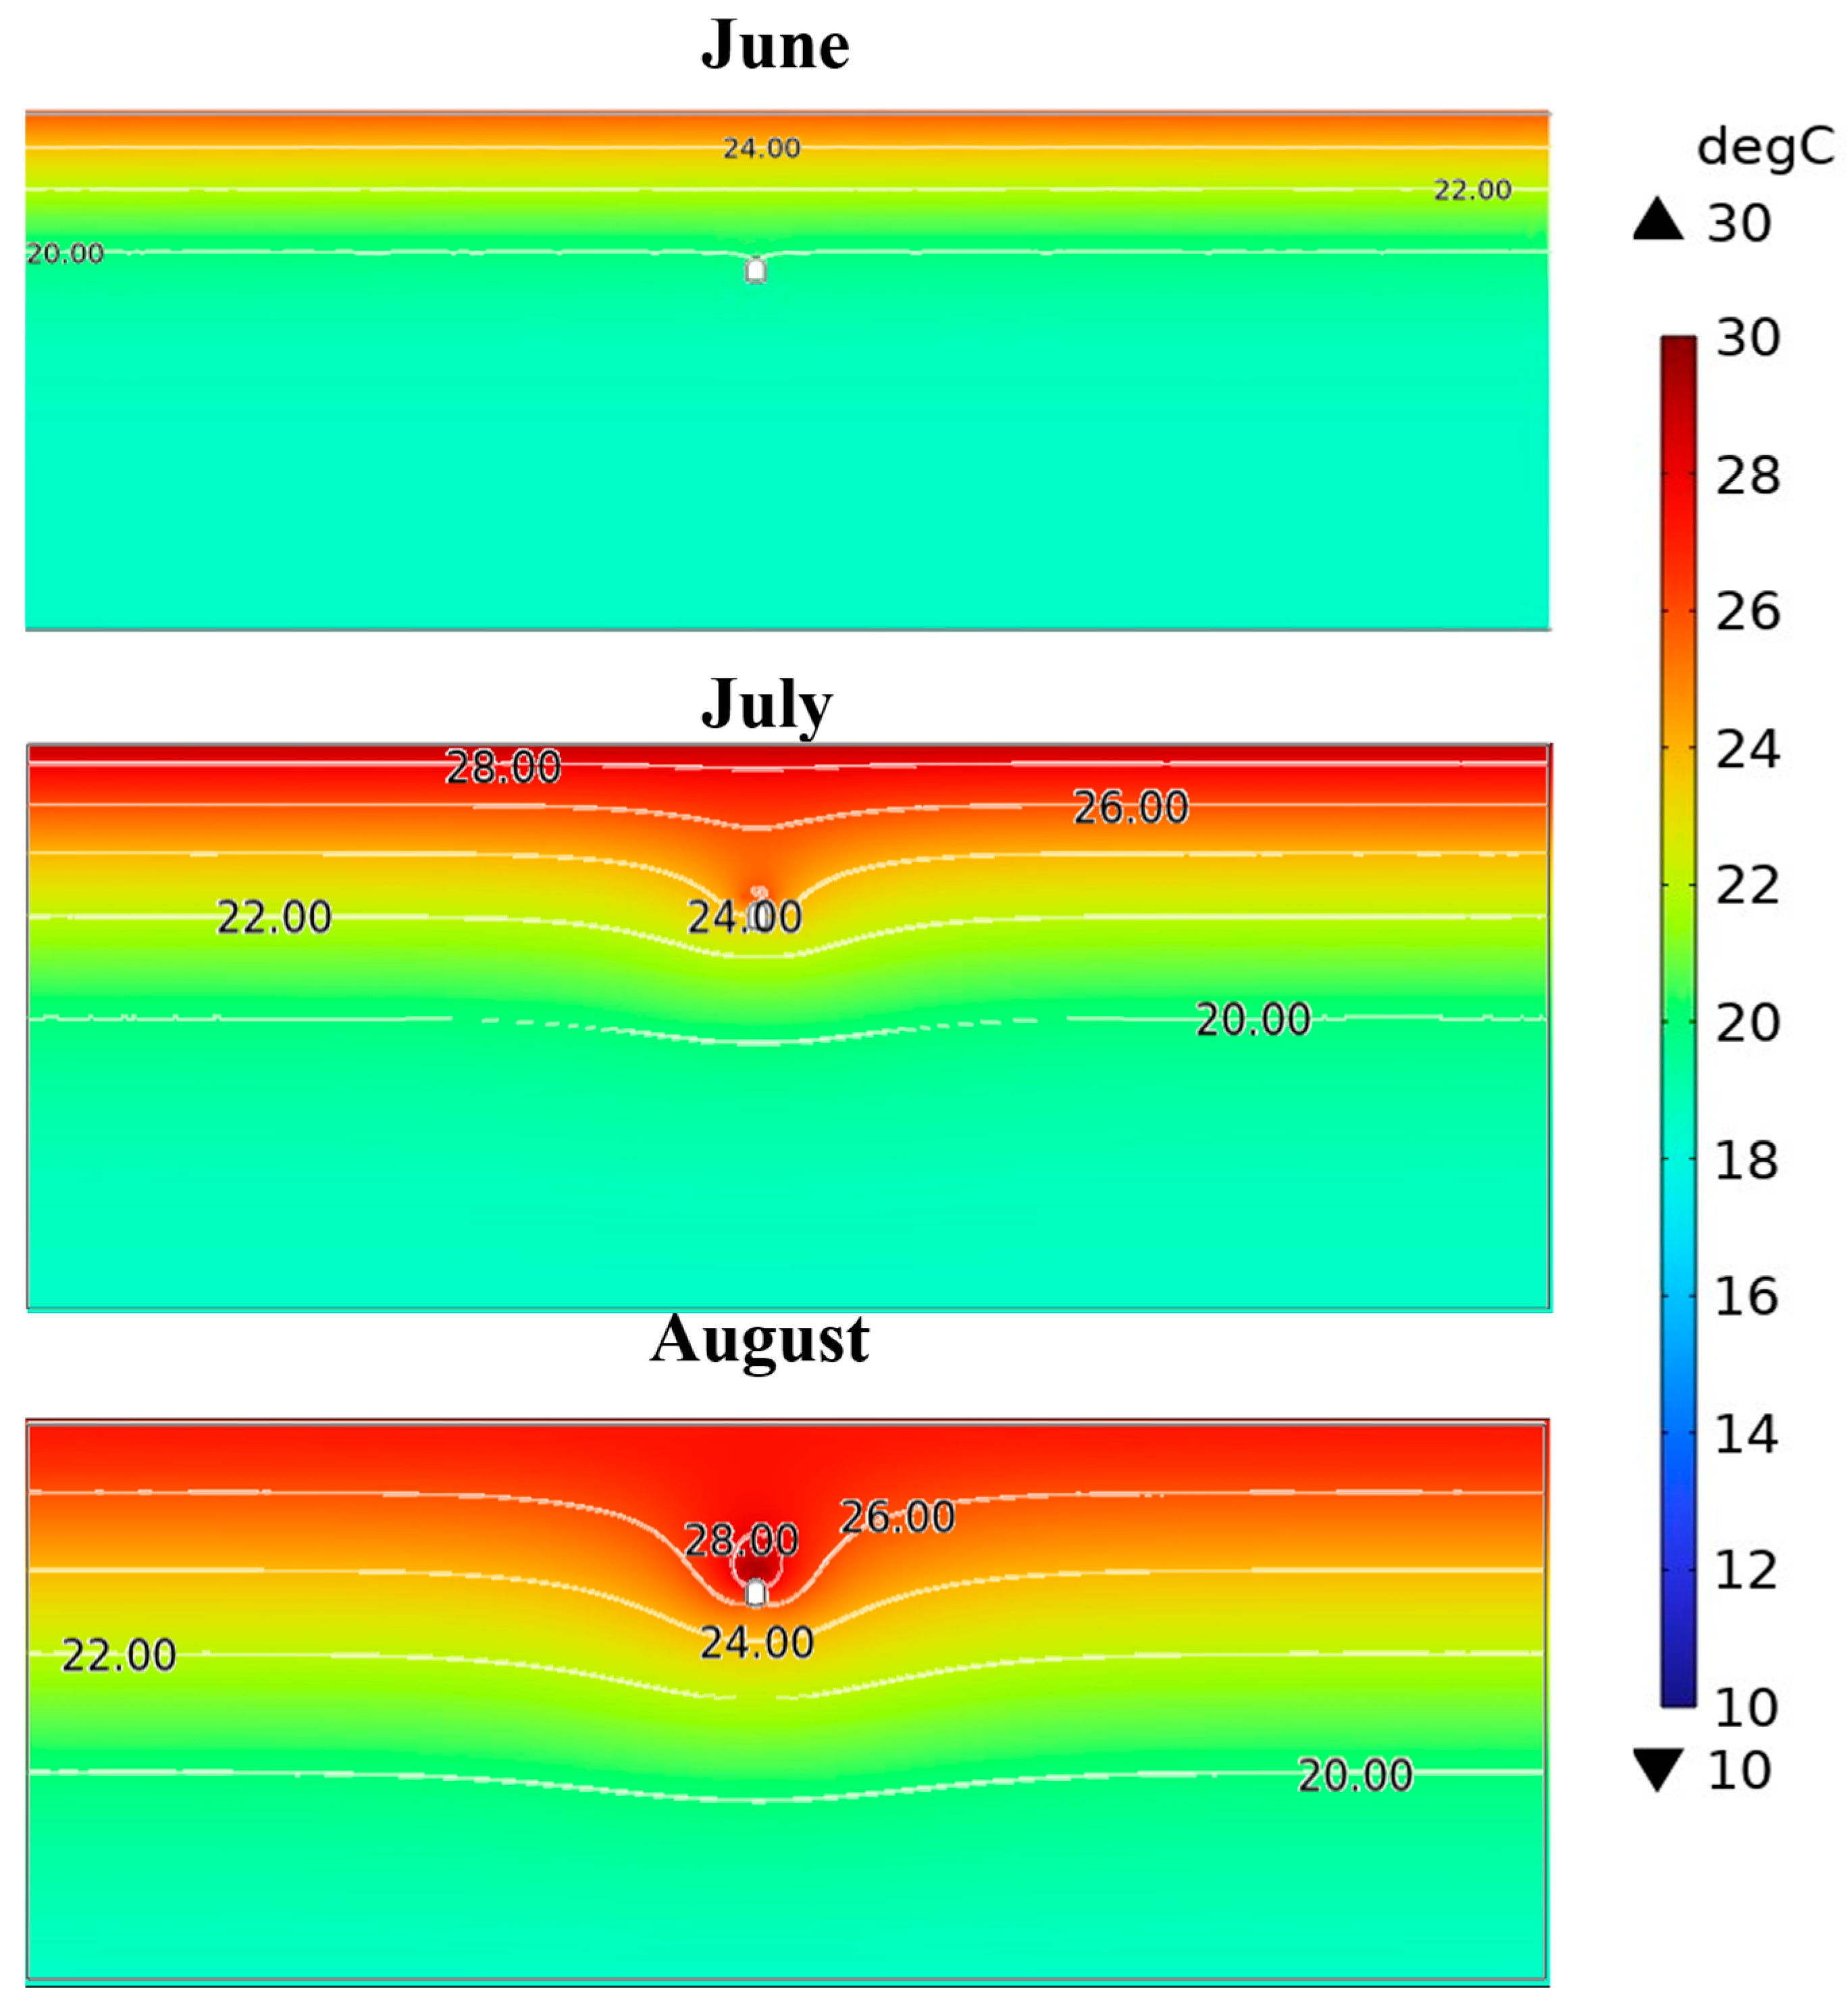
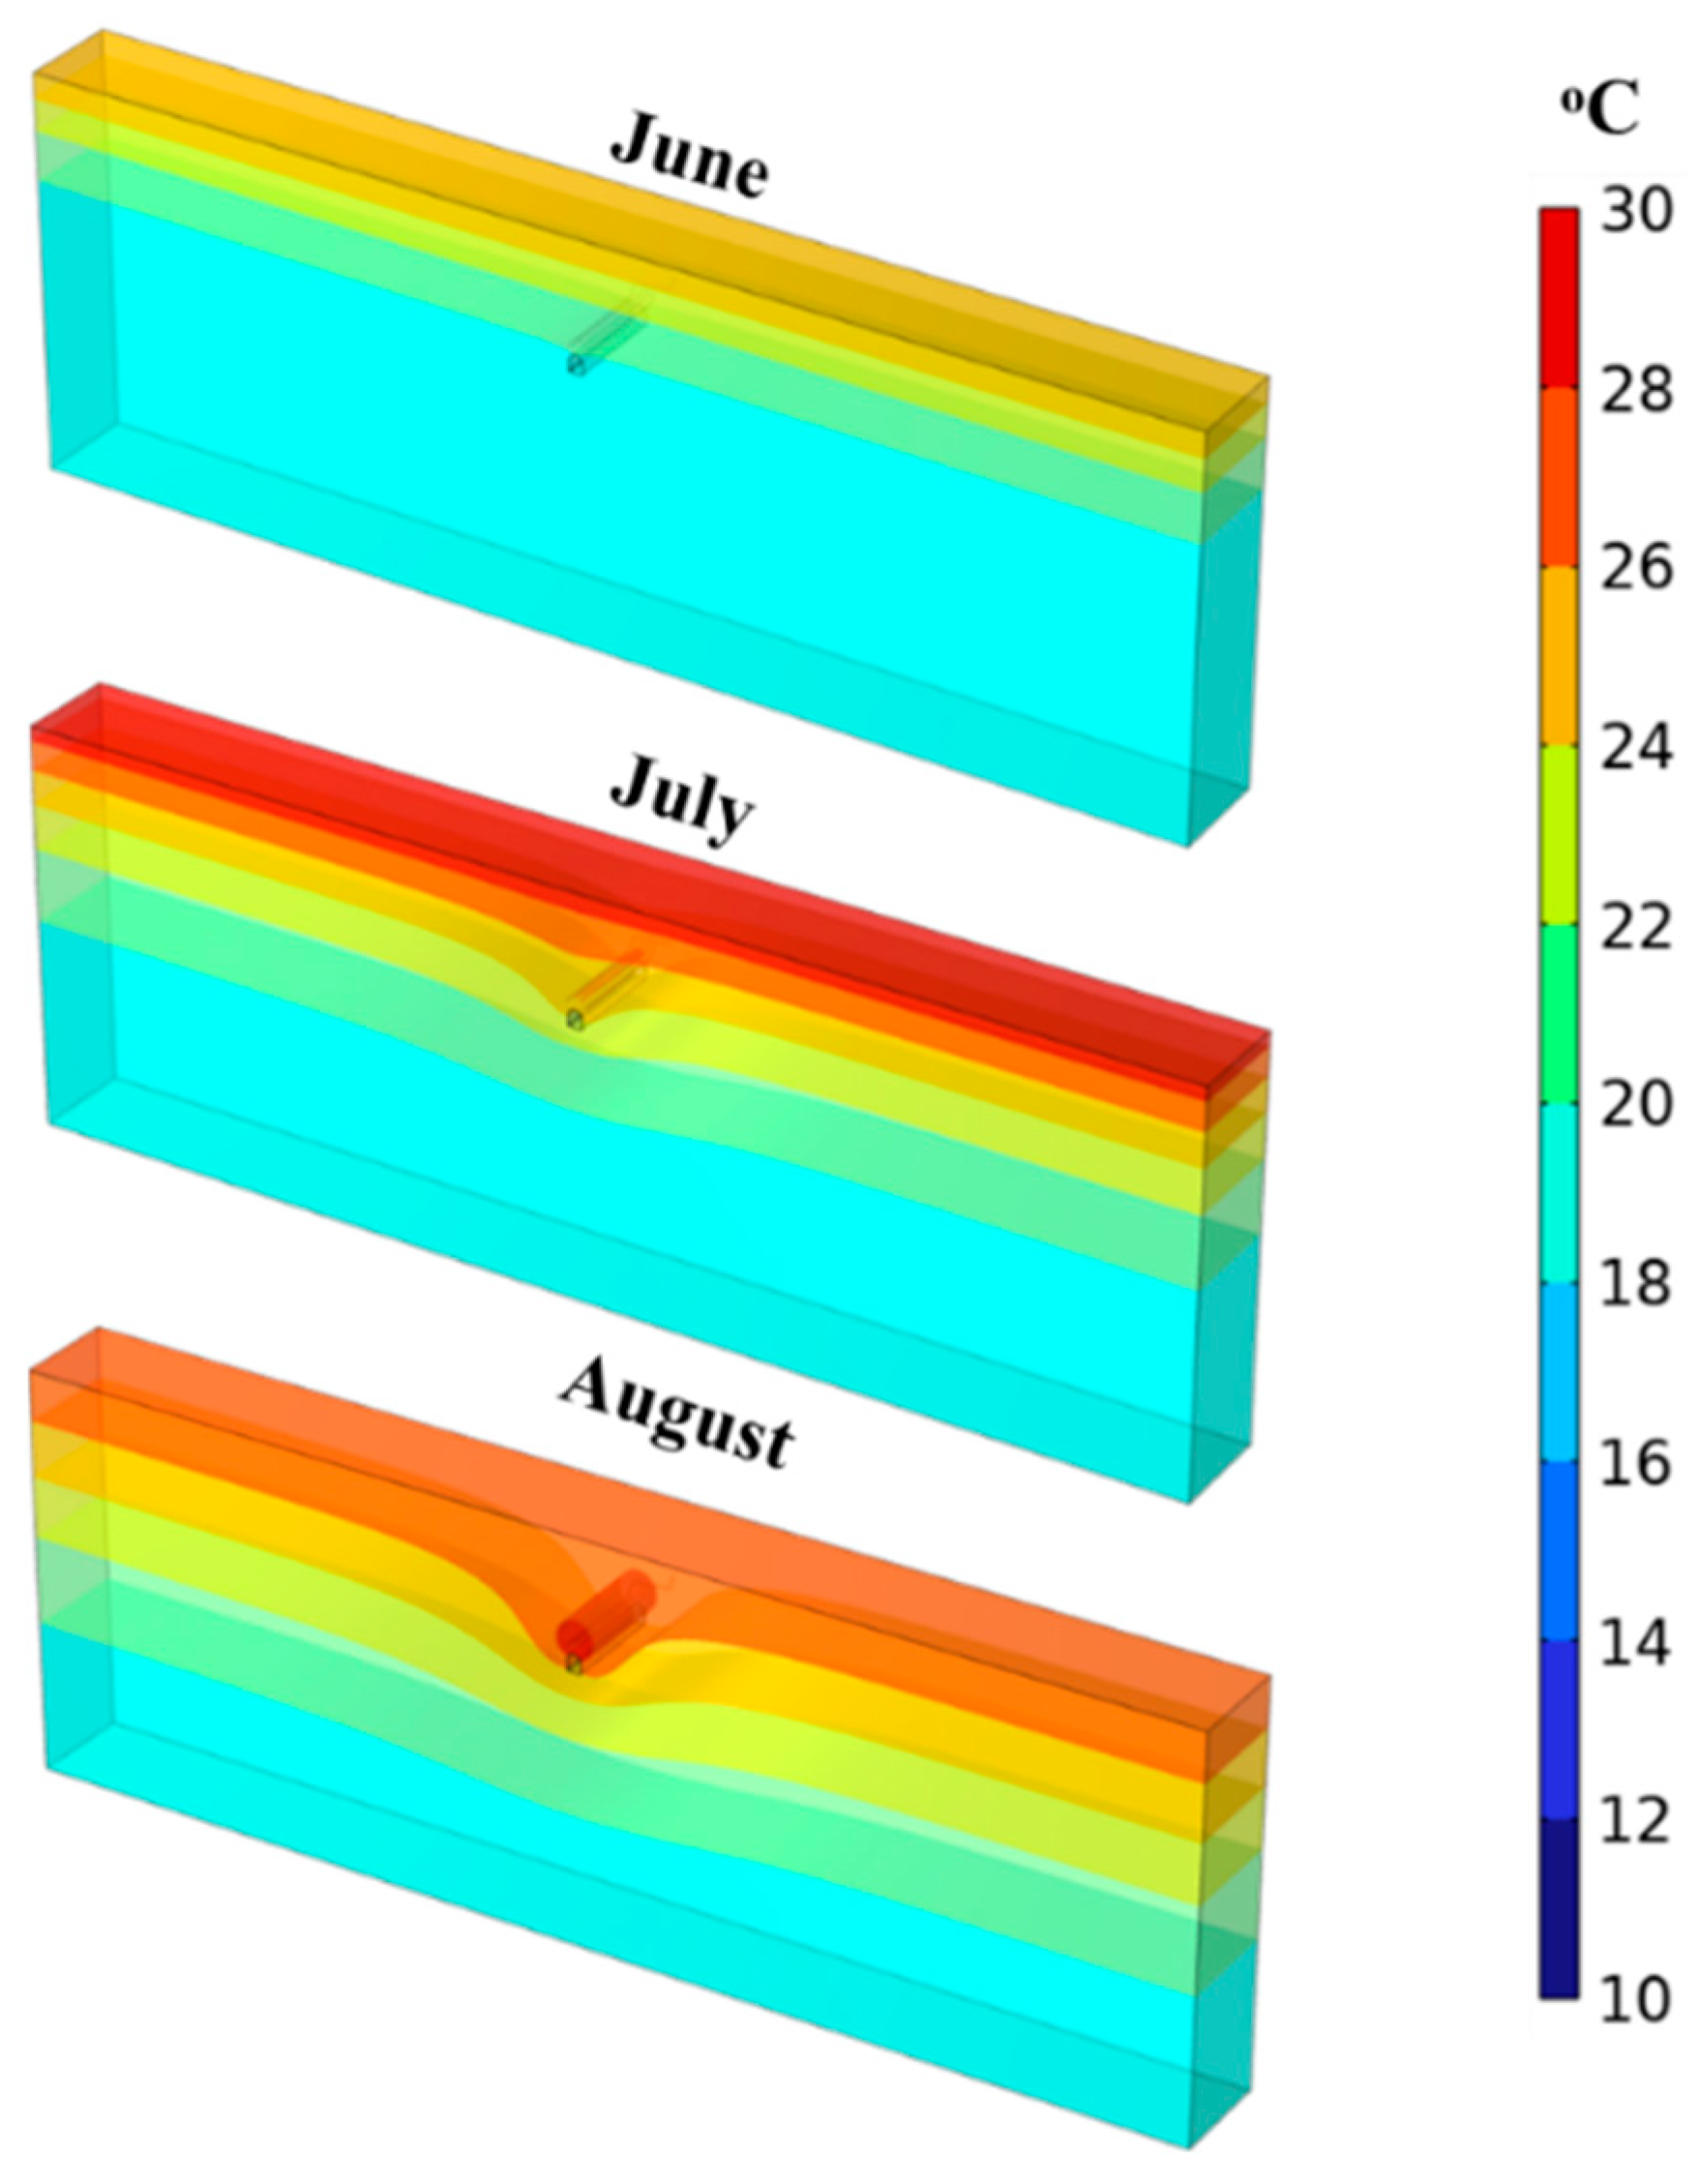
The ground temperature surrounding the converted AGF probes after the heat transfer is important for the evaluation of the long-term performance of the system. During the cooling operation, the heat rejection by the probes will increase the temperature of the adjacent soil. Figure 16 presents the temperature contours in the domain during the cooling operation. It is worth mentioning that the effect of ambient temperature at the ground surface also contributes to the temperature rise close to the tunnel area during the summer months. Due to surface temperature interference, it is considered to simulate the month of June with ambient conditions without thermally activating the tunnel to obtain close-to-actual thermal conditions for the months when the tunnel is thermally activated. During June, no flow for HTF was considered, and the related boundary conditions were applied. It can be noted that the surface temperature affected the temperature of the domain in the vicinity of the tunnel and, therefore, the heat transfer phenomenon during the cooling cycle. Different isotherm contours in the domain can be observed when the tunnel is activated for a cooling operation.
Further details with isothermal lines are shown in the Appendix A, which presents the isothermal lines for the month of June above the tunnel, as the tunnel was not activated during the month of June. For the months of July and August, the temperature above the tunnel is increased due to diffusion of heat from the surface and the heat transferred from the probes, as a high temperature region can be observed around the tunnel, as seen in the iso-surfaces in August. During the cooling operation, heat is rejected into the tunnel domain, which ultimately reduces the HTF outlet temperatures by exchanging the heat between the AGF probes and the domain. Therefore, the temperature around the tunnel starts increasing, as shown in Figure 15.

4.2. Heating Mode

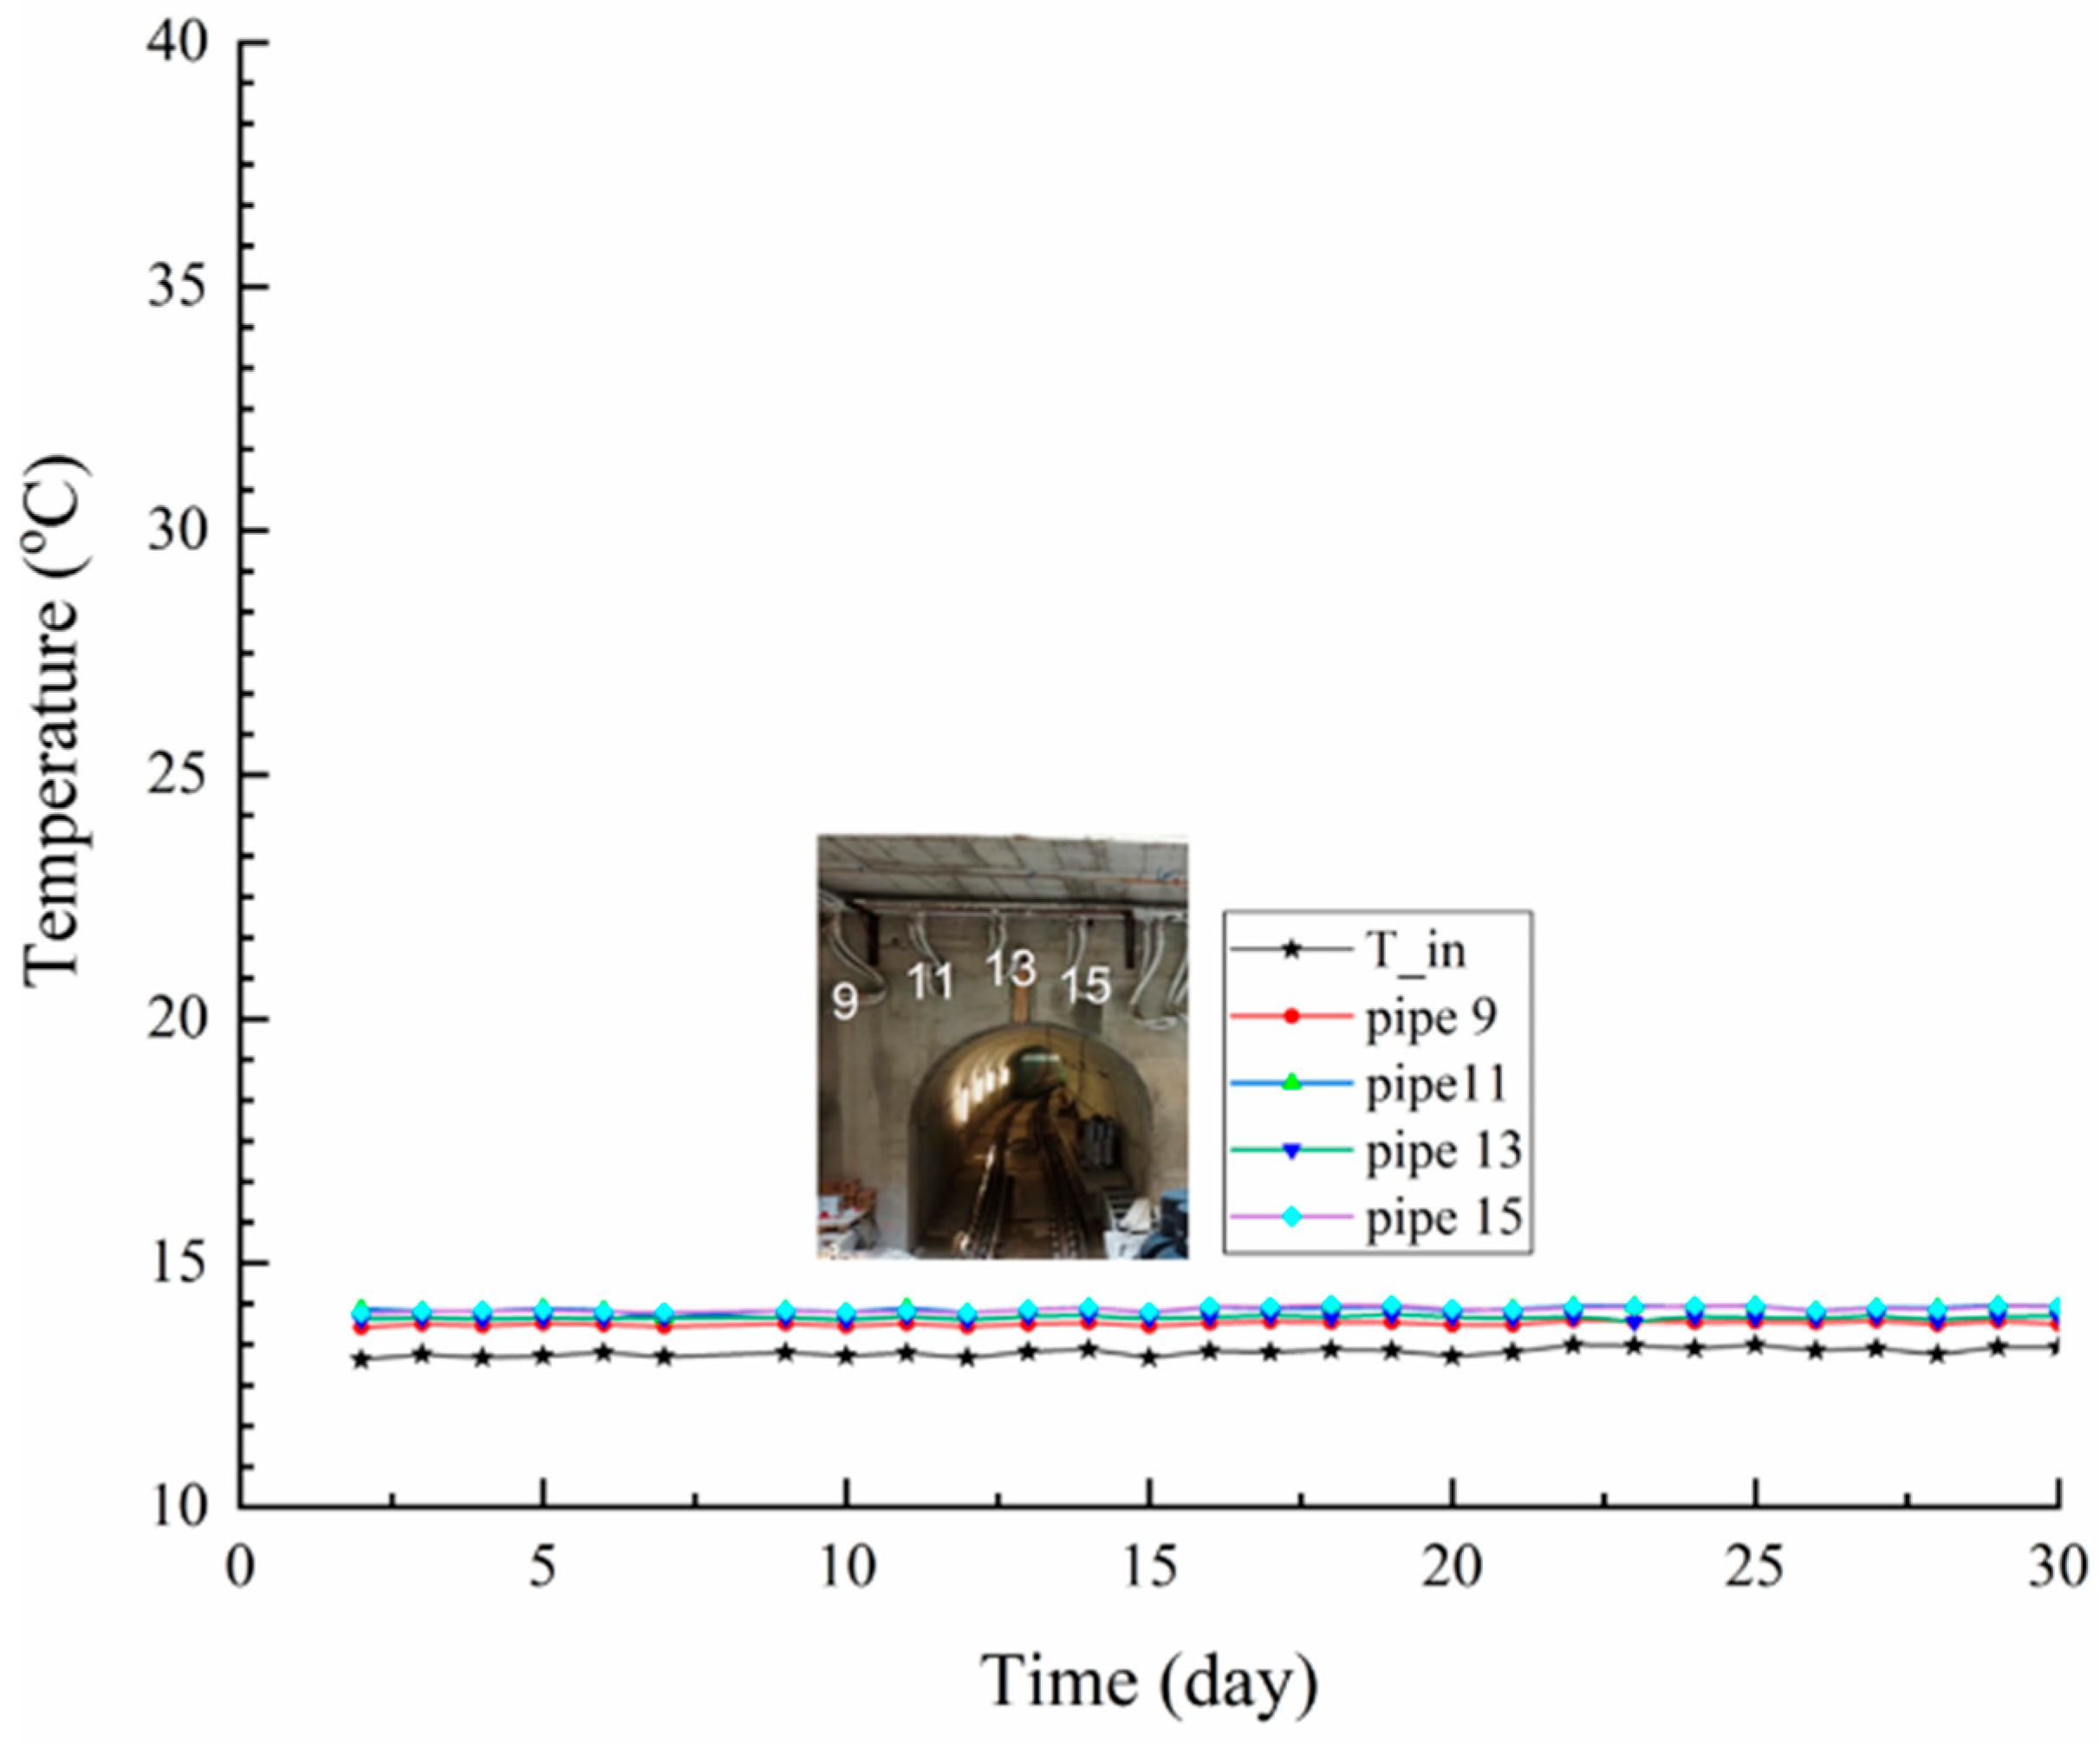
The heating operation of the tunnel consists of three months (September, October, and November). The tunnel’s operational mode is converted from cooling to heating by lowering the fluid inlet temperature of the probes and allowing it to gain heat from the surrounding soil. Appendix B compares the inlet temperature and outlet recorded temperature of the probes to determine the tunnel’s heating operation. The graphs in Appendix B demonstrate that the outlet temperature of all probes is higher than the inlet temperature, denoted as Tin, for the months of September, October, and November.
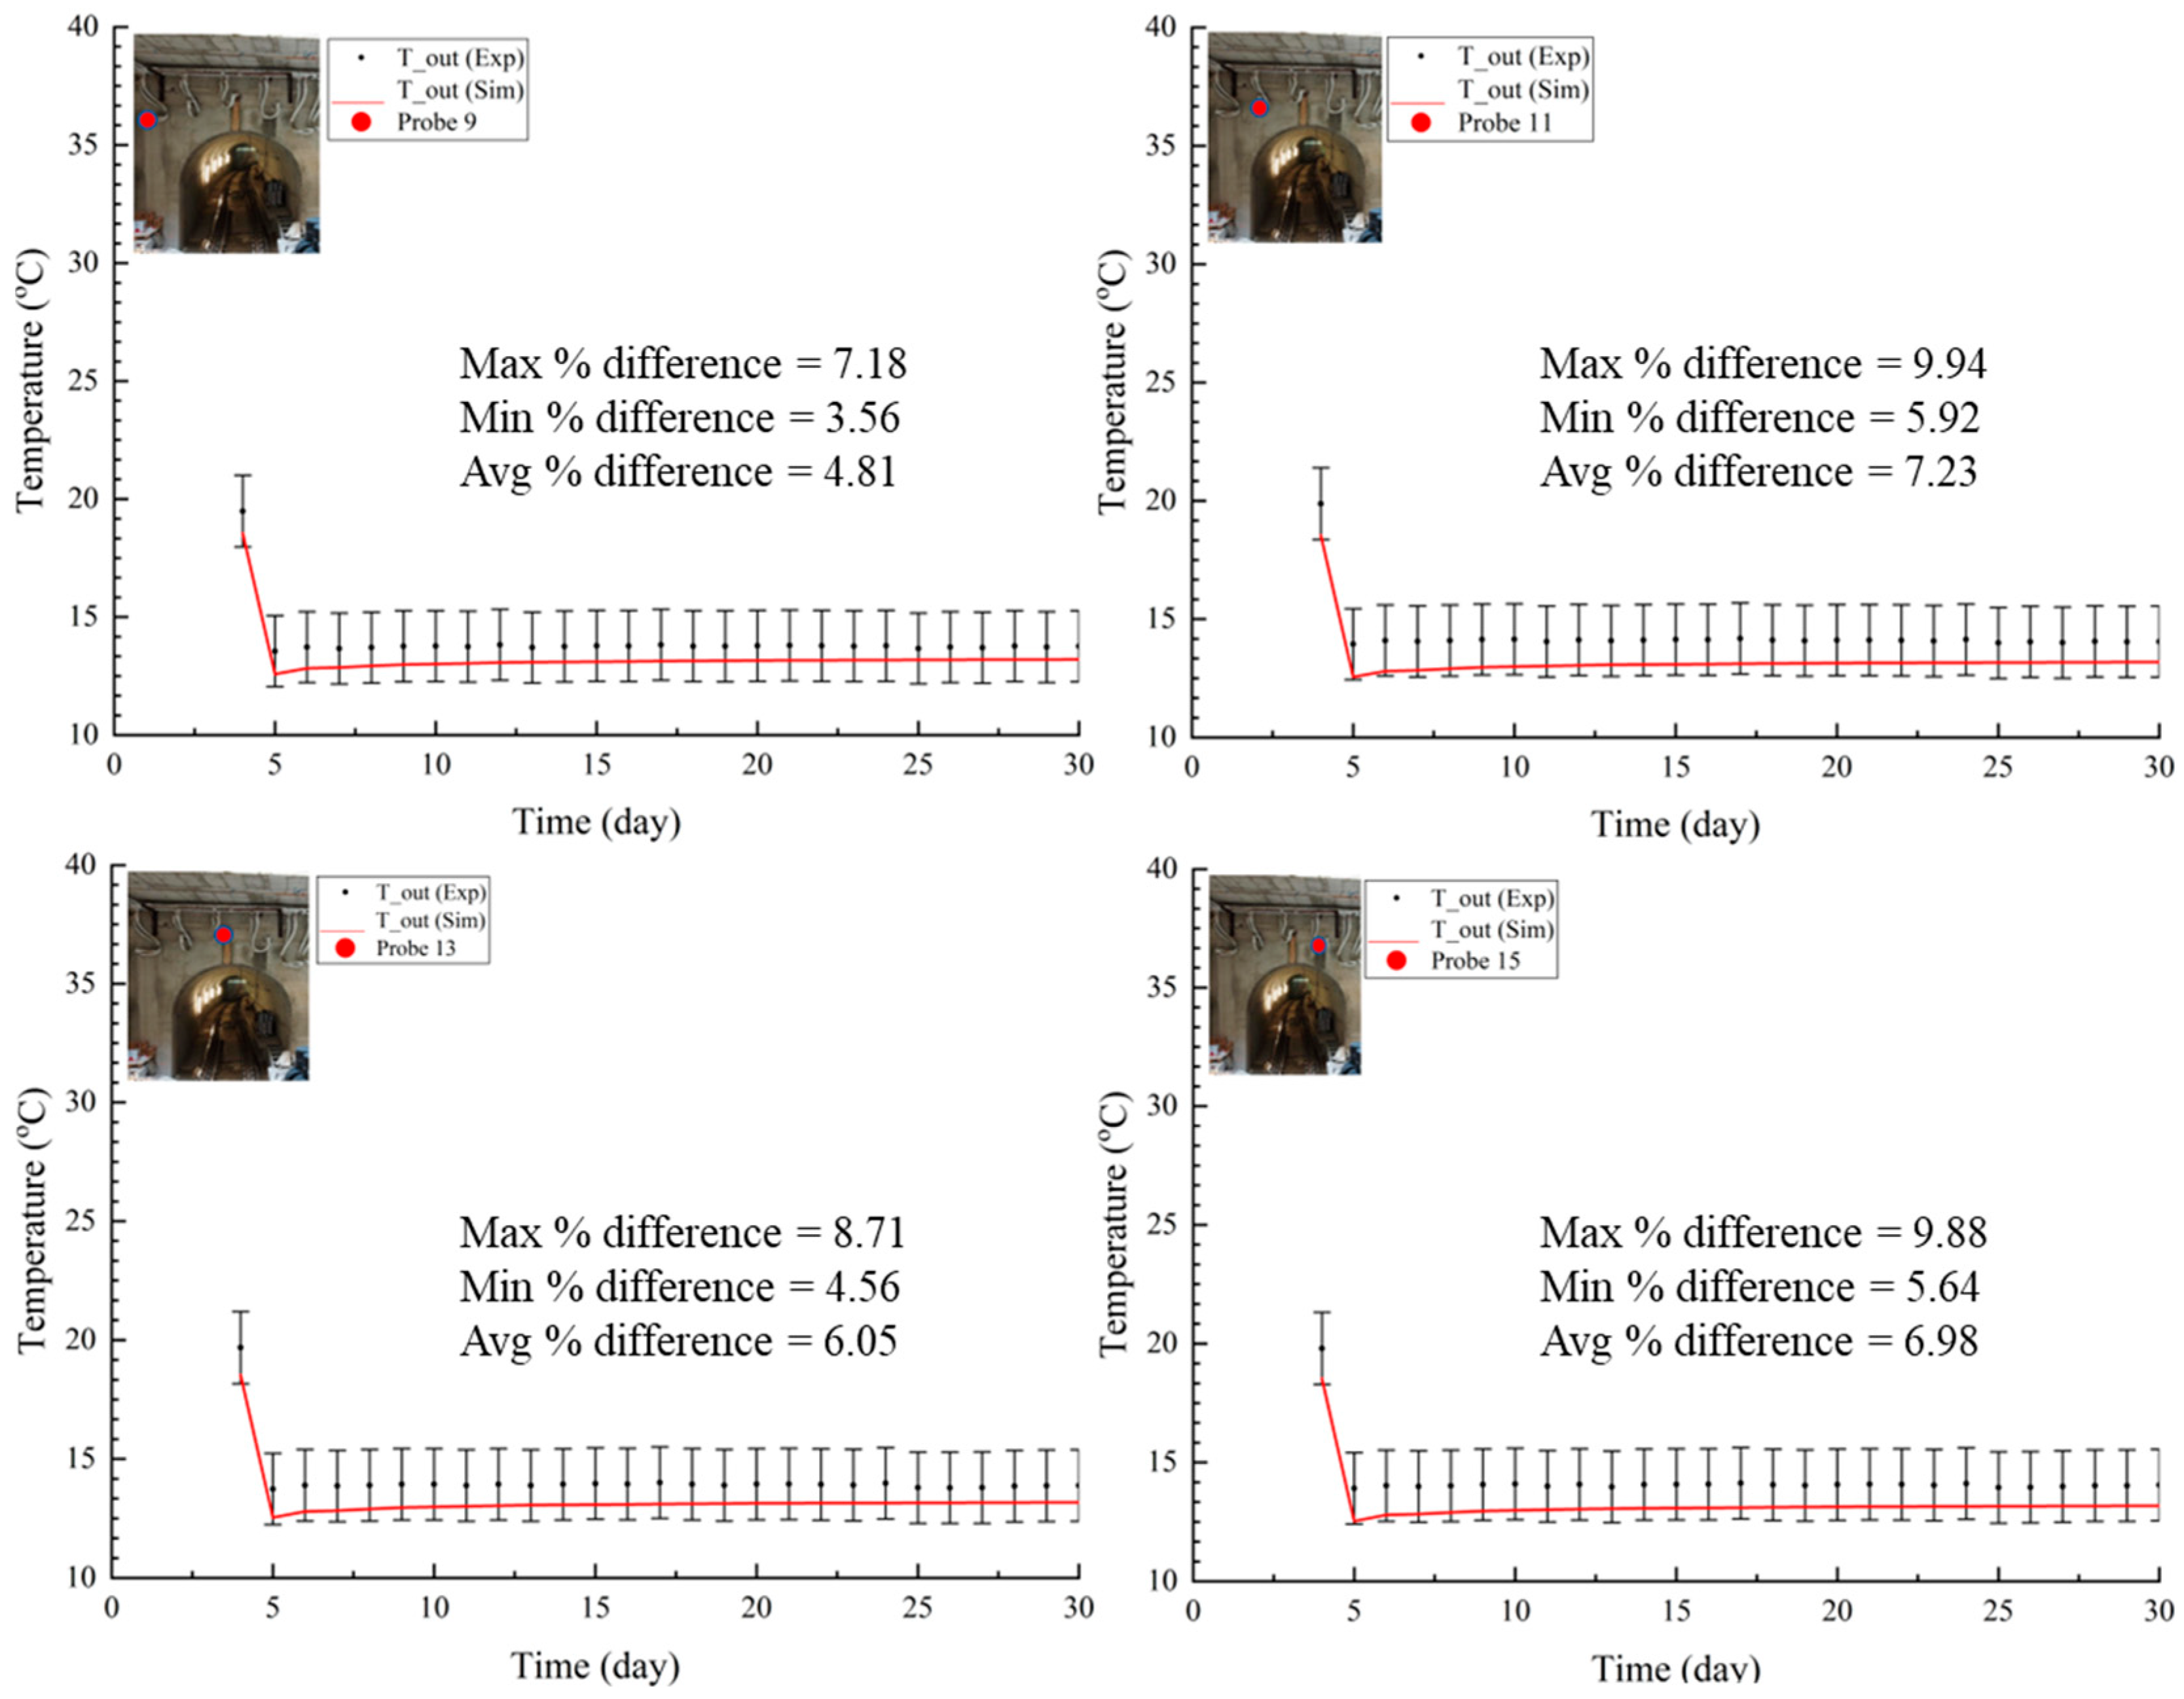
The probe temperatures of the simulated model for the heating period consist of September, October, and November and are validated against the experimental data obtained during the experimental campaign. Figure 16 shows the comparison of the calculated outlet temperature of probes, shown in a continuous red line, with the experimental values (black dots with error bars). The simulated results demonstrate good agreement with the experimental data. The graphs presented in Figure 16 show the temperature drop measured after the operation of the tunnel is changed from cooling to heating. This drop is due to the change in operation from cooling to heating. Once the inlet temperature for the heating operation is stabilized at 13 °C, the system is maintained at the same temperature during the heating operation.
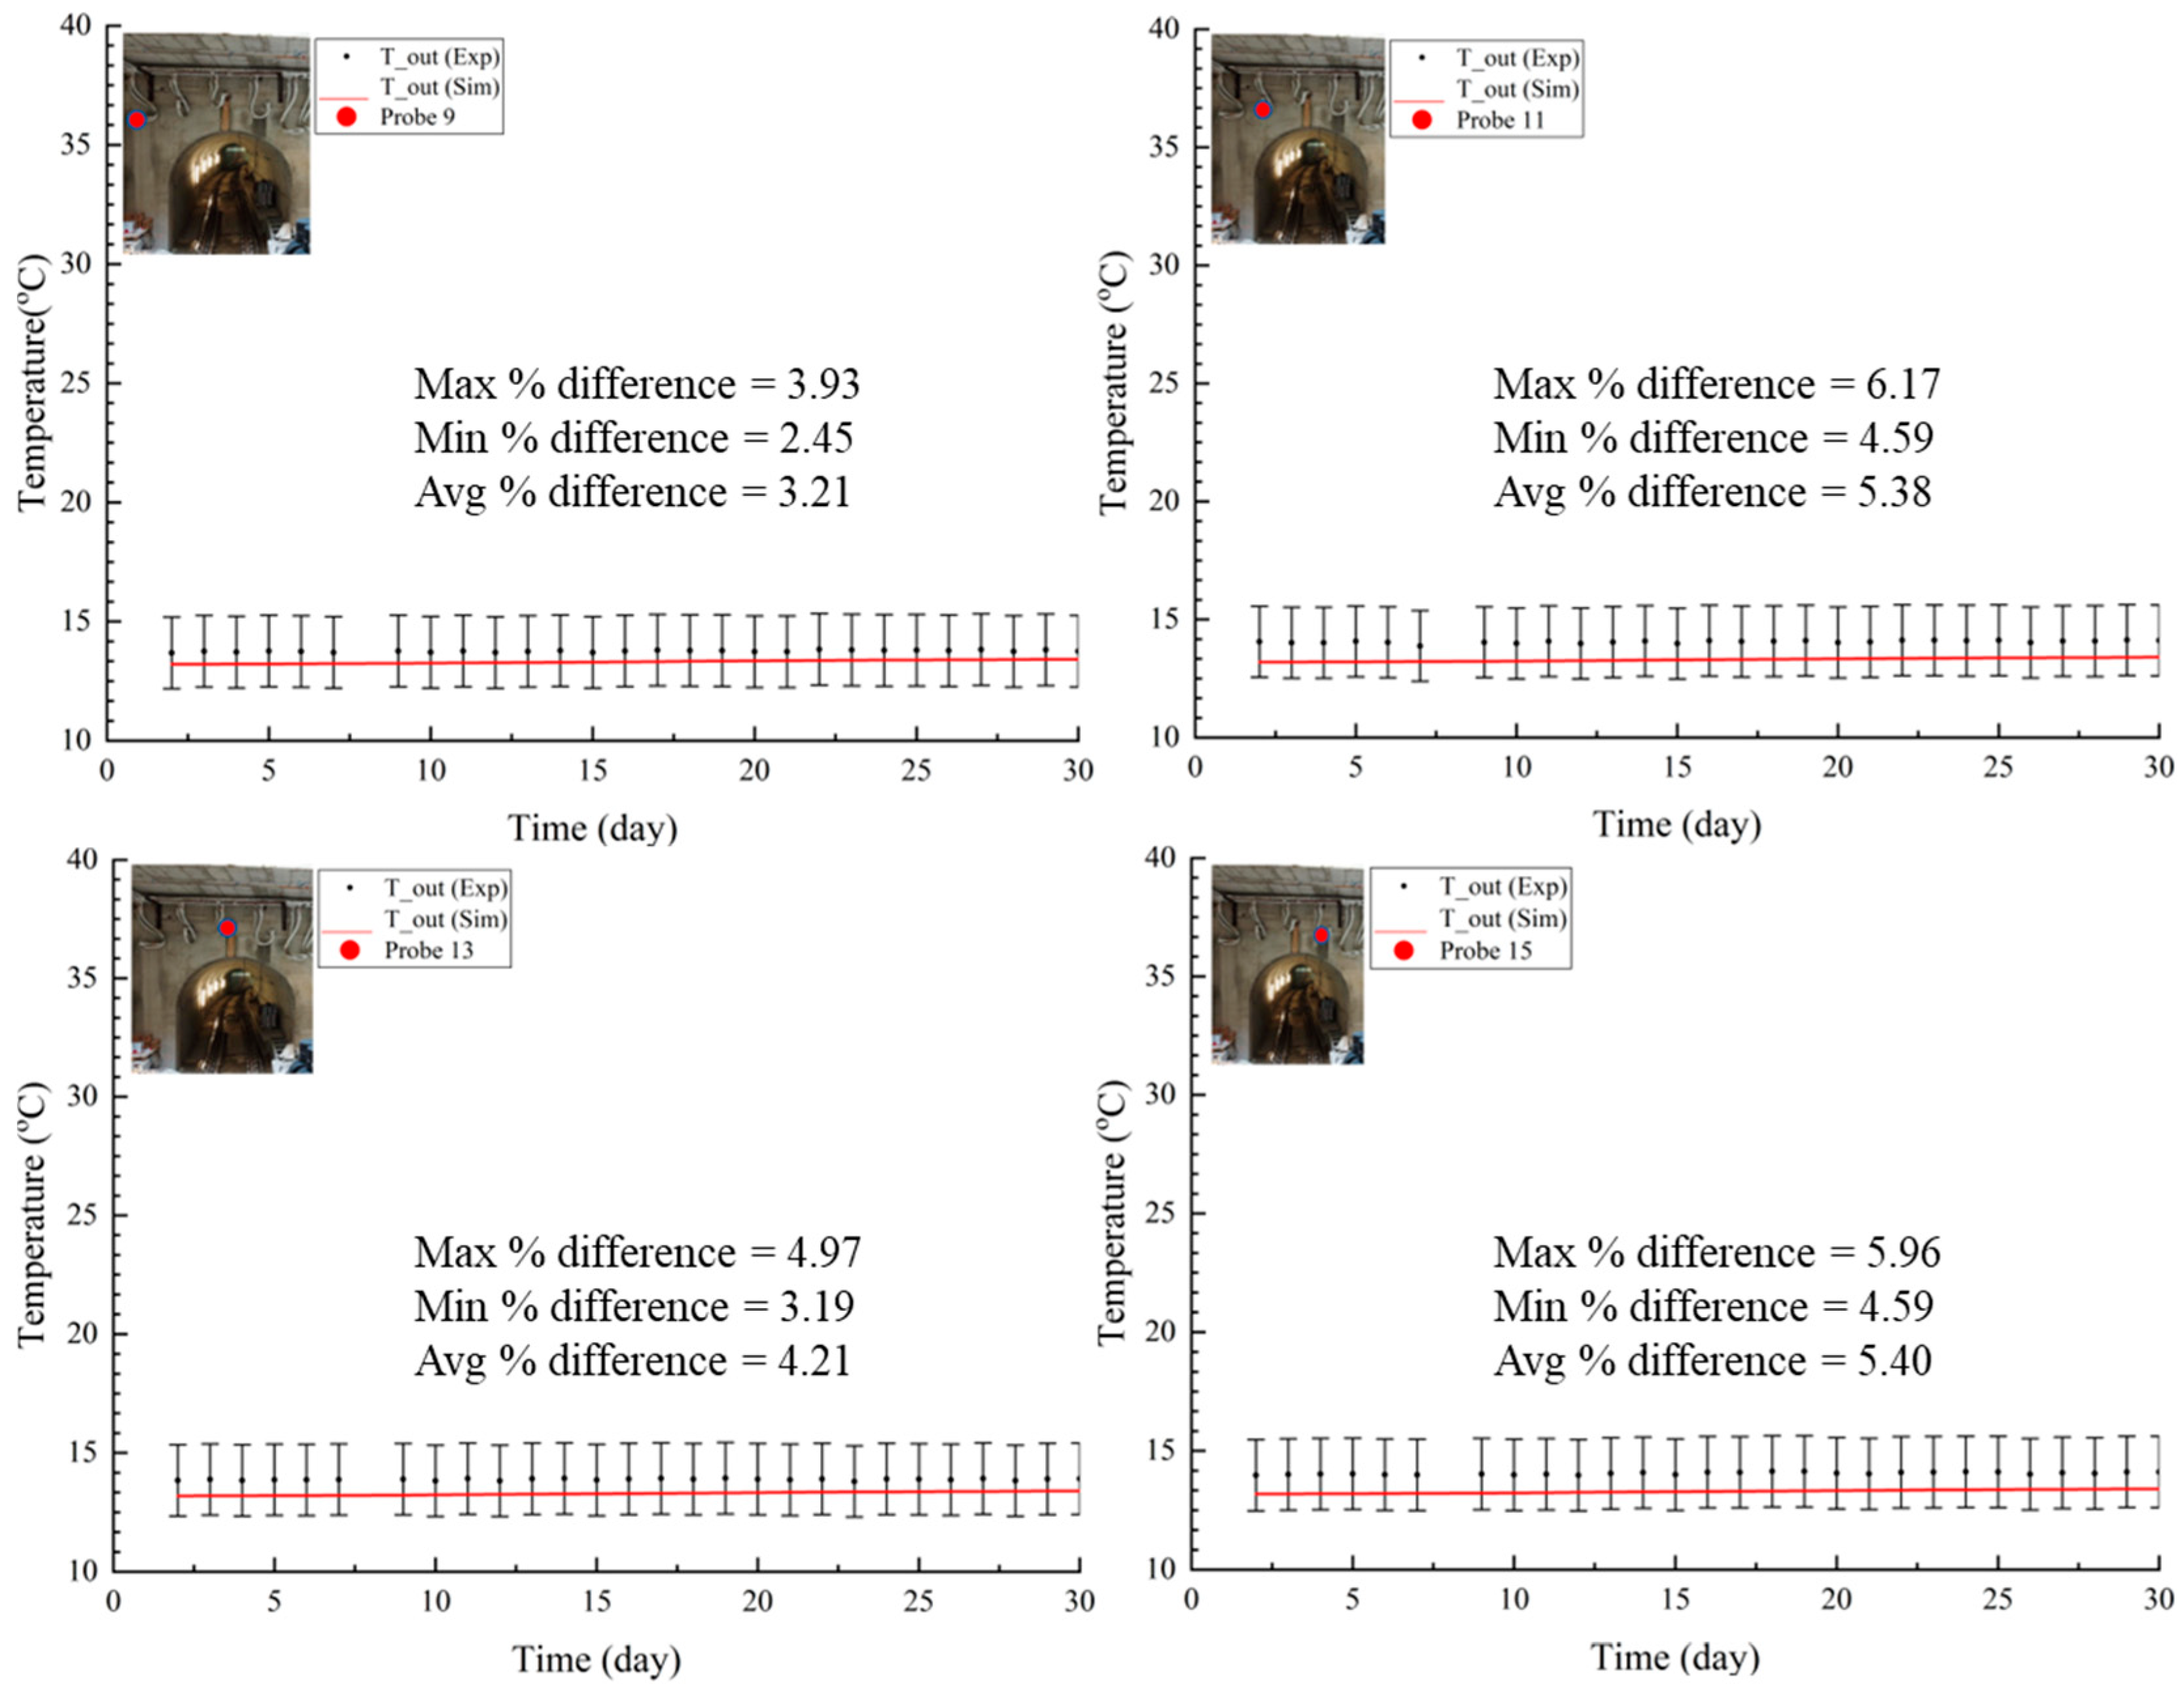
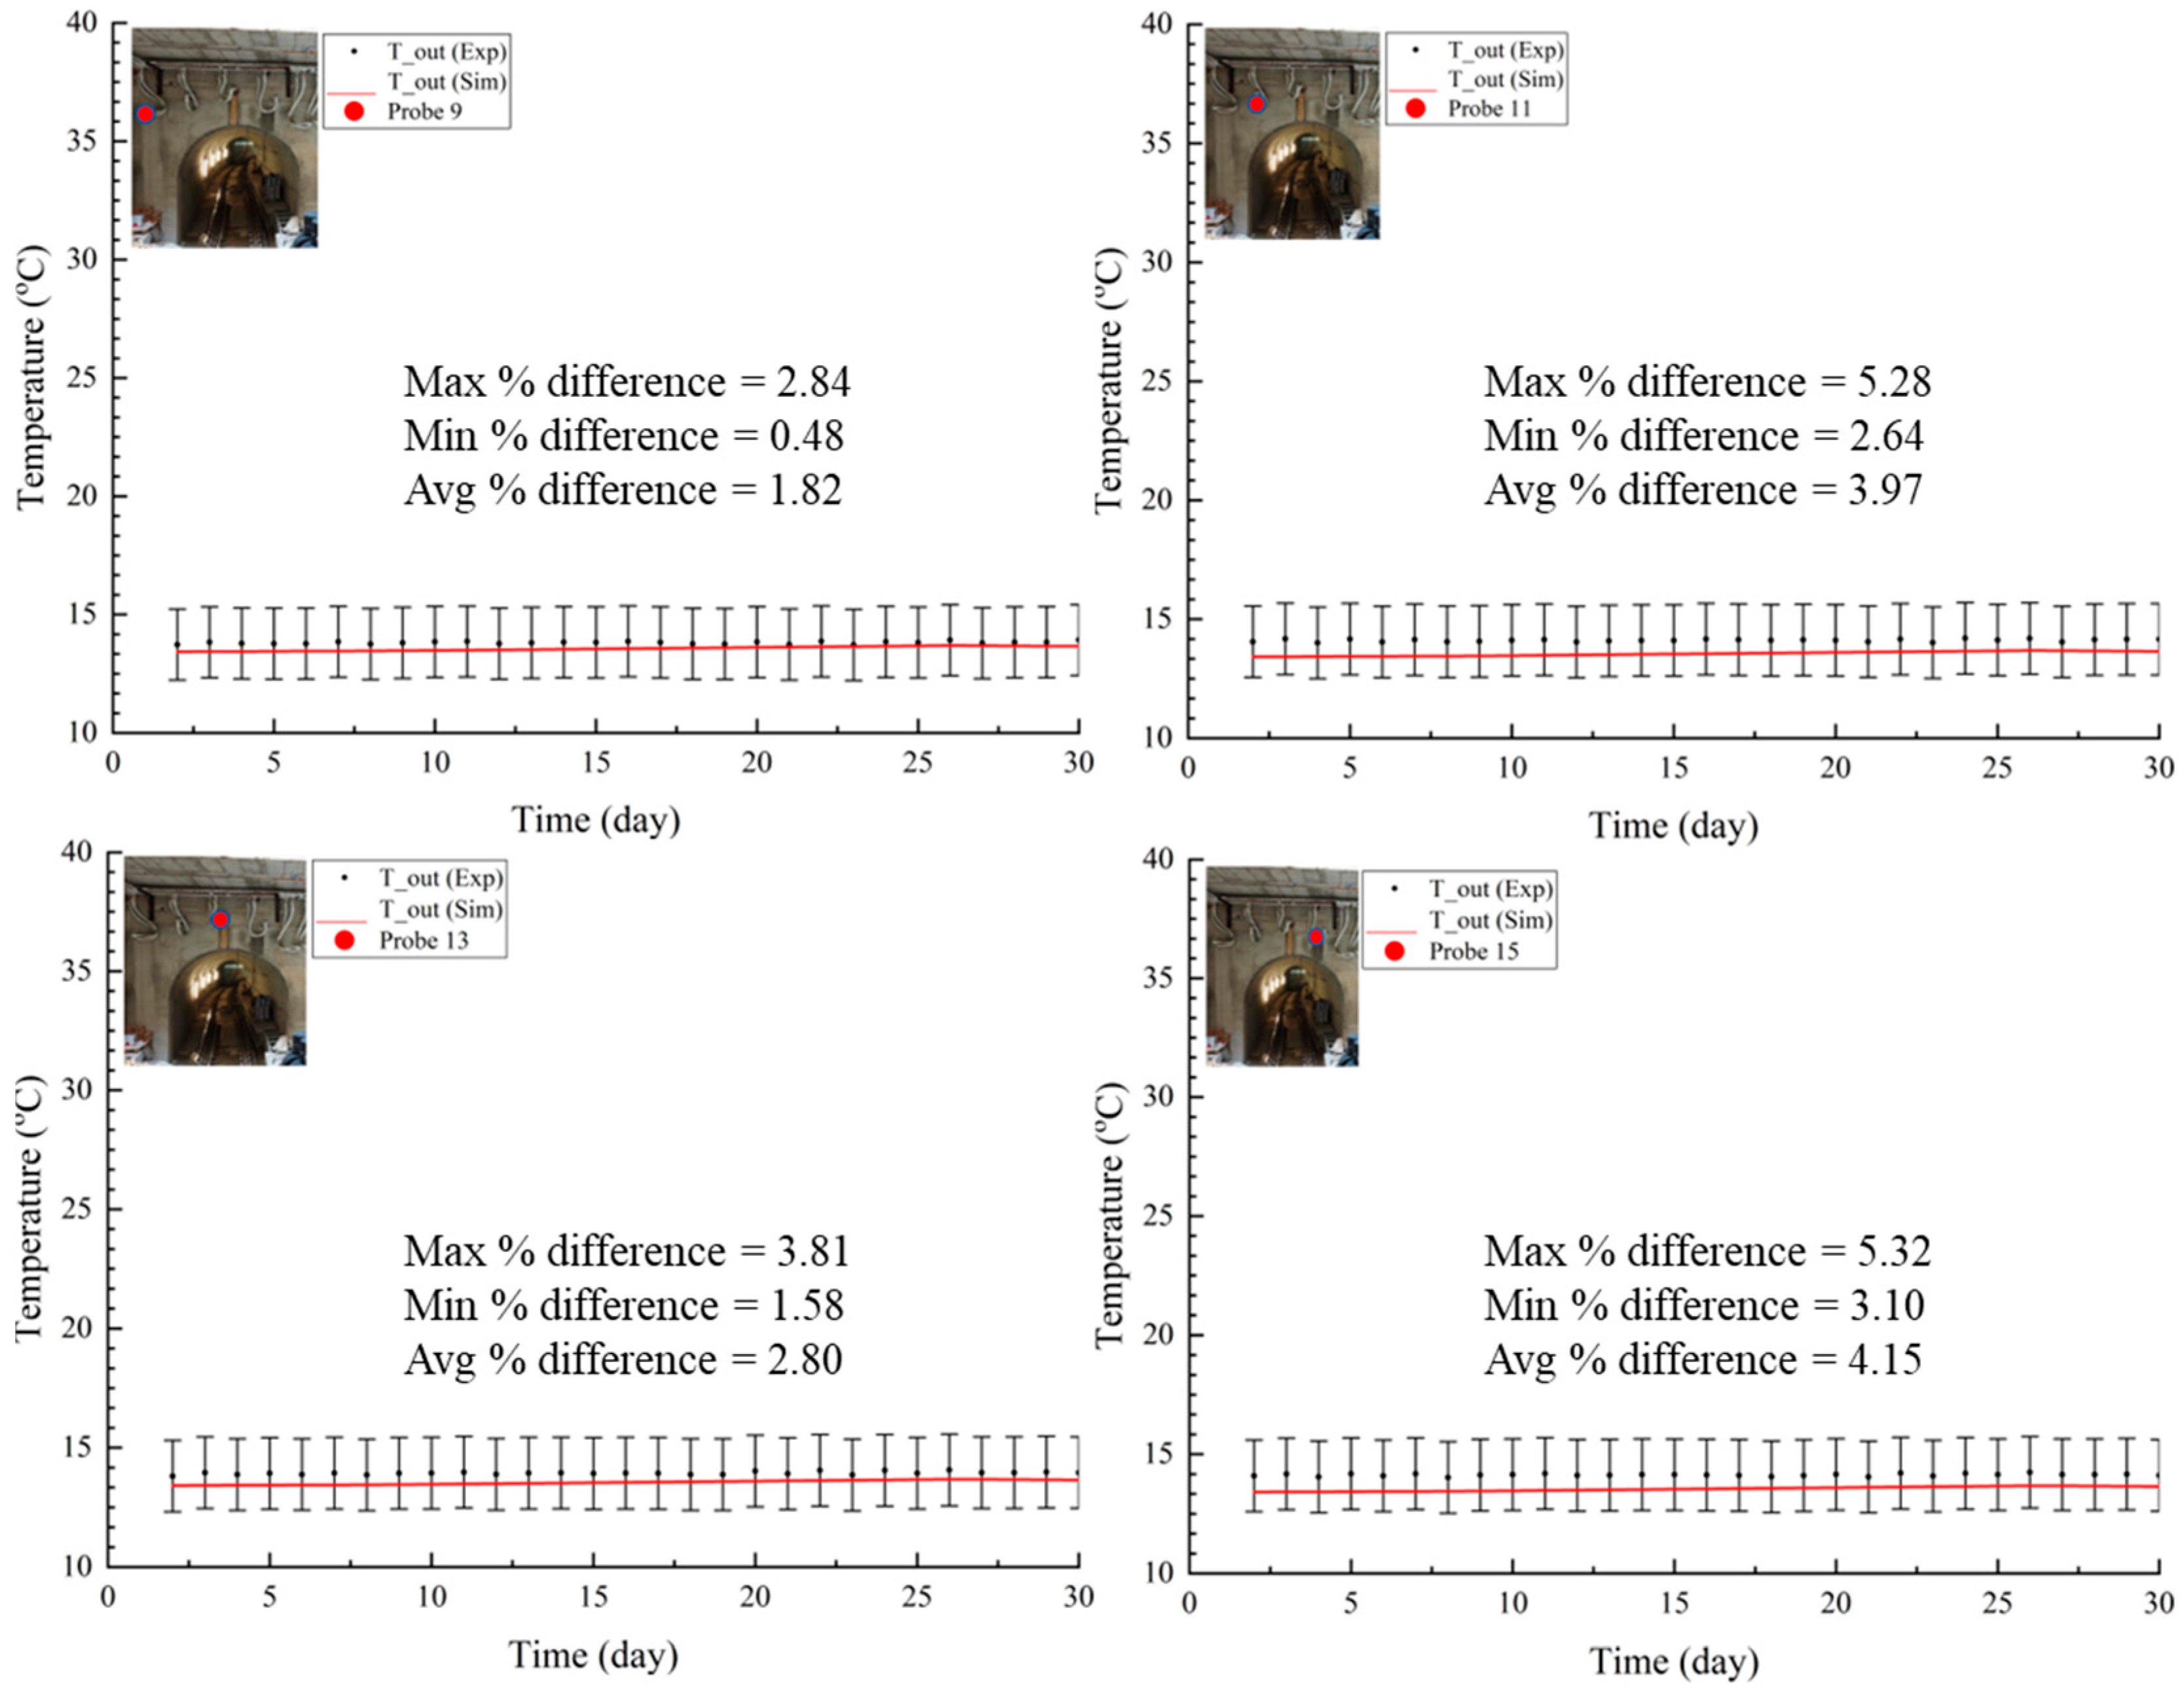
Figure 17 and Figure 18 show similar graphs for the months of October and November. It can be seen in the graphs for October and November that the outlet temperature is stabilized because of the continuation of the heating operation when compared with the month of September, when the operation modes were switched from cooling to heating.
The model is validated with the experimental data with a confidence level of 95% for the heating operation, and a good agreement between experimental and simulated values shows that the numerical model predicted the outlet temperatures within a maximum percentage error of 10% range for the heating operation.
As the heat exchanged between the HTF and the ground affects the temperature distribution in the ground, it is important to monitor any changes that occur.
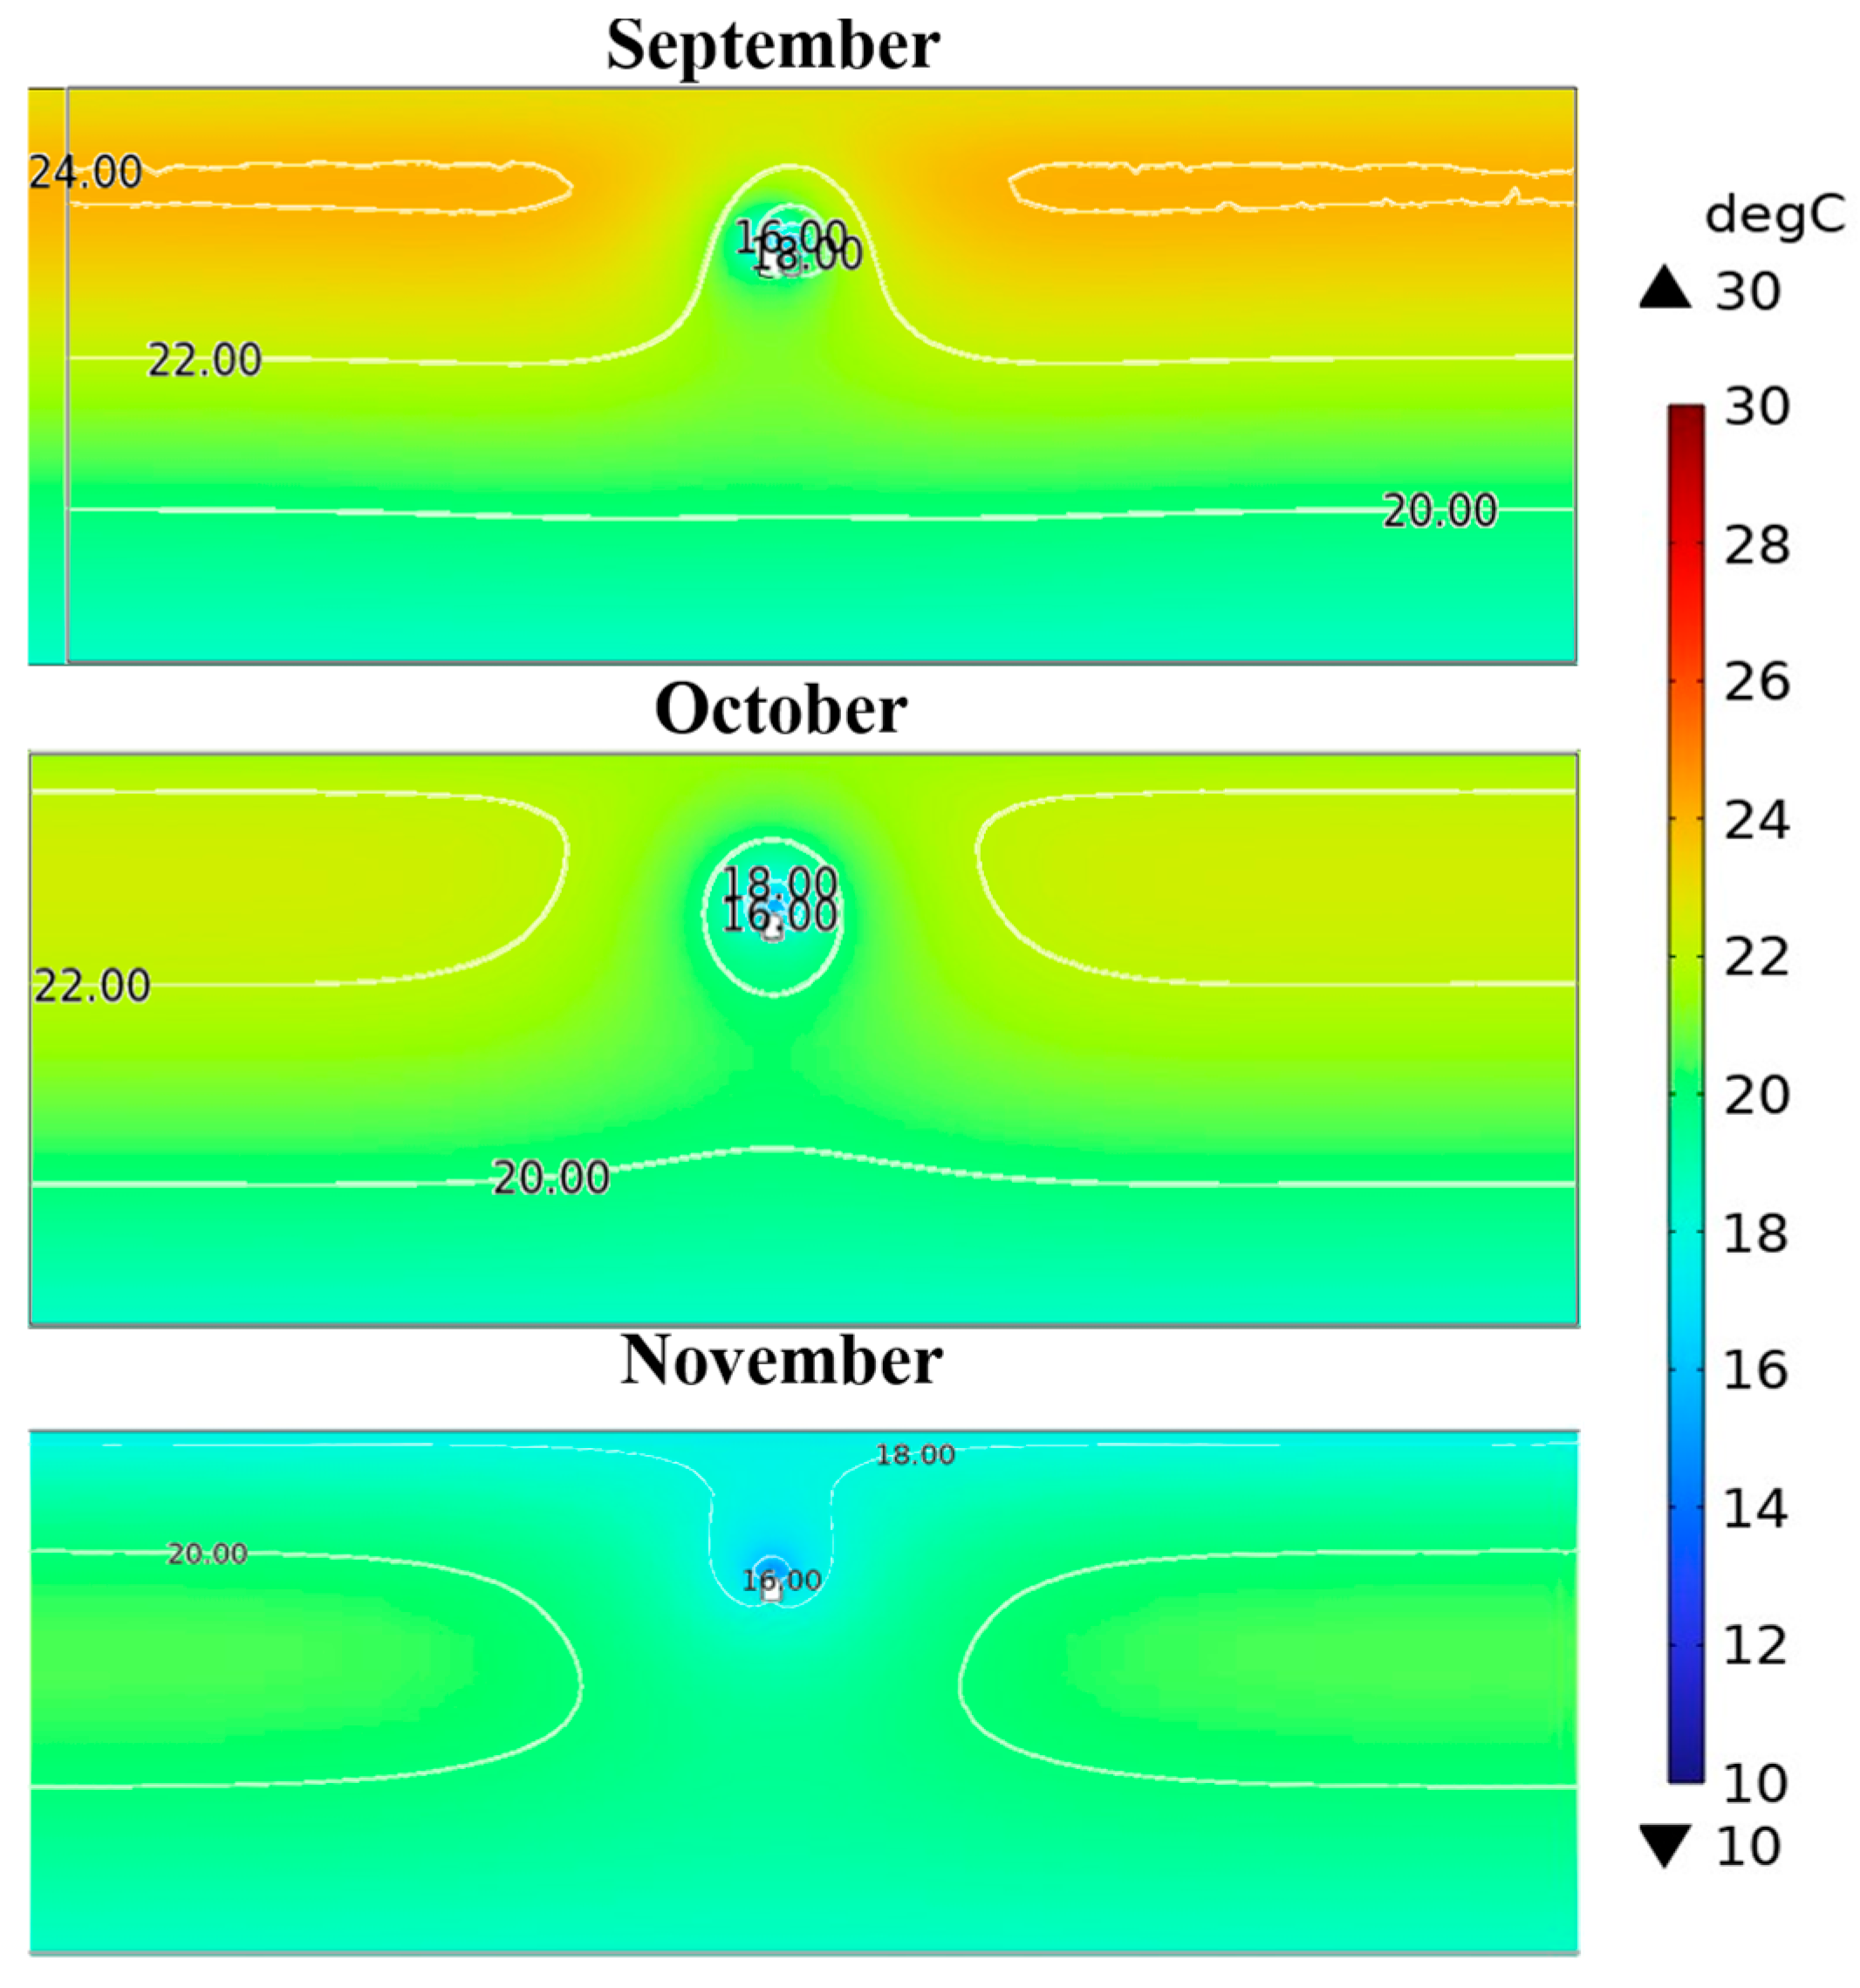
Figure 19 depicts the temperatures around the tunnel and nearby ground for the months of September, October, and November. The heat withdrawn by the HTF affects the area surrounding the probes, as evidenced by the lower temperature near the tunnel. As the heating operation continues, the temperature around the tunnel starts reducing, and during the month of November, it is evident that the temperature in the vicinity of the tunnel reduces due to the energy exchange. More information and detailed plots are included in the appendices for further consultation.

4.3. Heating Transfer

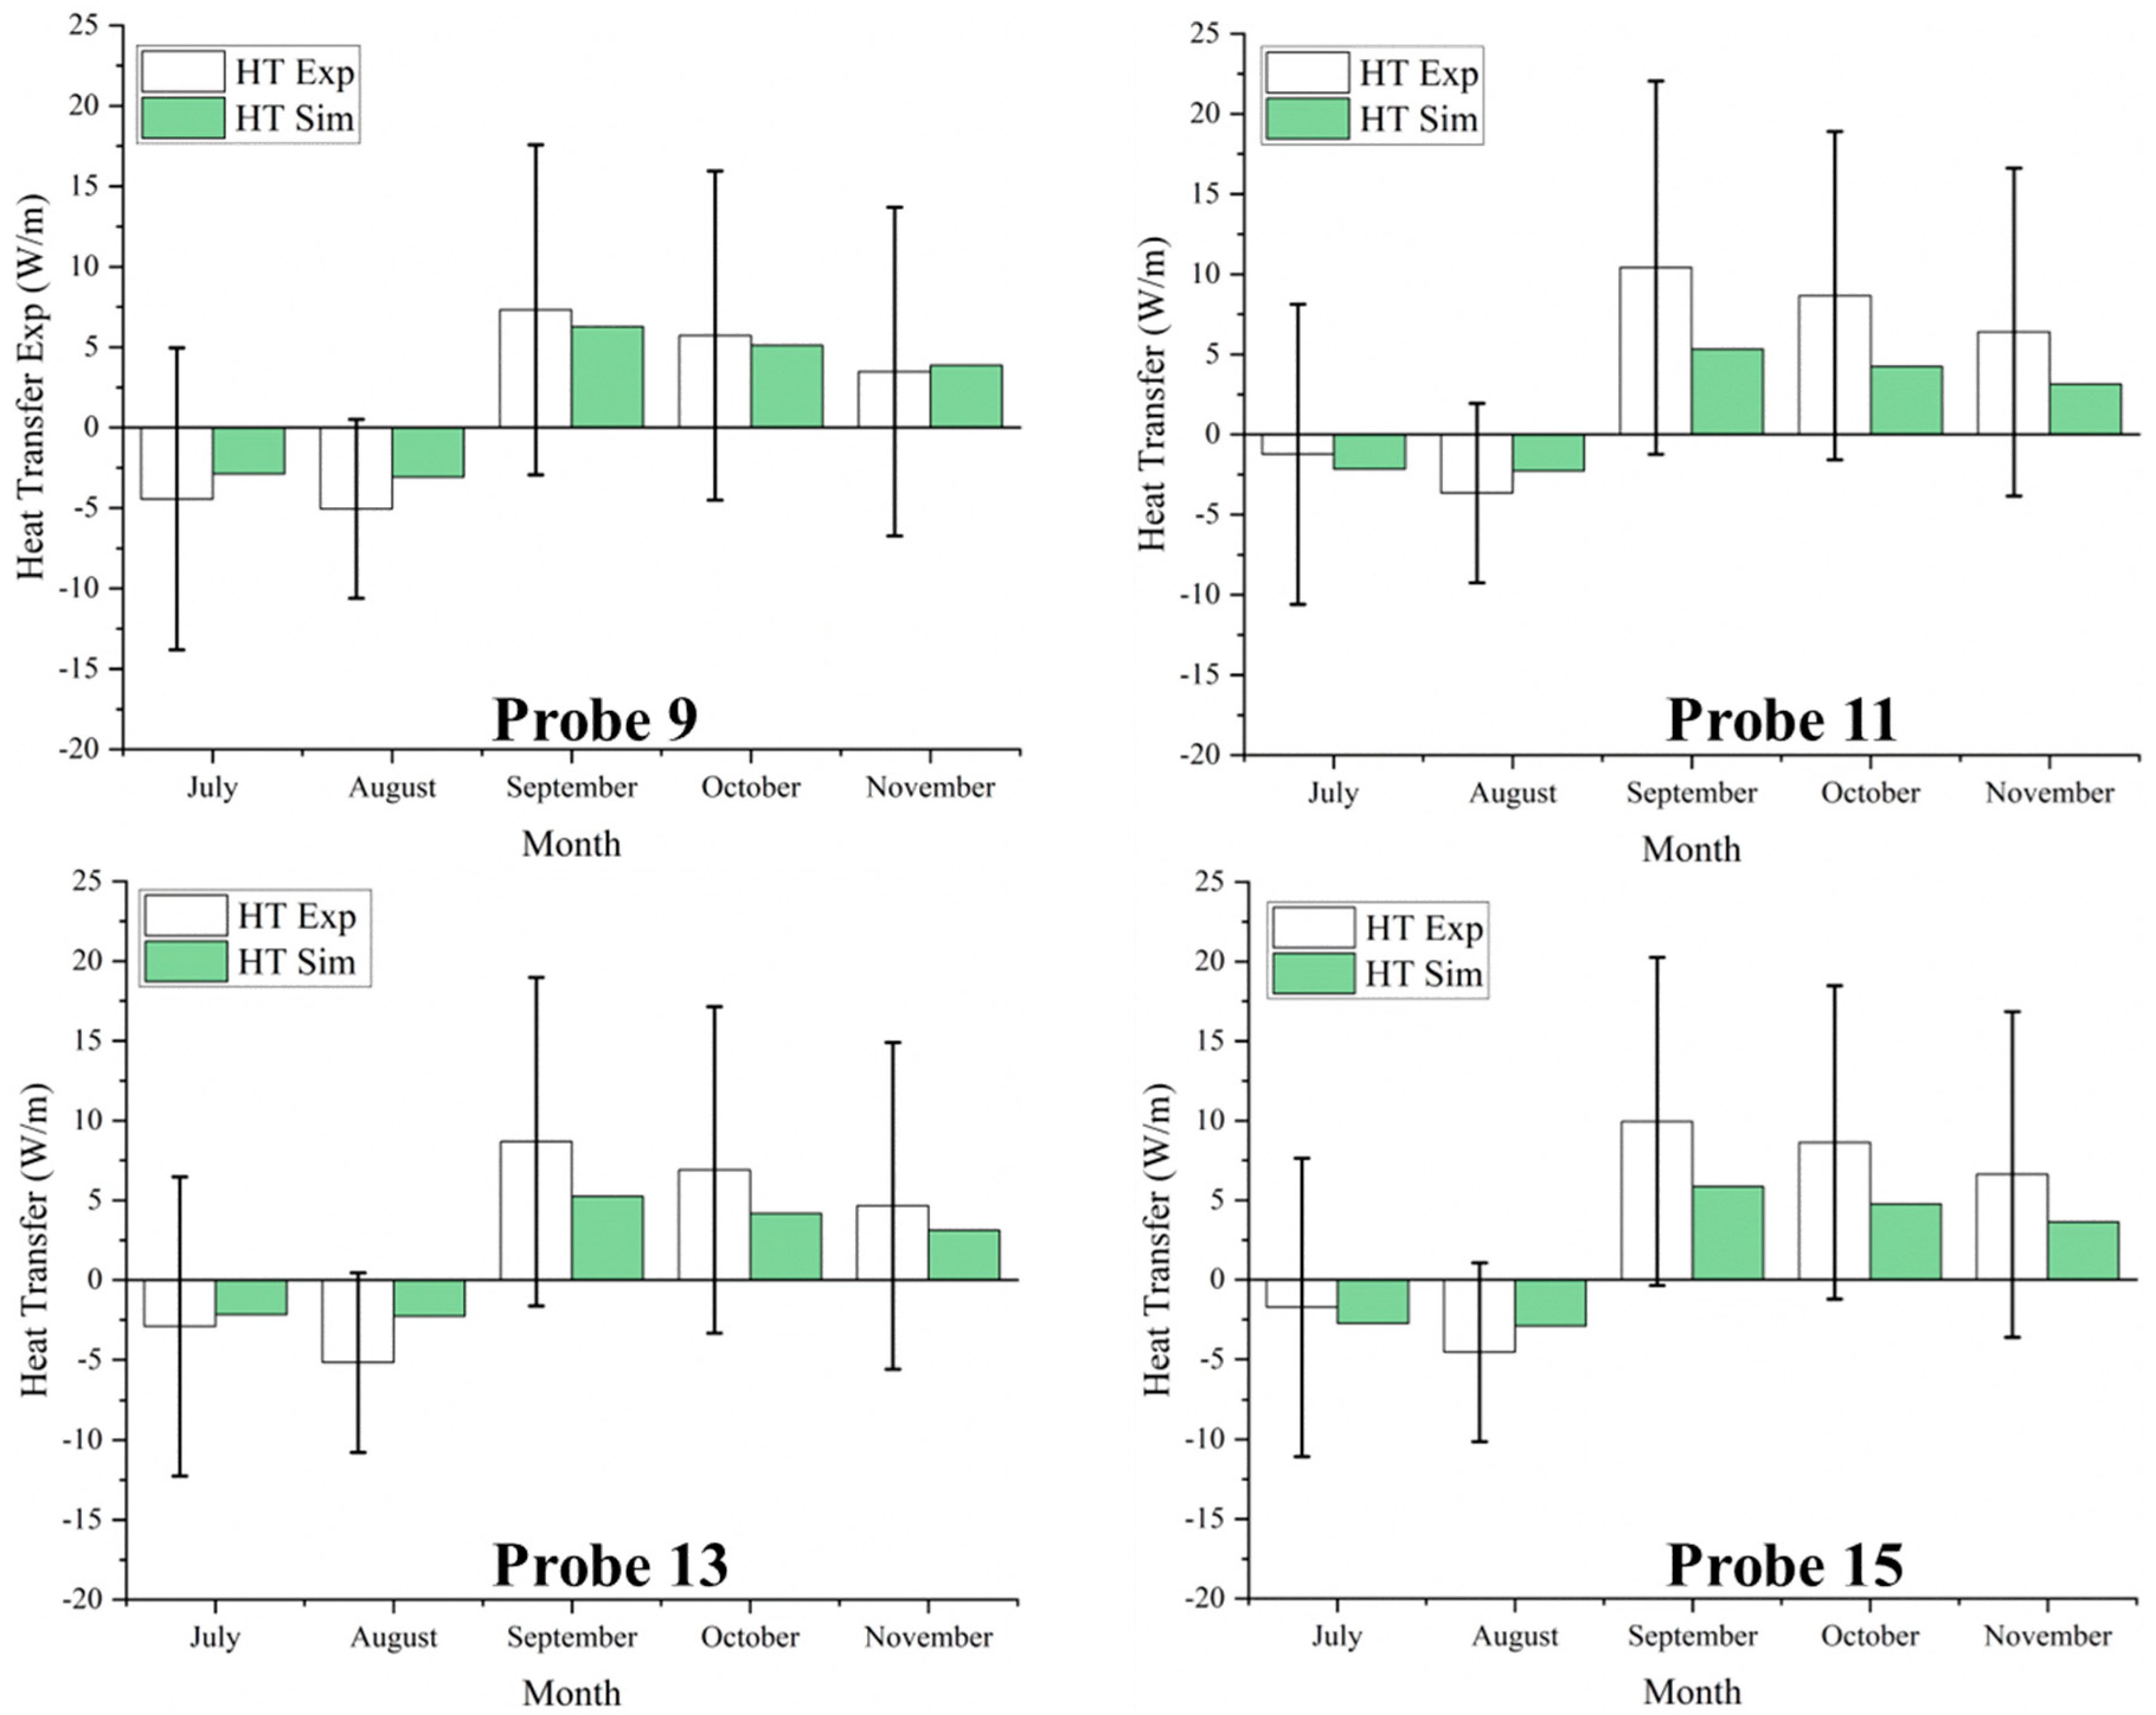
In this section, the heat exchanged by the probes during the experiments is discussed. As four probes were transformed into the GHE, the heat transfer for those probes is calculated during cooling and heating periods, and experimental and numerical data are compared to determine the system’s potential for improvement. Figure 20 depicts the cumulative monthly average of heat transfer in probes 9, 11, 13, and 15 for the cooling and heating periods.
Figure 20 shows a comparison of the monthly average heat transfer rate per unit length for probes 9, 11, 13, and 15 during the cooling and heating phases for both the experimental and numerical results. Negative values of heat transfer refer to the cooling phase, indicating that the tunnel serves as a sink and heat is rejected into it. Positive heat transfer rate values represent heat recovered from the tunnel during the heating cycle.
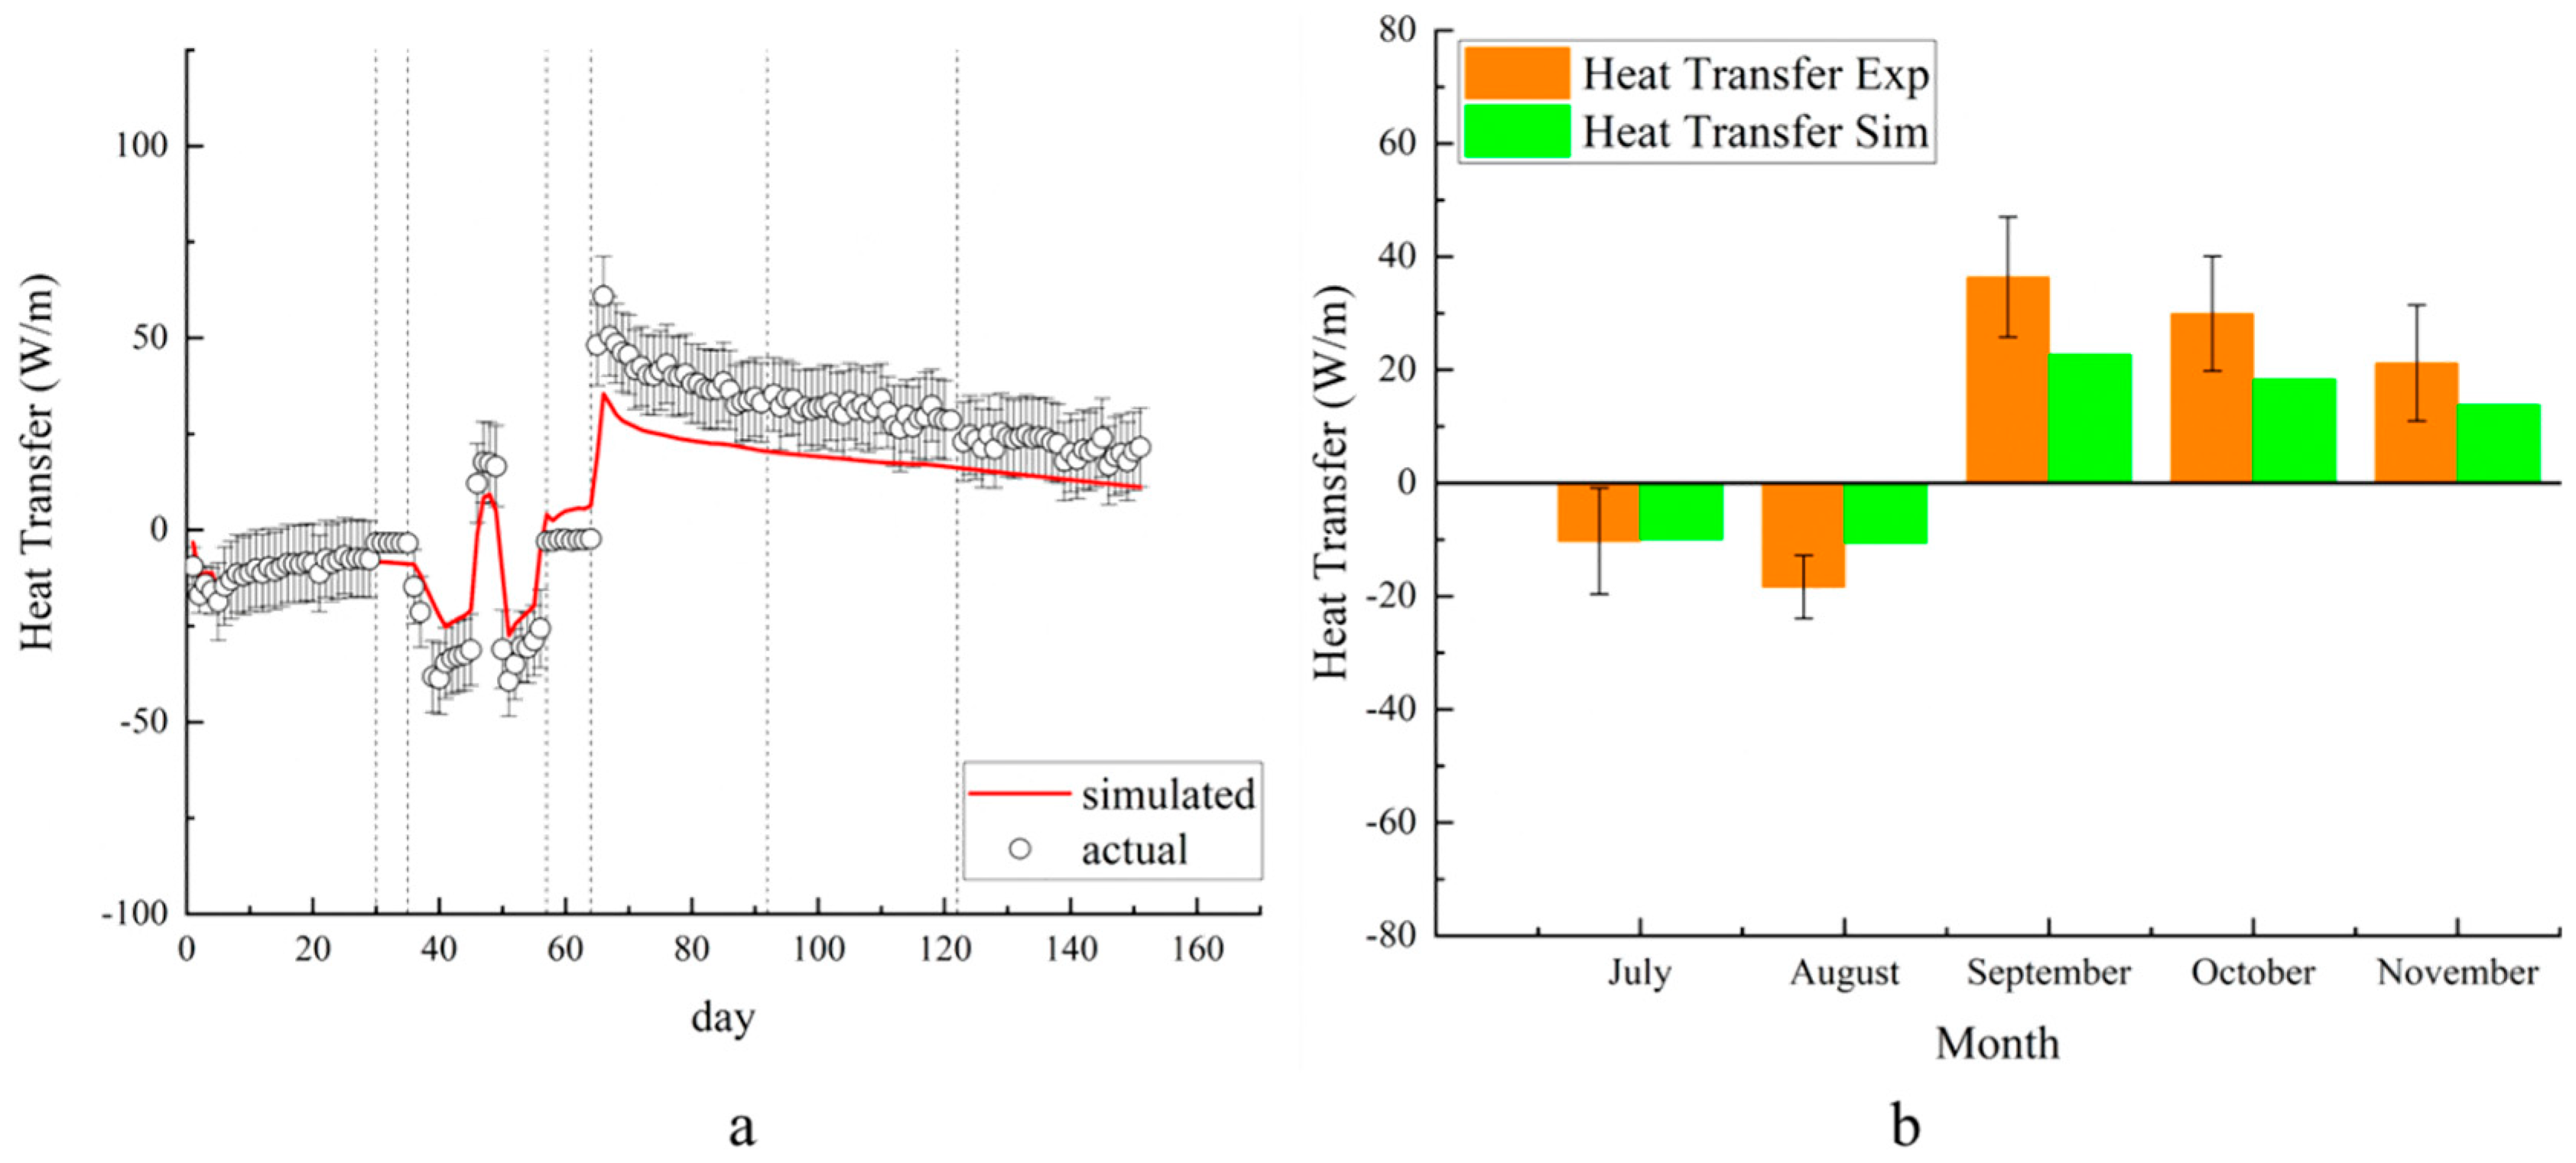
Figure 21a compares the combined experimental and numerical average daily heat transfer from all probes, whereas Figure 21b compares the system’s combined average monthly heat transfer from all probes over the whole operational time. During the cooling period, flow rate fluctuations have a significant impact on heat transfer. The black circles with error bars in Figure 21a represent the combined daily experimental heat transfer from all probes, whereas the red line represents the heat transfer calculated using numerical simulations.
The black dotted lines in Figure 21a indicate the system shut-down period, during which the HTF was not flowing through the pipes. The numerical and experimental trend validation can be seen in the figure. Figure 21b presents the collective heat transfer of all probes during the months of July, August, September, October, and November. The graph shows that the greatest heat transfer occurred in September, when the operation mode was switched from cooling to heating. The underprediction of heat transfer observed from September to November in Figure 21 can be justified by the likely increment in the ground moisture content during autumn, which is not indicated by simulations keeping the properties of the ground constant. High moisture content in the ground layers enhances thermal conductivity of the ground, resulting in higher heat transfer values during the experimental campaign. In order to account for such variation in the results, seasonal variations in the ground’s properties should also be considered.

5. Conclusions and Future Work

The work’s major conclusions from the results are presented as follows:
  • The experimental campaign in Piazza Municipio, Napoli, Italy, aimed to convert artificial ground-freezing probes into a ground heat exchanger for ground-coupled heating/cooling systems. This could greatly reduce the installation costs for ground loops for ground-source heat pump systems, which typically represent 50% of the total cost;
  • Data collection for the experimental campaign included 151 days, demonstrating tunnel performance for cooling and heating applications from July to November;
  • A numerical model was developed and validated with the experimental data. The model simulates operations under similar conditions to understand the impact of heat transfer on the tunnel’s adjacent ground;
  • The average values for combined heat transfer per unit length in W/m from all probes are 10.27 W/m and 18.4 W/m during cooling operation for the months of July and August, respectively. During the heating operation, the system obtained the average heat transfer values per unit length of 36.4 W/m, 29.9 W/m, and 21.2 W/m during the months of September, October, and November, respectively. The average cooling and heating energy extracted by the probes during the entire operation is calculated to be 1.3 MWh and 7.06 MWh, respectively.
This experimental effort laid a solid basis for ground-linked systems in densely populated cities, where it might be difficult to follow standard drilling operations due to the close spacing between buildings. It also provides a cost-effective and long-term alternative to the high installation costs of ground loops. Another advantage of such a system is the ease of integration with the city’s district heating/cooling networks, as most metro tunnels link densely populated areas.
Throughout this experimental campaign, the tunnel’s performance was evaluated as a standalone system, and temperatures were recorded throughout the cooling and heating phases to determine the system’s behavior. It may also be observed in conjunction with the fifth-generation DHC systems, which integrate several sources and sinks on a single loop to generate a very constant temperature loop for producers and consumers.

Author Contributions

Conceptualization, N.M. and A.M.; methodology, N.M. and A.M.; software, F.A.; validation, N.M., G.N. and F.A.; formal analysis, N.M. and F.A.; investigation, G.N.; resources, N.M.; data curation, G.N.; writing—original draft preparation, F.A.; writing—review and editing, N.M.; visualization, supervision, N.M.; project administration, A.M.; funding acquisition, N.M. and A.M. All authors have read and agreed to the published version of the manuscript.

Funding

This research was partly funded by the green thematic doctoral research program under projects GEOGRID (CUP B43D18000230007) and GEODE (REACT-EU CUP 165F21001390001).

Data Availability Statement

Dataset available on request from the authors.

Conflicts of Interest

The authors declare no conflicts of interest.

Abbreviations

The following abbreviations are used in this manuscript:
Acronyms
IEAInternational Energy Agency
GHGGreenhouse Gas
AGFArtificial Ground Freezing
COPCoefficient of Performance
GSHPGround Source Heat Pump
EGDEuropean Green Deal
GHEGround Heat Exchanger
ASHPAir-Source Heat Pump
HTFHeat Transfer Fluid
HDPEHigh-Density Polyethylene
Miscellaneous
u T Uncertainty in temperature
u m ˙ Uncertainty in mass flow rate
NNo of terms
T s Solid temperature
k s Thermal conductivity of solid
Q Heat transfer with pipe
ρ f Density of fluid
C p f Specific heat capacity of fluid
k f Thermal conductivity of fluid
TgrndGround temperature
T Ambient temperature
σ Standard deviation
u Q ˙ Uncertainty in heat transfer rate
C p s Specific heat capacity for solid
Q w a l l f l Heat transferred between fluid and surroundings
ρ s Density of solid
A Area of pipe
T f Fluid temperature
u Fluid velocity
q k Convective heat transfer
θTime

Appendix A

Graphs for Cooling mode
Figure A1. Comparison of inlet and outlet temperatures of probes 9, 11, 13, and 15 for the month of July during cooling operation.
Energies 18 02965 g0a1
Figure A2. Comparison of inlet and outlet temperature of probes 9, 11, 13, and 15 for the month of August for cooling operation.
Energies 18 02965 g0a2
Figure A3. Tunnel cross-section from the inlet side showing the isothermal lines over domain temperatures shown for the cooling operation. The values indicated by the digits on the figure show the temperature of those lines on the cross-section.
Energies 18 02965 g0a3

Appendix B

Graphs for Heating mode
Figure A4. Comparison of inlet and outlet temperature of probes 9, 11, 13, and 15 for the month of September for heating operation.
Energies 18 02965 g0a4
Figure A5. Comparison of inlet and outlet temperature of probes 9, 11, 13, and 15 for the month of October for heating operation.
Energies 18 02965 g0a5
Figure A6. Comparison of inlet and outlet temperature of probes 9, 11, 13, and 15 for the month of November for heating operation.
Energies 18 02965 g0a6
Figure A7 depicts the isotherms for the months of September, October, and November. The iso-lines show the temperature distribution during the heating operation of the tunnel. As the heat from the adjacent domain is exchanged with the low temperature HTF in the probes to obtain heating effect. Due to this heat exchange, the temperature domain reduced near the probes in the domain, as shown by the iso-therms. High temperature zones formed because of the heat transfer are also indicated by the iso-thermal lines, showing that heat was extracted from the domain by the HTF near the tunnel.
Figure A7. Tunnel cross-section from the inlet side showing the isothermal lines over domain temperatures shown for the heating operation. The values indicated by the digits on the figure show the temperature of those lines on the cross-section.
Energies 18 02965 g0a7

References

  1. Scarlat, N.; Dallemand, J.F.; Monforti-Ferrario, F.; Banja, M.; Motola, V. Renewable Energy Policy Framework and Bioenergy Contribution in the European Union—An Overview from National Renewable Energy Action Plans and Progress Reports. Renew. Sustain. Energy Rev. 2015, 51, 969–985. [Google Scholar] [CrossRef]
  2. Friedlingstein, P.; O’sullivan, M.; Jones, M.W.; Andrew, R.M.; Gregor, L.; Hauck, J.; Le Quéré, C.; Luijkx, I.T.; Olsen, A.; Peters, G.P.; et al. Global Carbon Budget 2022. Earth Syst. Sci. Data 2022, 14, 4811–4900. [Google Scholar] [CrossRef]
  3. Luqman, M.; Mahmood, F.; Al-Ansari, T. Supporting Sustainable Global Food Security through a Novel Decentralised Offshore Floating Greenhouse. Energy Convers. Manag. 2023, 277, 116577. [Google Scholar] [CrossRef]
  4. EUR-Lex. European Parliament Directive of the European Parliament and of the Council as Regards the Promotion of Energy from Renewable Sources. Eur. Comissmion 2021, 0218, 5–24. [Google Scholar]
  5. IRENA. World Energy Transitions Outlook: 1.5 °C Pathway; International Renewable Energy Agency: Abu Dhabi, United Arab Emirates, 2022; ISBN 9789292604295. [Google Scholar]
  6. Bhamare, D.K.; Rathod, M.K.; Banerjee, J. Passive Cooling Techniques for Building and Their Applicability in Different Climatic Zones—The State of Art. Energy Build. 2019, 198, 467–490. [Google Scholar] [CrossRef]
  7. Firfiris, V.K.; Martzopoulou, A.G.; Kotsopoulos, T.A. Passive Cooling Systems in Livestock Buildings towards Energy Saving: A Critical Review. Energy Build. 2019, 202, 109368. [Google Scholar] [CrossRef]
  8. La Roche, P.; Yeom, D.J.; Ponce, A. Passive Cooling with a Hybrid Green Roof for Extreme Climates. Energy Build. 2020, 224, 110243. [Google Scholar] [CrossRef]
  9. Alahmer, A.; Ajib, S. Solar Cooling Technologies: State of Art and Perspectives. Energy Convers. Manag. 2020, 214, 112896. [Google Scholar] [CrossRef]
  10. Zhang, H.; Yang, D.; Tam, V.W.Y.; Tao, Y.; Zhang, G.; Setunge, S.; Shi, L. A Critical Review of Combined Natural Ventilation Techniques in Sustainable Buildings. Renew. Sustain. Energy Rev. 2021, 141, 110795. [Google Scholar] [CrossRef]
  11. Fraia, S.D.; Shah, M.; Vanoli, L. A Biomass-Based Polygeneration System for a Historical Building: A Techno-Economic and Environmental Analysis. Energy Convers. Manag. 2023, 291, 117336. [Google Scholar] [CrossRef]
  12. Stryi-Hipp, G. Renewable Heating and Cooling: Technologies and Applications; Woodhead Publishing: Cambridge, UK, 2015; ISBN 9781782422181. [Google Scholar]
  13. Zhuang, Z.; Li, Y.; Chen, B.; Guo, J. Chinese Kang as a Domestic Heating System in Rural Northern China—A Review. Energy Build. 2009, 41, 111–119. [Google Scholar] [CrossRef]
  14. Ahmed, F.; Mahmood, M.; Waqas, A.; Ahmad, N.; Ali, M. Thermal Analysis of Macro-Encapsulated Phase Change Material Coupled with Domestic Gas Heater for Building Heating. Sustain. Energy Technol. Assess. 2021, 47, 101533. [Google Scholar] [CrossRef]
  15. Prakash, J.; Roan, D.; Tauqir, W.; Nazir, H.; Ali, M.; Kannan, A. Off-Grid Solar Thermal Water Heating System Using Phase-Change Materials: Design, Integration and Real Environment Investigation. Appl. Energy 2019, 240, 73–83. [Google Scholar] [CrossRef]
  16. Ge, T.S.; Wang, R.Z.; Xu, Z.Y.; Pan, Q.W.; Du, S.; Chen, X.M.; Ma, T.; Wu, X.N.; Sun, X.L.; Chen, J.F. Solar Heating and Cooling: Present and Future Development. Renew. Energy 2018, 126, 1126–1140. [Google Scholar] [CrossRef]
  17. Mosallat, F.; Elmekkawy, T.; Friesen, D.L.; Molinski, T.; Loney, S.; Bibeau, E.L. Modeling, Simulation and Control of Flat Panel Solar Collectors with Thermal Storage for Heating and Cooling Applications. Procedia Comput. Sci. 2013, 19, 686–693. [Google Scholar] [CrossRef]
  18. Carvalho, A.D.; Moura, P.; Vaz, G.C.; De Almeida, A.T. Ground Source Heat Pumps as High Efficient Solutions for Building Space Conditioning and for Integration in Smart Grids. Energy Convers. Manag. 2015, 103, 991–1007. [Google Scholar] [CrossRef]
  19. Chandrashekar, M. Heat Pumps. In Proceedings of the Selected Lectures from the 1980 International Symposium on Solar Energy Utilization, London, ON, Canada, 10–24 August 1981; pp. 447–468. [Google Scholar] [CrossRef]
  20. Ratchawang, S.; Chotpantarat, S.; Chokchai, S.; Takashima, I.; Uchida, Y.; Charusiri, P. A Review of Ground Source Heat Pump Application for Space Cooling in Southeast Asia. Energies 2022, 15, 4992. [Google Scholar] [CrossRef]
  21. Zhang, Y.; Zhang, G.; Zhang, A.; Jin, Y.; Ru, R.; Tian, M. Frosting Phenomenon and Frost-Free Technology of Outdoor Air Heat Exchanger for an Air-Source Heat Pump System in China: An Analysis and Review. Energies 2018, 11, 2642. [Google Scholar] [CrossRef]
  22. Lucia, U.; Simonetti, M.; Chiesa, G.; Grisolia, G. Ground-Source Pump System for Heating and Cooling: Review and Thermodynamic Approach. Renew. Sustain. Energy Rev. 2017, 70, 867–874. [Google Scholar] [CrossRef]
  23. Chesser, M.; Lyons, P.; O’Reilly, P.; Carroll, P. Air Source Heat Pump In-Situ Performance. Energy Build. 2021, 251, 111365. [Google Scholar] [CrossRef]
  24. Song, C.; Li, Y.; Rajeh, T.; Ma, L.; Zhao, J.; Li, W. Application and Development of Ground Source Heat Pump Technology in China. Prot. Control Mod. Power Syst. 2021, 6, 17. [Google Scholar] [CrossRef]
  25. Wang, X.; Xia, L.; Bales, C.; Zhang, X.; Copertaro, B.; Pan, S.; Wu, J. A Systematic Review of Recent Air Source Heat Pump (ASHP) Systems Assisted by Solar Thermal, Photovoltaic and Photovoltaic/Thermal Sources. Renew. Energy 2020, 146, 2472–2487. [Google Scholar] [CrossRef]
  26. Yang, L.W.; Xu, R.J.; Hua, N.; Xia, Y.; Zhou, W.B.; Yang, T.; Belyayev, Y.; Wang, H.S. Review of the Advances in Solar-Assisted Air Source Heat Pumps for the Domestic Sector. Energy Convers. Manag. 2021, 247, 114710. [Google Scholar] [CrossRef]
  27. ASHRAE (American Society of Heating Refrigerating and Air-Conditioning Engineers). Handbook HVAC Systems and Equipment; American Society of Heating Refrigerating and Air-Conditioning Engineers: Peachtree Corners, GA, USA, 2012; ISBN 9781936504268. [Google Scholar]
  28. Valancius, R.; Singh, R.M.; Jurelionis, A.; Vaiciunas, J. A Review of Heat Pump Systems and Applications in Cold Climates: Evidence from Lithuania. Energies 2019, 12, 4331. [Google Scholar] [CrossRef]
  29. Sivasakthivel, T.; Murugesan, K.; Sahoo, P.K. Study of Technical, Economical and Environmental Viability of Ground Source Heat Pump System for Himalayan Cities of India. Renew. Sustain. Energy Rev. 2015, 48, 452–462. [Google Scholar] [CrossRef]
  30. Sarbu, I.; Sebarchievici, C. Ground-Source Heat Pumps: Fundamentals, Experiments and Applications; Joe Hayton: Pateley Bridge, UK, 2015; ISBN 9780128042205. [Google Scholar]
  31. Lu, Q.; Narsilio, G.A.; Aditya, G.R.; Johnston, I.W. Economic Analysis of Vertical Ground Source Heat Pump Systems in Melbourne. Energy 2017, 125, 107–117. [Google Scholar] [CrossRef]
  32. Nouri, G.; Noorollahi, Y.; Yousefi, H. Solar Assisted Ground Source Heat Pump Systems—A Review. Appl. Therm. Eng. 2019, 163, 114351. [Google Scholar] [CrossRef]
  33. Menegazzo, D.; Lombardo, G.; Bobbo, S.; De Carli, M.; Fedele, L. State of the Art, Perspective and Obstacles of Ground-Source Heat Pump Technology in the European Building Sector: A Review. Energies 2022, 15, 2685. [Google Scholar] [CrossRef]
  34. United Nations. Economic Commission for Europe. Economic and Social: Railway Tunnels in Europe and North America. Repos. Open Sci. Access Portal 2002, 7, 27–28. [Google Scholar]
  35. Revesz, A.; Chaer, I.; Thompson, J.; Mavroulidou, M.; Gunn, M.; Maidment, G. Ground Source Heat Pumps and Their Interactions with Underground Railway Tunnels in an Urban Environment: A Review. Appl. Therm. Eng. 2016, 93, 147–154. [Google Scholar] [CrossRef]
  36. Davies, G.; Boot-Handford, N.; Curry, D.; Dennis, W.; Ajileye, A.; Revesz, A.; Maidment, G. Combining Cooling of Underground Railways with Heat Recovery and Reuse. Sustain. Cities Soc. 2019, 45, 543–552. [Google Scholar] [CrossRef]
  37. Tong, L.; Songtao, H.; Shan, L.; Wang, Y. Study on Heat Transfer Performance of Metro Tunnel Capillary Heat Exchanger. Sustain. Cities Soc. 2019, 45, 683–685. [Google Scholar] [CrossRef]
  38. Mao, Z.; Hu, S.; Guan, Y.; Ji, Y.; Liu, G.; Tong, Z.; Wang, Y.; Tong, L. Performance Analysis of a Hybrid Subway Source Heat Pump System Using Capillary Heat Exchanger. Appl. Therm. Eng. 2021, 197, 117367. [Google Scholar] [CrossRef]
  39. Tong, Z.; Guan, Y.; Cao, T.; Ji, Y.; Hu, S.; Liu, G.; Liu, N.; Fan, Y. Onsite Measurement and Performance Analysis of Capillary Heat Pump System Used in Subway Tunnels. Appl. Therm. Eng. 2022, 204, 118008. [Google Scholar] [CrossRef]
  40. Ji, Y.; Wu, W.; Qi, H.; Wang, W.; Hu, S. Heat Transfer Performance Analysis of Front-End Capillary Heat Exchanger of a Subway Source Heat Pump System. Energy 2022, 246, 123424. [Google Scholar] [CrossRef]
  41. Ji, Y.; Wu, W.; Hu, S. Long-Term Performance of a Front-End Capillary Heat Exchanger for a Metro Source Heat Pump System. Appl. Energy 2023, 335, 120772. [Google Scholar] [CrossRef]
  42. Yu, Y.; You, S.; Zhang, H.; Ye, T.; Wang, Y.; Wei, S. A Review on Available Energy Saving Strategies for Heating, Ventilation and Air Conditioning in Underground Metro Stations. Renew. Sustain. Energy Rev. 2021, 141, 110788. [Google Scholar] [CrossRef]
  43. Ji, Y.; Yin, Z.; Jiao, J.; Ji, C.; Hu, S. Long-Term Operational Characteristics of Subway Source Heat Pump System under Various Tunnel Internal Heat Source Intensities. Renew. Energy 2024, 236, 121445. [Google Scholar] [CrossRef]
  44. Ji, Y.; Ji, C.; Shen, S.; Zhang, J.; Hu, S. Performance and Optimal Design Parameters of Tunnel Lining CHEs under Typical Design Conditions. Renew. Energy 2025, 238, 121962. [Google Scholar] [CrossRef]
  45. Ji, Y.; Shen, S.; Wang, X.; Zhang, H.; Qi, H.; Hu, S. Impact of Groundwater Seepage on Thermal Performance of Capillary Heat Exchangers in Subway Tunnel Lining. Renew. Energy 2024, 227, 120551. [Google Scholar] [CrossRef]
  46. Alzoubi, M.A.; Xu, M.; Hassani, F.P.; Poncet, S.; Sasmito, A.P. Artificial Ground Freezing: A Review of Thermal and Hydraulic Aspects. Tunn. Undergr. Space Technol. 2020, 104, 103534. [Google Scholar] [CrossRef]
  47. Crippa, C.; Manassero, V. Artificial Ground Freezing at Sophiaspoortunnel (The Netherlands)—Freezing Parameters: Data Acquisition and Processing. In Proceedings of the GeoCongress 2006: Geotechnical Engineering in the Information Technology Age, Reston, VA, USA, 21 February 2006; American Society of Civil Engineers: Reston, VA, USA, 2006; Volume 2006, p. 254. [Google Scholar]
  48. Colombo, G.; Lunardi, P.; Cavagna, B.; Cassani, G.; Manassero, V. The Artificial Ground Freezing Technique Application for the Naples Underground. In Word Tunnel Congress 2008 on Underground Facilities for Better Environment and Safety; Central Board of Irrigation & Power: New Delhi, India, 2008; pp. 910–921. [Google Scholar]
  49. Mauro, A.; Normino, G.; Cavuoto, F.; Marotta, P.; Massarotti, N. Modeling Artificial Ground Freezing for Construction of Two Tunnels of a Metro Station in Napoli (Italy). Energies 2020, 13, 1272. [Google Scholar] [CrossRef]
  50. Meglio, A.D.; Massarotti, N.; Mauro, A.; Trombetta, V. Coupled Geothermal Energy Simulations. J. Phys. Conf. Ser. 2022, 2177, 012004. [Google Scholar] [CrossRef]
  51. Ahmed, F.; Massarotti, N.; Mauro, A.; Normino, G. A Novel Ground Source Heat Exchanger in an Underground Metro Tunnel. J. Phys. Conf. Ser. 2024, 2685, 012037. [Google Scholar] [CrossRef]
  52. Lancellotta, G.D.S.; Wernecke, R. Application of Artificial Ground-Freezing to Construct a Passenger Interchange Tunnel for the Subway Line 14 in Paris, France. Environ. Sci. Eng. Geol. 2017, 19, 2461–2467. [Google Scholar]
  53. Massarotti, N.; Mauro, A.; Normino, G.; Vanoli, L.; Verde, C.; Allocca, V.; Calcaterra, D.; Coda, S.; de Vita, P.; Forzano, C.; et al. Innovative Solutions to Use Ground-Coupled Heat Pumps in Historical Buildings: A Test Case in the City of Napoli, Southern Italy. Energies 2020, 14, 296. [Google Scholar] [CrossRef]
  54. Parali, L.; Durmaz, F.; Aydin, O. Calibration of a Platinum Resistance Thermometer (Pt-100) and Its Measurement Uncertainty Analysis. Celal Bayar Üniversitesi Fen. Bilim. Derg. 2018, 14, 41–49. [Google Scholar] [CrossRef]
  55. Portata, M.D.I. RIF100. “Misuratore di Portata”. pp. 1–31. Available online: https://www.riels.it/it/rif100-rif100-misuratore-di-portata-elettromagnetico?srsltid=AfmBOoqmP618CTbO6At-Ji3SdE-KzclGhMitons-8R6OTxhyHJ9WHg3o (accessed on 1 June 2025).
  56. Janna, W.S. Natural-Convection Systems. In Engineering Heat Transfer; CRC Press: Boca Raton, FL, USA, 2018; pp. 8–47. [Google Scholar]
  57. Pimentel, E.; Papakonstantinou, S.; Anagnostou, G. Numerical Interpretation of Temperature Distributions from Three Ground Freezing Applications in Urban Tunnelling. Tunn. Undergr. Space Technol. 2012, 28, 57–69. [Google Scholar] [CrossRef]
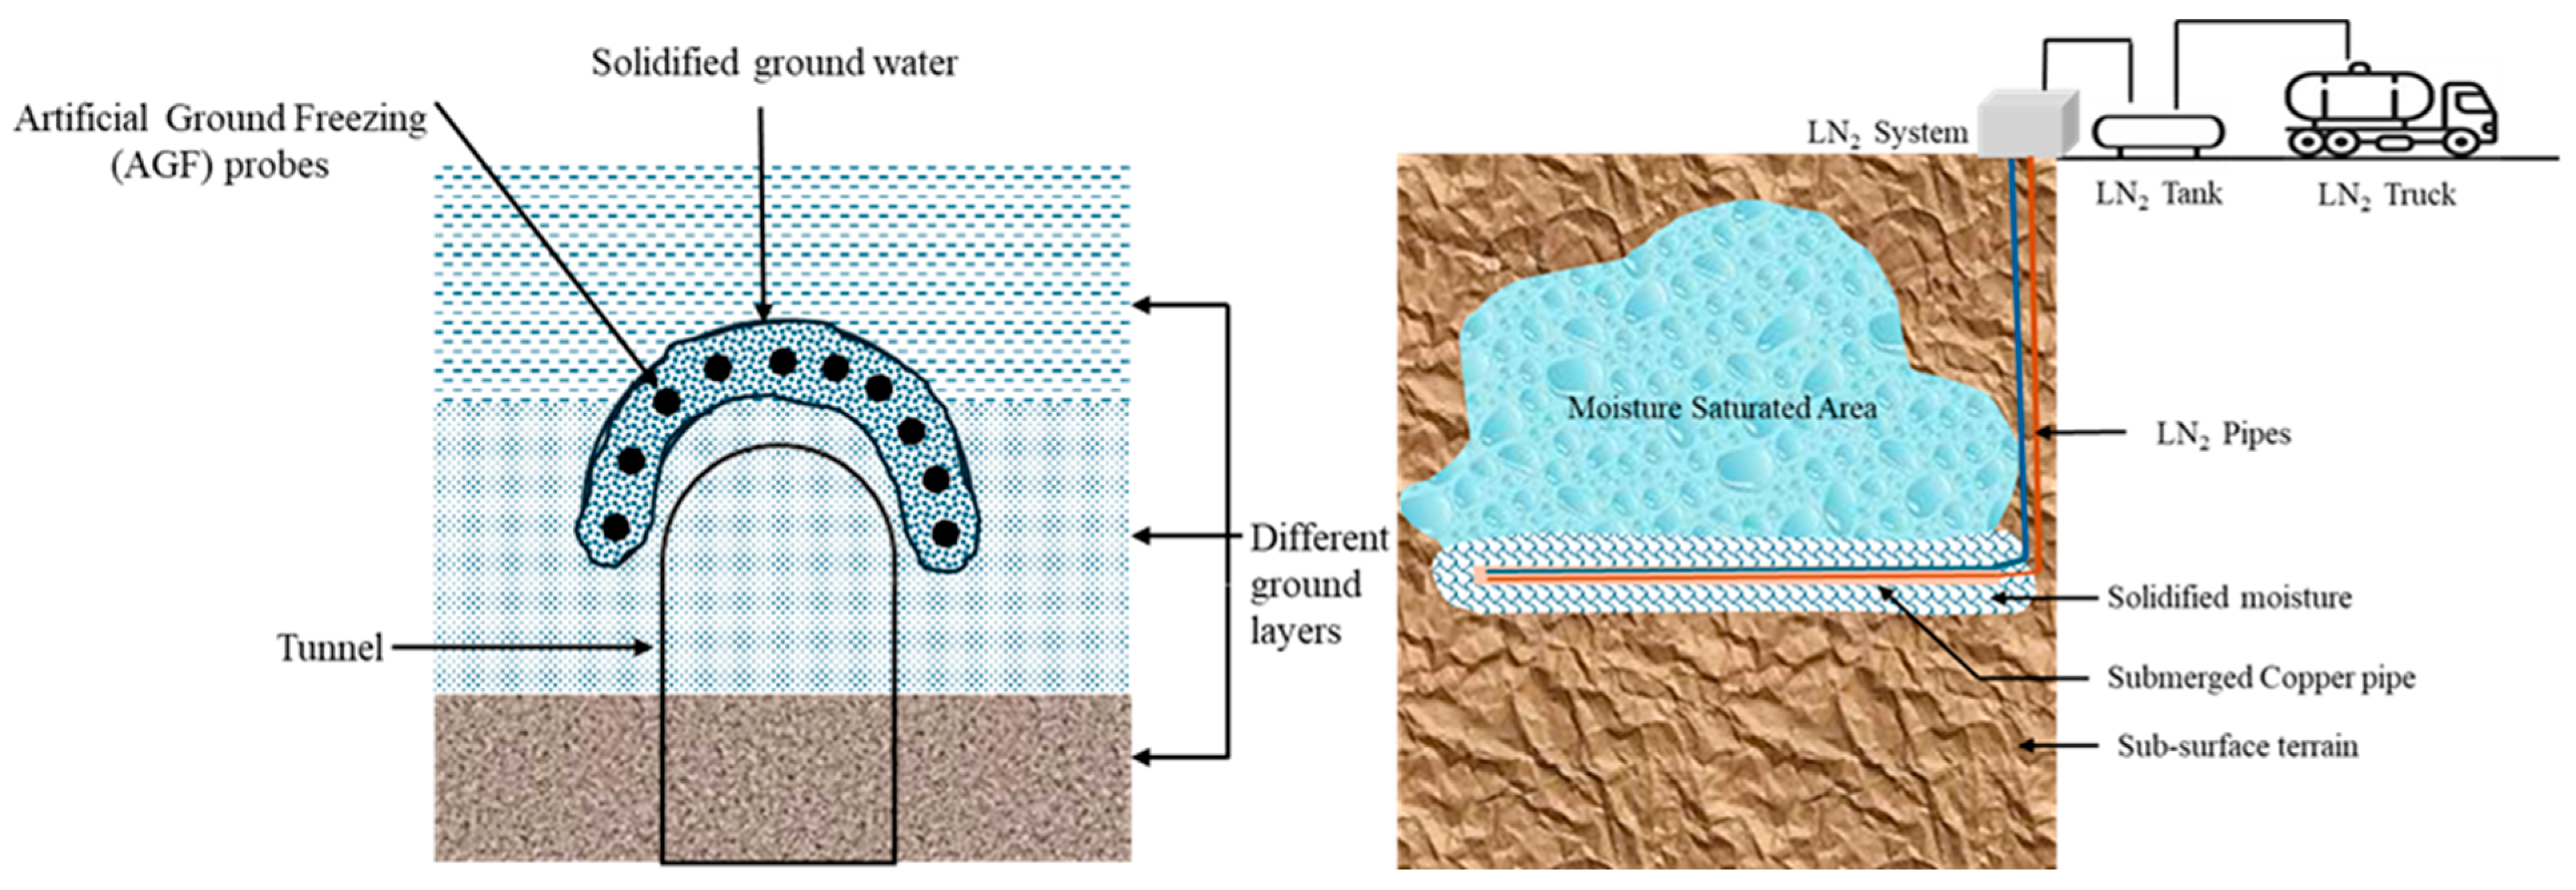
Figure 1. Schematic of artificial ground freezing (AGF) technique and how the ground is solidified over tunnel area [46].
Energies 18 02965 g001
Figure 2. Simple schematic of the proposed system.
Energies 18 02965 g002
Figure 3. Actual AGF arrangement on tunnel periphery. The converted pipes have an inner pipe and annulus diameters of 32 mm and 76 mm, with a pipe length of 40 m.
Energies 18 02965 g003
Figure 4. Experimental site near Piazza Municipio, Naples, Southern Italy.
Energies 18 02965 g004
Figure 5. Experimental setup, showing the arrangements in a single tunnel with converted AGF probes indicated as 9, 11, 13, and 15. Placement of different sensors is also indicated.
Energies 18 02965 g005
Figure 6. Data-processing workflow followed in experimental campaign.
Energies 18 02965 g006
Figure 7. Actual tunnel showing converted AGF probes (9, 11, 13, and 15) with 3D computational domain used for the model.
Energies 18 02965 g007
Figure 8. Boundary conditions for the computational domain.
Energies 18 02965 g008
Figure 9. Distribution of mesh elements in the domain and around the tunnel.
Energies 18 02965 g009
Figure 10. Dimensions of various computational domains for mesh independence analysis.
Energies 18 02965 g010
Figure 11. Comparison of temperature to obtain a mesh-independent domain.
Energies 18 02965 g011
Figure 12. Comparison of mass flow rate and temperature variation for the month of August.
Energies 18 02965 g012
Figure 13. Comparison of probe temperatures with simulated values for the month of July.
Energies 18 02965 g013
Figure 14. Comparison of probe temperatures with simulated values for the month of August.
Energies 18 02965 g014
Figure 15. Temperature variations in the domain with continuous operation of the system during the cooling operation.
Energies 18 02965 g015
Figure 16. Comparison of probe temperatures with simulated values for the month of September.
Energies 18 02965 g016
Figure 17. Comparison of probe temperatures with simulated values for the month of October.
Energies 18 02965 g017
Figure 18. Comparison of probe temperatures with simulated values for the month of November.
Energies 18 02965 g018
Figure 19. Temperature variations in the domain with continuous operation of the system for September, October, and November.
Energies 18 02965 g019
Figure 20. Comparison of average heat transfer through probes during the operational period with a numerical model.
Energies 18 02965 g020
Figure 21. Average heat transfer during the cooling and heating period. (a) Showing the comparison of average heat transfer per unit length for all the probes; (b) compares the average cumulative heat transfer in a month.
Energies 18 02965 g021
Table 1. Comparison of GSHP and ASHP.
FactorGSHPASHPReferences
Heat Source Ground is used as sourceAmbient air outside the building, even in cold climates [20,21]
Efficiency More efficient due to stable heat sourceThe efficiency is less than that of GSHP systems, especially in colder/hotter climates.[22,23]
InstallationComparatively installation require specialized process of drillingTypically, easy to install. [20,24,25,26]
NoiseLow almost negligible noise production during operationHigher noise production during operations [27,28]
MaintenanceThe maintenance is lower as compared to ASHP but when required it can be difficultThe maintenance is easy as components are easily accessible [29,30]
CostHigh installation costs required, due to drilling and loop installation but low operating costLower installation costs but higher operating costs [29,31,32]
Table 2. Material properties for the ground, adjacent to the tunnel.
Material Properties (Pozzolana)Values
Porosity ℇ0.51
Dry   density   ρ d (kg/m3)1172
Thermal conductivity k (W/m/K)1.28
Heat capacity Cp (kJ/m3/K)3150
Permeability kf (m/s)10−6
Table 3. Summary of mesh independence parameters with respect to average domain temperatures for cooling and heating cycles.
Mesh LevelNo. of
Elements
Avg. Domain Temp. (Cooling)
(°C)
Avg. Domain Temp. (Heating)
(°C)
Coarse510921.45521.763
Medium16,06721.92721.788
Fine68,33121.80721.938
Extremely Fine178,94821.75121.888
Disclaimer/Publisher’s Note: The statements, opinions and data contained in all publications are solely those of the individual author(s) and contributor(s) and not of MDPI and/or the editor(s). MDPI and/or the editor(s) disclaim responsibility for any injury to people or property resulting from any ideas, methods, instructions or products referred to in the content.