Abstract
Green data centers (GDCs) are increasingly deployed worldwide to power digital infrastructure sustainably. These centers integrate renewable energy sources, such as solar and wind, to reduce dependence on grid electricity and lower operational costs. When distributed geographically, GDCs face considerable challenges due to spatial variations in renewable energy availability, electricity pricing, and bandwidth costs. This paper addresses the joint optimization of operational cost and service quality for delay-sensitive applications scheduled across distributed green data centers (GDDCs). We formulate a multi-objective optimization problem that minimizes total operational costs while reducing the Average Task Loss Probability (ATLP), a key Quality of Service (QoS) metric. To solve this, we propose an Adaptive Firefly-Based Bi-Objective Optimization (AFBO) algorithm that introduces multiple adaptive mechanisms to improve convergence and diversity. The minimum Manhattan distance method is adopted to select a representative knee solution from each algorithm’s Pareto front, determining optimal task service rates and ISP task splits into each time slot. AFBO is evaluated using real-world trace-driven simulations and compared against benchmark multi-objective algorithms, including multi-objective particle swarm optimization (MOPSO), simulated annealing-based bi-objective differential evolution (SBDE), and the baseline Multi-Objective Firefly Algorithm (MOFA). The results show that AFBO achieves up to 64-fold reductions in operational cost and produces an extremely low ATLP value () that is nearly two orders of magnitude lower than SBDE and MOFA and several orders better than MOPSO. These findings confirm AFBO’s superior capability to balance energy cost savings and Quality of Service (QoS), outperforming existing methods in both solution quality and convergence speed.
1. Introduction
Cloud computing has fundamentally transformed the computing landscape, enabling enterprises, organizations, and academic institutions to offload the management of costly IT infrastructure to cloud data centers [1,2]. These data centers offer elastic, reliable, and cost-effective services, hosting millions of physical servers, storage devices, and cooling facilities [3]. This infrastructure supports a wide array of delay-sensitive applications, including e-commerce, scientific computing, high-performance simulations, and big data analytics [4]. The scalability and flexibility of cloud data centers have led to their widespread adoption across various sectors.
However, the rapid proliferation of cloud-based applications has significantly increased the energy consumption of cloud data centers. In 2023, data centers in the United States consumed approximately 176 terawatt-hours (TWh) of electricity, accounting for about 4.4% of the nation’s total electricity consumption. Projections indicate that by 2028, U.S. data center energy consumption could reach between 325 and 580 TWh, representing up to 12% of the country’s electricity demand [5]. Globally, data centers consumed around 340 TWh in 2023, constituting approximately 1.3% of worldwide electricity usage. This figure is expected to rise, driven by the increasing computational demands of artificial intelligence (AI) and other emerging technologies [6].
The rising energy demands of cloud data centers (CDCs) pose significant environmental challenges, as much of their electricity still comes from fossil fuels, contributing to greenhouse gas emissions and climate change. To mitigate this impact, cloud service providers are increasingly adopting green data centers (GDCs), integrating renewable energy sources such as solar, wind, hydro-, and geothermal power to reduce their carbon footprints. For instance, as of 2024, Apple Inc. has invested heavily in renewable energy, supporting over 18 gigawatts of clean electricity across its global operations and supply chain [7].
As cloud services expand globally, data centers are evolving into geographically distributed infrastructures, leading to the emergence of green distributed data centers (GDDCs) [8]. These infrastructures span multiple locations, leveraging regional renewable energy sources to enhance sustainability and optimize energy use. However, renewable energy availability fluctuates across regions and deregulated electricity markets introduce dynamic pricing variations. Additionally, factors such as server availability, task service rates, and queue capacities vary spatially and temporally, making resource management increasingly complex. Furthermore, GDDCs depend on multiple Internet Service Providers (ISPs) for global data transfers, adding another layer of complexity due to variable bandwidth availability and pricing across regions. Moreover, GDDCs must efficiently schedule diverse workloads while meeting strict delay-bound constraints, ensuring cost-effective execution of heterogeneous applications [9].
With their decentralized architecture, efficient task scheduling in GDDCs has become a critical challenge. Unlike traditional centralized data centers, GDDCs must dynamically adapt to variations in renewable energy supply, electricity costs, and network conditions. This variability necessitates intelligent workload distribution to achieve both energy efficiency and high performance and requires advanced resource allocation strategies. Scheduling tasks in GDDCs involve balancing energy consumption and Quality of Service (QoS) in highly dynamic environments [10]. While minimizing energy usage reduces operational costs, it may compromise system performance, affecting response times and reliability, especially for delay-sensitive applications. Additionally, network bandwidth constraints and heterogeneous resource capacities across distributed data centers further complicate scheduling decisions. To address these challenges, adaptive scheduling strategies are required to dynamically allocate resources, ensuring energy-efficient execution while maintaining QoS guarantees [11].
Extensive research in both academia and industry has focused on minimizing energy costs in CDCs [12,13]. While numerous task-scheduling strategies have been proposed to optimize energy consumption, many fail to account for the spatial variability of energy availability, electricity pricing, and network conditions in distributed infrastructures. Moreover, existing approaches often treat QoS as a fixed constraint rather than an optimization objective, limiting their ability to dynamically balance energy efficiency and service performance [14]. To bridge this gap, this work addresses the joint optimization of energy cost and Quality of Service in distributed green infrastructures through a dynamic, adaptive metaheuristic framework. Specifically, the proposed work addresses three key challenges: (i) how to schedule delay-sensitive applications across geo-distributed GDDCs under highly variable energy, pricing, and network conditions; (ii) how to minimize the Average Task Loss Probability (ATLP)—a delay-bound violation metric—alongside operational cost; and (iii) how to efficiently solve the resulting high-dimensional, constrained multi-objective optimization problem in real time.
We propose a multi-objective optimization model that simultaneously minimizes the total operational cost and ATLP. Our solution is an Adaptive Firefly-Based Bi-Objective Optimization (AFBO) algorithm that introduces adaptive mechanisms to the baseline Firefly Algorithm (FA) [15,16] for constraint handling, randomized exploration, and convergence control. These enhancements improve global search mobility, refine the exploration–exploitation trade-off, and accelerate convergence speed, making the proposed approach highly suitable for real-time GDDC task scheduling. A representative knee solution is extracted from each generated Pareto front using the minimum Manhattan distance method, which determines the optimal service rates and task splits across GDDCs.
This work contributes to the field in several important ways. First, it formulates a realistic, delay-aware cost-QoS optimization framework tailored for dynamic GDDC environments. Second, it introduces a structured set of design extensions to the baseline Firefly Algorithm (FA), resulting in a novel adaptive firefly-based metaheuristic capable of robust, bi-objective optimization under complex constraints. Third, it combines penalty-based reformulation with Pareto-based knee selection to support efficient exploration of bi-objective trade-offs. Finally, it validates the proposed approach through extensive simulations based on real-world cloud traces, demonstrating significant improvements in service reliability, convergence speed, and energy efficiency.
This paper is structured as follows. The next section reviews related work, highlighting the novel contributions of this study. Section 3 presents the GDDC architecture and formulates the multi-objective optimization problem for a GDDC provider. Section 4 details the problem-solving methodology. Section 5 discusses the proposed AFBO approach, while Section 6 evaluates its performance through real-life trace-driven experiments and comparisons with state-of-the-art methods. Finally, Section 7 concludes the paper with key insights and future research directions.
2. Related Works
The related work is split into the following three subsections.
2.1. Green Data Centers
The increasing energy demands of large-scale cloud data centers have motivated numerous studies to integrate renewable energy sources into their operations. Various approaches have been proposed to maximize green energy utilization, minimize operational costs, and ensure sustainable, energy-efficient computing. Islam et al. developed an energy management framework in [17] to maximize green energy utilization and reduce operational costs in data centers. Their framework significantly reduces on-grid electricity consumption while maintaining Quality of Service (QoS), leading to energy-efficient operations for green data centers (GDCs). A Service Level Agreement (SLA)-driven approach was proposed by Amokrane et al. in [18] to minimize the carbon emissions and operational costs of distributed clouds by leveraging variable electricity prices and renewable energy availability. Another study proposed a systematic approach to maximize green data center profits by balancing energy expenditure and revenue from various services, explicitly considering practical SLAs [19]. In [20], an online algorithm is designed for load scheduling and greenness-aware power optimization in DGDCs. The approach formulates a stochastic constrained optimization problem that is solved using Lyapunov theory. The proposed algorithm effectively balances power savings, carbon footprint reduction, and user quality of experience (QoE). However, due to limited renewable energy availability, certain tasks are rejected, impacting overall service efficiency. More recent studies have further explored renewable energy integration and task scheduling in DGDCs. For instance, Zhang et al. [21] investigated renewable-aware workload balancing strategies that optimize energy efficiency and QoS in multi-region DGDCs. Kumaravelu [22] proposed an AI- and machine learning (ML)-driven framework to enhance energy efficiency in data centers. The study explores intelligent resource allocation techniques that dynamically adjust computational workloads based on real-time energy availability. By leveraging predictive analytics and adaptive scheduling, the approach reduces grid dependency and operational costs while optimizing renewable energy utilization in distributed cloud infrastructures. Unlike the aforementioned studies, our work focuses on efficient task scheduling for heterogeneous, delay-bounded applications in GDDCs. It maximizes renewable energy utilization, reduces operational costs, and balances energy efficiency with QoS constraints. We propose a multi-objective optimization approach that ensures real-time, near-optimal scheduling decisions, improving both resource utilization and system performance.
2.2. Task Scheduling in GDCs
Task scheduling in green data centers (GDCs) has been a focal point of research in recent years [23,24]. Juarez et al. [23] developed scheduling policies aimed at minimizing both execution time and power consumption in distributed cloud platforms. Employing heuristic techniques, their approach defines resource allocation rules that yield satisfactory solutions within acceptable time frames. In another study, an energy-aware task-scheduling model is proposed to reduce energy consumption for cloud providers by associating minimum frequency settings with task performance requirements [25]. This scheduler minimizes the number of active servers and adjusts server core frequencies to conserve energy. Similarly, Nir et al. [26] formulated a task-scheduling model enabling numerous mobile users to allocate their tasks to cloud resources, optimizing energy utilization and total costs for cloud providers. However, these studies do not account for renewable energy sources. Recent studies have extended task-scheduling approaches by incorporating renewable energy awareness and advanced optimization techniques. A novel bio-inspired scheduling approach was introduced to minimize energy consumption in DGDCs, demonstrating significant efficiency improvements by dynamically adjusting workloads based on green energy availability [27]. Jayanetti et al. [24] proposed a Multi-Agent Deep Reinforcement Learning (MADRL) framework for renewable energy-aware workflow scheduling in geo-distributed cloud data centers. Their approach dynamically adjusts task scheduling based on real-time renewable energy availability, reducing reliance on non-renewable power sources. Experimental results demonstrate significant energy savings while maintaining workflow performance and efficiency. Distinct from prior work, our approach optimizes task scheduling in GDDCs by minimizing ATLP and energy costs while considering spatial and temporal variations in electricity pricing, renewable energy availability, server availability, task service rates, and queue capacities, to ensure efficient resource allocation and adherence to delay constraints.
2.3. Performance Modeling and Optimization in GDCs
Several studies have extensively explored QoS modeling and guarantees for user tasks [28,29]. In [28], the average response time per server is modeled using an M/M/C queuing system, which is then extended to compute the overall user response time. A profit optimization problem is subsequently formulated for cloud providers. In [20], service latency is modeled as a convex function of geographical distance, capturing the impact of a user’s proximity to different data centers. A stochastic optimization problem is formulated and solved using the Lyapunov method, leading to an eco-aware load scheduling and power management algorithm that minimizes the energy costs in DGDCs. Further, the study in [30] formulates multi-objective mathematical models to optimize task scheduling and energy consumption. It employs NSGA-II to minimize both makespan and energy consumption, integrating an artificial neural network (ANN) to predict future resource availability based on task characteristics. Additionally, ref. [31] proposes a QoS-aware task-scheduling algorithm that optimizes energy consumption using an ARIMA-based prediction model and a hybrid PSO-GSA approach. Deep learning-based workload modeling is explored in [32], improving elastic scaling and resource provisioning through data-driven analytics. Meanwhile, ref. [29] introduces a Firefly Algorithm and Learning-based Geographical Task-Scheduling framework, reducing the operational costs in DGDCs via adaptive metaheuristics and intelligent resource allocation.
The Firefly Algorithm (FA) is a promising nature-inspired optimizer for high-dimensional, nonlinear, and NP-hard problems [15,16]. Its flexibility and multimodal search behavior have led to widespread use in resource allocation tasks. The FA regulates exploration through parameters such as the absorption coefficient , attractiveness , and randomization factor , which are typically fixed before execution [33].
To overcome this limitation, enhanced variants have introduced dynamic control schemes. Farahani et al. [34] adapt using Gaussian distributions; Yang et al. [35] use Lévy flights for improved exploration. Other works leverage chaotic maps to tune and , improving global diversity and local refinement [36,37,38,39]. These extensions demonstrate FA’s versatility and extensibility for solving complex scheduling problems.
Our proposed AFBO builds on these developments by integrating adaptive control tailored to GDDCs. Unlike prior works that treat QoS as a constraint, AFBO jointly optimizes operational cost and Average Task Loss Probability (ATLP) in a bi-objective framework. Through dynamic parameter adaptation and Pareto front exploration, it efficiently determines optimal task service rates and ISP allocations across distributed nodes.
3. Problem Formulation
This section formulates the bi-objective optimization problem considered in this work. It presents the mathematical modeling of the system—encompassing key assumptions, operational constraints, and objective functions—that collectively define the scheduling problem in green distributed data centers (GDDCs). Section 3.1 introduces the system architecture, including task sources, routing, and energy provisioning. Section 3.2, Section 3.3 and Section 3.4 then describe the queuing behavior, energy-cost dynamics, and QoS constraints, leading to the formal problem formulation.
3.1. System Architecture and Assumptions
Green data centers (GDCs) cater to a diverse range of global users by providing various cloud services. A typical cloud provider operates multiple GDCs distributed across different geographical locations, as illustrated in the DGDC system architecture in Figure 1. Each GDC consists of thousands of servers dedicated to processing user tasks, with power supplied from multiple energy sources, including wind, solar, and non-renewable grids. Users submit tasks to GDCs via different devices such as smartphones, tablets, and computers.
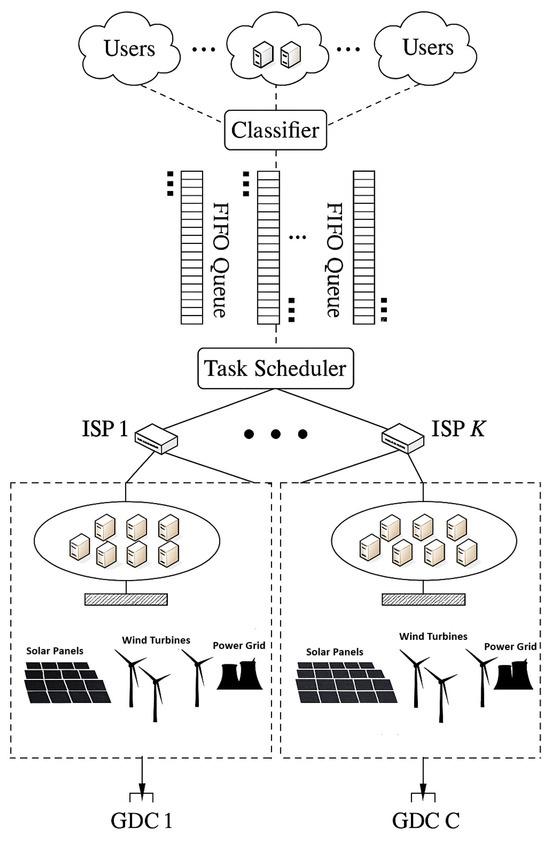
Figure 1.
System architecture of green distributed data centers (GDDCs), where user tasks are submitted via diverse devices and routed through multiple ISPs to geo-distributed GDCs powered by a mix of renewable and thermal energy sources.
These users may include individuals engaged in latency-sensitive activities such as cloud gaming, video conferencing, and remote desktop services, as well as enterprise systems performing real-time analytics or smart factory operations. Such scenarios generate geographically distributed, delay-critical workloads that require energy-aware task scheduling to ensure both low-latency performance and sustainable operations.
Following the approach in [10], we assume that applications are replicated and distributed across all GDCs, allowing each task to be executed independently at any available GDC. Tasks are transmitted to the cloud data centers through multiple ISPs. Based on the application type, tasks are first classified and then managed using First-In-First-Out (FIFO) queues specific to each application category [40]. Key operational data—including queue statuses, renewable energy availability, grid electricity costs, and ISP pricing at each location—are periodically collected and transmitted to a task scheduler. This scheduler implements the proposed Adaptive Firefly-Based Bi-Objective Optimization (AFBO) algorithm to determine the Pareto-optimal task service rates, ISP-based task distribution, and optimal configuration of GDC servers. By dynamically optimizing these parameters at each time slot, the framework minimizes the total operational cost for the GDDC provider while ensuring strict Quality of Service (QoS) compliance.
3.2. Delay-Constrained Task Model
At time slot , represents the task arrival rate, while denotes the server service rate for application n in GDC c. Following the approach in [10], servers in GDC c for application n are modeled using an M/M/1//∞ queuing system, where denotes the queue capacity for application n in GDC c. Based on this model, the average response time for application n tasks in GDC c is computed as follows:
where
Let represent the maximum allowable response time for tasks of application n. The average time response of application n tasks in GDC c must not exceed this constraint:
The service rate of tasks for application n corresponds to the rate at which they are processed and removed from their respective FIFO queue. This rate is determined by incorporating the task loss probability for application n at time slot in GDC c. Under the adopted M/M/1//∞ queuing model, the task’s loss possibility at time slot for application n in GDC c, is expressed as follows [41]:
where is the capacity of each server queue in GDC c for application n tasks and is defined by Equation (4). Let define application n’s tasks arriving rate at time slot delivered through ISP k to DGDC c. The stability of an application n’s task queue in GDC c is guaranteed as long as the task arrival rate does not exceed the service rate at time slot . This condition imposes the following constraints:
Moreover, at each time slot , the total task arrival rate for application n in GDC c must equal the sum of the task arrival rates distributed across all k ISPs. Additionally, the overall task arrival rate for application n is the sum of arrival rates across all GDCs, as expressed in the following equation:
Let denote the average task size for application n, and let represent the bandwidth capacity limit of ISP k. At each time slot , the total allocated bandwidth through ISP k must not exceed , ensuring the following constraint:
3.3. Energy Consumption Model for Task Execution
Based on the homogeneous server model in [42], each powered-on server in GDC c processes tasks of application n at a fixed rate of tasks per minute. To ensure sufficient resource allocation while maintaining efficiency, the number of active servers, , required at time slot is given as
must not exceed , the maximum number of servers available for application n in GDC c. Thus, the following constraint holds:
The number of tasks processed by each active server for application n in GDC c at time slot , denoted as , is given by
where L is the duration of time slot . Accordingly, let represent the busy period (in minutes) of each powered-on server assigned to application n in GDC c at time slot , defined as:
We define as the CPU utilization of an active server handling application n in GDC c during time slot , expressed as
Each powered-on server in GDC c processing application n’s tasks consumes energy through a combination of a base load and a dynamically varying component [43]. The base load corresponds to the power required when the server is idle, while the proportional load scales with task execution. We define and as the base and load-dependent power consumption of an active server running application n in GDC c, respectively, computed as follows:
The parameter represents the average idle power of a server allocated to application n in GDC c, while corresponds to its average peak power. Additionally, defines the power usage effectiveness of GDC c, representing the ratio of total energy consumption (including infrastructure overhead) to the energy consumed by servers. Its typical value ranges from 1.2 to 2.0.
Therefore, the total power of GDC c consumed by servers in time slot is obtained as
Thus, the total power consumed by all switched-on servers in GDC c at time slot is computed as follows:
Using (12) and (16), the total energy can be expressed by:
The total energy used for processing application tasks in GDC c at time slot must be constrained within , the GDC’s maximum allowable energy. The following inequality expresses this condition:
3.4. Solar and Wind Renewable Energy Model
The solar energy produced in GDC c at time slot , denoted as , is determined based on the model in [44] as follows:
where is the active irradiation area of solar panels in GDC c, is the rate of converting solar energy to electricity, and is the solar irradiance per at time slot .
Denoting with the wind energy produced in GDC c at time slot , we compute its value using the wind energy model in [45] as
where is the rate to convert wind to electricity, is the rotor area of the wind turbines, is the on-site air density, and is the wind speed in GDC c.
3.5. Constrained Optimization Problem
At time slot , the total cost of a GDDC provider, denoted as , includes the ISP bandwidth cost and the DGDCs energy cost incurred for processing the scheduled tasks.
The ISP bandwidth cost at time slot is formulated as follows:
Here, K, N, and C represent the number of available ISPs, application types, and GDCs, respectively. The ISP bandwidth price at time slot is denoted by , while defines the arrival rate of application n’s tasks delivered via ISP k to GDC c at time slot . Additionally, represents the average task size for application n and L denotes the duration of each time slot (5 min).
Let denote the thermal power electricity price at time slot in GDC c; the energy cost at time slot of the GDDC is given as
The first objective aims to minimize the operational cost of GDDCs and is formulated as follows:
The Average Task Loss Probability (ATLP), denoted as , represents the average probability of task loss across all GDCs at time slot . It is computed as
The second objective, which aims to minimize the ATLP, , is expressed as
The ATLP is selected as the QoS objective because it directly captures the probability of task rejection due to service delays exceeding application-specific deadlines. This makes it highly suitable for evaluating performance in delay-sensitive GDDC environments. Compared to other QoS metrics such as latency, availability, or throughput, ATLP accounts for queue dynamics, task arrival intensity, and server capacity, offering a more integrated and service-aware performance measure. Moreover, it is mathematically aligned with the adopted M/M/1/ queuing model, allowing for tractable optimization and direct incorporation into the scheduling strategy.
Consequently, the problem is formulated as a bi-objective optimization model ():
Solving requires jointly optimizing two interdependent decisions: (a) allocating incoming tasks among available ISPs and (b) configuring the set of active servers in each GDC at every time slot. The goal is to simultaneously minimize operational costs while optimizing Quality of Service (ATLP), ensuring that delay constraints and energy availability limits are met. An optimal solution to must effectively balance these competing objectives while adhering to the system constraints. The proposed approach for solving is detailed next, under the assumption that all system parameters, including (electricity price), (ISP bandwidth price), (wind energy availability), and (solar irradiance), are known at the beginning of each time slot .
4. Problem-Solving Methodology
This section presents the methodological foundations underlying our proposed solution to the bi-objective task-scheduling problem formulated in Section 3. As the problem involves nonlinear, high-dimensional objectives and complex system constraints, classical optimization techniques are insufficient. We first reformulate the constrained problem using a penalty-based approach to enable tractable search in an unconstrained setting. Next, we review the limitations of conventional scalarization-based methods and discuss the advantages of direct multi-objective optimization. We then provide an overview of prominent evolutionary algorithms and motivate the selection of the Firefly Algorithm (FA) for this task. Finally, we highlight the limitations of the classical FA and introduce the rationale for our adaptive enhancements. These elements collectively establish the foundation for the Adaptive Firefly-Based Bi-Objective Optimization (AFBO) algorithm, which is formally introduced in the next section.
4.1. Reformulating the Optimization Problem
It is important to note that and in P1 are nonlinear with respect to and . As a result, P1 is a constrained nonlinear optimization problem with continuous decision variables. Constraints (5), (7)–(11), (13), and (22) are inherently nonlinear and complex. To enable metaheuristic optimization in the presence of complex constraints, we reformulate the problem by embedding constraint violations into the objective function through a penalty mechanism. Following this approach, we adopt a penalty function method [46], eliminating explicit equality and inequality constraints by introducing a penalization function that grows to infinity when constraints are violated. Consequently, P1 is reformulated into an equivalent unconstrained nonlinear problem P2, as follows:
where and denote the new unconstrained objective functions, is a large positive constant, and represents the total constraint violation cost, defined as follows:
Here, represents the vector of decision variables and l and are positive constants.
The first summation captures penalties from violated inequality constraints , while the second term penalizes deviations from equality constraints . When all constraints are satisfied, the penalty value is zero, restoring equivalence with the original constrained problem. This reformulation enables the use of metaheuristic algorithms in a simpler unconstrained search space.
In our implementation, we set and , applying quadratic penalties for both inequality and equality constraint violations. This choice balances enforcement strength and numerical stability—penalizing larger violations more aggressively while preserving the optimizer’s ability to explore near-feasible regions. These values were selected based on commonly adopted practice in penalty-based metaheuristics and were validated empirically for convergence consistency across all scenarios tested.
4.2. Why Direct Multi-Objective Optimization?
The penalty-based reformulation in Section 4.1 results in two conflicting objectives: minimizing operational cost and task loss probability. Selecting an appropriate multi-objective optimization strategy is thus essential. Classical scalarization techniques—such as the weighted sum or weighted metric methods—convert multi-objective problems into single-objective formulations. However, these approaches face several limitations. For instance, the weighted sum method requires predefined objective weight vectors, making it challenging to ensure a well-distributed set of Pareto-optimal solutions. Moreover, it struggles to capture certain Pareto-optimal solutions, particularly in nonconvex objective spaces, where a simple linear combination fails to explore the entire Pareto front. Additionally, this method produces only a single candidate solution per run, necessitating multiple executions with varying weights to approximate the full set of optimal trade-offs. In contrast, direct multi-objective optimization methods inherently generate a diverse set of Pareto-optimal solutions in a single run, allowing decision-makers to explore a broader range of trade-offs without repeated optimization. This improves computational efficiency and provides a more comprehensive representation of the Pareto front, making it better suited for real-world decision-making scenarios. We therefore adopt a direct multi-objective approach and review suitable evolutionary algorithms in the next subsection.
4.3. Evolutionary Approaches for Multi-Objective Optimization
Several multi-objective evolutionary optimization algorithms have been developed to simultaneously optimize multiple objectives and generate a set of Pareto-optimal solutions. Among these, multi-objective particle swarm optimization (MOPSO) [47] is a well-known approach. However, a major drawback of MOPSO is its rapid convergence, often leading to a premature solution. As a result, MOPSO may fail to capture the true Pareto-optimal front when applied to complex multi-objective optimization problems. Another widely used method is Multi-objective Differential Evolution (MODE) [48], a simple yet effective population-based direct search algorithm designed to handle complex multi-objective problems with constraints in continuous spaces. MODE has been validated in numerous real-world applications [49]. However, like MOPSO, MODE is prone to premature convergence and can easily get trapped in local optima. To overcome these limitations, the authors of [10] introduced a simulated-annealing-based bi-objective differential evolution (SBDE) algorithm to enhance solution diversity and improve the approximation of the Pareto front. In SBDE, evolutionary operations such as adaptive mutation, simulated annealing (SA)-based crossover, and SA-based selection are incorporated to improve global convergence speed and overall optimization performance.
4.4. Firefly Algorithm and Adaptation Rationale
A promising optimization technique, the Firefly Algorithm (FA) [50], is inspired by the natural attractiveness behavior of fireflies, where individuals are drawn to others based on their flashing light signals. The basic FA was introduced in [15], highlighting its multi-modal characteristics and superior ability to explore the search space compared to several other nature-inspired meta-heuristics. The studies in [33,51] further confirm the FA’s potential for efficiently solving nonlinear, non-polynomial, multidimensional, and NP-hard real-world optimization problems. Given its effectiveness in single-objective optimization, the FA has evolved into the Multi-Objective Firefly Algorithm (MOFA) to tackle multi-objective problems with complex constraints in continuous spaces [52,53]. MOFA leverages randomization and local search trade-offs to efficiently explore solution sets and achieve fast convergence. The balance between these trade-offs is controlled by specific algorithm parameters, which are typically tuned before execution and remain fixed during iterations [54]. However, several modified FA variants have introduced adaptive control mechanisms that dynamically adjust these parameters during execution [55], improving solution quality and convergence.
Building on previous advancements in FA modifications, MOFA enhancements must be tailored to the specific problem. To effectively solve our large-scale nonlinear optimization problem P2, we introduce an adaptive MOFA that dynamically optimizes the balance between exploration and exploitation. The proposed solution introduces new learning rules for parameter control, adaptation, and selection strategies to enhance its global search capability, ensuring robust and efficient global optimization of P2. The following sections first review the main steps of the basic FA, then introduce multiple novel modifications aimed at increasing FA’s global search mobility, achieving higher convergence speed and enhanced optimization efficiency. Finally, we introduce the Adaptive Firefly-based Bi-Objective Optimization (AFBO) framework and outline the methodology for selecting the final representative solution, known as the knee, from the Pareto-optimal set.
The next section formally presents the AFBO algorithm, its adaptive components, and its implementation strategy for constrained, real-time scheduling in GDDCs.
5. Adaptive Firefly-Based Bi-Objective Optimization (AFBO)
This section presents the complete Adaptive Firefly-Based Bi-Objective Optimization (AFBO) algorithm developed to solve the unconstrained problem P2. AFBO integrates new learning rules for parameter control, adaptive movement, and selection strategies to improve global search efficiency and solution quality. It extends the standard Firefly Algorithm with mechanisms for constraint handling, dominance-based evaluation, and knee selection tailored to dynamic GDDC environments. We first review the core steps of the baseline FA, followed by our adaptive enhancements, and conclude with the full AFBO framework and knee solution methodology.
5.1. Baseline Firefly Algorithm (FA): Core Steps
The pseudocode for the basic FA is outlined in [56]. The fundamental steps of the FA are as follows:
1- Establish firefly brightness and attractiveness: At any given location x, the brightness intensity is determined based on the objective functions of the problem. An aggregation strategy or dominance-based mechanism is applied to define brightness for multiple objectives. The intensity also diminishes with distance from its source , following the inverse square law, i.e.,
As light propagates through a medium with an absorption coefficient , its attractiveness decreases accordingly. Given , the intensity I at a distance r is expressed as:
2- Calculate the distance between any two fireflies i and j:
where is the dimension of one firefly vector.
3- Initialize a population of fireflies and update the position of firefly i by moving it toward a more attractive firefly j at each iteration t.
The second term in (37) accounts for attractiveness, while the final term represents randomization, where is a vector of random numbers drawn from a Gaussian distribution, and is the randomization parameter. To control , a geometric annealing schedule is applied, starting from its initial value , i.e.,
where is a damping reduction constant.
4- Update the fireflies’ light intensities, rank them accordingly, and identify the current best solution.
5.2. Adaptive Firefly Algorithm (AFA): Design Extensions
To enhance the efficiency and robustness of the Firefly Algorithm (FA), this section introduces the proposed Adaptive Firefly Algorithm (AFA). AFA integrates multiple modifications aimed at improving global search capability, convergence speed, and overall optimization efficiency. These enhancements adaptively adjust key algorithmic parameters to maintain an optimal balance between exploration and exploitation, as detailed in the following subsections.
1- Controlling the Attractiveness Parameter: In the standard FA, the initial attractiveness value is typically set to a constant . However, we propose an adaptive rule to update dynamically during the algorithm’s execution. Specifically, when firefly i moves toward a more attractive firefly j (i.e., ), the initial brightness is adjusted as follows:
where , , and is a small positive constant to prevent division by zero when .
Moreover, in the standard FA, the absorption factor is typically set to a fixed value , where . To improve adaptability, we introduce a boundary-handling mechanism inspired by [57]. Let and denote the upper and lower bounds, respectively. These boundaries are used to adjust the attractiveness by defining a new initial value for as
where D represents the maximum distance between and , given by
where is the dimensionality of the firefly vector.
Consequently, the attractiveness is computed as
2- Adaptive Randomization Parameter: We introduce an adaptive randomization parameter inspired by [34] to enhance the balance between exploration and exploitation. A new damping scheme is proposed for the randomization factor . While follows a similar formulation to the standard FA, given by
the damping factor is now iteration-adaptive, ensuring a more controlled decay. In the standard FA, the randomization parameter decreases exponentially with a fixed damping factor, which can lead to inefficient search behavior—excessive randomness in early iterations slows convergence, while insufficient randomness in later iterations risks trapping fireflies in local optima. To address this, we introduce an iteration-dependent damping factor, allowing randomness to decrease gradually in the early stages and more aggressively in later stages, striking a better balance between global exploration and local exploitation.
In the modified FA, is defined as
where , t is the current iteration index, and represents the maximum number of iterations.
3- Adaptive Scheme for the Randomization Factor: This modification introduces a novel adaptive scheme for the randomization factor by incorporating a new parameter, , which adjusts randomization based on the fireflies’ adaptation step. The parameter is defined as:
where is a random value drawn from a standard normal distribution and m is a fixed positive constant. In our case, . This ensures that randomness decreases progressively as iterations advance while still allowing slight variations due to , maintaining diversity in the search process.
Consequently, the movement of firefly toward a more attractive firefly is updated as
where dynamically scales the randomization term, ensuring a more adaptive balance between exploration and exploitation throughout the optimization process. Unlike the global damping factor , which regulates randomness uniformly across all fireflies, introduces a localized adaptive mechanism that varies per firefly. This refinement complements the previous modification by preventing premature stagnation, maintaining search diversity, and ensuring a more flexible adaptation of the fireflies’ movement strategy. Together, these enhancements improve both the convergence speed and the robustness of the solution.
4- Adaptive Exploration Mechanism: This modification introduces a new adaptation rule that enhances solution diversity by allowing the best fireflies to explore new solutions through random walk, while others continue moving toward superior solutions. The updated movement rule is defined as
where is a variable fraction in . In this approach, the best-performing fireflies execute a random walk to explore new regions of the search space, while the remaining fireflies move toward better solutions. This balances exploration and exploitation, ensuring the algorithm maintains solution diversity without sacrificing convergence.
This modification introduces two extreme cases based on the value of . When , the modification has no effect and the behavior remains identical to previous AFA versions. Conversely, when , all fireflies move entirely through random walk, eliminating attraction-based movement and making the algorithm purely stochastic. Intermediate values allow the algorithm to balance convergence and exploration by selectively applying random walks to top-performing fireflies. In our design, we adopt , following the findings in [29], which identified this value as a robust trade-off between computational efficiency and optimization accuracy. This was also confirmed by preliminary tuning trials, where lower values (e.g., ) reduced search diversity, while higher values (e.g., ) introduced excessive randomness that degraded convergence speed. As such, was selected to ensure controlled exploration without compromising the stability and convergence of the AFBO algorithm.
5.3. AFBO Framework and Multi-Objective Integration
This subsection presents the Adaptive Firefly-Based Bi-Objective Optimization (AFBO) framework, which extends the adaptive modifications introduced in the previous section to a multi-objective optimization setting. AFBO incorporates Pareto dominance, adaptive movement strategies, and a refined knee selection methodology to improve both solution quality and convergence.
1- Adaptive Pareto Front Optimization: To handle multiple objectives, AFBO operates under the Pareto dominance principle, avoiding scalarization-based methods that convert multiple objectives into a single weighted function. A solution is said to dominate another solution if
with at least one inequality being strict. The non-dominated solutions from the population at each iteration define the Pareto front, which forms the basis for decision making.
2- Knee Solution Selection: While the Pareto front provides a set of optimal trade-off solutions, a single representative solution—the knee solution—is often required for practical decision making. The knee point is characterized as the most balanced trade-off between conflicting objectives. It is selected based on its Manhattan distance from the ideal point.
We use Manhattan distance in this context due to its robustness and linear treatment of deviations across multiple objectives. Unlike Euclidean distance, it avoids squaring, which can exaggerate the influence of large variations in one objective. This ensures a more balanced selection between energy cost and ATLP. Moreover, cosine similarity, which captures the angular similarity between vectors, is less appropriate here because our optimization seeks absolute deviation minimization from an ideal point, not vector alignment. The Manhattan distance thus offers both simplicity and interpretability in bi-objective scheduling trade-offs.
where:
- -
- and define the ideal values.
- -
- The knee solution is given by
3- Roulette Wheel Selection for Knee Selection: To enhance the selection process, we introduce Roulette Wheel Selection (RWS) to ensure a more diverse and well-balanced knee selection process. Instead of always selecting the solution with the smallest , RWS probabilistically selects a knee solution using the distribution
where:
- -
- (the closest solution to the ideal point).
- -
- is the annealing temperature, updated as
Using RWS ensures that the selection process remains diverse, avoiding bias toward extreme solutions, while also enhancing the algorithm’s robustness in knee selection as it converges.
5.4. The AFBO Optimization Algorithm
Based on these enhancements, the final AFBO algorithm (Algorithm 1) is presented below:
| Algorithm 1 Adaptive Firefly-Based Bi-Objective Optimization (AFBO) |
|
Algorithm 1 Computational Complexity: Let be the number of fireflies, T the number of iterations, and D the number of decision variables, where for C data centers, N applications, and K ISPs. At each iteration, every firefly evaluates two objective functions, checks dominance against others, computes constraint penalties, and updates its position based on adaptive movement strategies—each operation involving all D dimensions. Thus, the total time complexity is . The space complexity is , reflecting the storage of firefly positions, objective values, and the non-dominated archive. These bounds are typical for population-based multi-objective metaheuristics and are corroborated by the runtime results in Section 6.
6. Performance Evaluation
Real-world, trace-driven experiments were conducted to evaluate the effectiveness of AFBO against state-of-the-art multiobjective evolutionary algorithms. The evaluation is based on publicly available workload traces from the Google cluster dataset [58], a widely used benchmark in previous studies [40,59,60,61,62]. Specifically, tasks labeled with the **SUBMIT** event type are selected as they indicate task arrivals to the scheduler. The extracted data are then grouped by day, application, and 10-min intervals. The chosen reference day for experimentation is 30 May 2024. All algorithms were implemented in MATLAB R2019b, and experiments were conducted in a standard computing environment.
6.1. System Parameters
In our model, green distributed data centers (GDDCs) are deployed across three cities: Muscat, Oman; Cairo, Egypt; and Istanbul, Turkey. Each GDC has distinct internal configurations, including the maximum number of servers, their processing capacities, and the availability of photovoltaic panels and wind generators for renewable energy supply. The workload consists of three application types, indexed as Type 1, Type 2, and Type 3, with arrival rates sampled every 10 min from the Google Cluster dataset, as illustrated in Figure 2a. Each task type has a fixed size of 8 Mb, 5 Mb, and 2 Mb, respectively. To handle data transmission, three Internet Service Providers (ISPs) are selected, each offering different bandwidth capacities and pricing models. The maximum bandwidth capacities for ISP 1, ISP 2, and ISP 3 are 2000 Mbps, 3000 Mbps, and 4000 Mbps, respectively, with pricing structures depicted in Figure 2b. Additionally, each GDC’s location has different solar irradiation and wind speed. The sum of solar and wind renewable energy power ratings in each location are shown in Figure 2c.
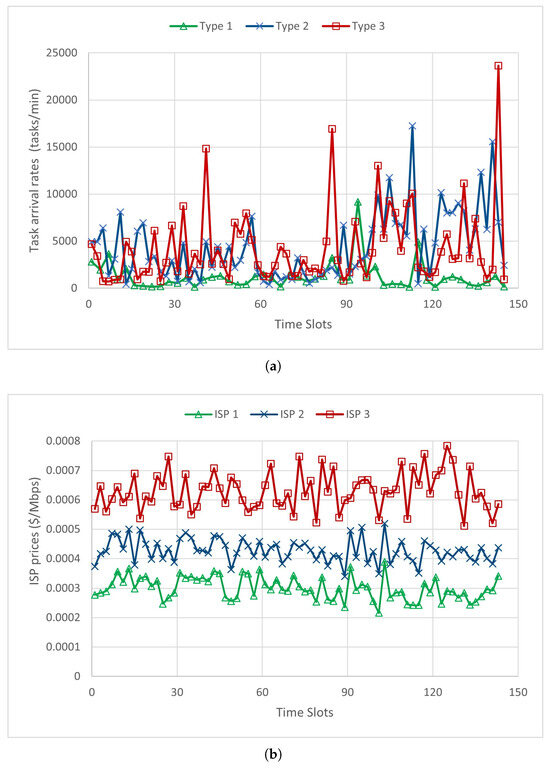
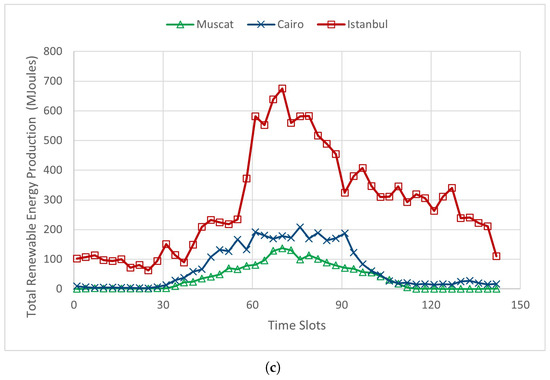
Figure 2.
Task arrival rates, ISP bandwidth prices, and GDC renewable energy production. (a) Task arrival rates for all application types. (b) ISP bandwidth prices. (c) Renewable energy production for all GDCs.
Table 1 summarizes the configurations of renewable and thermal power sources and the characteristics of the server infrastructure at each GDC location. For this study, it is assumed that electricity prices remain constant throughout the day. The table provides the power rating of each GDC (MWh), along with electricity costs (USD/kWh). It also shows detailed configuration parameters for both wind and solar energy sources. For wind energy, the parameters include the conversion rate, rotor area (), and air density (), whereas the solar parameters consist of conversion efficiency and the photovoltaic panel surface area (). The server infrastructure parameters outline critical characteristics for processing three types of delay-sensitive tasks. It specifies the delay constraints (), queuing capacities (), and processing rates during active () and idle () states in tasks per second. Task processing time is generated using a uniform distribution in time slots , as described in [42]. Moreover, the table lists the maximum number of servers () allocated for each task type.

Table 1.
Renewable energy and server characteristics for each GDC.
6.2. Experiment 1: Performance Evaluation of AFBO vs. MOFA
Trace-driven simulations were conducted to evaluate the performance of the proposed Adaptive Firefly-Based Optimization (AFBO) in solving problem P2. Each time slot corresponds to a 10-min interval, with a total of 144 time slots simulated. To ensure reliable convergence, 1000 iterations are performed per slot.
We begin by assessing the sensitivity of the penalty factor —which controls the trade-off between constraint satisfaction and objective optimization in problem P2. For this analysis, we selected a representative time slot () and examined the normalized convergence behavior of the cost objective for different values of ranging from to . For each case, the objective function was normalized by its initial value at iteration 0, and the evolution was tracked over 200 iterations using the AFBO algorithm.
As shown in Figure 3, small penalty values (, ) lead to significantly slower convergence. This is expected, as constraint violations are insufficiently penalized, which delays the convergence toward feasible solutions. In contrast, for , the objective function converges more rapidly and stabilizes earlier. This behavior confirms that the algorithm’s performance is stable within the range , with offering an effective trade-off between convergence speed and constraint enforcement.
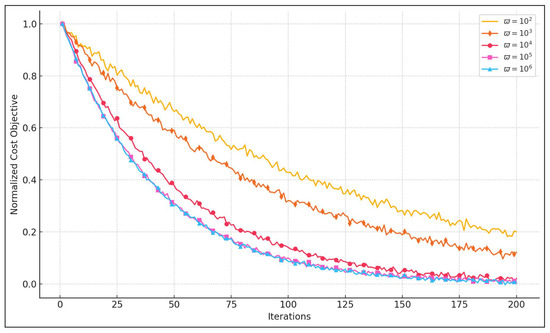
Figure 3.
Convergence of normalized cost objective for varying values of at a time slot ().
Based on these results, we retain for all subsequent experiments. The next subsection continues with the comparative evaluation between AFBO and the multi-objective firefly Algorithm (MOFA). Each algorithm independently generates its own Pareto front, from which a representative knee solution is selected using the minimum Manhattan distance method. Unlike conventional approaches where QoS constraints (e.g., average task latency penalty, ATLP) are strictly enforced, this study treats ATLP as a second objective. This multi-objective formulation provides more flexibility to decision-makers by offering diverse trade-offs. As a result, the comparison is based on three key metrics: (i) total operational cost, representing the cumulative cost of ISP bandwidth and thermal grid electricity across all GDCs; (ii) ATLP, as a QoS indicator; and (iii) computational time required to reach convergence.
Figure 4 illustrates the optimized total operational costs achieved by MOFA and AFBO in all time slots. As shown in the figure, AFBO significantly outperforms MOFA in cost reduction.
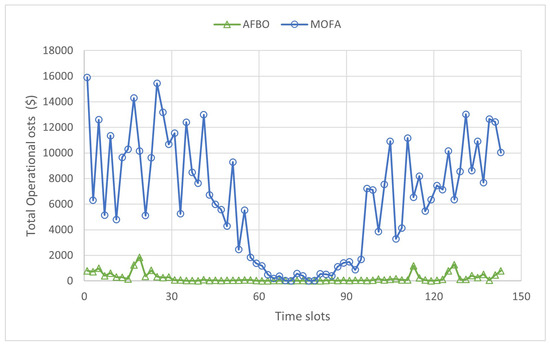
Figure 4.
Total optimized operational costs for MOFA and AFBO.
Table 2 further summarizes the comparison across all three metrics. AFBO achieves the lowest average operating cost, drastically improves ATLP, and reduces runtime by approximately 53%. Specifically, operational costs are reduced nearly 22-fold, while QoS performance also improves by two orders of magnitude. Although AFBO introduces additional mechanisms for parameter adaptation and Pareto-based dominance handling, it achieves faster convergence than MOFA due to an improved exploration–exploitation balance. The adaptive controls in AFBO guide the search process more efficiently, enabling the algorithm to reach high-quality solutions in fewer iterations. These results underscore the effectiveness of the adaptive modifications in enhancing the global search capabilities and convergence efficiency of the FA framework. As a result, the overall runtime of AFBO is shorter than that of MOFA, as reported in Table 2, despite a slightly higher computational cost per iteration. Importantly, despite the added complexity of multi-objective optimization, the convergence time of AFBO remains acceptable compared to the time slot length, making it suitable for real-time scheduling decisions.
Table 2.
Comparison of average operational cost, ATLP, and computational time.
6.3. Experiment 2: AFBO’s Performance at Solving P2
This experiment provides an in-depth performance analysis of the proposed Adaptive Firefly-Based Optimization (AFBO) in solving problem P2 under trace-driven simulations. As in Experiment 1, 1000 iterations are performed at each 10-min time slot to ensure convergence toward the global optimum.
Figure 5 illustrates the bandwidth allocated by the three Internet Service Providers (ISPs) to incoming tasks. It is evident that the bandwidth constraints of all ISPs—2000 Mbps, 3000 Mbps, and 4000 Mbps—are strictly satisfied. In particular, ISP 3 is the least utilized due to its higher bandwidth pricing, resulting in average bandwidth usages of 39.25% and 28.5% lower than ISPs 1 and 2, respectively. Conversely, ISP 1—offering the lowest data transfer costs—carries the largest task load without exceeding its 2000 Mbps limit. This behavior confirms that AFBO effectively identifies cost-efficient task distribution strategies across ISPs while adhering to bandwidth limitations.
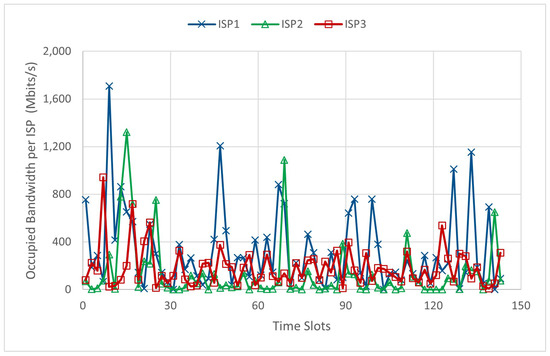
Figure 5.
Occupied bandwidth of the three ISPs.
Figure 6 presents the thermal (non-renewable) energy consumption across the three GDCs. This represents the additional power required from the grid to process tasks when the available renewable energy is insufficient. As shown, Muscat consumes the least thermal electricity among the sites, driven by Oman’s higher grid energy prices. Furthermore, during periods of high solar generation—between 6 AM and 6 PM—all GDCs operate entirely on renewable energy, avoiding any thermal electricity purchases. This behavior aligns with AFBO’s objective of maximizing GDC profitability by intelligently adjusting service rates to utilize green energy while satisfying power and processing constraints.
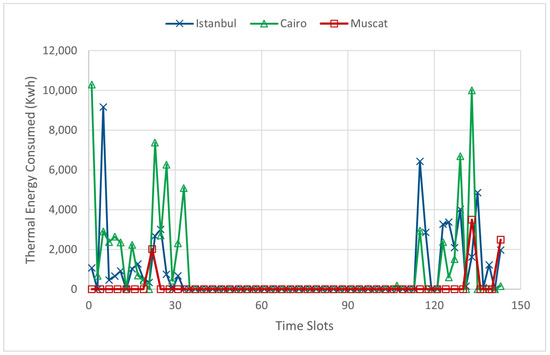
Figure 6.
Thermal energy consumption at each GDC.
Figure 7 illustrates the number of switched-on servers allocated to process incoming tasks while satisfying their respective delay constraints. As shown, for all GDCs and task types, the number of active servers always remains within the maximum allowable limit defined per task type in Table 1. Additionally, the figure reveals noticeable differences in the number of active servers used for the same task type across different GDCs. For instance, the number of active servers for type 1 tasks () reaches its maximum limit only at GDC 1 (). More generally, type 1 tasks are consistently served using nearly the full server capacity across all GDCs. This behavior can be explained by two key factors: (i) type 1 tasks have the most stringent delay requirements among all task types and (ii) their associated queuing and processing capacities (see and in Table 1) are smaller than those allocated to types 2 and 3. Interestingly, despite type 2 tasks having high processing demands, the number of servers assigned to them in GDC 1 remains well below its maximum limit () and is, in fact, the lowest compared to the allocations in GDCs 2 and 3. This is mainly due to GDC 1 (Muscat) having the least available renewable energy and the highest electricity prices. In contrast, GDC 3, which benefits from the highest level of renewable energy production, operates close to its server limit for type 2 tasks (), making it the preferred location for processing this task type. Finally, type 3 tasks are characterized by relatively relaxed processing delay constraints, which results in fewer switched-on servers being required compared to the other task types. As a result, these tasks are predominantly processed at GDC 3, where sufficient renewable energy is consistently available to meet demand.
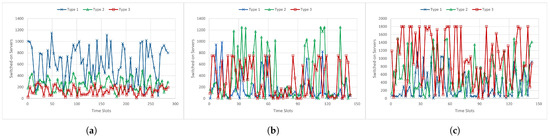
Figure 7.
Number of switched-on servers at each GDC. (a) GDC 1. (b) GDC 2. (c) GDC 3.
These findings reinforce the effectiveness of AFBO in intelligently distributing tasks across multiple GDCs while respecting delay constraints. Simultaneously, AFBO minimizes the operational costs of each GDC and maximizes the use of locally available solar and wind energy across geographically distributed infrastructures. Furthermore, the average ATLP obtained—, as reported in Table 2—is remarkably low, demonstrating that AFBO achieves a high Quality of Service (QoS) level. This result highlights the strength of the proposed multi-objective formulation, which not only reduces cost but also ensures near-zero latency violations, aligning well with the overall optimization objectives defined in this work.
6.4. Experiment 3: Comparison of AFBO with SBDE and MOPSO
To further validate the effectiveness of AFBO in solving problem P2, this experiment compares its performance against two state-of-the-art multi-objective evolutionary algorithms: multi-objective particle swarm optimization (MOPSO) [47] and the simulated-annealing-based bi-objective differential evolution (SBDE) algorithm recently proposed in [10]. The SBDE approach has been shown to significantly outperform several established methods, including NSGA-II [30], SPEA-II [63], and MODE [64].
The performance comparison is based on three main evaluation criteria: convergence speed, total operational cost of the GDCs, and overall processing time. To assess convergence behavior, the time slot 35 is selected as a representative sample. The results are depicted in Figure 8, where the base-10 logarithm of the unconstrained operational cost objective function, , is plotted against the number of iterations for each algorithm. In all cases, constraint violations are penalized using a large penalty multiplier to enforce feasibility. Convergence is considered achieved when the objective function stabilizes at its minimum value. The faster this minimum is reached (i.e., with fewer iterations), the better the convergence performance of the optimization algorithm.
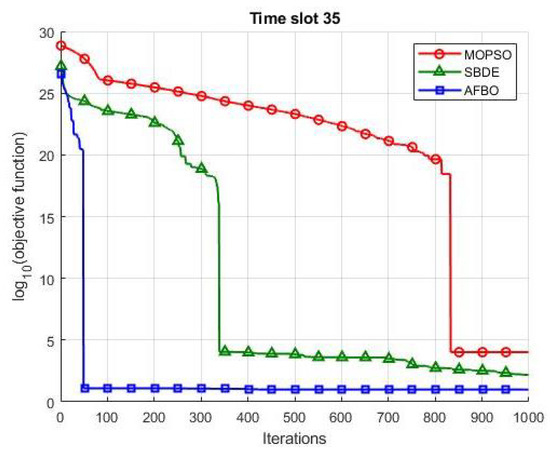
Figure 8.
Speed of convergence of AFBO compared to SBDE and MOPSO.
As illustrated in Figure 8, the proposed AFBO consistently converges to the lowest objective function values, demonstrating its effectiveness in satisfying both equality and inequality constraints while efficiently exploring the solution space for global and local optima. In contrast, the competing algorithms—particularly MOPSO and SBDE—converge to significantly higher objective values, indicating reduced capability in consistently identifying high-quality solutions. This limitation is especially pronounced for MOPSO, whose convergence stagnates far from the optimal region reached by AFBO. In addition to superior solution quality, AFBO exhibits markedly faster convergence, requiring fewer than 100 iterations compared to the approximately 350 and 850 iterations for SBDE and MOPSO, respectively. These findings underscore the robustness and efficiency of AFBO in terms of both convergence speed and optimization performance.
Figure 9 presents the total optimized operational costs for all GDCs across all time slots for each algorithm. Since each algorithm generates its own Pareto front, a representative knee solution is selected using the minimum Manhattan distance method to ensure fair comparison. The average operational costs over the simulation period are USD 20,835 for MOPSO, USD 7430 for SBDE, and just USD 325 for AFBO—corresponding to reductions by factors of 64 and 23 compared to MOPSO and SBDE, respectively. While SBDE clearly outperforms MOPSO, AFBO achieves substantially greater cost savings thanks to its ability to efficiently schedule and allocate tasks across GDCs, minimize ISP bandwidth usage, and reduce reliance on non-renewable energy. By maximizing the utilization of local wind and solar resources, AFBO ensures a more energy-efficient and sustainable operation for geographically distributed data centers.
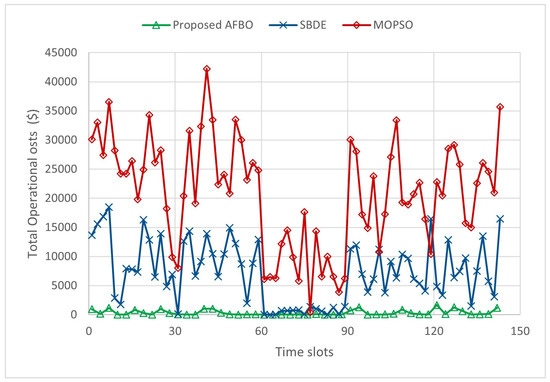
Figure 9.
Total GDC operational cost for AFBO compared to SBDE and MOPSO.
In addition to cost optimization, AFBO exhibits excellent performance in terms of Quality of Service (QoS), measured by the second objective, which is Average Task Loss Probability (ATLP). The achieved average ATLP for AFBO is —nearly two orders of magnitude lower than that of SBDE () and several orders better than MOPSO (). This extremely low ATLP reflects a significantly reduced likelihood of task rejection, thereby ensuring more reliable service delivery across diverse system conditions. These findings reinforce the strength of AFBO in addressing complex multi-objective scheduling challenges in green distributed data centers, effectively balancing operational cost reduction with enhanced QoS.
Following the cost and QoS performance analysis, we now examine the computational efficiency of the compared algorithms. Figure 10 illustrates the execution time of all algorithms at each time slot. It is evident that AFBO is more computationally demanding than both SBDE and MOPSO. On average, AFBO requires 305.46 s per time slot, compared to 162.64 s for SBDE and only 95 s for MOPSO. This higher execution time reflects the added complexity introduced by AFBO’s adaptive mechanisms and multi-objective optimization strategy. Although AFBO typically converges in fewer iterations, the computation time per iteration is greater, resulting in a higher total runtime. Nonetheless, this additional cost is justified by the significantly improved solution quality and lower ATLP values achieved. Moreover, AFBO remains suitable for real-time implementation, as its convergence time consistently stays well within the duration of each time slot.
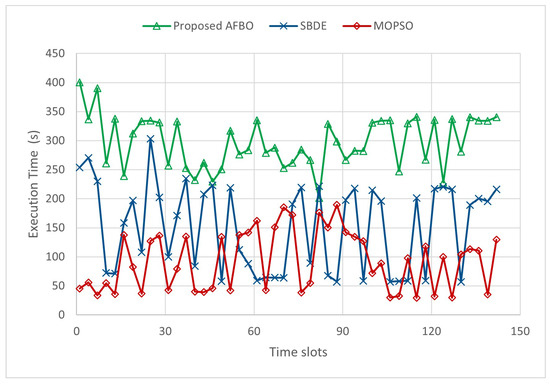
Figure 10.
Execution time of each algorithm.
7. Conclusions
The rise of green data centers (GDCs) offers a promising path toward sustainable cloud computing by integrating renewable energy sources such as solar and wind to reduce dependence on grid electricity generated from fossil fuels. However, efficient task scheduling across geo-distributed GDCs remains highly complex due to spatial variability in energy availability, electricity tariffs, and ISP bandwidth costs. These factors, combined with stringent delay and Quality of Service (QoS) requirements, necessitate intelligent scheduling strategies that can simultaneously ensure service reliability and operational cost-efficiency.
This paper formulated the underlying optimization problem as a nonlinear, bi-objective model targeting the minimization of both total operational cost and Average Task Loss Probability (ATLP)—a key Quality of Service (QoS) metric. To address this, we proposed an innovative Adaptive Firefly-Based Bi-Objective Optimization (AFBO) algorithm that integrates adaptive search mechanisms with a multi-objective Pareto-based framework. The proposed AFBO was extensively validated using real-life trace-driven simulations based on Google cluster data, ensuring realism and practical relevance.
The results confirm that AFBO consistently outperforms benchmark algorithms, including MOPSO, SBDE, and MOFA. Specifically, AFBO achieves average operational cost reductions by factors of 64, 23, and 22 compared to MOPSO, SBDE, and MOFA, respectively. From a Quality of Service (QoS) perspective, AFBO sustains an exceptionally low Average Task Loss Probability (ATLP) of —nearly two orders of magnitude lower than SBDE and MOFA and several orders lower than MOPSO. These findings highlight AFBO’s superior capability to simultaneously minimize operational costs and ensure strict adherence to QoS requirements, effectively balancing the competing objectives in multi-objective scheduling for green data centers.
In addition to its optimization accuracy, AFBO exhibits faster convergence toward global and local optima across all time slots, despite its higher computational cost. Importantly, the algorithm successfully satisfies both equality and inequality constraints for nearly all time instances, where peer methods occasionally fail to find feasible or high-quality solutions. These findings collectively validate the robustness, effectiveness, and multi-objective strength of the proposed AFBO in optimizing task placement in distributed green data centers under real-world constraints.
Given these results, the proposed AFBO framework is particularly applicable to distributed cloud platforms that deliver latency-critical services such as video conferencing, cloud gaming, industrial control, and real-time analytics. These application domains require dynamic, delay-aware scheduling under fluctuating energy and network conditions, making them well-suited for our adaptive, cost-efficient optimization strategy.
While AFBO demonstrates promising results, this work assumes fixed queue capacities and known renewable energy and price inputs at each time slot. It does not yet address the prediction errors, temporal uncertainty, or queue dynamics that may arise in real-time deployments. Furthermore, scalability on larger-scale, multi-provider federated platforms has not been evaluated. Additionally, our model does not yet incorporate explicit fault tolerance or resilience mechanisms. In real-world GDDC systems, failures in data centers or ISPs can critically impact service continuity. While this work ensures diversity in ISP-level routing, it did not integrate reliability-aware scheduling models to address node or provider failures, such as redundancy strategies, failover protocols, or risk-aware optimization formulations.
Future work will address these limitations by incorporating renewable energy and workload forecasting models, extending the framework to dynamic queues and uncertain environments, and deploying the AFBO method on live GDDC platforms to assess its real-time performance, adaptability, and robustness of scheduling at scale. Furthermore, scalability in large-scale or cross-provider cloud infrastructures—where multiple independent GDCs are coordinated—remains to be explored. We also plan to relax the fixed task size assumption by introducing heterogeneous task models that reflect practical workload diversity, enabling more realistic scheduling policies and performance evaluation. Additionally, fault tolerance mechanisms—such as provider failover handling and redundancy-aware scheduling—will be considered to improve system reliability under provider or node failures.
Author Contributions
Conceptualization, A.C.A.; Methodology, A.C.A. and W.L.; Validation, A.C.A. and W.L.; Formal analysis, W.L. and R.A.-H.; Writing—review & editing, A.C.A. and R.A.-H.; Visualization, A.C.A. and W.L.; Project administration, A.C.A. and R.A.-H. All authors have read and agreed to the published version of the manuscript.
Funding
This research was funded by OMANTEL and Sultan Qaboos University under grant number EG/SQU-OT/19/04. The APC was funded by Sultan Qaboos University.
Data Availability Statement
The original contributions presented in the study are included in the article, further inquiries can be directed to the corresponding authors.
Conflicts of Interest
Wael Labidi was employed by the Sequans Communications. The remaining authors declare that the research was conducted in the absence of any commercial or financial relationships that could be construed as a potential conflict of interest.
References
- Hamdi, M.; Halima, M.B.; Jmaiel, M. Secure Cloud Infrastructure: A Survey on Issues, Current Solutions, and Open Challenges. Appl. Sci. 2021, 11, 9005. [Google Scholar] [CrossRef]
- Hajjat, M.; Zhu, X.; Abdelzaher, T.F. The Impact of Cloud Computing on Information Systems Agility. Int. J. Cloud Comput. Serv. Sci. 2021, 10, 1–10. [Google Scholar] [CrossRef]
- Sharma, S.K.; Kalra, S.; Agrawal, S.S. Energy-Efficient Cloud Service Selection and Recommendation System for Cloud Service Providers. Energies 2021, 11, 9394. [Google Scholar] [CrossRef]
- Ghahramani, M.H.; Zhou, M.; Hon, C.T. Toward Cloud Computing QoS Architecture: Analysis of Cloud Systems and Cloud Services. IEEE/CAA J. Autom. Sin. 2017, 4, 6–18. [Google Scholar] [CrossRef]
- Shehabi, A.; Smith, S.; Masanet, E.; Koomey, J. United States Data Center Energy Usage Report; Technical Report; Lawrence Berkeley National Laboratory (LBNL): Berkeley, CA, USA, 2024. [Google Scholar]
- Patel, S. The Big Picture: How Much Power Will Data Centers Consume? POWER Mag. 2024. Available online: https://www.powermag.com/the-big-picture-how-much-power-will-data-centers-consume-infographic/ (accessed on 26 February 2025).
- Apple Inc. Apple Ramps up Investment in Clean Energy and Water Around the World; Apple Inc.: Los Altos, CA, USA, 2024. [Google Scholar]
- Yuan, H.; Bi, J.; Zhou, M.; Ammari, A.C. Time-aware multi-application task scheduling with guaranteed delay constraints in green data center. IEEE Trans. Autom. Sci. Eng. 2017, 15, 1138–1151. [Google Scholar] [CrossRef]
- Luo, J.; Rao, L.; Liu, X. Spatio-temporal load balancing for energy cost optimization in distributed internet data centers. IEEE Trans. Cloud Comput. 2015, 3, 387–397. [Google Scholar] [CrossRef]
- Yuan, H.; Bi, J.; Zhou, M.; Liu, Q.; Ammari, A.C. Biobjective task scheduling for distributed green data centers. IEEE Trans. Autom. Sci. Eng. 2020, 18, 731–742. [Google Scholar] [CrossRef]
- Lin, W.; Lin, J.; Peng, Z.; Huang, H.; Lin, W.; Li, K. A systematic review of green-aware management techniques for sustainable data center. Sustain. Comput. Inform. Syst. 2024, 42, 100989. [Google Scholar] [CrossRef]
- Bharany, S.; Sharma, S.; Khalaf, O.I.; Abdulsahib, G.M.; Humaimeedy, A.S.A.; Aldhyani, T.H.H.; Maashi, M.; Alkahtani, H. A Systematic Survey on Energy-Efficient Techniques in Sustainable Cloud Computing. Sustainability 2022, 14, 6256. [Google Scholar] [CrossRef]
- Chen, D.; Ma, Y.; Wang, L.; Yao, M. Spatio-temporal management of renewable energy consumption, carbon emissions, and cost in data centers. Sustain. Comput. Inform. Syst. 2024, 41, 100950. [Google Scholar] [CrossRef]
- Ammari, A.C.; Hmouz, R.A.; Khriji, L.; Zhou, M. Optimizing Cloud Computing Task Schedules Through Advanced Intelligent Optimization Methods. In Proceedings of the International IOT, Electronics and Mechatronics Conference, Singapore, 3–5 April 2024; pp. 443–456. [Google Scholar]
- Yang, X.S. Firefly algorithms for multimodal optimization. In Proceedings of the International Symposium on Stochastic Algorithms, Sapporo, Japan, 26–28 October 2009; Springer: Berlin/Heidelberg, Germany, 2009; pp. 169–178. [Google Scholar]
- Umbarkar, A.; Balande, U.; Seth, P. Performance evaluation of firefly algorithm with variation in sorting for non-linear benchmark problems. In Proceedings of the AIP Conference Proceedings; AIP Publishing LLC: Melville, NY, USA, 2017; Volume 1836, p. 020032. [Google Scholar]
- Islam, M.S.; Jahid, A.; Islam, A.T.; Sadath, M.A.; Monju, M.K.H. Energy Sustainable Provisioning for Green Data Centers. In Proceedings of the 2018 International Conference on Innovations in Science, Engineering and Technology (ICISET), Chittagong, Bangladesh, 27–28 October 2018; IEEE: Piscataway, NJ, USA, 2018; pp. 378–383. [Google Scholar]
- Amokrane, A.; Langar, R.; Zhani, M.F.; Boutaba, R.; Pujolle, G. Greenslater: On satisfying green SLAs in distributed clouds. IEEE Trans. Netw. Serv. Manag. 2015, 12, 363–376. [Google Scholar] [CrossRef]
- Ghamkhari, M.; Mohsenian-Rad, H. Energy and Performance Management of Green Data Centers: A Profit Maximization Approach. IEEE Trans. Smart Grid 2013, 4, 1017–1025. [Google Scholar] [CrossRef]
- Deng, X.; Wu, D.; Shen, J.; He, J. Eco-aware Online Power Management and Load Scheduling for Green Cloud Datacenters. IEEE Syst. J. 2014, 10, 78–87. [Google Scholar] [CrossRef]
- Zhang, S.; Xu, M.; Lim, W.Y.B.; Niyato, D. Sustainable AIGC Workload Scheduling of Geo-Distributed Data Centers: A Multi-Agent Reinforcement Learning Approach. In Proceedings of the GLOBECOM 2023—2023 IEEE Global Communications Conference, Kuala Lumpur, Malaysia, 4–8 December 2023; IEEE: Piscataway, NJ, USA, 2023; pp. 3500–3505. [Google Scholar] [CrossRef]
- Kumaravelu, A. Leveraging AI and ML to Revolutionize Energy Efficiency in Data Centers. Int. J. Comput. Eng. Technol. (IJCET) 2024, 15, 370–383. [Google Scholar]
- Juarez, F.; Ejarque, J.; Badia, R.M.; Rocha, S.N.G.; Esquivel-Flores, O.A. Energy-aware scheduler for HPC parallel task base applications in cloud computing. Int. J. Comb. Optim. Probl. Inform. 2018, 9, 54. [Google Scholar]
- Jayanetti, A.; Halgamuge, S.; Buyya, R. Multi-Agent Deep Reinforcement Learning Framework for Renewable Energy-Aware Workflow Scheduling on Distributed Cloud Data Centers. IEEE Trans. Parallel Distrib. Syst. 2024, 35, 604–615. [Google Scholar] [CrossRef]
- Wang, S.; Qian, Z.; Yuan, J.; You, I. A DVFS based energy-efficient tasks scheduling in a data center. IEEE Access 2017, 5, 13090–13102. [Google Scholar] [CrossRef]
- Nir, M.; Matrawy, A.; St-Hilaire, M. Economic and energy considerations for resource augmentation in mobile cloud computing. IEEE Trans. Cloud Comput. 2015, 6, 99–113. [Google Scholar] [CrossRef]
- Janakiraman, S.; Priya, M.D. Dynamic Butterfly Optimization Algorithm-Based Task Scheduling for Minimizing Energy Consumption in Distributed Green Data Centers. In Self-Powered Cyber Physical Systems; Scrivener Publishing: Austin, TX, USA, 2023; pp. 91–113. [Google Scholar] [CrossRef]
- Liu, C.; Li, K.; Li, K.; Buyya, R. A new service mechanism for profit optimizations of a cloud provider and its users. IEEE Trans. Cloud Comput. 2017, 9, 14–26. [Google Scholar] [CrossRef]
- Ammari, A.C.; Labidi, W.; Mnif, F.; Yuan, H.; Zhou, M.; Sarrab, M. Firefly algorithm and learning-based geographical task scheduling for operational cost minimization in distributed green data centers. Neurocomputing 2022, 490, 146–162. [Google Scholar] [CrossRef]
- Sathya Sofia, A.; GaneshKumar, P. Multi-objective task scheduling to minimize energy consumption and makespan of cloud computing using NSGA-II. J. Netw. Syst. Manag. 2018, 26, 463–485. [Google Scholar] [CrossRef]
- Rakrouki, M.A.; Alharbe, N. QoS-aware algorithm based on task flow scheduling in cloud computing environment. Sensors 2022, 22, 2632. [Google Scholar] [CrossRef] [PubMed]
- Daradkeh, T.; Agarwal, A. Cloud workload and data center analytical modeling and optimization using deep machine learning. Network 2022, 2, 643–669. [Google Scholar] [CrossRef]
- Arora, S.; Singh, S. The firefly optimization algorithm: Convergence analysis and parameter selection. Int. J. Comput. Appl. 2013, 69, 48–52. [Google Scholar] [CrossRef]
- Farahani, S.M.; Abshouri, A.A.; Nasiri, B.; Meybodi, M.R. A Gaussian firefly algorithm. Int. J. Mach. Learn. Comput. 2011, 1, 448. [Google Scholar] [CrossRef]
- Yang, X.S. Firefly algorithm, Levy flights and global optimization. In Research and Development in Intelligent Systems XXVI; Springer: Berlin/Heidelberg, Germany, 2010; pp. 209–218. [Google Scholar]
- dos Santos Coelho, L.; de Andrade Bernert, D.L.; Mariani, V.C. A chaotic firefly algorithm applied to reliability-redundancy optimization. In Proceedings of the 2011 IEEE Congress of Evolutionary Computation (CEC), New Orleans, LA, USA, 5–8 June 2011; IEEE: Piscataway, NJ, USA, 2011; pp. 517–521. [Google Scholar]
- Thompson, J.M.T.; Stewart, H.B. Nonlinear Dynamics and Chaos; John Wiley & Sons: Hoboken, NJ, USA, 2002. [Google Scholar]
- Talatahari, S.; Azar, B.F.; Sheikholeslami, R.; Gandomi, A. Imperialist competitive algorithm combined with chaos for global optimization. Commun. Nonlinear Sci. Numer. Simul. 2012, 17, 1312–1319. [Google Scholar] [CrossRef]
- Gandomi, A.H.; Yang, X.S.; Talatahari, S.; Alavi, A.H. Firefly algorithm with chaos. Commun. Nonlinear Sci. Numer. Simul. 2013, 18, 89–98. [Google Scholar] [CrossRef]
- Yuan, H.; Bi, J.; Zhou, M. Energy-efficient and QoS-optimized adaptive task scheduling and management in clouds. IEEE Trans. Autom. Sci. Eng. 2020, 19, 1233–1244. [Google Scholar] [CrossRef]
- Shah-Mansouri, H.; Wong, V.W.; Schober, R. Joint optimal pricing and task scheduling in mobile cloud computing systems. IEEE Trans. Wirel. Commun. 2017, 16, 5218–5232. [Google Scholar] [CrossRef]
- Yuan, H.; Bi, J.; Zhou, M. Spatial task scheduling for cost minimization in distributed green cloud data centers. IEEE Trans. Autom. Sci. Eng. 2018, 16, 729–740. [Google Scholar] [CrossRef]
- Kiani, A.; Ansari, N. Profit maximization for geographically dispersed green data centers. IEEE Trans. Smart Grid 2016, 9, 703–711. [Google Scholar] [CrossRef]
- Valencia, F.; Collado, J.; Sáez, D.; Marín, L.G. Robust energy management system for a microgrid based on a fuzzy prediction interval model. IEEE Trans. Smart Grid 2016, 7, 1486–1494. [Google Scholar] [CrossRef]
- Abdeltawab, H.H.; Mohamed, Y.A.R.I. Robust energy management of a hybrid wind and flywheel energy storage system considering flywheel power losses minimization and grid-code constraints. IEEE Trans. Ind. Electron. 2016, 63, 4242–4254. [Google Scholar] [CrossRef]
- Shokrian, M.; High, K.A. Application of a multi objective multi-leader particle swarm optimization algorithm on NLP and MINLP problems. Comput. Chem. Eng. 2014, 60, 57–75. [Google Scholar] [CrossRef]
- Trivedi, V.; Varshney, P.; Ramteke, M. A simplified multi-objective particle swarm optimization algorithm. Swarm Intell. 2020, 14, 83–116. [Google Scholar] [CrossRef]
- Yang, Y.; Liu, J.; Tan, S.; Wang, H. A multi-objective differential evolutionary algorithm for constrained multi-objective optimization problems with low feasible ratio. Appl. Soft Comput. 2019, 80, 42–56. [Google Scholar] [CrossRef]
- Wang, X.; Wang, X.; Qin, B. Improved multi-objective differential evolution algorithm and its application in the capacity configuration of urban rail photovoltaic hybrid energy storage systems. J. Energy Storage 2024, 98, 113155. [Google Scholar] [CrossRef]
- Yang, X.S. A new metaheuristic bat-inspired algorithm. In Nature-Inspired Cooperative Strategies for Optimization; Springer: Berlin/Heidelberg, Germany, 2010; pp. 65–74. [Google Scholar]
- Pei, W.; Huayu, G.; Zheqi, Z.; Meibo, L. A Novel Hybrid Firefly Algorithm for Global Optimization. In Proceedings of the 2019 IEEE 4th International Conference on Computer and Communication Systems (ICCCS), Singapore, 23–25 February 2019; IEEE: Piscataway, NJ, USA, 2019; pp. 164–168. [Google Scholar]
- Chen, G.; Yi, X.; Zhang, Z.; Lei, H. Solving the multi-objective optimal power flow problem using the multi-objective firefly algorithm with a constraints-prior pareto-domination approach. Energies 2018, 11, 3438. [Google Scholar] [CrossRef]
- Rokh, B.; Mirvaziri, H.; Olyaee, M. A new evolutionary optimization based on multi-objective firefly algorithm for mining numerical association rules. Soft Comput. 2024, 28, 6879–6892. [Google Scholar] [CrossRef]
- Shandilya, S.K.; Choi, B.J.; Kumar, A.; Upadhyay, S. Modified firefly optimization algorithm-based IDS for nature-inspired cybersecurity. Processes 2023, 11, 715. [Google Scholar] [CrossRef]
- Cheng, Z.; Song, H.; Zheng, D.; Zhou, M.; Sun, K. Hybrid firefly algorithm with a new mechanism of gender distinguishing for global optimization. Expert Syst. Appl. 2023, 224, 120027. [Google Scholar] [CrossRef]
- Tesla Built a Huge Solar Energy Plant on the Island of Kauai. 2020. Available online: https://www.mathworks.com/matlabcentral/fileexchange/52900-firefly-algorithm-fa (accessed on 15 March 2025).
- Padhye, N.; Deb, K.; Mittal, P. Boundary handling approaches in particle swarm optimization. In Proceedings of the Seventh International Conference on Bio-Inspired Computing: Theories and Applications (BIC-TA 2012); Springer: Berlin/Heidelberg, Germany, 2013; pp. 287–298. [Google Scholar]
- NREL’s PVWatts Calculator. 2025. Available online: https://pvwatts.nrel.gov/ (accessed on 10 January 2025).
- Hu, X.; Li, P.; Wang, K.; Sun, Y.; Zeng, D.; Wang, X.; Guo, S. Joint workload scheduling and energy management for green data centers powered by fuel cells. IEEE Trans. Green Commun. Netw. 2019, 3, 397–406. [Google Scholar] [CrossRef]
- Canali, C.; Chiaraviglio, L.; Lancellotti, R.; Shojafar, M. Joint minimization of the energy costs from computing, data transmission, and migrations in cloud data centers. IEEE Trans. Green Commun. Netw. 2018, 2, 580–595. [Google Scholar] [CrossRef]
- Khosravi, A.; Andrew, L.L.; Buyya, R. Dynamic vm placement method for minimizing energy and carbon cost in geographically distributed cloud data centers. IEEE Trans. Sustain. Comput. 2017, 2, 183–196. [Google Scholar] [CrossRef]
- Yuan, H.; Bi, J.; Zhou, M. Spatiotemporal task scheduling for heterogeneous delay-tolerant applications in distributed green data centers. IEEE Trans. Autom. Sci. Eng. 2019, 16, 1686–1697. [Google Scholar] [CrossRef]
- Jiang, S.; Yang, S. A strength Pareto evolutionary algorithm based on reference direction for multiobjective and many-objective optimization. IEEE Trans. Evol. Comput. 2017, 21, 329–346. [Google Scholar] [CrossRef]
- Taran, N.; Ionel, D.M.; Dorrell, D.G. Two-level surrogate-assisted differential evolution multi-objective optimization of electric machines using 3-D FEA. IEEE Trans. Magn. 2018, 54, 1–5. [Google Scholar] [CrossRef]
Disclaimer/Publisher’s Note: The statements, opinions and data contained in all publications are solely those of the individual author(s) and contributor(s) and not of MDPI and/or the editor(s). MDPI and/or the editor(s) disclaim responsibility for any injury to people or property resulting from any ideas, methods, instructions or products referred to in the content. |
© 2025 by the authors. Licensee MDPI, Basel, Switzerland. This article is an open access article distributed under the terms and conditions of the Creative Commons Attribution (CC BY) license (https://creativecommons.org/licenses/by/4.0/).