
Study on Swirling Flow and Spray Characteristics of Central Stage Direct Injection Combustor

 , , ,
, , ,  and
and
Abstract
1. Introduction
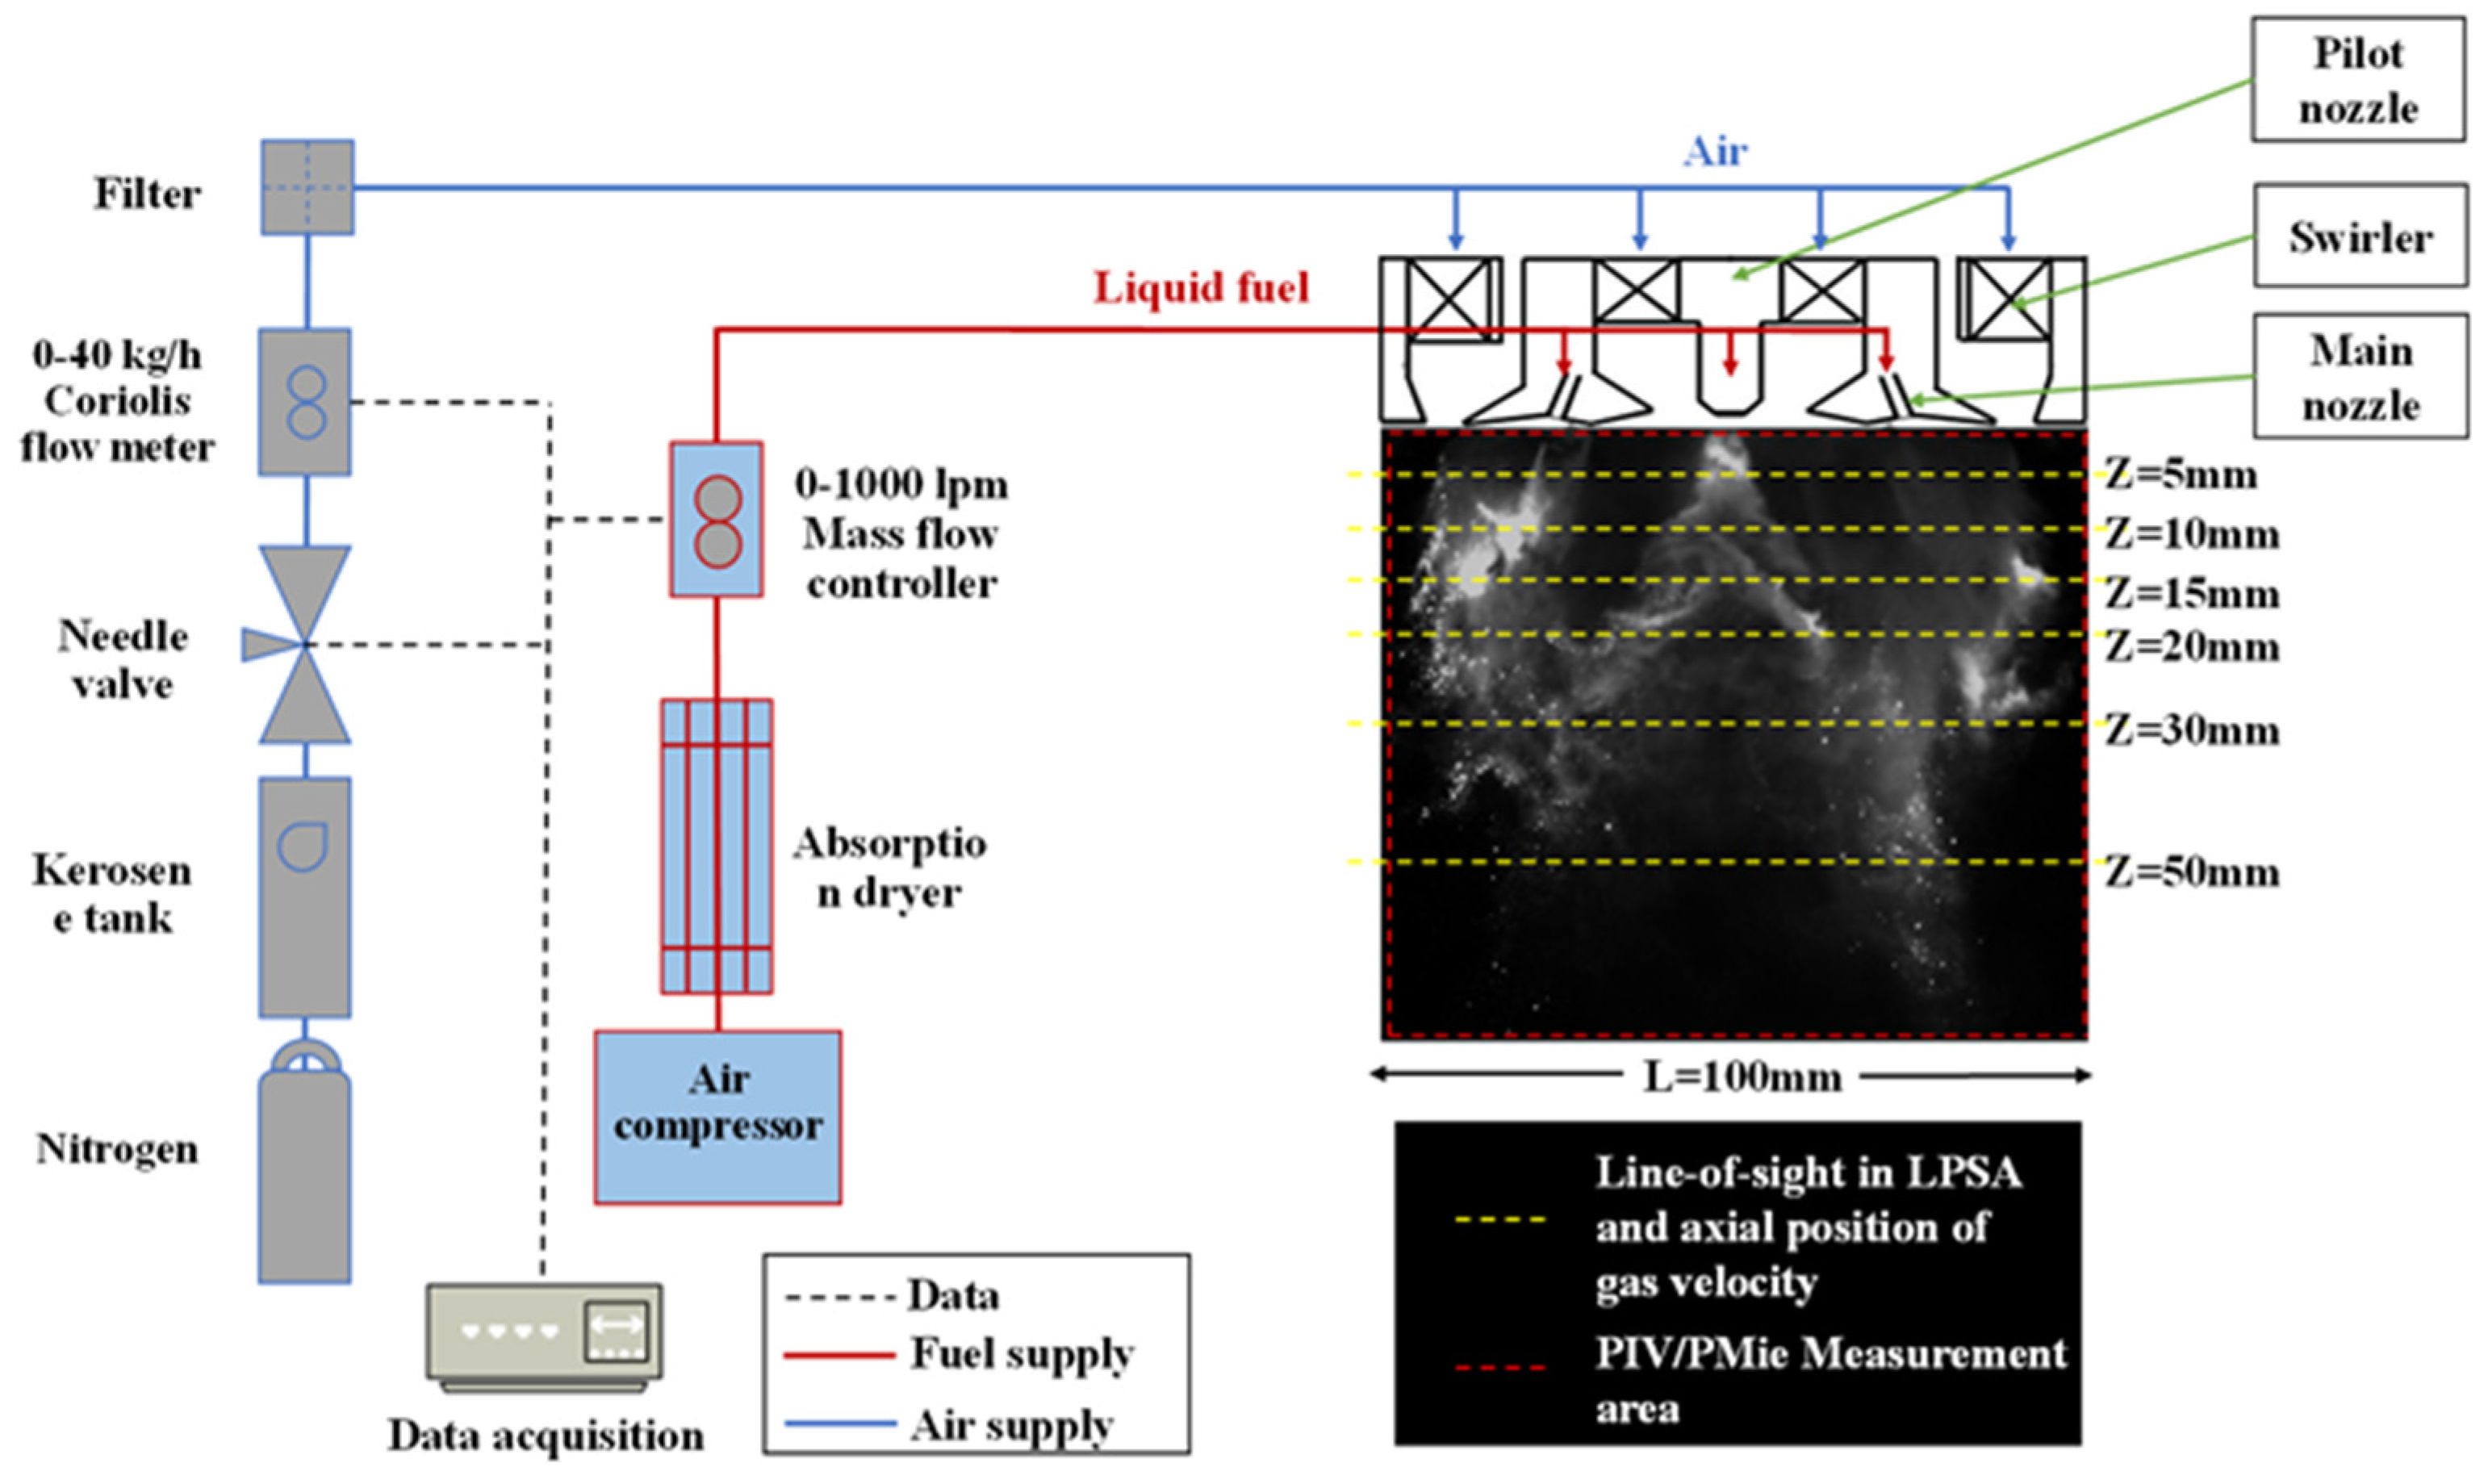
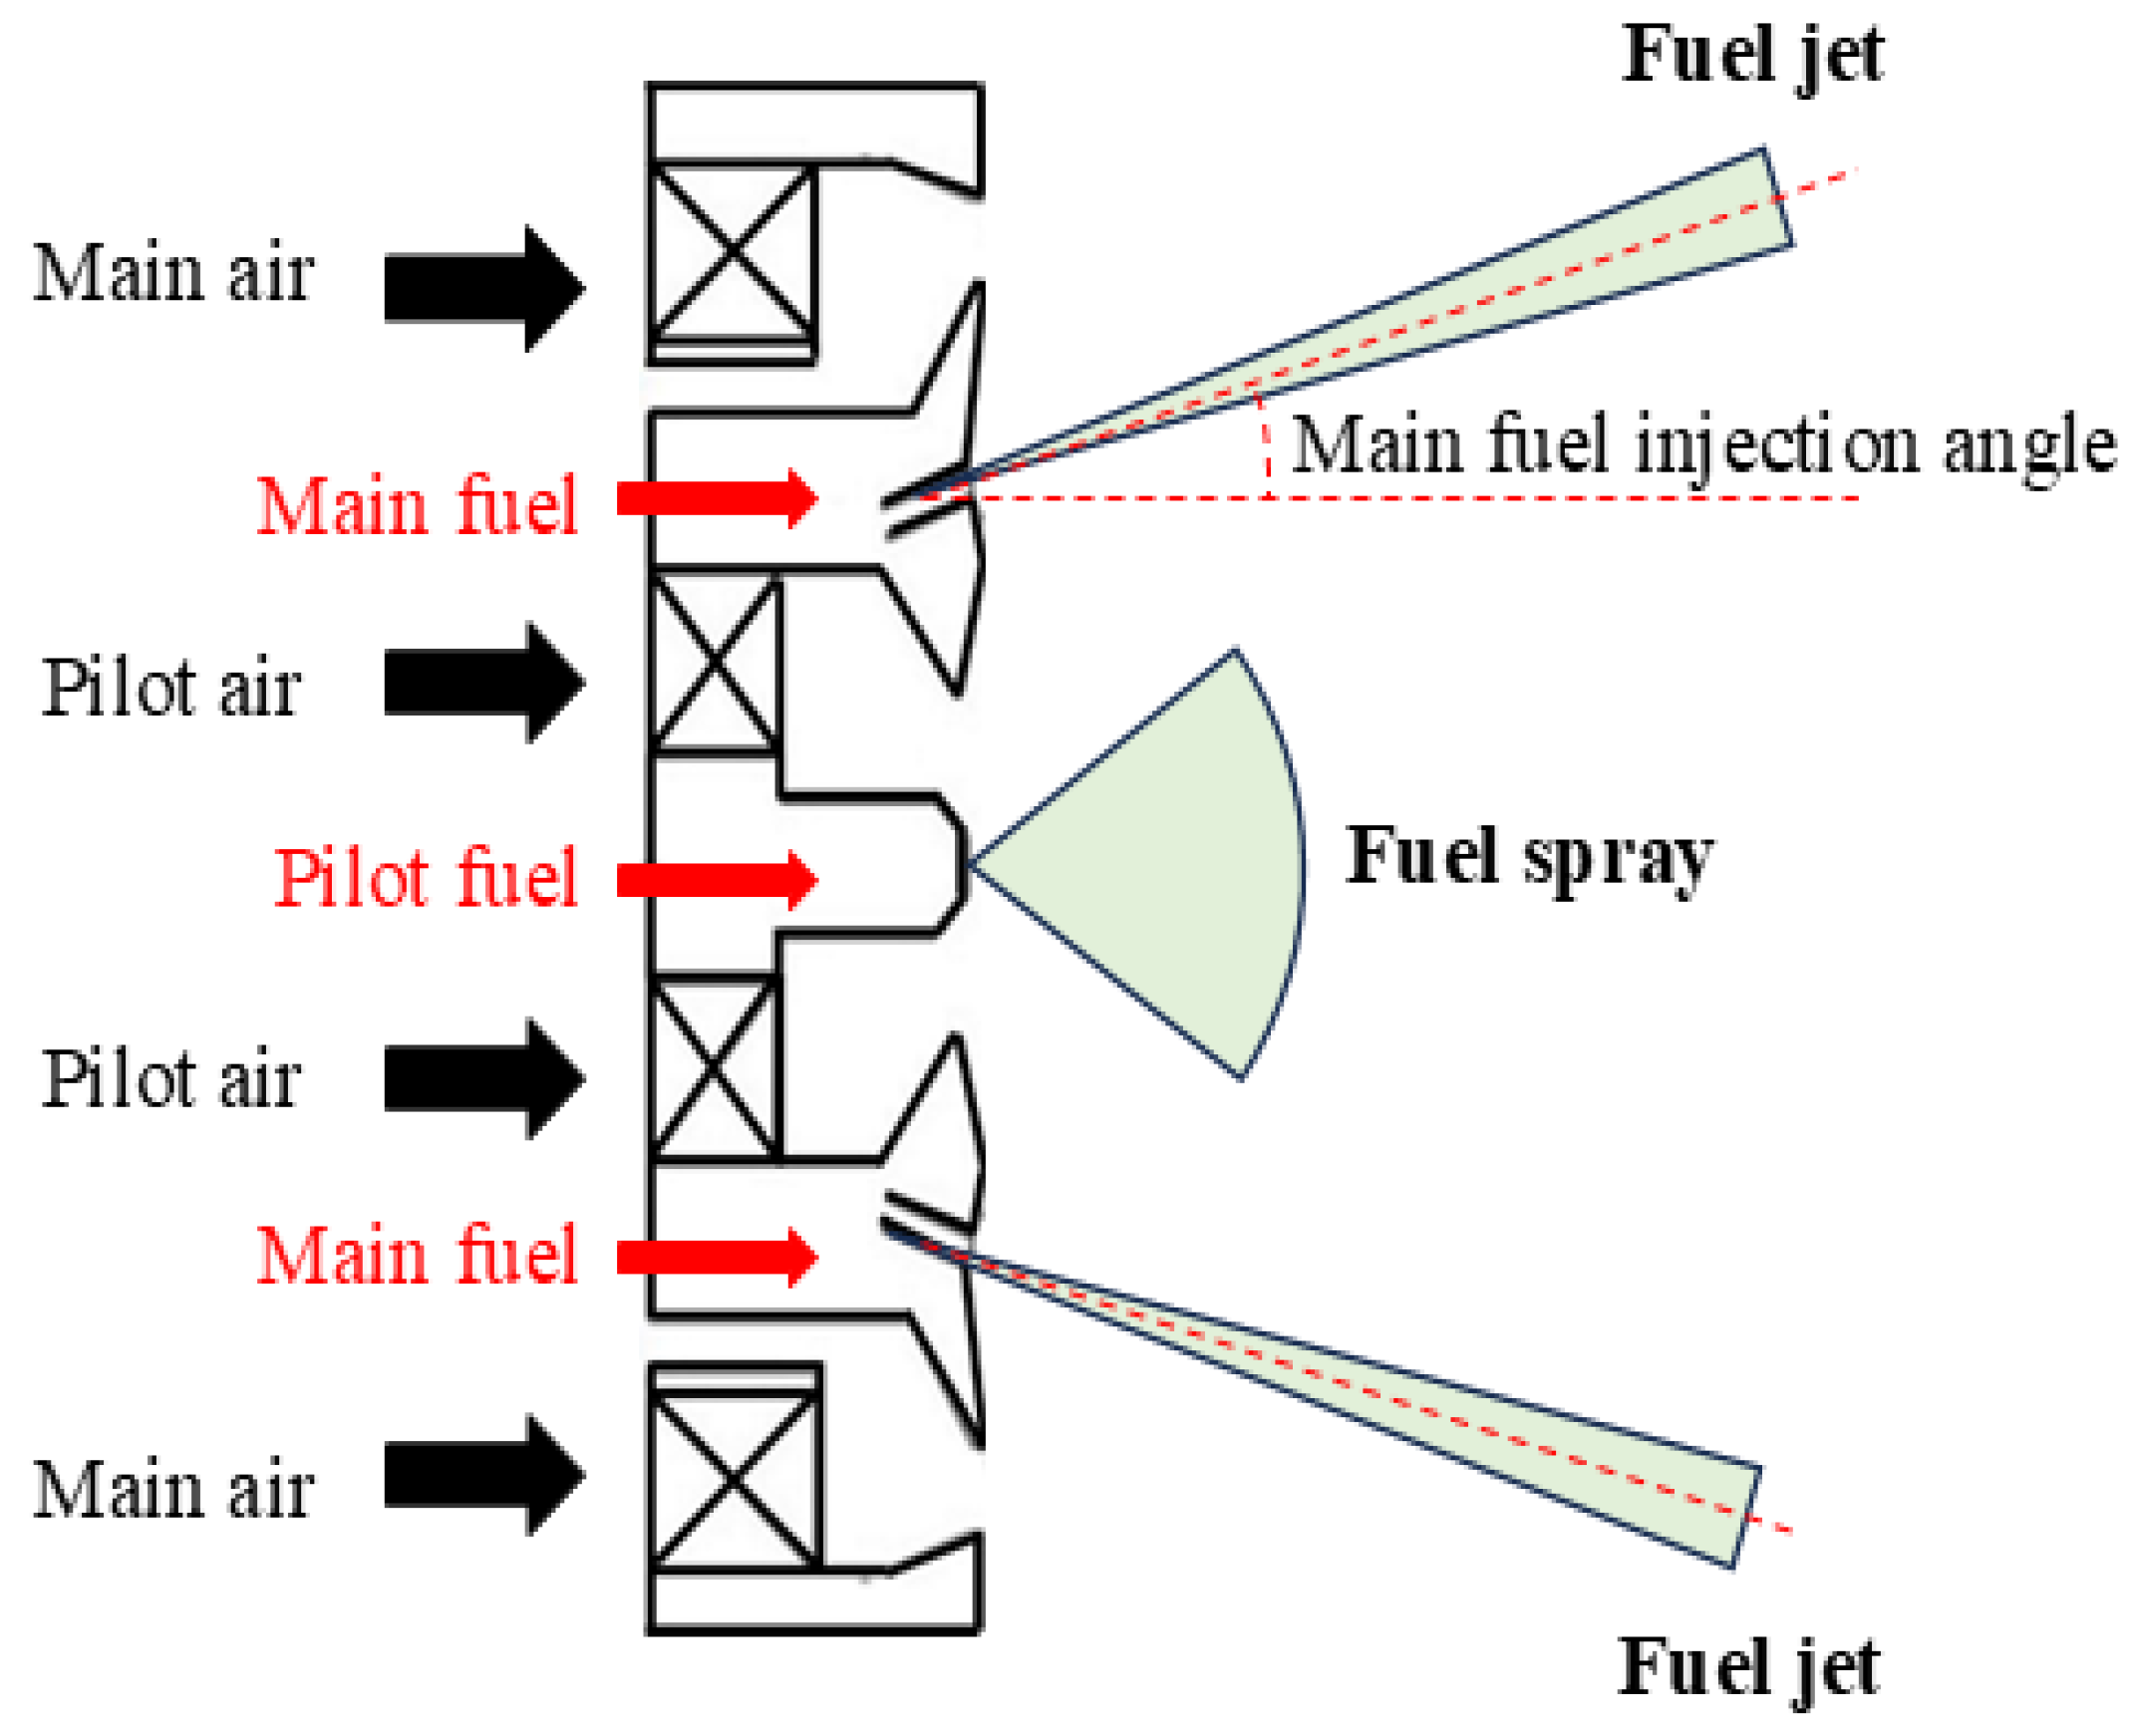
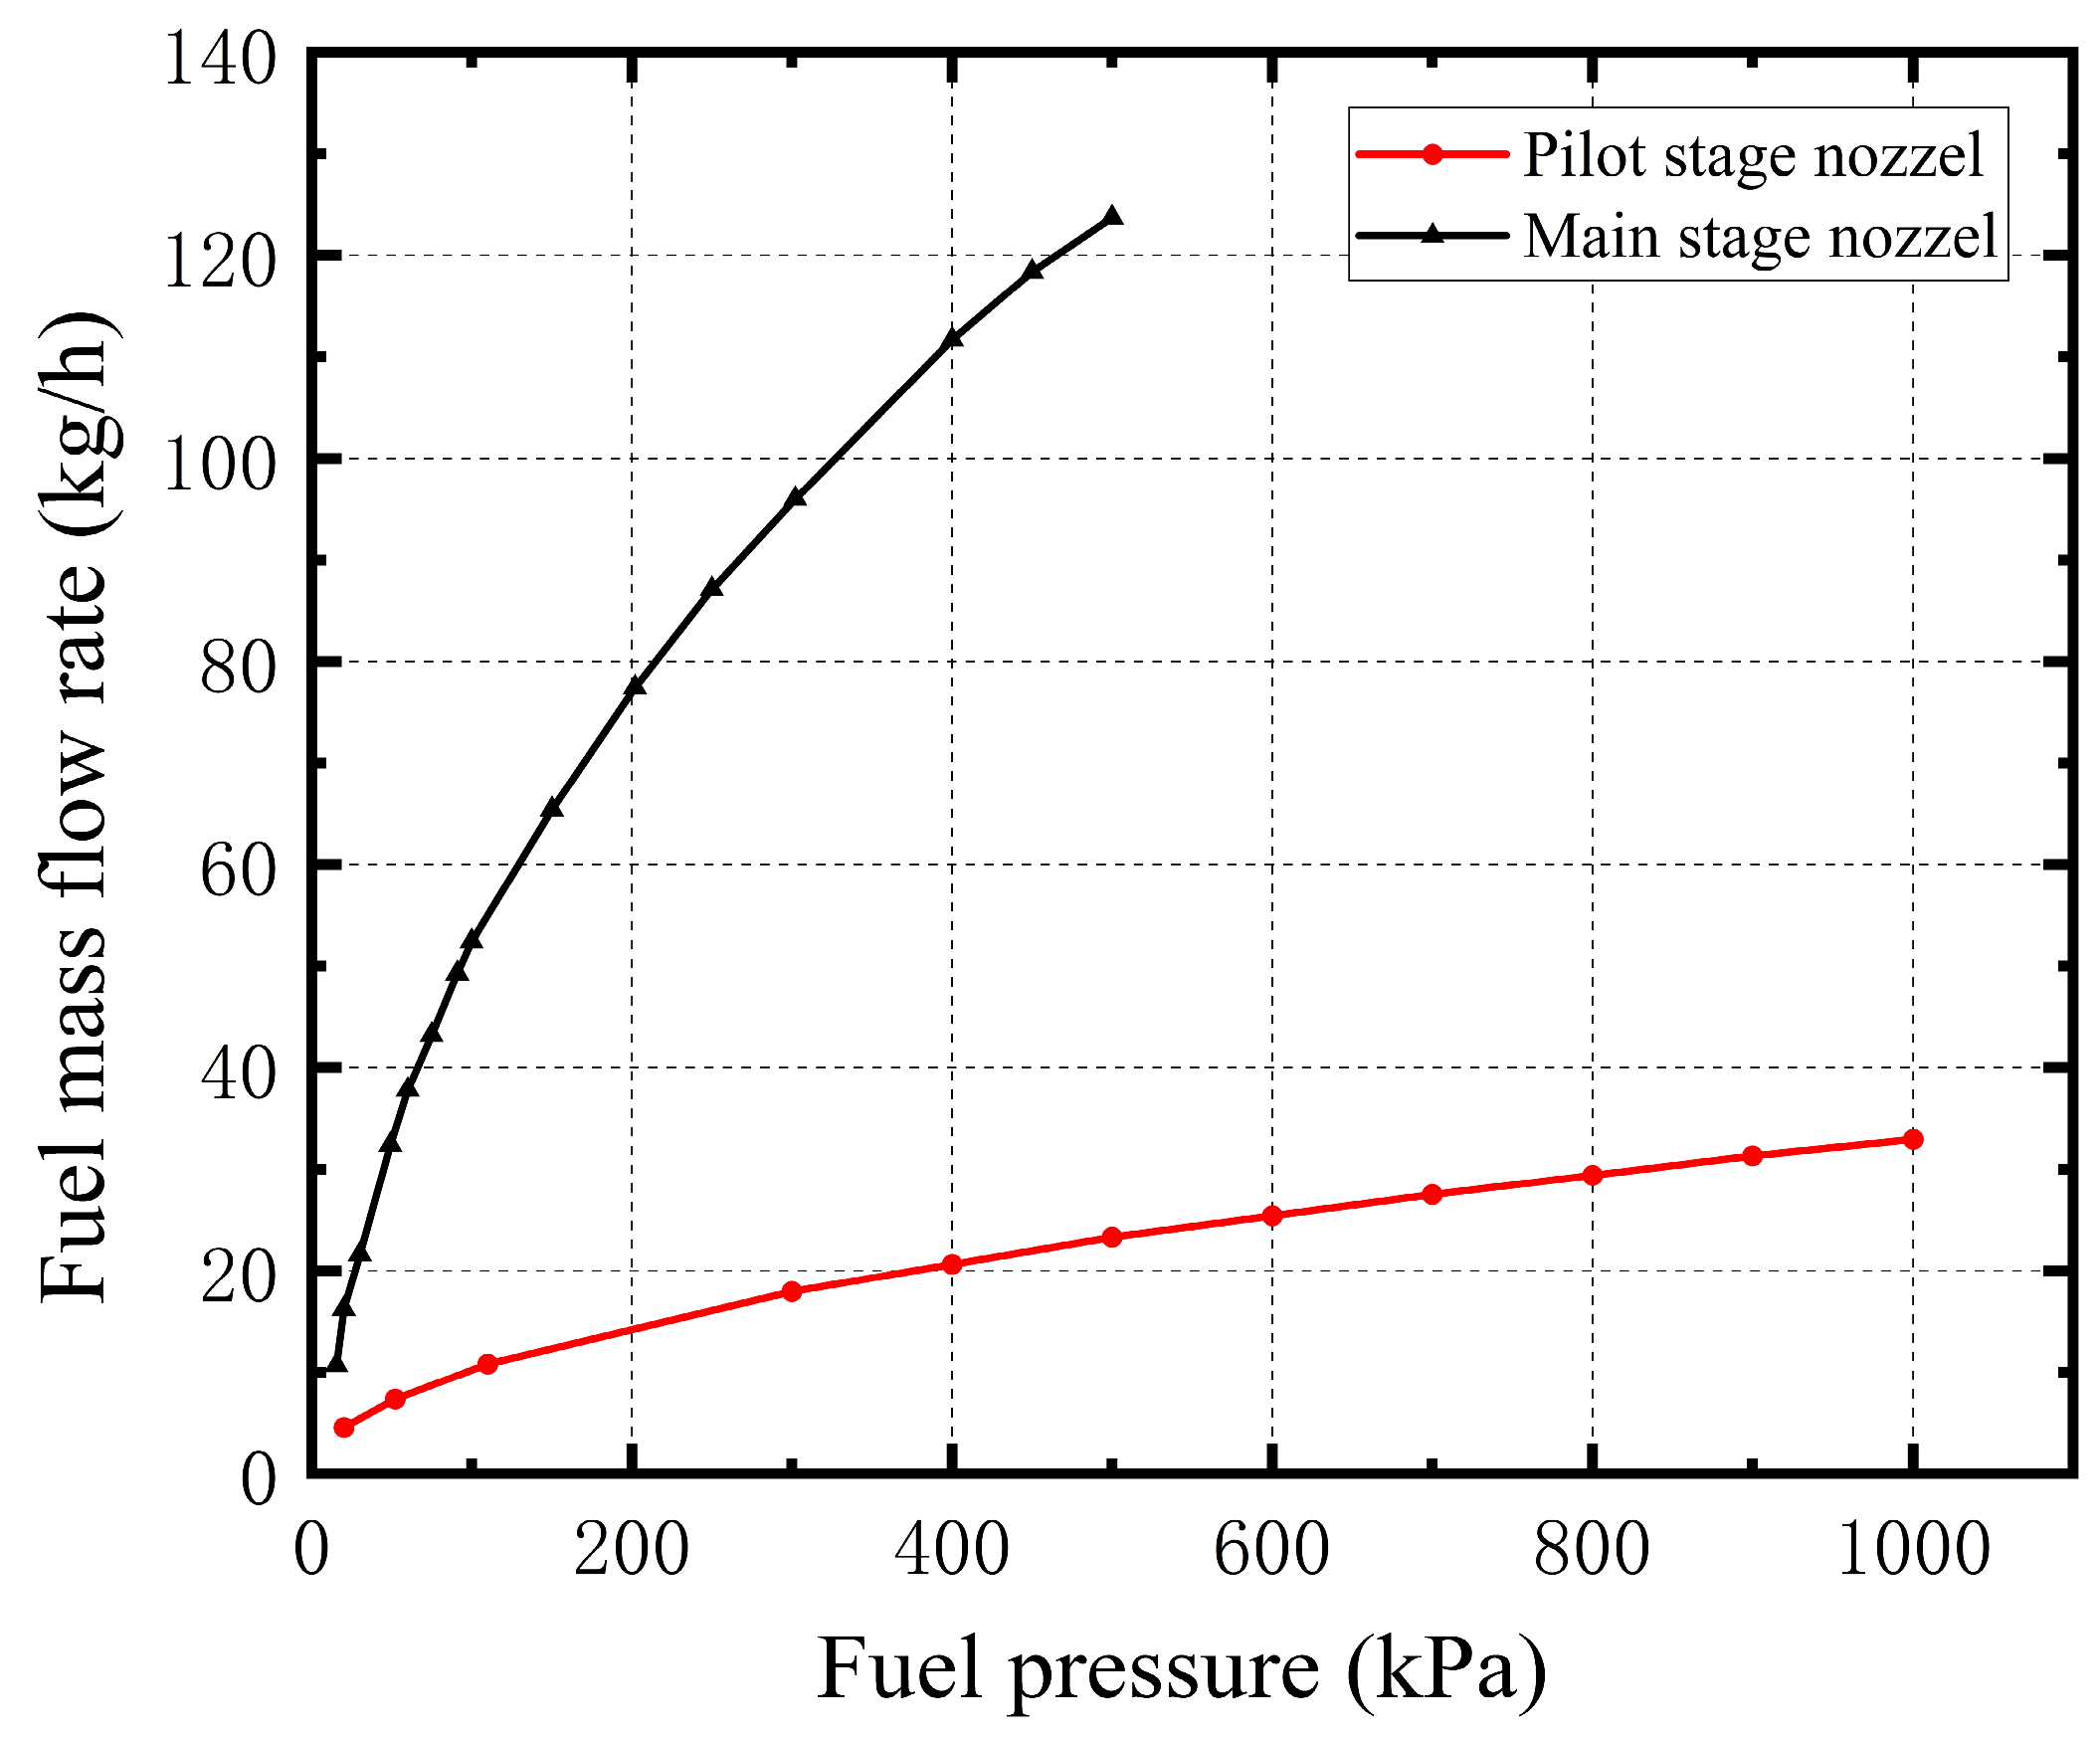
2. Materials and Methods
3. Results
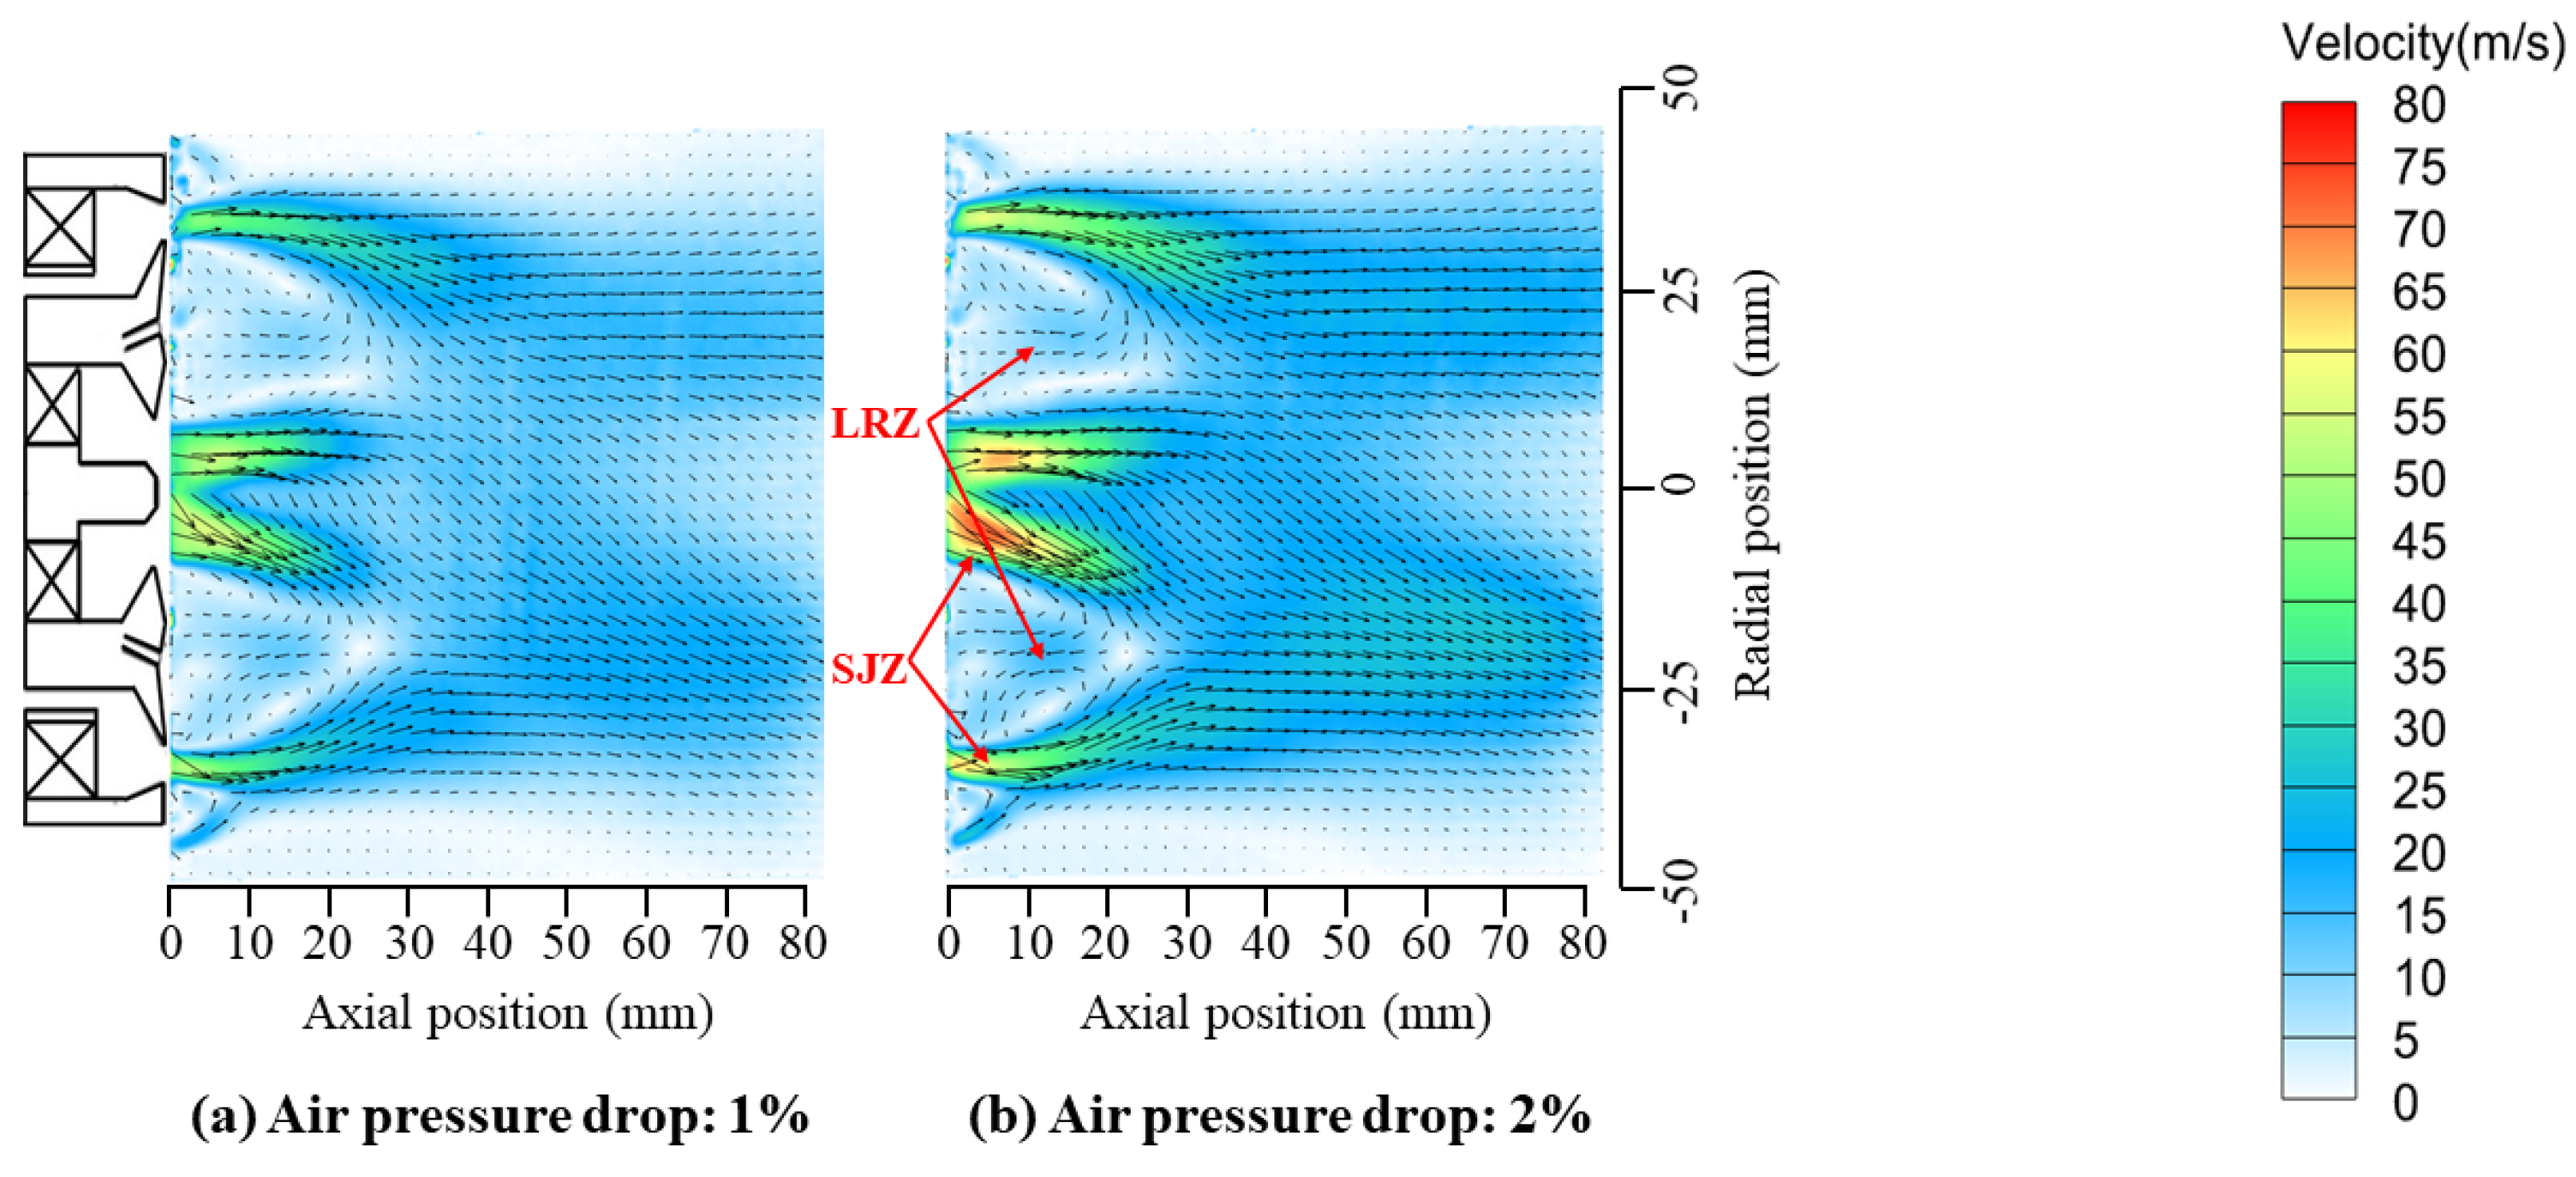
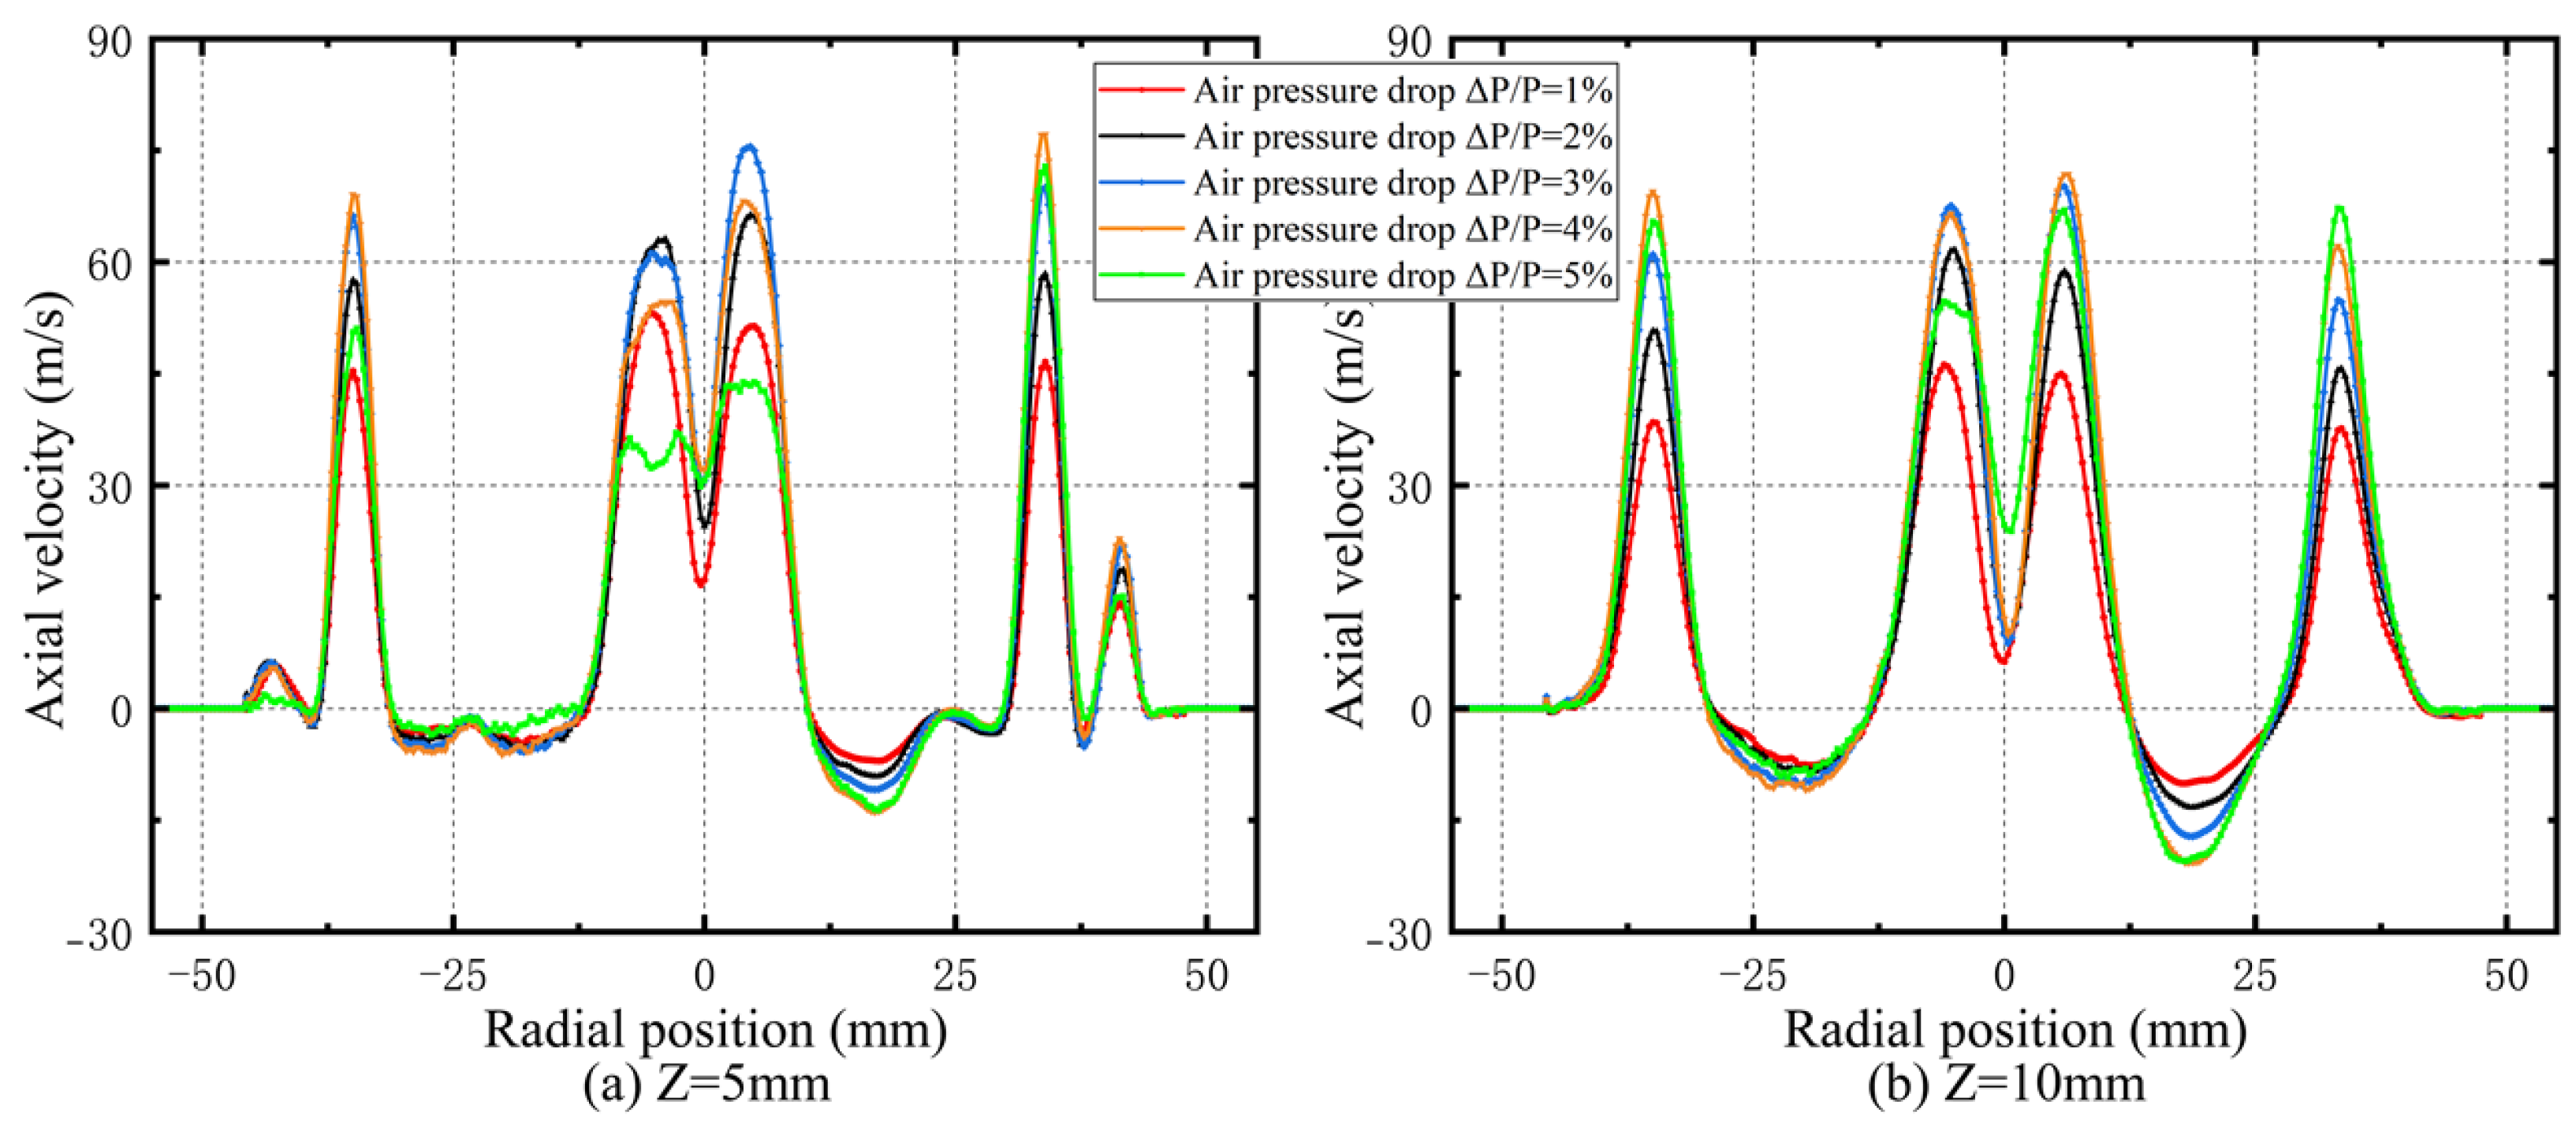
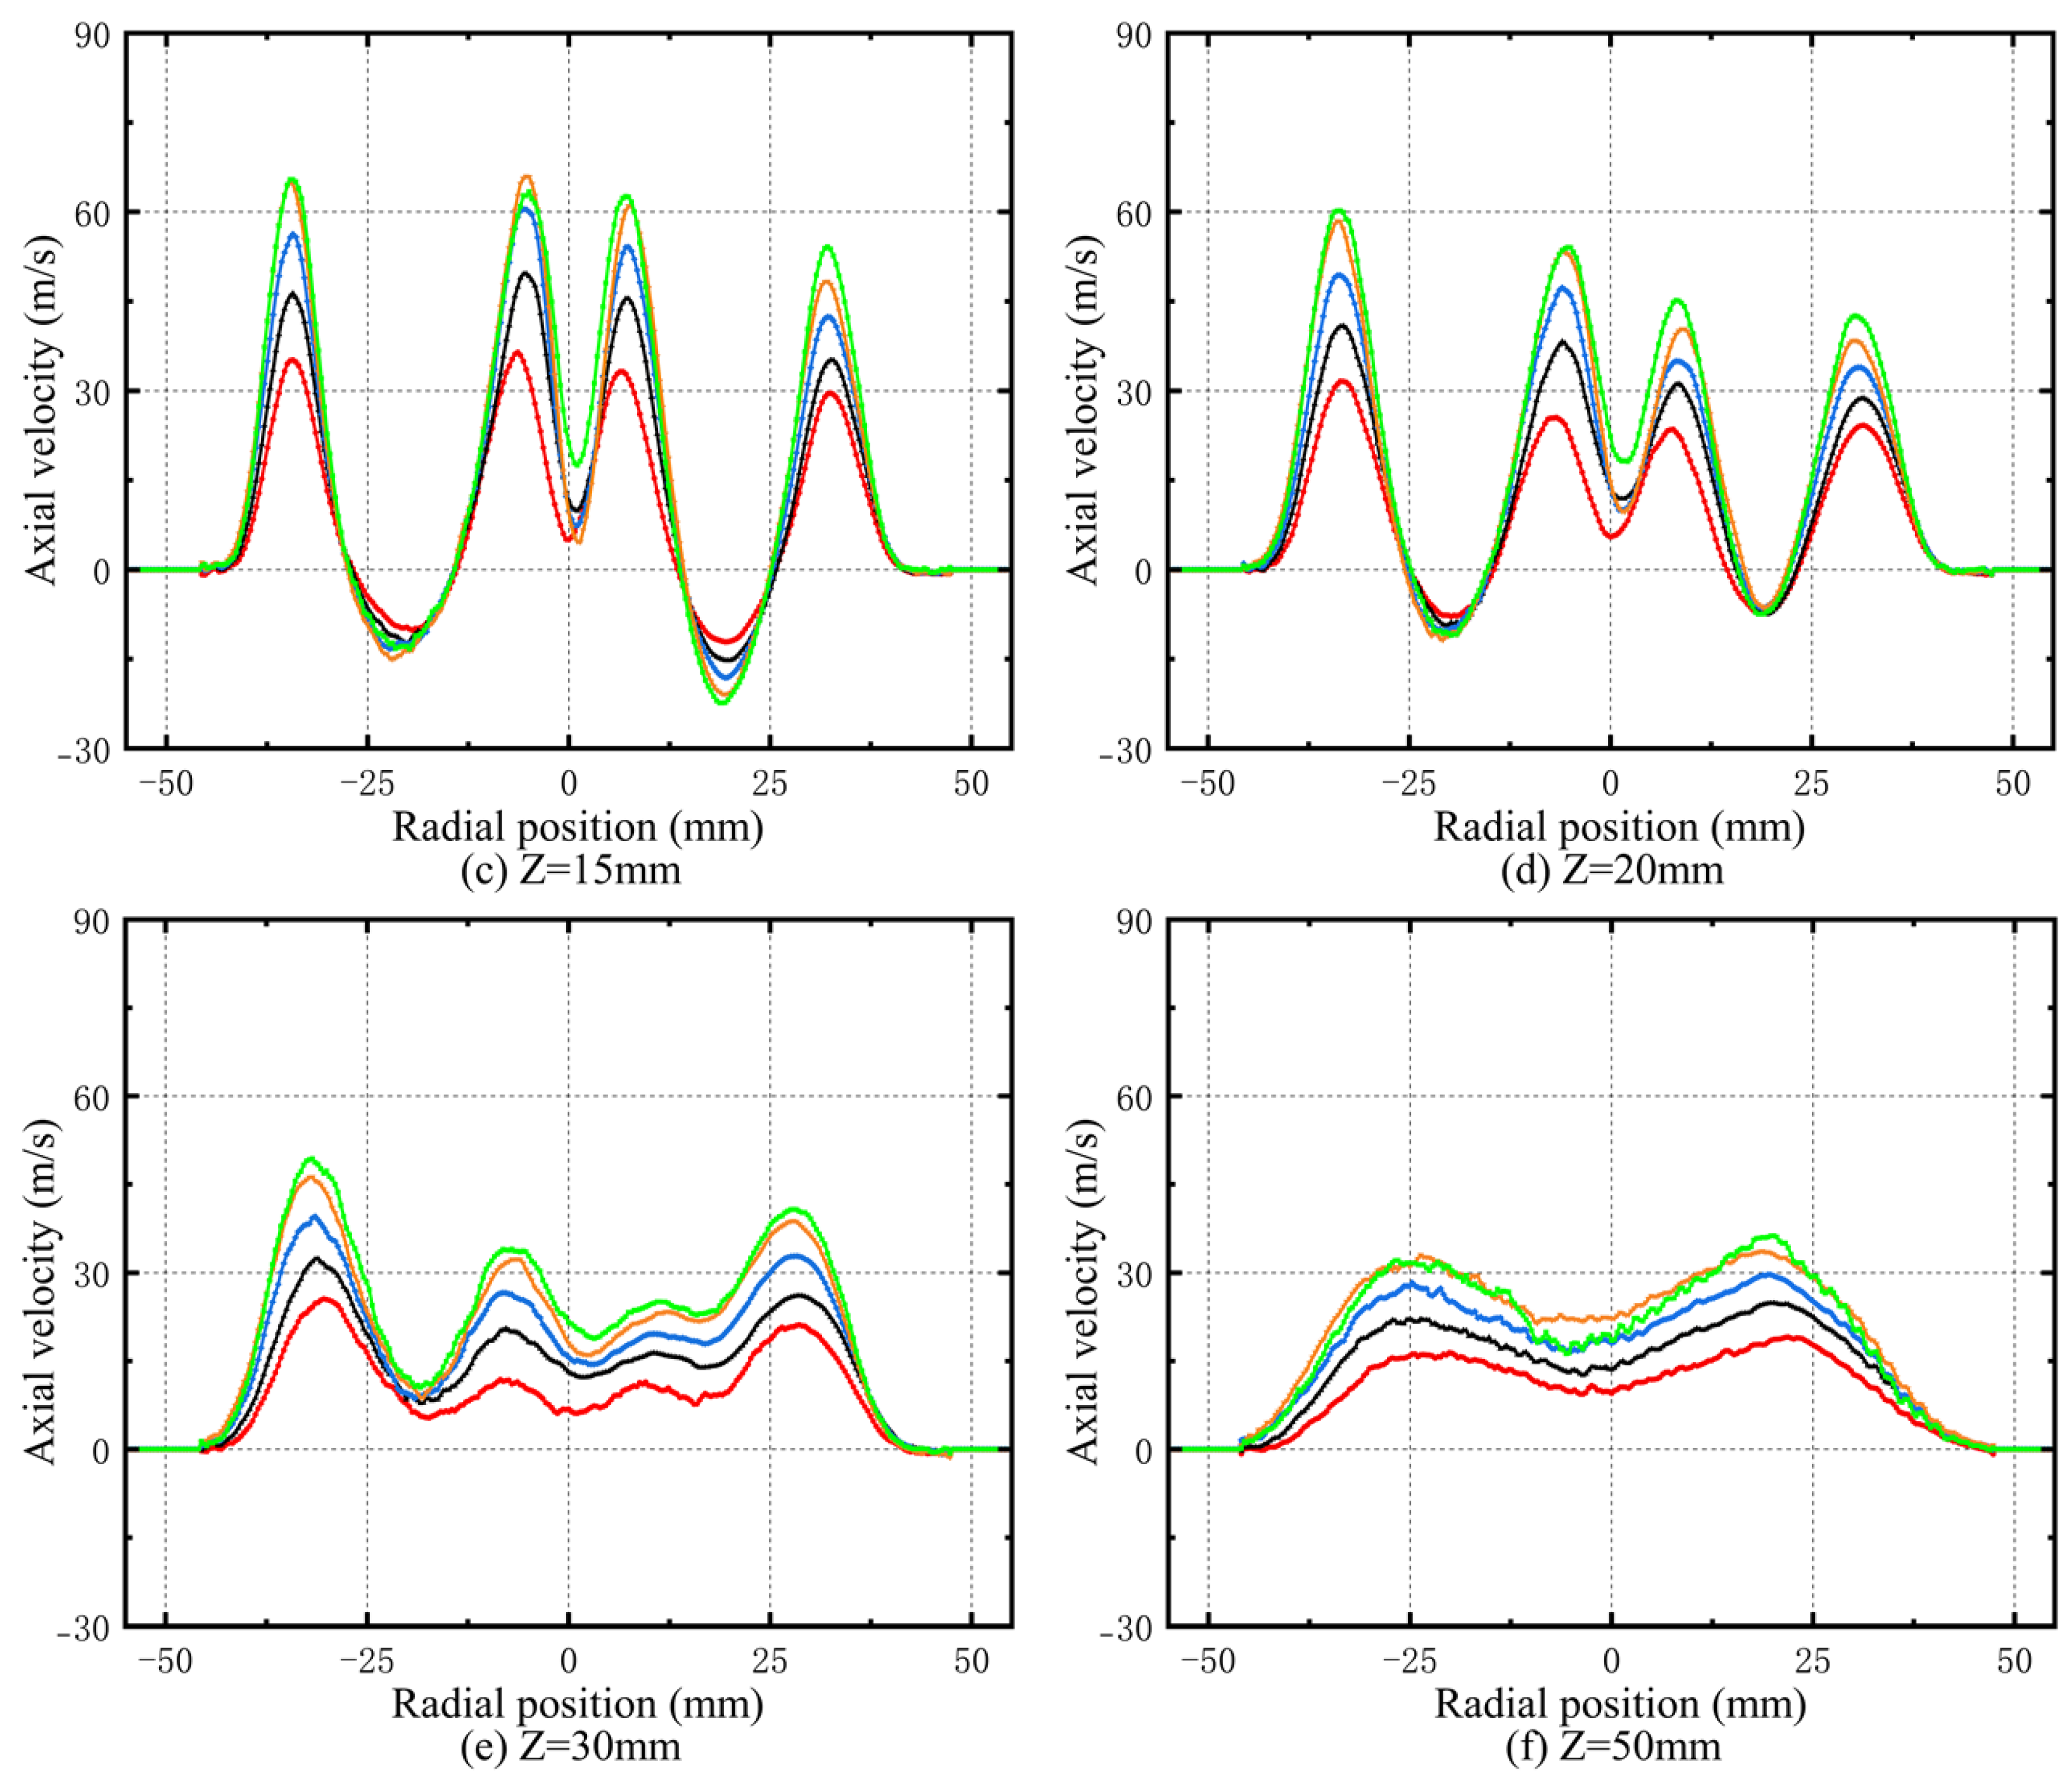
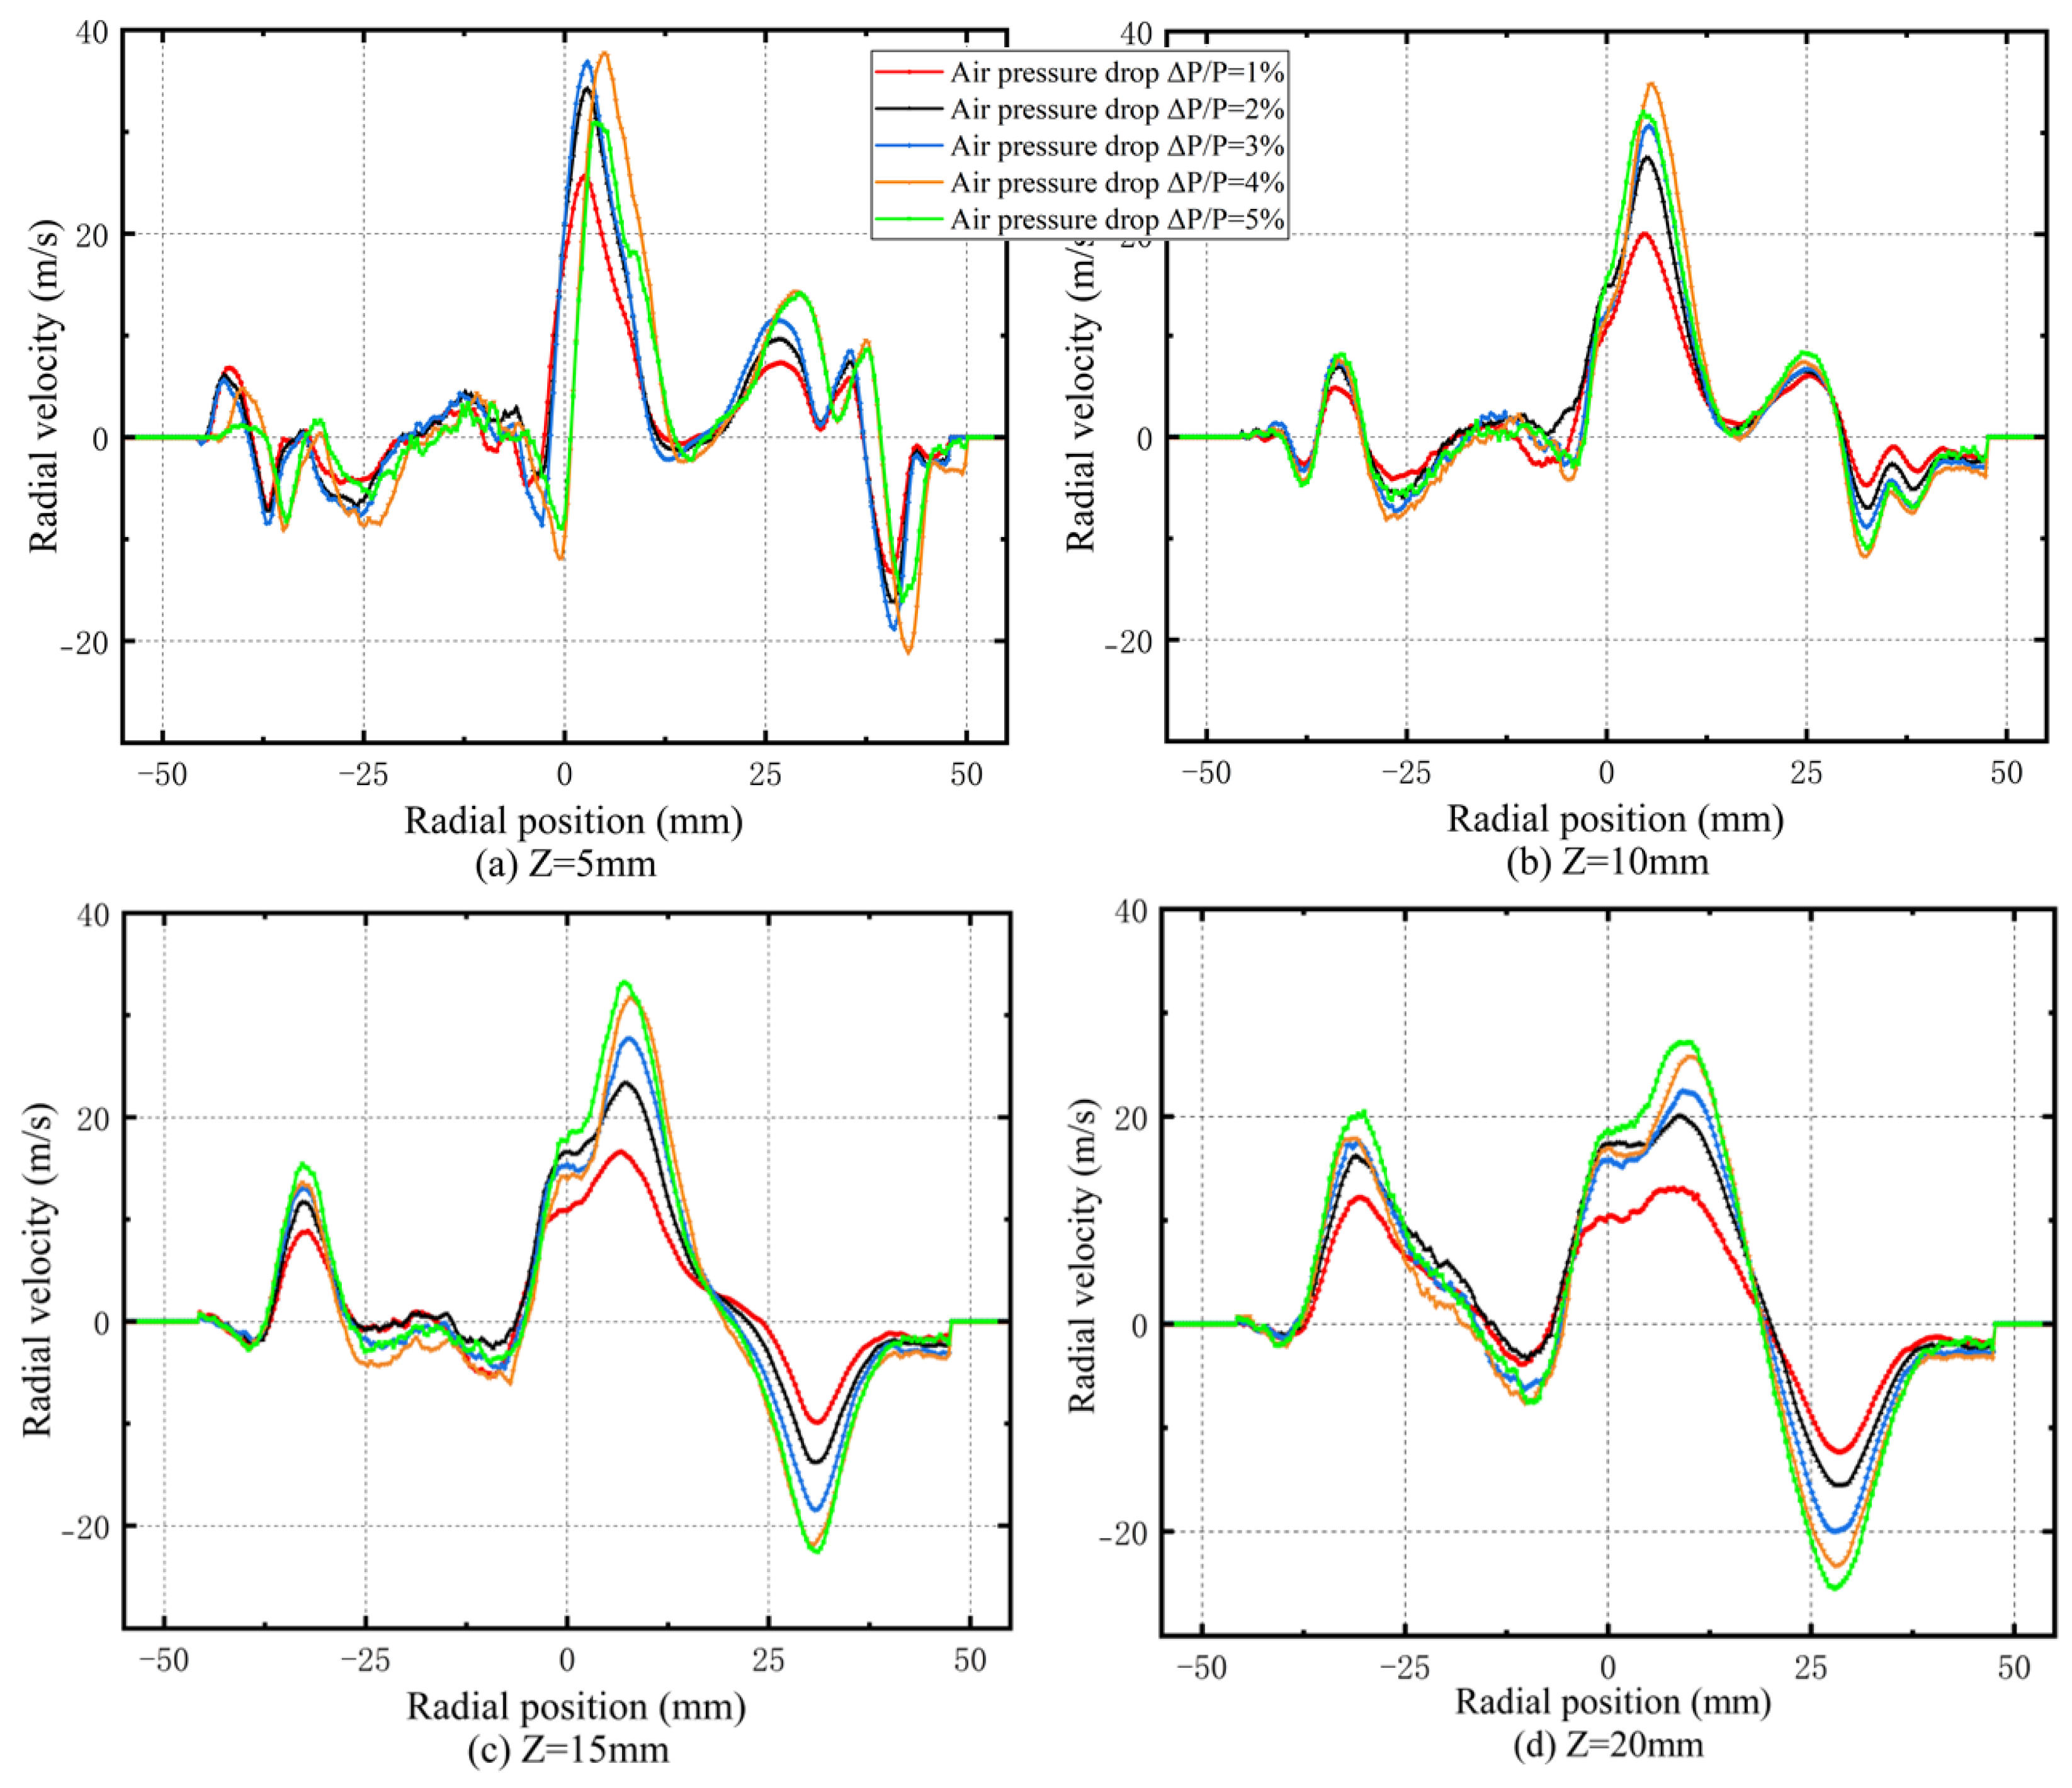
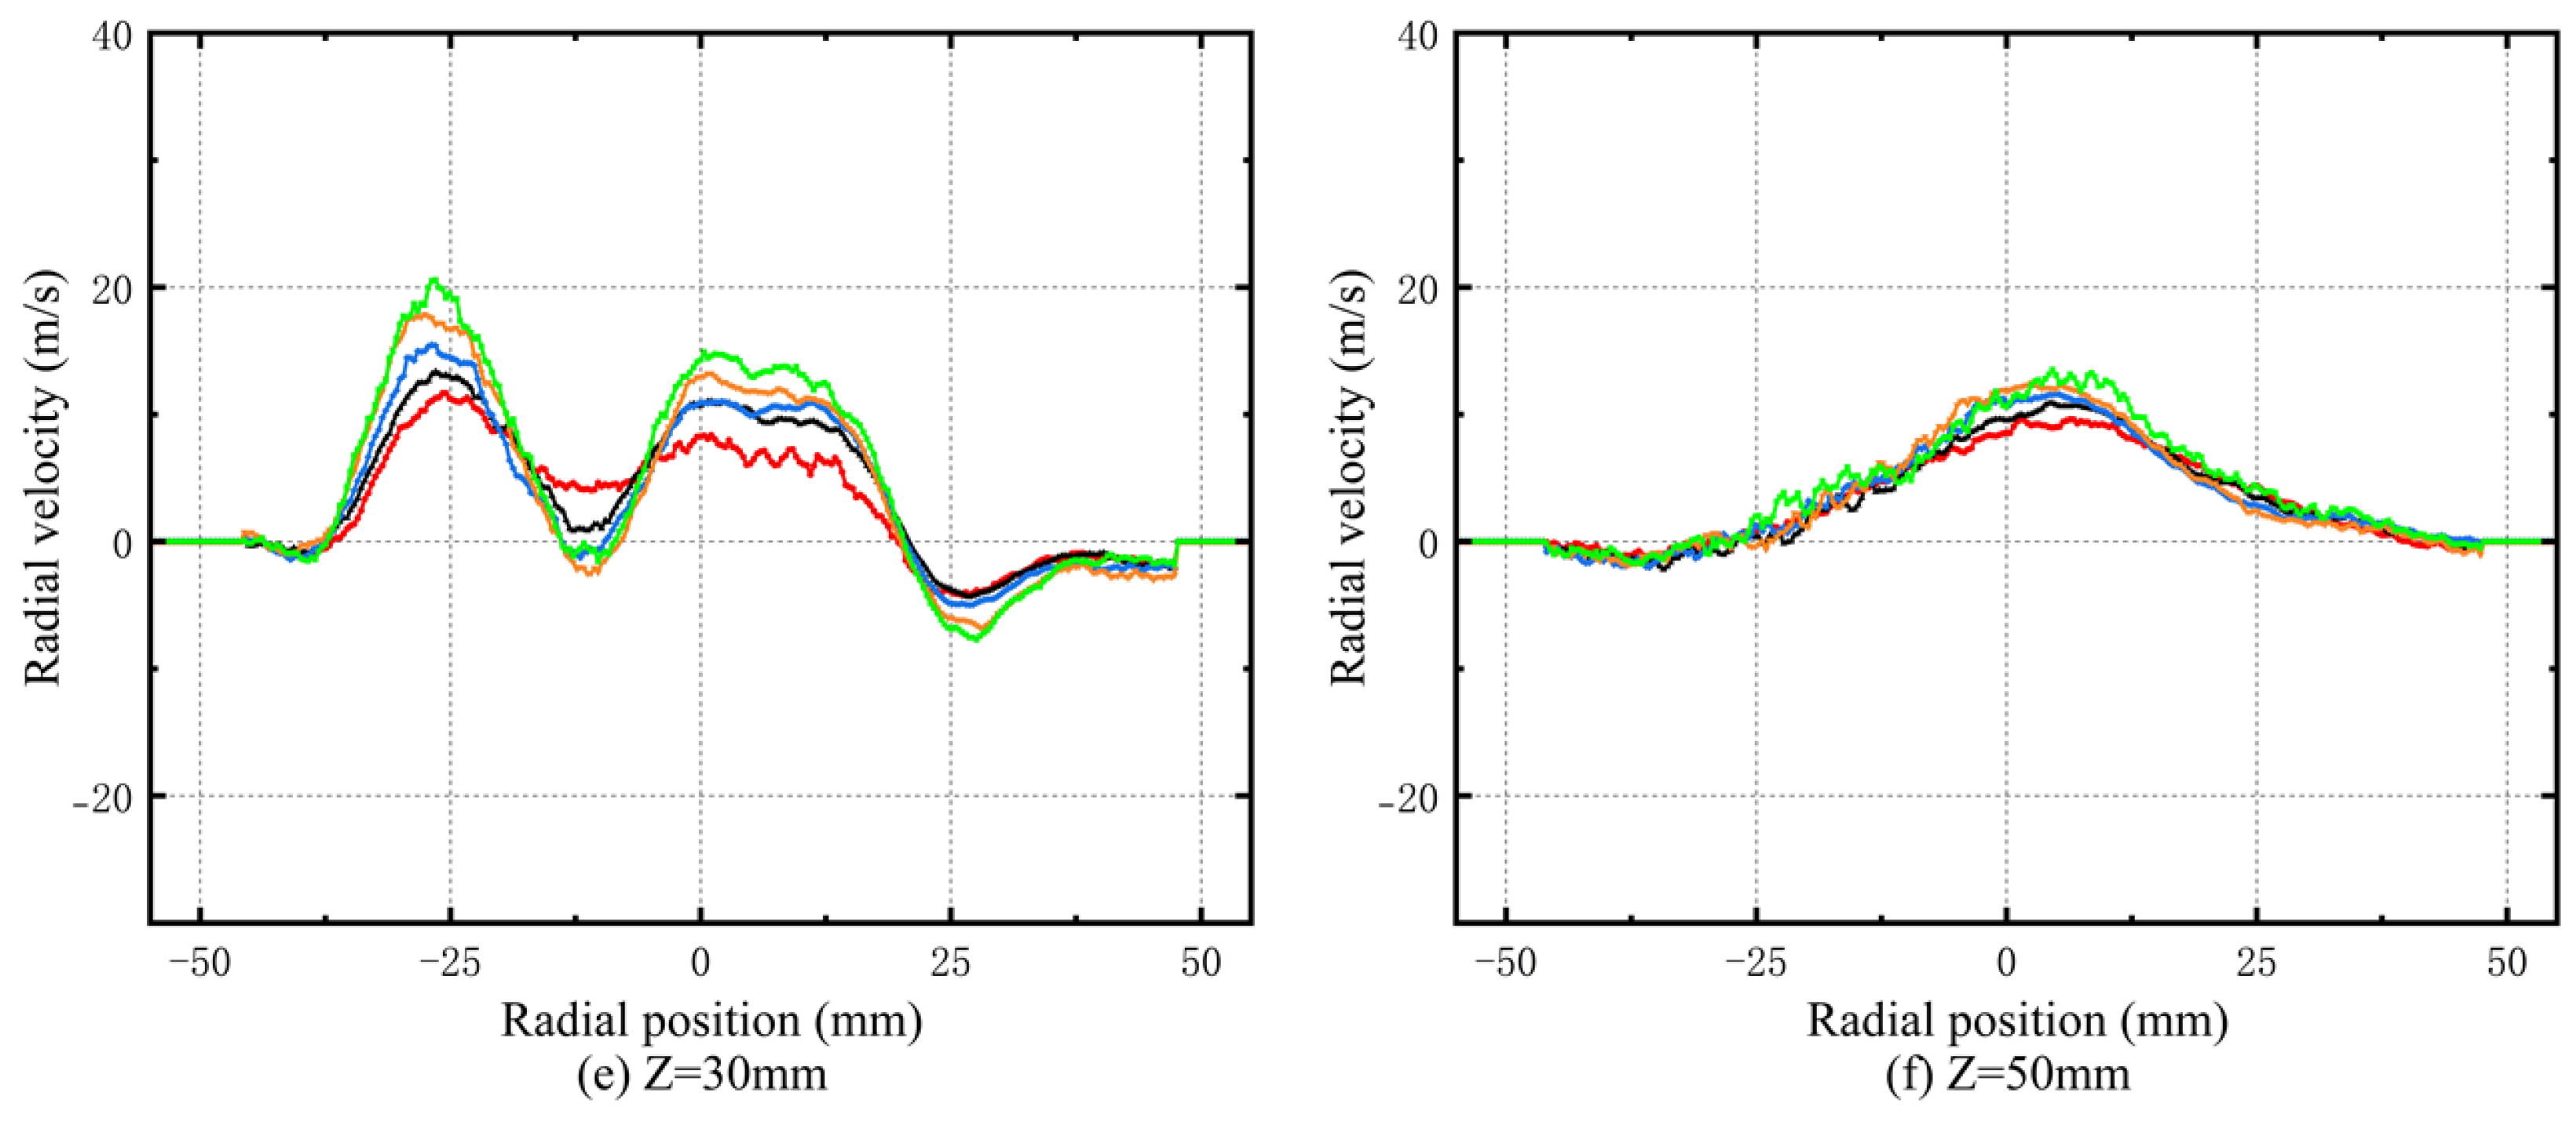
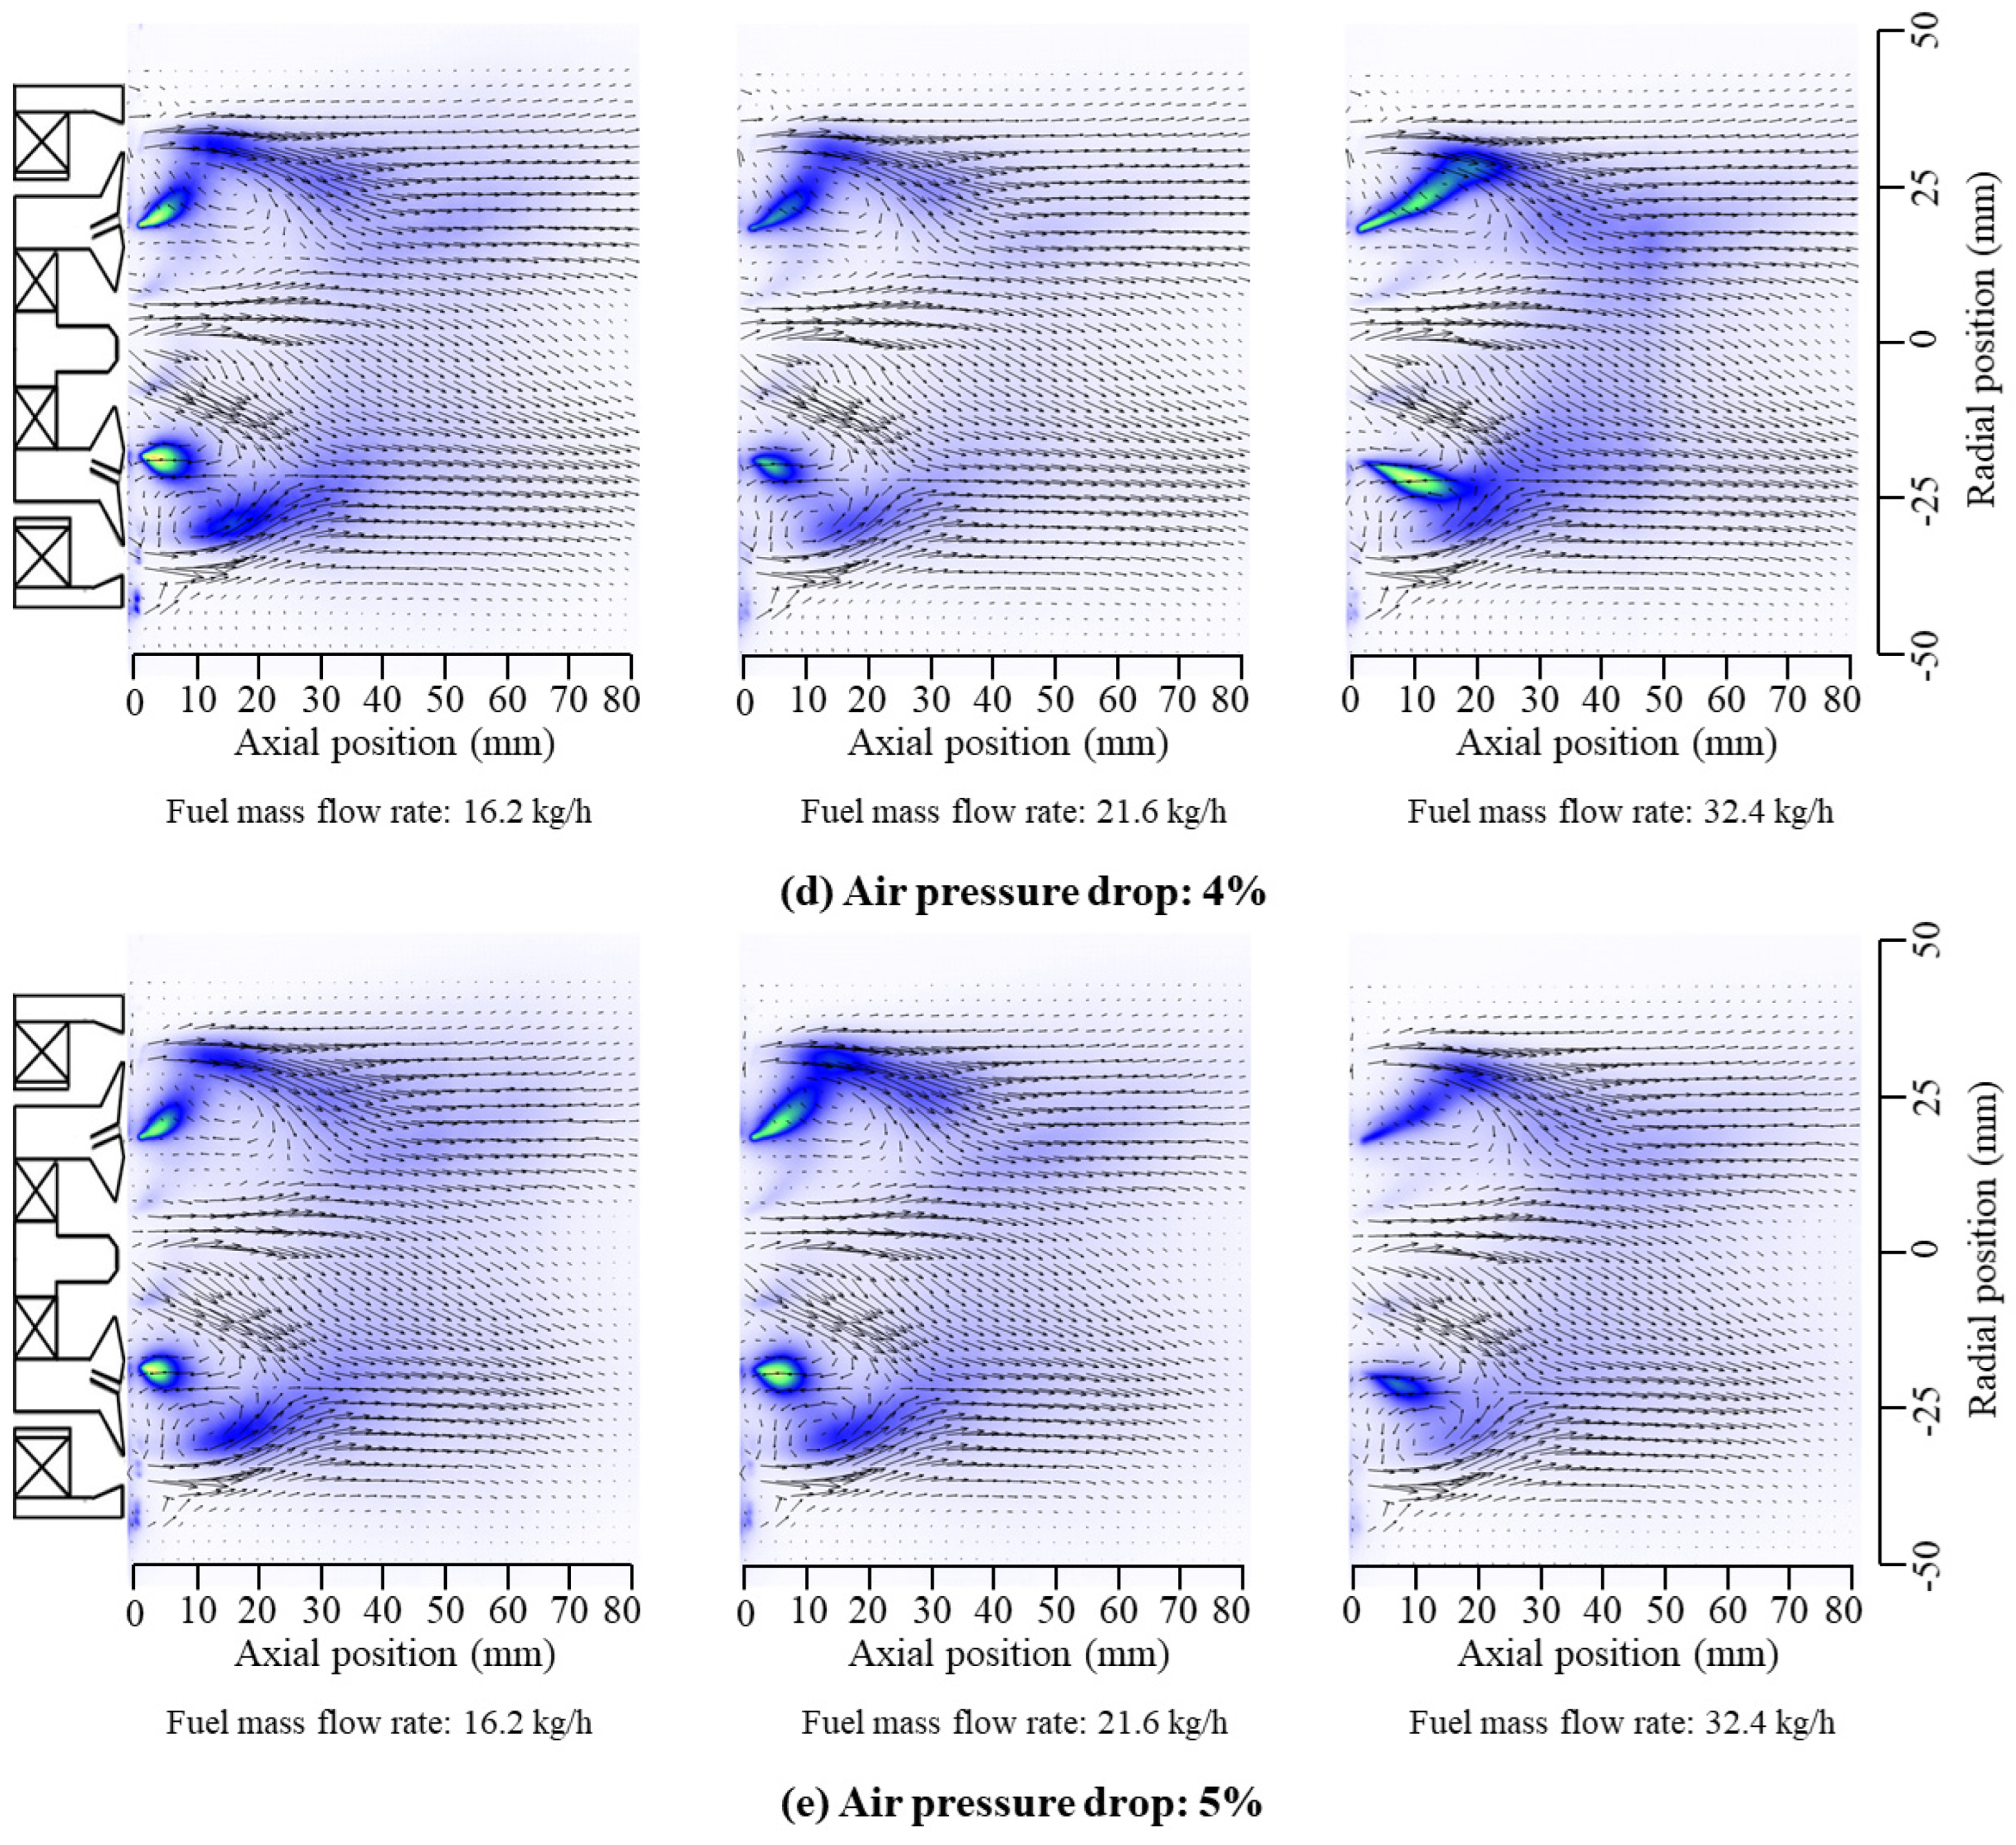
3.1. Flow Fields Distribution
3.2. Spray Pattern
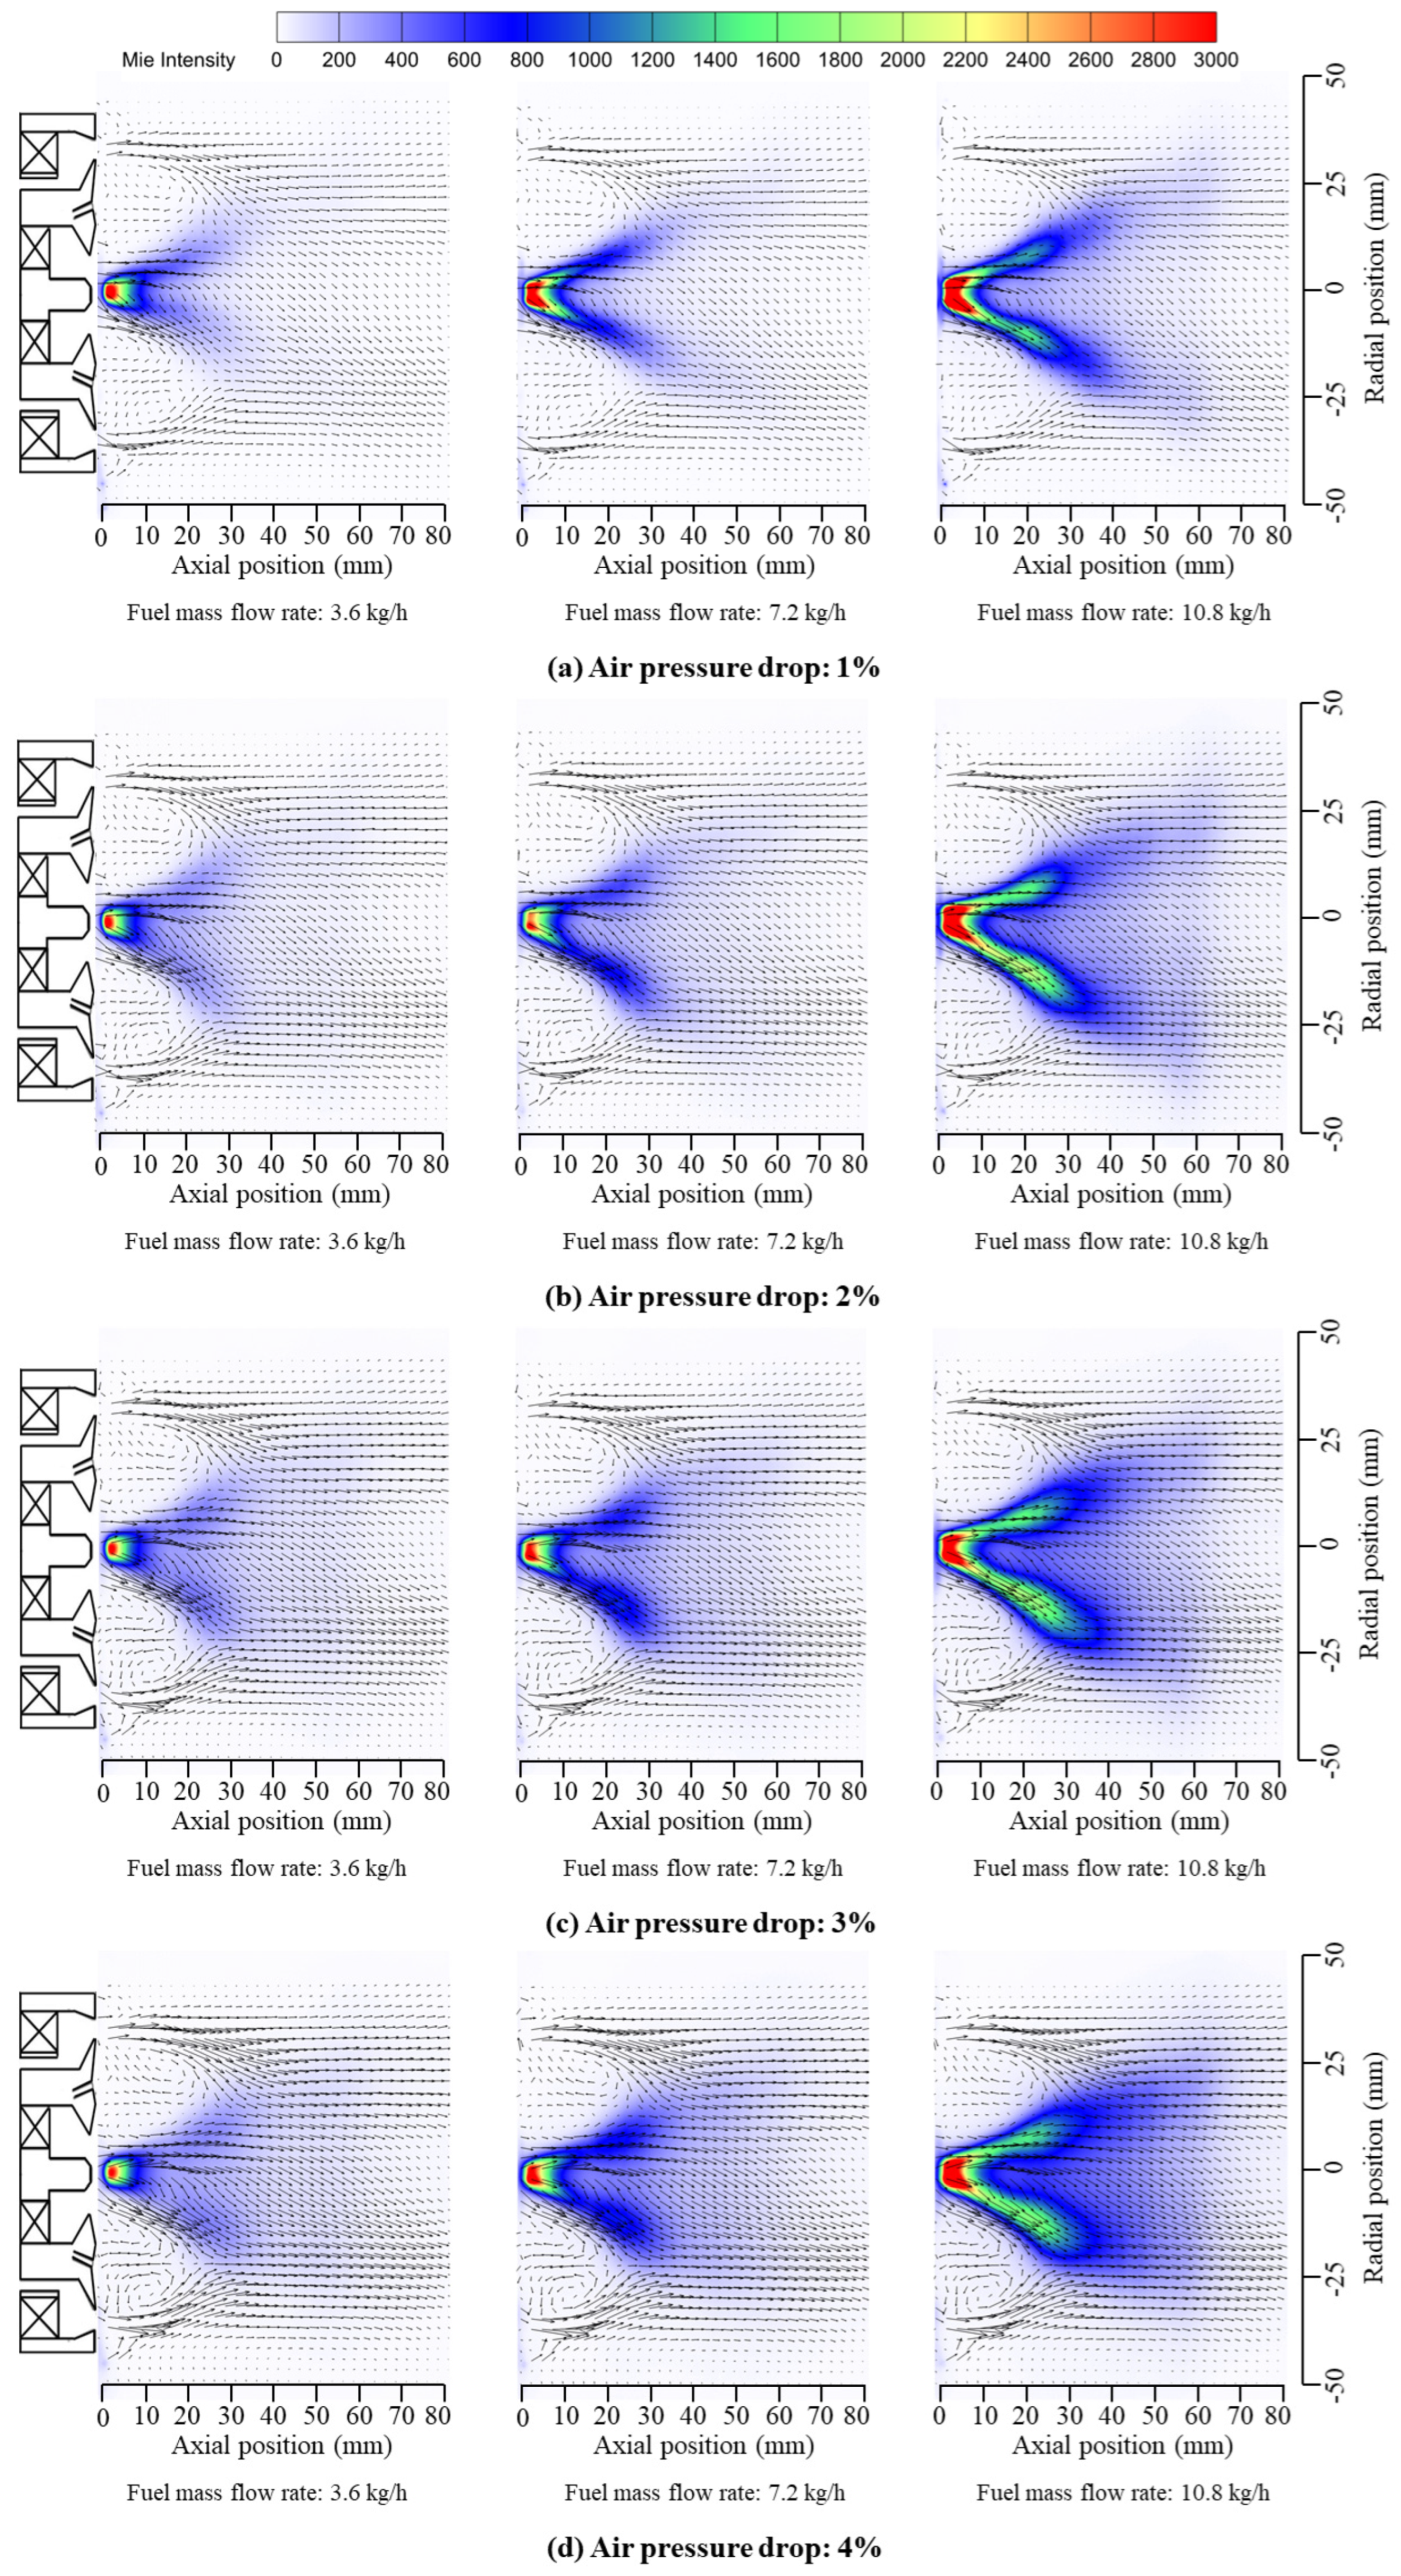
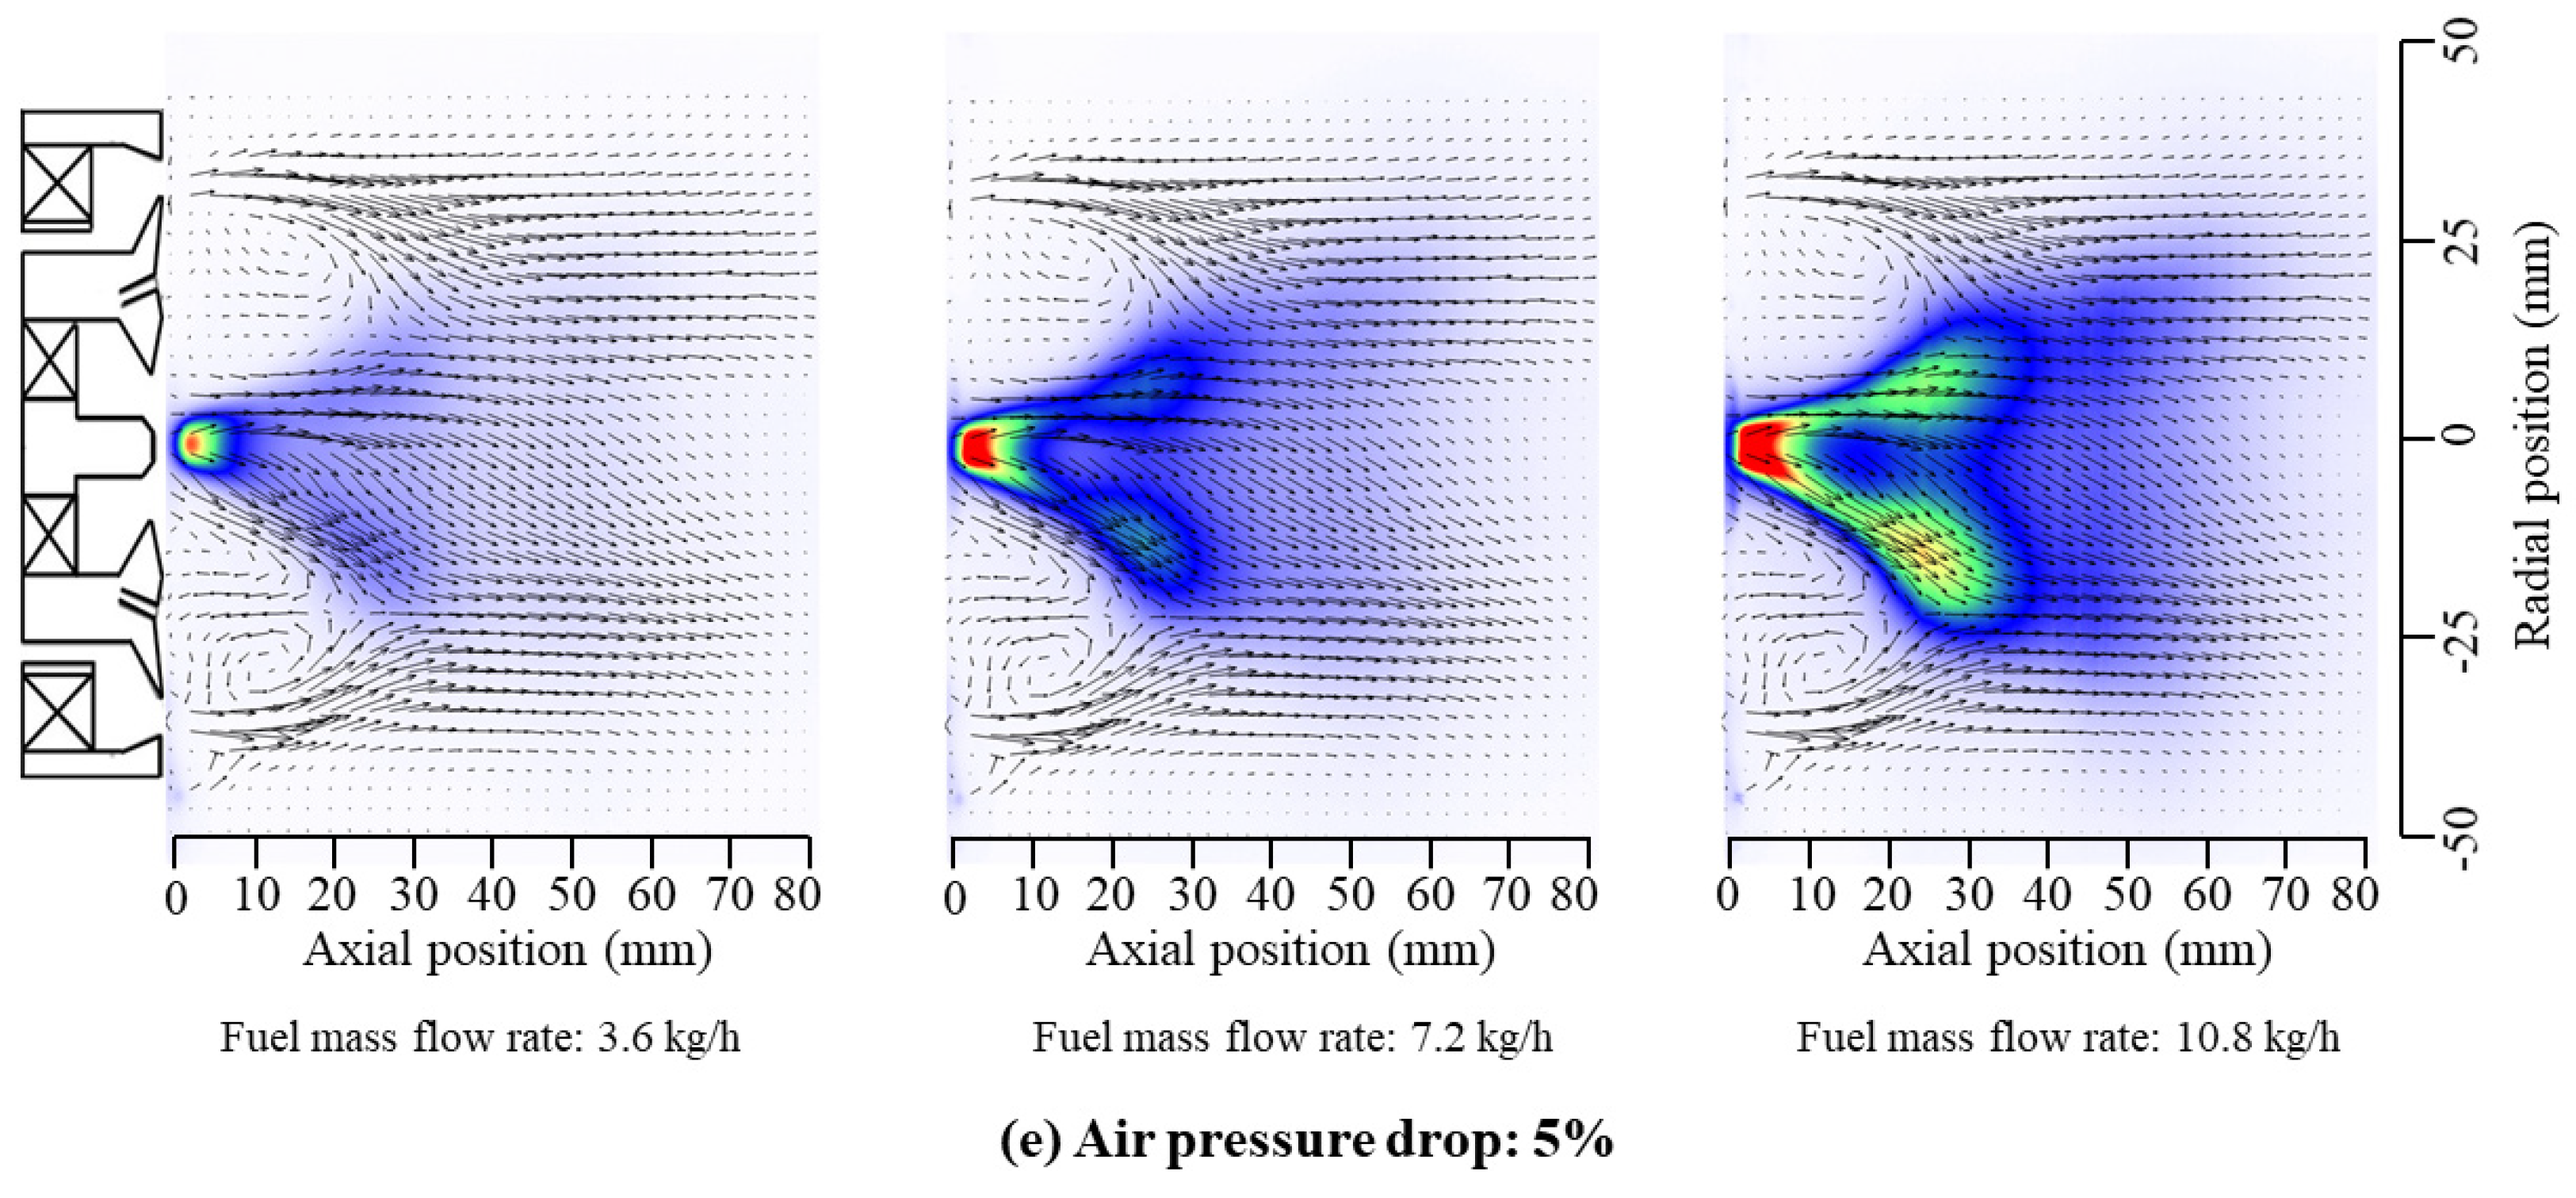
3.2.1. Pilot Stage Spray
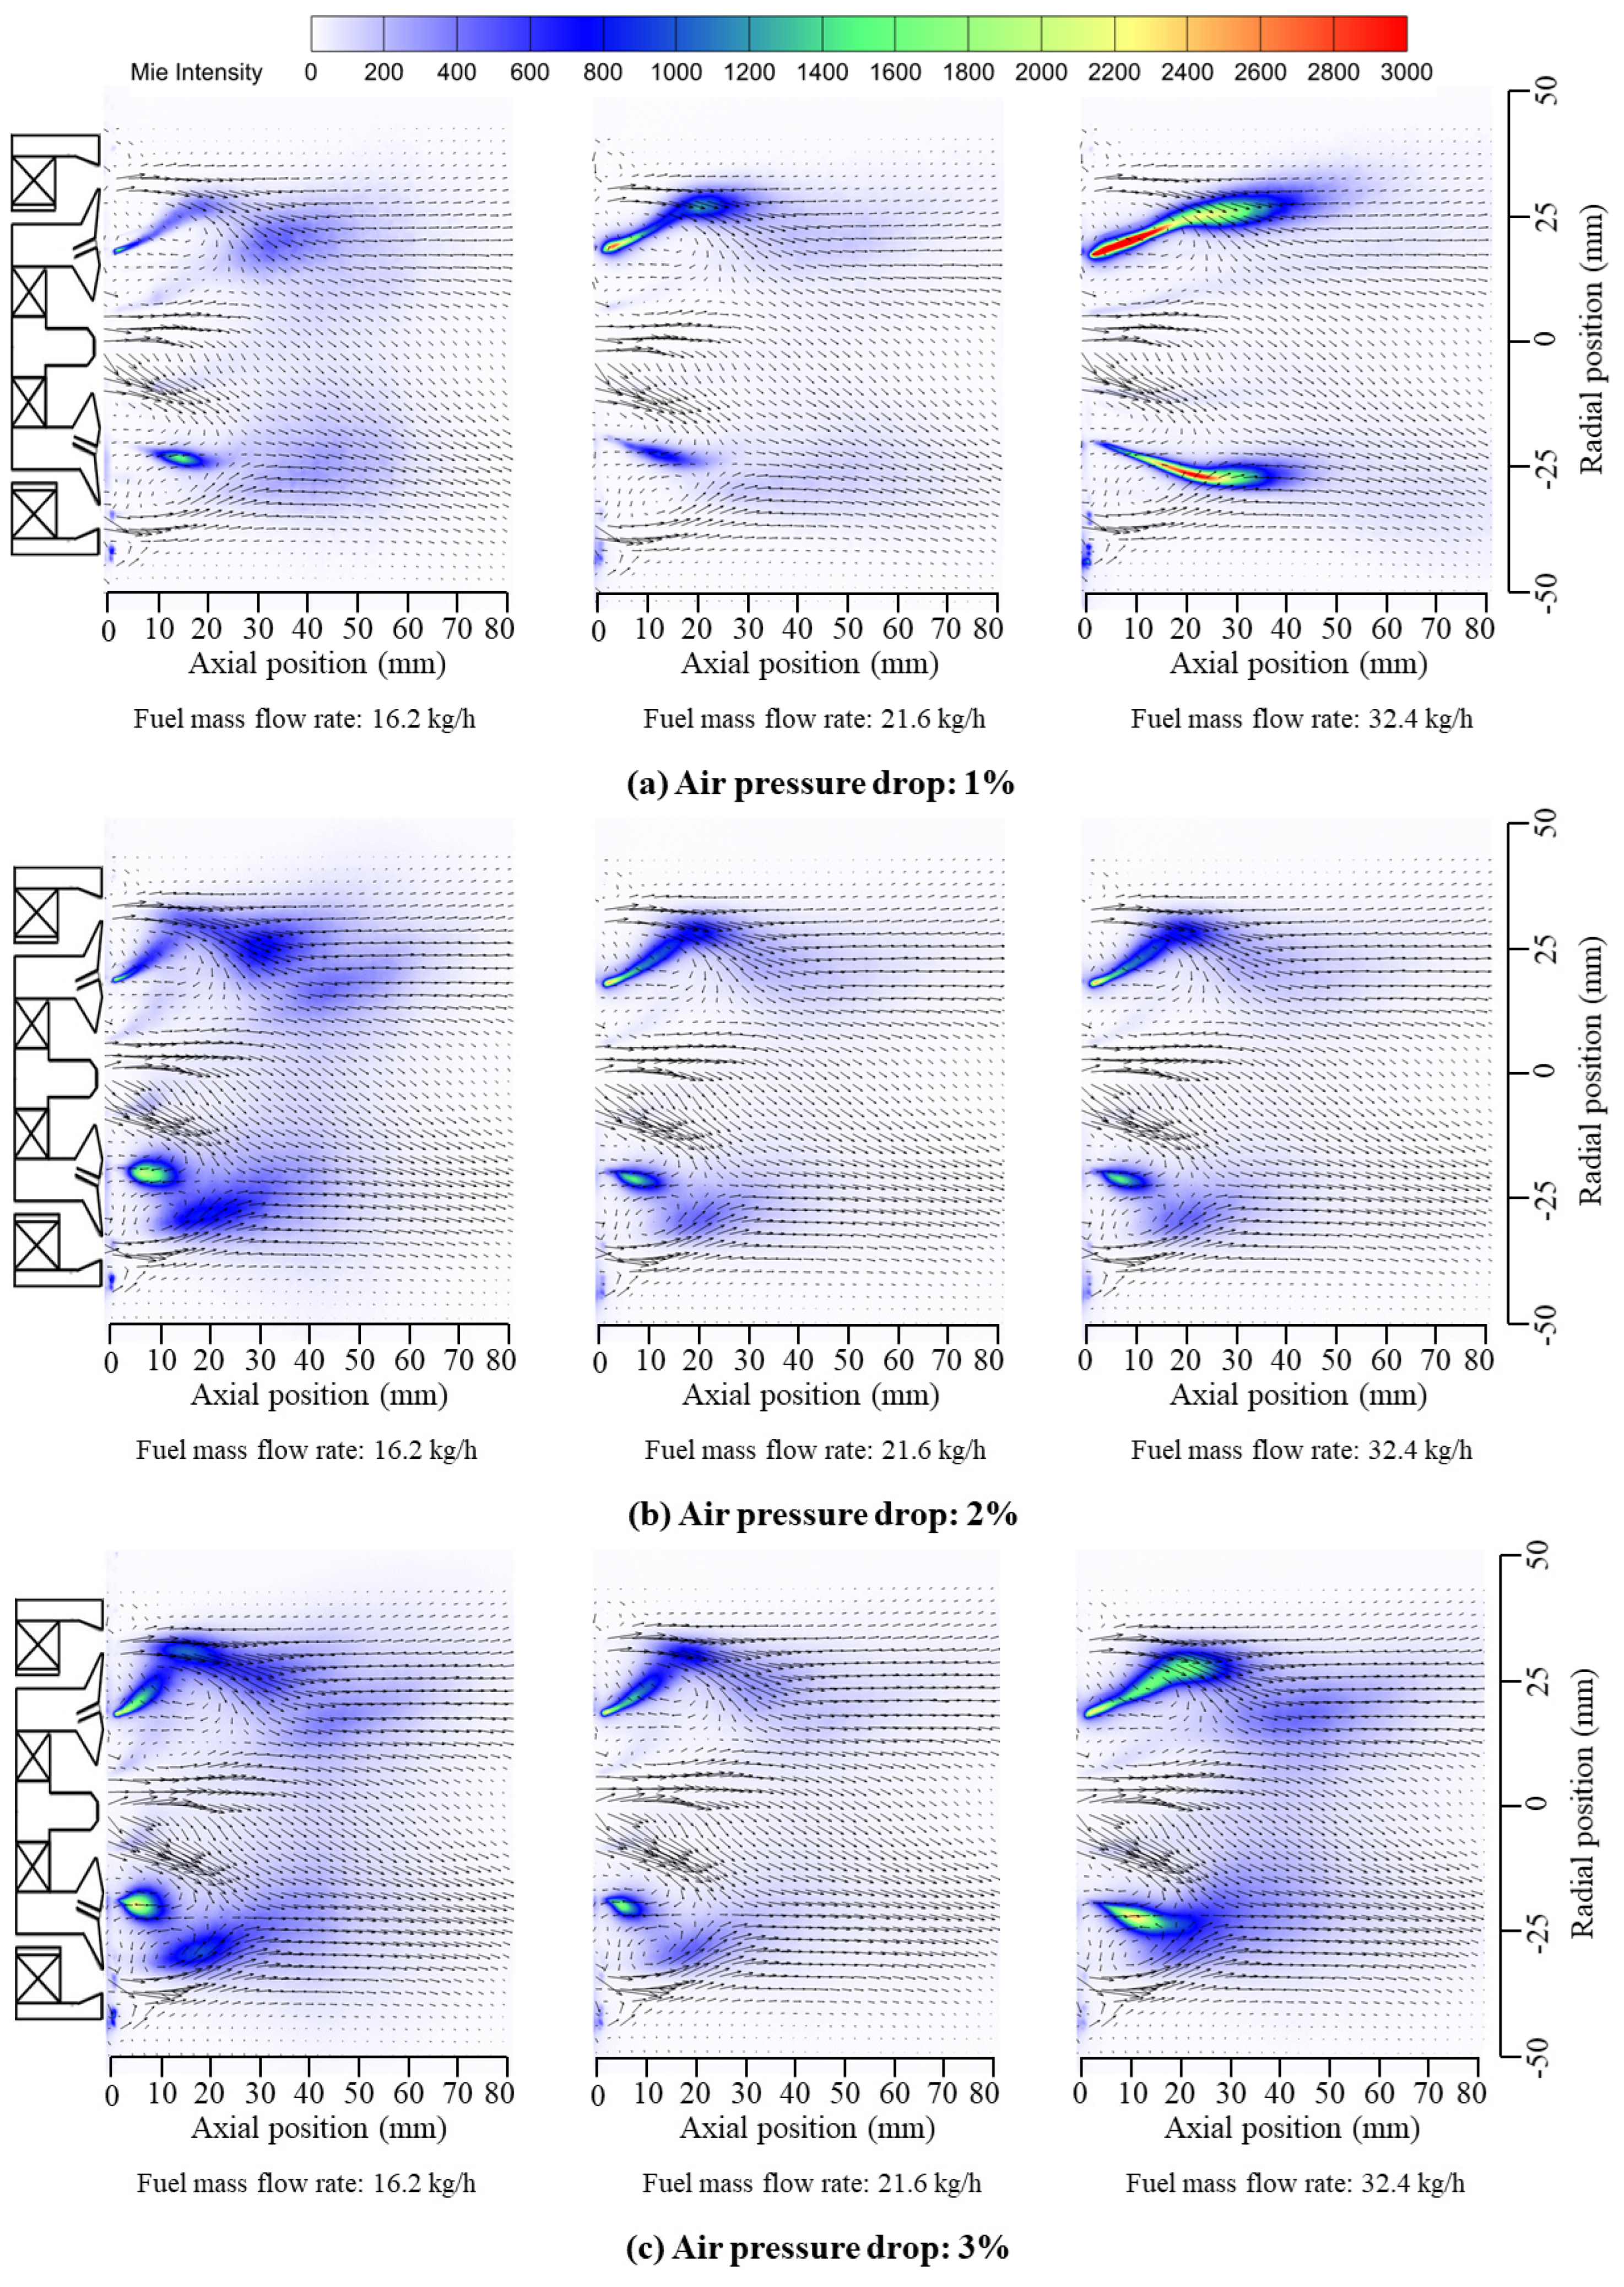
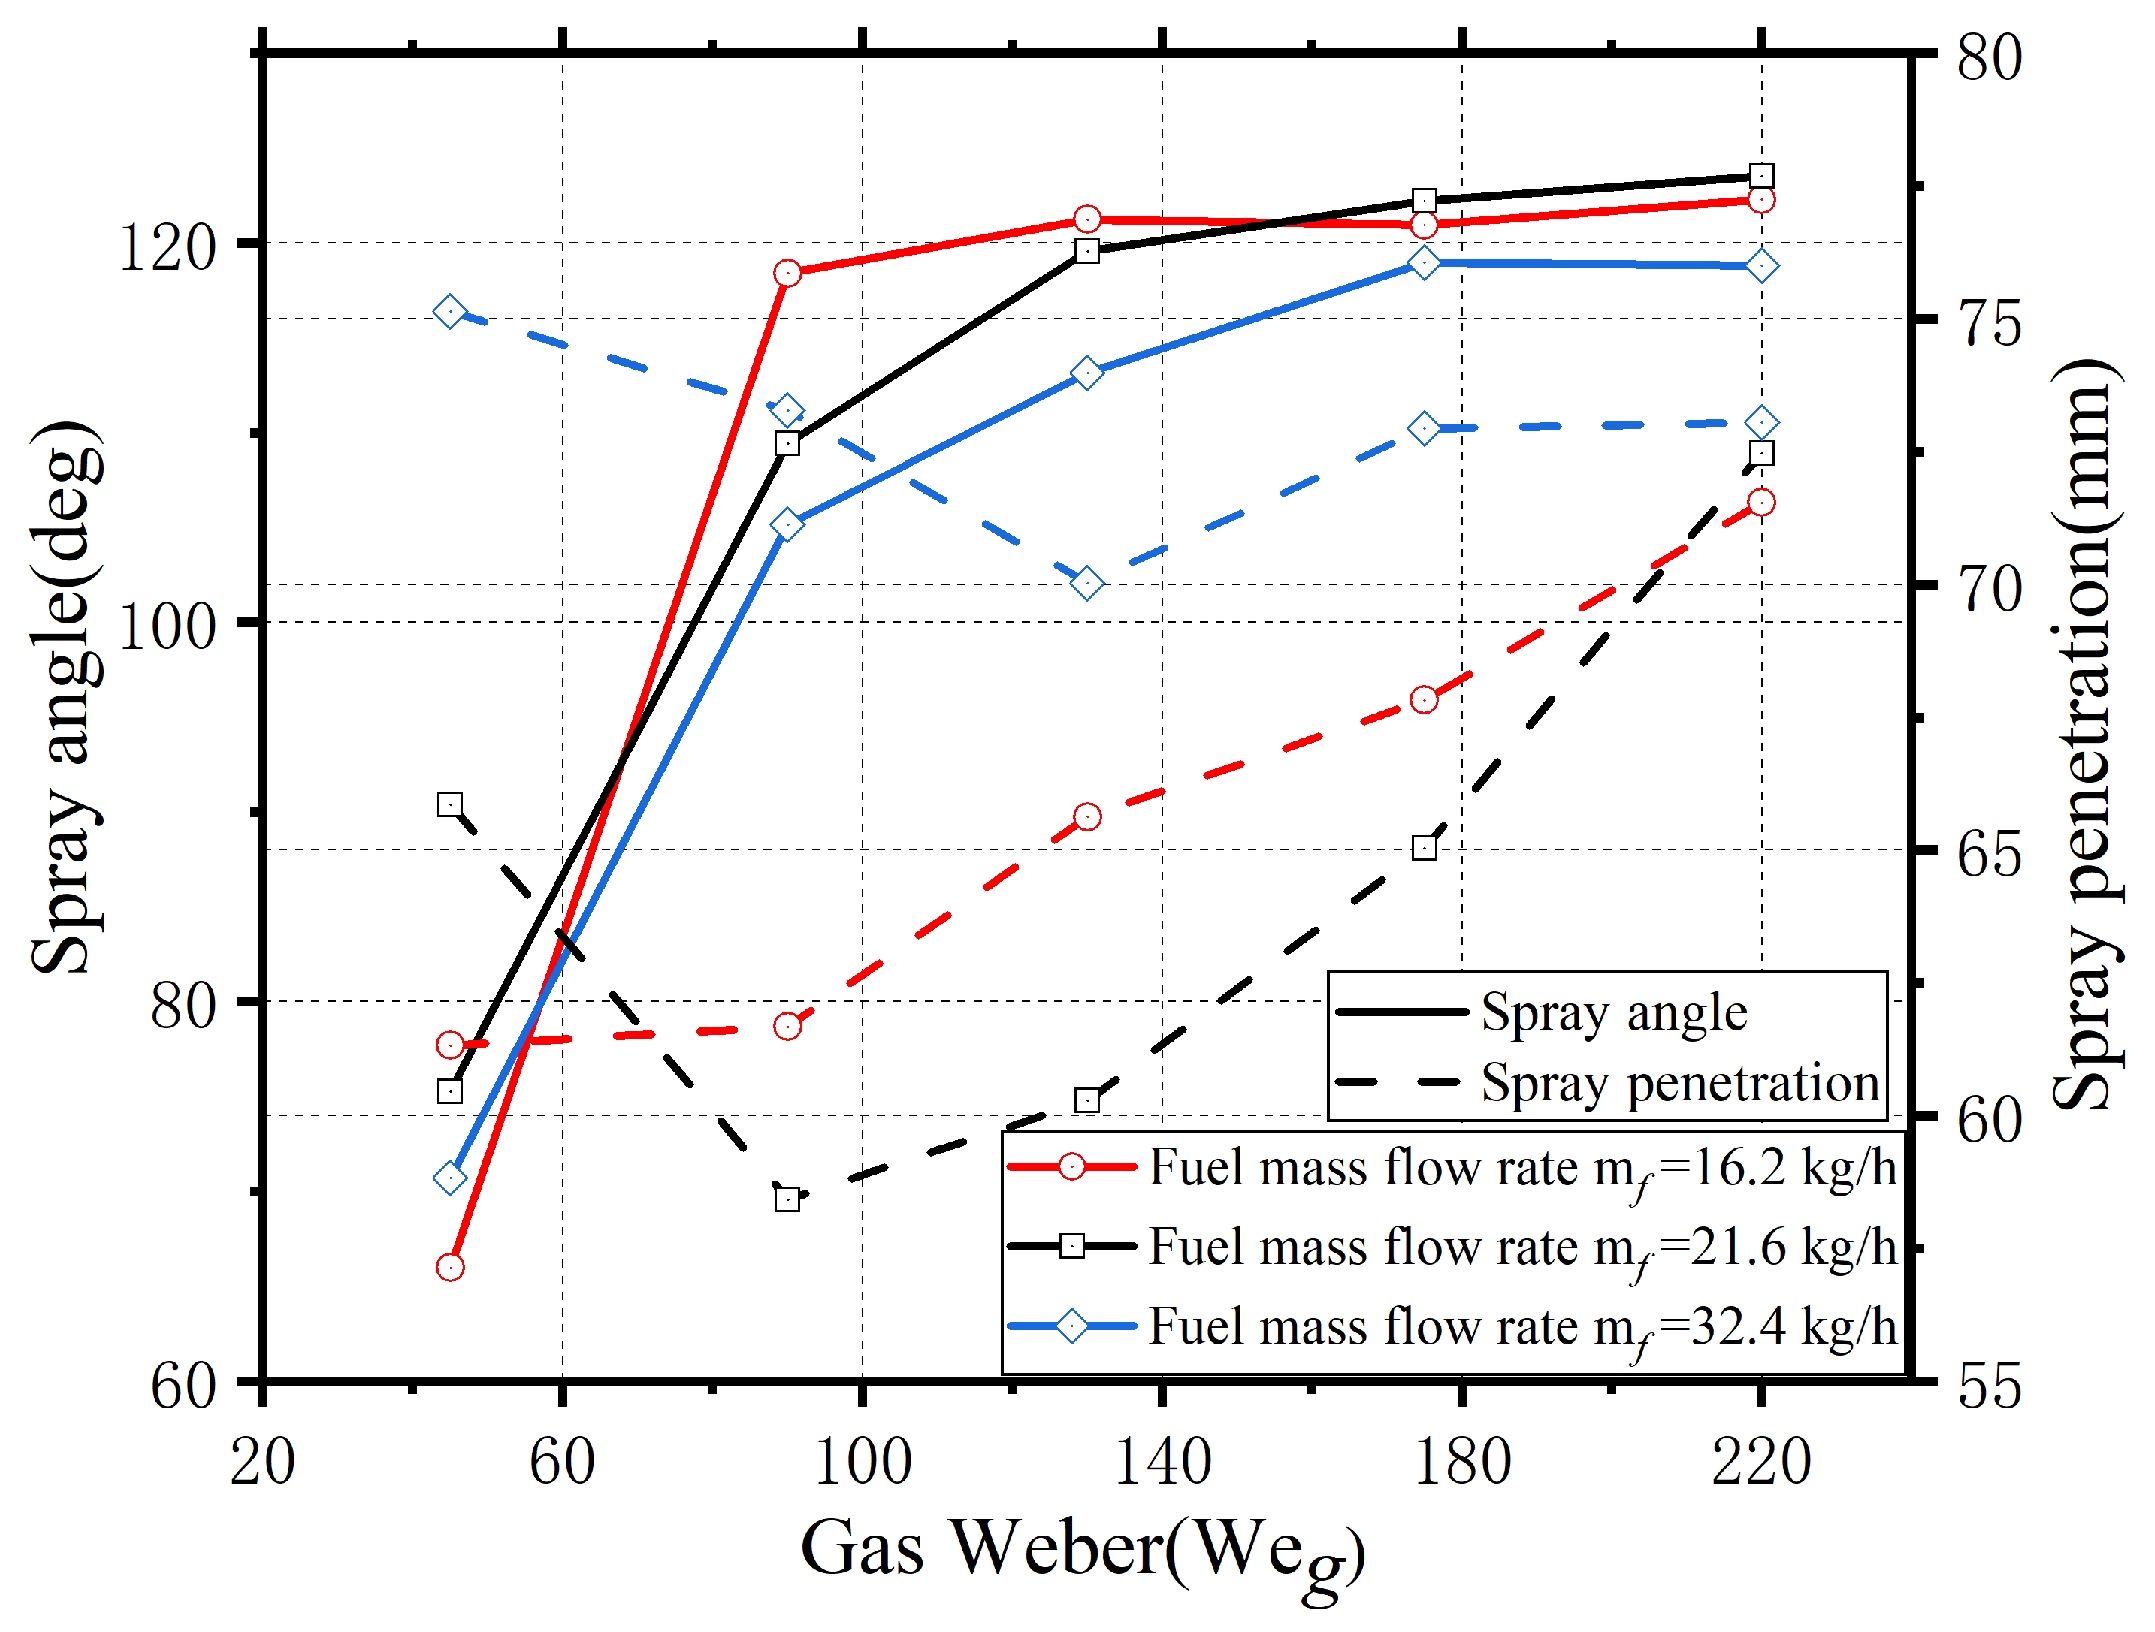
3.2.2. Main Stage Spray
3.3. Droplet Size Distribution
3.3.1. SMD of Pilot Stage
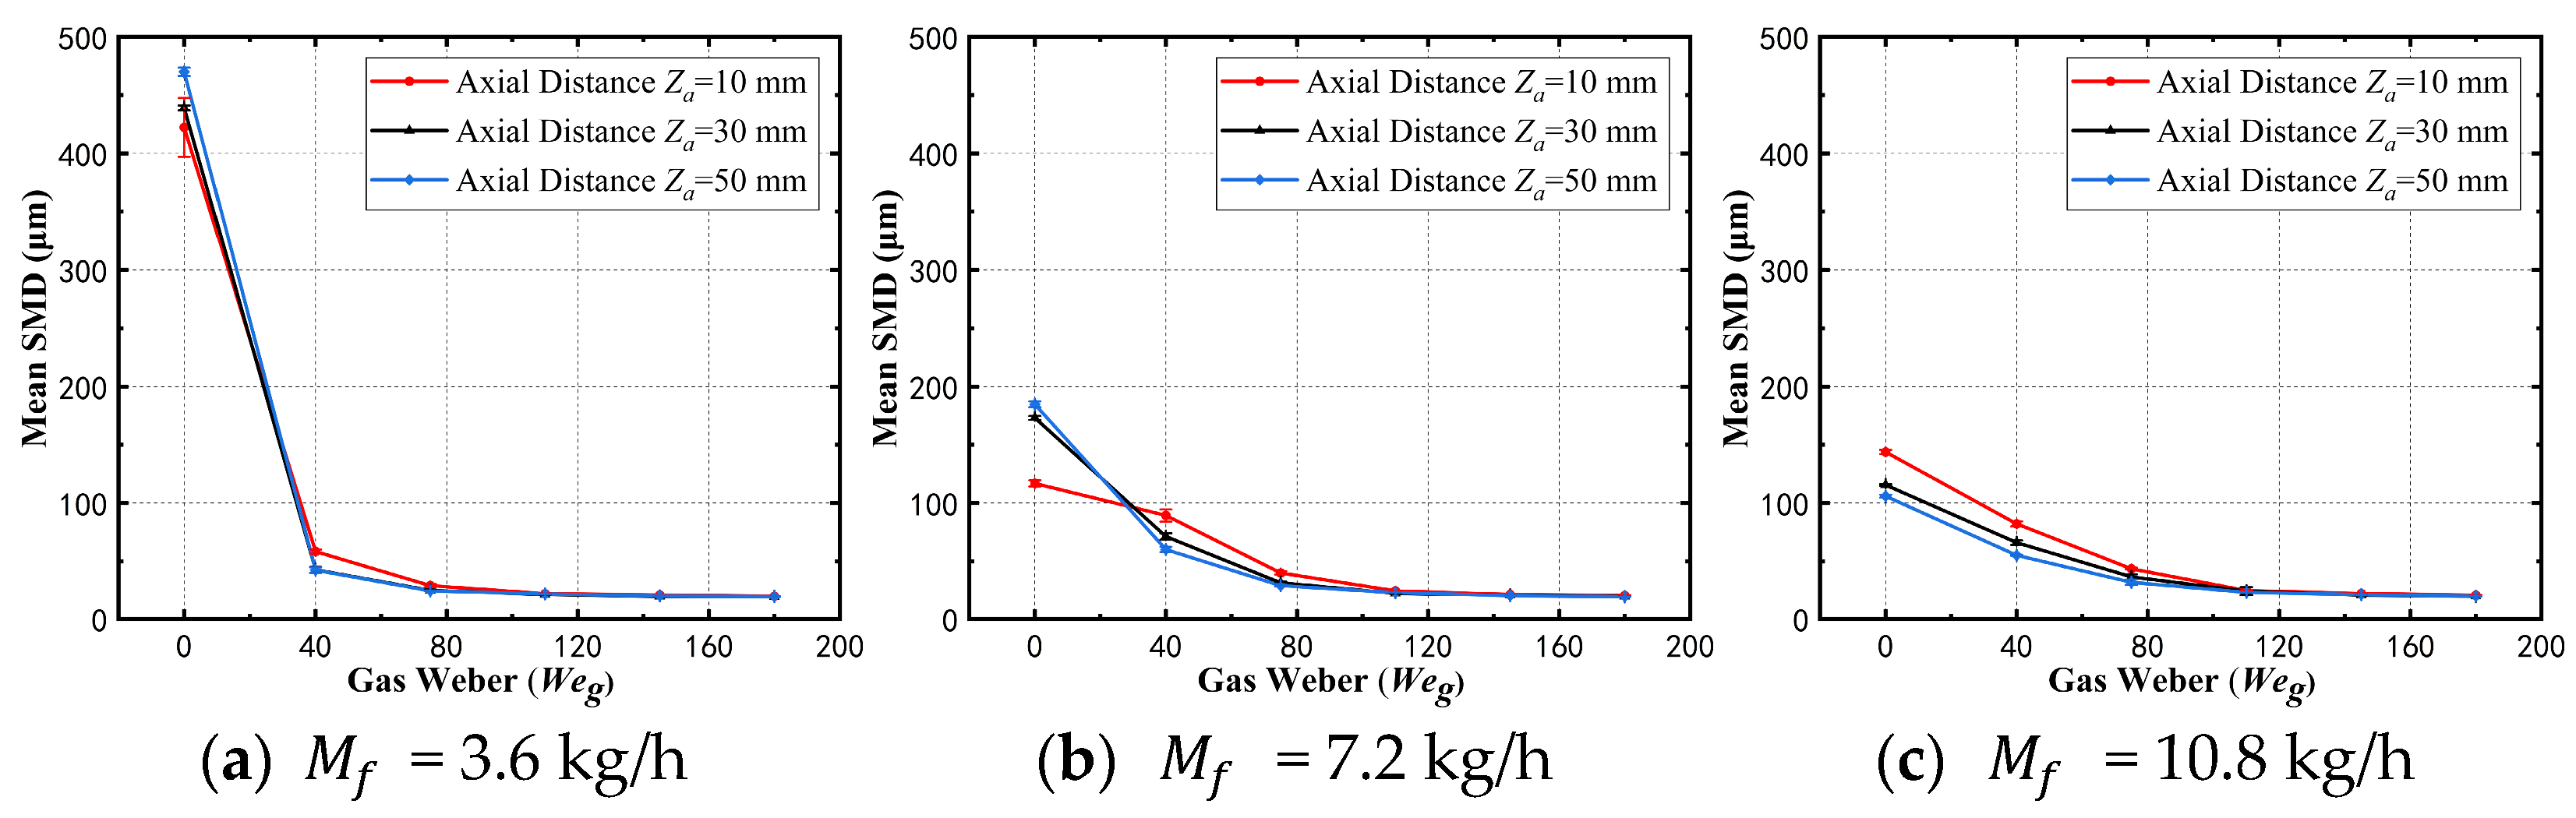
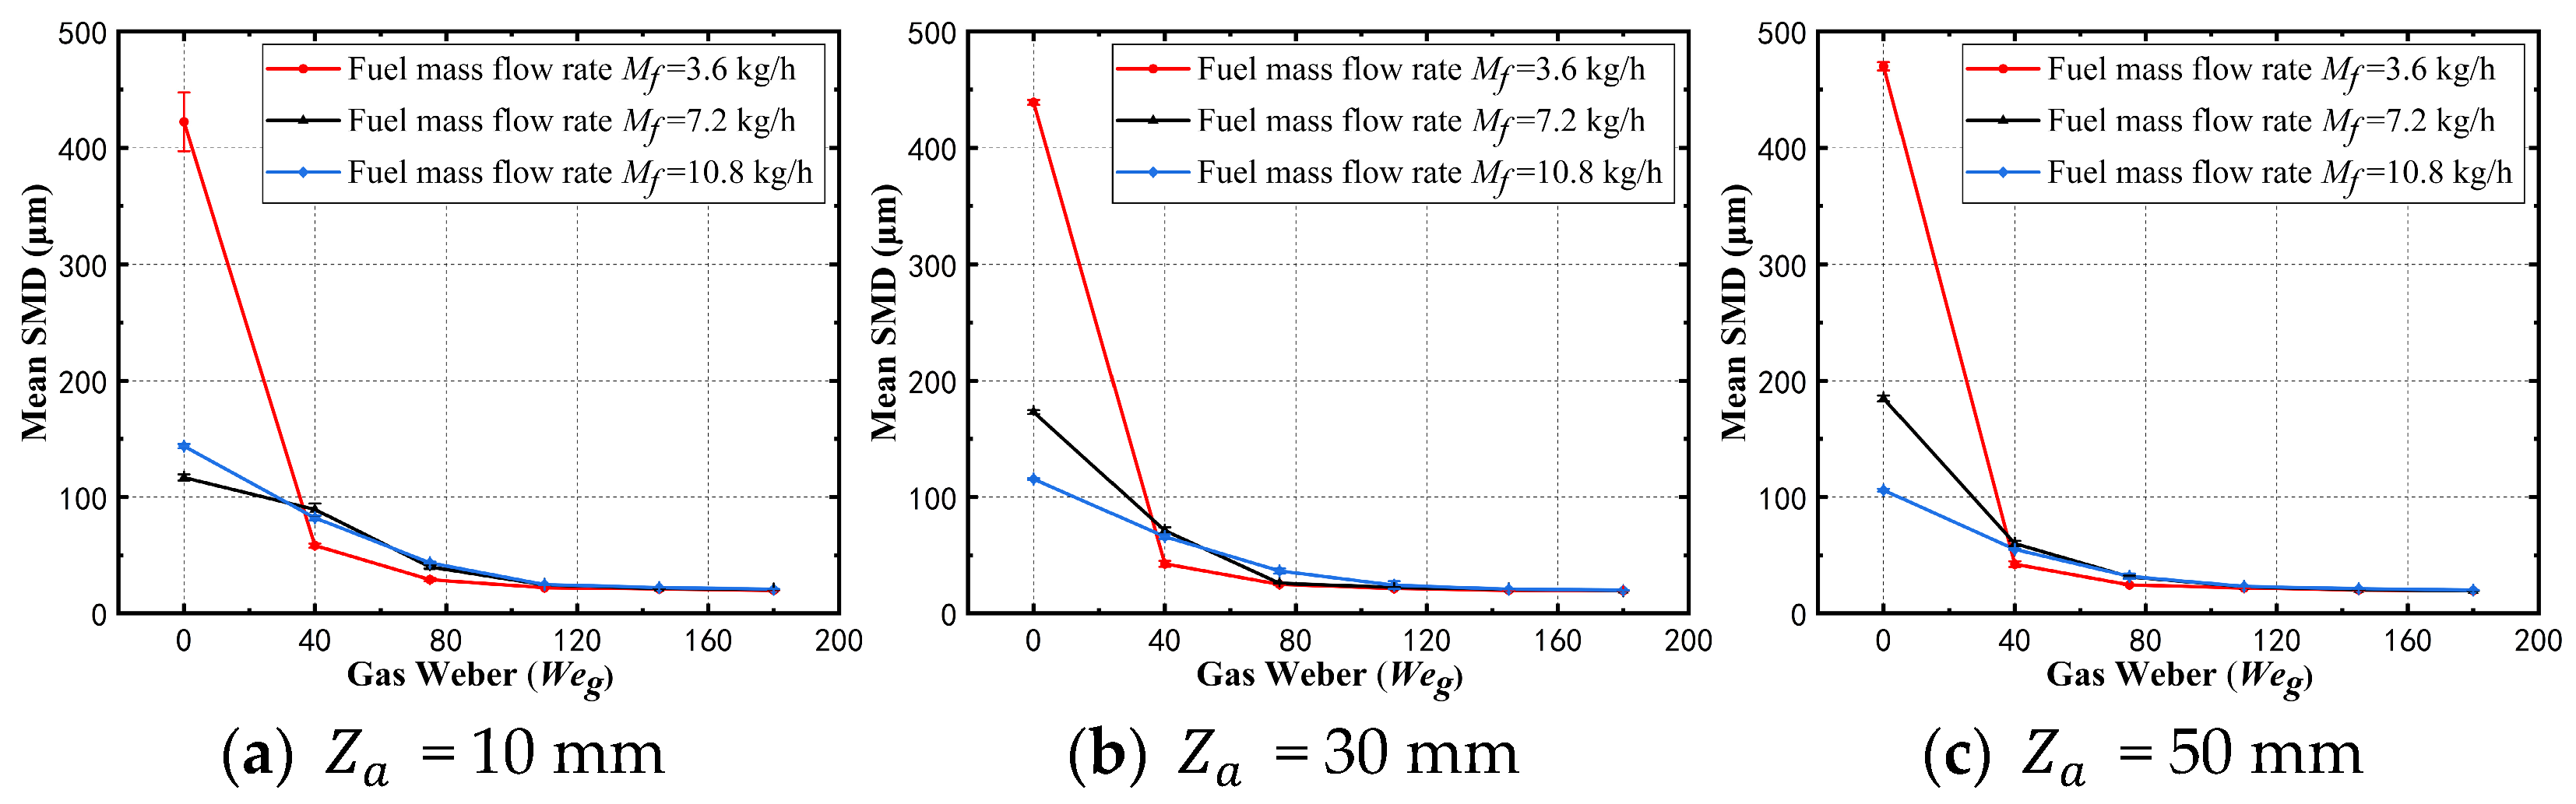
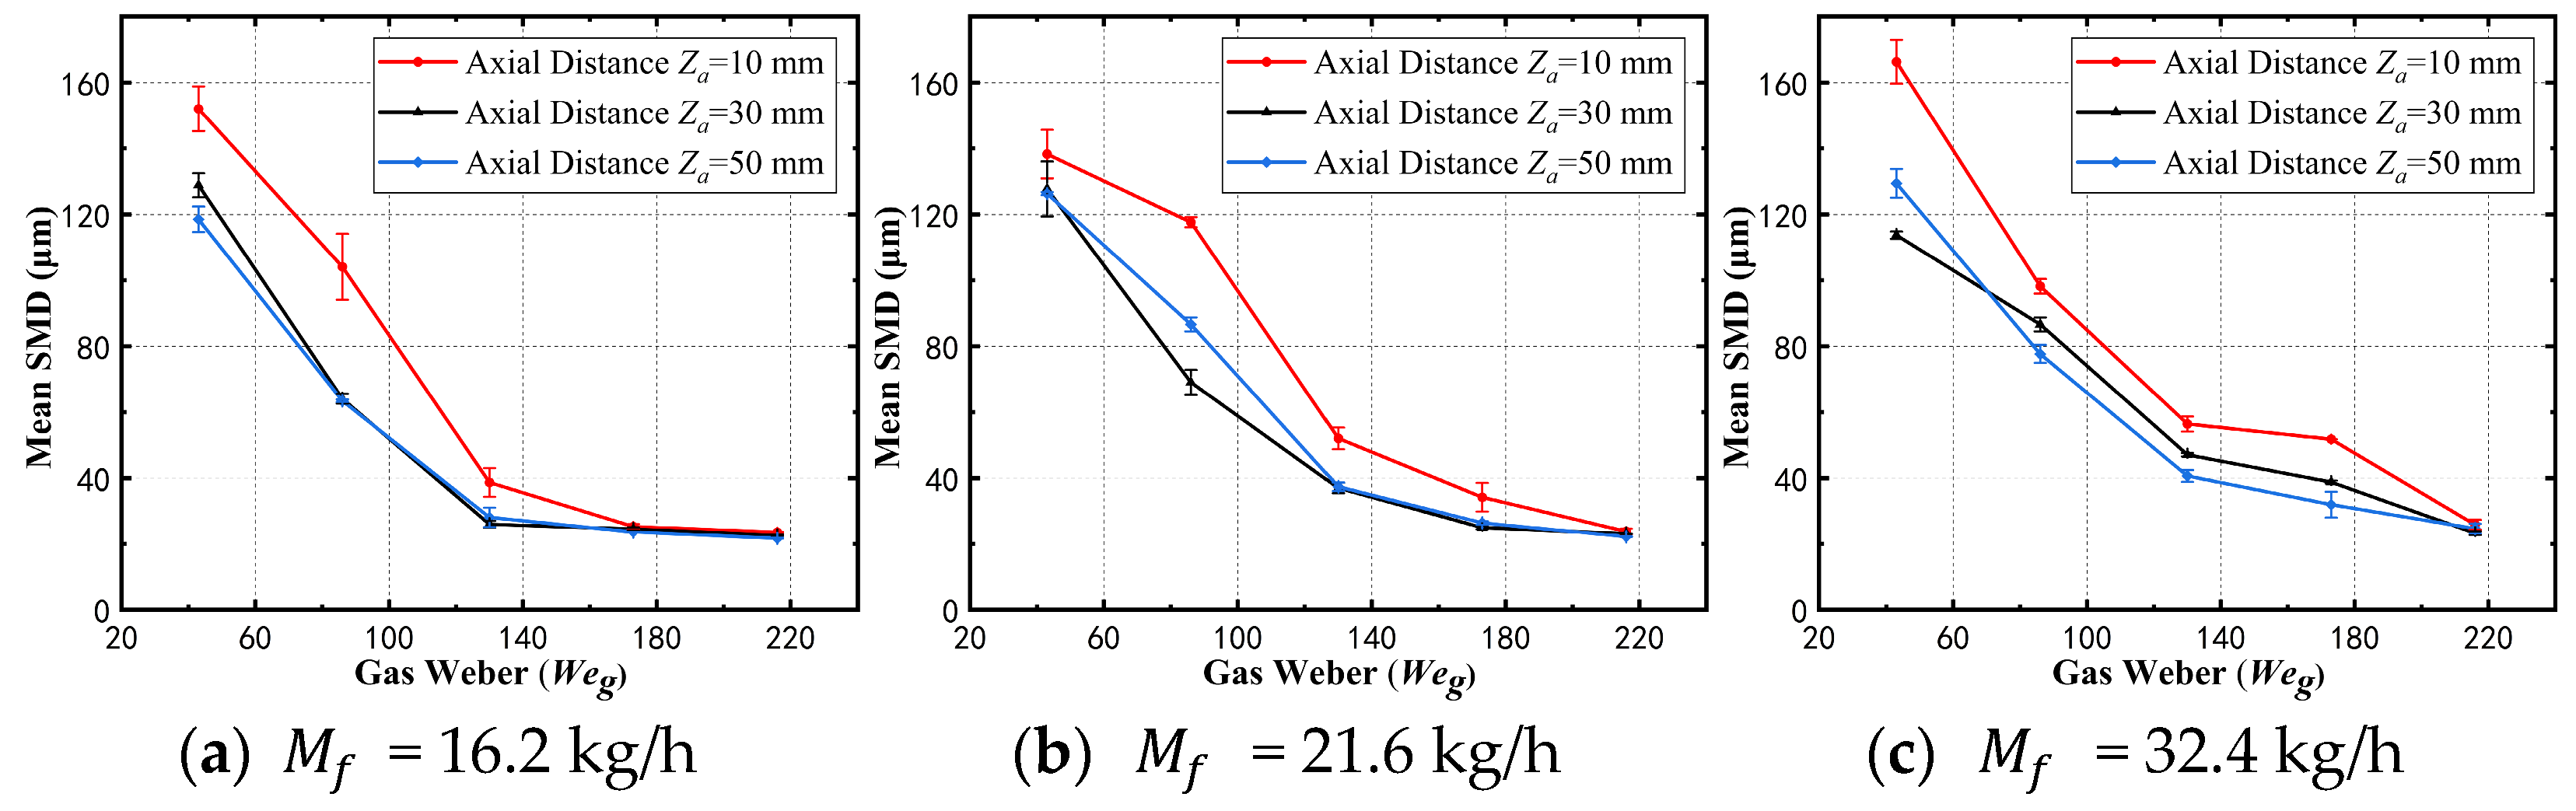
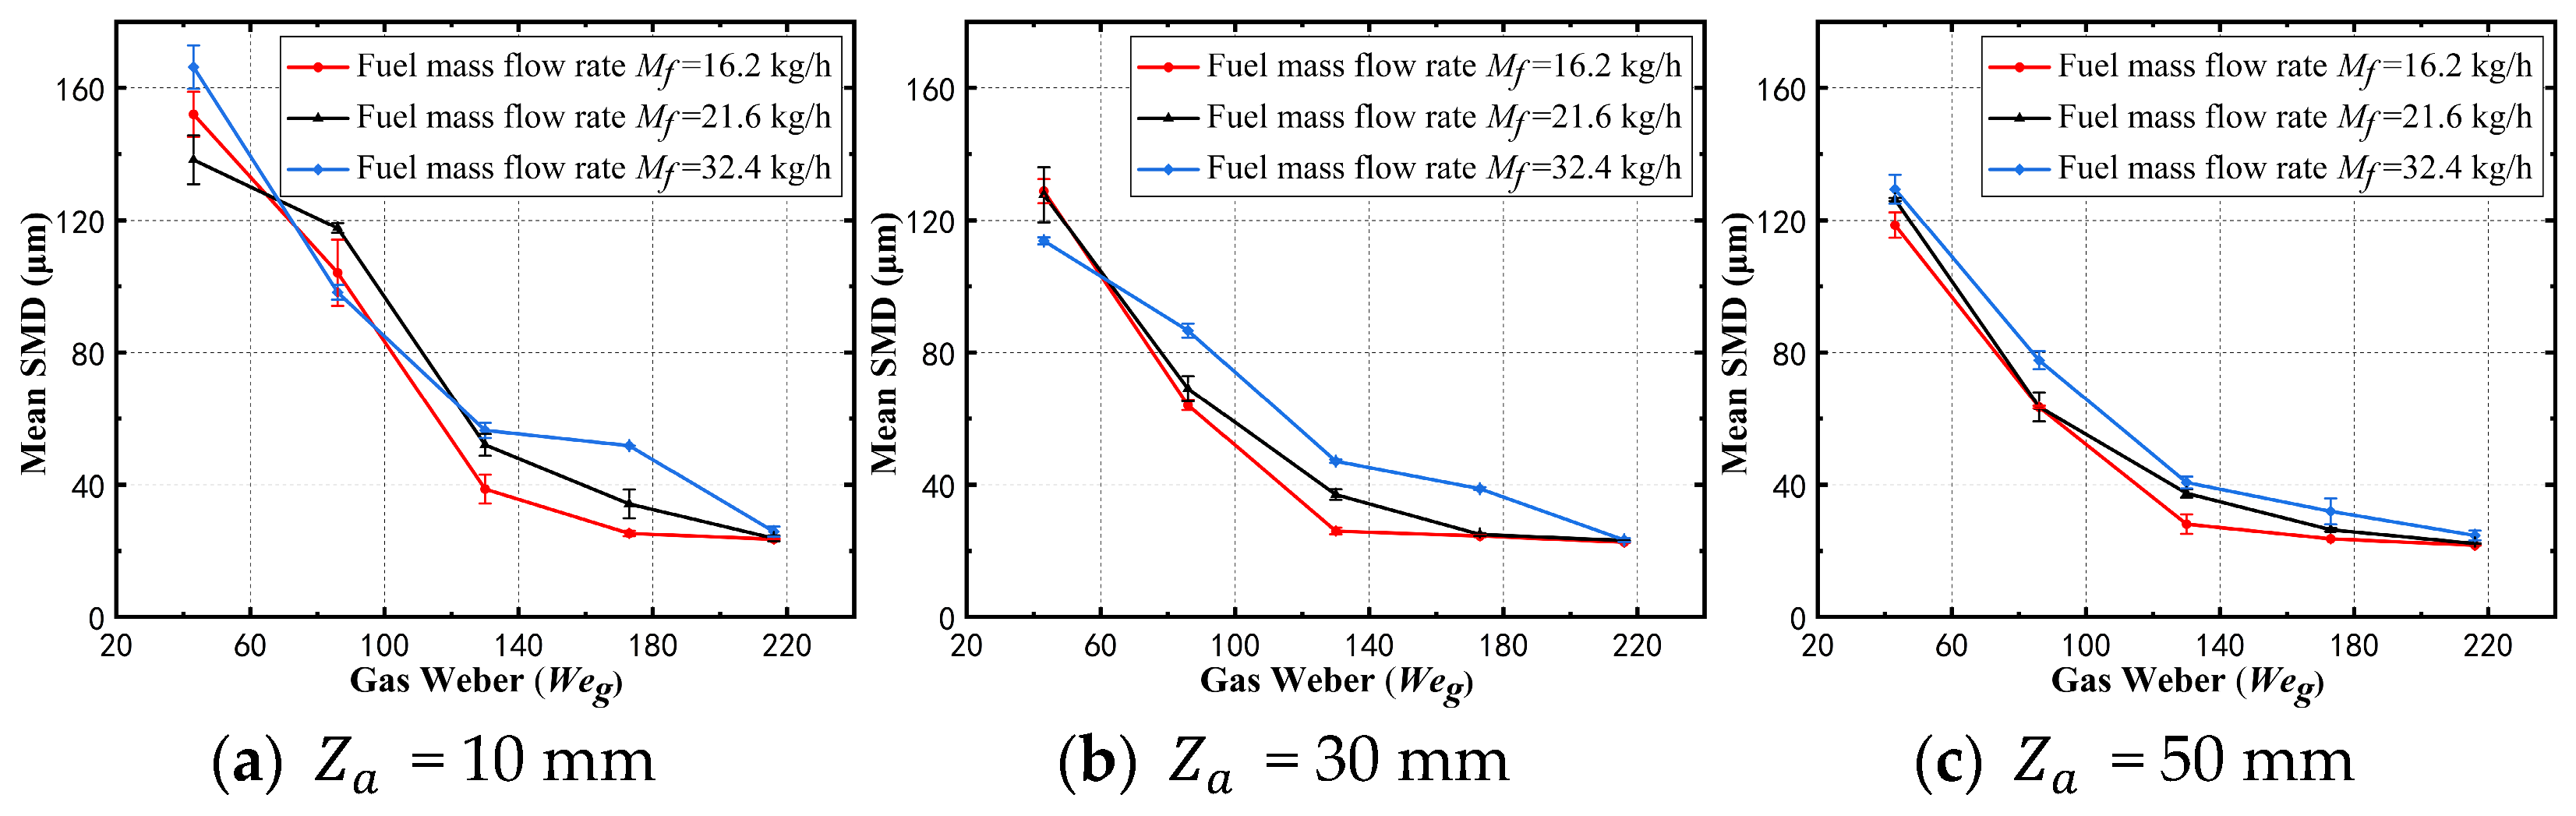
3.3.2. Main Stage SMD
4. Conclusions
- (1)
- For dual-stage swirl flow field, the air velocity distribution is non-uniform, particularly in the central upstream region, where velocity variations are more pronounced. The flow field exhibits a tendency to contract toward the center along the axial downstream. The velocity of the flow field is primarily concentrated between axial positions Z = 5 mm and Z = 10 mm, where distinct lip recirculation zones (LRZs) and high-velocity swirling axial jet zones (SJZs) are observed.
- (2)
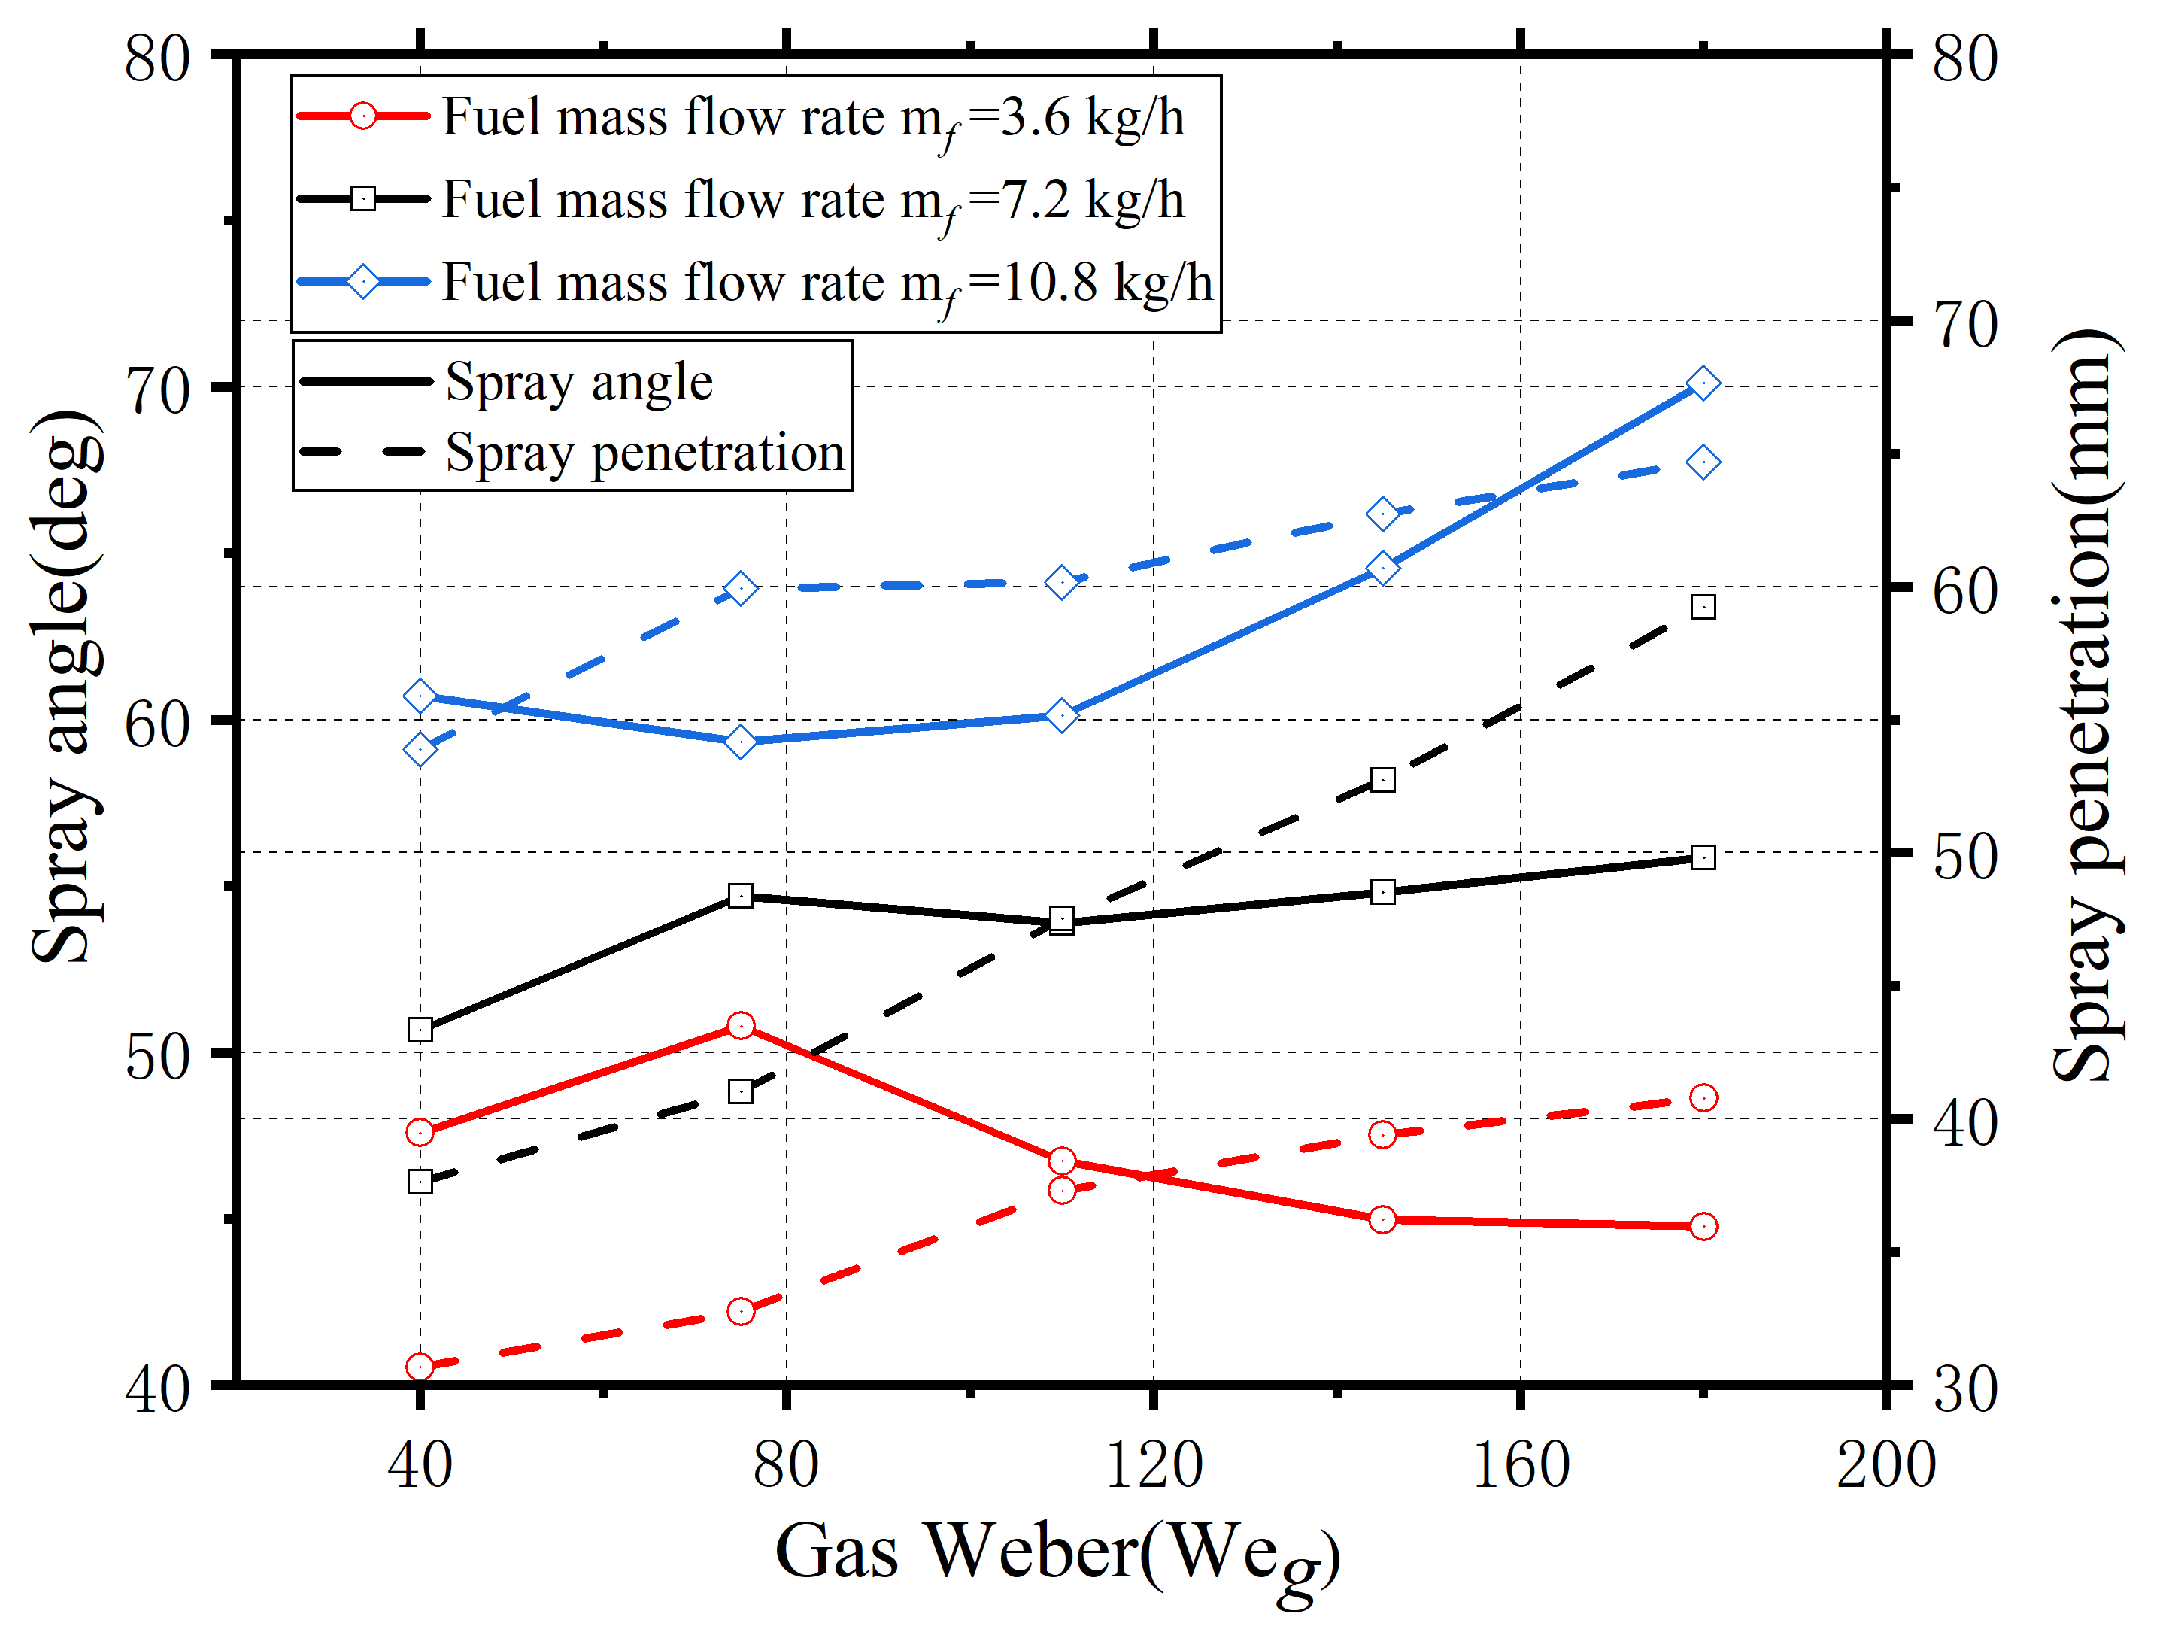
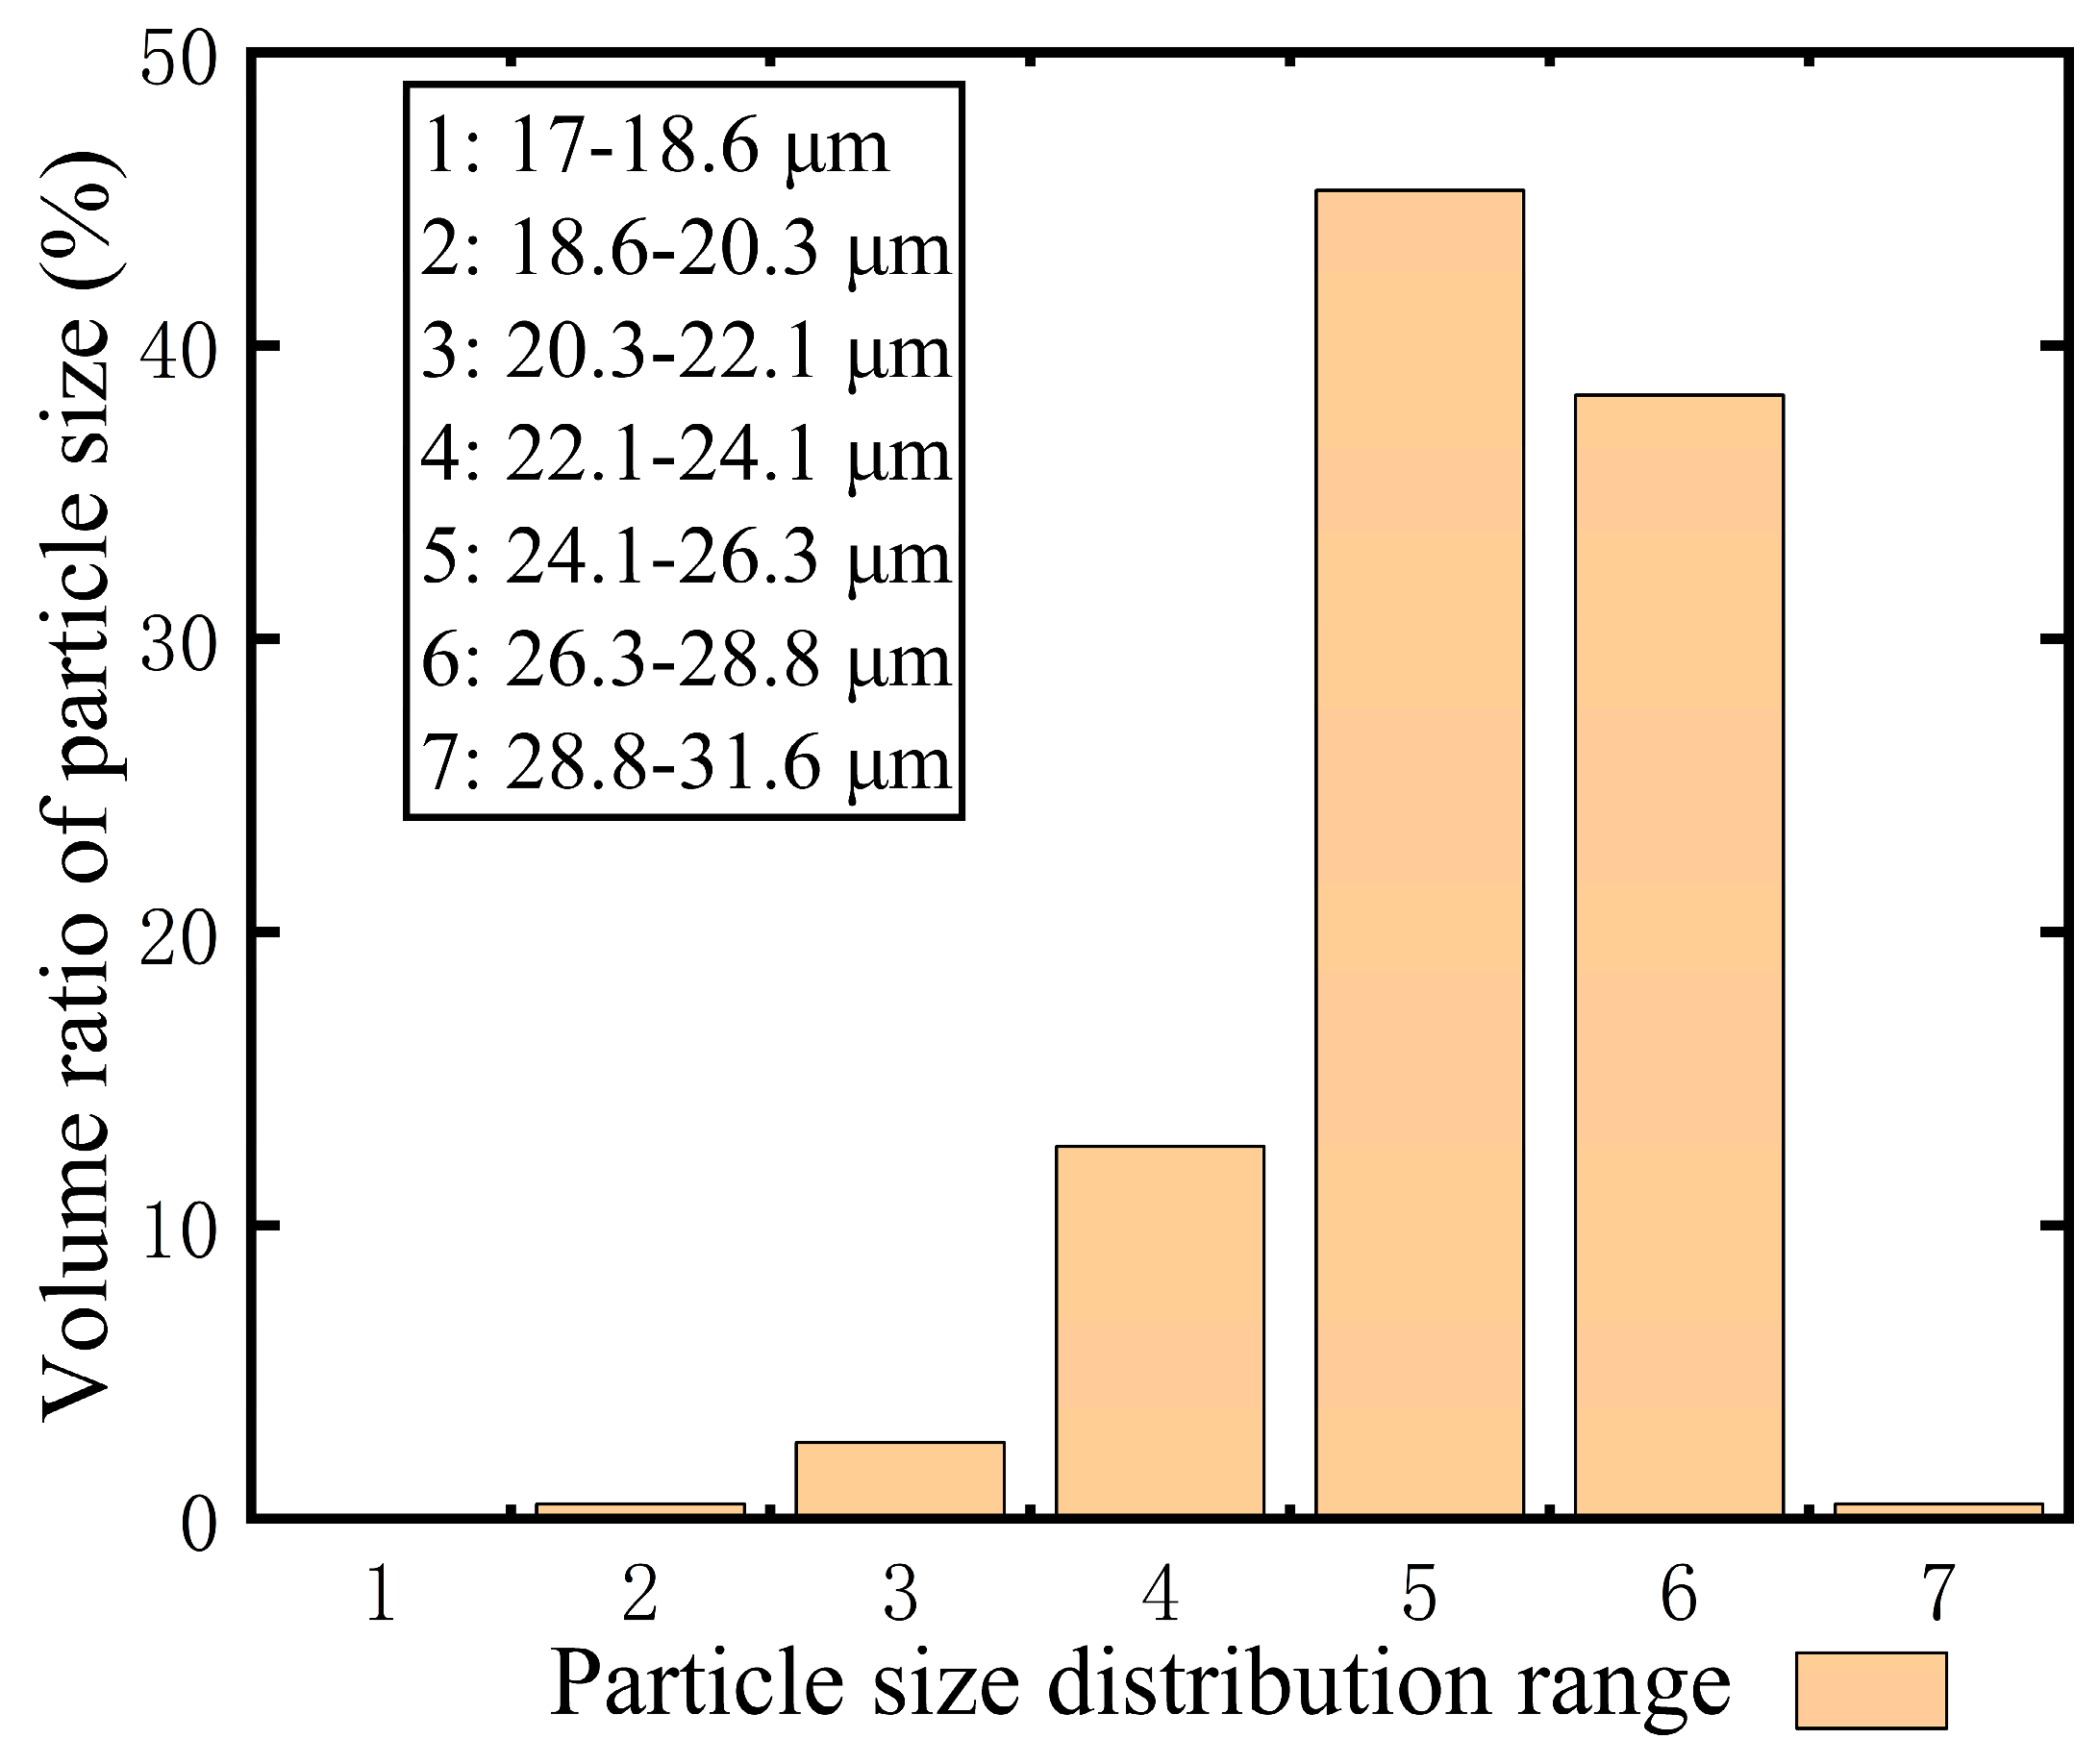
- The primary dimensionless parameters affecting spray penetration, spray cone angle, and droplet SMD are the liquid–gas momentum ratio () and the gas Weber number (). For the pilot stage spray, when the fuel injection velocity () is low, the spray cone angle does not increase monotonically with rising . Instead, when the gas shear effect on the fuel becomes too strong, the radial dispersion of the spray is suppressed, causing smaller droplets to follow the high velocity airstream. This inward contraction initially increases the spray cone angle before causing it to decrease. The spray penetration increases significantly with increasing . The SMD of the spray is influenced by , , and axial distance. At high pressure drops, the aerodynamic shear of the swirling airstream is sufficient to promote thorough fuel atomization, maintaining the SMD within an optimal range. As increases, when , the SMD stabilizes, indicating that the aerodynamic shear effect of the air swirl on the fuel has reached its maximum.
- (3)
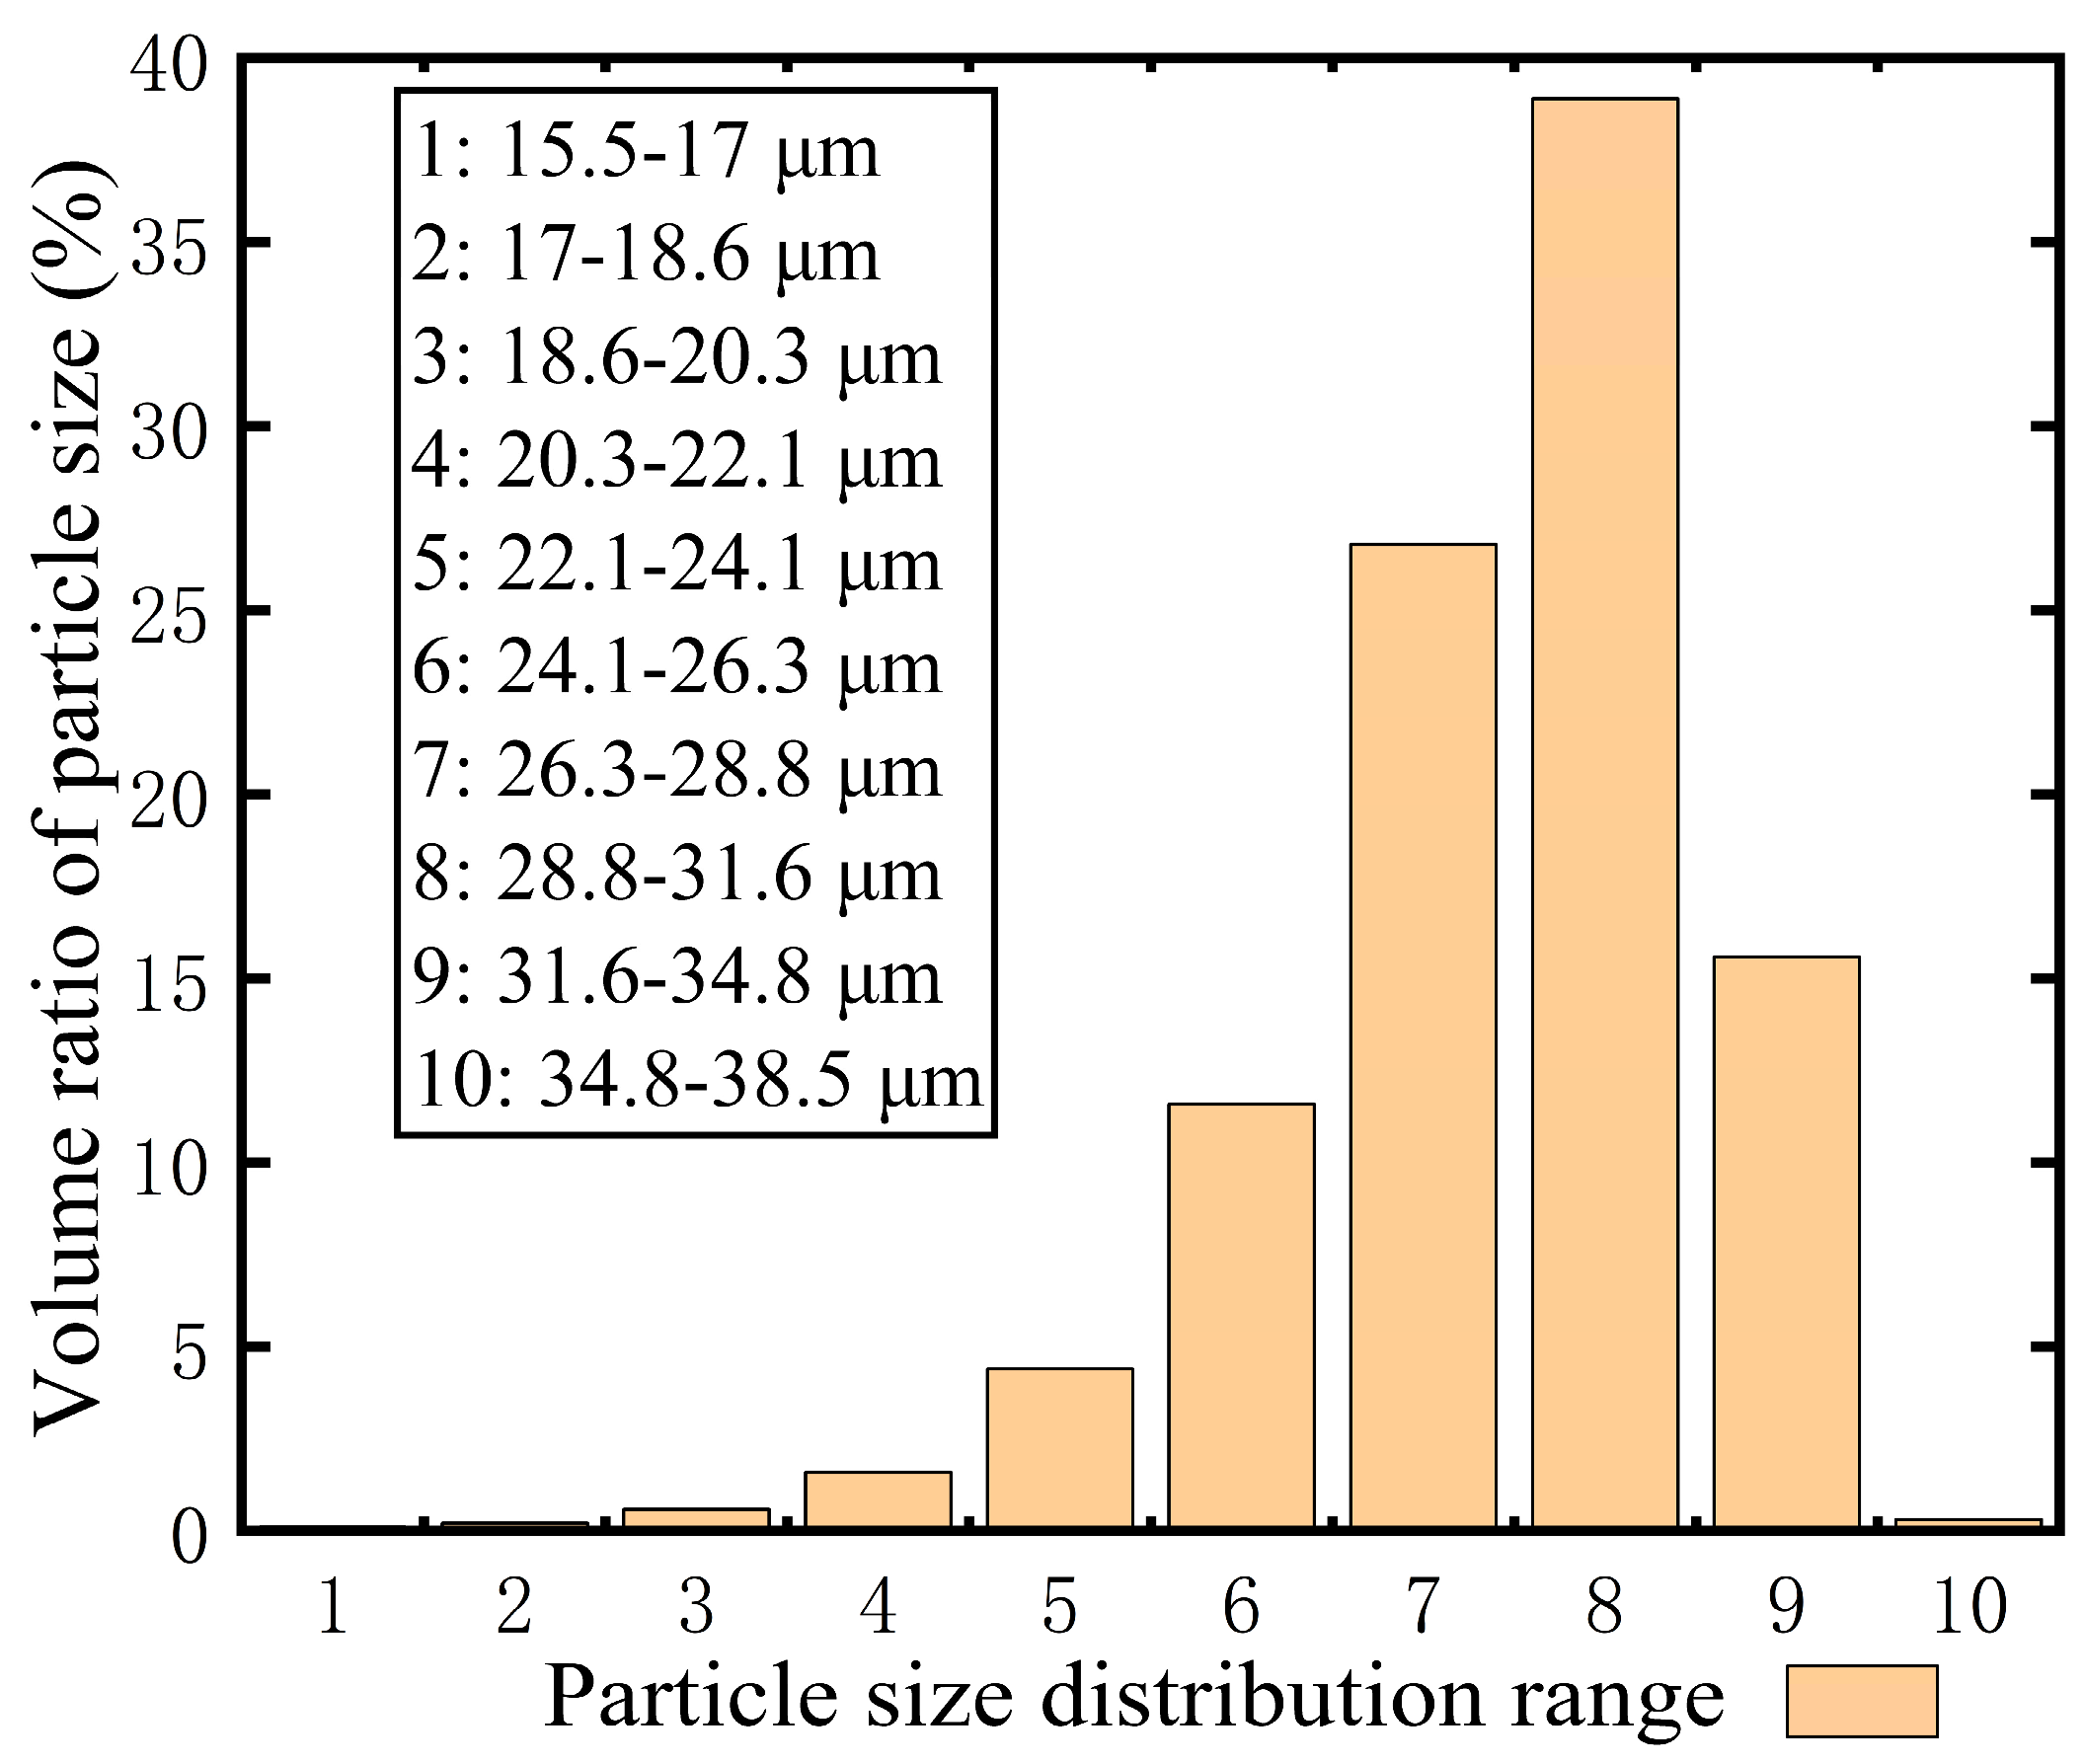
- For the main stage spray, when the is high, the penetration does not increase monotonically with rising . As aerodynamic shear intensifies, the jet breaks into progressively smaller droplets, causing to first increase and then decrease, which in turn results in an initial decrease followed by an increase in spray penetration. The variation trends in the spray characteristics of both the main and pilot stages are further confirmed by SMD measurements. For the main stage spray, greater initial momentum transfers the jet into a broader range, improving atomization. Additionally, the larger the axial position, the smaller its influence on SMD. Consequently, the swirl atomizer examined in this study achieves superior atomization within the lower operational conditions, providing a theoretical foundation and data support for the design of a high-performance swirl atomizer.
Author Contributions
Funding
Data Availability Statement
Conflicts of Interest
References
- Chang, C.T.; Holdeman, J.D. Low Emissions RQL Flametube Combustor Test Results. NTRS; 2001. Available online: https://ntrs.nasa.gov/api/citations/20030062196/downloads/20030062196.pdf (accessed on 1 April 2025).
- Dhanuka, S.K.; Temme, J.E.; Driscoll, J.F.; Mongia, H.C. Vortex-shedding and mixing layer effects on periodic flashback in a lean premixed prevaporized gas turbine combustor. Proc. Combust. Inst. 2009, 32, 2901–2908. [Google Scholar] [CrossRef]
- Tacina, R.; Wey, C.; Laing, P.; Mansour, A. Sector Tests of a Low NOx, Lean-Direct-Injection, Multipoint Integrated Module Combustor Concept. In Proceedings of the ASME Turbo Expo 2002: Power for Land, Sea, and Air, Amsterdam, The Netherlands, 3–6 June 2002; pp. 533–544. [Google Scholar]
- Candel, S. Combustion dynamics and control: Progress and challenges. Proc. Combust. Inst. 2002, 29, 1–28. [Google Scholar] [CrossRef]
- Yang, Z.; Breisacher, K.; Oyediran, A. Combustion-acoustic instability analysis of LPP combustor. II-Longitudinal modes. In Proceedings of the 38th Aerospace Sciences Meeting and Exhibit, Reno, NV, USA, 10–13 January 2000. [Google Scholar]
- Tacina, R.; Mao, C.-P.; Wey, C. Experimental investigation of a multiplex fuel injector module for low emission combustors. In Proceedings of the 41st Aerospace Sciences Meeting and Exhibit, Reno, NV, USA, 6–9 January 2003; p. 827. [Google Scholar]
- Liu, Y.; Sun, X.; Sethi, V.; Nalianda, D.; Li, Y.-G.; Wang, L. Review of modern low emissions combustion technologies for aero gas turbine engines. Prog. Aerosp. Sci. 2017, 94, 12–45. [Google Scholar] [CrossRef]
- Lazik, W.; Doerr, T.; Bake, S.; Bank, R.V.D.; Rackwitz, L. Development of Lean-Burn Low-NOx Combustion Technology at Rolls-Royce Deutschland. In Proceedings of the ASME Turbo Expo 2008: Power for Land, Sea, and Air, Berlin, Germany, 9–13 June 2008; pp. 797–807. [Google Scholar]
- Mosbach, T.; Sadanandan, R.; Meier, W.; Eggels, R. Experimental Analysis of Altitude Relight Under Realistic Conditions Using Laser and High-Speed Video Techniques. In Proceedings of the ASME Turbo Expo 2010: Power for Land, Sea, and Air, Glasgow, UK, 14–18 June 2010; pp. 523–532. [Google Scholar]
- Antoshkiv, O.; Bake, S.; Berg, H.-P. Spray Phenomena and their Influence on the Ignition Performance of a Modern Aeroengine Combustor. In Proceedings of the 22nd European Conference on Liquid Atomization and Spray Systems, Como Lake, Italy, 8–10 September 2008. [Google Scholar]
- Read, R.W.; Rogerson, J.W.; Hochgreb, S. Planar Laser-Induced Fluorescence Fuel Imaging During Gas-Turbine Relight. J. Propuls. Power 2013, 29, 961–974. [Google Scholar] [CrossRef]
- Feng, X.; Suo, J.; Li, Q.; Zheng, L. Modal Decomposition Study of the Non-Reactive Flow Field in a Dual-Swirl Combustor. Energies 2023, 16, 6182. [Google Scholar] [CrossRef]
- Wu, P.-K.; Kirkendall, K.A.; Fuller, R.P.; Nejad, A.S. Breakup processes of liquid jets in subsonic crossflows. J. Propuls. Power 1997, 13, 64–73. [Google Scholar] [CrossRef]
- Wu, P.-K.; Kirkendall, K.A.; Fuller, R.P.; Nejad, A.S. Spray structures of liquid jets atomized in subsonic crossflows. J. Propuls. Power 1998, 14, 173–182. [Google Scholar] [CrossRef]
- Lubarsky, E.; Shcherbik, D.; Bibik, O.; Gopala, Y.; Bennewitz, J.W.; Zinn, B.T. Fuel jet in cross flow-Experimental study of spray characteristics. In Advanced Fluid Dynamics; IntechOpen: London, UK, 2012; pp. 59–80. [Google Scholar]
- Tambe, S.B.; Jeng, S.-M. A Study of Liquid Jets Injected Transversely into a Swirling Crossflow. In Proceedings of the 21st Annual Conference on Liquid Atomization and Spray Systems, Zhenjiang, China, 23–26 October 2020. [Google Scholar]
- Patil, S.; Sahu, S. Liquid jet core characterization in a model crossflow airblast atomizer. Int. J. Multiph. Flow 2021, 141, 103688. [Google Scholar] [CrossRef]
- Eslamian, M.; Amighi, A.; Ashgriz, N. Atomization of Liquid Jet in High-Pressure and High-Temperature Subsonic Crossflow. AIAA J. 2014, 52, 1374–1385. [Google Scholar] [CrossRef]
- Lee, K.; Aalburg, C.; Diez, F.J.; Faeth, G.M.; Sallam, K.A. Primary Breakup of Turbulent Round Liquid Jets in Uniform Crossflows. AIAA J. 2007, 45, 1907–1916. [Google Scholar] [CrossRef]
- Patil, S.; Sahu, S. Breakup dynamics and near nozzle spray fluctuations in a twin-jet cross-flow airblast atomizer. At. Sprays 2019, 29, 217–250. [Google Scholar] [CrossRef]
- Hsiang, L.P.; Faeth, G.M. Near-limit drop deformation and secondary breakup. Multiph. Flow 1992, 18, 635–652. [Google Scholar] [CrossRef]
- Gong, X.; Choi, K.J.; Cernansky, N.P. Lean Direct Wall Injection Mode Atomization of Liquid Jets in Swirling Flow. J. Propuls. Power 2006, 22, 209–211. [Google Scholar] [CrossRef]
- Fujiwara, H.; Matsuura, K.; Shimodaira, K.; Hayashi, S.; Kobayashi, M.; Oda, T.; Horikawa, A.; Matsuyama, R.; Ogata, H.; Kinoshita, Y. Suppression of NOx Emission of a Lean Staged Combustor for an Aircraft Engine. In Proceedings of the ASME Turbo Expo 2011: Turbine Technical Conference and Exposition, Vancouver, BC, Canada, 6–10 June 2011. [Google Scholar]
- Sikroria, T.; Kushari, A.; Syed, S.; Lovett, J.A. Experimental Investigation of Liquid Jet Breakup in a Cross Flow of a Swirling Air Stream. J. Eng. Gas Turbines Power-Trans. ASME 2014, 136, 061501. [Google Scholar] [CrossRef]
- Song, J.; Cain, C.C.; Lee, J.G. Liquid Jets in Subsonic Air Crossflow at Elevated Pressure. In Proceedings of the ASME Turbo Expo: Turbine Technical Conference and Exposition, Düsseldorf, Germany, 16–20 June 2014. [Google Scholar]
- Fang, C.; Liu, Y.; Wang, S.; Liu, C.; Liu, F.; Yang, J.; Wang, K.; Mu, Y.; Xu, G.; Zhu, J. Aerodynamic effect on atomization characteristics in a swirl cup airblast fuel injector. Phys. Fluids 2023, 35, 103319. [Google Scholar] [CrossRef]
- Broumand, M.; Birouk, M. Liquid jet in a subsonic gaseous crossflow: Recent progress and remaining challenges. Prog. Energy Combust. Sci. 2016, 57, 1–29. [Google Scholar] [CrossRef]


| Test Cases | Ambient Pressure (kPa) | Ambient Temperature (K) | Air Pressure Drop |
|---|---|---|---|
| 1 | 101 | 288 | 1% |
| 2 | 101 | 288 | 2% |
| 3 | 101 | 288 | 3% |
| 4 | 101 | 288 | 4% |
| 5 | 101 | 288 | 5% |
| Test Cases | Pressure Drop | Gas Weber | Mass Flow Rate (kg/h) | Fuel Exit Velocity (m/s) | Liquid–Gas Momentum Ratio |
|---|---|---|---|---|---|
| 1 | 1% | 40 | 3.6/7.2/10.8 | 0.76/1.62/2.43 | 13/27/40 |
| 2 | 2% | 75 | 3.6/7.2/10.8 | 0.76/1.62/2.43 | 9/19/28 |
| 3 | 3% | 110 | 3.6/7.2/10.8 | 0.76/1.62/2.43 | 7/15/23 |
| 4 | 4% | 145 | 3.6/7.2/10.8 | 0.76/1.62/2.43 | 6/13/20 |
| 5 | 5% | 180 | 3.6/7.2/10.8 | 0.76/1.62/2.43 | 6/12/18 |
| Test Cases | Pressure Drop | Gas Weber | Mass Flow Rate (kg/h) | Fuel Jet Velocity (m/s) | Liquid–Gas Momentum Ratio |
|---|---|---|---|---|---|
| 1 | 1% | 45 | 16.2/21.6/32.4 | 3.43/4.58/6.86 | 56/75/112 |
| 2 | 2% | 90 | 16.2/21.6/32.4 | 3.43/4.58/6.86 | 40/53/79 |
| 3 | 3% | 130 | 16.2/21.6/32.4 | 3.43/4.58/6.86 | 32/43/65 |
| 4 | 4% | 175 | 16.2/21.6/32.4 | 3.43/4.58/6.86 | 28/37/56 |
| 5 | 5% | 215 | 16.2/21.6/32.4 | 3.43/4.58/6.86 | 25/33/50 |
Disclaimer/Publisher’s Note: The statements, opinions and data contained in all publications are solely those of the individual author(s) and contributor(s) and not of MDPI and/or the editor(s). MDPI and/or the editor(s) disclaim responsibility for any injury to people or property resulting from any ideas, methods, instructions or products referred to in the content. |
© 2025 by the authors. Licensee MDPI, Basel, Switzerland. This article is an open access article distributed under the terms and conditions of the Creative Commons Attribution (CC BY) license (https://creativecommons.org/licenses/by/4.0/).
Share and Cite
Jiang, W.; Qi, Z.; Yang, J.; Mei, D.; Wang, K.; Liu, Y.; Wang, S.; Liu, F.; Mu, Y.; Liu, C.; et al. Study on Swirling Flow and Spray Characteristics of Central Stage Direct Injection Combustor. Energies 2025, 18, 2926. https://doi.org/10.3390/en18112926
Jiang W, Qi Z, Yang J, Mei D, Wang K, Liu Y, Wang S, Liu F, Mu Y, Liu C, et al. Study on Swirling Flow and Spray Characteristics of Central Stage Direct Injection Combustor. Energies. 2025; 18(11):2926. https://doi.org/10.3390/en18112926
Chicago/Turabian StyleJiang, Wenjie, Ziyu Qi, Jinhu Yang, Deqing Mei, Kaixing Wang, Yushuai Liu, Shaolin Wang, Fuqiang Liu, Yong Mu, Cunxi Liu, and et al. 2025. "Study on Swirling Flow and Spray Characteristics of Central Stage Direct Injection Combustor" Energies 18, no. 11: 2926. https://doi.org/10.3390/en18112926
APA StyleJiang, W., Qi, Z., Yang, J., Mei, D., Wang, K., Liu, Y., Wang, S., Liu, F., Mu, Y., Liu, C., & Xu, G. (2025). Study on Swirling Flow and Spray Characteristics of Central Stage Direct Injection Combustor. Energies, 18(11), 2926. https://doi.org/10.3390/en18112926