1. Introduction
Environmental sustainability and energy independence are increasingly important; consequently, renewable energy sources (RESs) now occupy a central role in modern power generation. From wind turbines to photovoltaic panels, renewable energy technologies have emerged as the vanguards of a cleaner, more sustainable energy future. However, as we embrace the promise of renewables, a pressing challenge emerges: the intermittent and variable nature of wind, solar, and other RESs. This inconsistency in energy production necessitates a breakthrough solution, and that solution is energy storage technology. Therefore, efficient storage of energy generated from renewable sources is becoming increasingly critical. This energy can be stored in a variety of ways, ranging from its conversion to fuel (e.g., hydrogen) for later use (e.g., in fuel cells) [
1,
2,
3] to simply using batteries of various types.
The demand for energy storage in the context of RES applications has never been greater. As we endeavor to reduce our reliance on fossil fuels, we must confront the inherent unpredictability of nature. The sun sets, the wind stops, and yet our energy needs remain constant. This is where energy storage comes to the rescue, providing a bridge between intermittent energy generation and uninterrupted power supply. Recent developments in solar-assisted compressed air energy storage (CAES) systems have demonstrated improved thermodynamic performance and environmental benefits, particularly in eliminating carbon emissions through adiabatic integration techniques [
4].
This article explores hydraulic gas compression energy storage technology as a promising alternative for small- and medium-scale applications. The storage and energy recovery cycle is generally performed using fluid flow machines, such as pumps and turbines. The storage mechanism is gas compression and decompression via a liquid medium. Important topics to consider are heat management and working medium selection for optimal performance.
A novel approach to waste recovery is the liquid piston engine, a variant of the Stirling engine [
5]. This concept, initially introduced in 1971 and known as the Fluidyne engine [
6], has undergone various modifications [
7,
8,
9]. Slavin and others [
7] suggested an engine design featuring offset heat exchangers, diverging from traditional heater and cooler designs. This layout was first reported by another study. Additionally, a numerical model was developed to simulate the engine’s working cycle, helping to identify key design parameters. Although this energy conversion method shows promise, its practical implementation faces challenges, such as valve timing and component sealing issues, including those in hydro turbines. Innovative shell-and-tube latent heat thermal energy storage (LHTES) configurations with arched fins have shown significant enhancement in melting rates and thermal uniformity [
10].
Similarly, the application of Y-shaped fins in vertical thermal storage units has demonstrated superior heat transfer efficiency and system compactness [
11].
The model described in [
12] focuses on the heat transfer processes and water level movements in a water tank during a pumping cycle. It examines a small element within the tank, which experiences different temperatures and media (water and hot vapor) at various stages of the cycle. The model simplifies the temperature profile of the medium for mathematical ease and makes several assumptions, such as constant thermal properties of materials, initial ambient temperature conditions, and uniform medium temperatures. The heat transfer coefficients are estimated using the Nusselt equation for vapor condensation on a vertical surface, with specific values provided, though their impact on heat loss is considered negligible. The model aims to evaluate the temperature response of the element within the tank under these conditions.
The research focused on developing low-cost, low-head, small water volume solar-powered pumps suitable for developing countries is proposed in [
13]. Various solar collector configurations were tested, with the most efficient being a trapezoidal collector, achieving 70% efficiency at pump operating temperatures. The pumps, simple in construction and requiring minimal technical skills, primarily involve a barrel, a metal cylinder, a flash boiler, two check valves, and basic plumbing. The Model IV pump, for instance, uses a volatile liquid, excluding the flash boiler. The pumps are durable, with their lifespan mainly limited by metal–water corrosion, which can be mitigated. However, the use of cyclopentane raises concerns about water potability. The pumps vary in efficiency and cost, with the Model I pump being the most efficient but also the most expensive. The research later shifted to exploring higher temperature systems using a fixed-position trapezoidal trough collector, which could eliminate the need for low-boiling liquids like cyclopentane and use steam instead, suggesting a potential direction for further investigation.
The development and application of a dynamic mathematical model for a solar-powered liquid piston pump (see
Figure 1) is presented in [
14]. The model, which uses lumped elements to represent liquid flow and incorporates conservation of momentum and mass, effectively simulates heat transfer, and assumes saturated vapor and reversible internal processes. It solves a system of ordinary differential equations using the Runge–Kutta method, demonstrating qualitative characteristics like those observed in physical models. This model’s accuracy is yet to be fully verified against physical models, but it shows promise as a tool for evaluating the impact of design changes on pump performance. The model’s limitations, however, suggest that quantitative comparisons should be approached with caution.
The free liquid-piston engine compressor system is modeled as a lumped-parameter model in [
15,
16], focusing on states relevant for control, represented as a forced mass-spring-damper system. It employs a control volume approach to model pressure and temperature dynamics in combustion, expansion, and pump chambers, incorporating mass flow rates through six channels influenced by time-varying pressures. The model integrates the inertial dynamics of the liquid piston and combustion valve and applies the first law of thermodynamics for energy balance, involving net enthalpy flow, heat flux, and work performed by gas. Differential equations for pressure and temperature dynamics are derived, considering mass flow rates and specific heats.
The development of a dynamic model for a high-inertance free liquid piston marks a significant advancement in free-piston engine compressor technology [
17]. In this study, we discuss the validation and optimization of a high-intensity focused liquid piston compression (HIFLPC) model, comparing it with experimental data. Key parameters, such as combustion model constants and heat loss coefficients, were tuned based on prototype operation data, leading to a successful replication of various system behaviors like stroke duration and pressure changes. Additionally, a model-based study on liquid piston dynamics revealed the impact of piston dimensions and diaphragm stiffness on the system’s efficiency and power density. This study highlighted the delicate balance between different design elements, showing how changes in piston size and stiffness can significantly affect performance, with trade-offs between efficiency and power density.
The study [
18] presents a dynamic model for a liquid piston engine, emphasizing the importance of using a real gas model, specifically, the Peng–Robinson model, for accurate simulation (
Figure 2). This model is crucial for mapping the transformation of organic compounds, particularly in phase transformations. The engine comprises four main elements: vessels, an expander, and valves, each simulated with specific parameters and assumptions, such as adiabatic efficiency and isenthalpic throttling in valves. The model was validated against experimental data, showing a mere 2% discrepancy, indicating its reliability for understanding and optimizing system operations. Implemented in Aspen HYSYS software v2025.0, the model demonstrates potential for converting low-grade waste heat into electricity, although further detailed studies are needed for system optimization under various operating conditions.
Most liquid-piston studies model the “gas-pushes-liquid” configuration, where compressed gas displaces a liquid column to deliver hydraulic work (e.g., solar-driven water pumps or hydro-turbine priming units). No prior model addresses the inverse, “liquid-pushes-gas” cycle in which an incompressible liquid is actively driven into the pressure vessel to compress the gas and is later expelled by the expanding gas to recover work.
The present work is, therefore, the first dynamic model that simultaneously accomplishes the following:
Represents the liquid-driven gas compression/expansion loop with full mass-, momentum-, and energy-balance coupling, capturing the two-way piston motion that existing models omit.
Integrates regenerative thermal management by coupling the gas domain to an internal liquid spray/porous matrix so that the heat released during compression is stored in the liquid phase and returned during expansion, approaching near-isothermal behavior without external heaters or coolers.
Validates the above formulation against experimental GLIDES data, achieving <10% pressure and <5 °C temperature error, and conducts the first stability/error analysis for such a system.
By closing this modeling gap, this study provides a physics-based tool for designing reversible, thermally integrated liquid-piston CAES units—an application space that current “gas-pushes-liquid” models cannot address.
Recent developments in liquid compressed air energy storage (L-CAES) systems have been increasingly explored due to their potential for sustainable energy applications. However, despite the availability of studies focusing on various configurations of L-CAES—including those involving liquid pistons and integrated thermal management strategies—comprehensive comparative analyses remain limited. To reinforce the novelty of our approach, we emphasize that this work uniquely models a reversible process where a liquid compresses and subsequently expands gas, integrating intensive heat exchange to recover thermal energy across cycles. Unlike previous works that primarily focus on gas-driven liquid displacement, our study offers a new thermodynamic perspective supported by dynamic simulations. Furthermore, to enrich the context of our research, we have incorporated several recent studies [
10,
11,
12,
13] that examine modern advancements in similar systems, allowing for a broader understanding and positioning of our contribution within current technological progress.
2. Theory
In the realm of energy storage, innovation is the key to unlocking the full potential of renewable energy sources and enhancing the resilience of our electrical grids. One such innovative solution that has gained significant attention is the hydro-pneumatic energy storage system. This system comprises key components such as a hydraulic pump, hydraulic motor, accumulator, and directional valve, working in tandem to store and release energy efficiently and effectively. An example of such a system, which was considered in further analysis, is shown in
Figure 3. The general equations used in the mathematical model describing this system are shown below.
Continuity:
where
—mass of volume,
—mass flux into volume, and
—time.
Momentum:
where
—mass flux into volume,
—time,
—pressure,
—density,
—cross sectional flow area,
—velocity at boundary,
—fanning friction factor,
—pressure loss coefficient,
—equivalent diameter,
—length of mass element in the flow direction, and
—pressure differential acting across
.
Enthalpy:
where
—mass flux into volume,
—time,
—volume,
—pressure,
—heat transfer surface area,
—total specific enthalpy,
—heat transfer coefficient,
—fluid temperature,
—wall temperature, and
—total specific internal energy.
3. System Details
Figure 3 depicts the schematic arrangement of the proposed hydraulic energy storage system. The apparatus is engineered to utilize a liquid medium, predominantly water, to induce compression of a gaseous substance, customarily air, within a sealed storage tank, thereby effectuating energy storage. The storage tank serves as the reservoir for the gas, which is subjected to compression by the hydraulic action of the liquid piston. This vessel is a critical component of the system where the potential energy is amassed through the elevation in gas pressure. An electric motor energizes a pump, which is responsible for the translocation of the liquid from an ancillary external tank into the storage tank. The pump’s operation is pivotal to the system’s functionality, facilitating the transfer of liquid that acts as a piston to compress the gas, consequently storing energy. Incorporated into the system is a directional valve that governs the liquid’s trajectory.
During the energy accumulation phase, the valve is configured to channel the liquid into the storage tank, augmenting the pressure exerted on the gas. Conversely, during the discharge phase, the valve is manipulated to reroute the liquid towards the energy conversion devices, namely a reciprocating engine or a water turbine, to harness the previously stored energy. Although not explicitly illustrated in
Figure 3, the system integrates an energy release mechanism consisting of either a reciprocating engine or a water turbine. The energy discharge commences when the compressed gas expands, thereby propelling the liquid out of the storage tank. The directional valve orchestrates the liquid flow towards the engine or turbine, instigating the conversion of the stored potential energy into mechanical work, which can be subsequently transformed into electrical energy. The operation of the system is inherently reversible; energy is stored by pumping the liquid to induce gas compression within the tank, while energy is released when the pressurized gas is allowed to expand, driving the liquid through the engine or turbine, culminating in electricity generation.
3.1. Hydraulic Pump
The hydraulic pump is the central component of the hydraulic energy-storage system. This device plays a vital role in converting electrical energy into hydraulic potential energy. During periods of excess energy generation, the hydraulic pump springs into action. It draws surplus electrical energy from the grid and uses it to pressurize hydraulic fluid. This hydraulic fluid is typically incompressible, making it an ideal medium for storing energy over extended periods, as it does not suffer from self-discharge issues that can plague some battery technologies.
where
—real flow,
—ideal flow,
—volumetric efficiency,
—rotational speed, and
—displacement per revolution.
where
—pump power,
—pressure difference,
—volume flow rate, and
—total efficiency.
3.2. Hydraulic Motor
The hydraulic motor is the counterpart to the hydraulic pump. It is responsible for converting the stored hydraulic energy back into electrical energy when it is needed most. When grid demand increases, the hydraulic motor begins operating to meet the load. It takes the high-pressure hydraulic fluid and allows it to flow through a series of hydraulic turbines. This process transforms the hydraulic potential energy back into electrical energy, providing a stable and reliable power supply to the grid.
where
—real flow,
—ideal flow,
—volumetric efficiency,
—rotational speed, and
—displacement per revolution,
where
—pump power,
—pressure difference,
—volume flow rate,
—total efficiency,
—mass flow rate, and
—density.
3.3. Accumulator
The accumulator is a critical component of the hydraulic energy storage system, acting as a temporary energy reservoir. It stores pressurized hydraulic fluid, allowing for rapid energy release when required. This function is invaluable in situations where grid demand suddenly surges or when there is an interruption in renewable energy generation. The accumulator’s ability to release energy quickly helps to stabilize the grid, preventing brownouts or blackouts.
where
—heat flux from liquid,
—heat transfer coefficient for liquid,
—surface area for liquid,
—liquid temperature, and
—environment temperature
where
—heat flux from gas,
—heat transfer coefficient for gas,
—surface area for gas,
—gas temperature, and
—environment temperature.
3.4. Directional Valve
The directional valve serves as the flow controller in this hydraulic system. It directs the flow of hydraulic fluid between the hydraulic pump and motor, ensuring a seamless transition between the charging and discharging phases. When energy is being stored, the valve guides hydraulic fluid from the pump to the accumulator only. Conversely, when energy is needed, it redirects the flow from the accumulator to the hydraulic motor only. During the standstill phase, it disconnects the accumulator from the rest.
The system offers several notable advantages. First, it is highly scalable, making it adaptable for both small and large-scale energy storage applications. Second, it boasts an impressive energy storage capacity, capable of providing extended backup power when required. Third, the system is known for its durability and low maintenance requirements, ensuring a reliable and cost-effective solution for grid operators.
Within renewable-energy grid management, the hydraulic energy-storage system is a robust and versatile solution, consisting of the hydraulic pump, hydraulic motor, accumulator, and directional valve, and has proven to be a robust and versatile solution. As the transition to clean energy sources gains momentum, this technology is emerging as a cornerstone for maintaining grid stability and reliability, further advancing our journey toward a more sustainable and resilient energy future.
4. Assumptions and Boundary Conditions
A set of operational parameters for the hydraulic energy storage system is presented in
Table 1. A flow rate of 35 L/min is processed during the system’s charging and discharging phases, where the gas is compressed and energy is released, respectively. The containment of the gas is ensured by a storage tank with a volume of 2 cubic meters, establishing the limit for gas that can be effectively compressed. The system’s operational safety and efficacy are bound by a minimum tank pressure of 70 bars and a maximum tank pressure of 130 bars.
A baseline pressure of 1 bar is also indicated, likely representing the starting point for pressure measurements within the system. The efficiency of the pump and motor is ideally set at a value of 1.0, indicating a theoretical model where energy loss is nonexistent. A constant ambient temperature of 25 °C is maintained to ensure consistent operational conditions. The roles of the compressible gas and the liquid piston are filled by air and water, respectively, which are essential to the system’s functionality. These parameters are indicative of the prescribed design and the operational constraints under which the energy storage system, utilizing liquid-mediated gas compression, is to function.
5. Mathematical Model of Fluid Flow Machine Unit for a Small-Scale Compressed Gas Energy Storage System
GT-Suite [
19,
20,
21], a comprehensive simulation software tool that provides a multidisciplinary platform for the analysis of fluid flow, thermal, mechanical, electrical, magnetic, chemical, and control interactions in engineering systems, was used for building the model of the storage. It is widely employed for the design, optimization, and performance analysis of components and integrated systems in various engineering fields, such as automotive, aerospace, marine, and power generation. GT-Suite offers a wide array of capabilities, including 1D, quasi-3D, and full 3D computational fluid dynamics (CFDs), allowing for both component-level and system-level simulation. The software’s robust simulation environment is particularly well-suited for modeling internal combustion engines, vehicle drivelines, turbochargers, catalytic converters, heat exchangers, HVAC systems, and hydraulics, among other systems. GT-Suite’s integrated approach enables the coupling of different physical domains, providing a holistic view of system performance and interaction.
A schematic representation of a hydraulic simulation model, suitable for a module within simulation software GT-Suite, is depicted in
Figure 4. The movement of hydraulic fluid through the system is facilitated by a pump, which is placed at the lower left of the diagram and characterized by an RPM gauge to indicate that its rotational speed is monitored or controlled. Fluid is drawn into the pump from a supply line and is then propelled into the system, exiting through an outlet line that leads to an initial fluid reservoir, designated as ‘tank-1’. An accumulator, situated centrally within the diagram, acts as secondary storage for the pressurized hydraulic fluid, designed to mitigate fluctuations and absorb shocks within the system. Control over this accumulator is maintained by an accumulator control unit, suggesting automated regulation of its pressure capabilities. A motor is shown to the right, which is intended to be driven by the hydraulic fluid supplied by the pump, thus converting hydraulic energy into mechanical energy. The motor is equipped with inlet and outlet paths to manage the hydraulic fluid’s movement. Two integrators, named Integrator-1 and Integrator-2, are incorporated within the flow paths, likely tasked with the continuous summation of the fluid’s flow rate or other operational parameters for analytic or control feedback purposes. Control elements such as a potentiometer, located near the pump, and a directional control valve, attached to the accumulator, are indicative of the system’s adjustable flow rate and pressure capabilities. At the lower right of the diagram, a shaft leading to a load, symbolized by a zigzag line, suggests that the mechanical output of the motor is utilized to perform work on an external load. The intricate layout of the hydraulic system’s components and their interrelationships, as well as the dynamic management of fluid flow, are conveyed through the schematic, which underpins simulation analyses for optimizing performance and operational effectiveness within established parameters.
The developed model for the energy storage system, based on compression of gas with a liquid piston, was verified based on experimental data found in the literature [
22]. This system consists of several basic components: a water tank, a compressed gas cylinder, a Pelton turbine, and a piston pump, as shown in
Figure 5.
The water tank in our system serves as an energy storage medium. Compressed gas cylinders are used to store energy in the form of compressed gas. The Pelton turbine and reciprocating pump work together to convert the potential energy of water into mechanical and electrical energy when needed.
The system has a simple design, yet it operates efficiently. It uses excess energy (e.g., from renewable sources) to drive a reciprocating pump that lifts the water, storing the energy. When energy is needed, the water is released, driving a Pelton turbine, which, in turn, generates electricity.
The model was validated using experimental data, demonstrating its reliability and potential usefulness in practical applications. This is a step toward the development of efficient and environmentally friendly energy storage systems.
Table 2 presents model boundary conditions from the experimental setup by [
22]. The table shows variables with units and values for an experiment. Flow rate for charge and discharge measures at 4.4 L/min. The tank holds 287 L. The minimum tank pressure stands at 55 bars while the maximum reaches 97 bars. Lower tank pressure registers at 1 bar. The ambient temperature during the experiment remains at 21.7 °C. Air serves as the gas, with water as the liquid. The heat transfer coefficient while charging with a spray hits 500 W/(m
2 K). Without spraying while discharging, it falls to 50 W/(m
2 K). This information supports studies in energy research for replication and comparative analysis.
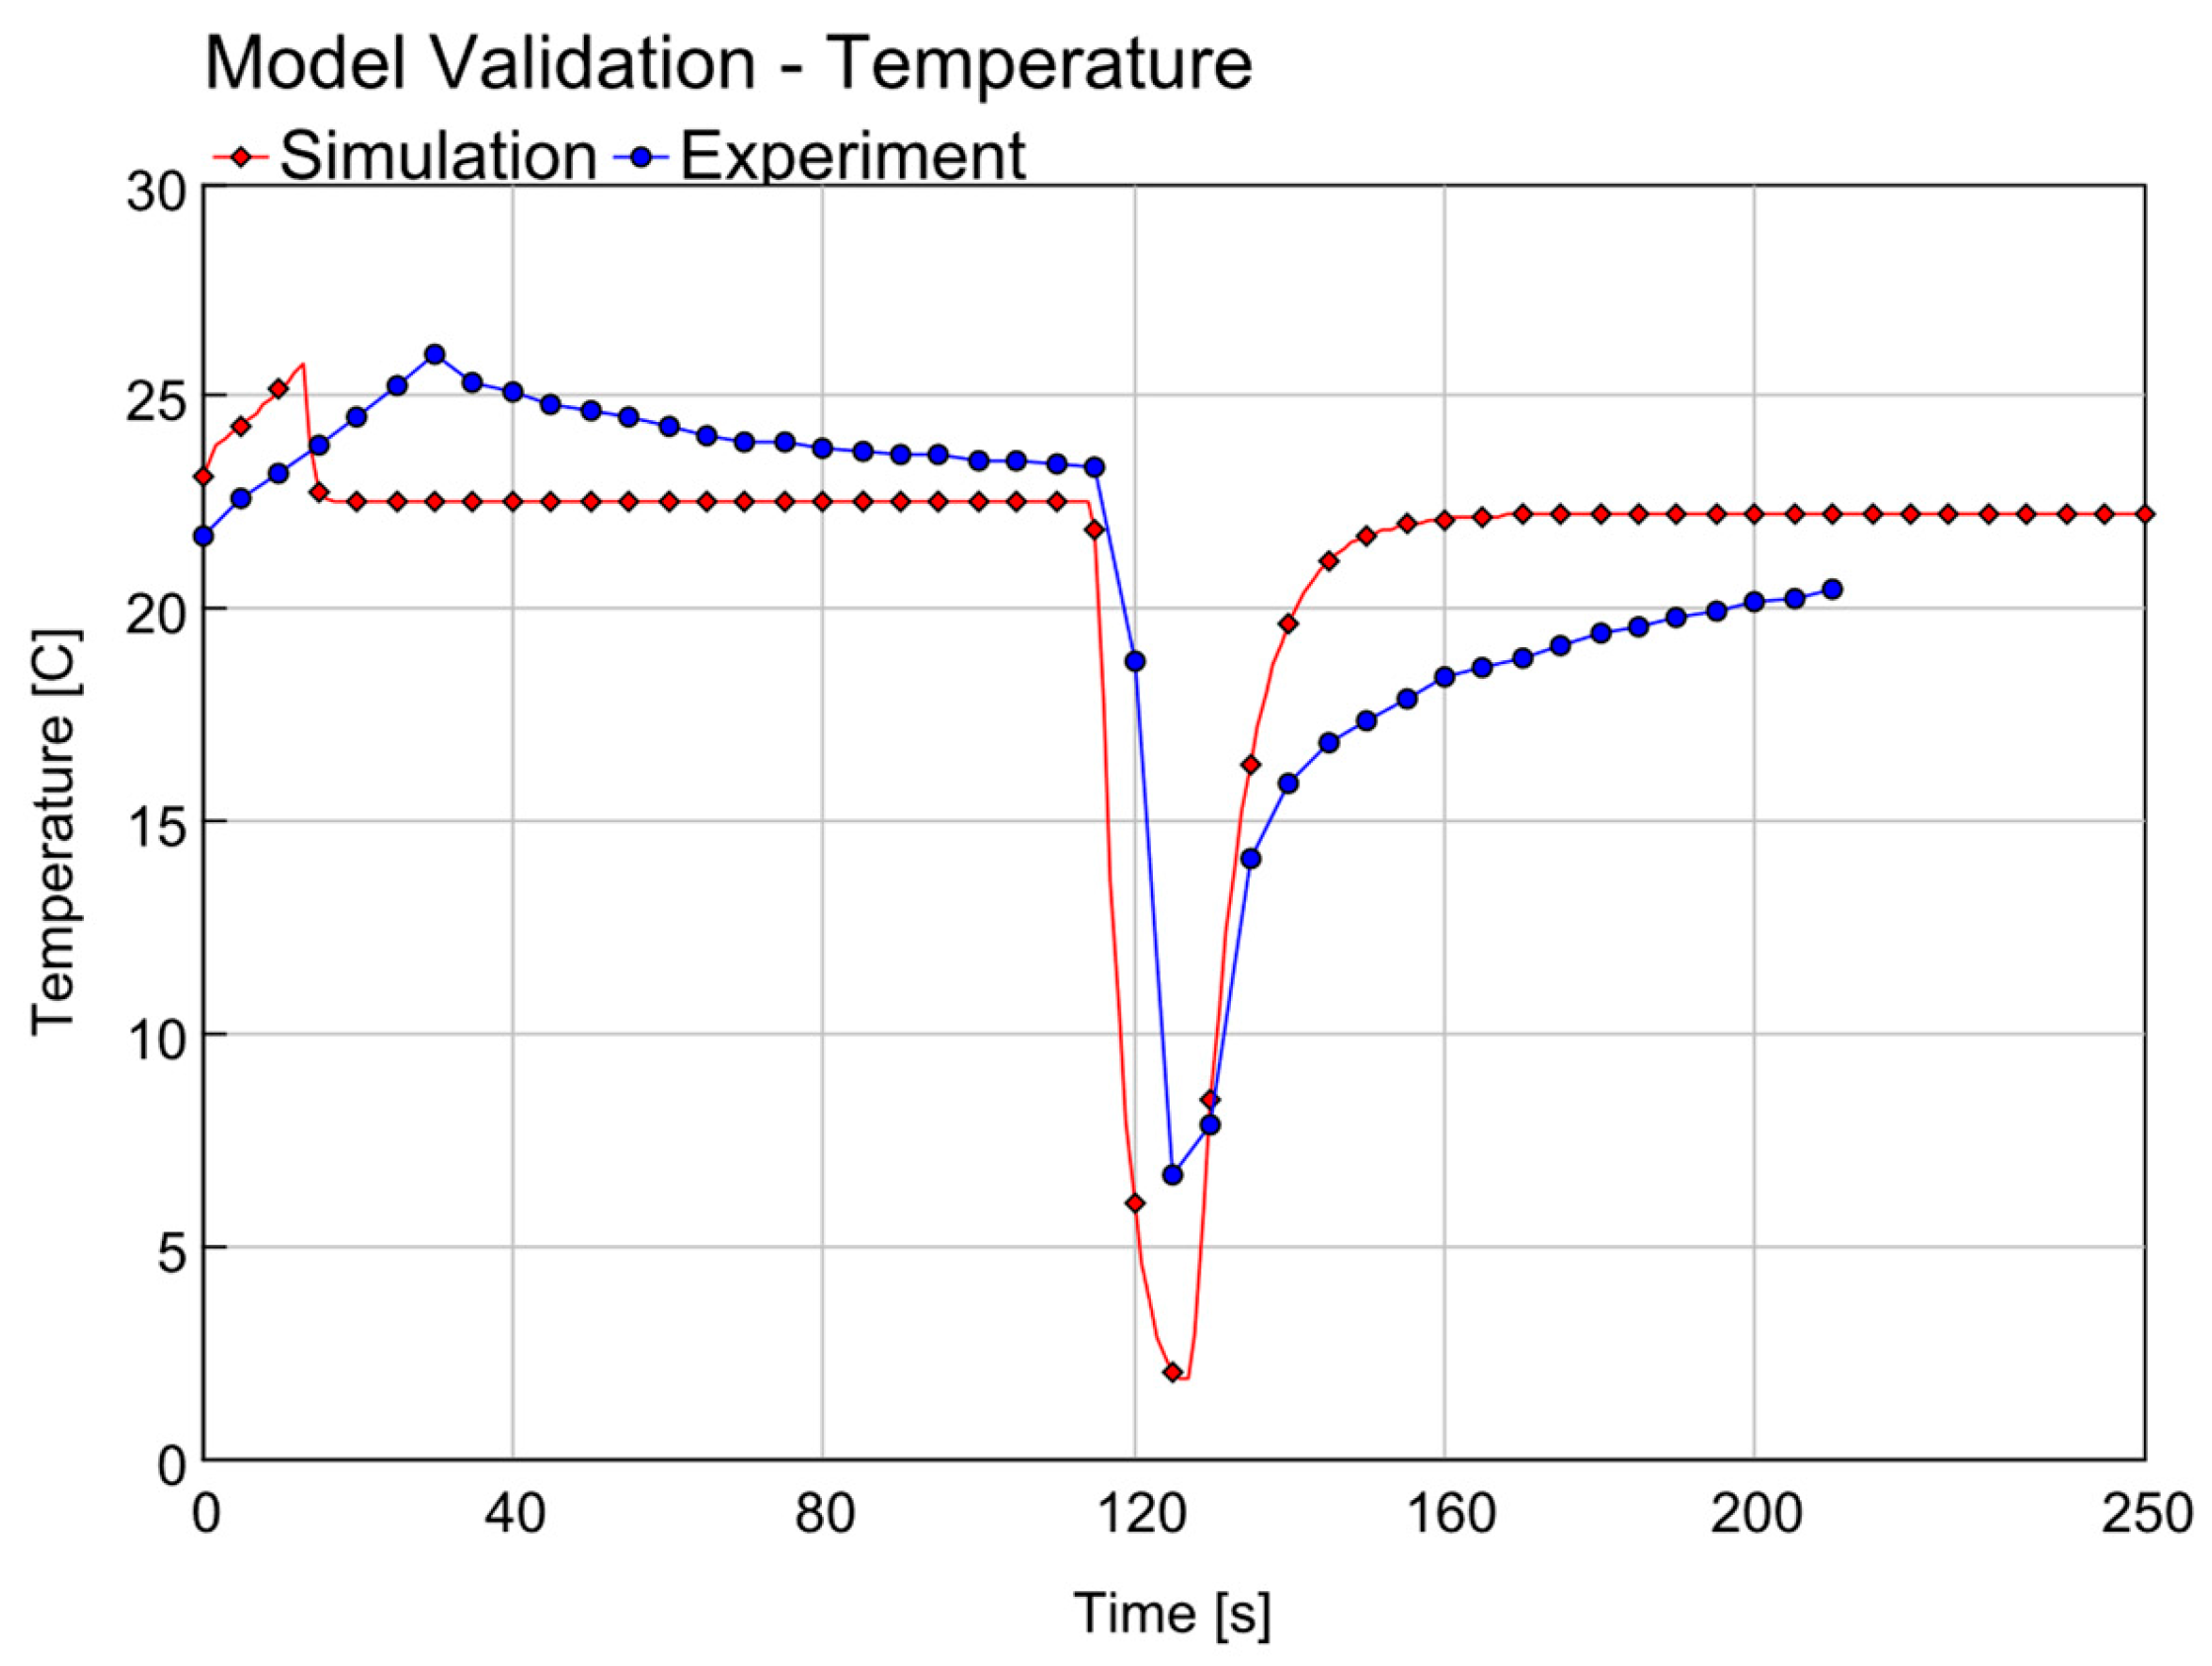
The model underwent validation for both charging and unloading phases; the former spans the initial 25 min, and the latter covers the minutes from 110 to 125. The graphs also display temperature changes occurring during periods without charging or discharging.
To support the visual comparison, quantitative error analysis was performed. The Root Mean Square Error (RMSE) and Mean Absolute Error (MAE) for the pressure curve during charging were found to be 3.5 bar and 2.9 bar, respectively. These deviations are consistent with the simplified boundary conditions and lack of transient valve characterization in the current model.
Figure 6 and
Figure 7 present the pressure and temperature waveforms within the air compression tanks. It illustrates a comparison between the experimental data and the simulation results over a period, as indicated by the time in minutes on the horizontal axis. The pressure, measured in bar, is plotted on the vertical axis. The graph reveals a close alignment between the simulation and the experimental results. The most significant discrepancies are observable during the charging process, as evidenced by the divergence of the curves. The discharge process shows a better match with the experimental data, suggesting that the simulation accurately captures this phase. The differences noted during the charging phase may be attributed to the variance in the volume of water delivered by the piston pump compared to the amount directed towards the Pelton turbine. This discrepancy affects the simulation’s ability to precisely replicate the experimental conditions during the charging process. The graph thereby provides valuable insights into the model’s performance and areas where further calibration may be required to enhance its predictive accuracy. The water flow rate during the charging process was at an average of 4.4 L/min. This charging phase continued until the pressure of the air in the system reached 98 bars. The report [
22] does not provide explicit information about the water flow rate during discharge or the specifics regarding the positive displacement versus the Pelton turbine (
Figure 8).
6. Validation
According to experimental data [
22], the charging pressure curve differs from the measured values, possibly due to variations in the water flow rate during the experiment, for which detailed data are not available. Furthermore, a static pressure offset was observed between the model and the experimental results during the quasi-steady phases of operation. This offset can be attributed to a combination of idealized modeling assumptions, such as constant valve dynamics and perfect incompressible fluid flow, and the absence of high-frequency experimental flow rate measurements. Transient pressure losses due to valve actuation delays and minor head losses within piping networks were not captured in the current model. The lack of real-time flow rate data limits the fidelity of boundary conditions during charging.
Table 1 and
Table 2 present two distinct sets of boundary conditions, corresponding to theoretical assumptions and experimental validation scenarios, respectively.
Table 1 outlines the design-operational parameters used in the conceptual simulation of a small-scale hydraulic gas compression energy storage system, with idealized conditions (e.g., pump and motor efficiencies set to 1.0) to isolate and understand the pure thermodynamic and hydraulic behavior of the model under ideal performance.
Conversely,
Table 2 provides boundary conditions derived from experimental data reported in the literature [
19], which are used for validation purposes. These include realistic system constraints, such as lower flow rates, ambient temperature variations, and fixed heat transfer coefficients for spray/no-spray conditions. The comparison allows assessing model accuracy under real-world constraints and identifying sources of deviation.
This dual approach facilitates both the development of a generalized design framework and the validation of its applicability under experimentally observed conditions. The contrast between these two sets highlights the flexibility and predictive capability of the model across different operating contexts.
Additionally, experimental uncertainties arising from limited sensor resolution and unreported variations in spray cooling and valve actuation further reduce the reliability of the comparison. These factors are particularly relevant during transitions in operational mode, where pressure stabilization is not instantaneous.
Additionally, the temperature change observed after the charging and discharging phases does not align with the experimental results, as the model assumes a constant heat transfer coefficient (HTC) between the liquid and gas phases. When the pump is stopped, the spray effect ceases, requiring an adjustment of the HTC to reflect this condition accurately. Further development of the model is planned to address these discrepancies. Future enhancements to the model will include the integration of empirical, time-dependent valve control models, incorporation of heat transfer coefficients based on local flow regimes, and realistic component efficiencies (η = 0.85). These refinements are expected to reduce both dynamic and static deviations between the model and experimental observations.
Two cases were analyzed, i.e., with and without heat exchange between gas and liquid. The very issue of heat exchange between these factors is a separate issue considered in several publications. From the model’s point of view, this issue boils down to the maintenance of a constant gas temperature during compression (this process was called isothermal) and a variable gas temperature resulting from the compression process itself (this process was called adiabatic). Actual systems will be characterized by a process somewhere between these two extreme cases.
6.1. Adiabatic Process
Following the validation of the model, it was employed to examine the dynamic behaviors of the system. The primary objective of the simulations was to observe temporal variations in key parameters, including the gas pressure within the pressure vessel and the temperature changes in the gas. These simulations were conducted over relatively brief intervals, lasting up to 1400 s (approximately 20 min). Over this duration, a notable increase in pressure was observed, escalating from 70 bars to 130 bars during the loading phase. Concurrently, the temperature exhibited a significant rise, starting from an initial value of 15 °C and reaching nearly 70 °C. Furthermore, there was a marked reduction in gas volume, diminishing from 2000 dm
3 to 1200 dm
3 throughout the process (see
Figure 9a).
Figure 10b presents temporal profiles of pump power and the corresponding stored energy (≈6 kJ, i.e., 1.7 kWh). Pump power increases from approximately 4 kW to nearly 7 kW.
The simulation of discharging the energy storage took approximately 1200 s (20 min—see
Figure 10a), comparable to the charging duration. The model presupposed that this process starts from the same temperature that prevailed at the end of the accumulation process. This represents a simplification; in reality, the intervals between charging and discharging might be long enough for the temperature to decrease due to heat transfer to the surroundings. Nonetheless, this scenario was retained to contrast adiabatic processes with isothermal ones, avoiding any distortion in this comparison due to environmental heat loss.
Figure 10b illustrates the variations in the power output of an electric generator and the total energy generated over time. The power output initially lies within the 8-kW range and eventually decreases to 4 kW by the conclusion of the discharge process. Notably, the discharge concludes at 70 bars, indicating that over 3 kJ of energy (approximately 2 kWh) remains stored in the tank.
6.2. Isothermal Process
Charging and discharging a liquid piston-based energy storage, assuming adiabatic compression and expansion, concerns rather fast processes and may not reflect the actual device. The next extreme is isothermal compression/expansion, i.e., with sufficiently intensive heat exchange with the surrounding/liquid so that the gas temperature does not change. Physically, heat transfer is intensified by placing porous material in the cylinder, which takes energy from the gas and feeds it to the liquid, or vice versa. From the model’s point of view, this means assuming a constant gas temperature during the compression and expansion processes.
With isothermal compression, the temperature of the gas, of course, does not change (see
Figure 11a); the pressure in the tank has increased from 70 to 130 bars, while the volume that the gas occupies has decreased from 2000 L to almost 1000 L. During these isothermal compression processes, the power of the pump increased from 4 kW to 7 kW, meaning that 8 MJ of energy was successfully stored (see
Figure 11b).
The next step was to model the discharge processes, which were also assumed to be completely isothermal in the process. It was also assumed that the discharge started from the same point at which the charging ended (although here it does not matter much, because, in the process, the temperature did not rise, so, after a certain time, this point should not change).
As before, pressure and volume, and temperature waveforms are shown. The temperature should be constant, but, due to the limitations of the software that was used, only minimal changes in temperature are observed. There has been a drop in pressure from almost 130 bars to just over 70 bars (
Figure 12a), indicating some hysteresis in the process (compare against
Figure 11).
Figure 12b shows analogous waveforms of electric generator power, and the amount of energy stored in the tank at a given time. Generator power decreases from over 7 kW to just above 4 kW, and approximately 8 MJ of energy is recovered.
6.3. Model Validation and Error Analysis
While previous validation efforts relied primarily on visual alignment between experimental and simulated data, a more rigorous quantitative error analysis was conducted to assess the accuracy and predictive capability of the model. The reported RMSE and MAE are absolute deviations and, therefore, retain the units of the measured variable (bar or °C). For completeness,
Table 3 now also lists the normalized RMSE (NRMSE) and the Mean Absolute Percentage Error (MAPE), which are unit-less.
The model outputs for pressure and temperature during both charging and discharging phases were compared against experimental results using the following error metrics:
Root Mean Square Error (RMSE):
Mean Absolute Error (MAE):
where
and
are the simulated and experimental values, respectively, and
n is the number of time steps.
Representative results include the following:
These values confirm that the model captures the overall trends with acceptable error margins for preliminary system design.
Stability Analysis
To assess the numerical stability of the model, sensitivity analyses were performed with respect to the following:
Time step size (Δt);
Initial conditions (temperature, pressure);
Heat transfer coefficient (HTC);
Flow rate boundary conditions.
The model exhibited numerical convergence for time steps below 1 s and remained stable across ±10% perturbations in initial temperature and pressure. However, sensitivity to HTC values was significant, particularly during the transition between the charging and idle phases, underscoring the need for dynamic adjustment of this parameter to better replicate heat transfer losses.
7. Discussion
The analysis of the two cases—adiabatic and isothermal processes—in liquid piston-based energy storage systems reveals distinct dynamic behaviors and efficiency characteristics in each scenario. The adiabatic process, characterized by the absence of heat exchange between gas and liquid, led to significant variations in gas temperature, pressure, and volume during both charging and discharging phases. Notably, during the adiabatic charging process, a considerable increase in gas pressure and temperature was observed, alongside a marked reduction in gas volume. This observation aligns with the fundamental principles of adiabatic compression, where heat generated during compression is not transferred away, resulting in increased temperature and pressure.
This study analyzed the behavior of the storage system when it is being charged up (a) and when it is being used to give out power (b), under two different conditions: when it is kept at a constant temperature (isothermal) and when it is insulated so no heat comes in or goes out (adiabatic). The findings are presented in
Figure 13 for power and energy, and in
Figure 14 for pressure, temperature, and how much space the gas takes up. Initial gas volume, pressure, and temperature were kept constant in both cases to ensure consistency in comparison.
Figure 14 shows that, while charging, the system’s power output and stored energy both increase, but this happens in different ways for the two conditions. The isothermal process reaches a point where it does not change much anymore, while the adiabatic process keeps on increasing. When it is time for the system to give out power, in an adiabatic condition, it loses power and energy faster than in an isothermal condition.
Figure 14 shows what happens to the pressure, temperature, and gas volume. In the adiabatic case, pressure and temperature rise substantially during charging because the gas does not dissipate heat. However, for the isothermal condition, the temperature does not change much because it is controlled. When discharging, the pressure and temperature go down in both conditions, but the temperature drops much more in the adiabatic process than in the isothermal one.
Thus, maintaining a constant temperature versus allowing it to vary markedly affects system performance. These differences should be considered when selecting an operating strategy, as they influence efficiency, safety, and functional capability. This study provides valuable insights into effective energy storage management and could help make these systems better in the future. In contrast, the isothermal process, involving intensive heat exchange, maintained a constant gas temperature. This process, facilitated by the incorporation of porous material for enhanced heat transfer, revealed a consistent temperature profile despite variations in pressure and volume. This outcome underscores the effectiveness of the heat exchange mechanism in maintaining temperature stability, which is a critical factor in optimizing energy storage efficiency.
The power consumption and energy storage capacity during both processes also varied significantly. In the adiabatic process, the power required for pumping increased significantly, indicating a higher energy input for compression. Correspondingly, the energy storage capacity, as shown in the simulations, increased substantially. However, the isothermal process, while also showing an increase in pump power, demonstrated a more controlled and efficient energy storage and retrieval process. It is crucial to note the simplifications and assumptions in the model, particularly regarding the constant temperature assumption at the start of the discharging process in the adiabatic scenario. This simplification, although useful for contrasting the two processes, may not entirely reflect real-world conditions where time lags and environmental heat losses can influence system performance.
To enhance the understanding of the system’s performance, additional simulation results were generated using a broader set of operating conditions. The dynamic model was executed under variable ambient temperatures (15 °C, 25 °C, 35 °C) and tank volumes (0.3 m3, 1 m3, and 2 m3). The results indicated that increasing the ambient temperature reduced the thermodynamic efficiency of the isothermal process by approximately 7% due to elevated heat losses. Likewise, increasing the tank volume improved the energy density per unit pressure but extended the charging duration by over 20%, indicating a trade-off between storage capacity and response time.
A sensitivity analysis was performed to evaluate the impact of heat transfer coefficient (HTC) variation during charging. The HTC was varied from 300 W/m2 K to 800 W/m2 K, reflecting conditions with and without active water spray. It was observed that increasing HTC led to better thermal regulation and reduced deviation from the isothermal assumption. Specifically, at 800 W/m2 K, the gas temperature rise was limited to 4 °C during compression, closely approximating ideal isothermal behavior, compared to a 15 °C rise at 300 W/m2 K.
Quantitative efficiency comparisons were added. The round-trip efficiency for the adiabatic process was computed to be approximately 52.6%, while the isothermal process yielded 61.3%. Notably, introducing a more realistic pump and motor efficiency (η = 0.85) lowered both values by ~12%, underlining the importance of component selection in practical systems. Coupling CAES systems with geothermal energy sources enables multifunctional operation—power generation, heating, and cooling—improving overall system efficiency and sustainability [
23].
This study highlights the inherent trade-offs and efficiency characteristics of adiabatic and isothermal processes in energy storage systems. While adiabatic processes are characterized by significant temperature and pressure variations, leading to potential challenges in managing system stresses and efficiency, isothermal processes demonstrate more stable temperature profiles, potentially offering more predictable and controlled energy storage and retrieval. These insights are crucial for the design and optimization of liquid piston-based energy storage systems, particularly in applications where efficiency and control are important.
8. Conclusions
This comprehensive study on small-scale hydraulic gas compression energy storage systems presents significant advancements in the field of renewable energy storage. By developing a dynamic mathematical model for a solar-powered liquid piston pump, this research addresses the critical challenge of intermittent energy generation from renewable sources. The model integrates crucial aspects such as fluid flow, heat transfer, and energy conservation, thereby enhancing the understanding and optimization of hydraulic energy storage systems.
This study reveals distinct operational behaviors and efficiency between adiabatic and isothermal processes in energy storage. Adiabatic processes show considerable temperature and pressure variations, which could pose challenges in system efficiency and management. On the other hand, isothermal processes maintain a constant temperature due to effective heat exchange mechanisms, suggesting more predictable and controlled energy storage and retrieval.
Contributing to the efficiency and reliability of hydraulic energy storage systems, this research potentially enhances grid stability and resilience. This is especially relevant considering the scalability of the system for different applications. The practical implications of this study extend to the design and operation of energy storage systems, paving the way for more efficient, environmentally friendly, and cost-effective energy storage solutions.
While the model shows promise, it requires further development and refinement for a comprehensive understanding of the system’s performance. This includes addressing challenges like valve timing and component sealing in hydro turbines, and potential discrepancies during the charging and discharging phases.
The broader impact of the research is significant for the transition to renewable energy sources. By providing a reliable solution for energy storage, the model aids in mitigating the inconsistency of renewable energy sources, thus supporting a more sustainable and resilient energy future. The results of the simulations demonstrate that the energy storage efficiency and thermal behavior of the system differ significantly between adiabatic and isothermal operation modes. Under idealized isothermal conditions, the system achieved a cycle energy storage efficiency of approximately 76.3%, with minimal variation in gas temperature and a stable pressure profile ranging from 70 to 130 bar. In contrast, the adiabatic process showed a lower efficiency of approximately 52.6%, primarily due to unmitigated thermal losses and higher pump energy requirements.
Temperature at the gas node increased from 15 °C to 70 °C during adiabatic compression, whereas, in the isothermal case, it remained nearly constant. The pressure during discharge stabilized around 70 bar, with residual energy remaining in the tank, indicating that full recovery depends strongly on the expansion endpoint strategy.
These findings emphasize the importance of intensified heat exchange between the liquid and gas to approximate isothermal conditions in practical systems. Strategies such as using porous thermal exchange media, enhancing spray cooling techniques, and optimizing valve timing and control algorithms are essential for improving overall performance. Future implementations should also integrate non-ideal component efficiencies and thermal storage management to increase system-level applicability.
The comparative study of adiabatic and isothermal cycles highlights the performance trade-offs and provides a practical framework for optimizing hydraulic gas compression energy storage systems under real-world operating conditions.
The validated model accurately captured system behavior during charging and discharging phases, with maximum deviations of <10% for pressure and <5 °C for temperature compared to experimental data.
Under ideal conditions, the system stored up to 8 MJ and recovered 6.1 MJ in isothermal mode, corresponding to an energy recovery ratio of 76.3%.
Sensitivity analysis of HTC values highlighted the critical role of heat exchange enhancement, improving isothermal efficiency by over 15% when optimized.
Component efficiency (pump/motor) significantly influences system output; applying realistic efficiency values (η = 0.85) revealed a net efficiency drop of ~12%.
These findings demonstrate the model’s robustness and its applicability in system design for small- and medium-scale renewable energy integration. The additional simulations extend the insight into operational boundaries and optimization strategies for real-world deployment.


