
An Optimized Dynamic Benefit Evaluation Method for Pumped Storage Projects in the Context of the “Dual Carbon” Goal


Abstract
1. Introduction
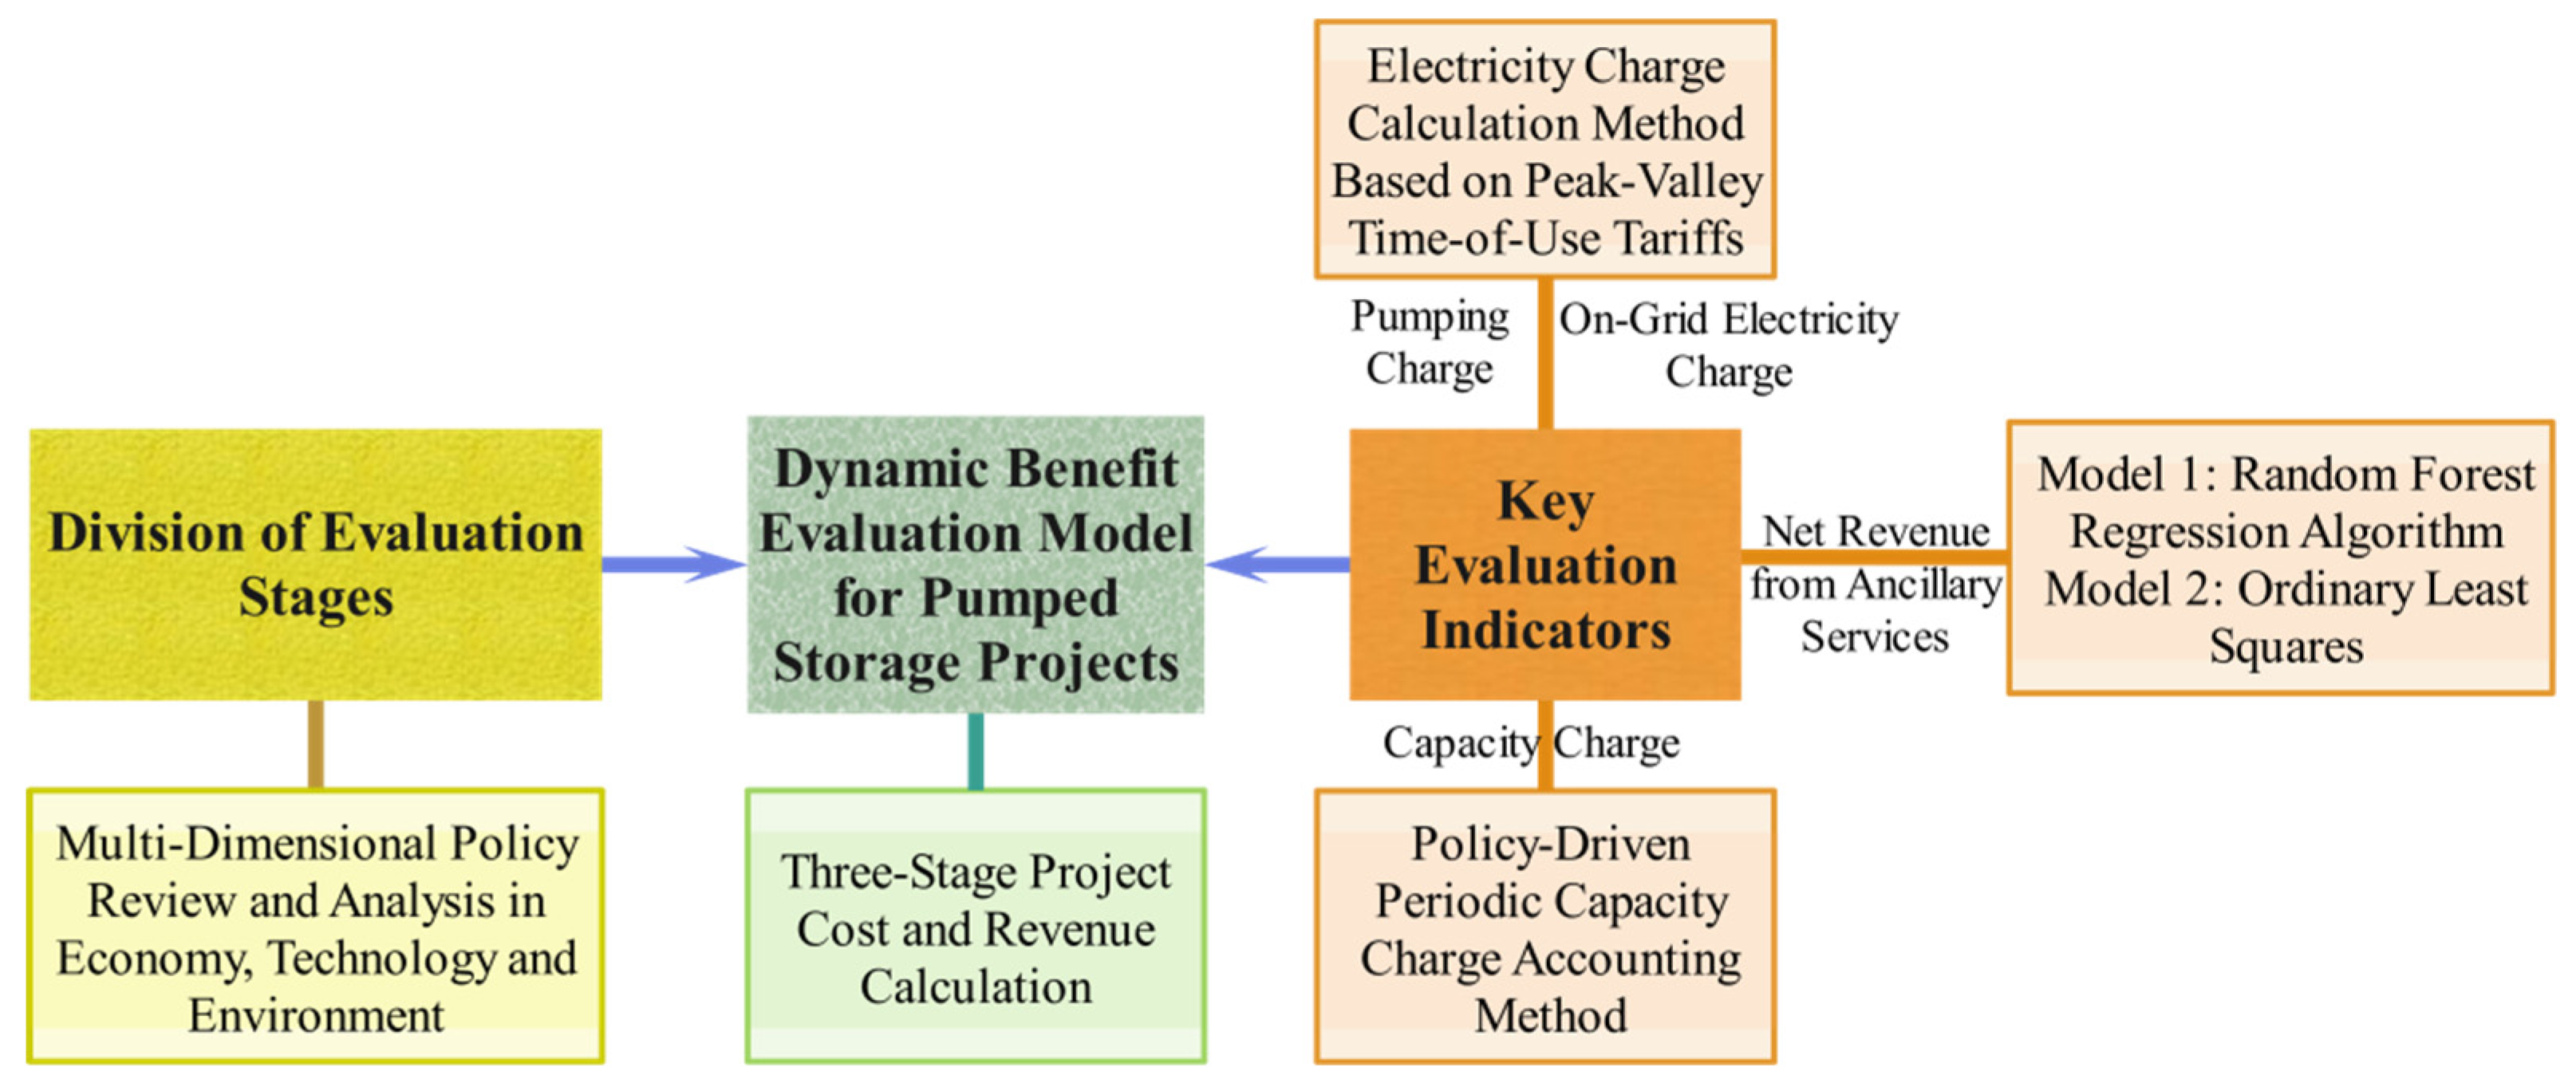
2. Research Methods
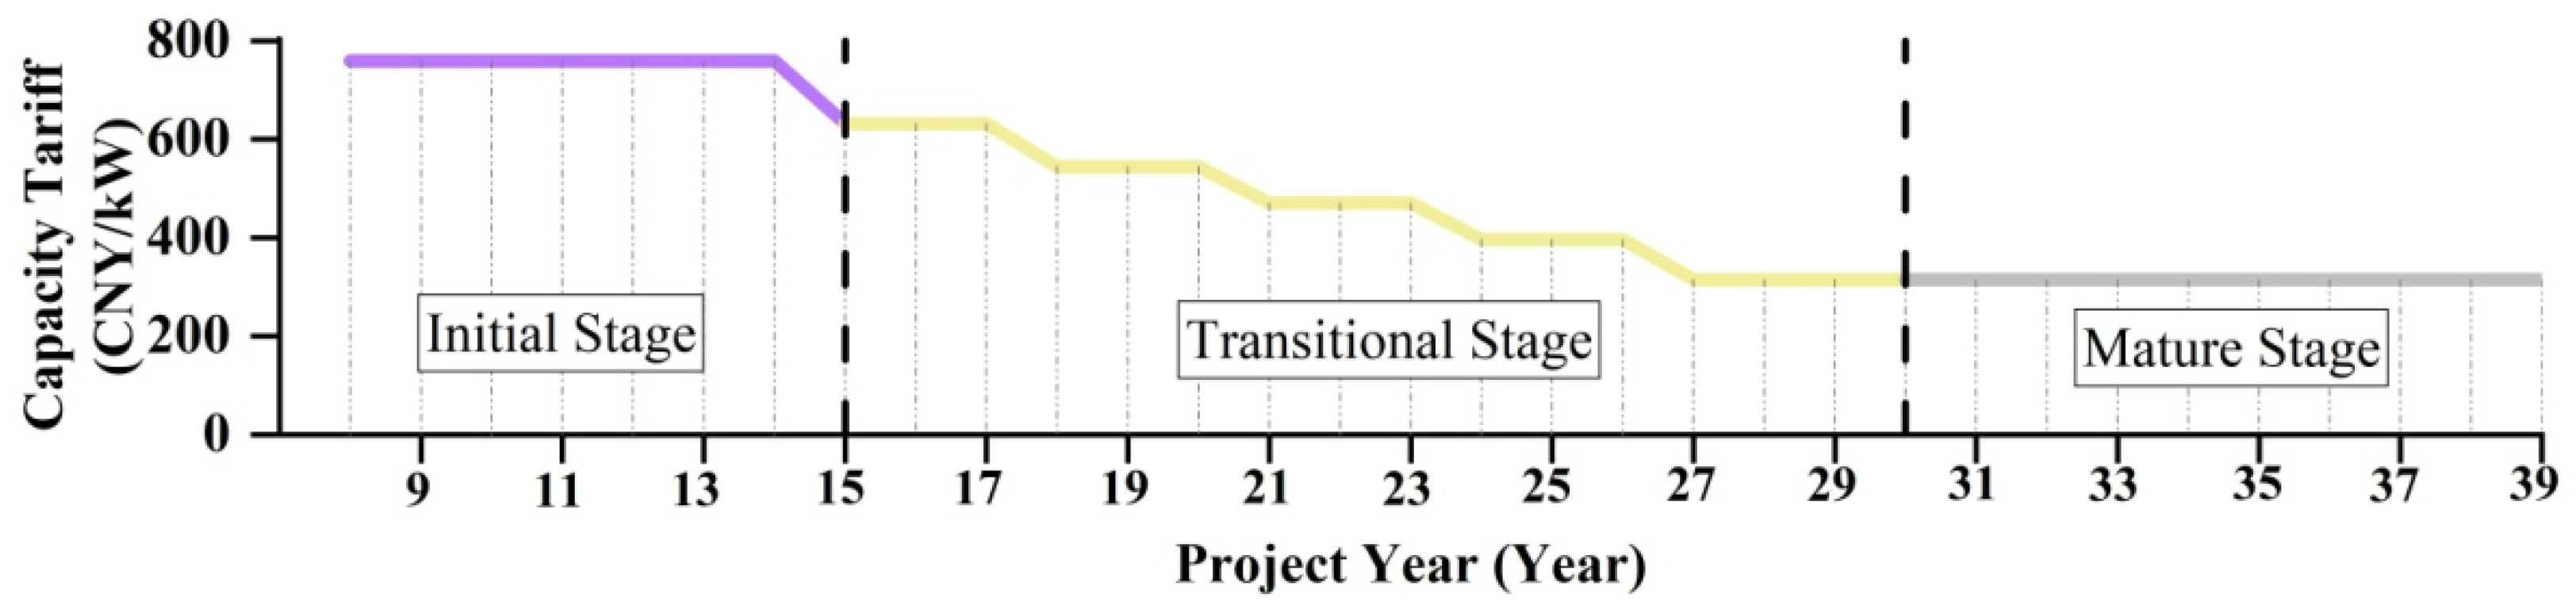
2.1. Division of Evaluation Stages for Pumped Storage Projects
2.2. Calculation Methods of Main Evaluation Indicators
2.2.1. On-Grid Electricity Revenue and Pumping Electricity Cost
2.2.2. Capacity Charge
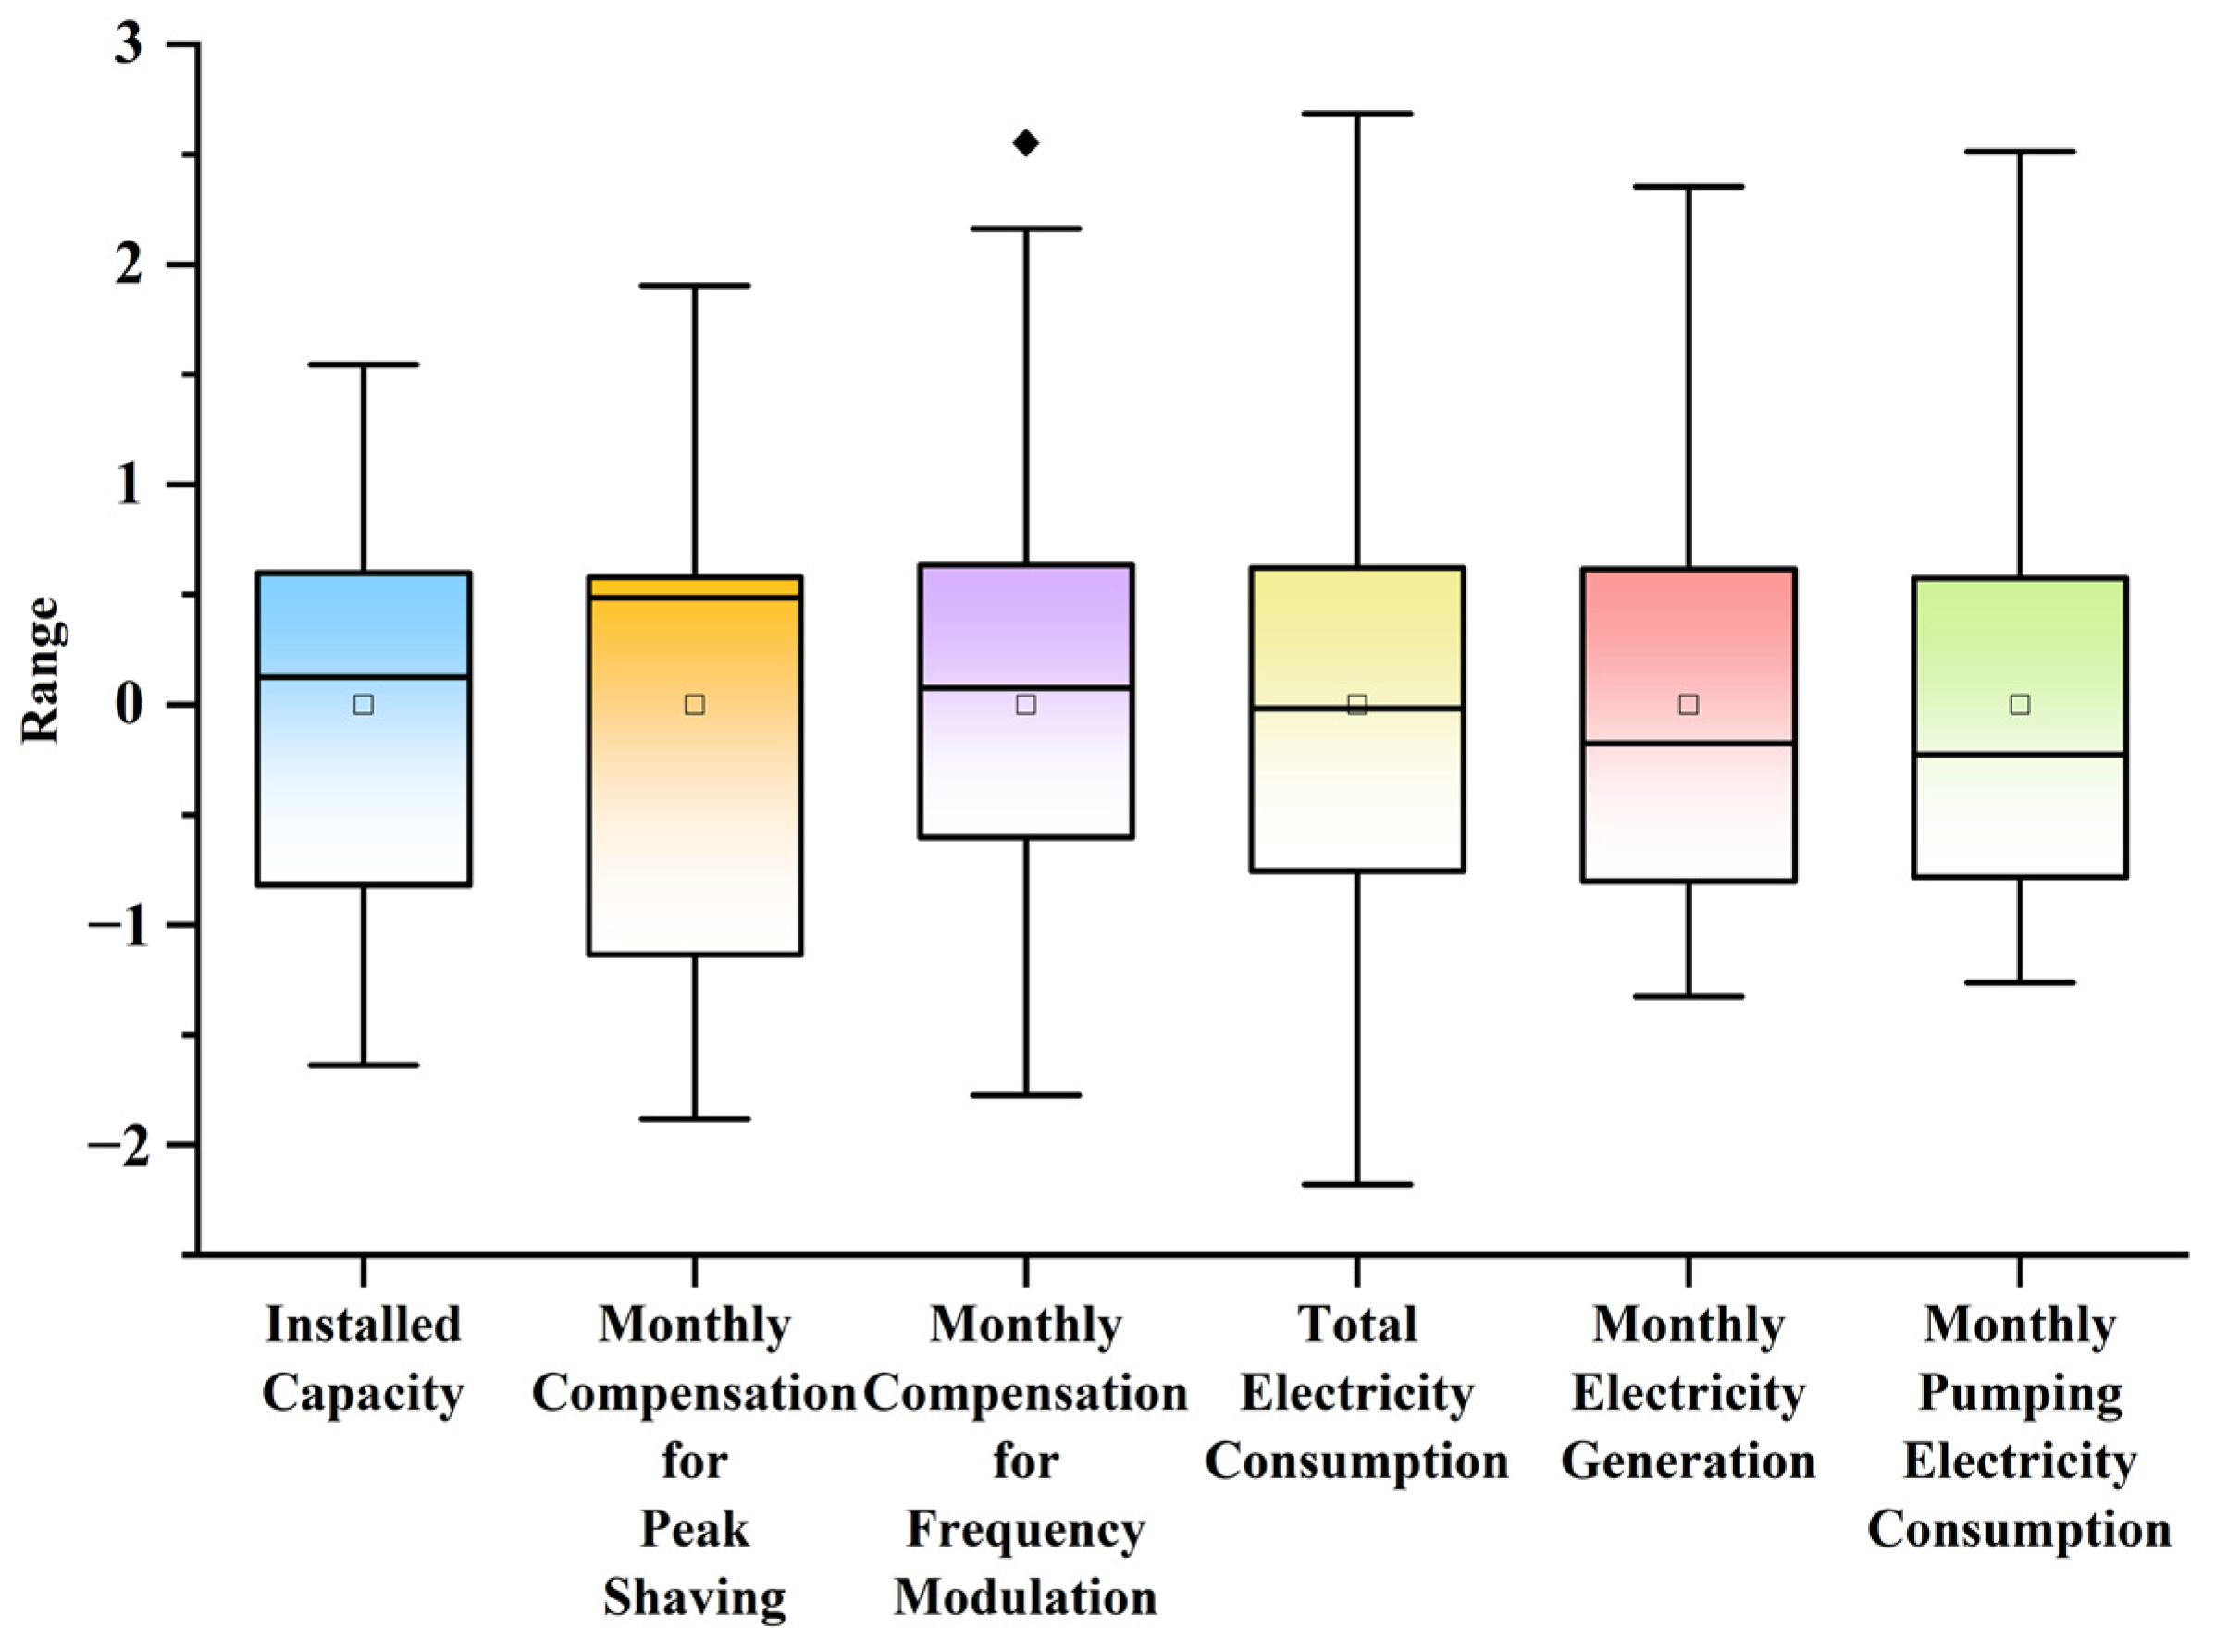
2.2.3. Net Revenue from Ancillary Services
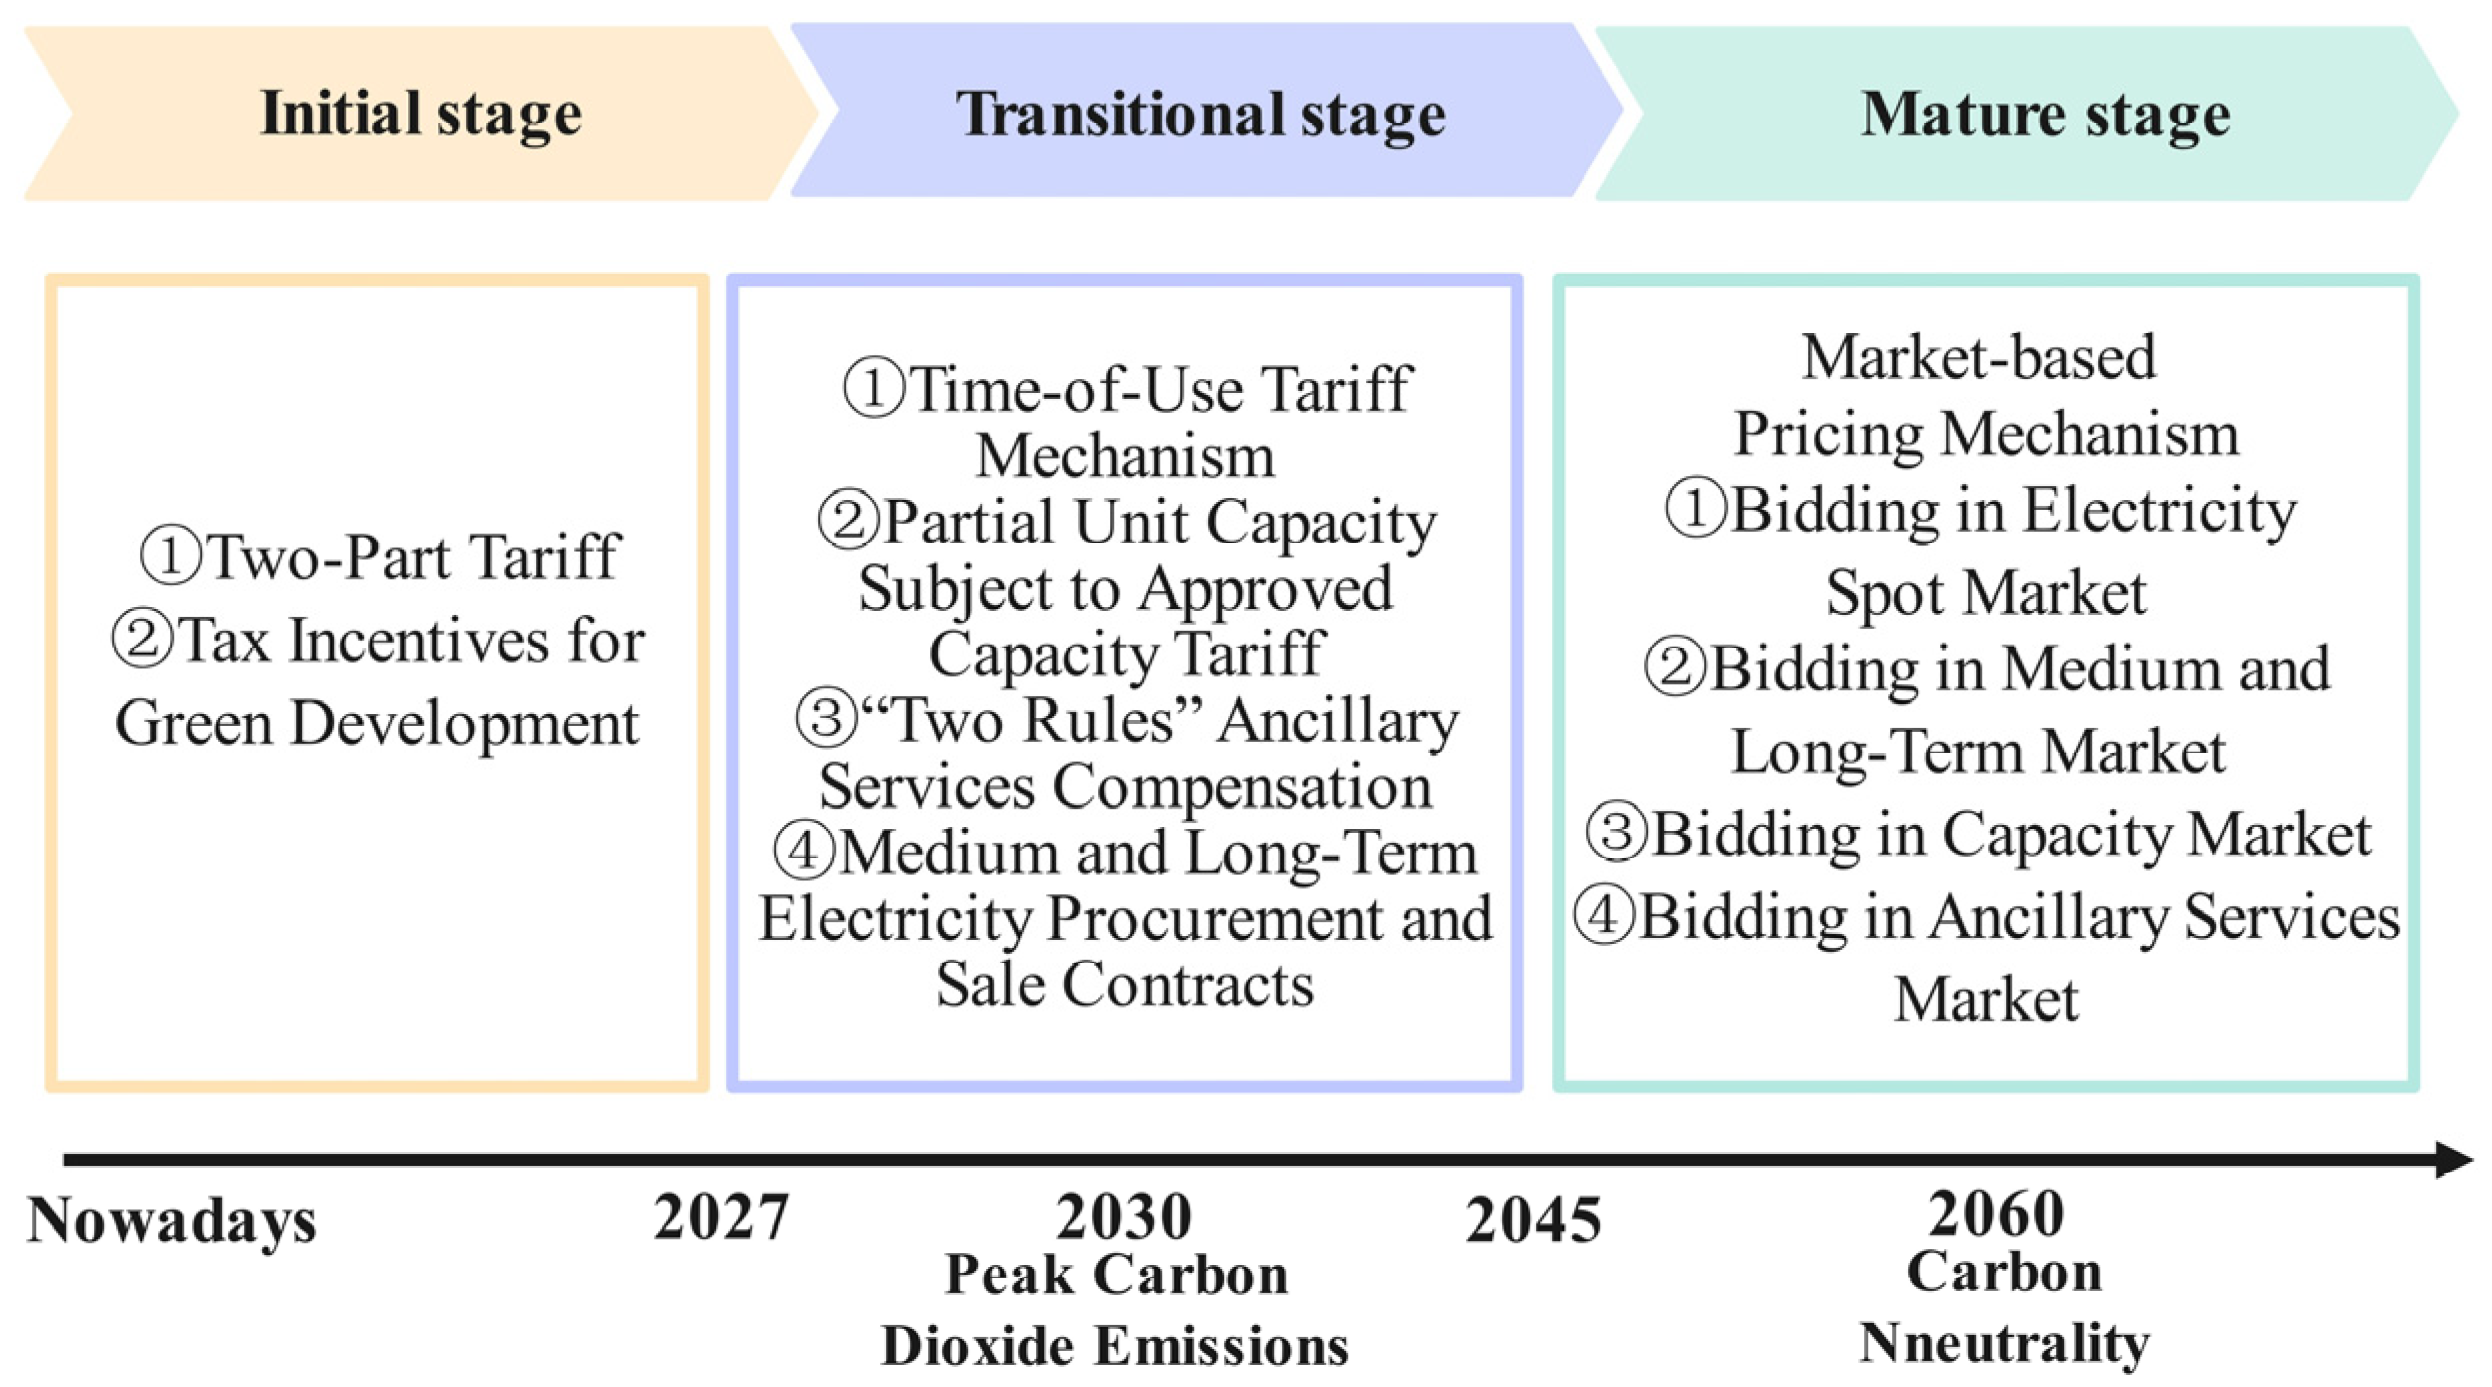
2.3. Dynamic Benefit Evaluation Model for Pumped Storage Projects
2.3.1. The Initial Stage
2.3.2. The Transitional Stage
2.3.3. The Mature Stage
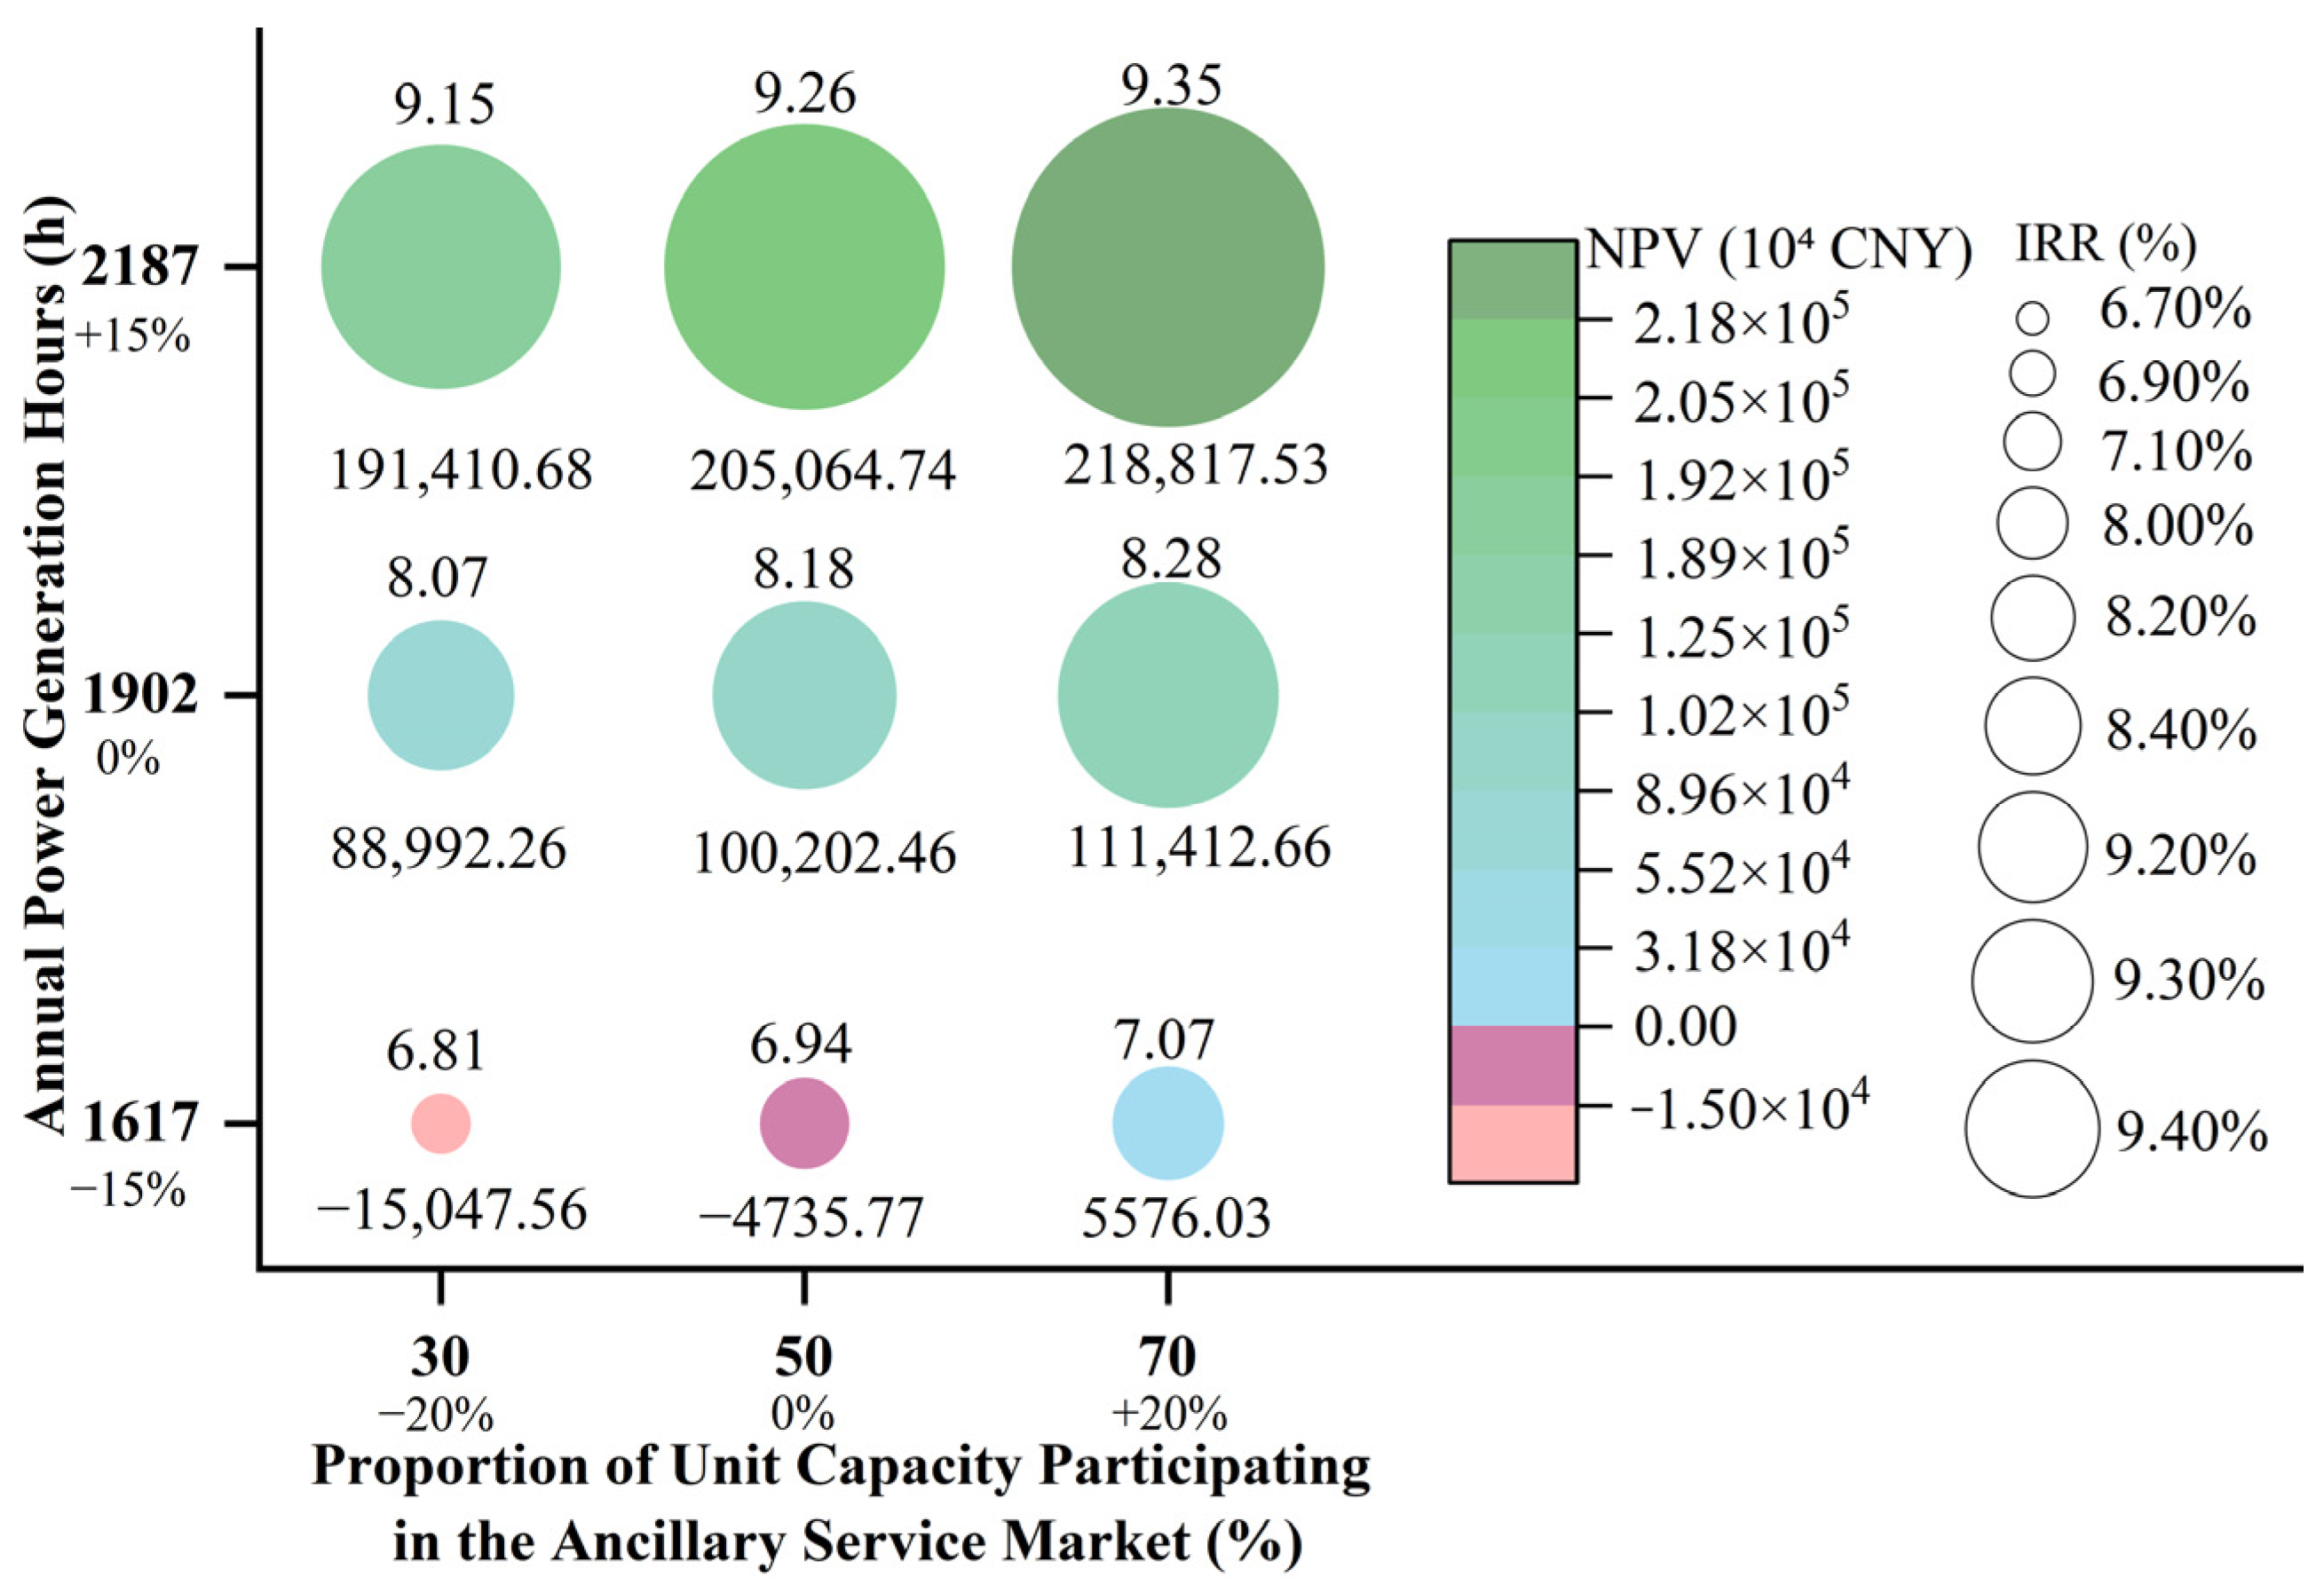
2.3.4. Sensitivity Analysis
3. Results
3.1. Calculation Results of the Main Economic Indicators
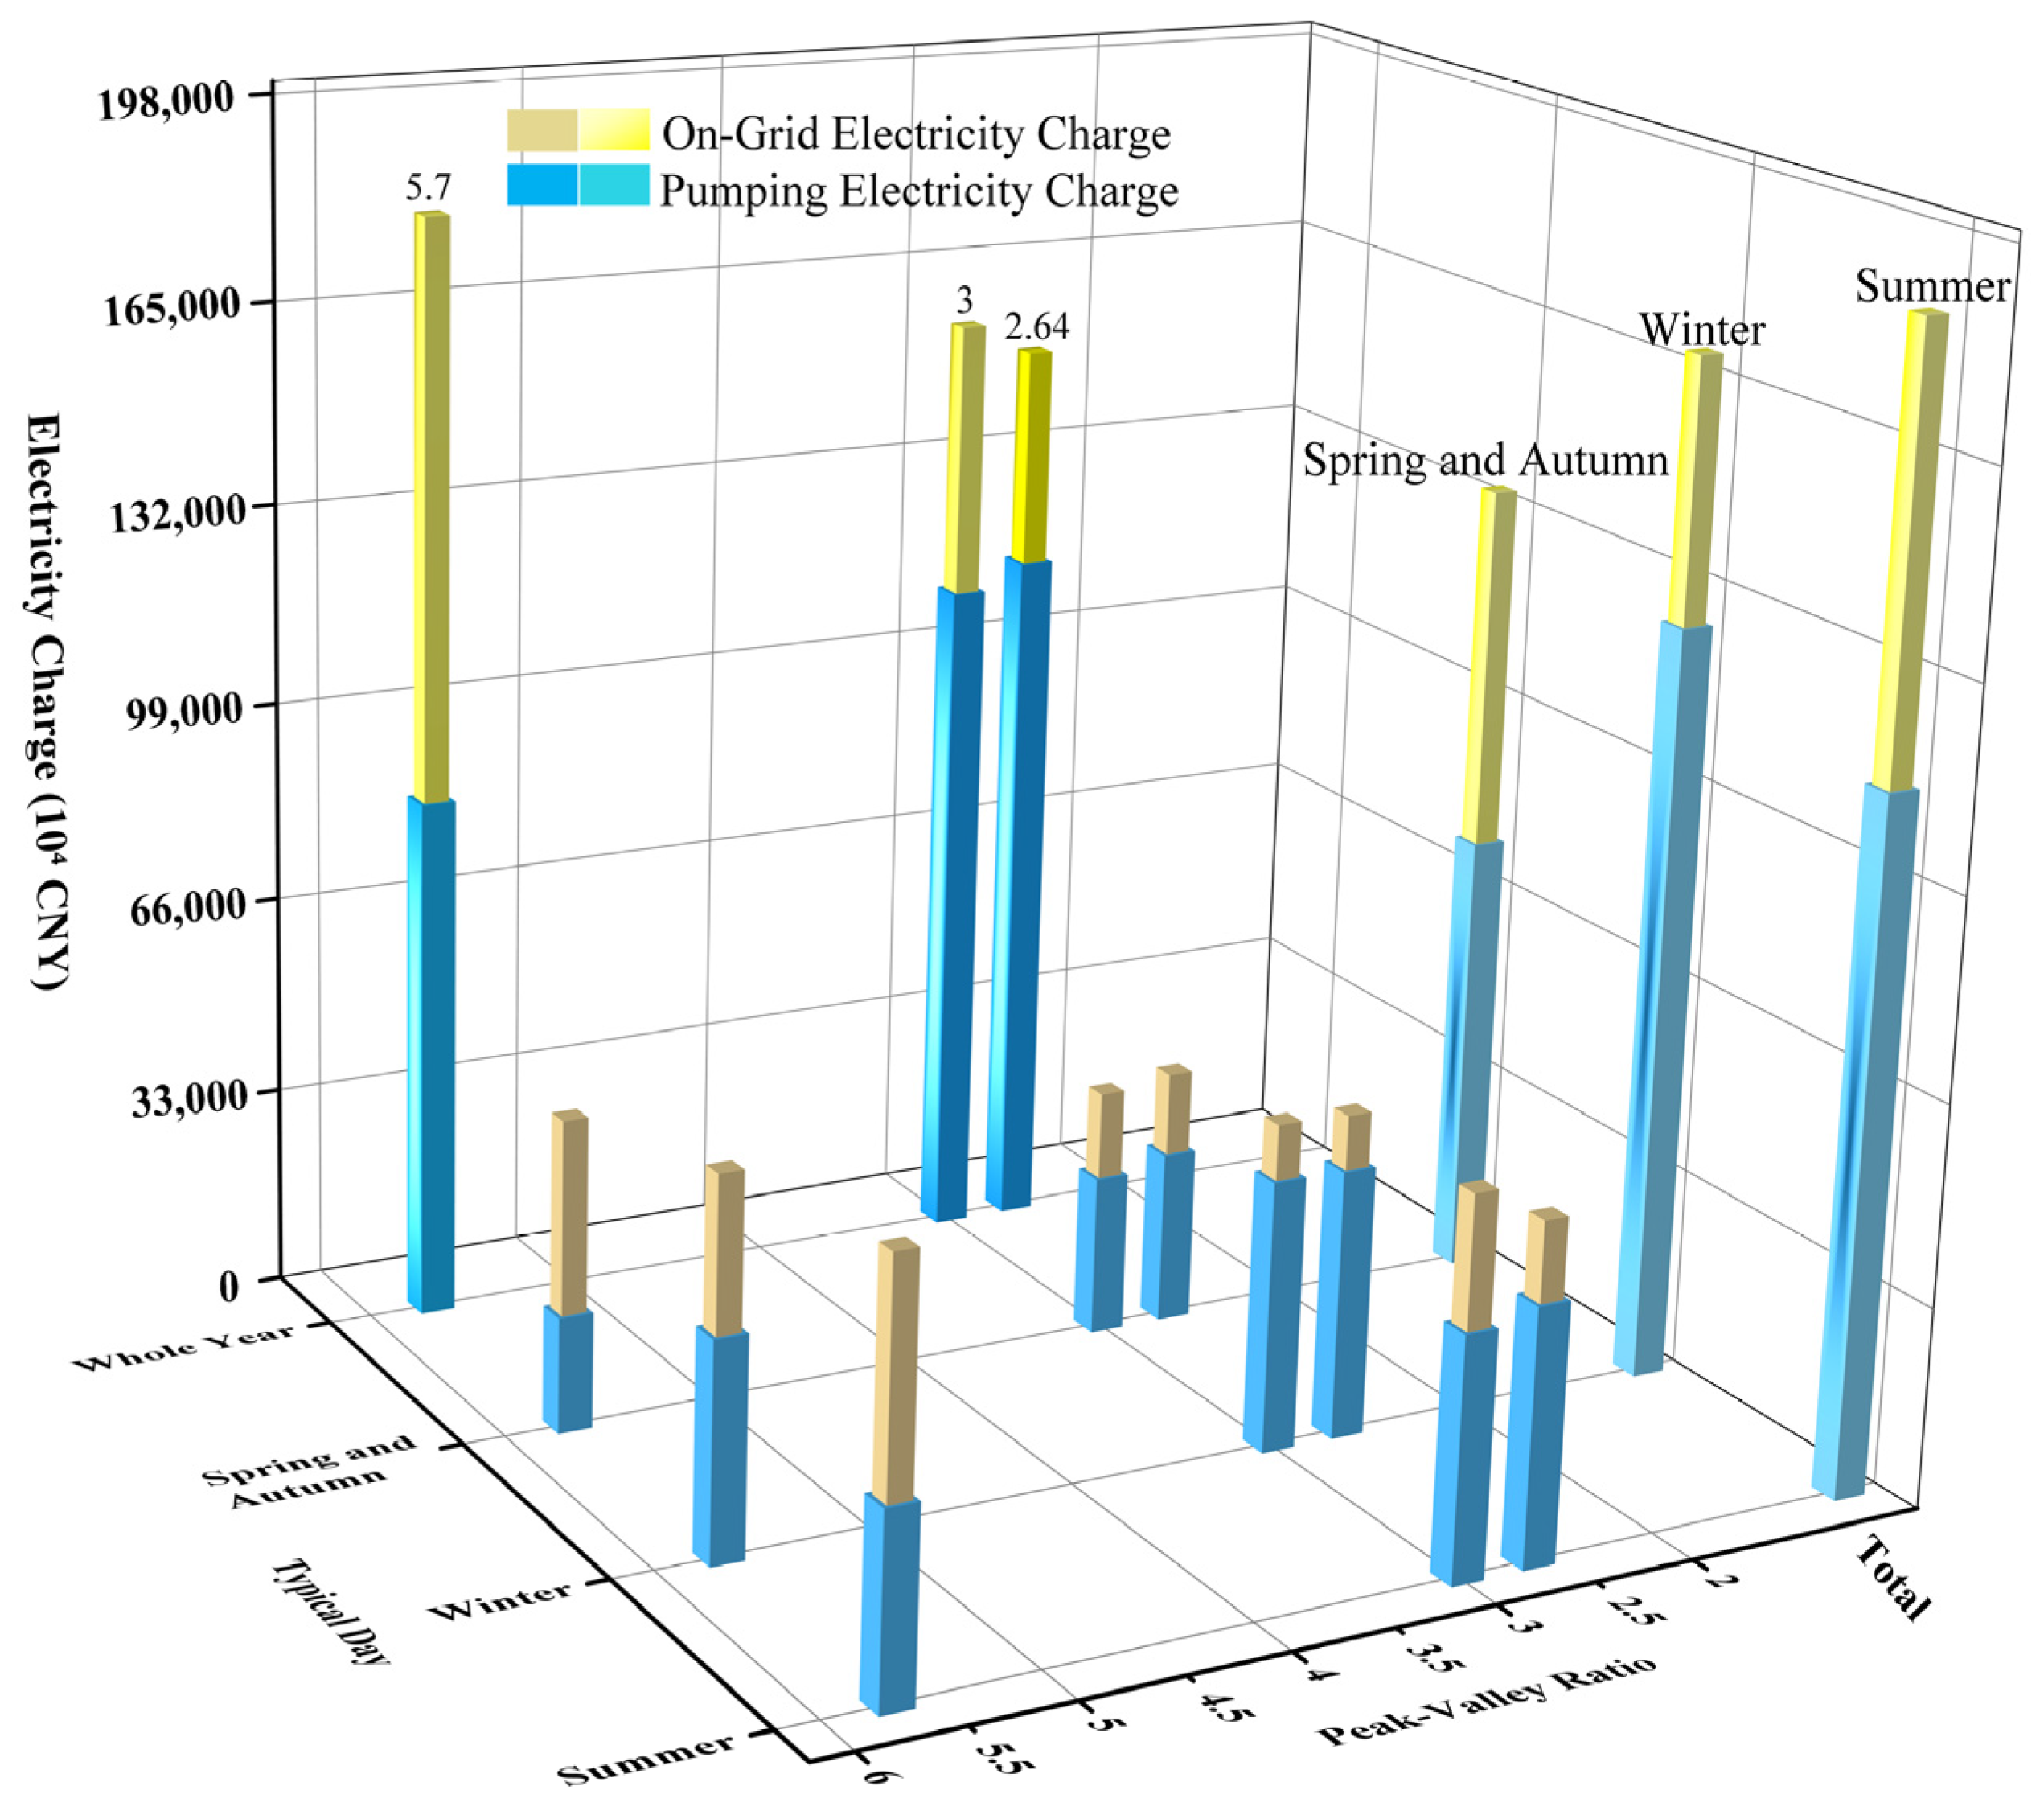
3.1.1. On-Grid and Pumping Electricity Charges
3.1.2. Capacity Tariff
3.1.3. Ancillary Service Net Revenue
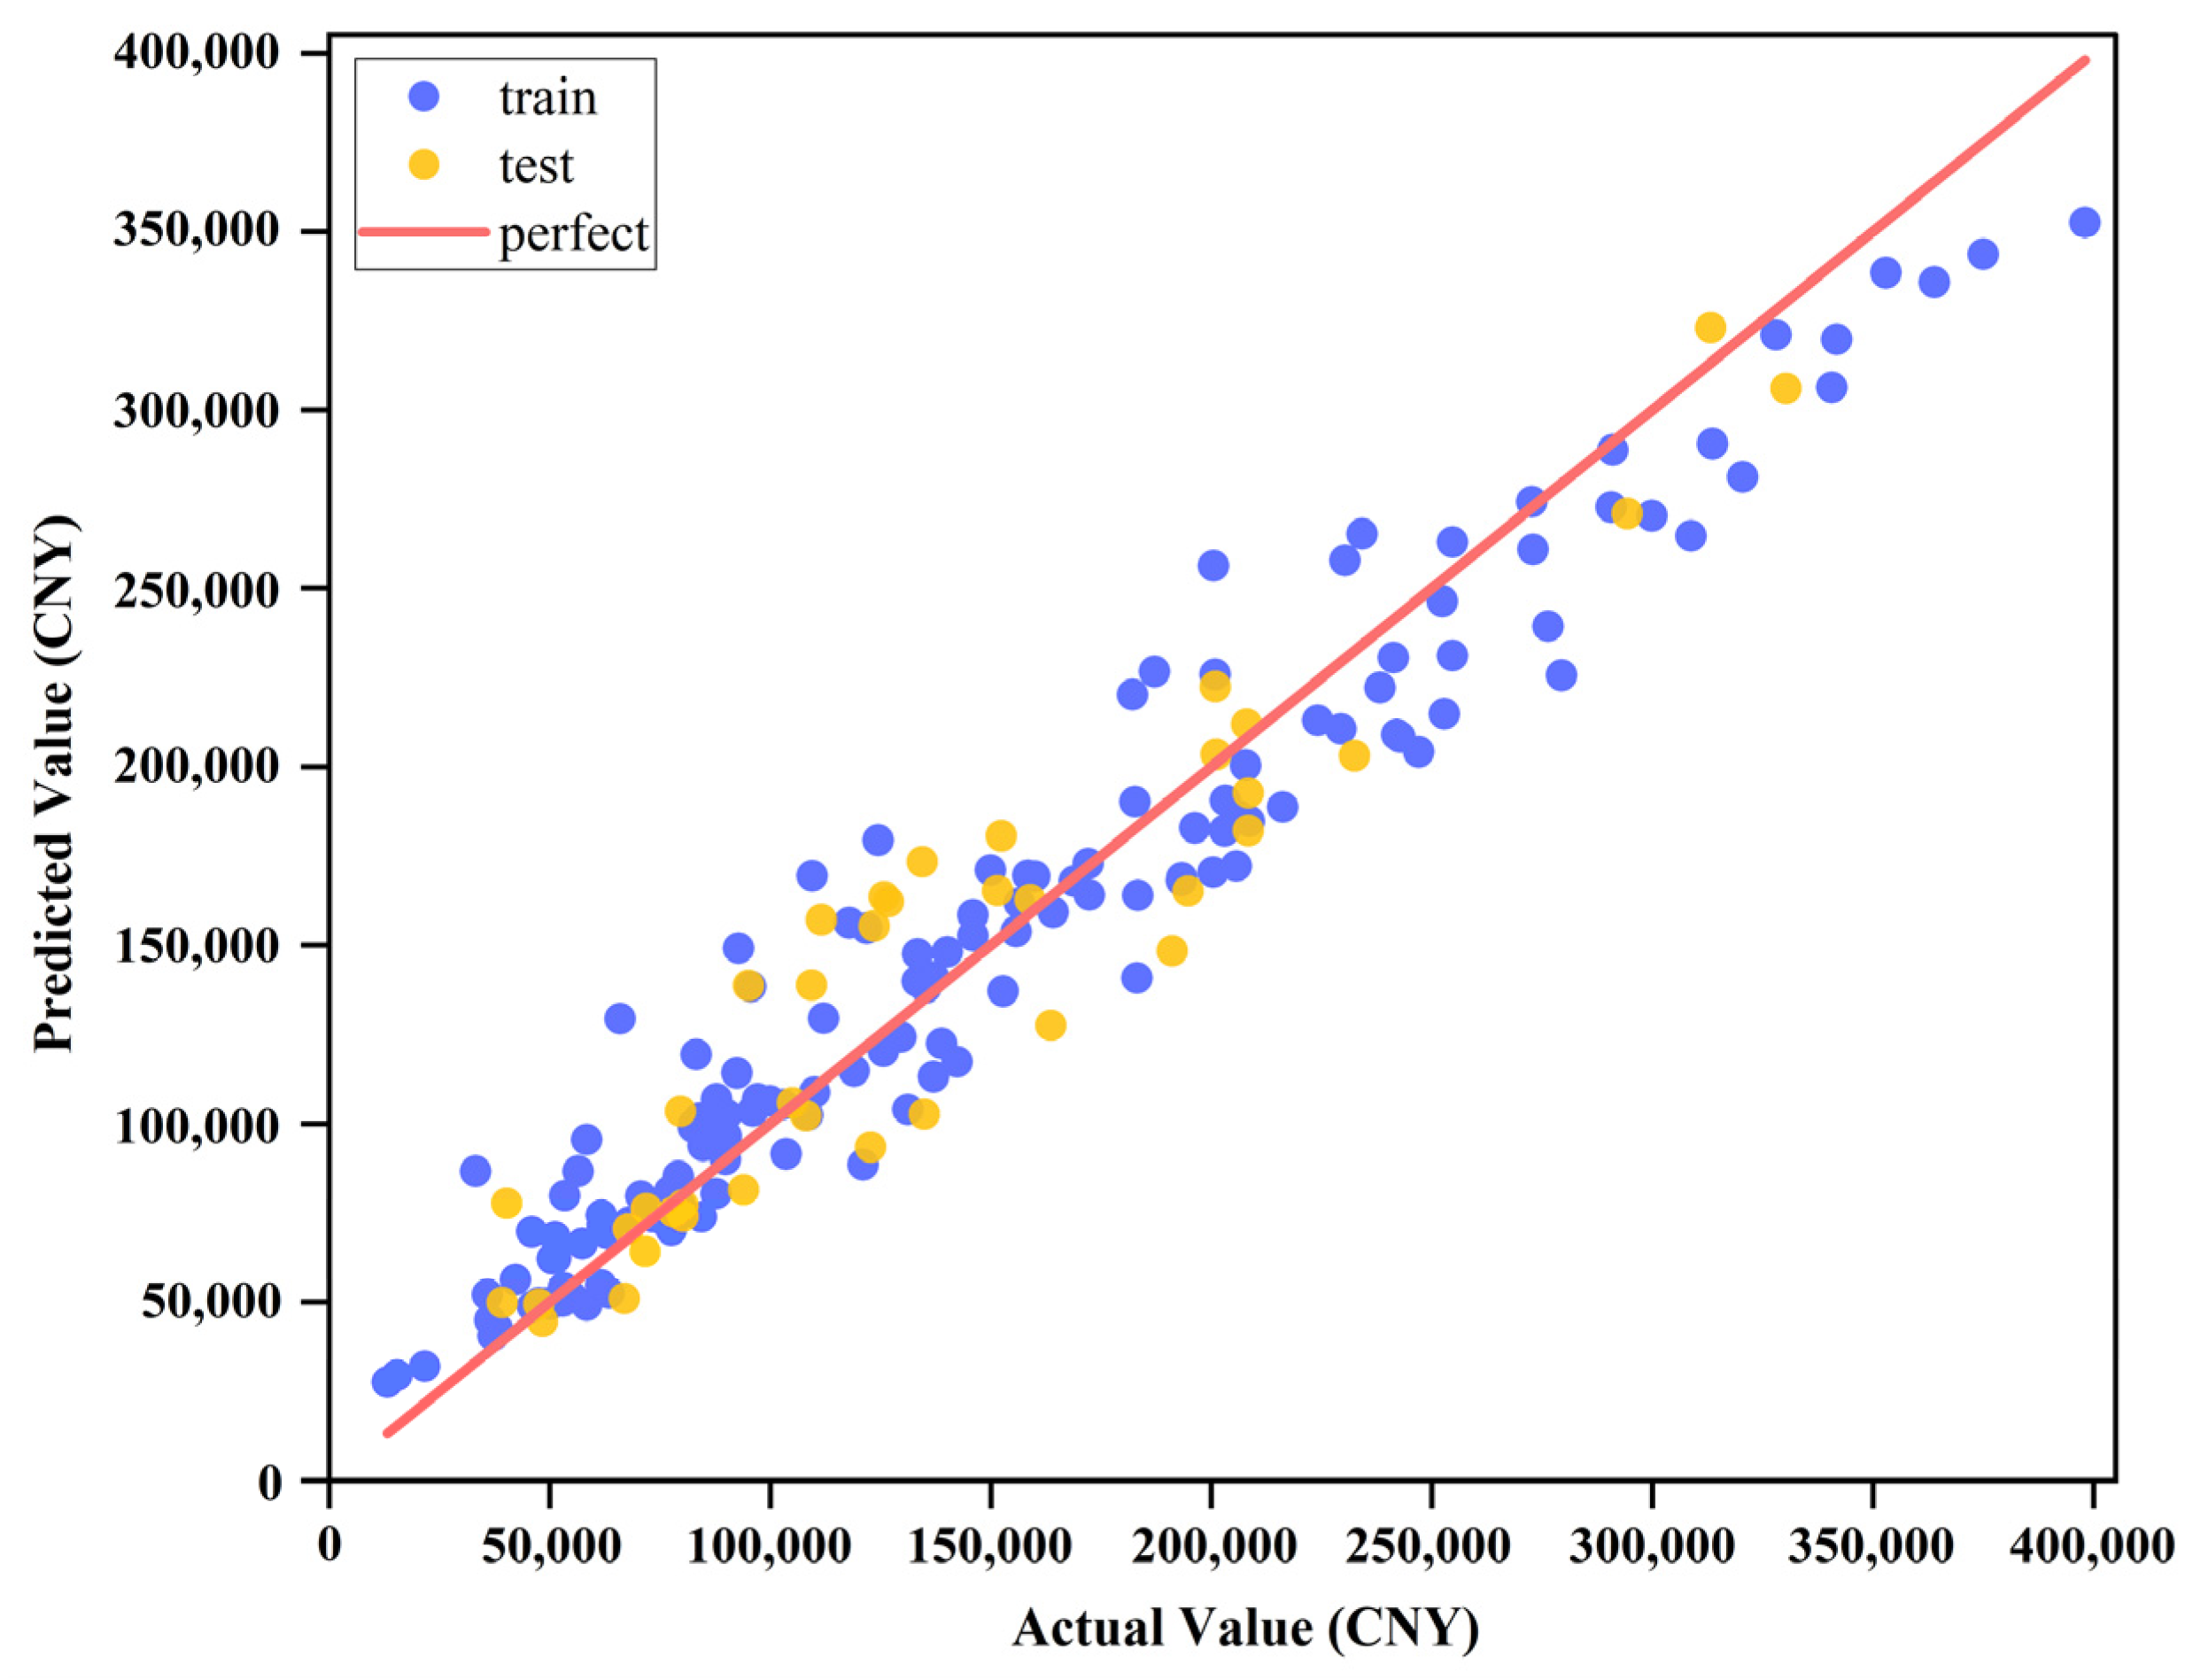
3.2. Calculation Results of the Economic Benefit Evaluation Model
4. Discussion
4.1. Discussion on Electricity Benefit
4.2. Discussion on Capacity Charge and Ancillary Service Compensation
4.3. Discussion on Sensitivity Analysis of Key Parameters
4.4. Discussion on Impact of Changes in External Economic Variables on Model Adaptability
4.5. Discussion on Potential Role of Environmental Factors in Project Benefits
5. Conclusions
Supplementary Materials
Author Contributions
Funding
Data Availability Statement
Conflicts of Interest
References
- China Renewable Energy Engineering Institute. China Renewable Energy Development Report 2021; China Water&Power Press: Beijing, China, 2022. [Google Scholar]
- China Renewable Energy Engineering Institute. Development Report of Pumped Storage Industry 2023; China Water&Power Press: Beijing, China, 2024. [Google Scholar]
- National Energy Administration. Medium and Long-Term Development Plan for Pumped Storage (2021–2035). Available online: http://zfxxgk.nea.gov.cn/1310193456_16318589869941n.pdf?eqid=dfb973150005d1960000000364887a20 (accessed on 11 December 2024).
- You, P.; Liu, S.; Guo, S. A hybrid novel fuzzy MCDM method for comprehensive performance evaluation of pumped storage power station in China. Mathematics 2022, 10, 71. [Google Scholar] [CrossRef]
- Tan, Y.; Xie, G.; Xiao, Y.; Luo, Y.; Xie, X.; Wen, M. Comprehensive benefit evaluation of hybrid pumped-storage power stations based on improved rank correlation-entropy weight method. Energies 2022, 15, 8414. [Google Scholar] [CrossRef]
- Lu, Y.; Liu, X.; Zhang, Y.; Yang, Z.; Wu, Y. Investment efficiency assessment model for pumped storage power plants considering grid operation demand under fuzzy environment: A case study in China. Sustainability 2023, 15, 8724. [Google Scholar] [CrossRef]
- Yang, Y.; Yang, Y.; Lu, Q.; Liu, D.; Xie, P.; Wang, M.; Yu, Z.; Liu, Y. Comprehensive evaluation of a pumped storage operation effect considering multidimensional benefits of a new power system. Energies 2024, 17, 4449. [Google Scholar] [CrossRef]
- Serrano-Canalejo, C.; Sarrias-Mena, R.; Garcia-Trivino, P.; Fernandez-Ramirez, L.M. Energy management system design and economic feasibility evaluation for a hybrid wind power/pumped hydroelectric power plant. IEEE Lat. Am. Trans. 2019, 17, 1686–1693. [Google Scholar] [CrossRef]
- Zhang, S.; Yang, W.; Li, X.; Zhao, Z.; Wang, R.; Li, Y. Economic evaluation of wind–pv–pumped storage hybrid system considering carbon emissions. Energy Rep. 2022, 8, 1249–1258. [Google Scholar] [CrossRef]
- Xiao, Y.; Su, Q.; Bresler, F.S.S.; Carroll, R.; Schmitt, J.R.; Olaleye, M. Performance-based regulation model in PJM wholesale markets. In Proceedings of the 2014 IEEE PES General Meeting | Conference & Exposition, National Harbor, MD, USA, 27–31 July 2014; pp. 1–5. [Google Scholar]
- Wessel, M.; Madlener, R.; Hilgers, C. Economic feasibility of semi-underground pumped storage hydropower plants in open-pit mines. Energies 2020, 13, 4178. [Google Scholar] [CrossRef]
- Martínez-Jaramillo, J.E.; Ackere, A.v.; Larsen, E.R. Transitioning towards a 100% solar-hydro based generation: A system dynamic approach. Energy 2022, 239, 122360. [Google Scholar] [CrossRef]
- Li, H.; Zheng, H.; Zhou, B.; Li, G.; Yang, B.; Hu, B.; Ma, M. Two-part tariff of pumped storage power plants for wind power accommodation. Sustainability 2022, 14, 5603. [Google Scholar] [CrossRef]
- Zhang, X.; Lian, J.; Tao, Y.; Ma, C.; Chen, D.; Chen, M.; Xu, B. Capacity tariff mechanism of a pumped hydro storage station: Pricing approaches for reducing benefit allocation unfairness of integrated renewable energy systems. J. Energy Storage 2023, 71, 108156. [Google Scholar] [CrossRef]
- Tian, B.; He, Y.; Zhou, J.; Wang, B.; Wang, Y.; Shi, W. Cost-sharing mechanisms for pumped storage plants at different market stages in China. Renew. Energy 2023, 217, 119183. [Google Scholar] [CrossRef]
- National Development and Reform Commission. Opinions of National Development and Reform Commission on Further Improving the Price Formation Mechanism of Pumped Storage. Available online: https://www.gov.cn/zhengce/zhengceku/2021-05/08/content_5605367.htm (accessed on 10 February 2025).
- The State Council; The People’s Republic of China. Guidelines for Tax and fee Preferentialpolicies Supporting Green Development. Available online: https://www.gov.cn/xinwen/2022-06/01/content_5693350.htm (accessed on 15 March 2025).
- National Development and Reform Commission; National Energy Administration. Notice on the Issuance of “Basic Rules for Medium and Long-Term Electricity Trading”. Available online: https://www.gov.cn/gongbao/content/2020/content_5532632.htm?eqid=a525e5e70000f3be000000046463381e (accessed on 10 March 2025).
- National Development and Reform Commission; National Energy Administration. Notice on the Establishment of Coal Power Capacity Pricing Mechanism. Available online: https://www.gov.cn/zhengce/zhengceku/202311/content_6914744.htm (accessed on 15 December 2024).
- National Energy Administration. Regulations on Power Grid Connection Operation Management. Available online: https://www.cec.org.cn/upload/1/editor/1640768317460.pdf (accessed on 5 January 2025).
- National Energy Administration. Management Measures for Power Ancillary Services. Available online: https://zfxxgk.nea.gov.cn/2021-12/21/c_1310391161.htm (accessed on 5 January 2025).
- Zhao, C.; Ma, L.; Zhai, H. Benefit analysis of pumped storage power station based on peak-valley electricity price. Constr. Econ. 2022, 43, 467–470. [Google Scholar] [CrossRef]
- Ma, L.; Zhai, H.; Yang, W.; Zhao, C. Benefit analysis of pumped storage power station based on spot market. Water Resour. Hydropower Eng. 2023, 54, 283–289. [Google Scholar] [CrossRef]
- Sekulic, A.; Kilibarda, M.; Heuvelink, G.B.M.; Nikolic, M.; Bajat, B. Random Forest Spatial Interpolation. Remote Sens. 2020, 12, 1687. [Google Scholar] [CrossRef]
- National Development and Reform Commission. Regulations on the Approval of Capacity Tariffs for Pumped Storage. Available online: https://www.ndrc.gov.cn/xxgk/zcfb/tz/202105/P020210507591035697887.pdf (accessed on 11 January 2025).
- Anwar, A.; Siddique, M.; Dogan, E.; Sharif, A. The moderating role of renewable and non-renewable energy in environment-income nexus for ASEAN countries: Evidence from Method of Moments Quantile Regression. Renew. Energy 2021, 164, 956–967. [Google Scholar] [CrossRef]
- Schonlau, M.; Zou, R.Y. The random forest algorithm for statistical learning. Stata J. 2020, 20, 3–29. [Google Scholar] [CrossRef]
- Meng, X.; Li, S.; Hu, S.; Tang, W. Influencing factors of pumped storage power stations from the perspectiveof multi-energy complementarity: A case study of Liaoning Qingyuan pumped storage power station. Acta Sci. Nat. Univ. Pekin. 2024, 60, 917–926. [Google Scholar] [CrossRef]
- Menéndez, J.; Fernández-Oro, J.M.; Loredo, J. Economic feasibility of underground pumped storage hydropower plants providing ancillary services. Appl. Sci. 2020, 10, 3947. [Google Scholar] [CrossRef]
- Zhang, Z.; Cong, W.; Liu, S.; Li, C.; Qi, S. Auxiliary service market model considering the participation of pumped-storage power stations in peak shaving. Front. Energy Res. 2022, 10, 915125. [Google Scholar] [CrossRef]
- Chen, J.; Yang, W.; Li, Y.; Liao, Y.; Cheng, Y. Quantifying the performance and compensation of secondary frequency regulation of pumped storage plants considering variable-speed operation. Front. Energy Res. 2024, 12, 1358150. [Google Scholar] [CrossRef]
- Pan, Z.F.; Wang, Y.L.; Wang, K.; Chen, H.T.; Yang, C.H.; Gui, W.H. Imputation of missing values in time series using an adaptive-learned median-filled deep autoencoder. IEEE Trans. Cybern. 2023, 53, 695–706. [Google Scholar] [CrossRef] [PubMed]
- Zossi, B.S.; Medina, F.D.; Duran, T.; Fagre, M.; Barbas, B.F.D.; Elias, A.G. Filling ionospheric monthly medians missing data: A machine learning approach. Proc. R. Soc. A-Math. Phys. Eng. Sci. 2025, 481, 20240566. [Google Scholar] [CrossRef]
- Torres-Sanchez, R.; Navarro-Hellin, H.; Guillamon-Frutos, A.; San-Segundo, R.; Ruiz-Abellón, M.C.; Domingo-Miguel, R. A decision support system for irrigation management: Analysis and implementation of different learning techniques. Water 2020, 12, 548. [Google Scholar] [CrossRef]
- Kroll, C.N.; Song, P. Impact of multicollinearity on small sample hydrologic regression models. Water Resour. Res. 2013, 49, 3756–3769. [Google Scholar] [CrossRef]
- Månsson, K.; Kibria, B.M.G.; Shukur, G.; Sjölander, P. On the estimation of the CO2 emission, economic growth and energy consumption nexus using dynamic OLS in the presence of multicollinearity. Sustainability 2018, 10, 1315. [Google Scholar] [CrossRef]
- Xu, D.; Zhai, G.; Liu, X. Research on the calculation method for the frequency modulation and reserve benefits of pumped-storage station. J. Hydroelectr. Eng. 2001, 3, 1–10. [Google Scholar] [CrossRef]
- Li, C. The role and prospect of pumped storage power stations in China’s power system. In Proceedings of the 2004 National Academic Conference on Pumped Storage, Nanjing, China, 1 November 2004; pp. 64–70. [Google Scholar]
- Liu, F.; Che, Y.Y.; Tian, X.; Xu, D.C.; Zhou, H.J.; Li, Z.Y. Cost sharing mechanisms of pumped storage stations in the new-type power system: Review and prospect. J. Shanghai Jiao Tong Univ. 2023, 57, 757–768. [Google Scholar] [CrossRef]
- Tang, Q.; Xiao, Y.; Xiang, Z. Research on pricing and clearing mechanism of regulation market and its enlightenment. In Proceedings of the 2019 Academic Annual Conference of the Electric Power Market Professional Committee of the China Electrical Engineering Society, Chengdu, China, 3–4 September 2019; pp. 1–11. [Google Scholar]
- Li, X.; Tan, Z.; Shen, J.; Yang, J.; Fan, W.; Zhao, H.; Zhang, T. Research on the operation strategy of joint wind-photovoltaic-hydropower-pumped storage participation in electricity market based on Nash negotiation. J. Clean. Prod. 2024, 442, 140981. [Google Scholar] [CrossRef]
- Thomas, K.; Lindsey, R.; Patrick, M.; Hoyt, B.; Rajesh, D. Valuing Hydropower Grid Services in the Future Electricity Grid. Available online: https://www.factorthis.com/energy-business/energy-finance/valuing-hydropower-grid-services-in-the-future-electricity-grid/ (accessed on 22 May 2025).
- Luo, K.; Wang, R.; Chen, Q. The analysis of the business models of foreign pumped storage hydro plants. Energy China 2022, 44, 16–23. [Google Scholar] [CrossRef]
- Groen, E.A.; Bokkers, E.A.M.; Heijungs, R.; de Boer, I.J.M. Methods for global sensitivity analysis in life cycle assessment. Int. J. Life Cycle Assess. 2017, 22, 1125–1137. [Google Scholar] [CrossRef]
- Tian, W. A review of sensitivity analysis methods in building energy analysis. Renew. Sust. Energ. Rev. 2013, 20, 411–419. [Google Scholar] [CrossRef]
- Luo, S.; Han, B.; Liu, Y.; Liu, G. Research on the main functions of pumped-storage plants in Guangdong. South. Energy Constr. 2017, 4, 69–74. [Google Scholar] [CrossRef]
- National Energy Administration. Regulatory Report on the Operation of Pumped Storage Power Stations in North China and East China Regions. Available online: https://zfxxgk.nea.gov.cn/auto92/201505/t20150519_1927.htm?utm_source=chatgpt.com (accessed on 11 January 2025).
- Han, L.; Li, Y.; Chen, H.; Lu, N. Electricity pricing with continuous-time commodity model and non-monotonic load curve. CSEE J. Power Energy Syst. 2024, 10, 272–280. [Google Scholar] [CrossRef]
- Nikolaos, P.C.; Marios, F.; Dimitris, K. A review of pumped hydro storage systems. Energies 2023, 16, 4516. [Google Scholar] [CrossRef]
- Normyle, A.; Pittock, J. A review of the impacts of pumped hydro energy storage construction on subalpine and alpine biodiversity: Lessons for the Snowy Mountains pumped hydro expansion project. Aust. Geogr. 2020, 51, 53–68. [Google Scholar] [CrossRef]
- Karambelkar, S.; Cantor, A.; Bui, T.-K.; Turley, B.; Fischer, M.; Ames, S. Pumped storage hydropower in the united states: Emerging importance, environmental and social impacts, and critical considerations. WIREs Water 2025, 12, e70017. [Google Scholar] [CrossRef]
- Immendoerfer, A.; Tietze, I.; Hottenroth, H.; Viere, T. Life-cycle impacts of pumped hydropower storage and battery storage. Int. J. Energy Environ. Eng. 2017, 8, 231–245. [Google Scholar] [CrossRef]
- Simon, T.R.; Inman, D.; Hanes, R.; Avery, G.; Hettinger, D.; Heath, G. Life cycle assessment of closed-loop pumped storage hydropower in the United States. Environ. Sci. Technol. 2023, 57, 12251–12258. [Google Scholar] [CrossRef]
- Xu, S.; Zhang, G.; Wang, F.; Pu, L. Study on carbon emission reduction calculation method for pumped storage based on CCER rules. Electr. Power 2024, 57, 175–182. [Google Scholar]


| Peak–Valley Tariff Ratio in Northern Hebei Grid | Time Period | Time-of-Use Tariffs CNY/kWh |
|---|---|---|
| 2.64 | Peak: 08:00–12:00, 16:00–20:00 | 0.48 |
| Mid-peak: 07:00–08:00, 12:00–16:00, 20:00–22:00 | 0.41 | |
| Off-peak: 22:00–07:00 | 0.19 | |
| 3 | Summer (June, July, and August) | |
| Off-peak: 00:00–07:00, 23:00–24:00 | 0.17 | |
| Mid-peak: 07:00–10:00, 12:00–14:00, 18:00–19:00, 21:00–23:00 | 0.43 | |
| Peak: 11:00–12:00, 14:00–17:00, 19:00–20:00 | 0.45 | |
| Critical-peak: 10:00–11:00, 17:00–18:00, 20:00–21:00 | 0.54 | |
| Winter (November to December and the Following January Each Year) | ||
| Off-peak: 00:00–07:00, 23:00–24:00 | 0.17 | |
| Mid-peak: 07:00–08:00, 09:00–10:00, 11:00–14:00, 20:00–23:00 | 0.40 | |
| Peak: 08:00–09:00, 10:00–11:00, 14:00–17:00, 19:00–20:00 | 0.48 | |
| Critical-peak: 17:00–19:00 | 0.58 | |
| Other seasons (February to May and September to October Each Year) | ||
| Off-peak: 00:00–07:00, 23:00–24:00 | 0.17 | |
| Mid-peak: 07:00–09:00, 12:00–15:00, 18:00–19:00, 21:00–23:00 | 0.40 | |
| Peak: 09:00–12:00, 15:00–18:00, 19:00–21:00 | 0.49 | |
| 5.7 | Summer (June, July, and August) | |
| Off-peak: 00:00–7:00, 23:00–24:00 | 0.10 | |
| Mid-peak: 07:00–10:00, 12:00–16:00, 22:00–23:00 | 0.47 | |
| Peak: 10:00–12:00, 16:00–17:00, 20:00–22:00 | 0.50 | |
| Critical-peak: 17:00–20:00 | 0.61 | |
| Winter (November to December and the Following January Each Year) | ||
| Off-peak: 01:00–07:00, 12:00–14:00 | 0.16 | |
| Mid-peak: 00:00–01:00, 07:00–08:00, 10:00–12:00, 14:00–16:00, 22:00–24:00 | 0.38 | |
| Peak: 08:00–10:00, 16:00–17:00, 19:00–22:00 | 0.56 | |
| Critical-peak: 17:00–19:00 | 0.67 | |
| Other seasons (February to May and September to October Each Year) | ||
| Off-peak: 01:00–07:00, 12:00–14:00 | 0.16 | |
| Mid-peak: 00:00–01:00, 07:00–08:00, 10:00–12:00, 14:00–16:00, 22:00–24:00 | 0.38 | |
| Peak: 08:00–10:00, 16:00–22:00 | 0.58 | |
| Variable | Unit | Definition | Interpretation |
|---|---|---|---|
| MW | The maximum available generation capacity of a PSPS as per design | Represents service scale and operational capability of station | |
| 104 CNY | The total monthly compensation obtained through electricity transactions for providing peak shaving ancillary services in the station’s region | Indicates intensity of system demand and price level for peak shaving services | |
| 104 CNY | The total monthly compensation obtained through electricity transactions for providing FM ancillary services in the station’s region | Reflects market value and trading activity level of system frequency regulation resources | |
| 100 million kWh | The total monthly electricity consumption in the provinces primarily served by the PSPS | Represents overall load level in service area | |
| 100 million kWh | The total monthly hydroelectricity generated | Indicates operational intensity and utilization rate of PSPS | |
| 100 million kWh | The total monthly electricity consumption for pumping operations | Indicates operational intensity and utilization rate of PSPS |
| Station | Installed Capacity | Region |
|---|---|---|
| PSPS 1 | 1800 MW | Xuancheng, Anhui |
| PSPS 2 | 1200 MW | Taizhou, Zhejiang |
| PSPS 3 | 600 MW | Chuzhou, Anhui |
| PSPS 4 | 1000 MW | Wuxi, Jiangsu |
| PSPS 5 | 1500 MW | Liyang, Jiangsu |
| PSPS 6 | 2100 MW | Huzhou, Zhejiang |
| PSPS 7 | 80 MW | Lu’an, Anhui |
| PSPS 8 | 80 MW | Ningbo, Zhejiang |
| Indicator | Unit | Value |
|---|---|---|
| Fixed Asset Investment | 104 CNY | 810,560 |
| Working Capital | 104 CNY | 1800 |
| Annual Loan Interest Rate | % | 5.94 |
| Annual Interest Rate for Working Capital Loan | % | 5.31 |
| Loan Repayment Period | Year | 25 |
| Depreciation Rate | % | 4 |
| Maintenance Fee Rate | % | 1.5 |
| Employee Welfare Rate | % | 63 |
| Average Annual Employee Salary | 104 CNY/Person | 5 |
| Insurance Rate | ‰ | 2.5 |
| Reservoir Area Fund | CNY/kWh | 0.001 |
| Material Cost | CNY/kW | 2 |
| Other Costs | CNY/kW | 12 |
| Variable | Coef | Std. Error | t-Value | p-Value | 95%CI [0.025, 0.975] |
|---|---|---|---|---|---|
| Intercept | 139,700 | 4103.447 | 34.049 | 0.000 | [1.32 × 10⁵, 1.48 × 10⁵] |
| x1 | 32,430 | 5879.502 | 5.516 | 0.000 | [2.08 × 10⁴, 4.41 × 10⁴] |
| x5 | 36,240 | 5808.505 | 6.239 | 0.000 | [2.48 × 10⁴, 4.77 × 10⁴] |
| lnx4 | 23,240 | 4122.360 | 5.637 | 0.000 | [1.51 × 10⁴, 3.14 × 10⁴] |
Disclaimer/Publisher’s Note: The statements, opinions and data contained in all publications are solely those of the individual author(s) and contributor(s) and not of MDPI and/or the editor(s). MDPI and/or the editor(s) disclaim responsibility for any injury to people or property resulting from any ideas, methods, instructions or products referred to in the content. |
© 2025 by the authors. Licensee MDPI, Basel, Switzerland. This article is an open access article distributed under the terms and conditions of the Creative Commons Attribution (CC BY) license (https://creativecommons.org/licenses/by/4.0/).
Share and Cite
Feng, C.; Guo, Q.; Liu, Q.; Jian, F. An Optimized Dynamic Benefit Evaluation Method for Pumped Storage Projects in the Context of the “Dual Carbon” Goal. Energies 2025, 18, 2815. https://doi.org/10.3390/en18112815
Feng C, Guo Q, Liu Q, Jian F. An Optimized Dynamic Benefit Evaluation Method for Pumped Storage Projects in the Context of the “Dual Carbon” Goal. Energies. 2025; 18(11):2815. https://doi.org/10.3390/en18112815
Chicago/Turabian StyleFeng, Cong, Qi Guo, Qian Liu, and Feihong Jian. 2025. "An Optimized Dynamic Benefit Evaluation Method for Pumped Storage Projects in the Context of the “Dual Carbon” Goal" Energies 18, no. 11: 2815. https://doi.org/10.3390/en18112815
APA StyleFeng, C., Guo, Q., Liu, Q., & Jian, F. (2025). An Optimized Dynamic Benefit Evaluation Method for Pumped Storage Projects in the Context of the “Dual Carbon” Goal. Energies, 18(11), 2815. https://doi.org/10.3390/en18112815