Review

Investigating Wind Energy Curtailment to Enable Constraint Analysis and Green Hydrogen Potential in Scotland’s Energy Infrastructure

by
Thomas Storey
1,
Wolf-Gerrit Früh
2 and
Sudhagar Pitchaimuthu
1,*
1
Research Centre for Carbon Solutions (RCCS), Institute of Mechanical, Processing and Energy Engineering, School of Engineering and Physical Sciences, Heriot-Watt University, Edinburgh EH14 4AS, UK
2
Institute of Mechanical, Processing and Energy Engineering, School of Engineering and Physical Sciences, Heriot-Watt University, Edinburgh EH14 4AS, UK
*
Author to whom correspondence should be addressed.
Energies 2025, 18(11), 2777; https://doi.org/10.3390/en18112777
Submission received: 4 February 2025 / Revised: 29 March 2025 / Accepted: 24 April 2025 / Published: 27 May 2025

Abstract

:
Curtailment of renewable energy is a growing issue in global energy infrastructure. A case study is carried out to investigate wind energy curtailment occurring in Scotland, which presents a growing issue, with an increasing amount of renewable energy going to waste. Complex relationships between grid constraints and wind farm operations must be explored to maximise utilisation of low-carbon electricity and to avoid the “turn-up” of non-renewable sources. Transmission zones and boundaries are considered and mapped, and a novel method of direct measurement of curtailment for transmission-level assets is proposed, with an intuitive, reproducible approach utilising balancing mechanism data. Curtailment data is examined and combined to find national trends, explore the viability of distributed hydrogen electrolysis, and compare curtailment and constraint directly across transmission boundaries. The weaknesses of the data collection methods are considered, solutions for a future iteration are proposed, and further uses of the outputs are discovered.

1. Introduction

As one of the world’s leading low-carbon electricity sources [1], wind energy has become a dominant proportion of Scotland’s energy mix. With wind producing 78% of all renewable energy output in Scotland in 2022 [2], driven by a rapid growth in wind farms [3]. Following the trend of increasing renewable energy capacity, from 1.4 GW in Q1 2001 to 13.6 GW in Q3 2022 [4], this change is set to continue, with a further 14.2 GW of onshore and offshore wind in the planning stage. However, an increasing dependence on renewable generation creates new challenges, such as oversupply to the grid system [5]. This directly results in an ever-increasing amount of wind generation being advised to turn down production in order to keep higher system stability [6]. This phenomenon is known as curtailment, and it has become a large issue, stopping further adoption of wind energy [7].
The mechanism that advises an operator to turn down production is known as the balancing mechanism and is utilised by the energy systems operator (ESO) to manage the real-time supply and demand [8], breaking each day into 48 settlement periods. The energy systems operator in Scotland is known as National Grid ESO, which also manages the transmission-level assets. Reducing the amount of curtailment to maximise outputs of wind energy generation is a crucial goal to deliver climate action [9].
Curtailment is a broad term and refers to the use of less wind power than is potentially available at a given time [10]. Curtailment is particularly acute for wind energy in Scotland, with 88% of wind curtailment across the UK occurring in Scotland. For the entire UK, there was 5.8 TWh of wind curtailment across 2020 and 2021 due to system actions, which caused 2% of the power sector’s CO2 emissions [8]. Curtailment has been found to be as high as 26% of annual output for some wind farms in Scotland [9].
A leading cause of curtailment is the lack of transmission capacity when wind penetration levels are high in a certain area [7], but any excess cannot be exported to other balancing areas. This cannot be easily solved due to the high cost of reinforcing the transmission network. When the network undergoes such issues, it is referred to as congestion or constraint, and there is a dependency on curtailment risk based on the location of the power system [11] and whether this area is constrained.
Carbon-intensive generation can be “turned up” to compensate for this curtailment when energy cannot be moved across transmission networks, resulting in increased emissions, along with increased consumer cost, rising from £299 m in 2020 to £507 m in 2021 [8]. These costs come from the backup plants which manage the variability of renewables, known as the “system integration” costs [12]. Costs relating to system operation increased by 62% between 2010 and 2018 for Great Britain. Congestion management costs have increased by 74% [12].
Modelling wind production (and hence curtailment) is complex due to the fluctuating nature of wind generation, making any predictions of production probabilistic [11]. Unless a historic approach is taken to using past generation data, a common approach is to consider the effects of wind integration into a transmission grid [13]. In 2019, a total of 1.9 TWh of electricity was discarded [3,9], and by 2021, the amount of curtailment was said to be “unacceptable” and continuing to increase [9]. Despite constraint concerns, Scotland has become the renewable powerhouse of the UK [9], with over half of Scottish generation coming from wind farms. Deployment of additional renewable energy assets into areas of network constraint will increase costs due to the “contract for difference” system utilised in the UK [14]. The current pricing schemes cause a high number of wind projects to be concentrated in the areas with the best conditions for generation, not where demand is greatest. There is also the issue that the grid was planned and deployed before large wind farms [9]. As such, due to large wind farms being in former low-demand zones, the infrastructure is currently not able to cope well with the large new sources of generation. Further development of Scottish wind is planned, with an additional 3.4 GW of capacity being added to the grid in areas such as offshore wind farms off the Moray Firth [4].
While curtailment for wind energy can be found in lower-voltage, distribution-level systems [15], the major impacts can be felt at the transmission level. The integration costs of installing variable wind energy to the grid are comprised of grid congestion management and balancing [12].
There are two key balancing concepts: that of energy and system balancing. Energy balancing is more straightforward and refers to matching generation to demand. To this end, when possible, wind energy will be prioritised, resulting in this type of balancing not having a large effect on curtailment [8]. However, system curtailment is based on constraints within the transmission infrastructure and is much more of a prevalent cause for curtailment of wind farms. As such, these constraints must be defined to understand and analyse much of the causes of curtailment.
Geographic analysis of the grid infrastructure is difficult, with most geographic data relating to energy systems being available in many different conflicting formats [16]. Constraint group data may be available in some regions; however, this may not align with the locations of the electrical substations for the high-level transmission zones. Furthermore, lower voltage distribution networks may lack the mapping of their higher voltage transmission counterparts, effectively meaning that there is a “missing link” between the two [16].
The ESO manages constraint at the transmission level [8] and utilises the balancing mechanism when constraint results in an inability to move power to demand areas. Overloading the system can result in voltage outages and breaking of thermal restrictions and can pose severe consequences for energy security [17].
In comparison to curtailment, constraint refers to the issues revolving around the localised network, such as voltage issues and thermal limits. The problem can be broken down into the issue of there being a higher generation than a particular area requires while also being unable to export to another area due to the voltage issues caused by thermal limits [6]. Congestion management is a vital issue within a deregulated energy market [17], which is bound to influence the rates of curtailment.
An area of serious concern is congestion between Scotland and England, with high wind energy generation in Scotland but low demand. Currently, the grid connections are insufficient to carry this generation to England and its higher demand zones [9] and must be investigated thoroughly.
To address wind curtailment issues, energy storage is considered a viable alternative to reinforcing transmission [7]; energy storage can be utilised as a “buffer” between supply and demand [9]. Adding an energy storage system to onshore wind farms allows for greater economic improvement, namely by utilising and selling curtailed energy later.
This can take many forms, although some of the most promising are scheduled battery storage and hydrogen electrolysis [18]. The energy storage methods are utilised during periods of curtailment, and current research typically models curtailment at one site. A coupled wind-hydrogen system offers a solution to the curtailment issue through production on the spot [19]. Although this has its own issues, namely that the efficiency of PEM (Proton Exchange Membrane) electrolysers can range from 65 to 68% [20] and that hydrogen systems have a high cost, so choosing the correct sizing of the hydrogen electrolyser is important [19] for economic viability. In prior cases, utilising a classical pumped storage solution dramatically reduced curtailment, sidestepping expensive increases to the operational limits of transmission capacity [7].
In its most basic form, hydrogen electrolysis splits water into hydrogen and oxygen through use of electrical energy [21], and electrolysers are in a limited state of operation in the real grid. However, it is expected that this will increase with time to effectively become a new source of demand during curtailment [8]. Electrolyser operation must be optimised to achieve the lowest hydrogen production cost [21], with considerations of hydrogen demand and curtailment made. Green hydrogen electrolysers can vary in size. For example, the Haeolus system in Norway comprises a 2.5 MW PEM electrolyser [22], of which the economics have been assessed [23]. Other electrolysers with sizes of 1 MW and 100 MW have also been simulated [24]; capacities can even range as high as 400 MW to 3 GW in other modelling studies [25]. This would provide the basis for the range of electrolyser sizes as outlined in Section 2.5.
GIS techniques have been used in the past to consider how to model hydrogen infrastructure in the UK energy system [26]. Drawing comparisons to any electrolyser placements found in Scotland is of great interest to see if demand can be reached more productively through preconceived routes. This is important when considering generation from either a centralised hydrogen electrolyser or a decentralised one [27].
This study explored wind curtailment challenges in the Scottish grid by exploring the potential of energy storage solutions. It focuses understanding wind energy generation and curtailment dynamics, developing a consistent methodology for measuring curtailment and analysing how infrastructure constraints affect curtailment patterns. By grouping high curtailment wind farms for hydrogen generation, this study presents optimal energy storage scenarios and expands the curtailment calculator tool’s applications, including potential of machine learning integration.
Only transmission-level assets are considered; no distribution-level consideration will be made. Furthermore, the inner workings of the hydrogen electrolysers will not be considered; as far as the study is concerned, the hydrogen electrolyser behaves as a “black box”. With a certain input energy required to meet full-capacity operational requirements.

2. Methodology

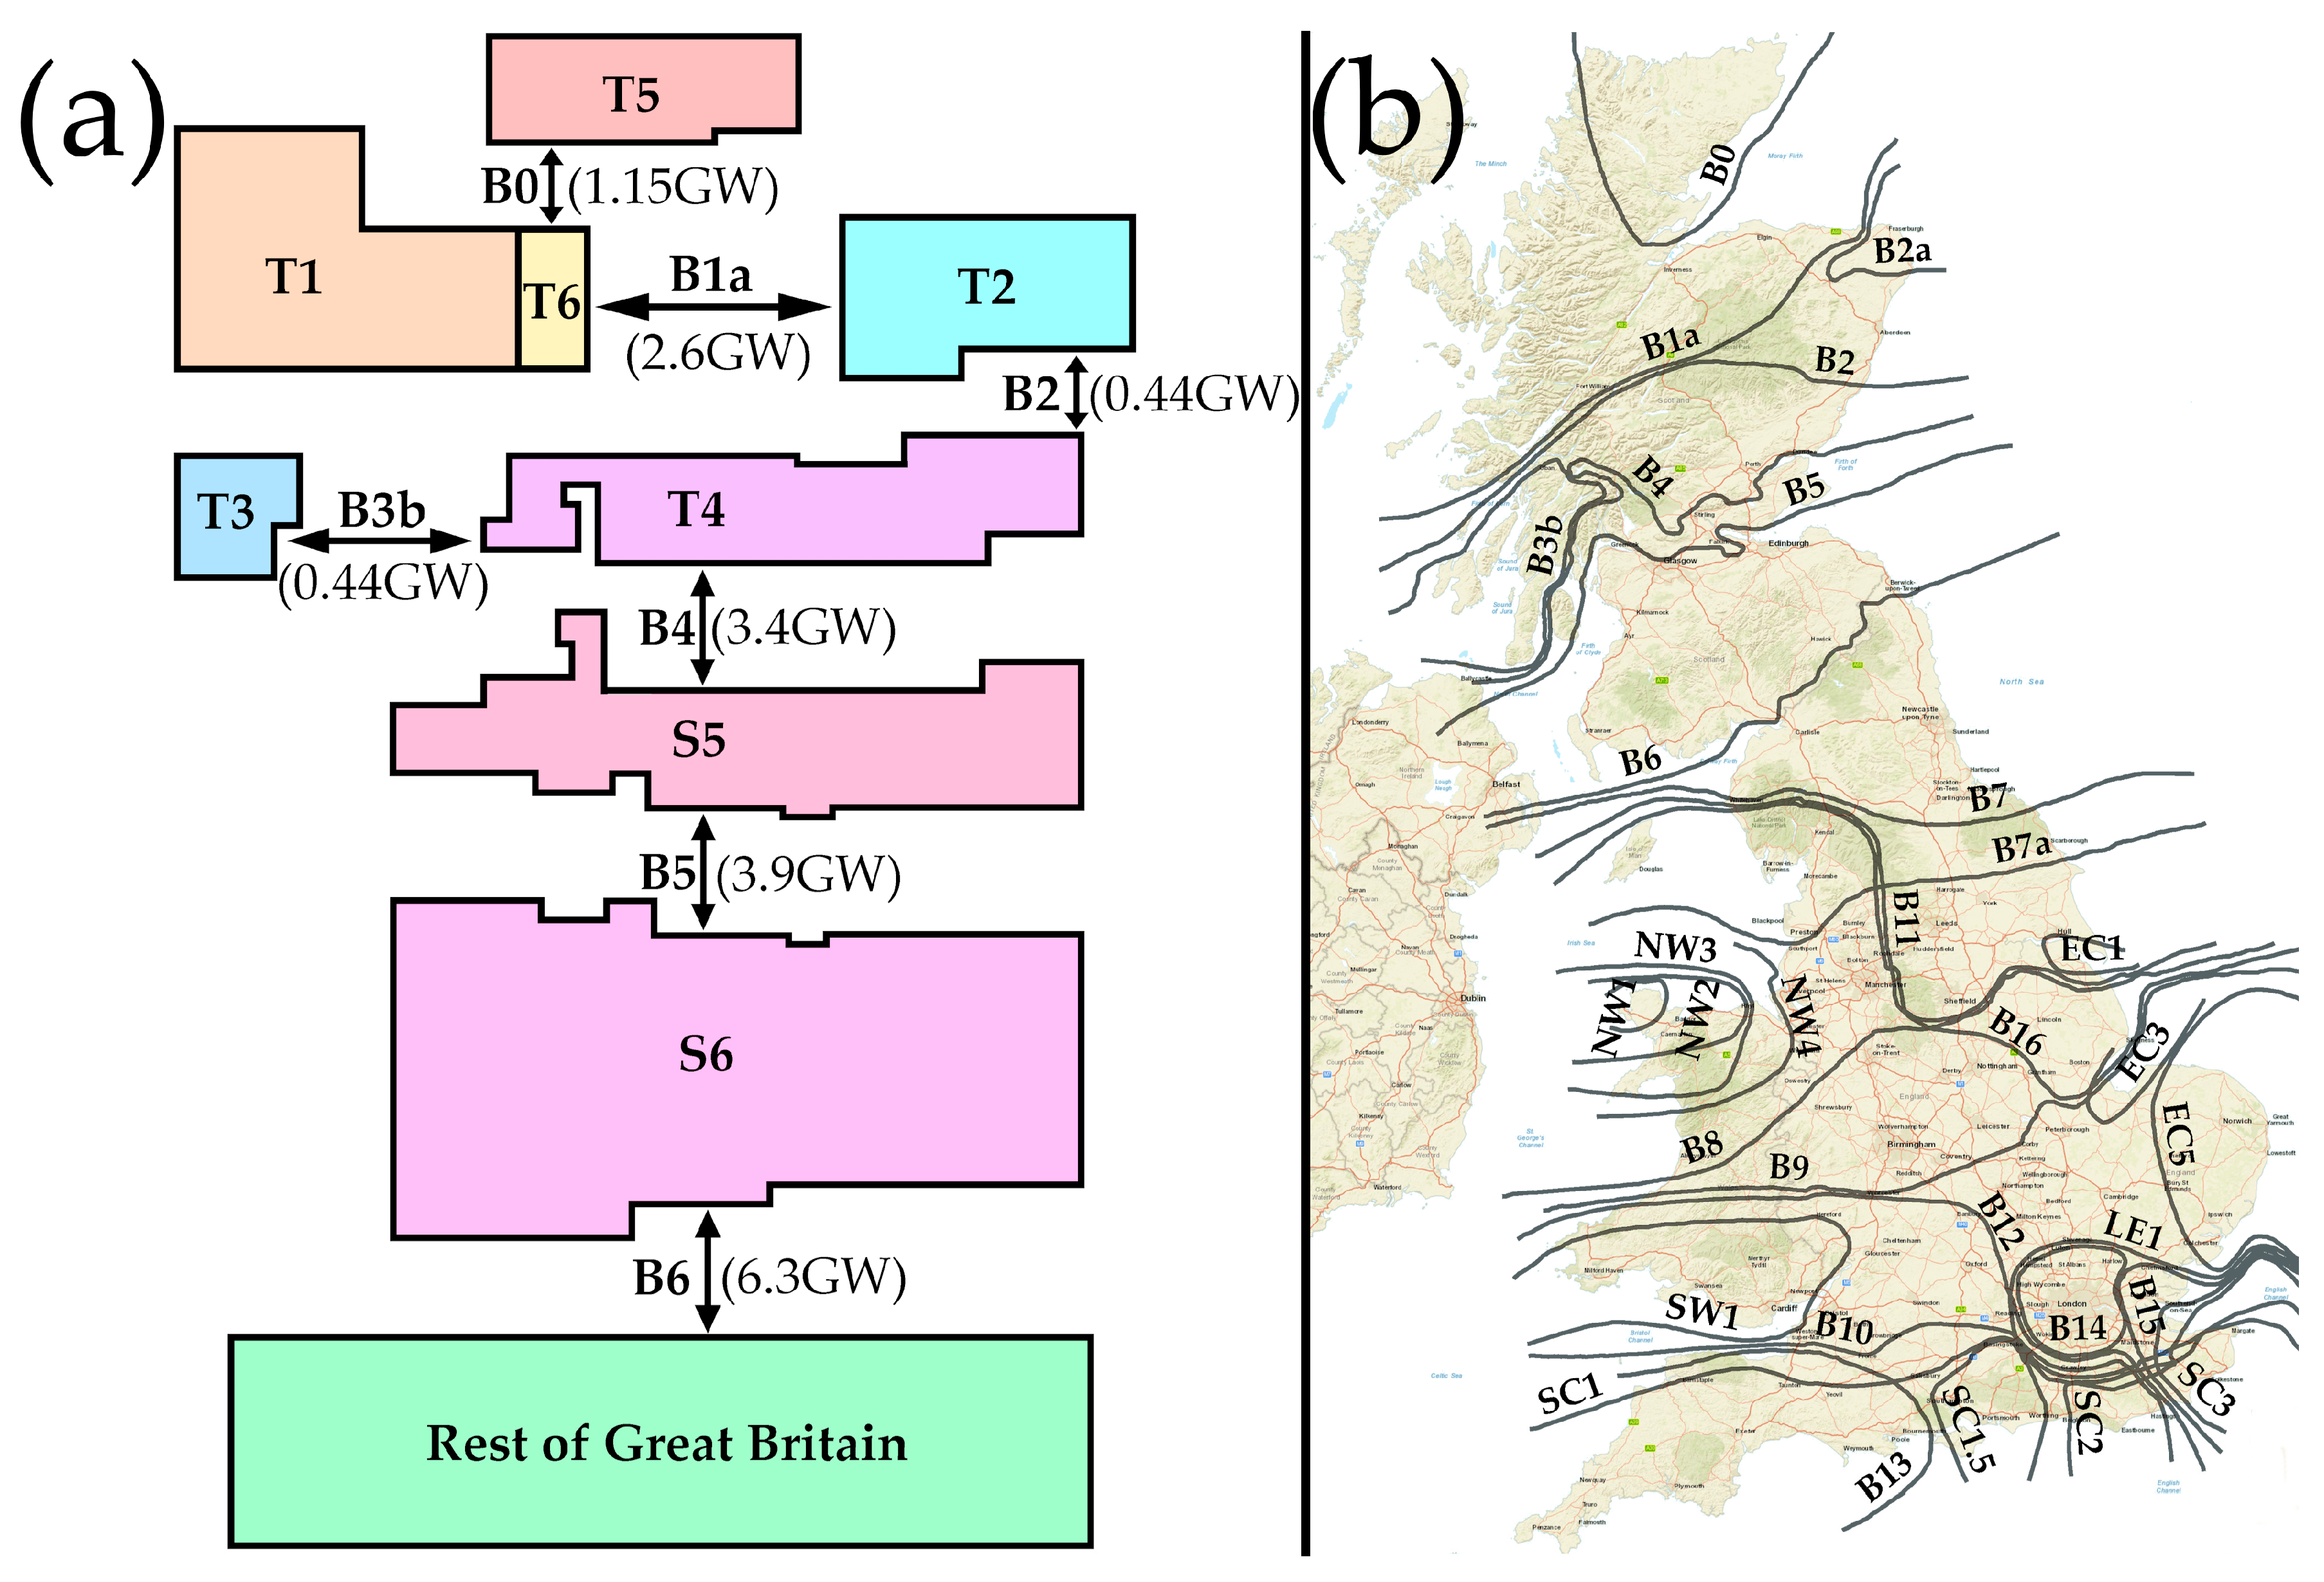
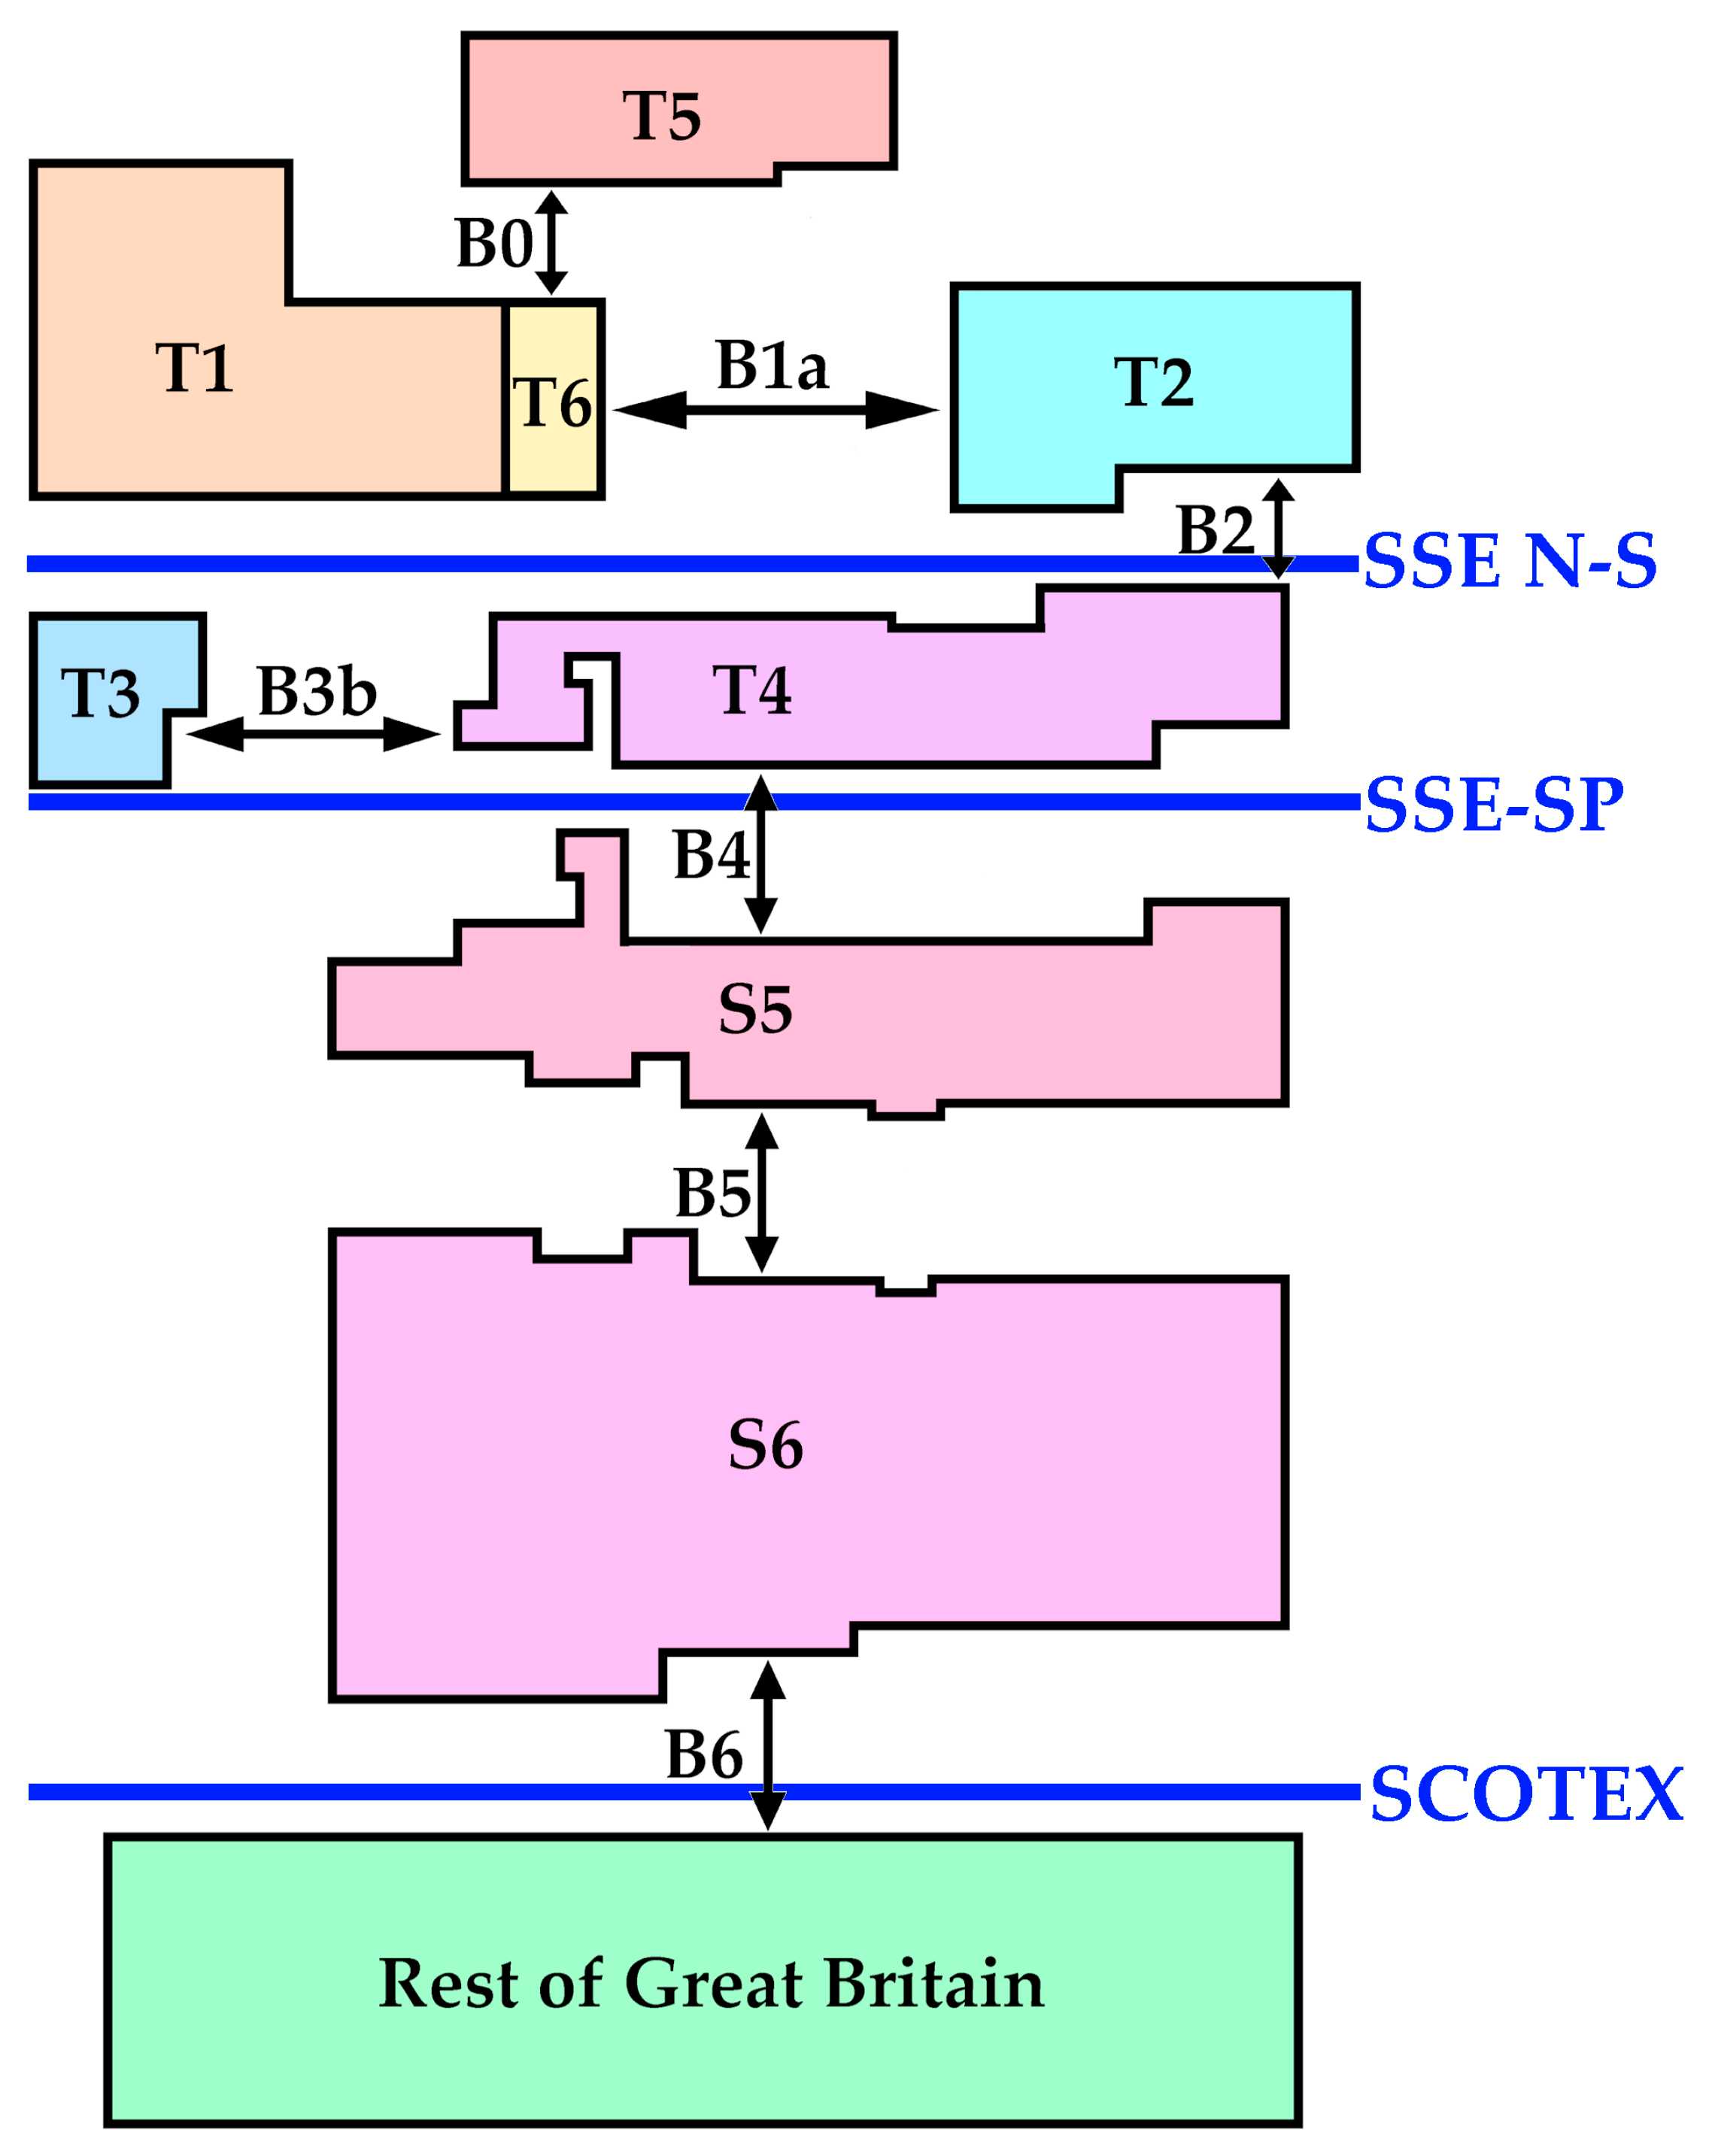
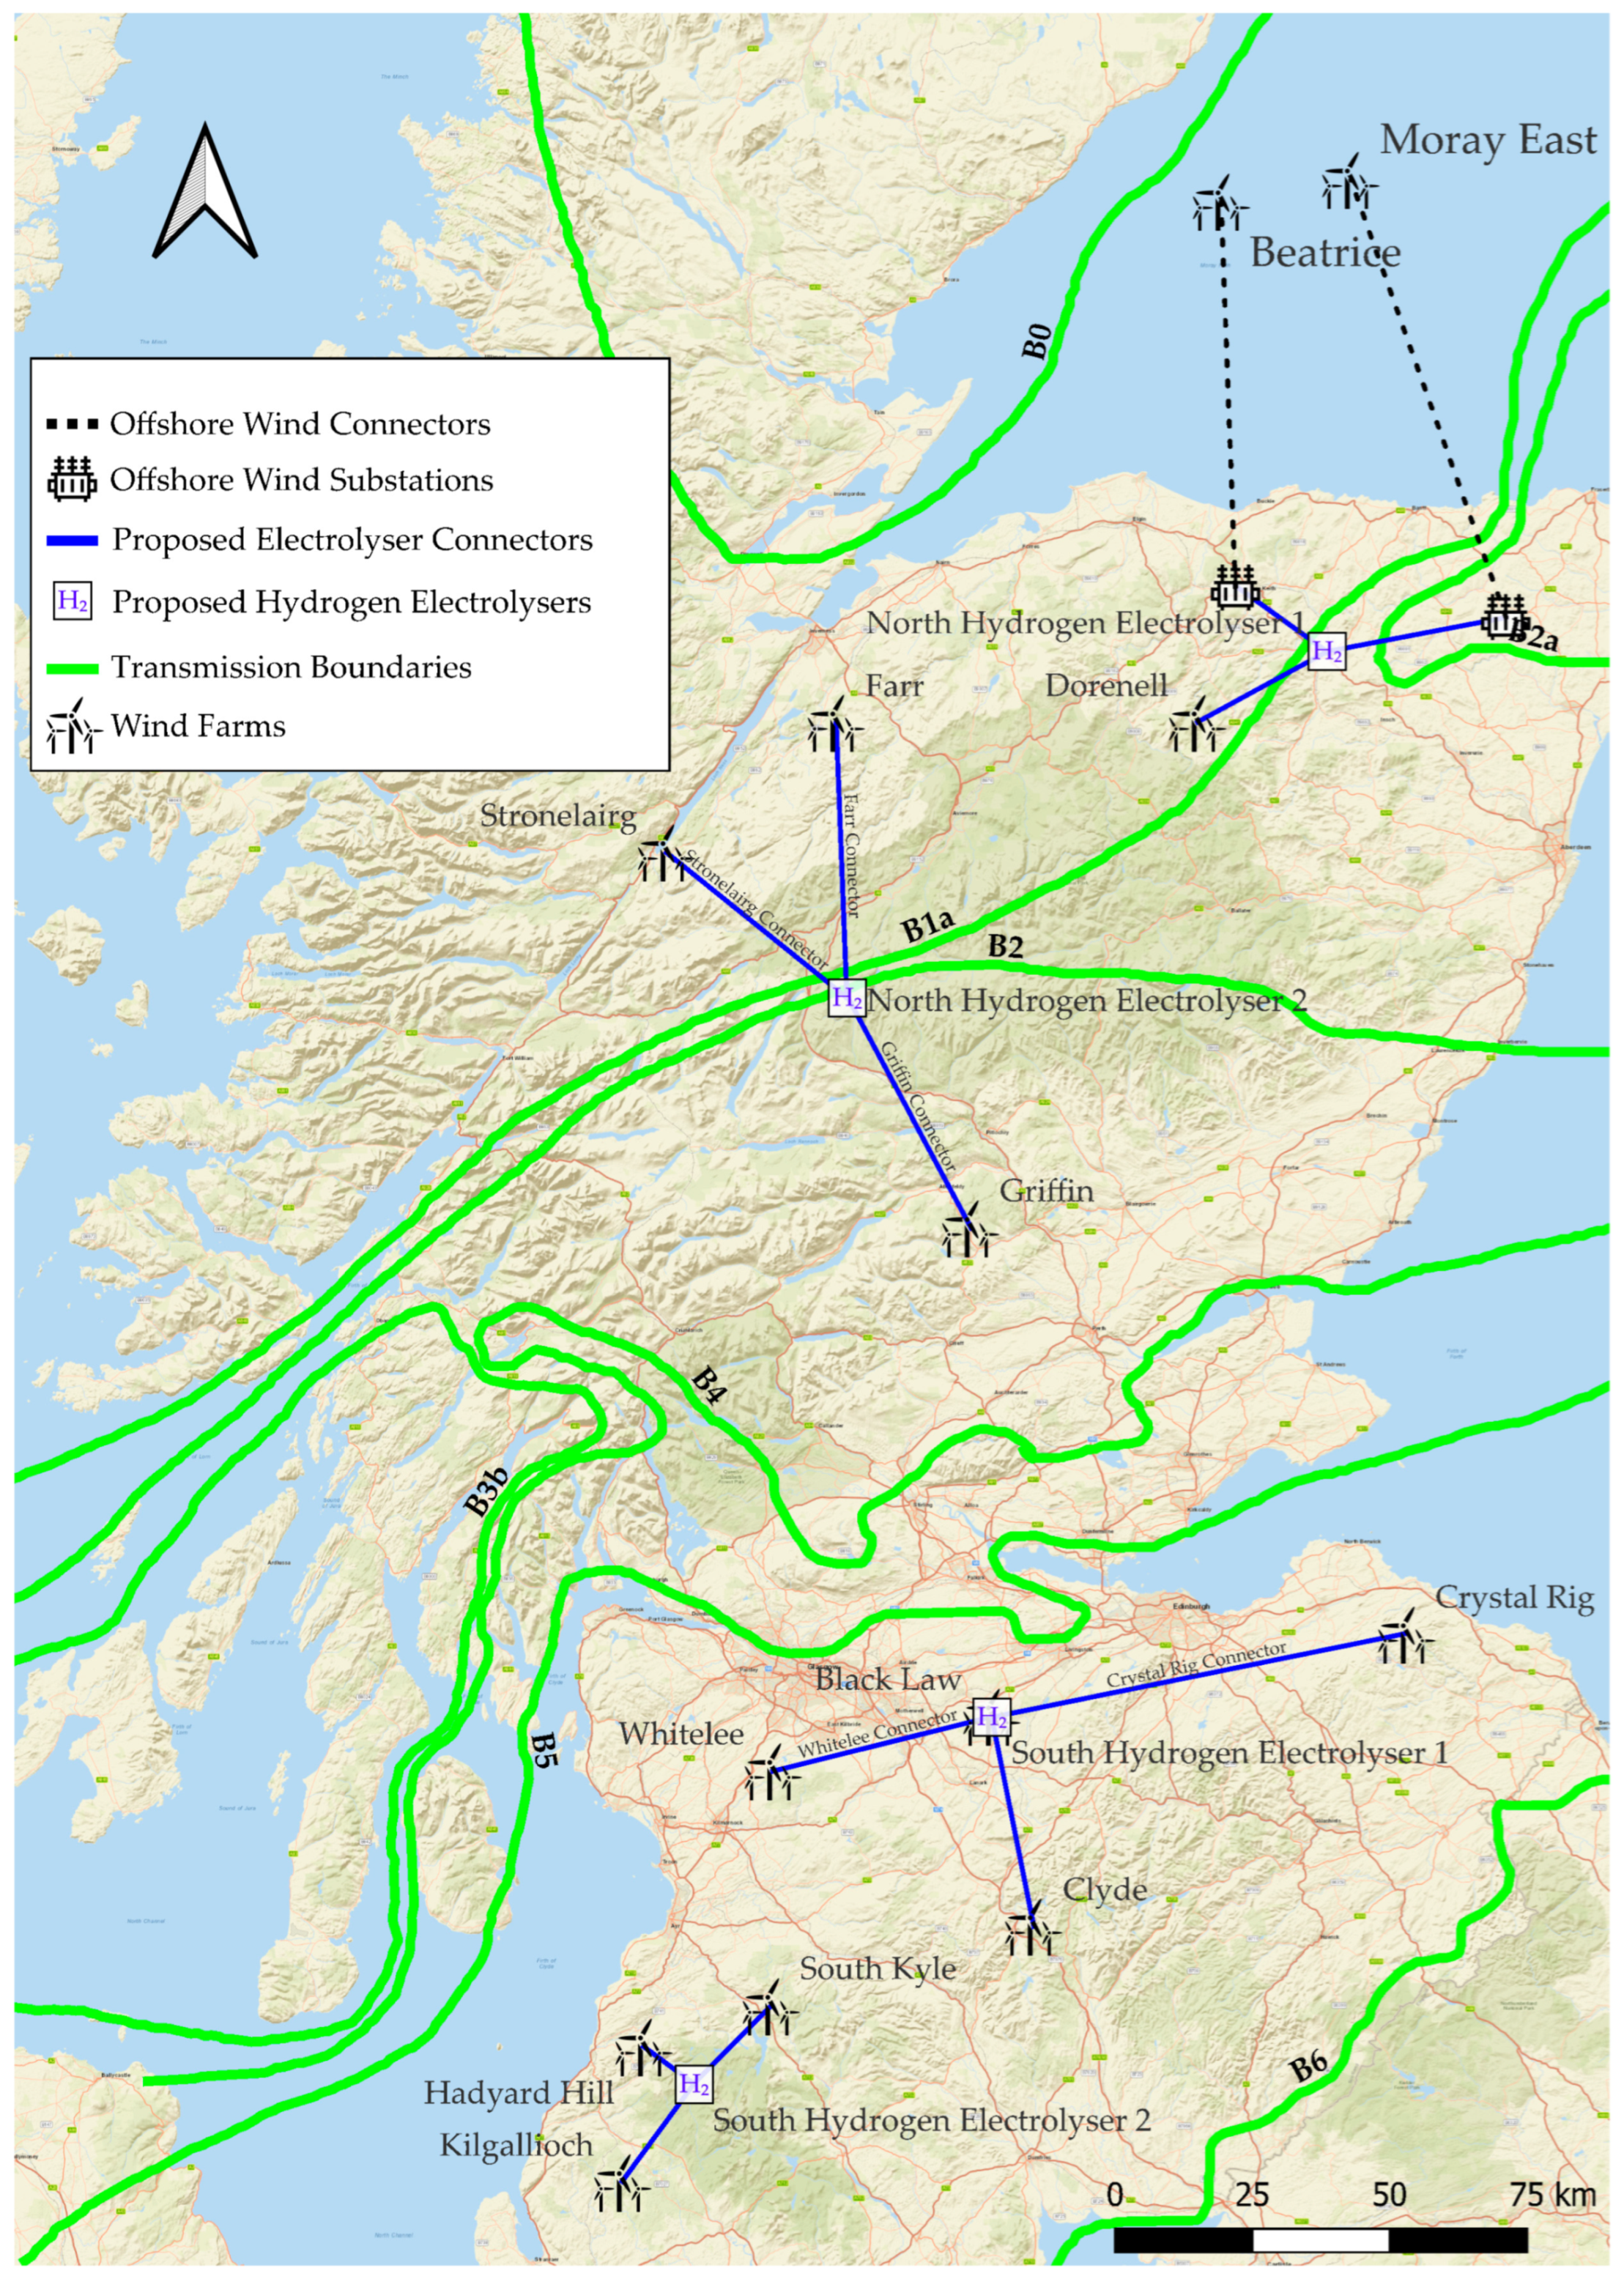
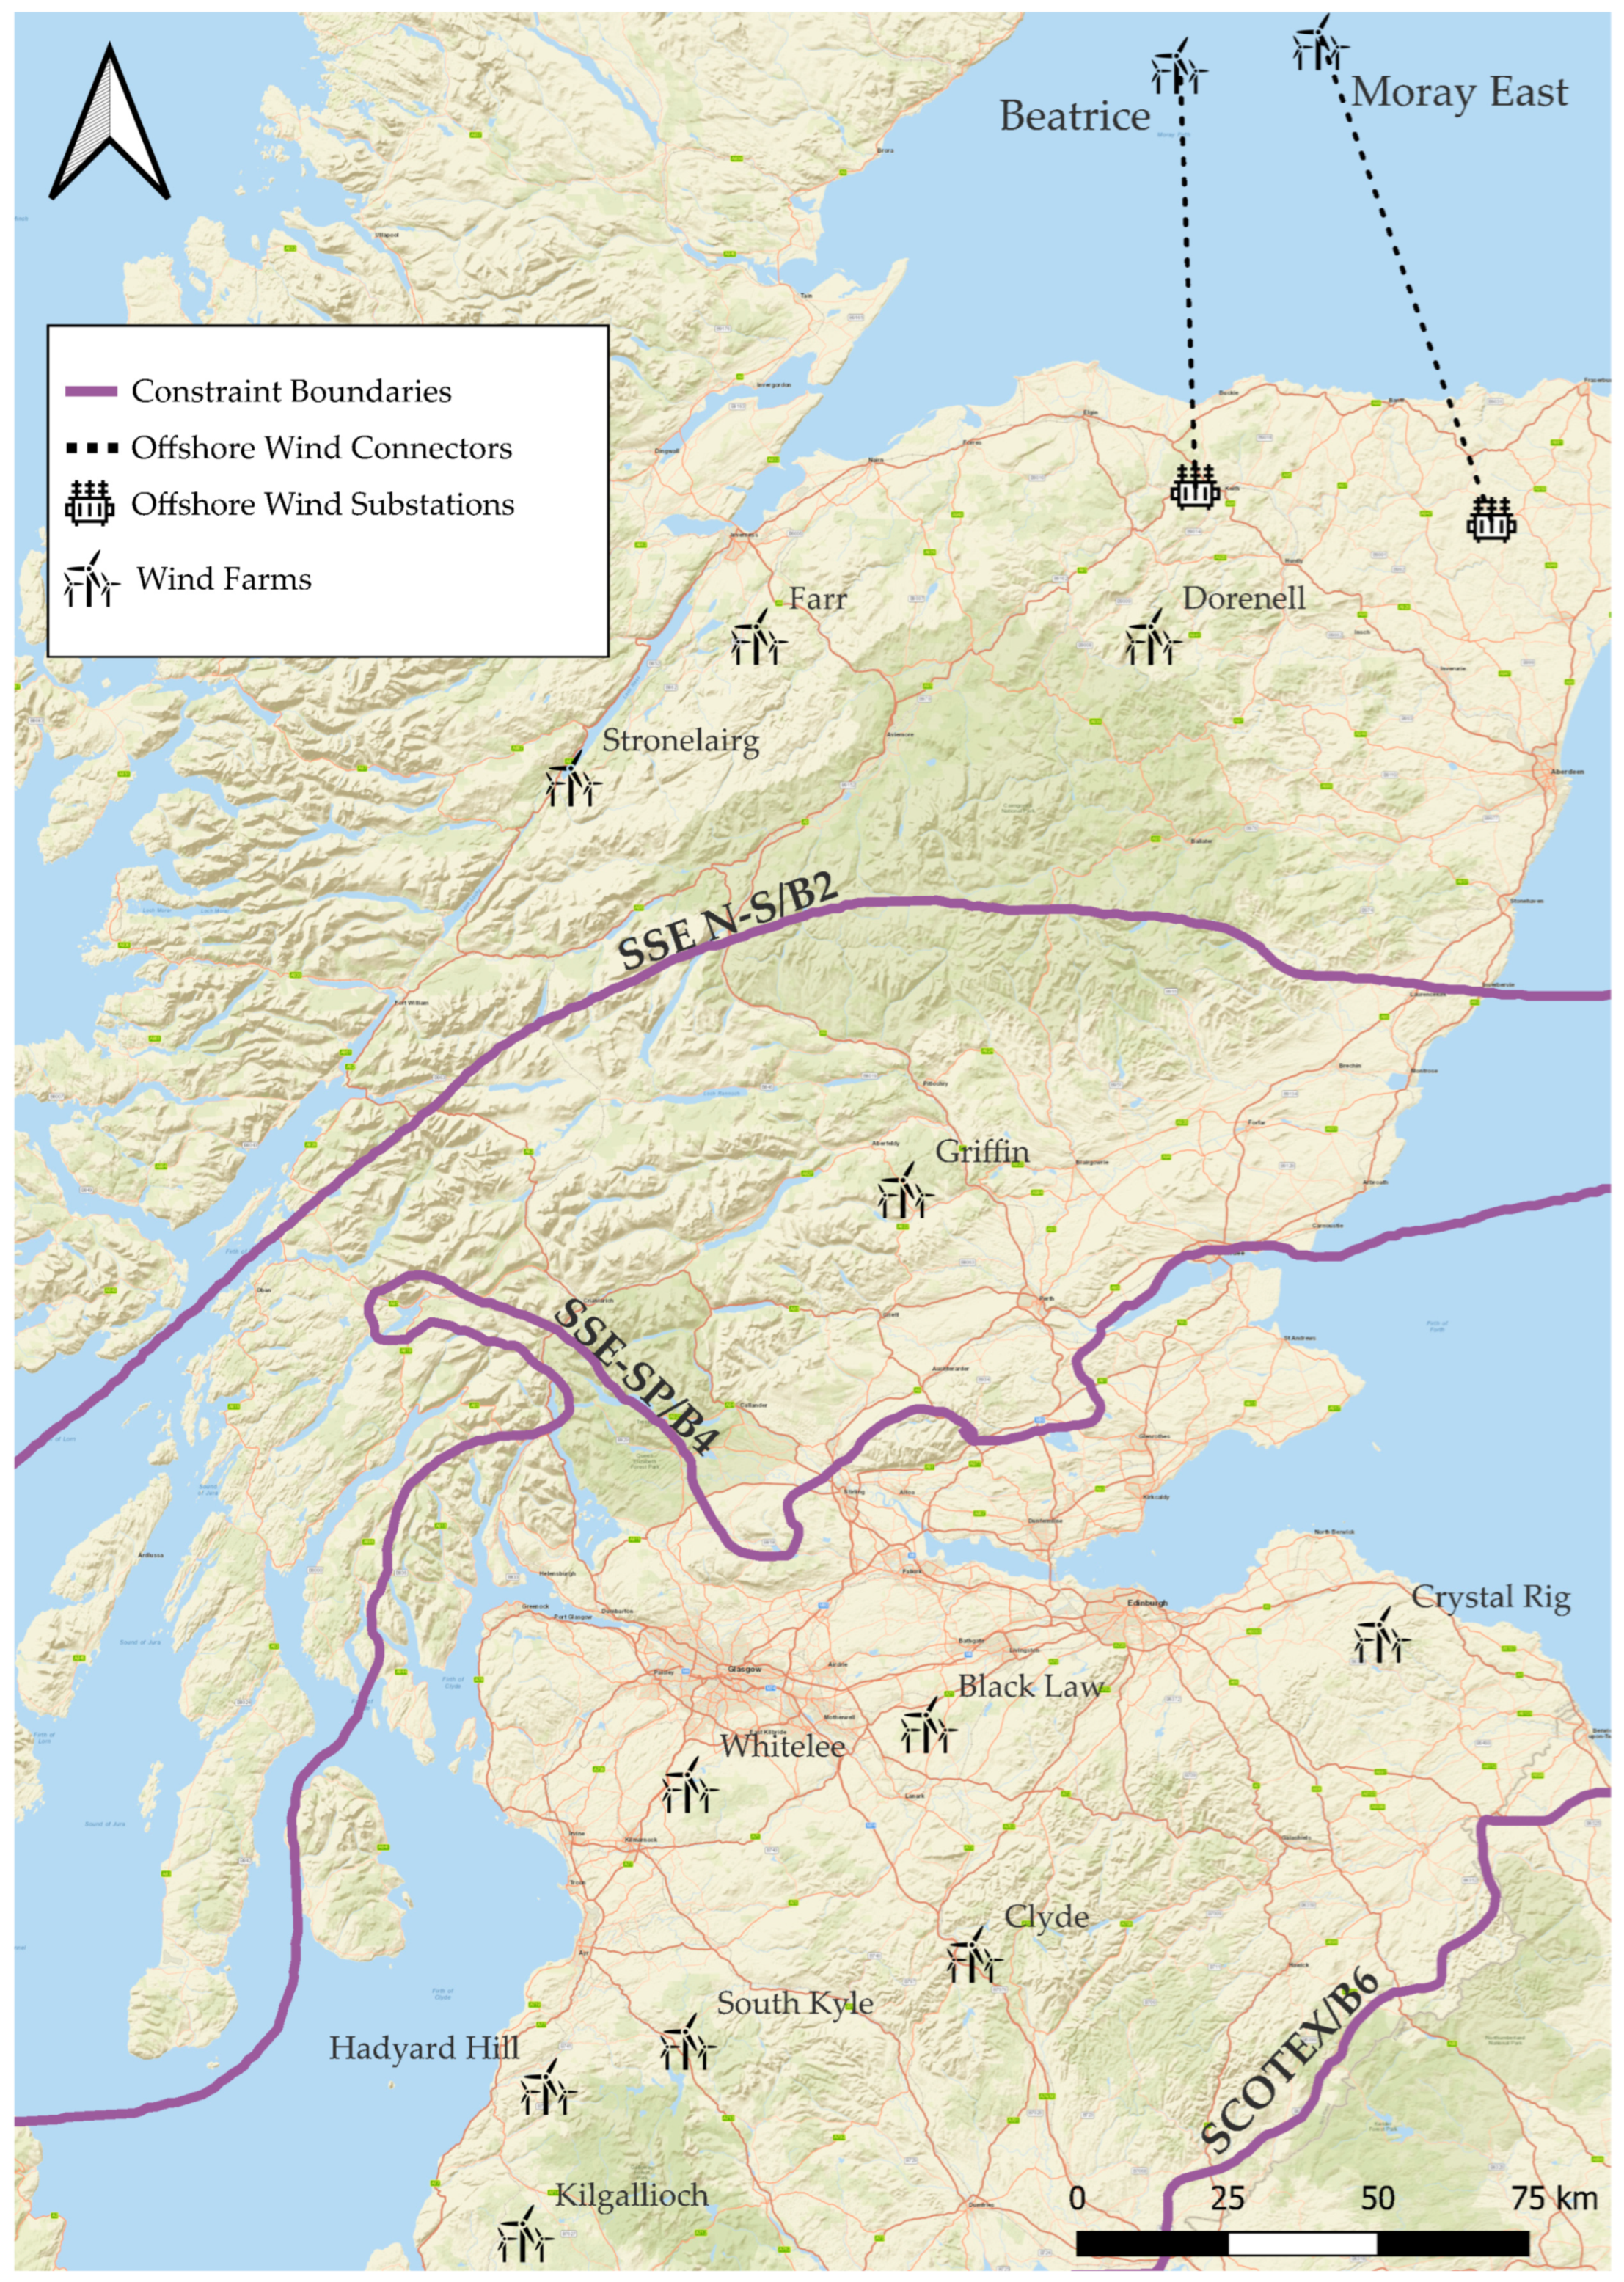
2.1. Overlaying of Grid Elements and Defining Boundaries

To determine the grid architecture that was to be investigated (namely, the way that curtailment interacts with certain constraints the grid places on high-level transmission), National Grid ESO’s schematics were utilised for the transmission level. It is important to note that the geographic considerations of where physical high-voltage transmission assets are placed are relatively unimportant, only where substations are in relation to other grid assets.
The ESO defines transmission zones and boundaries but does not define that the edge of one transmission zone is strictly a boundary. Thus, the two datasets were overlaid and meticulously checked to ensure that all grid assets in one transmission zone versus another transmission zone were separated by a boundary. Despite some mild differences in how the boundaries were drawn, this was shown to be the case. The boundaries for consideration are outlined in Figure 1, cropped to just the Scottish boundaries.
Using Figure 1, an example of Griffin Wind Farm is said to be in transmission zone “T4”, between boundaries “B2” and “B4”. These boundaries also have defined constraints across them, as shown in Table 1.
As shown in Table 1, each boundary has a static constraint, separating transmission zones where energy can be said to move freely. National Grid ESO provides another set of defined boundaries, with real-time constraint measured in half-hour intervals. The most important being SSE N-S, SSE-SP, NKILGRMO, and SCOTEX, representing transfers from the north to the south of the country. These boundaries resemble the transmission counterparts of B2, B4, B5, and B6, respectively, and their comparison is represented in Figure 2. NKILGRMO does not follow the western part of boundary B5 closely, has a limited dataset, and the area it represents was not considered. Therefore, the NKILGRMO boundary can be discounted. However, other boundaries were very similar to their counterparts and hence are used interchangeably. The boundary B6/SCOTEX represents the edge of the Scottish energy grid, and the two are identical; as such, this gives the project a clearly defined edge to solve to.
To apply the new boundaries to Griffin Wind Farm, this places the wind farm north of the constraint boundary “SSE-SP”. In total, this leaves 9 static boundaries at the edge of 8 transmission zones, with 3 major constraint boundaries taking their place during real-time constraint calculations.

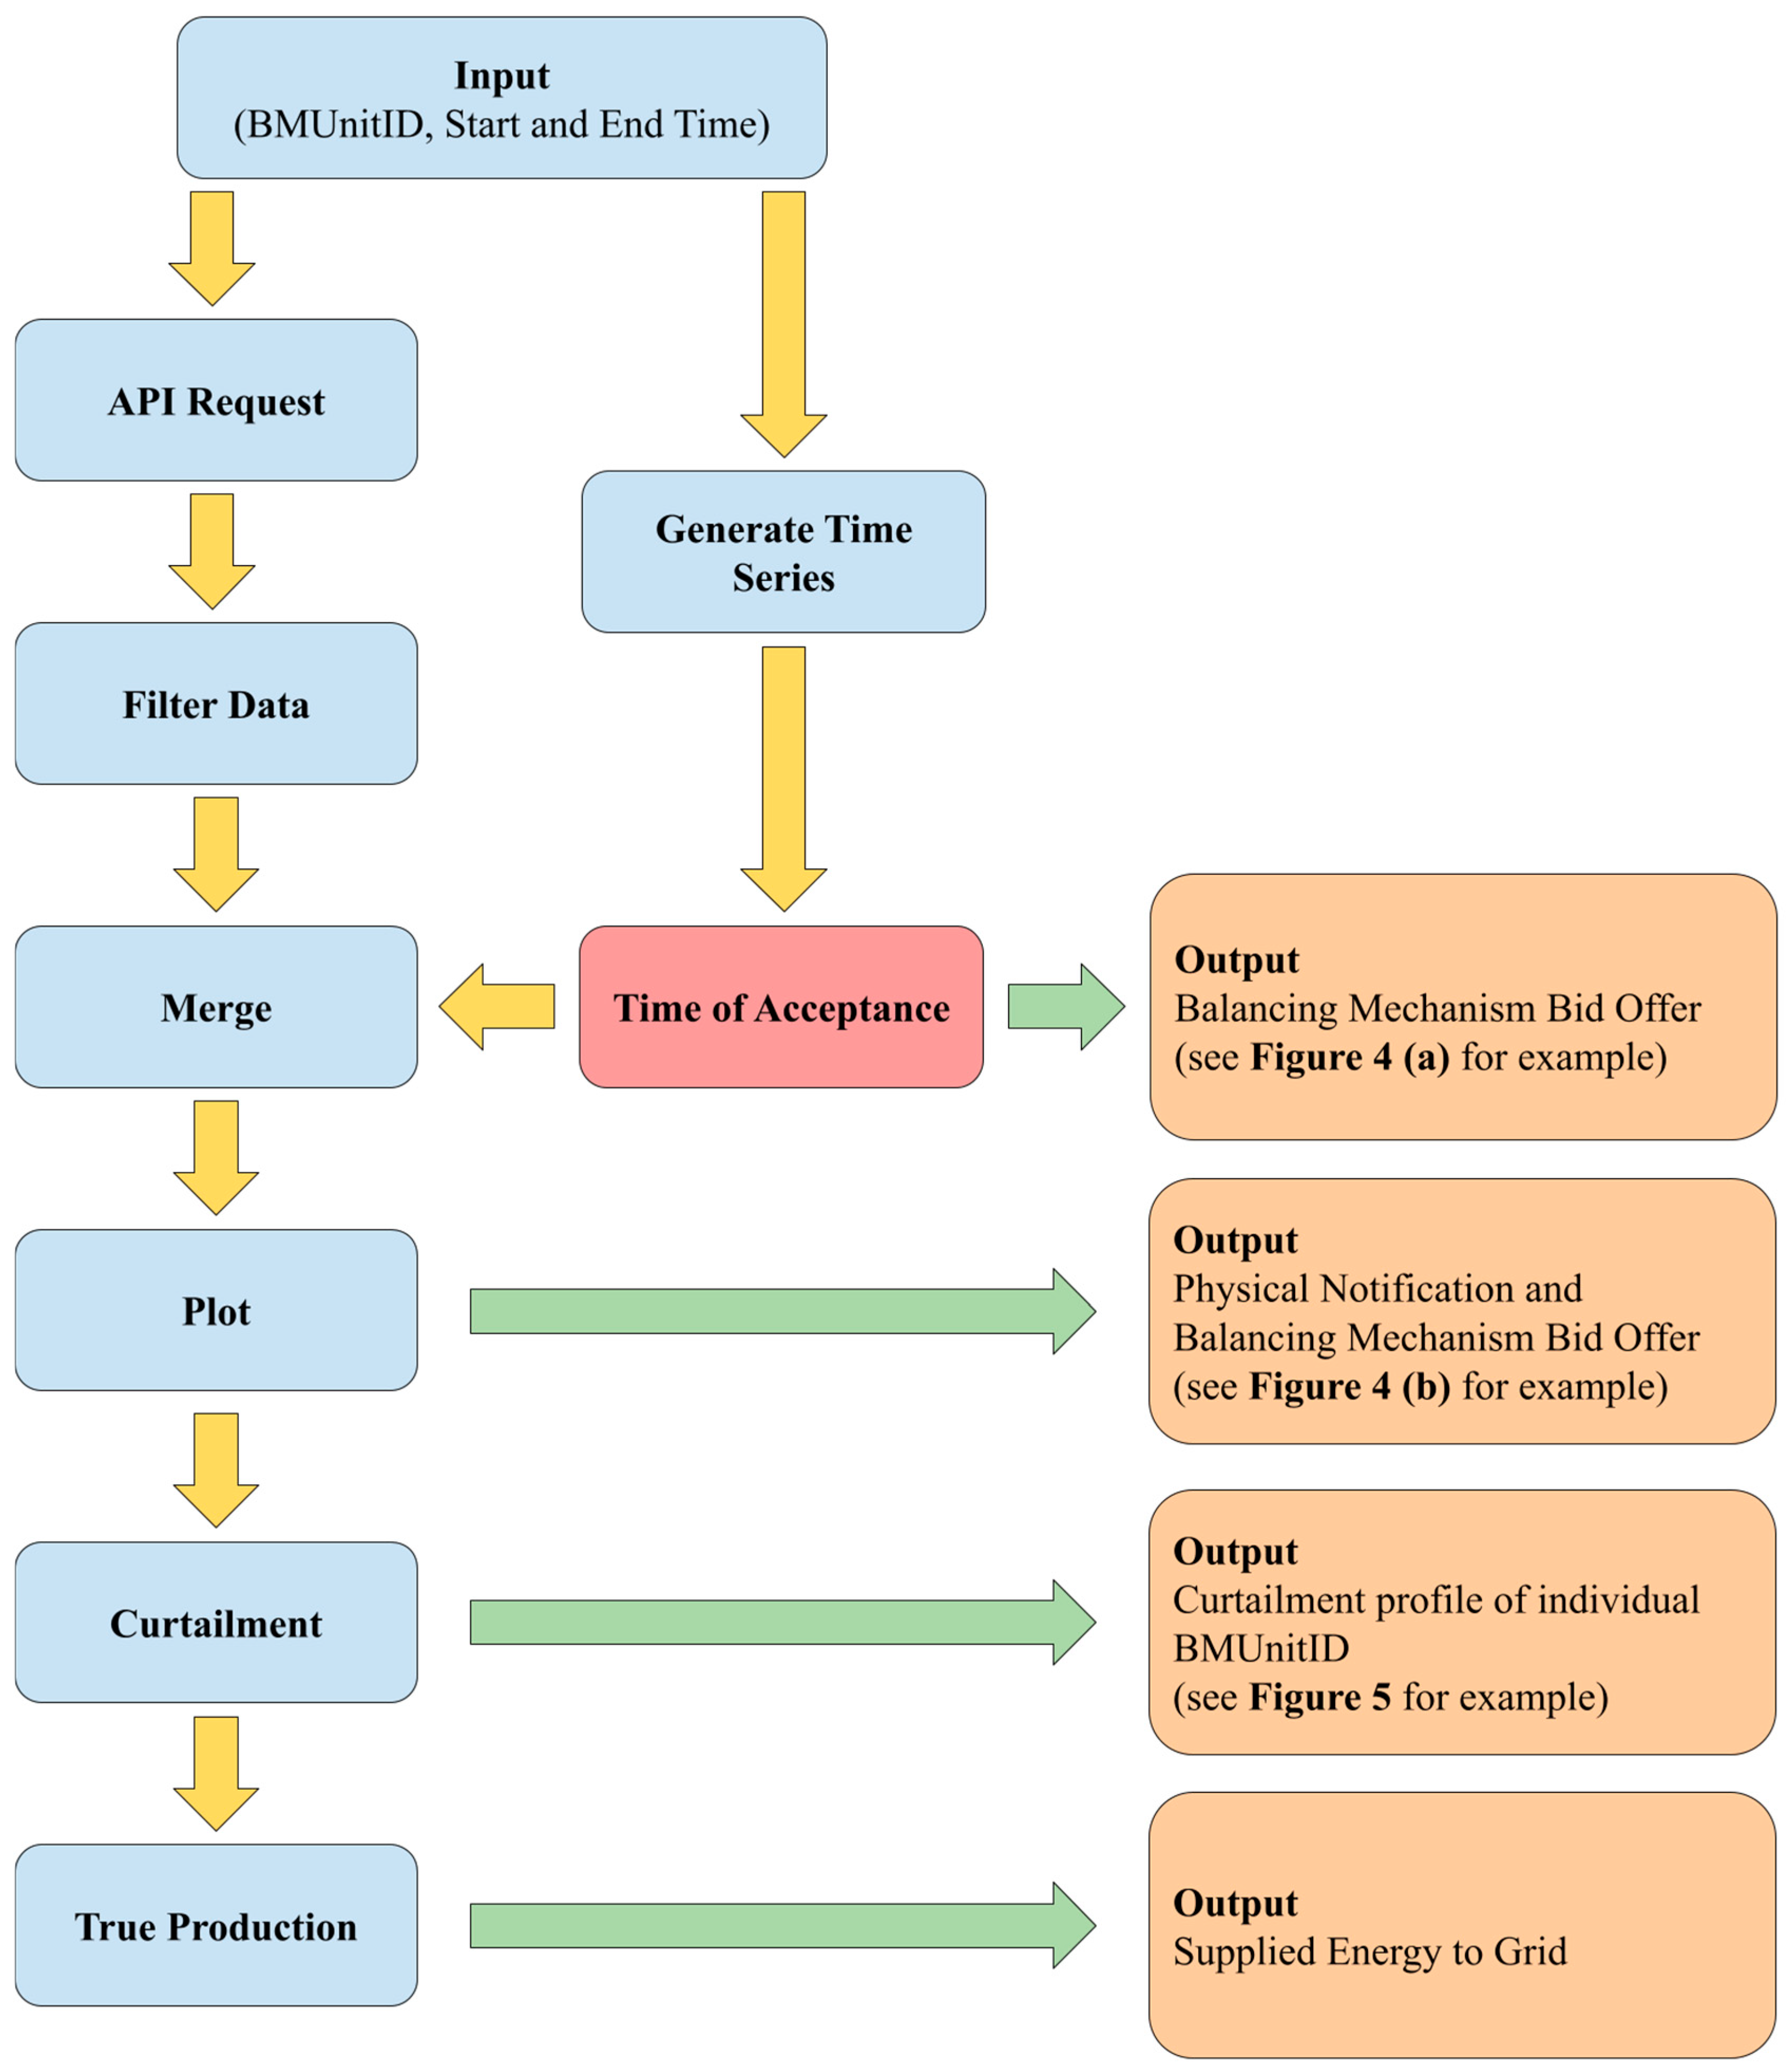
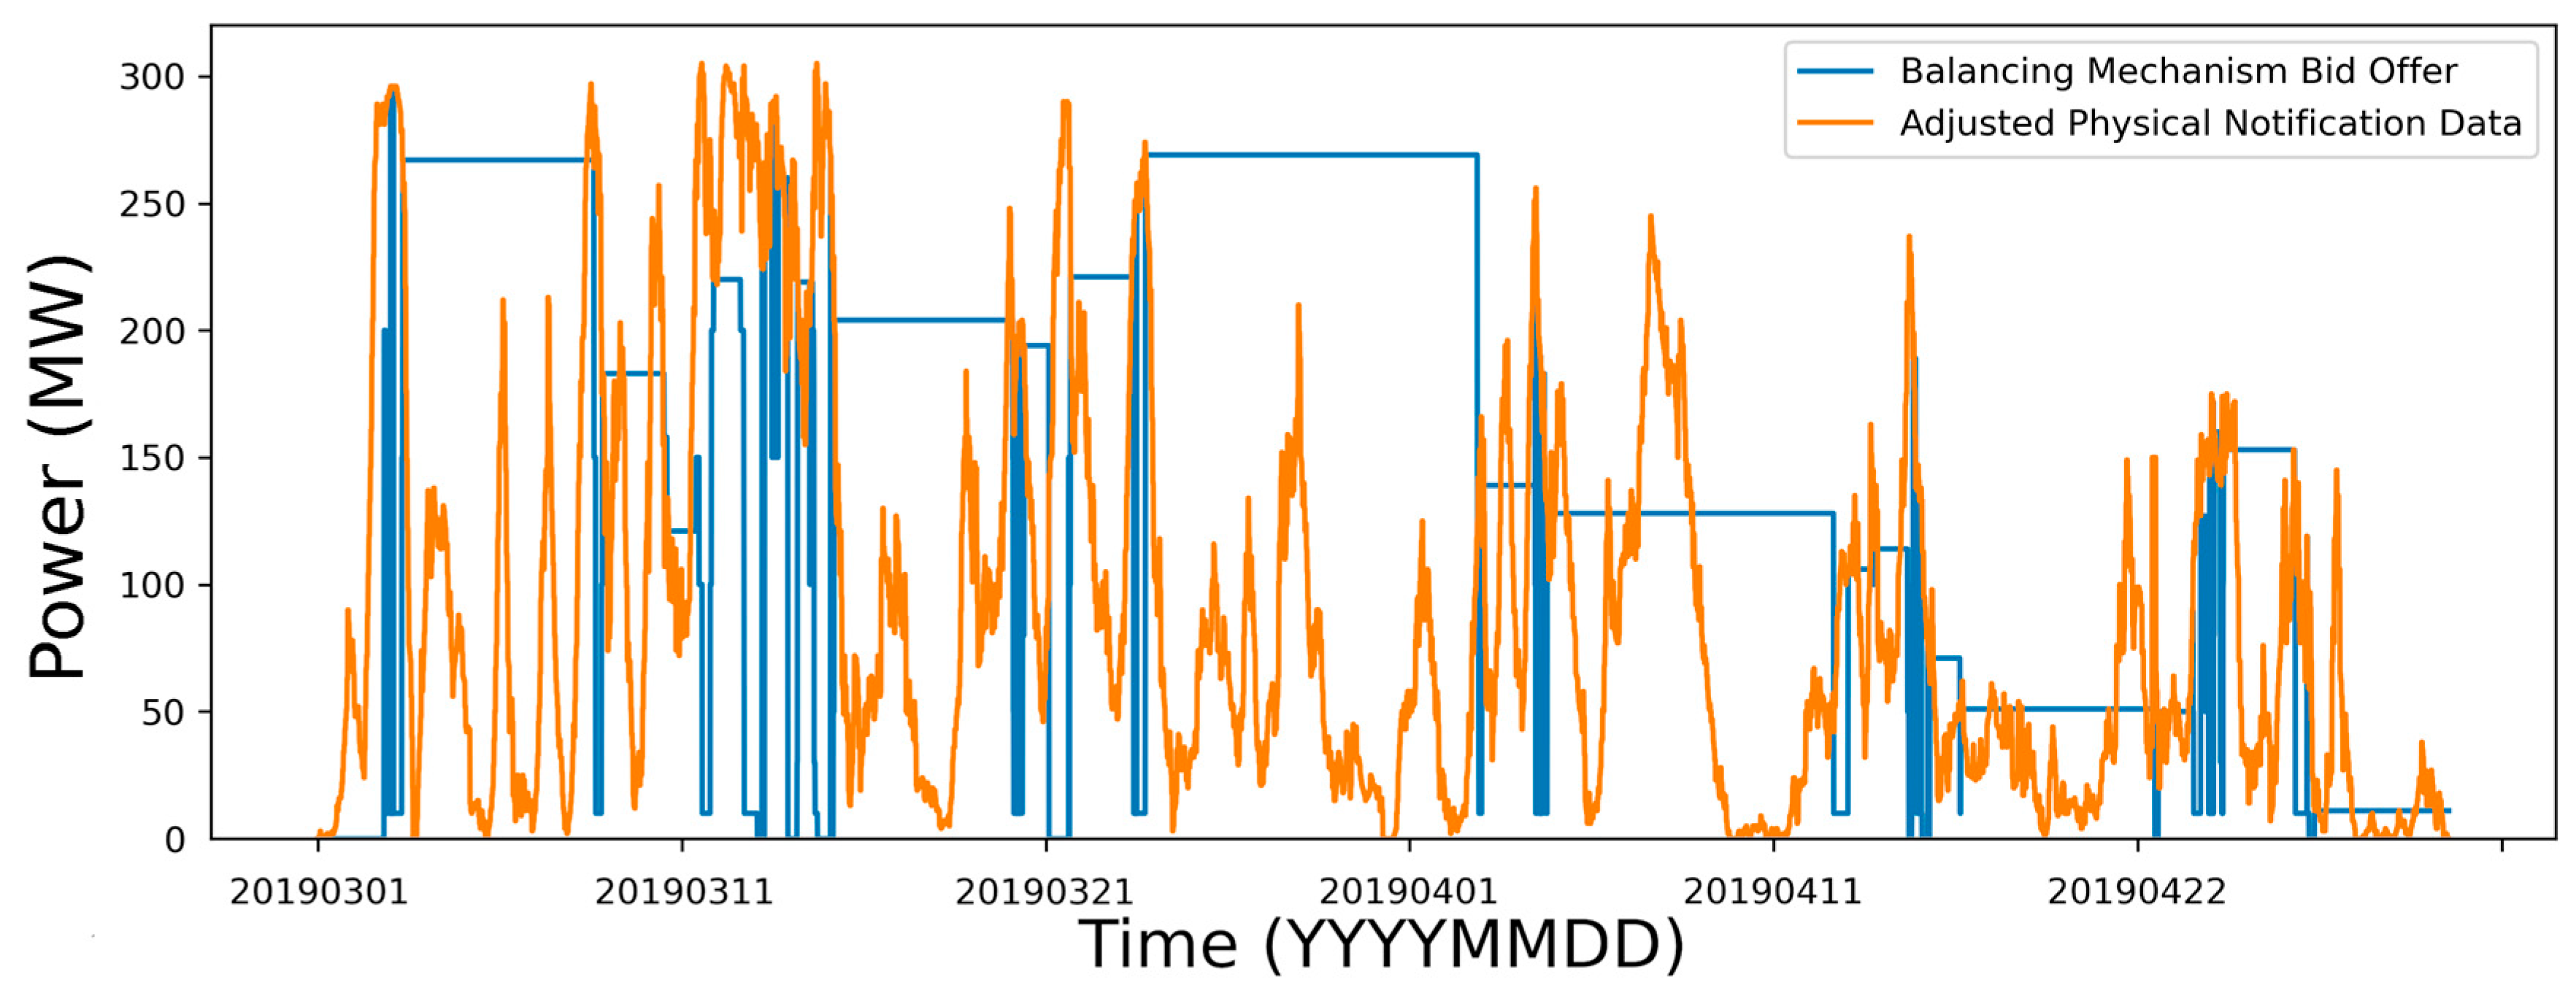
2.2. Development of Curtailment Calculator

The balancing mechanism is a tool utilised by the energy system operator to manage demand and generation while also ensuring that no damage is caused to the grid infrastructure by overloading the system (see Section 1). This directly follows on from the concept of transmission zones, as once demand is met in a transmission zone, electricity cannot be moved to areas of higher demand due to constraints between boundaries. The balancing mechanism instructs operators to “turn-up” or “turn-down” production depending on current grid conditions. When an operator is advised to “turn-down” their supply to the grid while there is potential for more generation to be sent, this is known as curtailment and is especially prevalent in the wind energy sector. As wind energy generation potential is based on what the current conditions are, the “fuel” cannot be saved for later when it is needed.
Elexon specialises in keeping a log of several parts of the balancing mechanism and running the day-to-day management of the Balancing and Settlement Code (BSC) [32]. To this end, they monitor energy producers and keep a log of several factors. Of key importance is their “PHYSMBDATA” dataset, of which 3 parts are required: Physical Notification (PN) data, Bid Offer Acceptance Level (BOAL) data, and the Maximum Export Limit (MEL). This data can be manually requested by inputting a BM Unit ID into their online tool and requesting one of the datasets, along with the time period needed (taken as a date and a settlement period, typically ranging from 1 to 48 and representing each half-hour period of a day). Example BOAL data would take the form shown in Table 2.
The BM Unit ID refers to the asset that is being investigated; for example, one of the BM Unit IDs for Whitelee Wind Farm is T_WHILW-1. Where “T” represents that it is a transmission-level asset, “WHILW” is the asset code, and “1” represents which part of the asset is being considered. Typically, large wind farms are split into several parts, and each BM Unit ID must be considered separately.
Manually inspecting the data every time to retrieve this valuable data is unfeasible to build a large dataset. Every settlement period must be considered over a several-year span, a process that itself would take months. Therefore, the Elexon API was utilised to gather the data needed to calculate curtailment in a novel manner. PHYSMBDATA was collected for a time series that could be specified through Python 3 (3.11) code, and all settlement periods in this range were gathered as one CSV file. This file would require “cleaning”, as PN and BOAL data were simply placed in a long column, not sorted by type, but by settlement period. Hence, code was developed to extract the PN and BOAL data and write it into two new CSVs. PN data is expected to be reported every settlement period; however, some operators do so more frequently. To preserve this data, a new time series was constructed through the input time span, with a precision of minutes. PN data would be written to the correct minute in the new time series, and then any gaps would be filled with the prior value (assuming generation remains constant until the operator advises of a new generation value).
A similar approach was taken with the BOAL data, as the accepted instructions from the balancing mechanism were as precise as one minute. However, care had to be taken that subsequent instructions could overwrite existing ones, while keeping the original instructions valid until the new bid was placed. Once the new instructions expired, the original instructions would be reinstated. This allowed for the first results to be extracted, entitled “Balancing Mechanism Bid Offer”. A minute-by-minute dataset showing how the balancing mechanism instructions varied over time. The same was true of the PN data, entitled “Adjusted Physical Notification Data”. The various inputs, steps, and outputs can be seen in Figure 3. A simplified view of some of the interim outputs can be seen in Figure 4; the final outputs are explored in Figure 5.
This provided the basis of the “curtailment calculator”, which generalised the above steps, allowing a user to simply input the BM Unit ID and dates they wished to determine curtailment from. This would find the “Balancing Mechanism Bid Offer” (BOAL) and “Adjusted Physical Notification Data” (PN), and plot them for the user, as shown in Figure 4. Then, operations were performed on the data to find the curtailment, the subsequent supplied energy to the grid, and the effects of curtailment on this. Graphs would be labelled and titled based on the users’ original parameters, shown in Figure 5. These same parameters would be used to create the unique folder name in which files were saved.
Curtailment was found through taking the difference between the PN data (what the operator should be able to produce) and the BOAL data (what the grid operator has accepted). When PN exceeded BOAL, it indicated curtailment, whereas when BOAL exceeded PN, it signified that the wind farm was underperforming. The difference was taken from each occurrence of PN > BOAL, and this was saved as a CSV and plotted. Further supplied energy to the grid is found through contrast with the original physical notification data.
After multiple versions, the curtailment calculator was able to render curtailment for any wind farm, over any period, in a reasonable rendering time. The calculator was used to collect data from 49 BM Unit IDs, which represented 11 onshore and 2 offshore wind farms in Scotland, 5 offshore wind farms in England, and 1 onshore and 1 offshore wind farm in Wales. Non-Scottish wind farms were considered for national comparisons when scaling up the data.

2.3. Combination of Data

Through use of the curtailment calculator to find the curtailment for specific BM Unit IDs, curtailment data were collected through further code into a complete 4-year curtailment pattern for each wind farm. These datasets had a precision of 1 min and contained a curtailment value for the wind farm in MW for each minute. Wind farms would then be plotted using GIS to show their interaction with the boundaries of the Scottish grid and to see which transmission zones the wind farms were contained in.
This process was repeated for each transmission zone (see Section 2.1) to build a picture of how the curtailment varied based on geography and transmission/constraint boundaries. The contribution of each wind farm was plotted accordingly; however, unfortunately, the total curtailment per transmission zone could not be determined due to the lack of precise data on installed capacity per zone. In effect, limiting the possibility of accurately upscaling the curtailment trends at this level.
However, this approach was possible for the modelling of national curtailment, with installed capacity values being available for each nation [34,35]. Thus, the capacity values of each wind farm could be summed for a cumulative representative capacity value and then upscaled by calculating the percentage that the summed capacities represented. The considered Scottish wind farms and their associated percentages are shown in Table 3.

2.4. Data Collection for Hydrogen Generation

One of the use cases for the results of the curtailment calculator was that of determining the potential for hydrogen generation through electrolysis (outlined in Section 1). Decentralised hydrogen generation was of particular importance, where several wind farms’ curtailment would be utilised to power one hydrogen electrolyser, a popular concept suggested for the utilisation of curtailed energy [18].
A method was developed to test all possible combinations of curtailment data from 13 Scottish wind farms, focusing on how future electrolyser technology could handle curtailment values over time. Rather than selecting a specific electrolyser mod-el, hypothetical electrolysers with capacities of 25, 50, 100, 200, 300, 400, and 500 MW were used as thresholds. Each time curtailment exceeded these capacities, the excess was recorded. The analysis began by testing each wind farm individually before com-bining multiple curtailment profiles to explore the impact of a decentralized genera-tion model. The method of combination was through finding all possible groupings of wind farms and iterating with the threshold curtailment values. Unfortunately, this proved to be too computationally intensive, with over 16,383 combinations of all group sizes, and a rendering time of over 24 h.
Therefore, the 13 Scottish wind farms were split into a “north” and a “south” group. This resulted in a much more manageable 63 combinations for the north group and 127 combinations for the south group. Once each combination and each threshold for each combination had been tested, the best formations were selected based on the “full-time minute” usage of the various electrolysers.
Using QGIS 3.36.2, the distance between the various wind farms was found, and a suggested electrolyser location was pinpointed. Which could, in a future study, allow for calculation of cable losses (and associated electrolyser losses), as well as the cost of laying cable of various capacities.

2.5. Constraint Data

The provided constraint data were sourced from National Grid ESO [36] and was available in the form of each half-hourly period and contained both the limit and the current flow at that time period, both measured in MW. The relevant zones of SSE N-S (B2), SSE-SP (B4), and SCOTEX (B6) were extracted from the day-ahead constraints and flow output dataset. Section 2.1 explores the justification behind considering these zones.
The CSV curtailment outputs from the curtailment calculator, comprising the selected wind farms for the given 4-year period (2019–2022), were parsed so that the time series would match for both the constraint boundaries as well as the curtailment outputs. This required taking each half-hour value in MW from the output and creating new CSVs. The new CSVs were then combined into a single CSV containing the time stamps and curtailment values. This CSV file then had the SSE N-S, SSE-SP, and SCOTEX boundary data placed as new columns manually due to issues with matching the timestamp data. With the start date for the SSE-SP and SCOTEX data on 1 October 2019 and 14 July 2022 for SSE N-S. The data were aligned with the curtailment timestamps so that direct row comparison would be possible. If data were missing from the constraint datasets, values would be set to zero.
As the constraint varied daily, a percentage was utilised to find the overall trend of constraint as a function of the boundary and the given time, irrespective of the conditions that day. Boundaries would record 100% when at maximum capacities, and negative percentages referred to a south-north flow, although this was much less common than north-south flows [28]. The percentage outputs, fixed to the investigated curtailment time period.
From this data, and using the unified constraint CSV, the combined curtailment data per transmission zone (as explored in Section 2.3), the two were plotted on the same time axis such that constraint and curtailment patterns could be directly compared. This is explored further in Section 3.4.

3. Results and Discussion

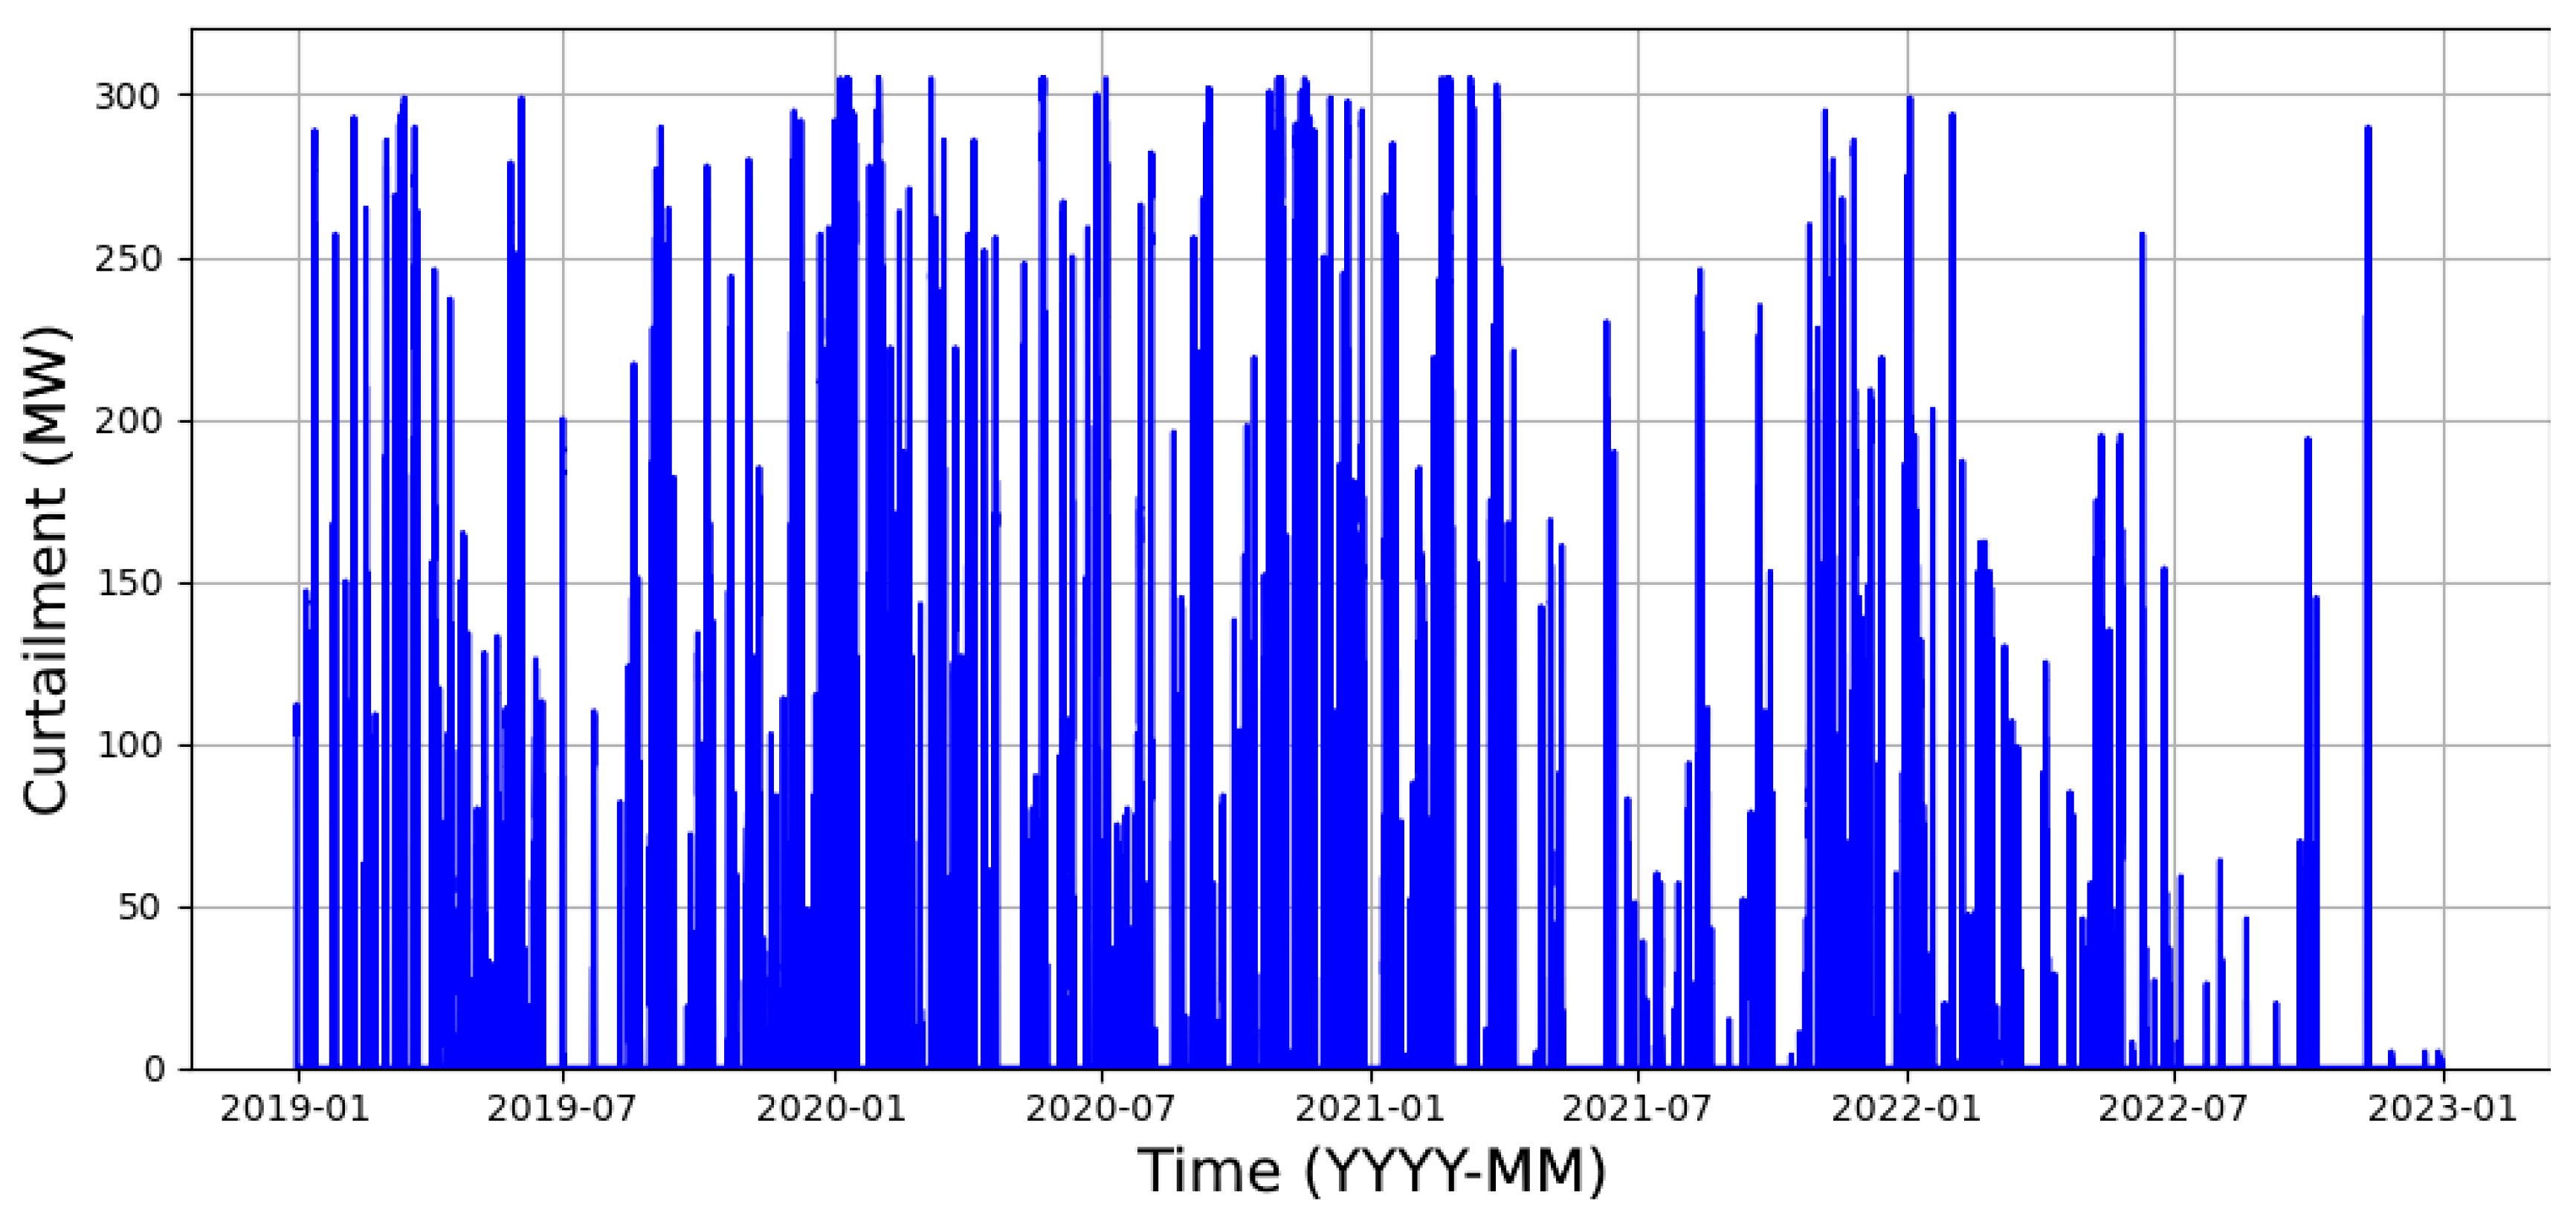
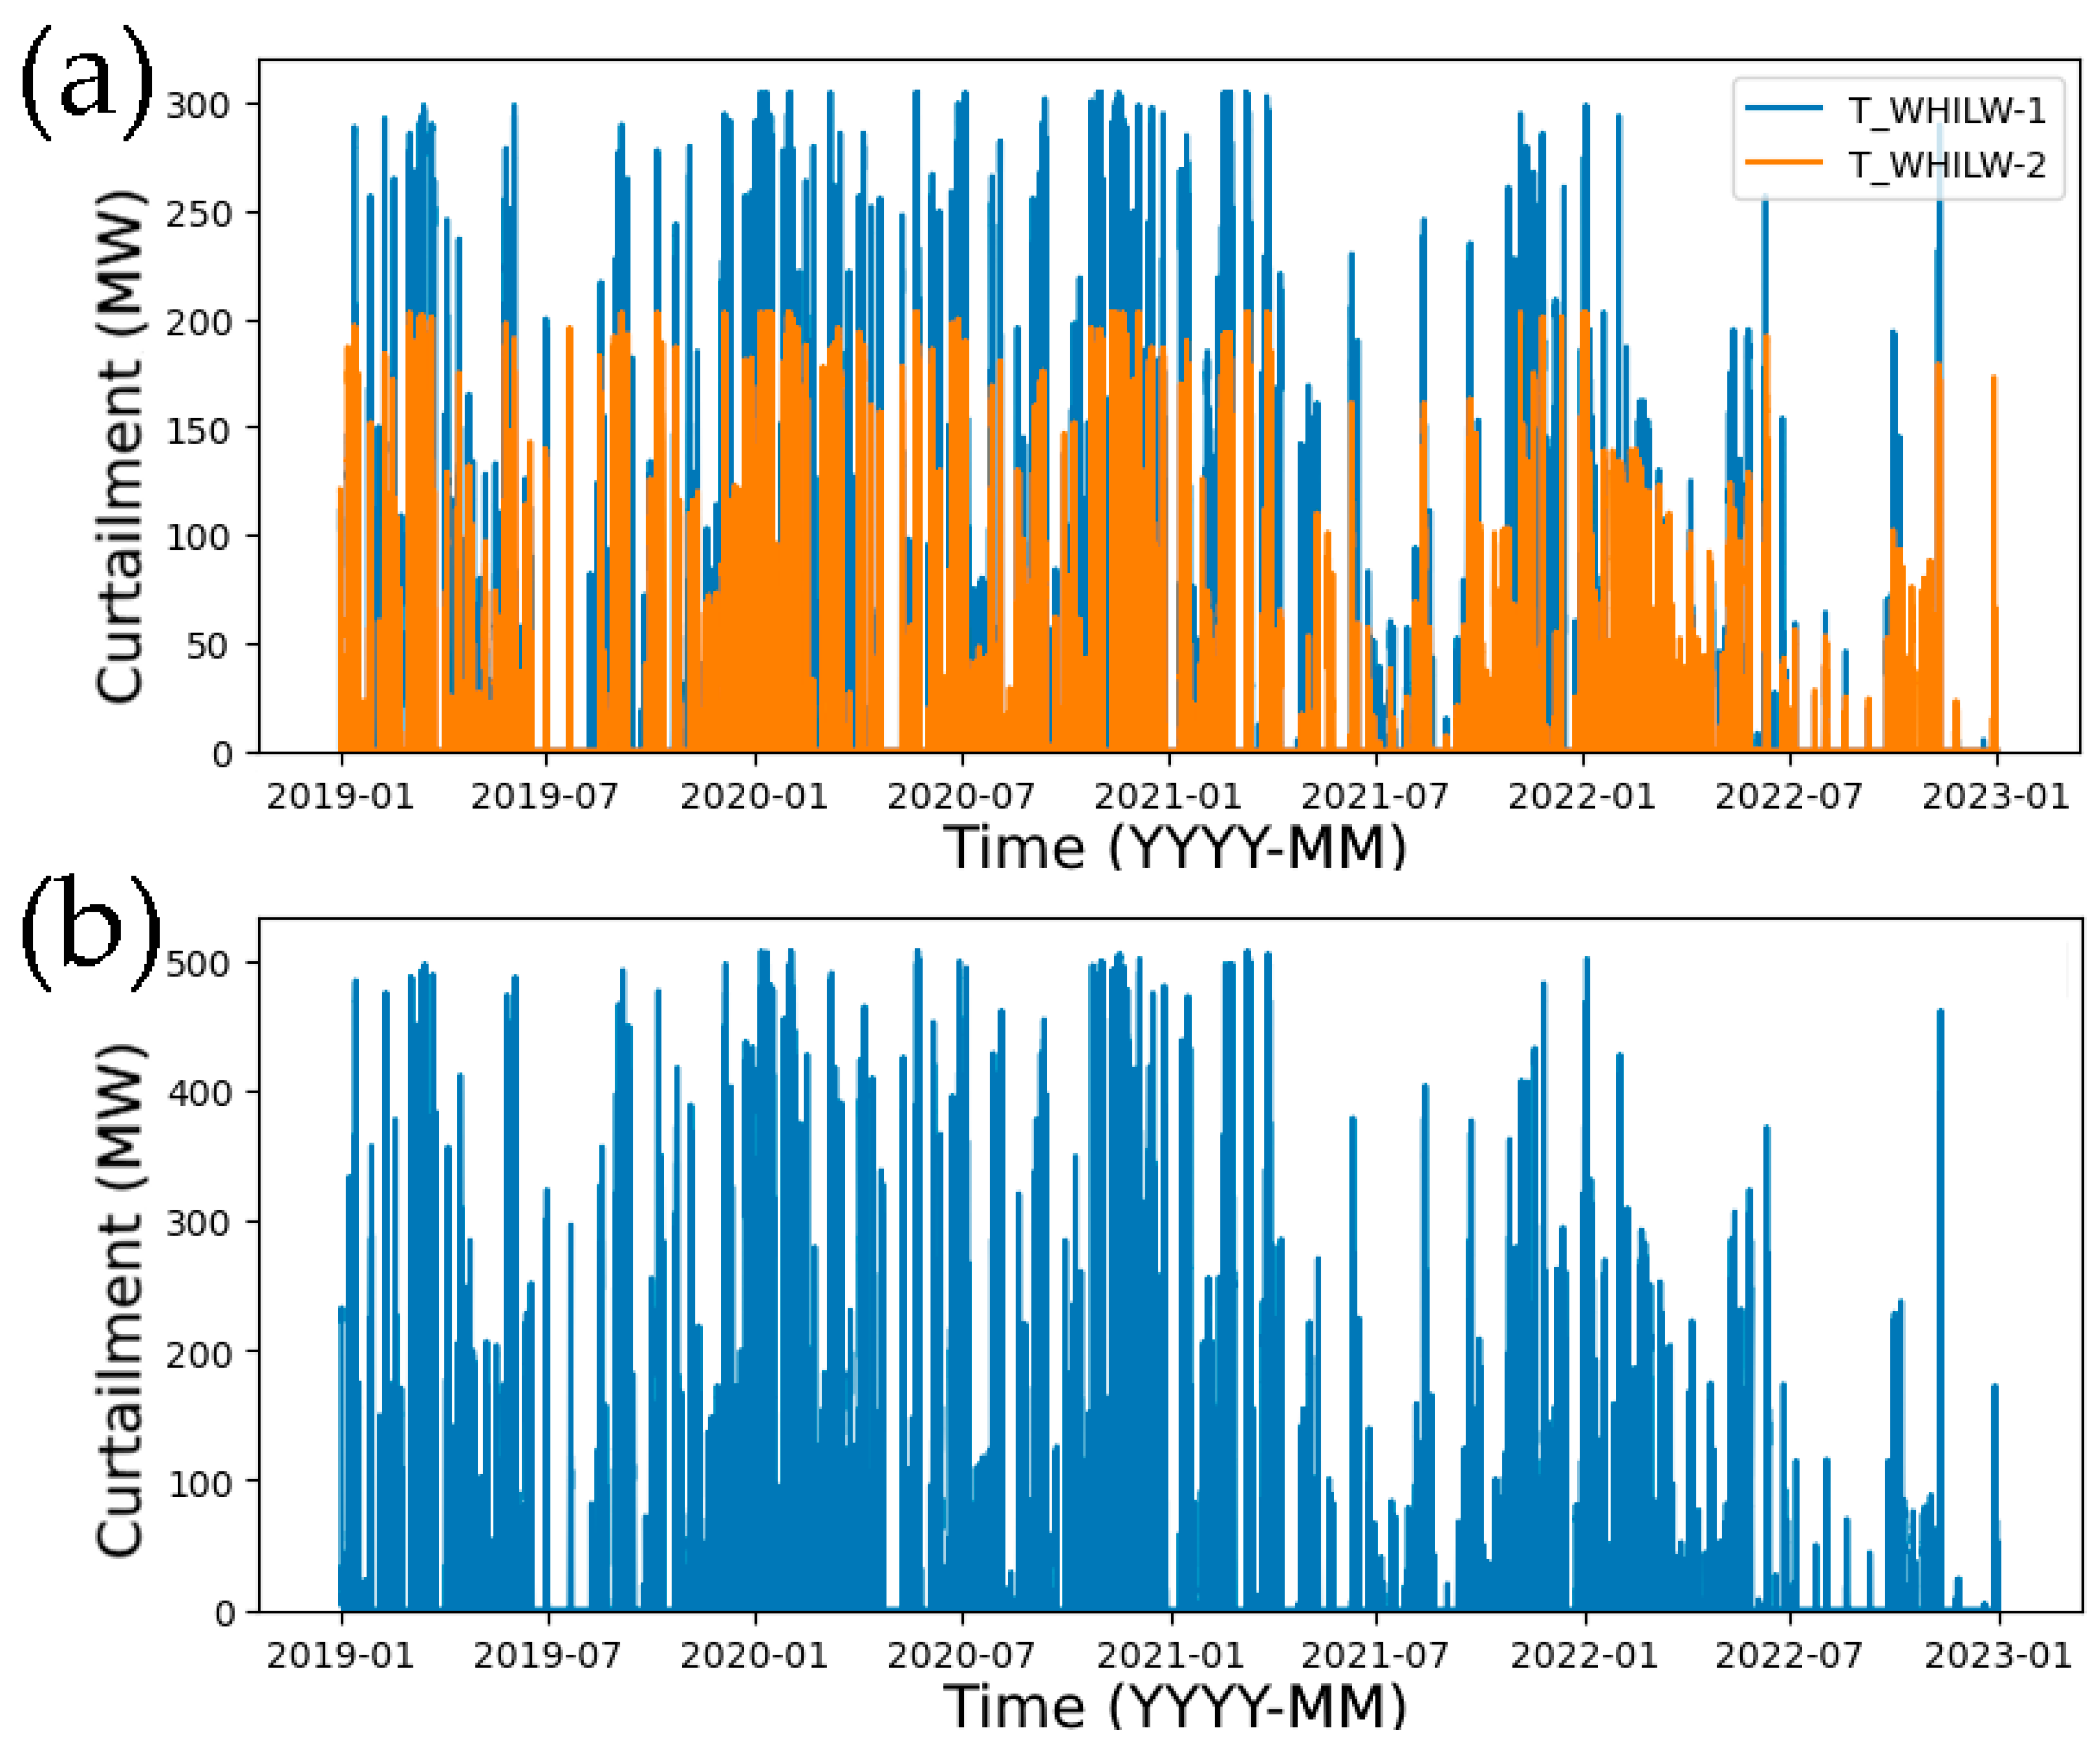
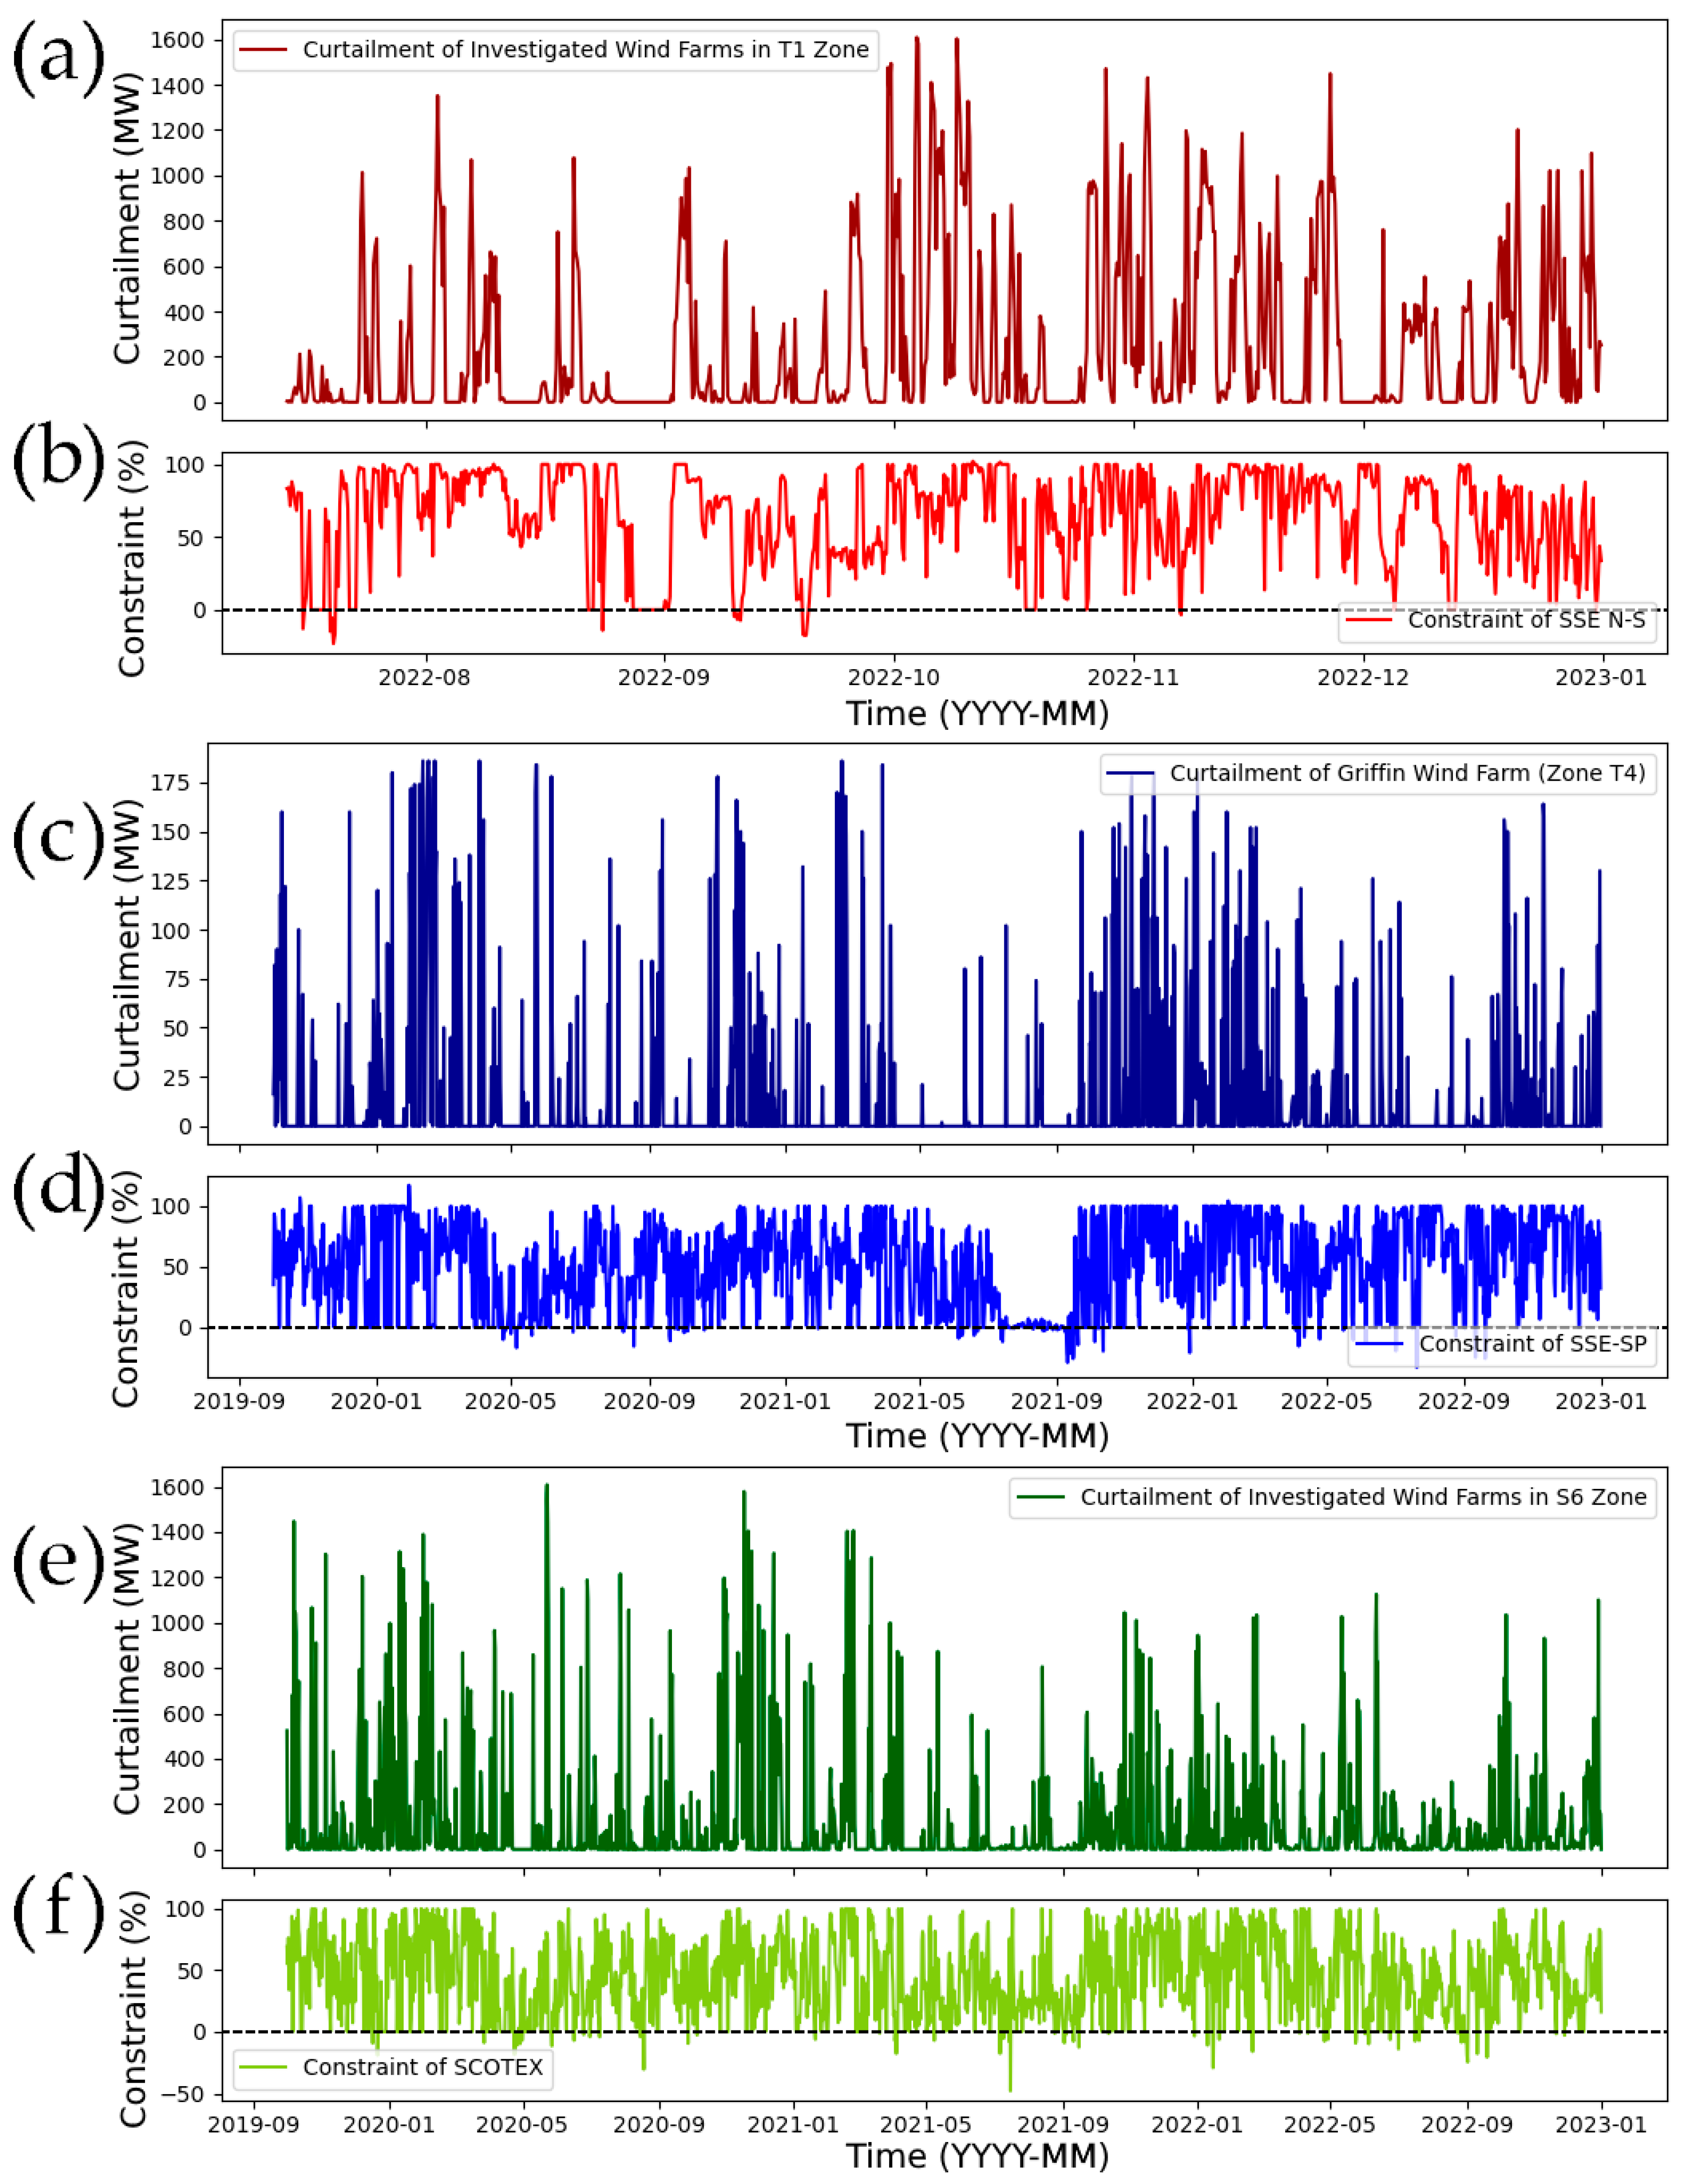
3.1. Curtailment Calculator Outputs and Discussion

The curtailment calculator produced robust outputs, storing 2,103,840 rows of minute-by-minute data over the 4-year period. Additional CSV files containing associated data were generated for each tested BM Unit ID; an example output for a section of Whitelee Wind Farm is shown in Figure 5.
Figure 5. Showing the curtailment trends of T_WHILW-1 generated from the curtailment calculator for a 4-year period from 2019 to 2022.
Energies 18 02777 g005
After the combination of multiple BM Unit IDs into a single wind farm (see Figure 6), the same process could be repeated to represent an entire transmission zone (see Figure 7). This allowed for the curtailment patterns for wind farms and regions to be determined.
Aggregating all transmission zones together into a national dataset allowed the curtailment patterns from some of Scotland’s largest wind farms (see Table 3) to be upscaled to reflect national trends. The associated data such as the effect of curtailment on supply was not taken forward at this time, due to the project focusing primarily on wind curtailment and the effects of transmission and potential utility of hydrogen generation.
There are some slight errors with the methodology of the curtailment calculator however, for some wind farms, the delay between the start of the time series and the first issued balancing mechanism instruction can result in overcounting of curtailment as the accepted values from the grid are assumed to be zero. This is not an issue for frequent operators but can be noticeable in some data series such as Figure 8. Potential solutions to this issue are discussed below for future consideration. Another error is that of the differences in frequency between the PN and BOAL data. The minimum frequency of PN data is half hourly, and this must be increased to match the BOAL data for curtailment calculations. There is also the issue of the PN data being what the operator believes will be generated, which can be incredibly variable given the nature of wind generation.
However, the calculator does make use of the maximum precision of input data, although this increases processing time. The raw outputs are in the form of MWminutes. But can be converted to MWh (the industry standard), by taking every 60th value in the data series, and performing the calculation on the hour and therefore spot checking the curtailment. Or by averaging the 60 values to find the average MW of curtailment across an hour, giving an integration which is closer to the power measured at minute intervals. Error in the actual values of curtailment can be found in the precision of the supplied values, which are processed but are not adjusted or rounded in any way, which results in a precision to the nearest MW.
Using the aforementioned methods outlined above, a combination could be found for the all the curtailment experienced by the wind farms in Table 3. Utilising the percentage this grouping made up compared with the total installed capacity in Scotland [34], the results can be upscaled to show national curtailment volumes and trends, as shown in Figure 8. Note that the 60th value method was utilised to convert to MWh, as discussed above. The results from Figure 8 clearly demonstrate the variability of curtailment, there are slight decreases across the summer months (note the drop between March and August 2021). But overall, curtailment is unpredictable from just prior curtailment data alone Additionally, Figure 8 highlights the earlier-mentioned methodological error, as the initial curtailment values appear inflated.
The error from overcounting curtailment can be addressed through two potential methods, substituting the aforementioned “maximum export limit” (MEL) at the start of any data series, and hence assuming the ESO is able to accept any amount of generation (up to the maximum of the wind farm) until stated otherwise. Alternatively, the calculator can be initiated earlier than required, and the data subsequently sliced to the desired time range, thus preserving the last ESO instruction and providing more accurate estimates.
A similar method can be applied to the other nations in Great Britain, with the offshore wind farms of Hornsea One, East Anglia One, London Array, Walney, and Robin Rigg considered for England. In Wales, Pen Y Cymoedd (onshore) and Gwynt y Môr (offshore) were considered. These wind farms represent 27.5% of English installed capacity, and 40.6% of Welsh installed capacity [35]. As such, they can be scaled up to represent national curtailment, and are depicted alongside the data for Scotland in Figure 9.
The results from Figure 9 show the increasing curtailment patterns, of special interest is the way in which curtailment patterns in Scotland are often reflected in England. Relative to England total Scottish curtailment increases over time, as predicted in much of the literature [10,28].

3.2. Decentralised Hydrogen Generation

The hydrogen combination data were examined, and the full dataset for all combinations in the north and south groups and all electrolyser sizes can be found in the figures included in the Supporting Material (Figures S3–S15). The best-performing hydrogen electrolyser groups are shown in Table 4, and associated groupings are shown in Figure 10. Note that some of the best groupings in the south group were discounted due to the cable length concerns, which did factor into the decision-making process.
Table 4 also contains the minimum lengths of cable required to connect the decentralised hydrogen electrolysers to their respective wind farms, which can be used to calculate the cost.
Analysis of the viable connections (see Figure 10 and Table 4) indicates that cross-boundary connections can significantly boost overall performance. This improvement is attributed not solely to the curtailment volume, but to the non-overlapping curtailment profiles, which enhance full-time electrolyser utilization. Therefore, deploying such installations in strategic locations can help circumvent transmission constraints—especially when paired with lower capacity electrolysers requiring less expensive, lower-voltage cables.
It is recommended, following the investigation and results in Table 4, that a 50 MW electrolyser be utilised for the North Group 1, and 25 MW electrolysers are deployed for all other groups. This should keep costs down while maximising production, with the larger electrolyser being able to operate for over half of the 4-year period just on curtailed energy. Of course, there is an issue with the consideration of the full-time usage of the electrolysers, as every minute is considered. Electrolysers have variable start-up times, and to this end, they may not be able to respond to minute-by-minute changes in the generation profile. A future consideration would be to calculate when total curtailment was above the threshold for a given number of minutes consecutively, such that production was viable.
There is also the issue of cable losses over the minimum defined distances, which would affect the full-time use of the electrolyser. Any further research in this area should consider even more wind farms to find even better combinations, along with more realistic connection distances using geographic obstacles.

3.3. Constraint Boundaries

Constraint data were sourced as outlined in Section 2.5, and was applied to the various applicable wind farms north of the constraint boundary; this can be more clearly seen in Figure 11.
The conversion of the constraint flow in MW to that of a percentage of the boundary’s capacity yielded the results depicted in Figure 12.

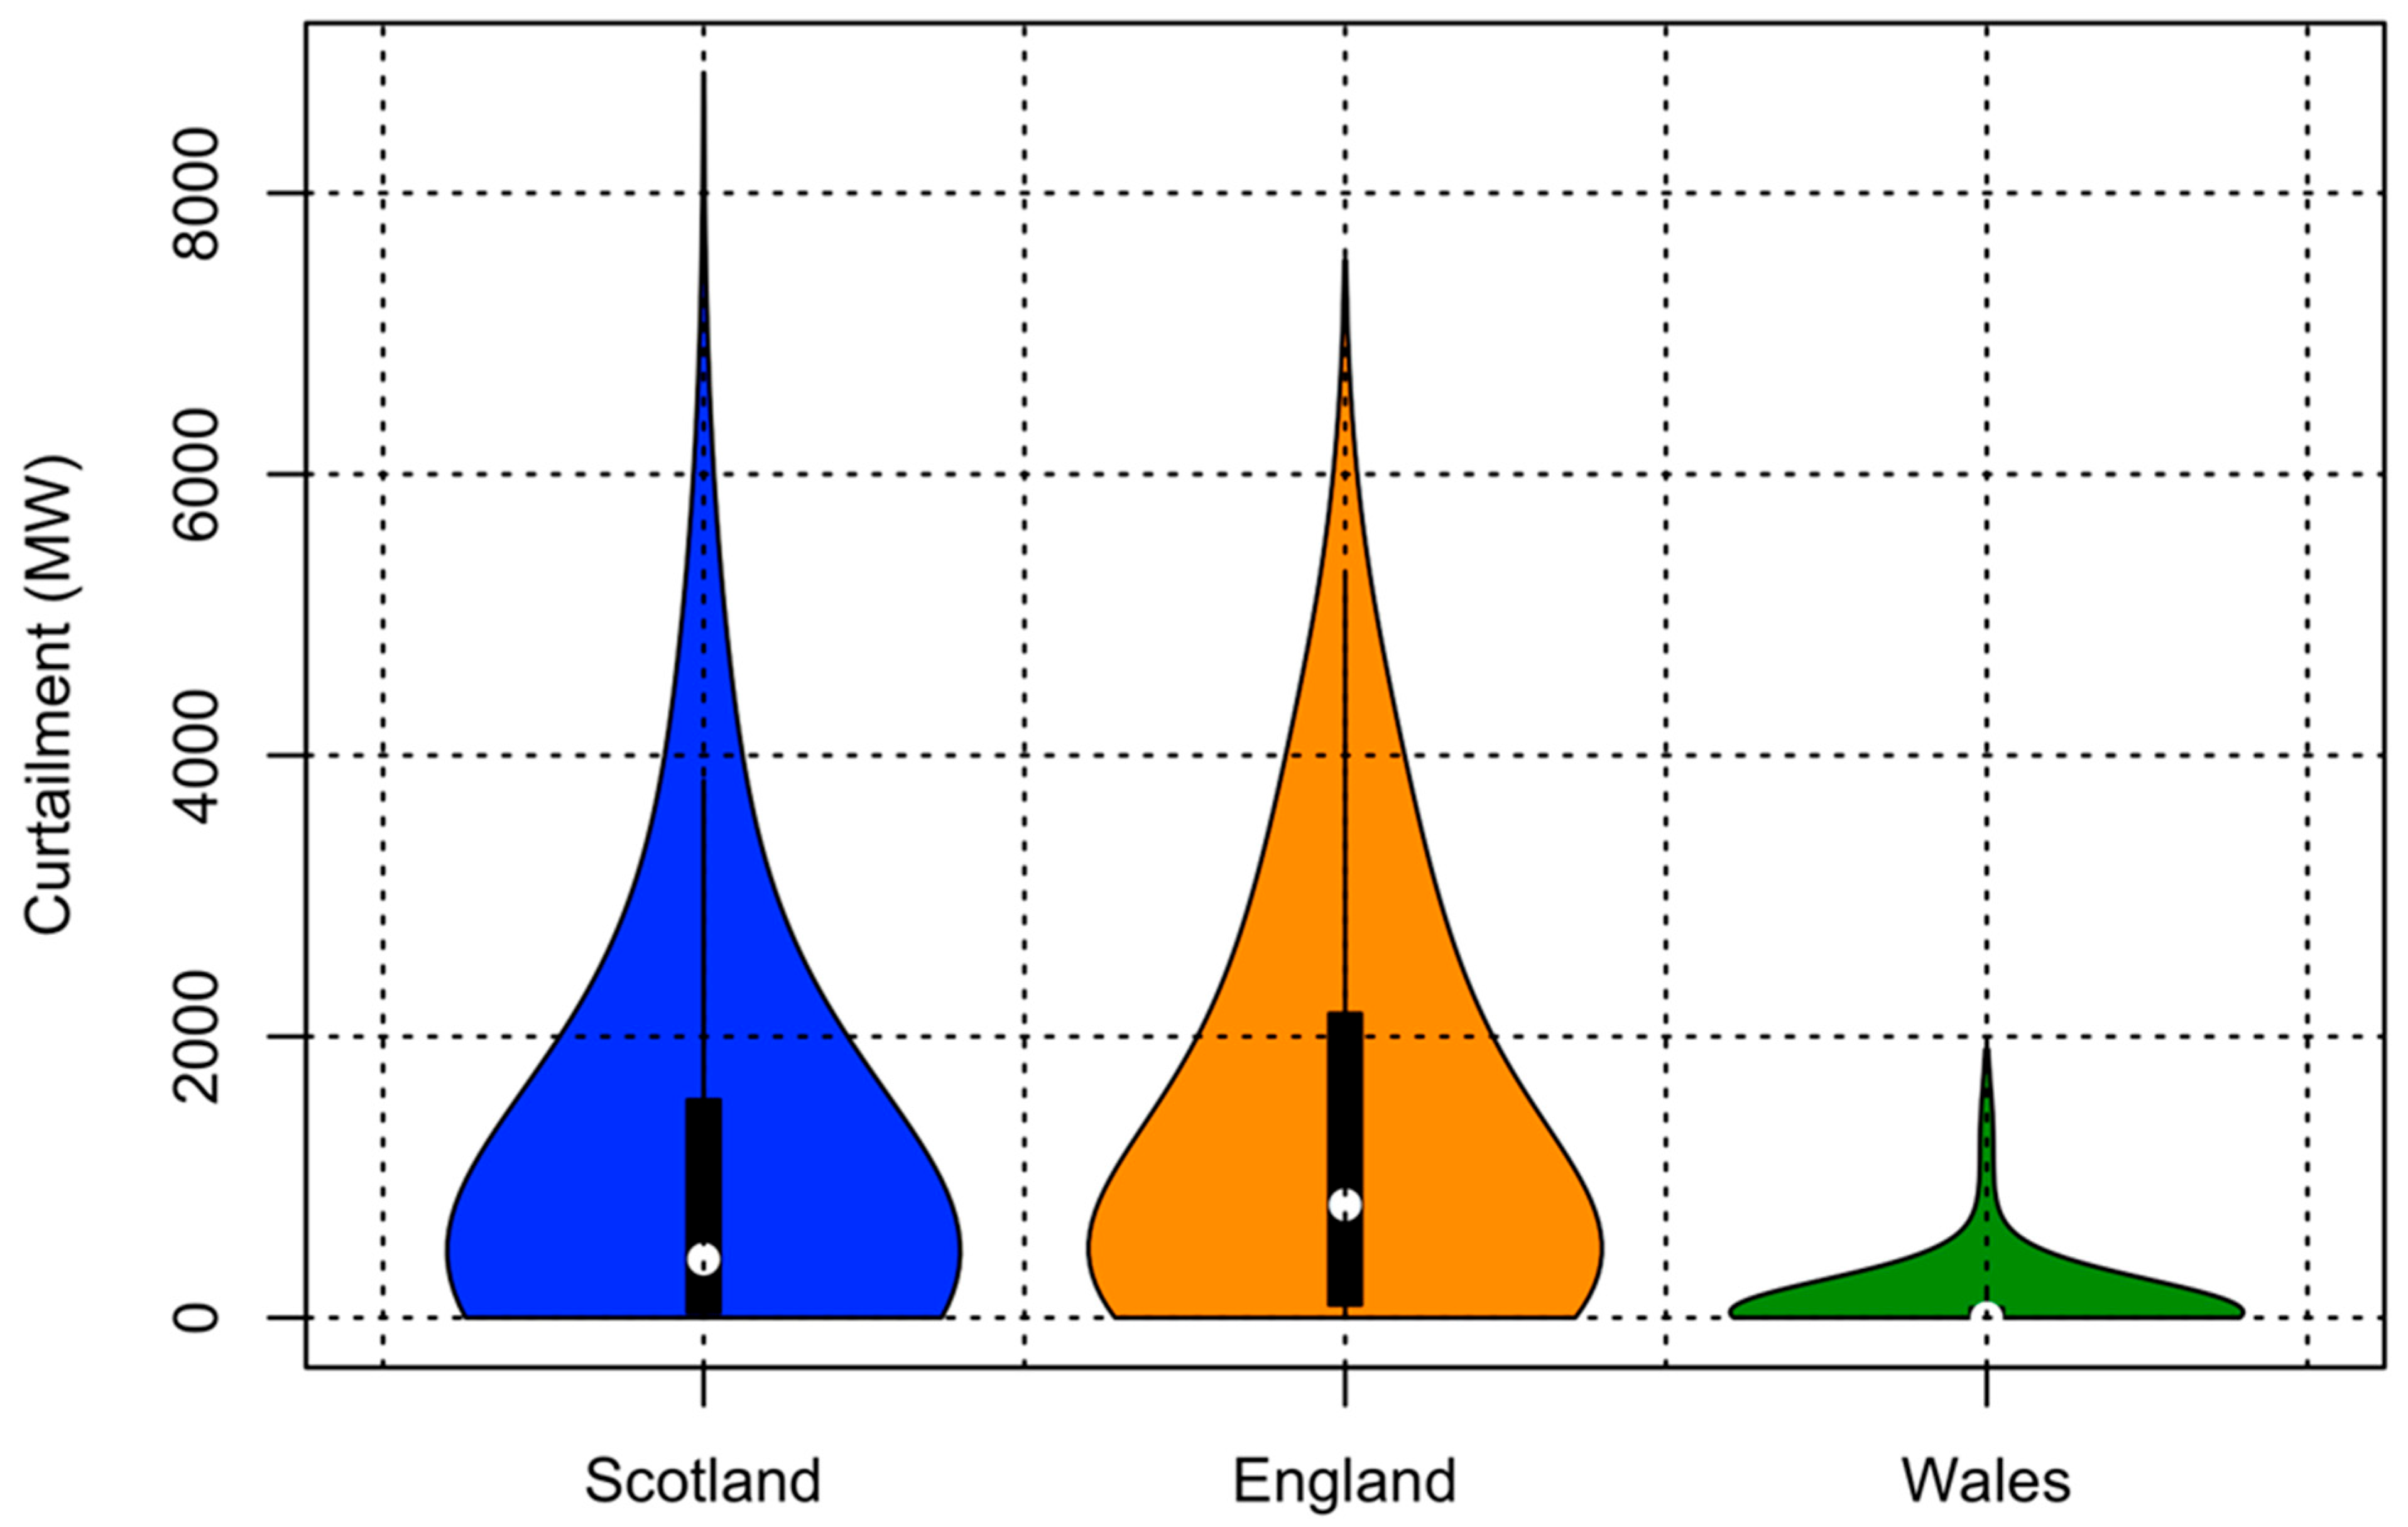
3.4. Geographic Curtailment and Boundary Constraints

All curtailment data north of a specific constraint boundary (see Figure 11) was combined using the method outlined in Section 3.1 to build a curtailment profile of a transmission zone. This data was then plotted alongside a normalised constraint percentage for each boundary, adjusted from National Grid ESO data [36]. Both datasets were processed to fit the same time series, as constraint data was available for a shorter duration than the curtailment (for the SSE N-S boundary). The curtailment was further adjusted to sample with the same half-hourly frequency provided for the constraint from the ESO. The results of this are presented in Figure 12.

3.5. Curtailment Versus Constraint

The curtailment and constraint data explored in Figure 12 does have some minor correlation, especially noticeable in Figure 12a. The drop in curtailment around periods of low constraint seems to support the idea that the constraint on boundaries that are south of installed wind capacity can be a major cause of wind curtailment, with the generated energy being unable to move south to higher demand centres [28].
However, the overall correlation appears weak, possibly due to the long timescales and high resolution of the datasets, which may obscure broader patterns. Nonetheless, the data hold promise as a training set for a machine learning model that could predict real-time curtailment based on boundary constraints. Further research employing machine learning techniques may be necessary to fully capture the complex relationship between curtailment and transmission constraints.

4. Conclusions

A detailed study has been conducted investigating wind curtailment in the Scottish energy infrastructure. The existing literature has been thoroughly investigated to determine the current accepted views on curtailment and transmission issues within Scotland, and a novel technique has been suggested for measuring and calculating wind curtailment. This method is applicable for a multi-industry approach and can assist with predicting curtailment based on any parallel dataset the user wishes to consider. The data generated through the curtailment calculator has a great number of uses and opens minute-by-minute curtailment data in a way that has not been publicly available.
The data has been successfully utilised and combined to draw curtailment trends of entire transmission regions and nations, directly comparing the behaviour on a national and seasonal basis. The concept of constraint regarding transmission has also been investigated, and the links between the geographic placement of a wind farm and the constraint boundaries have been explored. A decentralised hydrogen generation system has also been investigated, seeking to maximise the full-time usage of an electrolyser. The investigated wind farms have been linked to improving this, increasing the economic feasibility of such a set up.
There are limitations to the study, representing areas that can be expanded and improved; fixing the curtailment calculator’s initial overcounting issue (as explored in Section 3.1) is a high priority. Furthermore, scaling up the national curtailment trends would be much more accurate with an increased number of wind farms being considered, along with a more comprehensive dataset to consider, with geographic and transmission trends. More accurate modelling of the potential hydrogen electrolysis would also be useful, especially regarding the effect transmission losses would have for the cable lengths investigated.
Work would also be extremely useful in the developing area of machine learning, as the curtailment trends are difficult to predict using a more linear solution. The generated datasets would make an ideal set of training data for such an AI to be used to predict future trends from current data. The research could also be used in real time with the API requests to integrate it into a smart grid solution.

Supplementary Materials

The following supporting information can be downloaded at: https://www.mdpi.com/article/10.3390/en18112777/s1. Figure S1: Shows the transmission zones and boundaries of the Scottish grid, adapted from National Grid ESO. Figure S2: Illustrates new north-south transmission boundaries from National Grid ESO, overlaid on an earlier figure for comparison. Figures S3–S8: Depict the full-time usage of variously sized hydrogen electrolysers connected to combinations of 1 to 6 wind farms in the north group. Figures S9–S15: Depict the full-time usage of variously sized hydrogen electrolysers connected to combinations of 1 to 7 wind farms in the south group.

Author Contributions

T.S.: Data curation; Formal Analysis, Writing—original draft, Validation. W.-G.F.: Conceptualization, Writing—review & editing. S.P.: Conceptualization, Investigation, Methodology, Supervision, Writing—review & editing. All authors have read and agreed to the published version of the manuscript.

Funding

This research received no external funding.

Data Availability Statement

The original contributions presented in the study are included in the article, further inquiries can be directed to the corresponding author.

Acknowledgments

We would like to thank Michael Walsh for their help with the direction to take when writing and considering what to include in in the report. We would also like to thank Rohit Rao for our discussions regarding large scale hydrogen electrolysis that were extremely helpful and allowed us to see if the scope and depth of the hydrogen analysis was going in the right direction. We would also like to thank Sathiskumar Anusuya Ponnusami, City St George’s, University of London for their help and regular meetings to discuss how to process the large datasets the project generated. They also helped us to consider if machine learning should be integrated with any of the analysis and gave advice of some better alternatives to use in a more linear fashion. S.P. acknowledges the support from the Heriot-Watt University EPSRC Impact Acceleration Account (IAA) Grant and the Scottish Enterprise Inward Investment Catalyst Fund.

Conflicts of Interest

The authors declare no conflicts of interest.

References

  1. Kåberger, T. Progress of Renewable Electricity Replacing Fossil Fuels. Glob. Energy Interconnect 2018, 1, 48–52. [Google Scholar]
  2. Scottish Renewables. Statistics, Scottish Renewables. Available online: https://www.scottishrenewables.com/our-industry/statistics (accessed on 15 August 2023).
  3. Renewable Energy Foundation. A Decade of Constraint Payments, Rnewable Energy Foundation 30 December 2019. Available online: https://www.ref.org.uk/ref-blog/354-a-decade-of-constraint-payments (accessed on 17 August 2023).
  4. Scottish Government. Energy Statistics for Scotland—Q3 2022, Scottish Government, 2022 December 2022. Available online: https://www.gov.scot/publications/energy-statistics-for-scotland-q3–2022/pages/renewable-electricity-capacity/ (accessed on 15 August 2023).
  5. Shams, M.H.; Niaz, H.; Na, J.; Anvari-Moghaddam, A.; Liu, J.J. Machine Learning-Based Utilisation of Renewable Power Curtailments Under Uncertainty by Planning of Hydrogen Systems and Battery Storages. J. Energy Storage 2021, 41, 103010. [Google Scholar] [CrossRef]
  6. Agbonaye, O.; Keatley, P.; Huang, Y.; Odiase, F.O.; Hewitt, N. Value of Demand Flexibility for Managing Wind Energy Constraint and Curtailment. Renew. Energy 2022, 190, 487–500. [Google Scholar] [CrossRef]
  7. Zou, J.; Rahman, S.; Lai, X. Mitigation of Wind Output Curtailment by Coordinating with Pumped Storage and Increasing Transmission Capacity. In Proceedings of the IEEE Power & Energy Society General Meeting, Denver, CO, USA, 26–30 July 2015; pp. 1–5. [Google Scholar]
  8. LCP. Renewable Curtailment and the Role of Long Duration Storage—Report for Drax; LCP: London, UK, 2022. [Google Scholar]
  9. Canbulat, S.; Balci, K.; Canbulat, O.; Bayram, I.S. Techno-Economic Analysis of On-Site Energy Storage Units to Mitigate Wind Energy Curtailment: A Case Study in Scotland. Energies 2021, 14, 1691. [Google Scholar] [CrossRef]
  10. Bird, L.; Lew, D.; Milligan, M.; Carlini, E.M.; Estanqueiro, A.; Flynn, D.; Gomez-Lazaro, E.; Holttinen, H.; Menemenlis, N.; Orths, A.; et al. Wind and Solar Energy Curtailment: A Review of International Experience. Renew. Sustain. Energy Rev. 2016, 65, 577–586. [Google Scholar] [CrossRef]
  11. Burke, D.J.; O’Malley, M. Factors Influencing Wind Energy Curtailment. IEEE Trans. Sustain. Energy 2011, 2, 185–193. [Google Scholar] [CrossRef]
  12. Joos, M.; Staffell, I. Short-Term Integration Costs of Variable Renewable Energy: Wind Curtailment and Balancing in Britain and Germany. Renew. Sustain. Energy Rev. 2018, 86, 46–65. [Google Scholar] [CrossRef]
  13. European Wind Integration Study. European Wind Integration Study (EWIS), 31 March 2010. Available online: http://pfbach.dk/firma_pfb/ewis_final_report_2010.pdf (accessed on 16 August 2023).
  14. Savelli, I.; Hardy, J.; Hepburn, C.; Morsyn, T. Putting Wind and Solar in their Place: Internalising Congestion and Other System-Wide Costs with Enhanced Contracts for Difference in Great Britain. Energy Econ. 2022, 113, 106218. [Google Scholar] [CrossRef]
  15. Chalise, S.; Atia, H.R.; Poudel, B.; Tonkoski, R. Impact of Active Power Curtailment of Wind Turbines Connected to Residential Feeders for Overvoltage Prevention. IEEE Trans. Sustain. Energy 2016, 7, 471–479. [Google Scholar] [CrossRef]
  16. Agbonaye, O.; Keatley, P.; Huang, Y.; Ademulegun, O.O.; Hewitt, N. Mapping Demand Flexibility: A Spatio-Temporal Assessment of Flexibility Needs, Opportunities, and Response Potential. Appl. Energy 2021, 295, 117015. [Google Scholar] [CrossRef]
  17. Mohapatra, B.K.; Gupta, D.K.; Panigrahi, C.K.; Kabat, S.R. Congestion Management in the Deregulated Market: A Brief Survey. In Innovation in Electrical Power Engineering, Communication, and Computing Technology: Proceeding of Second IEPCCT 2021; Springer: Singapore, 2022; pp. 6–9. [Google Scholar]
  18. Brown, S.; Biggins, F. Optimising Onshore Wind with Energy Storage Considering Curtailment. Energy Rep. 2022, 8, 34–40. [Google Scholar]
  19. Jiang, Y.; Deng, Z.; You, S. Size Optimization and Economic Analysis of a Coupled Wind-Hydrogen System with Curtailment Decisions. Int. J. Hydrog. Electr. 2019, 44, 19658–19666. [Google Scholar] [CrossRef]
  20. Atlam, O.; Kolhe, M. Equivalent Electrical Model for a Proton Exchange Membrane (PEM) Electrolyser. Energy Convers. Manag. 2011, 52, 2952–2957. [Google Scholar] [CrossRef]
  21. Grüger, F.; Hoch, O.; Hartmann, J.; Robinius, M.; Stolen, D. Optimised Electrolyser Operation: Employing Forecasts of Wind Energy Availability, Hydrogen Demand, and Electricity Prices. Int. J. Hydrog. Energy 2019, 44, 4387–4397. [Google Scholar] [CrossRef]
  22. Santos, M.; Marino, I. Energy Analysis of the Raggovidda Integrated System, 30 January 2019. Available online: https://www.haeolus.eu/wp-content/uploads/2019/01/D5.1.pdf (accessed on 23 August 2023).
  23. Zenith, F.; Flote, M.N.; Santos-Mugica, M.; Duncan, C.S.; Mariani, V.; Marcantonini, C. Value of Green Hydrogen when Curtailed to Provide Grid Balancing Services. Int. J. Hydrog. Energy 2022, 47, 35541–35552. [Google Scholar] [CrossRef]
  24. Martínez de León, C.; Ríos, C.; Brey, J.J. Cost of Green Hydrogen: Limitations of Production from a Stand-Alone Photovoltaic System. Int. J. Hydrog. Energy 2023, 48, 11885–11898. [Google Scholar] [CrossRef]
  25. Sorrenti, I.; Rasmussen, T.B.; Xydis, G.; Enelodsen, P.; You, S. Correlations Between Component Size Green Hydrogen Demand and Breakeven Price for Energy Islands. Renew. Sustain. Energy Rev. 2023, 183, 113439. [Google Scholar] [CrossRef]
  26. Strachan, N.; Balta-Ozkan, N.; Joffee, D.; McGeevor, K.; Hughes, N. Soft-Linking Energy Systems and GIS Models to Investigate Spatial Hydrogen Infrastructure Development in a Low-Carbon UK Energy System. Int. J. Hydrog. Energy 2009, 34, 642–657. [Google Scholar] [CrossRef]
  27. Ibrahim, O.S.; Singlitico, A.; Proskovics, R.; McDonagh, S.; Desmond, C.; Murphy, J.D. Dedicated Large-Scale Floating Offshore Wind to Hydrogen: Assessing Design Variables in Proposed Typologies. Renew. Sustain. Energy Rev. 2022, 160, 112310. [Google Scholar] [CrossRef]
  28. Hawker, G.; Oakley, G. The Potential for Hydrogen to Reduce Curtailment of Renewable Energy in Scotland; ClimateXChange: Edinburgh, Scotland, 2023. [Google Scholar]
  29. NESO. Scottish boundaries. Available online: https://www.nationalgrideso.com/research-and-publications/electricity-ten-year-statement-etys/electricity-transmission-network/scottish-boundaries (accessed on 17 August 2023).
  30. National Grid ESO. Electricity Ten Year Statement; NESO: Warwick, UK, 2022. [Google Scholar]
  31. National Grid ESO. Netowrk Diagram Scotland, National Grid ESO. Available online: https://data.nationalgrideso.com/constraint-management/day-ahead-constraint-flows-and-limits/r/network_diagram_scotland (accessed on 20 August 2023).
  32. Elexon. What is the BSC? Available online: https://www.elexon.co.uk/knowledgebase/about-the-bsc/ (accessed on 22 August 2023).
  33. Elexon. Balancing—Physical Data. Available online: https://bmrs.elexon.co.uk/api-documentation/endpoint/balancing/physical (accessed on 24 August 2023).
  34. The Scottish Parliament. Wind Energy in Scotland: Current Position and Future Plans, The Scottish Parliament, 26 April 2023. Available online: https://spice-spotlight.scot/2023/04/26/wind-energy-in-scotland-current-position-and-future-plans (accessed on 20 August 2023).
  35. UK Government. Wind Powered Electricity in the UK. 2019. Available online: https://assets.publishing.service.gov.uk/government/uploads/system/uploads/attachment_data/file/875384/Wind_powered_electricity_in_the_UK.pdf (accessed on 25 August 2024).
  36. National Grid ESO. Day Ahead Constraint Flows and Limits, National Grid ESO. Available online: https://data.nationalgrideso.com/constraint-management/day-ahead-constraint-flows-and-limits (accessed on 19 August 2023).
  37. Esri. World Street Map, ArcGIS REST Services Directory. 2024. Available online: https://server.arcgisonline.com/ArcGIS/rest/services/World_Street_Map/MapServer (accessed on 16 February 2024).
Figure 1. (a) Shows a simplified diagram of how each transmission zone interacts across each boundary with associated transmission limits, inspired by [28] using data from [29]. (b) Shows the geographic placement of transmission boundaries and zones across the entirety of Great Britain [30]. A full transmission diagram is available in the Supporting Material (Figure S1).
Energies 18 02777 g001
Figure 2. New north-south boundaries with NKILGRMO discounted, sourced from National Grid ESO, “Network Diagram Scotland” [31], overlaid on Figure 1a. Blue lines represent constraint boundaries, black arrows boundaries between transmission zones. Full constraint boundaries can be found in the Supporting Material (Figure S2).
Energies 18 02777 g002
Figure 3. Flow diagram of the current iteration of the curtailment calculator, showing specific outputs and general methodology.
Energies 18 02777 g003
Figure 4. Example initial data series generated through API access from the curtailment calculator. Showing the continuous series generated from bid offers similar to Table 2 and the physical notification data from the asset operator (increased in frequency to match that of bid offers). The difference between these matched datasets is the next stage in the solving process.
Energies 18 02777 g004
Figure 6. (a) Shows the contributions of both BM Unit IDs to the total curtailment for Whitelee Wind Farm for 2019 to 2022. (b) Shows the total curtailment of the wind farm from both sources. Both figures cover the 4-year time span included in the investigation.
Energies 18 02777 g006
Figure 7. (a) shows the contributions of wind farms considered in the S6 (B5 to B6) transmission zone. (b) shows the total curtailment pattern of the zone from the contribution of all considered wind farms. Both figures cover the 4-year time span included in the investigation, from 2019 to 2022.
Energies 18 02777 g007
Figure 8. A graph shows upscaled curtailment values in MW for all nations in Great Britain in 2019-2022 utilising wind farms investigated by the curtailment calculator.
Energies 18 02777 g008
Figure 9. Violin plots showing the number of occurrences at that value of curtailment, the black bars inside are the quartiles, and the white circle is the median.
Energies 18 02777 g009
Figure 10. Map showing transmission boundaries and associated wind farms, along with potential locations of hydrogen electrolysers. The map data are based on the World Street Map from Esri [37].
Energies 18 02777 g010
Figure 11. Simplified map showing the three major constraint boundaries on the transmission network. From north to south: SSE N-S/B2, SSE-SP/B4, and SCOTEX/B6. The 13 wind farms plotted in relation to these constraint boundaries. The map data are based on the World Street Map from Esri [37].
Energies 18 02777 g011
Figure 12. (a) Shows summed curtailment for all tested wind farms north of the N-S/B2 boundary, (b) shows the constraint across said boundary. (c) Shows summed curtailment for all tested wind farms north of the SSE-SP/B4 boundary, (d) and the constraint across said boundary. (e) Shows summed curtailment for all tested wind farms north of the SCOTEX/B6 boundary, (f) and the constraint across said boundary. Constraint data sourced from National Grid ESO [36]. All figures have been down-sampled for clarity. Note that (a,b) has a reduced time series due to constraint data series being reduced for this boundary. Negative constraint values represent constraint in the south-north direction.
Energies 18 02777 g012
Table 1. Full boundaries for the Scottish grid and their full names, maximum capacity, and cause of the limitation, sourced from National Grid ESO [29].
BoundaryBoundary NameCapabilityThermal Constraint Location
B0Upper North SSEN Transmission1.15 GWBeauly-Shin 132 kV circuit.
B1aNorth West SSEN Transmission2.6 GWFetteresso-Kincardine 275 kV circuit
B2North to South SSEN Transmission0.44 GWInveraray-Sloy 132 kV circuit.
B3bKintrye and Argyll SSEN Transmission0.44 GWInveraray-Sloy 132 kV circuit.
B4SSEN Transmission to SP Transmission3.4 GWWestfield-Longannet 275 kV circuit.
B5North to South SP Transmission3.9 GWKindarine-Tealing 275 kV circuit
B6SP Transmission to NGET6.3 GWHarker-Moffat 400 kV circuit.
Table 2. Example Bid Offer Acceptance Level (BOAL) Data that would be utilised to calculate curtailment. Sourced from Elexon [33]. This data corresponds to settlement period 48 (the final half hour of the date) on 01/01/2020 for BM Unit ID “T_WHILW-1” (part of Whitlee Wind Farm). This data would have to be collected over every settlement period to build a continuous series for balancing mechanism requests.
Accept Time (GMT)From Time (GMT)From Level (MW)To Time (GMT)To Level (MW)
2020-01-01 23:39:002020-01-01 23:41:002642020-01-01 23:42:00100
2020-01-01 23:39:002020-01-01 23:42:001002020-01-01 23:57:00100
2020-01-01 23:39:002020-01-01 23:57:001002020-01-01 23:58:00264
2020-01-01 23:40:002020-01-01 23:42:001002020-01-02 00:27:00100
2020-01-01 23:40:002020-01-01 23:42:001002020-01-01 23:43:0050
2020-01-01 23:40:002020-01-01 23:43:00502020-01-02 00:28:0050
Table 3. Table comprising all Scottish wind farms considered in the study, their associated capacities, the percentage contribution each farm makes to the overall Scottish wind capacity, and the associated BM Unit IDs utilised to find the curtailment data. Total installed capacity is found to be 10.9 GW from the Scottish Parliament [34].
TypeWind FarmCapacity (MW)Percentage of Scottish Wind CapacityAssociated BM Unit IDs
OffshoreMoray East9508.72%T_MOWEO-1, T_MOWEO-2, T_MOWEO-3
Beatrice5885.39%T_BEATO-1, T_BEATO-2, T_BEATO-3, T_BEATO-4
OnshoreWhitelee3594.94%T_WHILW-1, T_WHILW-2
Clyde3503.21%T_CLDCW-1, T_CLDNW-1, T_CLDSW-1
South Kyle2402.20%T_SOKYW-1
Kilgallioch2392.19%T_KLGLW-1
Stronelairg2282.09%T_STLGW-1, T_STLGW-2, T_STLGW-3
Dorenell2282.09%T_DOREW-1, T_DOREW-2
Crystal Rig200.51.84%T-CRYRW-2, T-CRYRW-3
Griffin156.41.43%T_GRIFW-1, T_GRIFW-2
Black Law1241.14%T_BLLA-1, T-BLLA-2
Hadyard1201.10%T_HADHW-1
Farr920.844%T_FARR-1, T_FARR-2
Total13 Wind Farms4054.937.2%N/A
Table 4. Best-case groupings of wind farms to maximise hydrogen generation through solely curtailed electricity, compared with their viability to supply the full-time usage of a given hydrogen electrolyser. Potential minimum cable lengths to the proposed electrolyser site (shown in Figure 10) are also outlined. Full data for all combinations is shown in Figures S3–S15 in the Supporting Material.
GroupFull-Time Usage of Electrolyser of Given SizeWind FarmCable Length (Km)
25 MW50 MW100 MW200 MW300 MW400 MW500 MW
Scotland North Group 161.4%54.5%45.8%33.8%27.8%23.1%17.1%Beatrice19.3
Dorenell25.2
Moray East31.1
Scotland North Group 228.8%22.4%15.2%7.6%3.5%1.3%0.0%Farr39.9
Griffin47.3
Stronelairg45.6
Scotland South Group 135.2%29.2%21.6%13.7%9.7%7.1%5.4%Crystal Rig75.3
Whitelee40.4
Black Law0
Scotland South Group 222.3%17.5%12.6%7.5%2.0%0.0%0.0%South Kyle19.9
Hadyard Hill11.3
Kilgalloich21.8
Disclaimer/Publisher’s Note: The statements, opinions and data contained in all publications are solely those of the individual author(s) and contributor(s) and not of MDPI and/or the editor(s). MDPI and/or the editor(s) disclaim responsibility for any injury to people or property resulting from any ideas, methods, instructions or products referred to in the content.

