Article

Variational Autoencoder Based Anomaly Detection in Large-Scale Energy Storage Power Stations

1
State Key Laboratory of Automotive Safety and Energy, Tsinghua University, Beijing 100084, China
2
Qixin Technology (Beijing) Co., Ltd., Beijing 100085, China
3
State Grid Jiangsu Electric Power Co., Ltd., Research Institute, Nanjing 211103, China
4
School of Mechanical and Energy Engineering, Beijing University of Technology, Beijing 100124, China
*
Author to whom correspondence should be addressed.
Energies 2025, 18(11), 2770; https://doi.org/10.3390/en18112770
Submission received: 1 April 2025 / Revised: 22 April 2025 / Accepted: 23 May 2025 / Published: 26 May 2025

Abstract

:
The rapid development of energy storage power stations plays a significant role in the widespread adoption of the energy internet. Anomaly detection in these stations, as a critical component of daily operation and maintenance, holds great importance for ensuring the normal operation of energy storage systems. Currently, station monitoring primarily relies on preset fixed threshold-based alerts combined with manual supervision. However, this approach is unable to detect abnormal states below the threshold and poses a risk of missing certain anomalies. This study employs an unsupervised deep learning model based on variational autoencoders (VAEs) to perform anomaly detection on real operational data. By training the model on normal operational data, the model learns the distribution of data in the latent space under normal conditions. Experimental results demonstrate that the VAE-based model is capable of effectively detecting abnormal data segments and outliers in electricity power real-world data. Compared to classical machine learning algorithms such as Isolation Forest and Support Vector Machine, the detection performance of the VAE-based model demonstrates superiority, indicating its practical value and research significance.

1. Introduction

1.1. Architecture of Battery Energy Storage Power Stations

Energy storage technology plays a pivotal role in the energy sector, particularly in the context of the energy internet, where it serves as a crucial component in achieving the “source-grid-load-storage” model. To enhance the risk resistance and flexible regulation capabilities of power grids, energy storage power stations are widely applied across various stages of the power system, including generation, transmission, distribution, transformation, and consumption, thereby improving grid safety and stability [1]. In the distribution phase of the power system, battery energy storage power stations utilize electrochemical storage media to store and release energy, enabling a more gentle regulation and balance of the power system. This technology is currently the most widely adopted form of energy storage [2].
The battery energy storage system and the power conversion system are the core components of a battery energy storage power station, with their key electrical equipment directly impacting the overall reliability of the station. The battery energy storage system consists of a battery pack and a battery management system, with the battery pack serving as the core component responsible for energy storage and release [3]. The power conversion system comprises devices such as storage converters, transformers, filter reactors, AC circuit breakers, and ring-main units. Among these, the converter acts as the core component, primarily responsible for the conversion of electrical energy between AC and DC. It is integrated with filter reactors and AC circuit breakers into the converter bay, along with other electrical equipment. The basic architecture of a battery energy storage power station is illustrated in Figure 1.

1.2. Anomaly Detection in Energy Storage Power Stations

Energy storage power stations are equipped with a variety of sensors that monitor critical information such as current, voltage, temperature, pressure, and strain of energy storage units. During long-term operation, the central control unit accumulates a large amount of high-dimensional time-series data. Typically, energy storage power stations are composed of multiple battery clusters, and there are significant differences in sensor signals between individual battery cells, battery clusters, and the overall energy storage system. These signals are systematically categorized based on a hierarchical framework: Individual Sensors → Battery Clusters → Energy Storage Devices → Energy Storage Systems (Figure 1). This framework, combined with the charge discharge mechanisms of batteries, is used to select appropriate parameters and data for constructing datasets.
In industrial processes, anomaly detection aims to identify operational segments or monitoring data that deviate from normal operating conditions or patterns. On the algorithmic level, any data point or segment with characteristics different from normal data should be classified as an “anomaly”. These anomalies can be categorized into three types: data errors, sub-health anomalies, and over-limit anomalies [4]. As illustrated in Figure 2a, data errors refer to measurement anomalies caused by external factors during data collection, without indicating any underlying device malfunction, and, they do not require an alarm. Sub-health anomalies and over-limit anomalies are defined based on predetermined alarm thresholds: data below the threshold is classified as sub-health anomalies, while data exceeding the threshold is classified as over-limit anomalies. Both scenarios require the issuance of alerts to ensure operational safety and reliability.

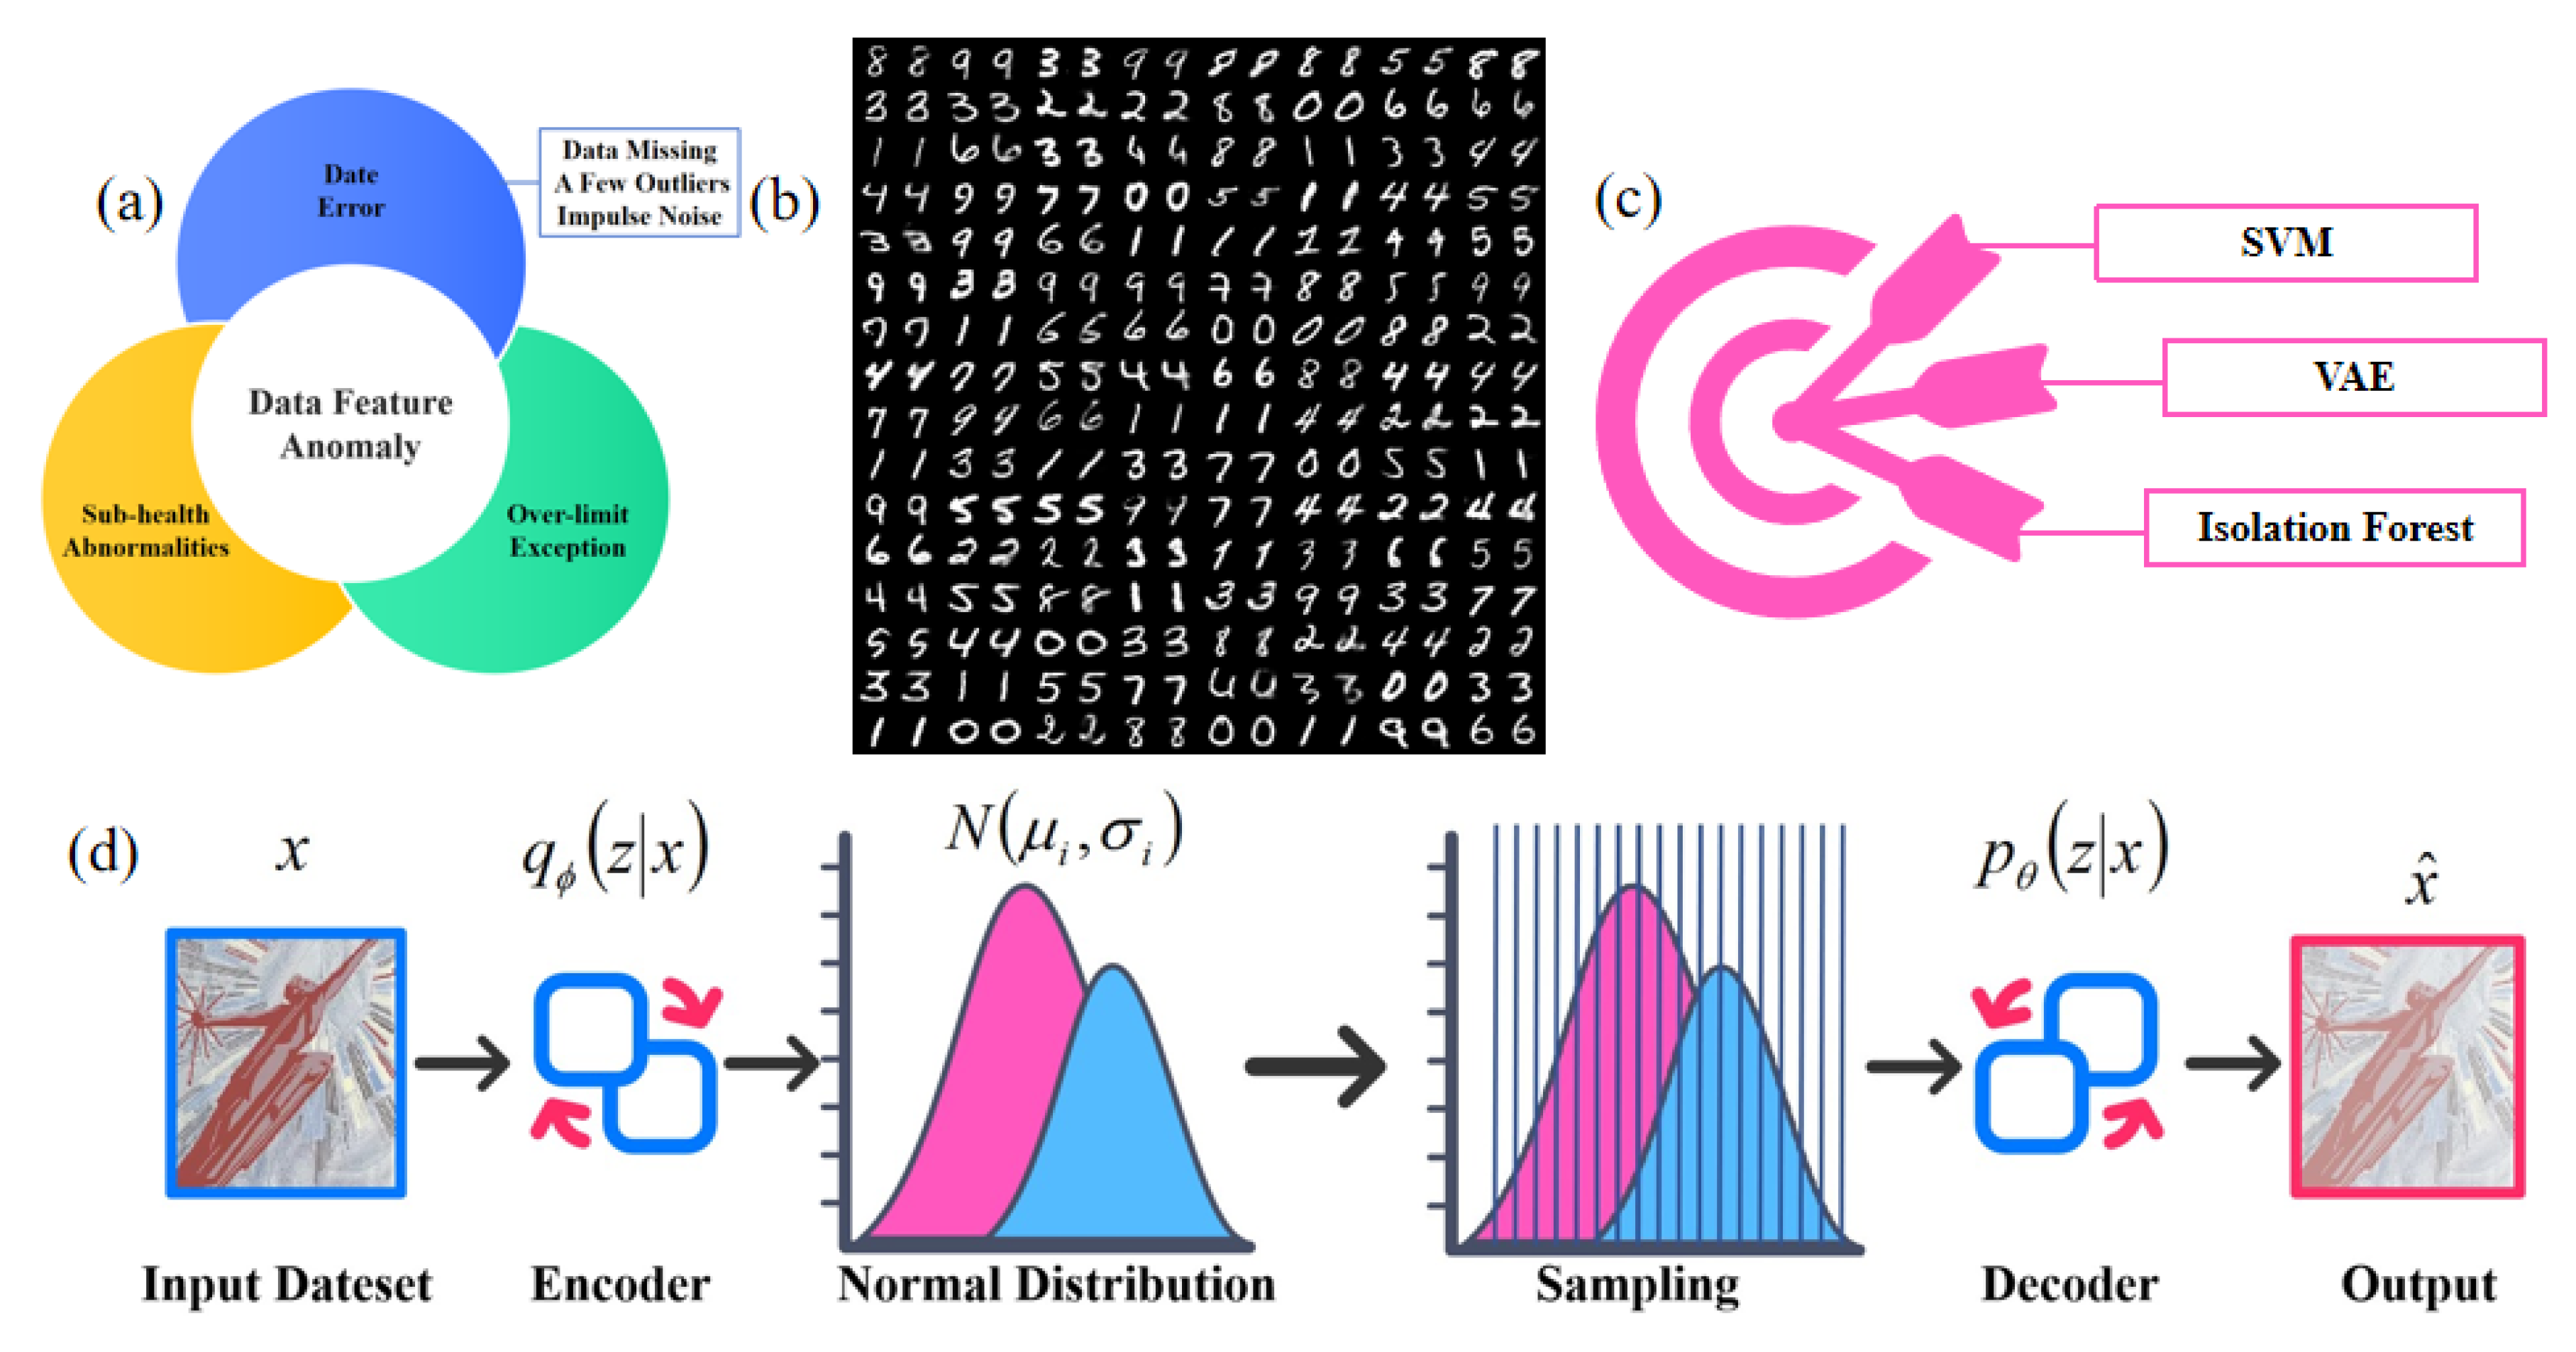
1.3. Anomaly Detection Algorithms

In recent years, data-driven anomaly detection algorithms have become the mainstream technical approach, primarily classified into three categories: statistical-based methods, machine learning-based methods, and deep learning-based methods.
Statistical-based methods mainly include Principal Component Analysis (PCA) [5], Partial Least Squares (PLS) [6], and Multivariate Statistical Process Control (MSPC) [7], among others. These methods require the data distribution to adhere to certain mathematical patterns, such as linear distribution, Gaussian distribution, or single modality. However, real-world data often fail to satisfy these requirements, leading to potential false alarms or missed detections.
Machine learning-based methods primarily encompass techniques such as K-Nearest Neighbors (KNN) [8], Support Vector Domain Description (SVDD) [9], and Support Vector Machine (SVM) [10]. These approaches distinguish between abnormal and normal data based on specific rules to achieve anomaly detection. However, when dealing with datasets characterized by a large volume and diverse types of information, classical machine learning methods may struggle to perform effectively.
Support Vector Machines (SVMs) play a significant role in anomaly detection, with One-Class SVM being particularly valuable in this domain. One-Class SVM excels by constructing a boundary model around normal data instances, thereby enabling the identification of outliers [11]. This methodology has been extensively applied in high-dimensional data anomaly detection, especially in the realms of image and video data, where the integration with deep learning models for feature extraction has demonstrated enhanced detection performance [12]. Furthermore, empirical studies have underscored the importance of tuning One-Class SVM parameters, such as the kernel function and γ value, to optimize detection outcomes [13].
In recent years, One-Class SVM has been effectively combined with other advanced techniques, including convolutional autoencoders and the stochastic gradient descent (SGD), to enhance both the accuracy and computational efficiency of anomaly detection systems [14]. However, the performance of One-Class SVM remains contingent upon the characteristics of the input data and the meticulous selection of parameters, necessitating application-specific optimization [15]. In conclusion, One-Class SVM stands as a robust and versatile tool in anomaly detection, with future research directions likely encompassing the development of refined parameter optimization strategies and the exploration of its applicability across diverse data domains [16].
Isolation Forest, an efficient anomaly detection algorithm, has garnered significant attention in recent years. Introduced by Liu et al. in 2008 [17], the core concept of this algorithm lies in leveraging the “isolation” property of data to identify outliers. Unlike traditional anomaly detection methods based on distance or density measures, Isolation Forest constructs Isolation Trees by recursively partitioning the data. Due to their small in quantity and different in nature characteristics, outliers are typically isolated more quickly within this framework [18].
The Isolation Forest algorithm possesses several notable advantages. First and foremost, it exhibits high computational efficiency, enabling the rapid processing of large-scale, high-dimensional datasets [19]. Additionally, the algorithm demonstrates strong robustness against noise and outliers, particularly excelling in handling high-dimensional problems with a substantial number of irrelevant attributes [20]. Furthermore, the linear time complexity and low memory requirements of Isolation Forest make it highly advantageous for processing extensive datasets [21].
Despite its strengths, the Isolation Forest algorithm also has certain limitations. One notable drawback is its sensitivity to hyperparameters, such as the number of trees and the size of the subsample, which significantly influence detection performance [22]. Moreover, as a “black-box” model, Isolation Forest lacks transparency in explaining its detection results, which may pose a limitation in applications where interpretability is crucial [23]. Additionally, the algorithm may encounter overfitting issues, particularly when an excessive number of trees is present in the forest [24].
Variational Autoencoders (VAEs) have garnered increasing attention in the domain of anomaly detection. By learning the latent distribution of data, VAEs identify anomalies as samples that deviate from the normal distribution, thereby facilitating anomaly detection [25]. For instance, the VAE-LSTM hybrid model proposed by Lin integrates the local feature extraction capability of VAEs with the long-term dependency modeling ability of LSTMs, enabling the effective detection of anomalies across multiple temporal scales [26]. Additionally, VAE models based on Transformers have been employed for anomaly detection in broadcast automatic dependent surveillance-broadcast (ADS-B) message sequences, leveraging the self-attention mechanism to model long-range dependency relationships and further enhancing detection performance [27].
The advantages of VAE models in anomaly detection stem from their robust representation learning capabilities, which enable automatic extraction of critical features while modeling data distributions [28]. Furthermore, the unsupervised learning nature of VAEs allows for training without labeled data, reducing reliance on annotated datasets [29]. However, VAEs also face challenges in anomaly detection, such as insufficient reconstruction errors in certain cases when distinguishing between normal and anomalous samples [30]. Future research directions may focus on improving the network architecture and optimization algorithms of VAEs to further enhance their performance in anomaly detection.
To address these challenges, deep learning has emerged as a powerful solution. It has demonstrated exceptional performance in handling complex, real-world problems and has shown significant advantages over traditional anomaly detection algorithms in terms of performance and robustness.

2. VAE-Based Anomaly Detection Model

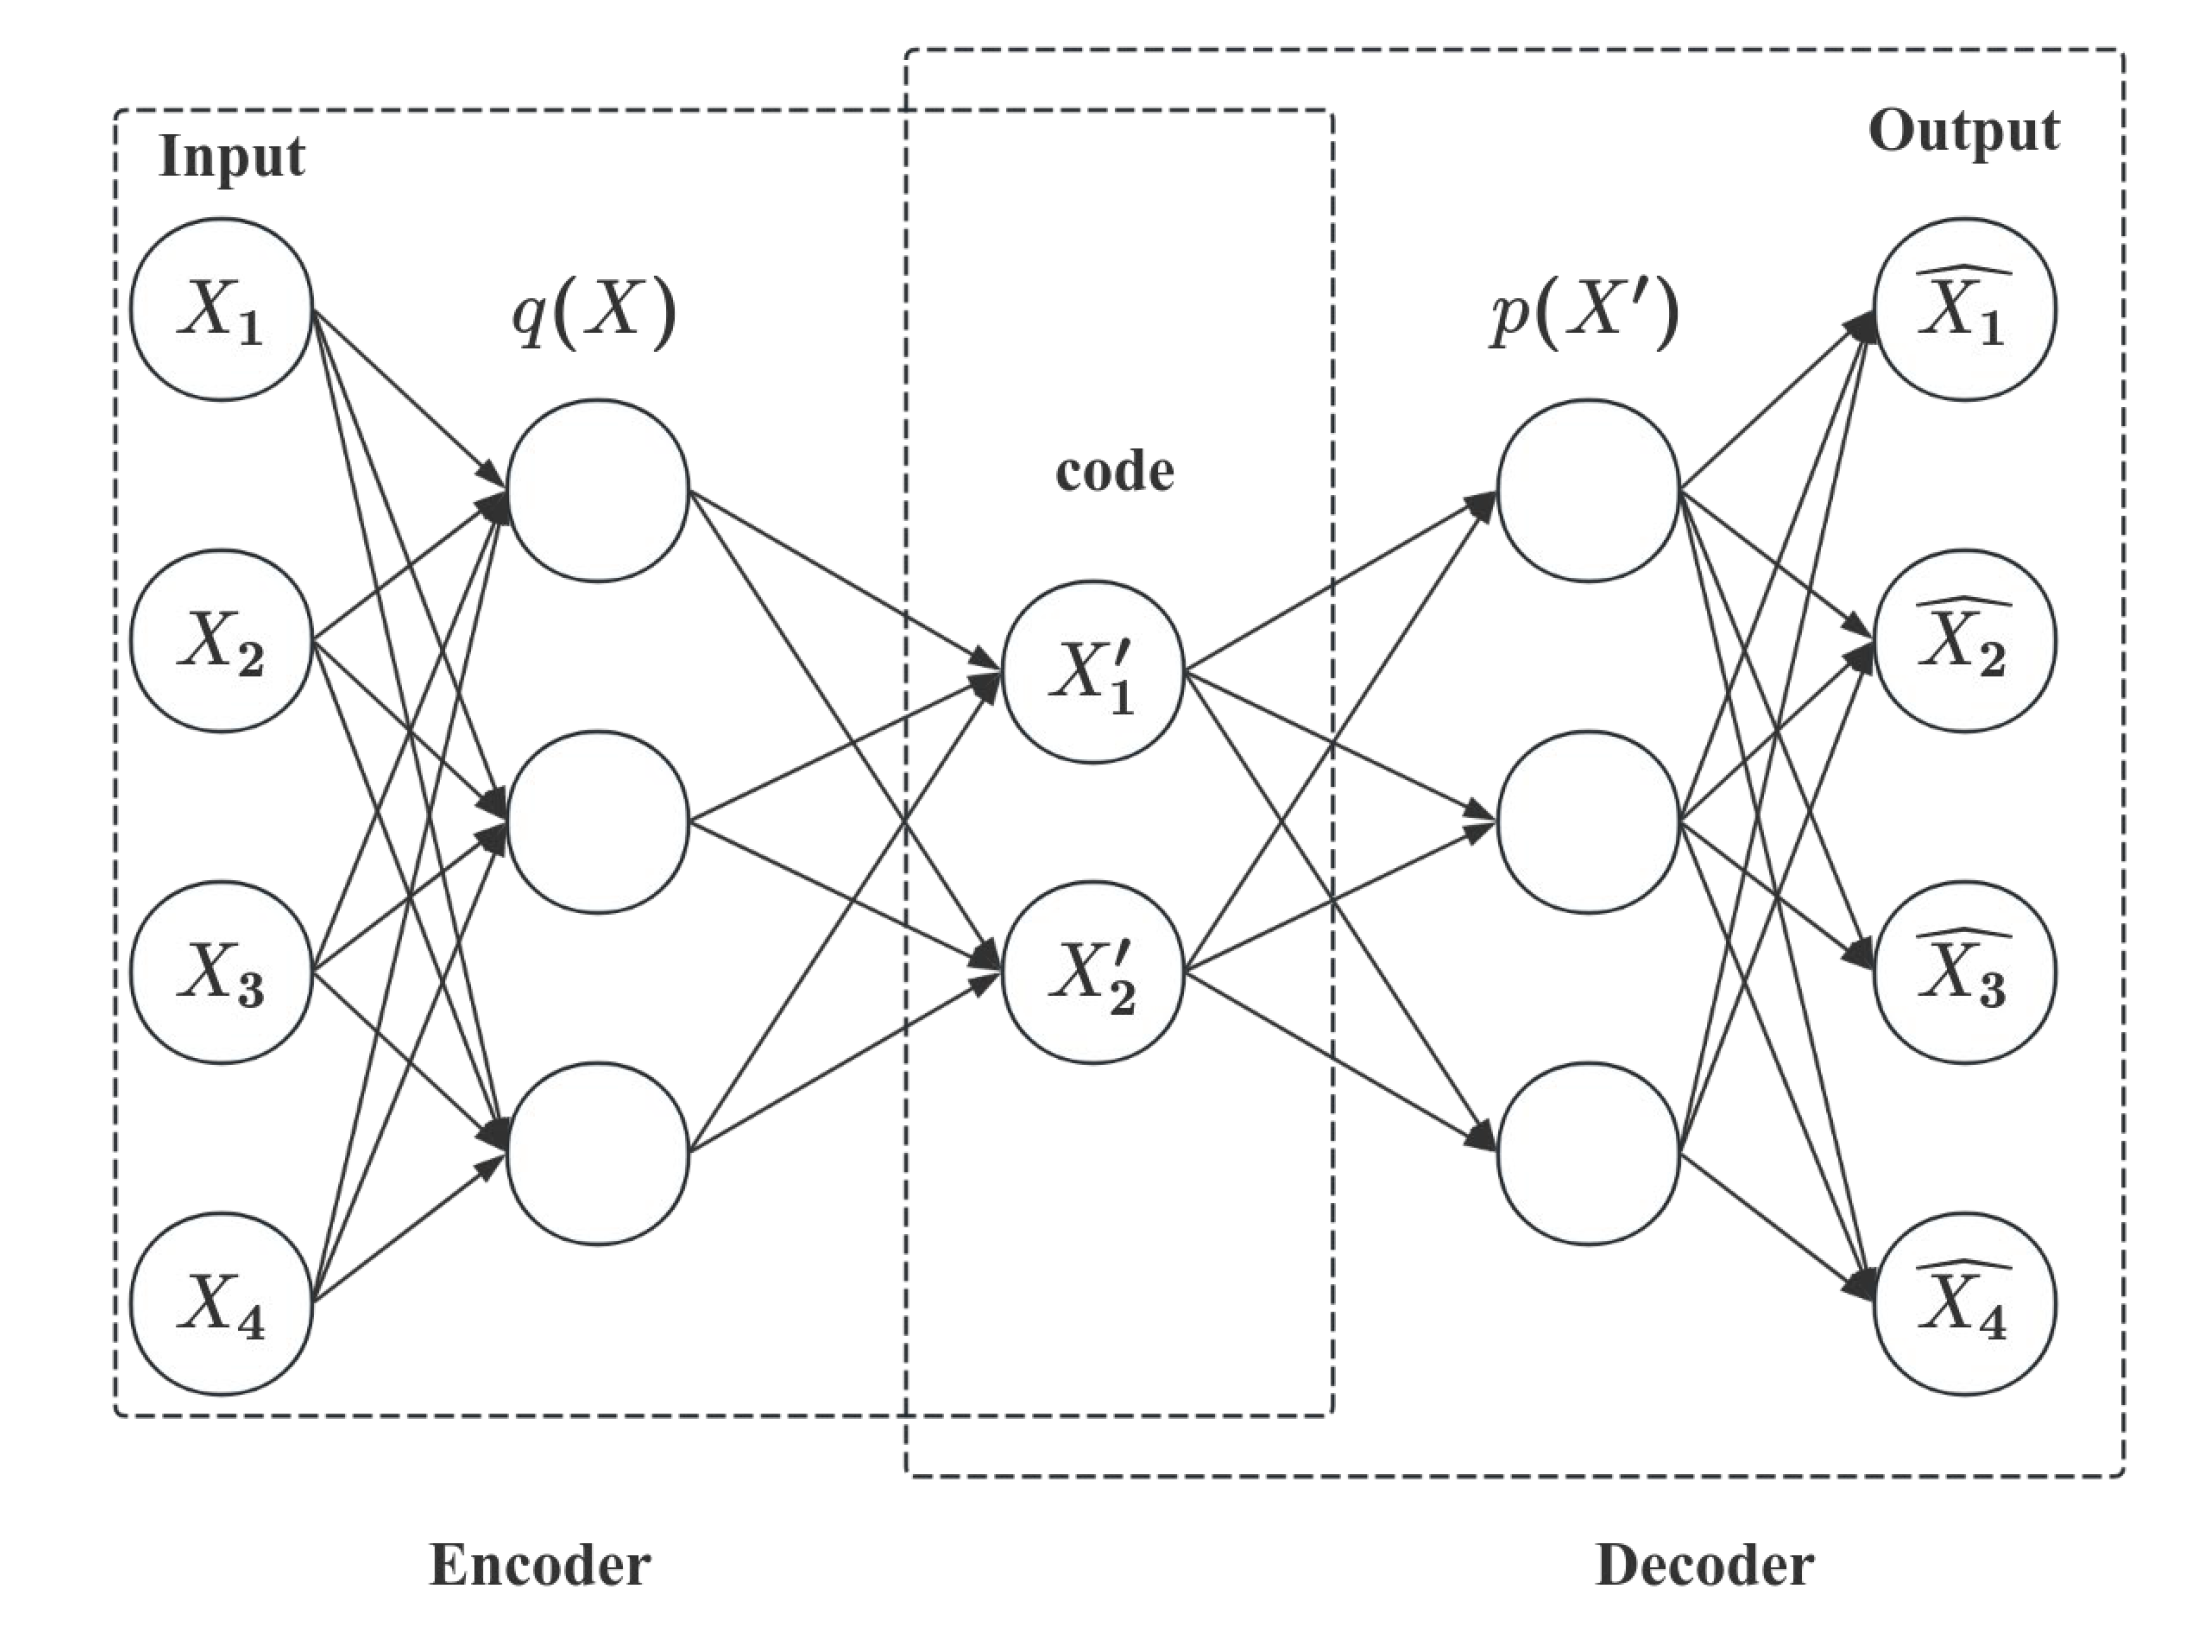
2.1. Variational Autoencoder Working Principle

VAE is an unsupervised deep learning method that maps multidimensional time-series data into a latent space and reconstructs the original input from sampled latent variables. Based on the assumption that the probability of reconstructing anomaly data from anomaly data is very low, VAE identifies anomalies by evaluating the reconstruction error, thereby enabling state monitoring [31]. VAE utilizes a directed probabilistic graphical model (DPGM) to estimate the posterior probability using neural networks, sharing a similar structure with traditional autoencoders (AE) [32]. In addition to performing tasks akin to autoencoders, such as encoding and decoding input data, VAE incorporates probabilistic inference capabilities. Specifically, VAE encodes input vectors into probability distributions in the latent space, samples randomly from these distributions, and then decodes them to obtain reconstructed probabilities corresponding to the original input. Unlike autoencoders, which rely on reconstruction errors for anomaly detection, VAE models the parameters of latent variable distributions through probabilistic encoders, thereby offering enhanced variability and generalization expressiveness. The network architecture of the VAE is depicted in Figure 3.
The VAE model is primarily composed of an encoder and a decoder. VAE adopts an encoder decoder structure and incorporates a resampling process. For a multi-dimensional time series dataset X = x i R m × n , i 1 , 2 , , n with m dimensions, and the encoder transforms the input variable x into the posterior probability distribution of the latent variable z , denoted as q φ z x . Here, φ represents the parameters of a normal distribution, with a mean of μ x and a variance of σ x 2 . A random sample is drawn from this distribution to obtain the latent variable z , which is then decoded by the decoder to reconstruct the output x ^ .
The training process of a VAE aims to make the posterior distribution q φ z x approximate the true distribution p θ z , where θ represents the parameters of the distribution. To achieve the maximum likelihood estimation, we set
p θ x 1 , x 2 , , x n = log p θ x i
by manipulating the formula
log p θ x i = D K L q φ z x i , p θ z x i + ϑ θ , φ ; x i
where D K L denotes the Kullback Leibler divergence between the two distributions and ϑ represents the objective function of the distribution.
This problem was transformed into optimizing the lower bound of likelihood estimation, which corresponds to the ELBO (Evidence Lower Bound) process in variational inference, denoted as E 0 . Further derivation of the formula is
log p θ x i = D K L q φ z x i , p θ z + E q φ z x i log p θ x i z
The VAE’s loss function incorporates both reconstruction loss and KL divergence loss. The loss function can be expressed as
Loss = D M S E X , X ^ + D K L q z x p z
The reconstruction loss was calculated using the Mean Square Error (MSE), which quantifies the difference between the reconstructed data X and the original data X .
The KL divergence loss is used to measure the similarity between the true distribution p z and the approximate distribution q z x . A smaller KL value indicates a closer proximity between the two distributions. For a VAE model trained on normal data, when abnormal data is input, the reconstruction probability of the anomaly points is low, and the reconstruction quality is poor, thereby enabling effective anomaly detection.

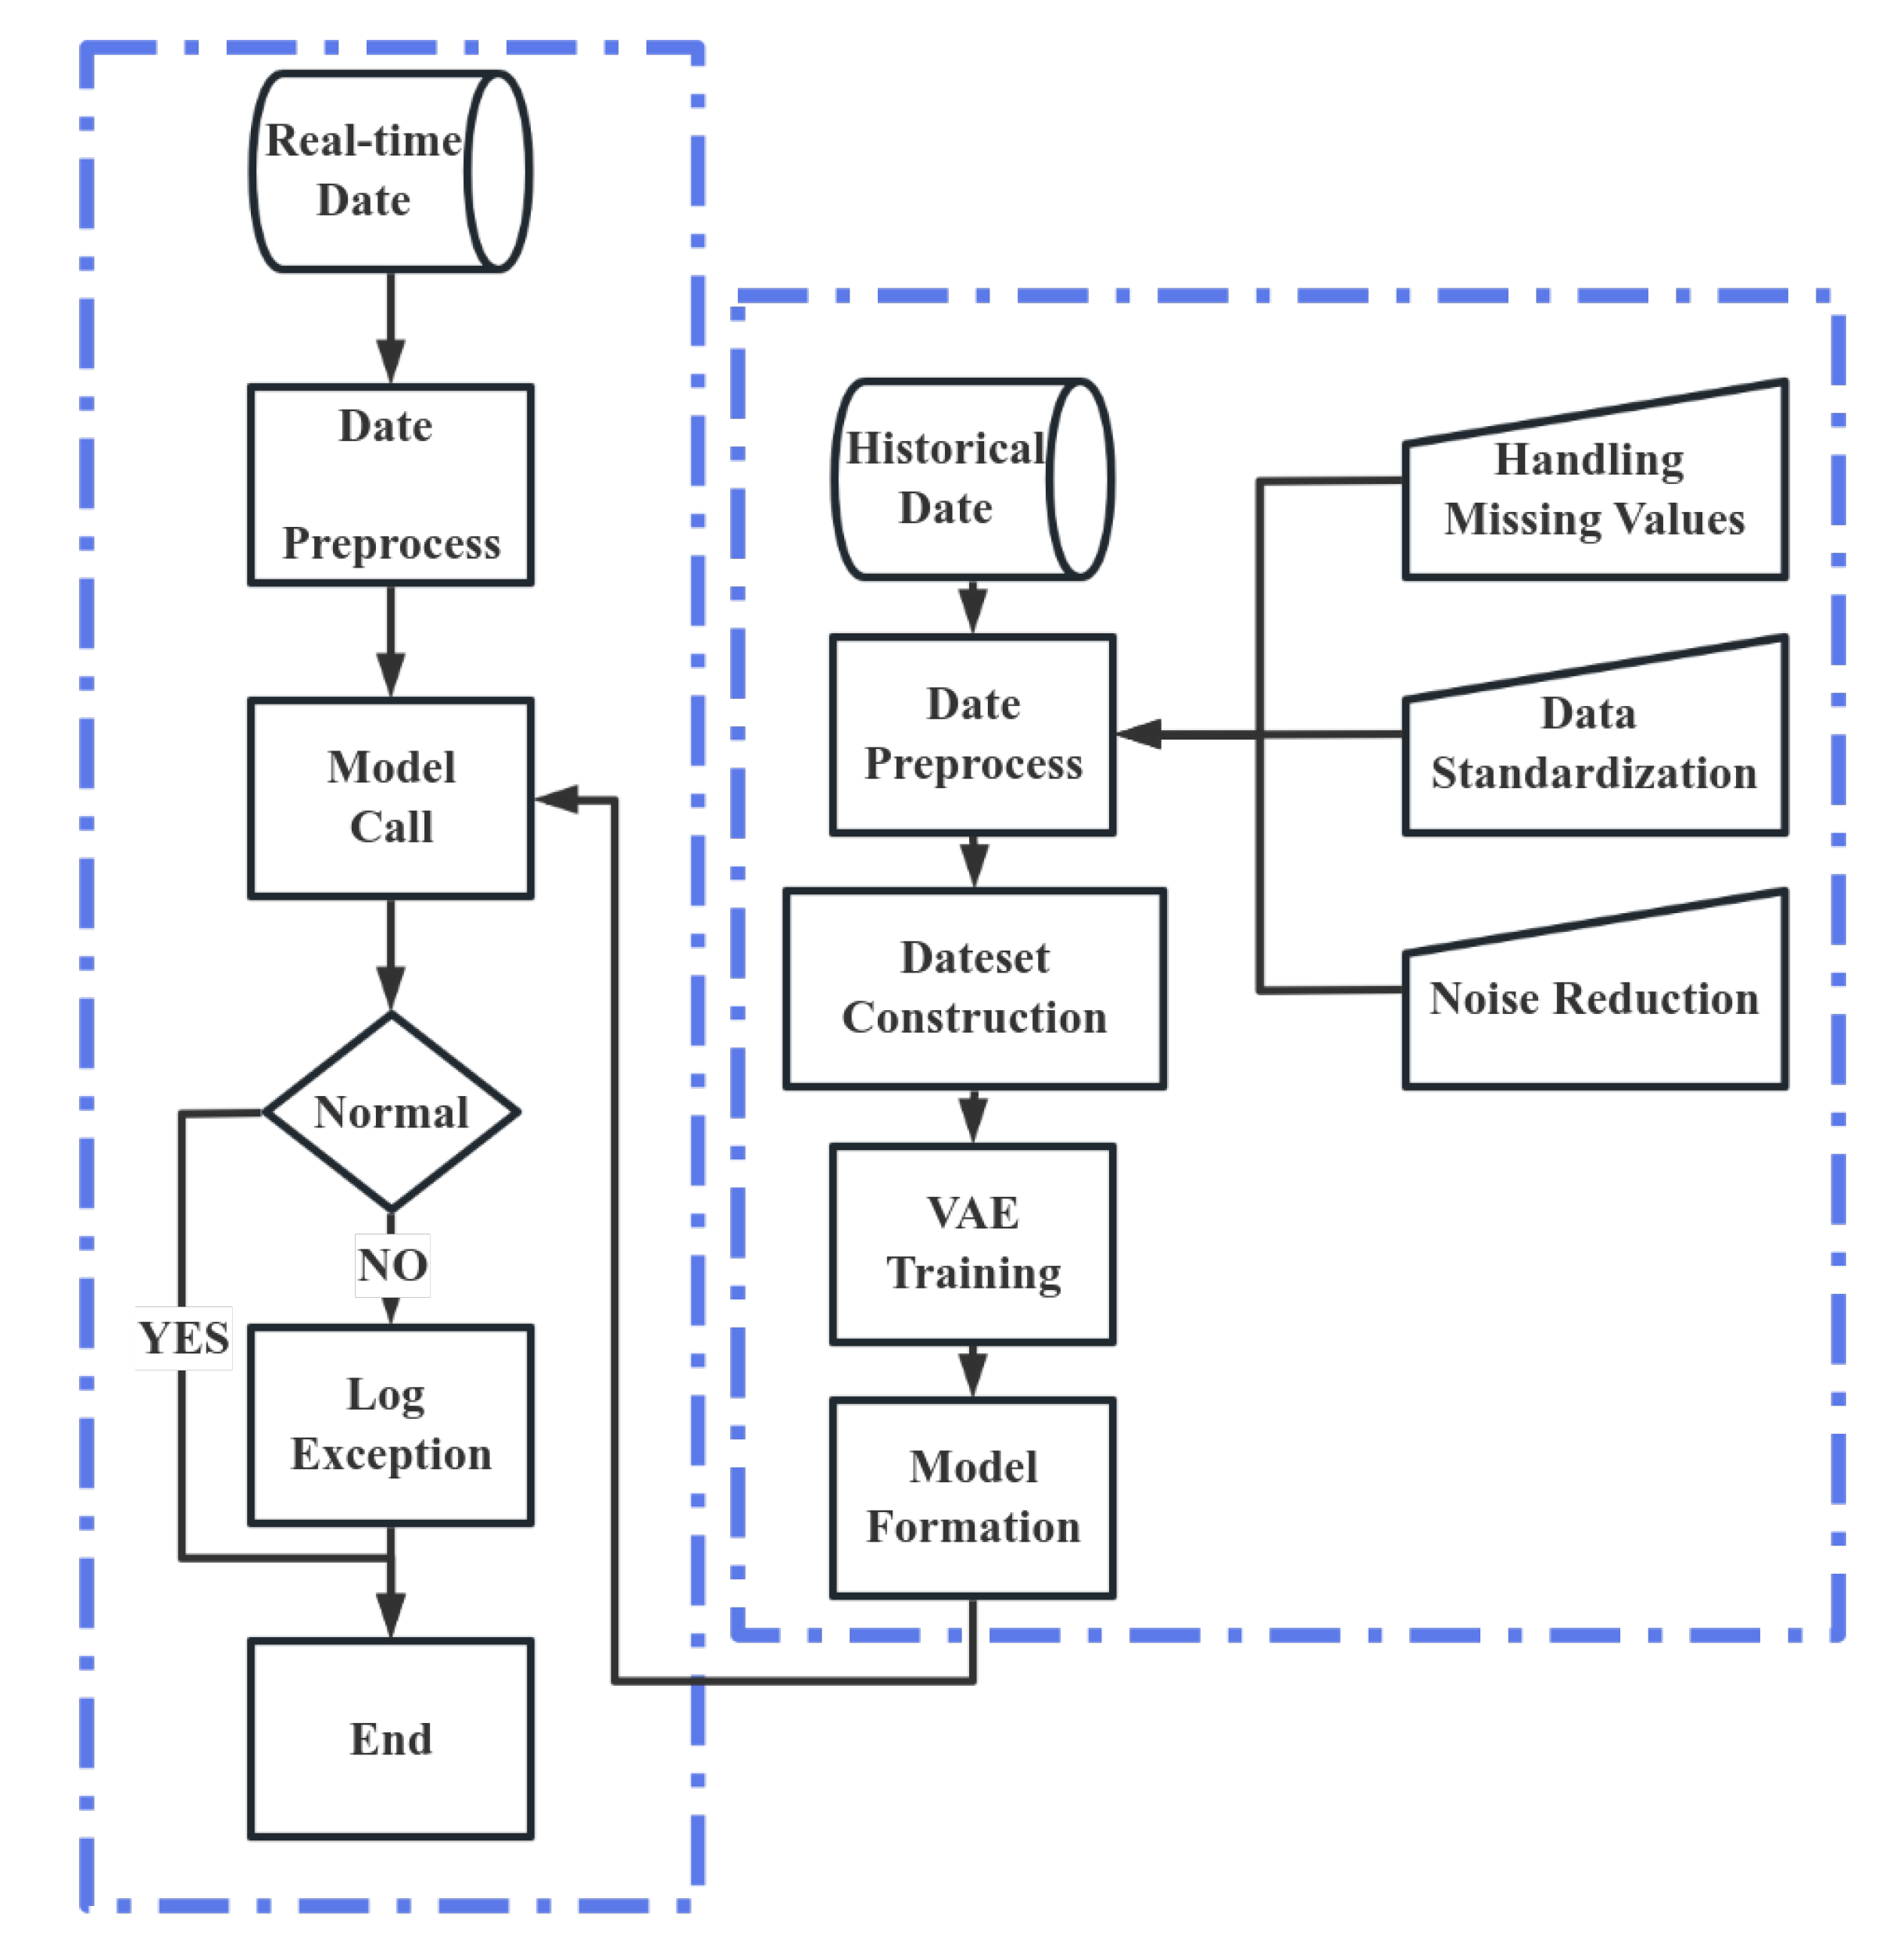
2.2. Anomaly Detection Process

The anomaly detection process involves several key steps to identify deviations from normal operating conditions. First, data are collected from various sensors monitoring critical parameters such as current, voltage, temperature, and strain. These raw data are then preprocessed to remove noise and outliers, ensuring high-quality input for subsequent analysis. Feature extraction is performed to identify relevant characteristics from the data, enabling the model to focus on essential patterns. The data are subsequently split into training and testing sets.
The VAE learns the distribution of normal data in the latent space and reconstructs the input data. During the detection phase, new data are fed into the trained model, and the reconstruction error is calculated. If the reconstruction error exceeds a predefined threshold, the data are flagged as anomalous. The results are analyzed to determine the type of anomaly, such as data errors, sub-health anomalies, or over-limit anomalies, as described in the previous sections. This process ensures effective identification and classification of anomalies, contributing to enhanced system reliability and safety.
Based on the principles of the VAE algorithm and the monitoring requirements of the operational status of energy storage power stations, the anomaly detection process of the model is illustrated in Figure 4 [33].
Figure 4 illustrates a flowchart of an anomaly detection process based on VAEs, which is bifurcated into two primary sections: real-time data processing and historical data processing. In the real-time data processing section, the system initially receives real-time data, followed by date preprocessing to ensure the temporal consistency of the data. Subsequently, a model is invoked to analyze the preprocessed data. If the model deems the data as normal, the process is terminated; however, if an anomaly is detected, it is logged and the appropriate handling mechanisms are activated. In the historical data processing section, date preprocessing is first applied to the historical data to ensure the integrity of the temporal sequence. This is followed by dataset construction, which encompasses steps such as handling missing values, data standardization, and noise reduction to enhance the quality and efficiency of model training. After the completion of data preprocessing, VAE model training is conducted, wherein the model learns the latent distribution of the data to construct an anomaly detection model. Ultimately, the final model is formulated for use in the anomaly detection of real-time data.
This flowchart underscores the significance of data preprocessing in enhancing model performance. By integrating the processing of both real-time and historical data, the system is capable of more comprehensively capturing anomalous patterns within the data, thereby improving the accuracy and reliability of anomaly detection. Moreover, the flowchart elucidates the iterative optimization process of the model, which involves the continuous updating and refinement of the model to adapt to changes in data distribution and to enhance detection performance.
Due to differences in the units of measurement and sampling periods of sensor data from different battery clusters in energy storage power stations, and given that issues such as data loss and redundancy may occur during data collection and transmission, it is necessary to perform data cleaning and preprocessing. This process ensures the acquisition of data of consistent length and uniform amplitude range for normal operational data, which are then utilized for model training. The trained anomaly detection model is subsequently employed to detect real-time data after processing, determining if the data are abnormal. Furthermore, the model is integrated with alarm strategies to generate abnormal warnings effectively.
Figure 2b illustrates the process of encoding and decoding different handwritten Arabic digits (0–9) as images using the VAE model, followed by the extraction of data features from the latent space. A matrix-based analysis was employed to evaluate the performance of the VAE model, where the odd columns represent the input to the model, and the subsequent columns (immediately following the odd columns) represent the model’s output. The results demonstrate that the VAE model effectively preserves the majority of the input data’s features, with the reconstructed outputs closely resembling the original data, thereby satisfying the design requirements of the VAE model.

3. Experiment

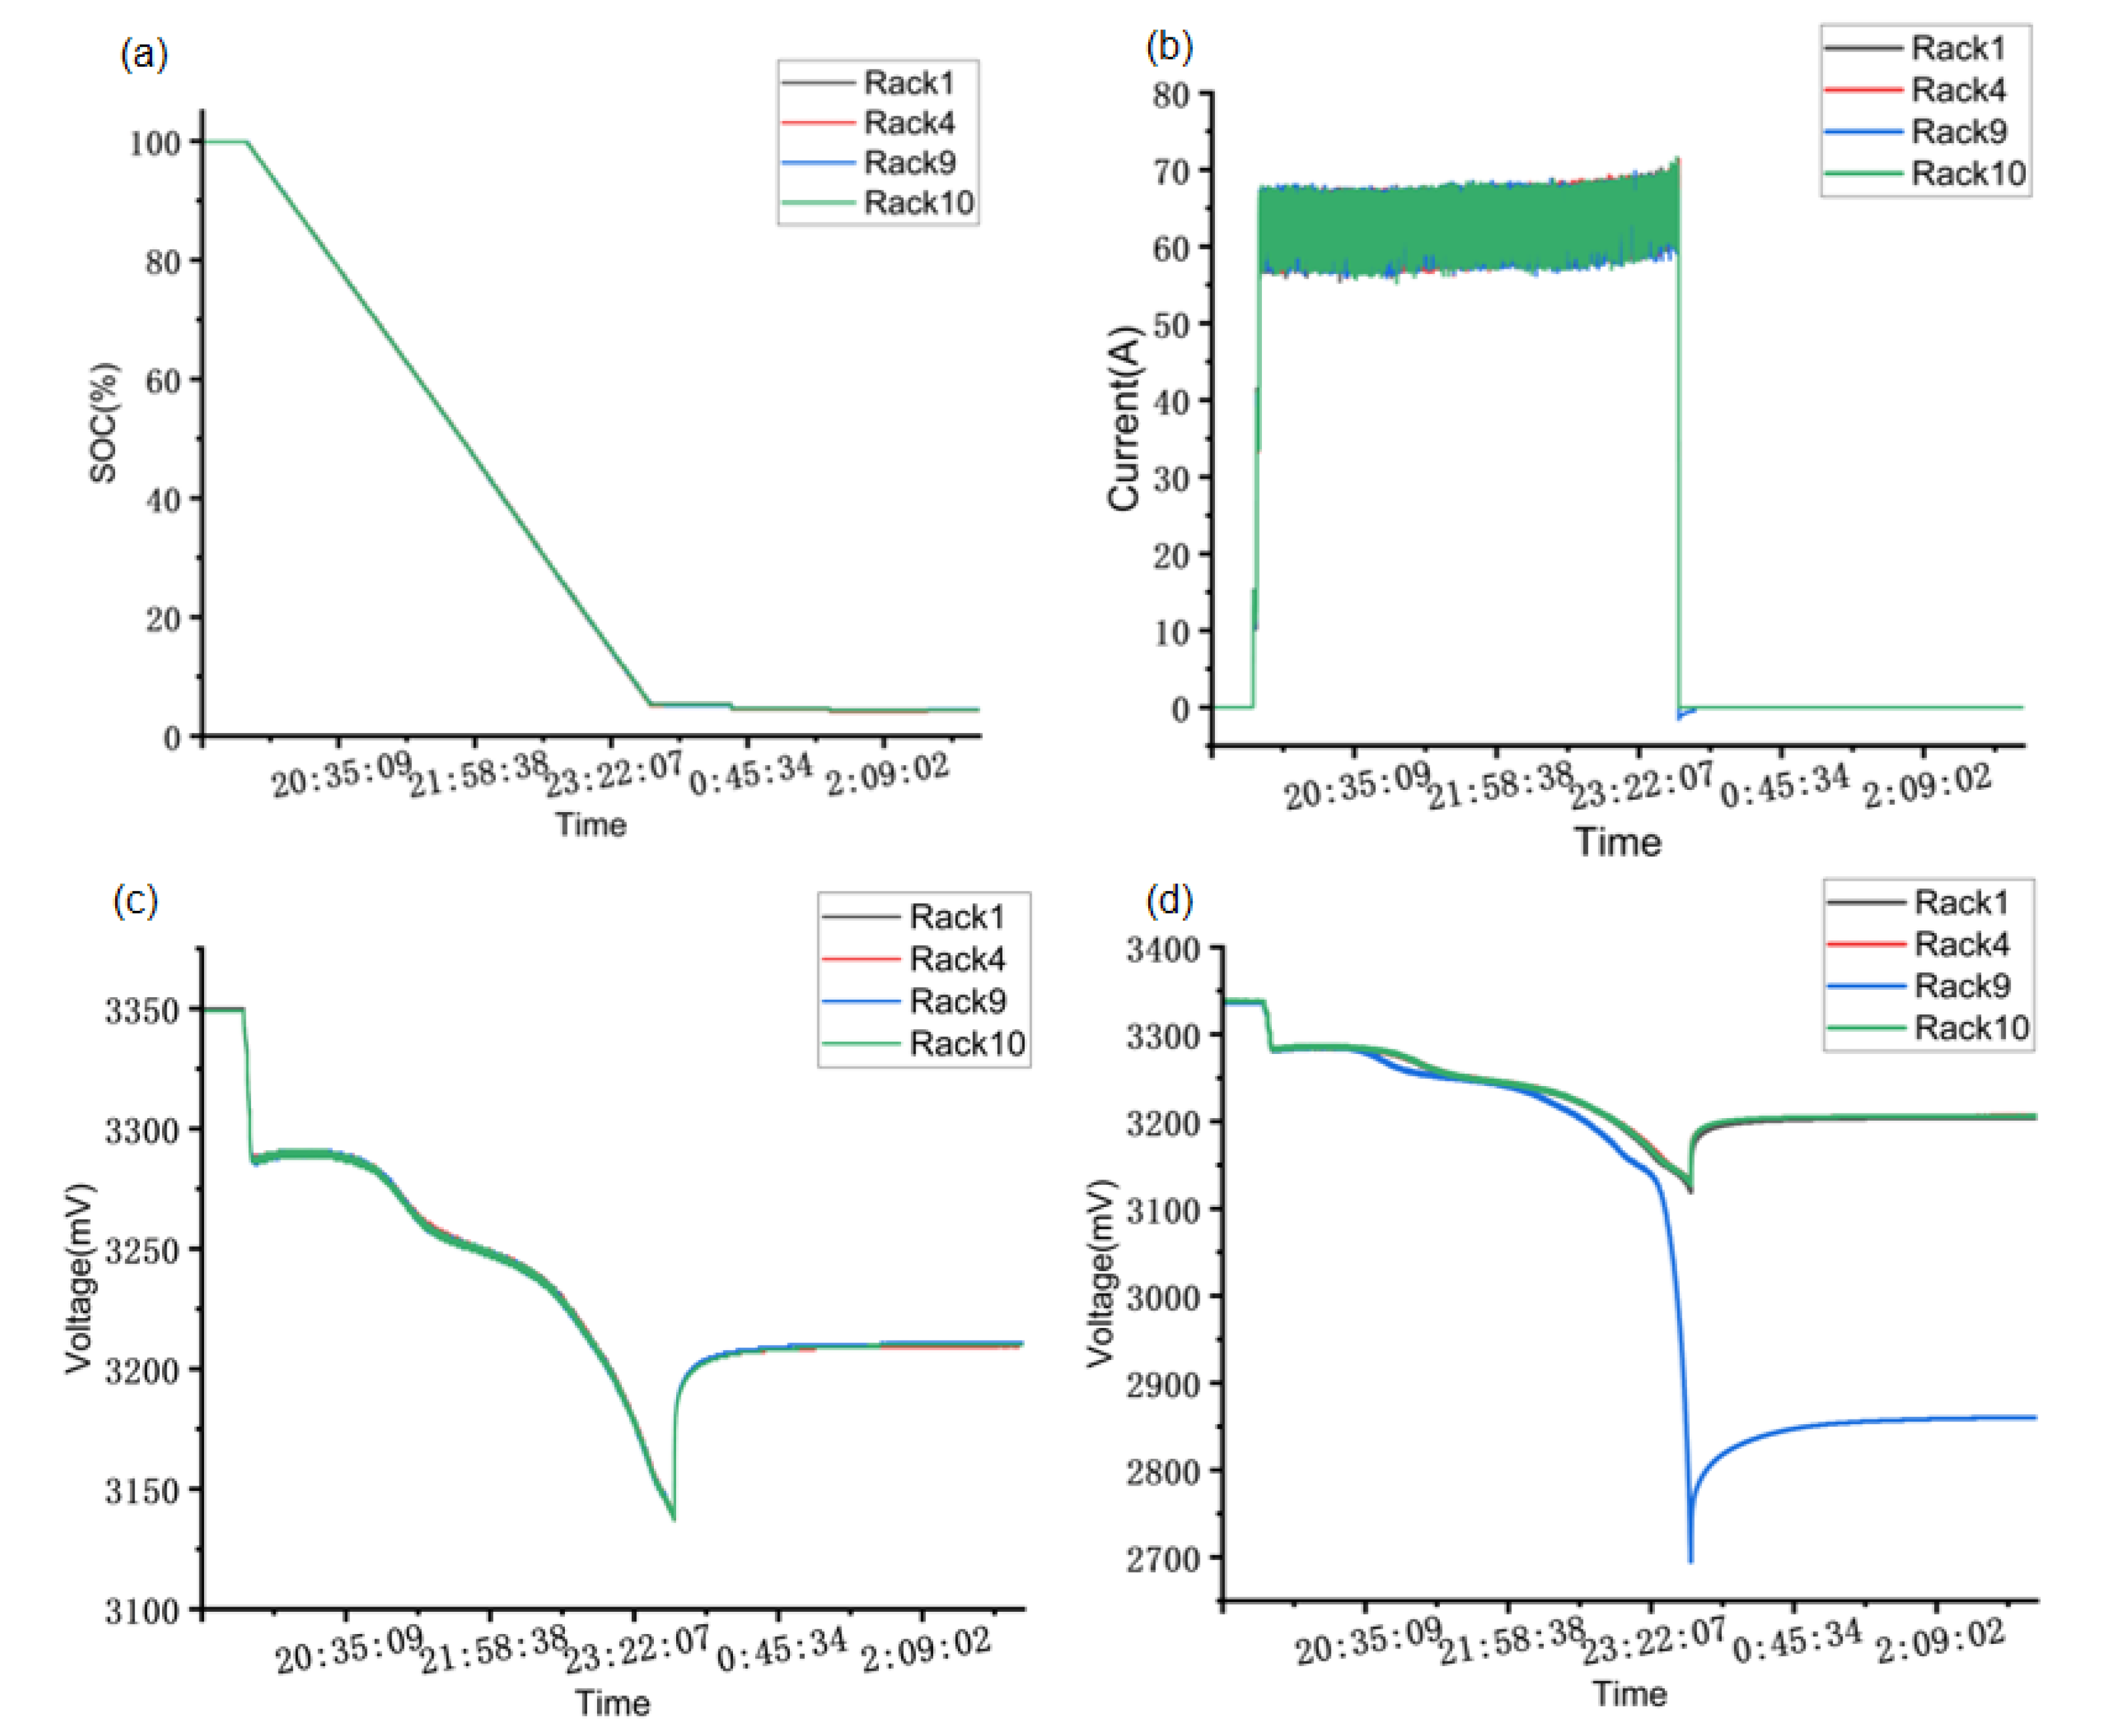
3.1. Experimental Data

The experimental data utilized in this study were sourced from a certain energy storage power station in China, spanning a period from 8 October 2024 to 18 November 2024, covering a total of 49 days. The dataset comprises data from one energy storage unit, which is composed of 10 battery clusters. This comprehensive dataset provides critical insights into the operational characteristics and performance metrics of the energy storage system, facilitating detailed analysis and modeling for anomaly detection purposes. The dataset in question is elucidated through the presentation of Figure 5.
Figure 5 illustrates four detection signals from battery clusters in the energy-storage power station on 17 November 2024, corresponding to battery clusters 1, 4, 9, and 10. These signals include the battery cluster State of Charge (SOC), main circuit current, maximum individual voltage, and minimum individual voltage. Figure 5a illustrates the SOC over time. It can be observed that the energy level starts at a higher value and then rapidly decreases to near zero. Figure 5b depicts the temporal evolution of the main circuit current. The current remains relatively stable for a period before abruptly dropping to zero. Figure 5c shows the change in the highest cell voltage over time. Figure 5d presents the variation of the lowest cell voltage over time. The velocity begins at a higher value, then gradually decreases, with a significant drop at a particular point, following which, it maintains a lower level. As shown in Figure 5d, the maximum individual voltage of battery cluster 9 is significantly lower than that of the other three battery clusters, which is an anomaly that can be directly observed. However, the anomalies in Figure 5a–c are not immediately apparent and require algorithmic analysis to determine whether the battery clusters are operating abnormally.
In battery systems, multiple physical quantities can significantly reflect the state of health (SOH) and fault conditions of batteries. These quantities include voltage, current, temperature, capacity, internal resistance, and power. For instance, variations in battery voltage directly reflect the state of charge (SOC) and the health of internal chemical reactions [34]. Abnormal fluctuations or sudden drops in voltage may indicate faults such as short circuits, over-discharge, or aging. Current, a critical parameter during battery charging and discharging, reflects both load demand and the battery’s output capability; abnormal current fluctuations may suggest internal short circuits or external overload conditions [35]. Additionally, changes in battery temperature serve as an important fault indicator, with excessively high temperatures often associated with overcharging, over-discharging, or inadequate heat dissipation [36]. Furthermore, variations in capacity and internal resistance can indicate battery aging; rapid capacity degradation or significant increases in internal resistance typically suggest a decline in battery performance [37]. By monitoring these physical quantities, it is possible to effectively identify battery faults or potential issues, thereby ensuring system safety and reliability.
In practical battery operation, obtaining the individual cell current is often challenging, and only the main circuit current of the battery pack is typically monitored. Meanwhile, battery capacity and internal resistance are critical parameters for evaluating the state of health (SOH) and performance of batteries, but they are difficult to measure directly [38,39]. Battery capacity is generally defined as the amount of energy a battery can store and release under specific conditions, while internal resistance refers to the characteristic that hinders current flow within the battery. However, since capacity and internal resistance are intrinsic properties of the battery, they cannot be directly measured. Measuring capacity usually requires discharge or charge testing, which is time-consuming and which affects the battery’s energy state. Additionally, accurate capacity measurement requires specific environmental conditions, such as constant-current discharge or constant-voltage charging, which are difficult to implement in real-time applications [40]. Similarly, directly measuring internal resistance requires complex experimental methods, such as pulse tests or AC impedance spectroscopy, which demand advanced measurement equipment and specific experimental conditions, making real-time implementation challenging [41]. Therefore, battery capacity and internal resistance are typically estimated indirectly using methods such as model-based predictions, voltage drop analysis, or equivalent circuit models. While these methods provide reliable estimates, their precision and accuracy depend on the reasonableness of the models and the reliability of the experimental data.
Based on this, selecting the individual cell voltage as the primary physical quantity for battery anomaly diagnosis is based on its importance and measurability in battery systems. The individual cell voltage directly reflects the battery’s state of charge, health condition, and potential fault situations [42]. Since voltage is an easily measurable and real-time available physical quantity during battery operation, it can effectively capture internal chemical and electrical changes, such as overcharging, over-discharging, short circuits, or aging, which are indicative of abnormal events [43,44,45]. Additionally, variations in individual cell voltage can reveal inconsistencies among battery cells within a battery pack, enabling the timely detection of performance deviations or faulty cells. Therefore, individual cell voltage serves as a primary diagnostic parameter, not only facilitating real-time monitoring and analysis but also providing reliable evidence for battery-system health management and faults.

3.2. Experimental Results and Analysis

For energy storage power stations, the occurrence of an individual battery voltage being too high or too low is considered an abnormal situation. By analyzing the highest and lowest individual battery voltages in the dataset, it is possible to diagnose whether there are abnormal operating conditions of individual batteries.
To train the VAE model, in the data processing phase, all data for a single battery were consolidated into a single CSV file. Based on the complete dataset for each battery, healthy and faulty datasets were constructed, with all data being time-series in nature. For the entire dataset, 34 columns of valid data were retained. The data were segmented according to the associated alarm levels, resulting in four distinct datasets: Level 1 alarm, Level 2 alarm, Level 3 alarm, and healthy datasets. The faulty dataset was specifically selected from the Level 3 alarm data. The lithium-ion battery energy storage dataset was sufficiently voluminous, and a fixed length of 720 was used as the step size to segment the time-series samples into sequences. Each battery’s healthy and faulty datasets were composed with a feature dimension of two. For a battery pack, if the amount of healthy data exceeded that of faulty data, a test set was formed by extracting data in a 1:1 ratio of healthy to faulty data, with the remainder of the healthy dataset serving as the training set. Conversely, if the healthy data were less than the faulty data, a test set was created with a 1:1 ratio of healthy to faulty data, and 20% of the healthy data was used as the test set, with the remaining healthy data used for training. Each battery pack used its own dataset to form the training and test sets, and an optimal model was trained individually. Given the multitude of data types and the significant differences in their ranges and units of measure, this study employed data normalization procedures. Specifically, all data were processed to conform to a standard normal distribution, achieving dimensionless data with identical means and variances. This normalization process was completed by subtracting the minimum value from each data point and dividing by the difference between the maximum and minimum values. This approach ensures the consistency of data distribution, thereby enhancing the efficiency and accuracy of the model training process. For anomaly diagnostics, a personal computer equipped with an Intel i9-12900 CPU and a NVIDIA GeForce RTX 3060 graphics card was utilized. Following the completion of model training with the training dataset, the VAE anomaly detection model demonstrated rapid inference capabilities, achieving a response time within one minute, which equates to a second-order response rate.
To quantify the performance of the testing, the experiment employed commonly used metrics: accuracy (A), precision (P), recall (R), and F1-score. The formulas for these metrics are as follows: A = T P + T N T P + T N + F P + F N , P = T P T P + F P , R = T P T P + F N , F 1 = 2 P R P + R . In these formulas, TP, FP, TN, and FN represent the numbers of true positives, false positives, true negatives, and false negatives, respectively [46].
For four battery clusters, a comparison was conducted among three commonly used anomaly detection strategies, including the VAE algorithm, the Isolation Forest algorithm, and the SVM algorithm. The quantitative metrics are summarized in Table 1.
Table 1 presents the detection results of four battery clusters (No. 1, 4, 9, and 10) under three anomaly detection algorithms. Visually, the VAE-based anomaly detection algorithm demonstrates superior performance across the three evaluation metrics: accuracy, precision, and F1-score. However, the three algorithms exhibit comparable performance in terms of recall rates. Nevertheless, these four quantitative metrics alone are insufficient to determine the specific fault severity of different battery clusters.
In the context of anomaly detection, One-Class Support Vector Machine (OVSVM) and Isolation Forest are two widely employed algorithms. Specifically, OVSVM operates by constructing a hyperplane to demarcate normal data from abnormal data. A data point is classified as normal if its distance to the hyperplane is less than or equal to 0.5, whereas it is deemed abnormal if the distance exceeds 0.5. Conversely, Isolation Forest functions by recursively partitioning the feature space to construct isolation trees. The anomaly status of a data point is determined by calculating its path length within the isolation tree. If the normalized path length is less than 0.5, the data point is considered normal; otherwise, it is identified as an anomaly. The threshold value of 0.5 for anomaly classification in both algorithms is empirically validated through experimental studies. This threshold is strategically chosen to balance the trade-off between the detection capability of anomalies and the rate of misclassification of normal data.
In this study, to alleviate the issue of overfitting in the model, we employed a variety of strategies. Firstly, we introduced the dropout mechanism, a commonly used regularization technique that randomly discards a subset of neurons in the network during training. This approach reduces the model’s reliance on the training data and enhances its generalization capabilities. Secondly, we implemented a learning rate decay strategy, which dynamically adjusts the learning rate to facilitate rapid convergence during the initial training phase and to enable finer parameter optimization in later stages, thus avoiding overfitting. Additionally, we applied an early stopping strategy, which monitors the performance metrics on a validation set; training is halted once performance ceases to improve, preventing the model from becoming overly fitted to the training data.
To visually demonstrate the distribution of data faults across four battery clusters, the data points after VAE detection were statistically analyzed, and a t-SNE diagram (Figure 6) was constructed for further analysis [47]. As shown in Figure 6, the blue points represent healthy data, while the yellow points indicate faulty data. To illustrate the varying fault severity among different battery clusters, the t-SNE plot displays all of the fault data points and an equivalent number of healthy data points for each cluster. Battery Cluster 9 exhibited the most severe fault conditions.
However, as demonstrated in Table 1, neither the Isolation Forest algorithm nor the Support Vector Machine (SVM) algorithm provided satisfactory anomal detection performance for Rack 9. This outcome is attributed to the fact that both the Isolation Forest and SVM algorithms require an approximate ratio of healthy to faulty data prior to their application. This ratio significantly influences the algorithms’ performance. Given the vast scale of the dataset, manually distinguishing between healthy and faulty data is highly labor-intensive, rendering both algorithms less suitable for real-time anomaly detection tasks.
As shown in Figure 6a,b, even though Battery Clusters 1 and 4 have fewer fault points, the data still exhibit well-defined clusters, indicating that the abnormal data within these clusters share high similarity and follow a certain pattern. Additionally, there is a distinct separation between healthy and abnormal data points in these clusters, suggesting that the abnormal data differ significantly from the healthy data. The VAE demonstrates effective capability in identifying abnormal data and diagnosing the battery clusters.
For the abnormal situation described in Figure 6c, Battery Cluster 9 exhibits a large number of fault data points, which form well-defined clusters and which are distinctly separated from the normal data points. This clear distinction indicates that Battery Cluster 9 has severe fault conditions with a single predominant fault type. Consequently, a comprehensive inspection and replacement of Battery Cluster 9 is necessary.
Regarding Figure 6d, which describes Battery Cluster 10, the healthy and abnormal data points are nearly uniformly mixed throughout the t-SNE plot, with a widespread distribution, as evident from the scale of the coordinate axes. This suggests that the abnormal data in Battery Cluster 10 are highly similar to the normal data, making it challenging for traditional methods like random forest and SVM to perform effective anomaly detection. However, the VAE, which learns the normal operating data distribution in the latent space and identifies anomalies based on the inability to reconstruct abnormal data, successfully distinguishes the fault data types and completes the anomaly detection.

4. Conclusions

Due to the trend of intelligent operation and maintenance of energy storage power stations and the demand for mining large-scale data, methods for monitoring the operational status of electricity power based on deep learning are becoming the future development direction. Given the characteristics of a large data volume, high dimensionality, and the lack of labels in energy storage power stations, unsupervised deep learning has demonstrated superior performance in addressing the issue of anomaly detection in power stations.
This paper proposes a VAE-based algorithm model for anomaly detection in power station data. By learning the data distribution under normal operational conditions using normal operating data, a detection model was established. The principle of anomaly detection is based on the significant reconstruction error between abnormal data and the model, thereby allowing for the identification of abnormal states. The AE anomaly detection model can extract data features from a massive amount of time-series data using deep-learning methods and can effectively detect various types of anomalies through reconstruction, even in the absence of data labels. Experimental results on real operational data from energy-storage power stations demonstrate that this method exhibits excellent detection performance and can achieve Multi-Operation Condition Anomaly Detection, indicating practical application potential.

Author Contributions

Conceptualization, T.J. and K.M.; methodology, T.J. and X.H.; software, T.J. and P.X.; validation, P.X., K.M. and D.G.; formal analysis, D.G. and L.S.; investigation, D.G. and L.S.; resources, D.G. and L.S.; data curation, Y.W., T.J. and P.X.; writing—original draft preparation, T.J., K.M. and Y.W.; writing—review and editing, T.J., P.X. and X.H.; visualization, Y.W. and X.H.; supervision, Y.W. and X.H.; project administration, D.G. and L.S.; funding acquisition, X.H. All authors have read and agreed to the published version of the manuscript.

Funding

This work is supported by National Key R&D Program of China under the Grant No. 2023YFC3009900.

Data Availability Statement

The original contributions presented in the study are included in the article further inquiries can be directed to the corresponding author.

Conflicts of Interest

Pinghu Xu was employed by the company Qixin Technology (Beijing) Co., Ltd. Dongliang Guo was employed by the company State Grid Jiangsu Electric Power Co., Ltd. The remaining authors declare that the research was conducted in the absence of any commercial or financial relationships that could be construed as a potential conflict of interest.

References

  1. Jin, Y.; Zhao, Z.; Miao, S.; Wang, Q.; Sun, L.; Lu, H. Explosion hazards study of grid-scale lithium-ion battery energy storage station. J. Energy Storage 2021, 42, 102987. [Google Scholar] [CrossRef]
  2. Olatomiwa, L.; Mekhilef, S.; Ismail, M.S.; Moghavvemi, M. Energy management strategies in hybrid renewable energy systems: A review. Renew. Sustain. Energy Rev. 2016, 62, 821–835. [Google Scholar] [CrossRef]
  3. Faraji, F.; Majazi, A.; Al-Haddad, K. A comprehensive review of flywheel energy storage system technology. Renew. Sustain. Energy Rev. 2017, 67, 477–490. [Google Scholar]
  4. Jamil, M.; Sharma, S.K.; Singh, R. Fault detection and classification in electrical power transmission system using artificial neural network. SpringerPlus 2015, 4, 1–13. [Google Scholar] [CrossRef]
  5. Michalski, K.; Kośka-Wolny, M.; Chmielowski, K.; Bedla, D.; Petryk, A.; Guzdek, P.; Dąbek, K.A.; Gąsiorek, M.; Grübel, K.; Halecki, W. Examining the Potential of Biogas: A Pathway from Post-Fermented Waste into Energy in a Wastewater Treatment Plant. Energies 2024, 17, 5618. [Google Scholar] [CrossRef]
  6. Cha, J. Partial least squares. Adv. Methods Mark. Res. 1994, 407, 52–78. [Google Scholar]
  7. MacGregor, J.F.; Kourti, T. Statistical process control of multivariate processes. Control. Eng. Pract. 1995, 3, 403–414. [Google Scholar] [CrossRef]
  8. Xu, X.; Jia, W.; Xu, S.; Ning, F.; Lei, J. Relationship between high-level color features and temperature mapping of magnesium alloy surface images based on the K-nearest neighbor algorithm. Appl. Therm. Eng. 2025, 259, 124940. [Google Scholar] [CrossRef]
  9. Wan, H.P.; Zhu, Y.K.; Luo, Y.; Todd, M.D. Unsupervised deep learning approach for structural anomaly detection using probabilistic features. Struct. Health Monit. 2025, 24, 3–33. [Google Scholar] [CrossRef]
  10. Ma, Q.; Sun, C.; Cui, B.; Jin, X. A novel model for anomaly detection in network traffic based on kernel support vector machine. Comput. Secur. 2021, 104, 102215. [Google Scholar] [CrossRef]
  11. Bounsiar, A.; Madden, M.G. One-Class Support Vector Machines Revisited. In Proceedings of the 2014 International Conference on Information Science & Applications (ICISA), Seoul, Republic of Korea, 6–9 May 2014; pp. 1–4. [Google Scholar]
  12. Pang, G.; Shen, C.; Cao, L.; Hengel, A.V.D. Deep learning for anomaly detection: A review. ACM Comput. Surv. 2021, 54, 1–38. [Google Scholar] [CrossRef]
  13. Huang, S.; Cai, N.; Pacheco, P.P.; Narrandes, S.; Wang, Y.; Xu, W. Applications of support vector machine (SVM) learning in cancer genomics. Cancer Genom. Proteom. 2018, 15, 41–51. [Google Scholar]
  14. Vigna, G.; Kemmerer, R.A. NetSTAT: A network-based intrusion detection system. J. Comput. Secur. 1999, 7, 37–71. [Google Scholar] [CrossRef]
  15. Cervantes, J.; Garcia-Lamont, F.; Rodríguez-Mazahua, L.; Lopez, A. A comprehensive survey on support vector machine classification: Applications, challenges and trends. Neurocomputing 2020, 408, 189–215. [Google Scholar] [CrossRef]
  16. Mũnoz-Marí, J.; Bovolo, F.; Gómez-Chova, L.; Bruzzone, L.; Camp-Valls, G. Semisupervised one-class support vector machines for classification of remote sensing data. IEEE Trans. Geosci. Remote Sens. 2020, 48, 3188–3197. [Google Scholar] [CrossRef]
  17. Liu, F.T.; Ting, K.M.; Zhou, Z.H. Isolation-based anomaly detection. ACM Trans. Knowl. Discov. Data 2012, 6, 1–39. [Google Scholar] [CrossRef]
  18. Hariri, S.; Kind, M.C.; Brunner, R.J. Extended isolation forest. IEEE Trans. Knowl. Data Eng. 2019, 33, 1479–1489. [Google Scholar] [CrossRef]
  19. Xu, H.; Pang, G.; Wang, Y.; Wang, Y. Deep isolation forest for anomaly detection. IEEE Trans. Knowl. Data Eng. 2023, 35, 12591–12604. [Google Scholar] [CrossRef]
  20. Lesouple, J.; Baudoin, C.; Spigai, M.; Tourneret, J.Y. Generalized isolation forest for anomaly detection. Pattern Recognit. Lett. 2021, 149, 109–119. [Google Scholar]
  21. Chabchoub, Y.; Togbe, M.U.; Boly, A.; Chiky, R. An in-depth study and improvement of isolation forest. IEEE Access 2022, 10, 10219–10237. [Google Scholar] [CrossRef]
  22. Ahmed, S.; Lee, Y.; Hyun, S.H.; Koo, I. Unsupervised machine learning-based detection of covert data integrity assault in smart grid networks utilizing isolation forest. IEEE Trans. Inf. Forensics Secur. 2019, 14, 2765–2777. [Google Scholar] [CrossRef]
  23. Duan, X.; Yan, H.; Tian, D.; Zhou, J.; Su, J.; Hao, W. In-vehicle CAN bus tampering attacks detection for connected and autonomous vehicles using an improved isolation forest method. IEEE Trans. Intell. Transp. Syst. 2021, 24, 2122–2134. [Google Scholar] [CrossRef]
  24. Li, T.; Liu, X.; Lin, Z.; Morrison, R. Ensemble offshore wind turbine power curve modelling–an integration of isolation forest, fast radial basis function neural network, and metaheuristic algorithm. Energy 2022, 239, 122340. [Google Scholar] [CrossRef]
  25. Lew, A.J.; Buehler, M.J. Encoding and exploring latent design space of optimal material structures via a VAE-LSTM model. Forces Mech. 2021, 5, 100054. [Google Scholar] [CrossRef]
  26. Jing, T.; Zheng, P.; Xia, L.; Liu, T. Transformer-based hierarchical latent space VAE for interpretable remaining useful life prediction. Adv. Eng. Inform. 2022, 54, 101781. [Google Scholar] [CrossRef]
  27. Ding, J.; Zhang, Q.; Wang, J.; Huo, W. ADS-B anomaly detection method based on Transformer-VAE. Syst. Eng. Electron. 2023, 45, 3680–3689. [Google Scholar]
  28. Dairi, A.; Harrou, F.; Sun, Y.; Khadraoui, S. Short-term forecasting of photovoltaic solar power production using variational auto-encoder driven deep learning approach. Appl. Sci. 2020, 10, 8400. [Google Scholar] [CrossRef]
  29. Staffini, A.; Svensson, T.; Chung, U.I.; Svensson, A.K. A disentangled VAE-BiLSTM model for heart rate anomaly detection. Bioengineering 2023, 10, 683. [Google Scholar] [CrossRef]
  30. Memarzadeh, M.; Matthews, B.; Avrekh, I. Unsupervised anomaly detection in flight data using convolutional variational auto-encoder. Aerospace 2020, 7, 115. [Google Scholar] [CrossRef]
  31. Zhou, Y.; Liang, X.; Zhang, W.; Zhang, L.; Song, X. VAE-based deep SVDD for anomaly detection. Neurocomputing 2021, 453, 131–140. [Google Scholar] [CrossRef]
  32. Ai, Q.; He, L.; Liu, S.; Xu, Z. Bype-vae: Bayesian pseudocoresets exemplar vae. Adv. Neural Inf. Process. Syst. 2021, 34, 5910–5920. [Google Scholar]
  33. Razghandi, M.; Zhou, H.; Erol-Kantarci, M.; Turgut, D. Smart home energy management: VAE-GAN synthetic dataset generator and Q-learning. IEEE Trans. Smart Grid 2023, 15, 1562–1573. [Google Scholar] [CrossRef]
  34. Li, J.; Ye, M.; Ma, X.; Wang, Q.; Wang, Y. SOC estimation and fault diagnosis framework of battery based on multi-model fusion modeling. J. Energy Storage 2023, 65, 107296. [Google Scholar] [CrossRef]
  35. Niu, G.; Dong, X.; Chen, Y. Motor fault diagnostics based on current signatures: A review. IEEE Trans. Instrum. Meas. 2023, 72, 1–19. [Google Scholar] [CrossRef]
  36. Zhao, H.; Chen, Z.; Shu, X.; Xiao, R.; Shen, J.; Liu, Y.; Liu, Y. Online surface temperature prediction and abnormal diagnosis of lithium-ion batteries based on hybrid neural network and fault threshold optimization. Reliab. Eng. Syst. Saf. 2024, 243, 109798. [Google Scholar] [CrossRef]
  37. Sun, J.; Chen, S.; Xing, S.; Guo, Y.; Wang, S.; Wang, R.; Wang, R.; Wu, Y.; Wu, X. A battery internal short circuit fault diagnosis method based on incremental capacity curves. J. Power Sources 2024, 602, 234381. [Google Scholar] [CrossRef]
  38. Zheng, Y.; Luo, Q.; Cui, Y.; Dai, H.; Han, X.; Feng, X. Fault identification and quantitative diagnosis method for series-connected lithium-ion battery packs based on capacity estimation. IEEE Trans. Ind. Electron. 2021, 69, 3059–3067. [Google Scholar] [CrossRef]
  39. Kim, S.B.; Lee, S.H. Development of Aging Diagnosis Device Through Real-time Battery Internal Resistance Measurement. Int. J. Internet Broadcast. Commun. 2022, 14, 129–135. [Google Scholar]
  40. Albertus, P.; Girishkumar, G.; McCloskey, B.; Sánchez-Carrera, R.S.; Kozinsky, B.; Christensen, J.; Luntz, A.C. Identifying capacity limitations in the Li/oxygen battery using experiments and modeling. J. Electrochem. Soc. 2011, 158, A343. [Google Scholar] [CrossRef]
  41. Wang, J.; Liu, S.; Lin, C.; Wang, F.; Liu, C.; Su, Y.; Chen, S.; Wu, F. Experimental study on the internal resistance and heat generation characteristics of lithium ion power battery with NCM/C material system. SAE Int. J. Passeng. Cars-Electron. Electr. Syst. 2018, 11, 131–138. [Google Scholar] [CrossRef]
  42. Zhao, B.; Hu, J.; Xu, S.; Wang, J.; Zhu, Y.; Zhang, L.; Gao, C. Estimation of the SOC of energy-storage lithium batteries based on the voltage increment. IEEE Access 2020, 8, 198706–198713. [Google Scholar] [CrossRef]
  43. Ouyang, D.; Chen, M.; Liu, J.; Wei, R.; Weng, J.; Wang, J. Investigation of a commercial lithium-ion battery under overcharge/over-discharge failure conditions. RSC Adv. 2018, 8, 33414–33424. [Google Scholar] [CrossRef] [PubMed]
  44. Alavi, M.; Wang, D.; Luo, M. Short-circuit fault diagnosis for three-phase inverters based on voltage-space patterns. IEEE Trans. Ind. Electron. 2014, 61, 5558–5569. [Google Scholar] [CrossRef]
  45. Farmann, A.; Sauer, D.U. A study on the dependency of the open-circuit voltage on temperature and actual aging state of lithium-ion batteries. J. Power Sources 2017, 347, 1–13. [Google Scholar] [CrossRef]
  46. Chandola, V.; Banerjee, A.; Kumar, V. Anomaly detection: A survey. ACM Comput. Surv. 2009, 41, 1–58. [Google Scholar] [CrossRef]
  47. Kobak, D.; Berens, P. The art of using t-SNE for single-cell transcriptomics. Nat. Commun. 2019, 10, 5416. [Google Scholar] [CrossRef]
Figure 1. Frame diagram of energy storage power station.
Energies 18 02770 g001
Figure 2. (a) Exception data type; (b) Generated images from the VAE decoder; (c) Comparison of Three Algorithms; (d) VAE schematic.
Energies 18 02770 g002
Figure 3. The network architecture of the VAE.
Energies 18 02770 g003
Figure 4. VAE Anomaly Detection Model.
Energies 18 02770 g004
Figure 5. Part of the data diagram of the energy storage power station (a) SOC; (b) Main circuit current; (c) Highest cell voltage; (d) Lowest cell voltage.
Energies 18 02770 g005
Figure 6. t-SNE diagram of 4 Racks (a) Rack1; (b) Rack4; (c) Rack9; (d) Rack10.
Energies 18 02770 g006
Table 1. Algorithm performance comparison of 4 racks.
Rack1Rack4
APRF1APRF1
Isolation Forest78 ± 11%83 ± 13%92 ± 19%85 ± 14%73 ± 15%7 ± 8%1 ± 19%77.5 ± 13%
SVM68 ± 3%76 ± 24%1 ± 16%81 ± 4%69 ± 17%62 ± 5%1 ± 16%76 ± 15%
VAE98 ± 15%96 ± 3%1 ± 17%98 ± 13%1 ± 3%1 ± 7%1 ± 11%1 ± 2%
Rack9Rack10
APRF1APRF1
Isolation Forest66 ± 19%74 ± 7%1 ± 22%79 ± 5%67 ± 23%75 ± 3%1 ± 3%8 ± 21%
SVM73 ± 3%65 ± 8%1 ± 13%79 ± 6%74 ± 25%82 ± 1%1 ± 7%85 ± 24%
VAE99 ± 2%99 ± 1%1 ± 2%99 ± 9%95 ± 7%93 ± 1%97 ± 9%91 ± 17%
Disclaimer/Publisher’s Note: The statements, opinions and data contained in all publications are solely those of the individual author(s) and contributor(s) and not of MDPI and/or the editor(s). MDPI and/or the editor(s) disclaim responsibility for any injury to people or property resulting from any ideas, methods, instructions or products referred to in the content.

