Abstract
In actual operation, the output power of distributed marine photovoltaic monitoring faces challenges from wind, waves, and other dynamic motion factors. To address these challenges, this paper proposes a novel maximum power point inference method for distributed marine photovoltaic monitoring. First, a digital fusion model has been constructed to obtain a comprehensive dataset of the distributed marine photovoltaic monitoring system. Second, Multilayer Convolutional Neural Networks (CNN) are constructed to extract the local high-frequency motion characteristics, Squeeze and Excitation Attention (SE-Attention) is employed to capture the global low-frequency motion characteristics, and Long Short-Term Memory (LSTM) is utilized to perform temporal modeling of the motion characteristics. Subsequently, the Crested Porcupine Optimizer (CPO) algorithm is used to achieve high-precision recognition of the maximum power point in distributed marine photovoltaic monitoring. Finally, the effectiveness of the method is verified through experiments and simulations. The results indicate that the maximum power point of distributed marine photovoltaic monitoring exhibits multi-spectral motion characteristics, with the highest frequency at 335.2 Hz and the lowest frequency at 12.9 Hz. The proposed method enables efficient inference of the maximum power point for distributed marine photovoltaic monitoring under motion conditions, with an accuracy of 98.63%.
1. Introduction
As a clean and sustainable energy form, distributed marine photovoltaic power generation has been widely adopted in unmanned distributed marine monitoring instruments such as deep-sea radars, wave gliders [1], small unmanned surface vessels [2], and environmental monitoring buoys [3], as depicted in Figure 1. These instruments serve as core nodes for building a three-dimensional marine observation network [4], undertaking key tasks such as marine disaster early warning, resource development, navigation safety assurance, and marine environmental monitoring. They are typically deployed in remote areas with complex marine conditions, where traditional power supply modes such as cable transmission or periodic battery replacement face challenges of high construction costs, difficult maintenance, and low power supply reliability. By integrating photovoltaic modules and energy controllers, distributed marine photovoltaic power generation can provide stable energy solutions for monitoring instruments operating continuously in harsh marine conditions. It effectively overcomes the energy supply bottleneck of unmanned marine monitoring instruments.
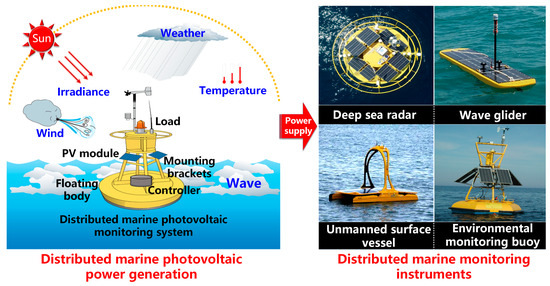
Figure 1.
Distributed marine photovoltaic power generation.
However, the distributed marine monitoring systems are exposed to random changes in external loads and environmental conditions such as wind, waves, temperature, solar irradiance, and weather [5,6,7,8]. The dynamic coupling of these factors introduces mechanical motion characteristics into the output power of distributed marine photovoltaic monitoring. These characteristics lead to multi-spectral aliasing and nonlinear dynamic signatures in the maximum power point of photovoltaic modules [9]. It renders existing maximum power point tracking algorithms inadequate in adaptability [10], thereby severely compromising power generation efficiency. Relevant literature indicates that the power generation efficiency can be reduced by up to 5.8% [11]. Therefore, how to achieve the maximum power point inference considering the motion and environmental factors is the foundation for researching maximum power point tracking control of distributed marine photovoltaic modules and increasing the system’s power generation.
As shown in Figure 1, a distributed marine photovoltaic monitoring system is typically composed of a floating body, photovoltaic modules, power controllers, and loads [12]. The installation method involves fixing the photovoltaic modules to the floating body using mounting brackets, thereby enabling the photovoltaic power generation to supply power to the load [13]. Under the interaction of wind and nonlinear waves, the floating body of the distributed marine photovoltaic system will experience large-scale three-dimensional oscillations and reciprocating motions [14]. These motions are indirectly transmitted to the photovoltaic modules through the rigid connection between the floating body and the modules, causing the modules to vibrate. The oscillatory motion causes changes in the spatial orientation of the photovoltaic modules, which in turn affects the irradiance and temperature on the module surfaces. This subsequently leads to alterations in the intrinsic electrical parameters of the photovoltaic modules. Ultimately, these changes are manifested in the output power as a mixture of high and low frequencies, nonlinearity, and complex dynamic characteristics. In general, the distributed marine photovoltaic system is a nonlinear complex mechatronic coupled system that integrates motion characteristic parameters (including triaxial angular velocity, triaxial acceleration, and triaxial attitude angles) and environmental characteristic parameters (including dynamic irradiance and dynamic temperature). The interaction between motion and environment poses extremely severe technical challenges in obtaining its maximum power point.
Based on computing power and parameter complexity, the existing methods for obtaining the maximum power point of photovoltaic modules can be categorized into classical algorithms [15,16,17,18,19,20], machine learning algorithms [21,22,23,24,25,26,27,28,29,30], and artificial intelligence predictive algorithms [31,32,33,34,35,36,37,38,39]. Among these, the classical algorithms widely adopted include the Incremental Conductance Method [15], the Hill Climbing Technique (HC) [16], and the Perturb and Observe Method (P&O) [17]. These methods are typically grounded in the physical characteristics of photovoltaic modules, seeking the maximum power point through conventional control of current or voltage. For instance, Mustafa Sacid Endiz [18] proposed an enhanced Incremental Conductance Method, which utilizes the sum of the photovoltaic module’s conductance (I/V) and incremental conductance (dI/dV) as the criterion for determining whether the maximum power point has been reached. The method is simple to compute but only suitable for conditions with minimal fluctuations in irradiance. Hwa-Dong Liu [19] developed a novel Hill Climbing Technique by leveraging the relationship between the solar elevation angle and load resistance. By integrating the output voltage, current, and load resistance of the photovoltaic module, he derived a formula to calculate the optimal duty cycle, thereby achieving maximum power point tracking. This approach addresses the performance limitations of traditional HC algorithms under low irradiance conditions but exhibits limited adaptability in rapidly changing environments. Abdelkhalek Chellakhi [20] proposed an enhanced Perturb and Observe Method based on current perturbation. By incorporating current perturbation and a variable step-size mechanism, this approach improves the maximum power point tracking performance of photovoltaic systems. It is easy to implement and well-suited for stable irradiance and temperature conditions. In summary, the aforementioned methods offer advantages such as fewer parameters and low computing power, demonstrating effective performance in environments with stable or slowly varying temperature and irradiance conditions. However, they struggle to address the challenges of obtaining the maximum power point under nonlinear environmental factors, such as shading and non-uniform irradiance. Particularly, their performance is suboptimal in scenarios involving multi-spectral motion and the coupling effects of multiple external environmental factors, as seen in distributed marine photovoltaic monitoring system.
Machine learning algorithms are widely applied, including Grey Wolf Optimizer (GWO) [21], Dandelion Optimizer Algorithm (DOA) [22], Salp Swarm Optimization Algorithm (SSA) [23], Sand Cat Swarm Optimization (SCSO) [24], Snake Optimizer (SO) [25], and so on. These algorithms do not rely on the specific mathematical model of the systems. Instead, they seek the optimal solution by simulating optimization processes found in nature, thereby aiming to maximize the output power of the photovoltaic modules. For example, Ahmed Refaat [26] proposed a maximum power point tracking based on Horse Herd Optimization (HHO). By using mathematical models to describe the behaviors of a horse herd, such as grazing, sociability, hierarchy, defense, imitation, and roaming, the maximum power point of photovoltaic power generation under non-uniform illumination conditions can be achieved. Zijian Zhou [27] proposed an improved three-stage maximum power point tracking algorithm based on the Eel and Grouper Optimizer (EGO). By integrating chaos mapping [28], the Grasshopper Optimization Algorithm (GOA) [29], and rolling formulas, the system’s ability to obtain the global maximum power point is significantly enhanced. This approach effectively addresses the issue of falling into local maximum power points under partial shading conditions. Sajid Sarwar [30] proposed a highly adaptive maximum power point tracking based on Coronavirus Optimization (CVO) algorithm, which mathematically simulates the virus propagation, infection and recovery process to achieve fast tracking to the global maximum power point under complex partial shade conditions. Compared with classical algorithms, these algorithms can solve the problem of calculating the global maximum power point of modules under nonlinear environmental factors such as shadows and non-uniform illumination. However, the lack of consideration of motion characteristics and the insufficient dynamic response of the algorithms lead to failures in the face of distributed marine photovoltaic monitoring systems.
Artificial intelligence predictive algorithms are derived from neural network architectures such as Convolutional Neural Network (CNN) [31], Recurrent Neural Networks (RNN) [32], Long Short-Term Memory network (LSTM) [33], Transformer [34], and their variants and ensembles. These algorithms are capable of processing large-scale data and effectively capturing the complex nonlinear relationships within the data, making them widely applicable in practical scenarios [35,36]. For instance, Ahmad M.A. Malkawi [37] proposed a maximum power point acquisition method based on Dual Artificial Neural Networks (DANN). This approach performs real-time prediction of irradiance and temperature and dynamically adjusts the maximum power point through adaptive inferenceal blocks, thereby effectively addressing tracking challenges under rapidly changing environmental conditions. Similarly, Linfei Yin [38] developed a Deep Predictive Data Representation Model Control (PDRC) for maximum power point acquisition. By learning the characteristic data of input and output signals in photovoltaic systems, they established a deep prediction model based on LSTM network and fully connected layers. It enables efficient and stable tracking of the maximum power point under dynamic operating environments. Furthermore, Ning Zhou [39] introduced a Bayesian-optimized CNN-LSTM-Attention hybrid model. This method extracts spatiotemporal fused characteristic data and establishes complex nonlinear relationships between input characteristics and output power, thus achieving efficient prediction of photovoltaic power generation under multiple complex operating conditions. However, these methods require substantial inferenceal resources and depend on extensive training with reliable sample data to optimize model parameters. Meanwhile, the distributed marine photovoltaic monitoring system is a multi-parameter mechatronic coupled system composed of motion characteristic parameters and environmental characteristic parameters. The incompleteness of the distributed marine photovoltaic monitoring system’s sample data leads to low accuracy and poor generalization ability when extracting the maximum power point.
In summary, the existing classical algorithms, machine learning algorithms, and artificial intelligence predictive algorithms are all developed based on an accurate understanding of the behavioral characteristics of photovoltaic modules and in accordance with the complexity of the application conditions of photovoltaic systems [40]. Due to the incompleteness of sample data for distributed marine photovoltaic monitoring systems, as well as insufficient perception of the high- and low-frequency motion and deficiencies in accurately identifying motion characteristics, existing algorithms for obtaining the maximum power point are poorly adaptable and difficult to apply in distributed marine photovoltaic monitoring.
To address the issue of maximum power point inference for distributed marine photovoltaic monitoring considering motion and environmental factors, this paper proposes a method for obtaining the maximum power point of distributed marine photovoltaic monitoring based on CPO-CNN-LSTM-Attention. First, by using the actual motion data measured by the Inertial Measurement Unit (IMU) and the constructed digital fusion model, a complete dataset for the distributed marine photovoltaic monitoring is obtained. This approach addresses the issue of incomplete sample data. Second, a maximum power point inference model based on CNN-LSTM-Attention is constructed. By extracting the local high-frequency motion characteristics and global low-frequency motion characteristics, the model enhances the perception of both high and low-frequency motions. Subsequently, the hyperparameters of the model are optimized using the Crested Porcupine Optimizer. The optimized model is capable of achieving high-precision recognition of motion characteristics. Ultimately, the optimized model results are compared with those of CNN-LSTM, CPO-CNN-LSTM, and CNN-LSTM-Attention models. Empirical results demonstrate that the proposed method for obtaining the maximum power point of distributed marine photovoltaic monitoring can effectively extract the motion characteristics of the maximum power point. Its accuracy is significantly higher than that of the model before optimization, with an accuracy rate reaching 98.63%.
The rest of the paper is organized as follows: Section 2 presents the system scheme; among them, Section 2.1 presents the method for obtaining a comprehensive dataset of distributed marine photovoltaic. Section 2.2 constructs an inference model for the maximum power point of distributed marine photovoltaic monitoring based on CNN-LSTM-Attention. Section 2.3 proposes a hyperparameter optimization method for the maximum power point inference model based on the Crested Porcupine Optimizer. To verify the correctness of the constructed model and the analysis method, Section 3 provides simulation and experimental validation. Section 3.1 introduces the experimental data and analysis methods, while Section 3.2 evaluates the accuracy of the established model and analyzes the motion characteristics of the maximum power point. Finally, Section 4 offers a summary of the entire paper.
2. Method
The maximum power point of a distributed marine photovoltaic monitoring system is the point at which the system achieves maximum power by dynamically adjusting the operating point of the photovoltaic modules under specific working conditions. Due to the coupled effects of motion and environment, the maximum power point of distributed marine photovoltaic monitoring exhibits nonlinear and multi-spectral motion characteristics. Consequently, in order to achieve high-precision inference and identification of the maximum power point for distributed marine photovoltaic monitoring, an inference model based on CPO-CNN-LSTM-Attention is constructed. The system scheme is shown in Figure 2, which is divided into three steps:
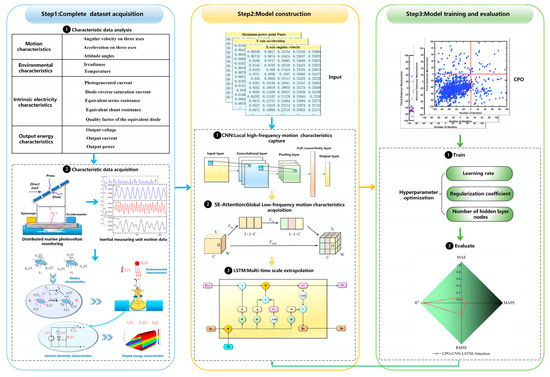
Figure 2.
System overview and principle.
- (1)
- Complete dataset acquisition, so as to provide high-quality input data for the inference model and enhance its accuracy and generalization ability. First, the characteristic data of the distributed marine photovoltaic monitoring system are analyzed. Subsequently, the motion characteristics data of the photovoltaic modules are collected using an inertial measurement experimental platform. These motion characteristics data are then imported into the digital fusion model of the distributed marine photovoltaic monitoring system to obtain a comprehensive dataset for distributed marine photovoltaic monitoring.
- (2)
- A maximum power point inference model based on CNN-LSTM-Attention. To achieve precise inference of the maximum power point for distributed marine photovoltaic monitoring, a multi-layer CNN is employed to extract local high-frequency motion characteristics and identify local patterns and key structures within the data. The SE-Attention is introduced to enable the model to focus on low-frequency characteristics in the global key information, accurately identifying the characteristics that have the most significant impact on the inference of the maximum power point. It enhances the model’s inference accuracy and efficiency. Additionally, LSTM is used to efficiently learn the long-term dependencies, precisely capturing the dynamic changes of the photovoltaic sequence across different time scales. It provides a robust temporal dimension support for the inference of the maximum power point.
- (3)
- Hyperparameter optimization of the inference model based on the Crested Porcupine Optimizer. To achieve high-precision recognition of the maximum output power point in distributed marine photovoltaic monitoring, the Crested Porcupine Optimizer is employed to optimize the hyperparameters during the training phase of the inference model. First, by automatically searching for an appropriate learning rate, the model can stably converge during the training process. Second, optimizing the regularization coefficient helps avoid overfitting, which significantly improves the model’s accuracy. Eventually, automatically adjusting the number of nodes in the hidden layers can enhance the model’s robustness and generalization ability. Furthermore, the model’s accuracy is measured using the coefficient of determination (R2), mean absolute error (MAE), root mean squared error (RMSE), and mean absolute percentage error (MAPE) to obtain the optimal model.
2.1. Distributed Marine Photovoltaic Monitoring Complete Dataset Acquisition
Figure 3 presents a digital fusion model for the distributed marine photovoltaic monitoring system. The complete data for the distributed marine photovoltaic monitoring system can be obtained through integrated calculations based on the motion characteristic parameters , environmental characteristic parameters , intrinsic electrical characteristic parameters , and output energy characteristic parameters .
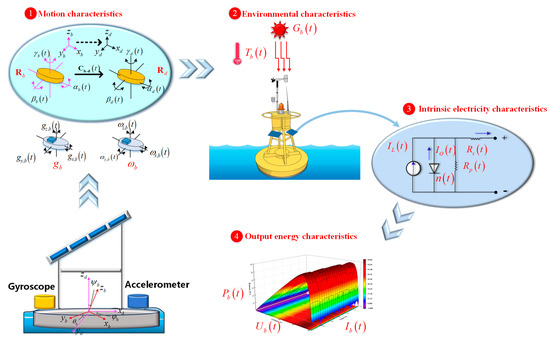
Figure 3.
Digital fusion model of distributed marine photovoltaic monitoring.
Where , , and are the triaxial angular velocity vector, triaxial acceleration vector, and triaxial attitude angle vector (including roll angle , pitch angle , and yaw angle ) in the carrier coordinate system, respectively. The vectors and can be obtained through an Inertial Measurement Unit (IMU). The dynamic irradiance is denoted as and the dynamic temperature as . The photovoltaic module’s five-parameter characteristics under motion conditions is represented as , , , ,. The output current, output voltage, and output power of the module are denoted as , , and , respectively.
Under the coupled action of wind and nonlinear waves, the floating body of the distributed marine photovoltaic monitoring system will undergo large-range reciprocating motion in three-dimensional space and experience changes in attitude. These attitude changes can be obtained by integrating the angular velocity and acceleration measured by gyroscopes and accelerometers. During actual operation, since the floating body is rigidly connected to the photovoltaic modules, the swaying motion is indirectly transferred to the modules, causing changes in their attitude. This, in turn, leads to alterations in the irradiance and temperature experienced by the module surfaces. Among them, based on the principle of Kalman filtering [41], the attitude of the photovoltaic module can be obtained by integrating the attitude derived from angular velocity and the attitude derived from acceleration , as shown in Equation (1):
where is the state transition matrix of the Kalman filter, is the control input coefficient matrix of the Kalman filter, is the initial state matrix of the Kalman filter system, is the Kalman filter gain (including the covariance matrix of Kalman filter measurement noise , the covariance matrix of Kalman filter prediction error , and the covariance matrix of Kalman filter system process noise ). is the observation matrix of the Kalman filter, is the noise signal of the angular velocity measurement, and is the noise signal of the acceleration measurement.
Based on the principles of inertial navigation [42] and Euler angle spatial rotation [43], the dynamic irradiance and dynamic temperature of the photovoltaic module can be calculated from the module’s attitude angles , as shown in Equation (2):
where is the environmental characteristic vector under static conditions and is the initial solar incidence angle. is the installation attitude angle in the geodetic coordinate system, which can be obtained through the coordinate transformation matrix , as shown in Equations (3) and (4).
The variations in irradiance and temperature on the surface of the photovoltaic module will further cause changes in its intrinsic electrical parameters . Based on the five-parameter model of the photovoltaic module, the electrical characteristic parameters under the motion environment can be updated from the module’s environmental characteristic parameters using Equations (5)–(7) [44,45].
where is the standard test temperature, is the standard test irradiance (1000 W/m2), is the photocurrent under standard test conditions, is the reverse saturation current of the diode under standard test conditions, is the equivalent series resistance under standard test conditions, is the equivalent parallel resistance under standard test conditions, and is the diode ideality factor under standard test conditions. In the equations, is the temperature coefficient, is the constitutive electronic mobility coefficient, and is the irradiance mobility coefficient.
Finally, based on the single-diode model of the photovoltaic module [46], the output energy characteristic parameters can be obtained from the updated intrinsic electrical characteristic parameters according to Equations (8) and (9) [47].
where, is the identity matrix, is the Boltzmann constant, and is the elementary charge.
Thus, by the above calculations, a comprehensive dataset for distributed marine photovoltaic monitoring under the motion environment has been obtained. To provide high-quality input data for the inference model, seven characteristics (including triaxial angular velocity, triaxial acceleration, and maximum power point) are extracted and calculated from the comprehensive dataset to form the input dataset for the inference model.
In addition, to resolve the issue of inconsistent scales in the characteristic dataset, the minimum-maximum normalization is performed using Equation (10) [48].
where and are the minimum and maximum values in the dataset, respectively, and is the normalized data.
2.2. A Maximum Power Point Inference Model for Distributed Marine Photovoltaic Monitoring Based on CNN-LSTM-Attention
To realize the inference of the maximum power point for distributed marine photovoltaic monitoring, a deep learning-based inference model centered on CNN, SE-Attention, and LSTM has been developed, as illustrated in Figure 4. First, two convolutional layers are employed to capture the local high-frequency motion characteristics. Subsequently, the convolutional results are fed into the SE-Attention layer, where the weights of each channel are adaptively adjusted. This allows the model to focus more on global low-frequency motion characteristics, thereby enhancing the globality of the inference results. Ultimately, the motion data that integrate both high- and low-frequency local characteristics are fed into the LSTM to capture the long-term dependencies, thereby obtaining the time series of the maximum power point.
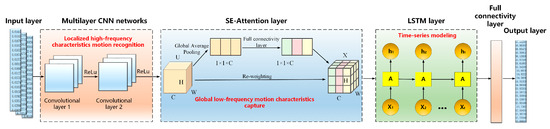
Figure 4.
An inference model of maximum power point based on CNN-LSTM-Attention.
2.2.1. Extraction of Local High-Frequency Motion Characteristics Using a Multi-Layer CNN
Due to the motion characteristics of low and high frequency mixed in the maximum power point for distributed marine photovoltaic monitoring, traditional single-layer CNN struggles to effectively capture the complex relationships within the data [49]. The adoption of a multi-layer convolutional approach allows convolutional kernels to extract more advanced characteristics. Therefore, this paper employs a two-layer convolutional neural network to extract the local high-frequency motion characteristics. First, the first convolutional layer uses a convolution kernel of size (3, 1), with 32 channels and a stride of (1, 1), to extract nonlinear transient motion characteristics. The convolution kernel scans the input data through a sliding window approach to extract local instantaneous changes in the motion data. Subsequently, the number of channels in the second convolutional layer is increased to 64, enhancing the ability to extract and learn multi-spectral motion characteristics. This allows the model to capture dynamic changes and periodic fluctuations, and to extract high-frequency patterns in the presence of mixed high- and low-frequency signals.
To enhance the network’s ability to learn complex patterns in the motion characteristic signals and thereby improve the model’s accuracy, the Relu activation function is applied after each convolution operation. This not only introduces non-linearity [50], but also effectively smooths the gradient [51], promoting gradient stability during the backpropagation process.
2.2.2. Extraction of Low-Frequency Global Motion Characteristics Using SE-Attention
To better focus on global low-frequency information and to more precisely extract key characteristics when extracting high- and low-frequency mixed input data, the SE-Attention is applied to the characteristic data following multi-layer convolution. SE-Attention enhances the perception and utilization of critical information by assigning different weights to different channels [52], thereby allowing low-frequency motion characteristics to have a greater impact on the results. The specific steps are as follows: first, the Global Average Pooling layer compresses each characteristic map of the characteristic channels into a single value, reducing the parameters while preserving the global characteristic information of each channel. Second, using Fully Connected layers and a Sigmoid activation function, the weights for each channel are generated. Finally, through element-wise multiplication, the generated weights are applied to the original characteristic maps to enhance the recognition of low-frequency characteristics.
2.2.3. Temporal Modeling of Motion Characteristics Using LSTM
Although the CNN layers and SE-Attention layers can efficiently extract high- and low-frequency motion characteristics from the data, they struggle to capture long-term dependencies within the data. By performing LSTM-based temporal modeling on the data enhanced by the CNN layers and the SE-Attention module, the temporal variations of these characteristics can be further explored. This enhances the model’s capability to model complex dynamic systems. By inputting the motion characteristic data with high- and low-frequency signals into a single-layer LSTM, the temporal dependencies in the data can be effectively captured through the mechanisms of the input gate, forget gate, and output gate [53]. This helps distinguish the motion characteristics of different frequency components in the multi-spectral mixed data over long timescales, thus enabling the model to more effectively perform the maximum power point inference.
2.3. Hyperparameter Optimization of the CNN-LSTM-Attention Model Based on the Crested Porcupine Optimizer
In the CNN-LSTM-Attention model, hyperparameters such as the learning rate, regularization coefficient, and the number of neurons in the LSTM hidden layer need to be set manually [54]. These parameters have a significant impact on the model’s training efficiency and prediction accuracy. To enhance the model’s performance and training efficiency, employing metaheuristic algorithms for automatic hyperparameter tuning has become an effective strategy [55]. The Crested Porcupine Optimizer (CPO) is one of the latest and most competitive metaheuristic algorithms [56]. It mathematically simulates the four defense strategies of the crested porcupine (including visual, auditory, olfactory, and physical attacks) to achieve efficient parameter optimization in high-dimensional and complex search spaces. The specific principles of the algorithm are as follows:
- (1)
- Population initialization phase
The algorithm initializes the crested porcupine population, generating a set of individuals. Each individual represents a candidate solution, and the initialization formula is as follows:
where . represents the number of individuals, is the ith candidate solution in the search space, and are the lower and upper bounds of the search range, respectively, and is a random number between (0, 1).
- (2)
- Cyclic population reduction technique
To accelerate convergence and avoid falling into local optima, the Crested Porcupine Optimizer employs a Cyclic Population Reduction Technique (CPR). This technique dynamically adjusts the population size during the optimization process, reducing the number of individuals while maintaining population diversity, thereby speeding up the search process. The formula is as follows:
where, is the number of cycles (usually is 2), is the current iteration, is the maximum number of iterations, % denotes the modulo operation, is the number of individuals in the newly generated population, and is the minimum number of individuals in the newly generated population.
- (3)
- Exploration phase
Upon detecting a predator, the crested porcupine starts to raise and fan its quills, initiating the first defense strategy, as indicated in Equation (13). When the predator approaches to a certain distance, the crested porcupine adopts the second defense strategy, which involves using sound to make noise and threaten the predator, as shown in Equation (14).
where, is a random number based on a normal distribution, is a random number between [0, 1], is the position of the ith crested porcupine at the tth iteration, is the position of the best crested porcupine at the current iteration, is the position of a randomly selected crested porcupine from the population, and is the position of the predator at the tth iteration. randomly takes the value of 0 or 1, is a random number between (0, 1), and and are the positions of two randomly selected crested porcupines.
- (4)
- Exploitation phase
To prevent the predator from approaching further, the crested porcupine will employ its third defense strategy by secreting a foul odor that spreads in its surrounding area, as shown in Equation (15). If the above three defense strategies fail to stop the intruder from continuing to approach, the crested porcupine will launch a physical attack using its body, as shown in Equation (16).
where is the convergence rate factor (typically set to 0.2), and are random numbers between (0, 1), and is a fitness-based factor. is the odor dispersion factor, which is generally selected within the range (0.3,2.6), is a parameter controlling the search direction, and is the defense factor.
In accordance with the aforementioned principles, the procedure for optimizing the hyperparameters of the maximum power point inference model based on the Crested Porcupine Optimizer is depicted in Figure 5. Among them,, , , , and are all random numbers between (0, 1).
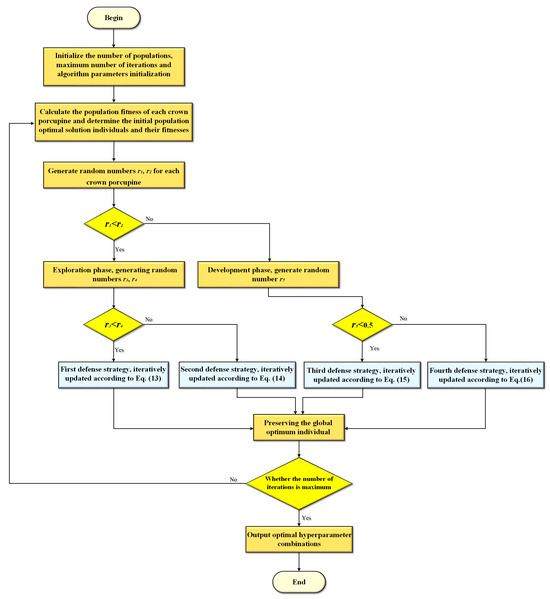
Figure 5.
The hyperparameter optimization process based on the Crested Porcupine Optimizer.
3. Validation, Analysis and Discussion
3.1. Data and Analytical Methods
To obtain a complete dataset of distributed marine photovoltaic power generation, an experimental platform was built, as shown in Figure 6. Among them, the PV module with 60 W output power is fixed to the floating body by means of a mounting bracket. The experimental platform is equipped with gyroscope, accelerometer, temperature sensor, irradiance meter, and wind speed sensor to realize the accurate measurement of the given motion and environmental data, and the relevant parameters of the experimental system are given in Table 1. The gyroscope is used to measure the angular velocity low-frequency signal and the accelerometer is used to measure the acceleration high-frequency signal. Then, the measured high- and low-frequency motion signals are transformed through the coordinate transformation and Kalman filtering to obtain the attitude angle of PV module, and the relevant parameters of Kalman filtering are given in Table 2. The irradiance meter is used to measure the vertical solar irradiance, and the irradiance on the surface of the module can be further obtained through coordinate transformation [11]. The temperature sensor is attached to the surface of the module to directly obtain the surface temperature of the module. Subsequently, the measured module irradiance and temperature are used to update the intrinsic five parameters of the PV module, and the standard test conditions and the intrinsic parameters of the PV module under these conditions are given in Table 3. Finally, the initial value of the maximum power point (MPP) voltage under the current environment is calculated according to the characteristics of the PV module, and the Buck-type DC-DC conversion circuit with the ARM chip STM32F107 (STMicroelectronics, Geneva, Switzerland) as the main processor is used. By adjusting the duty cycle of the Buck circuit to change the output voltage of the PV module, the P-V curve of the module is scanned to obtain the maximum power point at the current moment. Repeat the operation to obtain the maximum power point data of the PV module and use Zigbee wireless communication to realize the transmission and recording of the module’s voltage, current, and output power data.
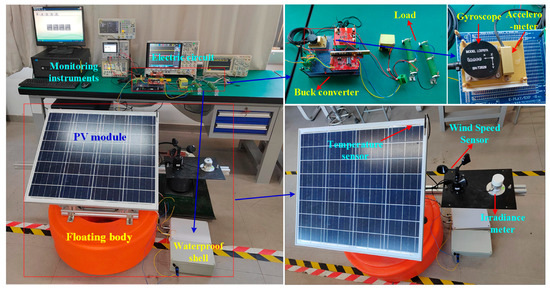
Figure 6.
Experimental platform.

Table 1.
Key parameters of the experimental platform.
Table 2.
Key parameters of the Kalman filtering.
Table 3.
Key parameters of the photovoltaic modules under standard test conditions.
After data preprocessing, data containing triaxial angular velocity, triaxial acceleration, and the maximum power point are extracted and divided into training and testing sets for the inference model at a ratio of 7:3. The Adam optimizer is employed to achieve adaptive parameter updates during the training process of the algorithmic model [57]. A segmented decay strategy for the learning rate is utilized to facilitate fine-tuning of the model in the later stages. Specifically, the learning rate is reduced by a factor of 0.5 after every 80 training cycles. At the same time, the maximum number of iterations is set to 100, and the batch size for each mini-batch training is 64. The Root Mean Squared Error (RMSE) is used as the loss function for training. Eventually, the relevant parameter settings of the constructed CPO-CNN-LSTM-Attention model are summarized in Table 4.
Table 4.
Key parameters of model.
To quantify the accuracy of the constructed model, the coefficient of determination (R2), Root Mean Square Error (RMSE), Mean Absolute Error (MAE), and Mean Absolute Percentage Error (MAPE) are used to measure the accuracy of the model in the following equation:
where is the number of samples in the test set, is the actual value of the maximum power point, is the value of the maximum power point modeling algorithm, and is the average value of the actual data of the maximum power point.
3.2. Results, Analysis and Discussion
3.2.1. Maximum Power Point Inference Results Based on CPO-CNN-LSTM-Attention
Figure 7 presents a comparison between the actual values and the results of the maximum power point algorithm for the distributed marine photovoltaic monitoring system. As shown in Figure 7a, the inference values of the maximum power point model are consistent in trend with the actual values. Both can effectively represent the periodic fluctuation of the maximum power point, which is influenced by high and low-frequency motions. This demonstrates that the maximum power point exhibits the nonlinear and multi-spectral motion characteristics. In terms of local extreme points, the inference values generally align well with the actual values at the wave peaks. However, at the wave valleys, the inference values are slightly lower than the actual values. This suggests that the model demonstrates a strong ability to fit the high-value regions of the data. Figure 7b presents a heatmap for the actual and inference values of the maximum power point. Overall, both the inference and actual values of the maximum power point indicate that the system’s output is less than the static maximum power of 60 W, varying between 50.25 W and 59.5 W. The consistent distribution ranges of the actual and inference values, along with the small differences, indicate that the model proposed in this paper has excellent generalization ability and robustness.
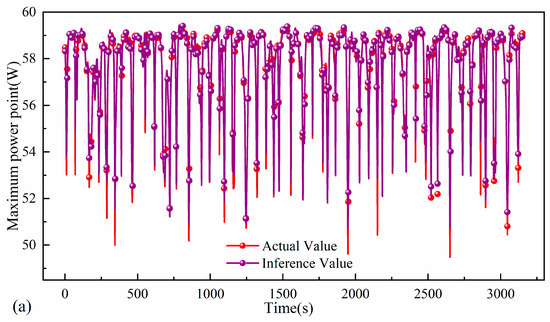
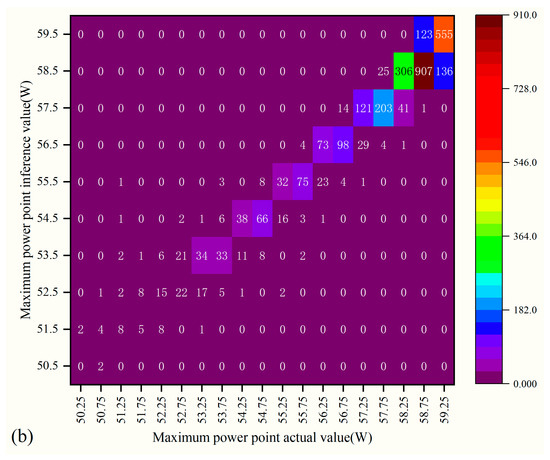
Figure 7.
Comparison of maximum power point inference results with the actual value: (a) Scatter line plot, (b) Heatmap.
Moreover, the evaluation indexes of the model can be obtained through calculation based on the prediction results and actual values of the CPO-CNN-LSTM-Attention. Among them, MAE is 0.0679, MAPE is 1.3%, and RMSE is 0.0263. These are all relatively small values, indicating that the constructed model has high accuracy both overall and for individual samples. The coefficient of determination (R2) of the model is 0.9863, which demonstrates that the model fits the data well and can effectively realize the inference of the maximum power point.
3.2.2. Motion Characteristics Spectrum Extraction
To further quantitatively analyze the motion characteristics of the multi-spectrum aliasing in the maximum power point signals, a method is used for spectrum extraction of the maximum power point [58]. First, the maximum power point timing signal is decomposed into independent components using Variational Mode Decomposition (VMD). These components are then processed through the Fast Independent Component Analysis (Fast-ICA) to extract the main frequency characteristics of the motion. Subsequently, the Hilbert–Huang Transform (HHT) is applied to reconstruct the output maximum power point timing signal. This process ultimately yields the main frequency signals characterizing resonance characteristics and the timing signals of low-frequency periods. The intrinsic mode functions of the maximum power point actuation time series are decomposed by VMD into five independent components. The Fast-ICA algorithm is then used to accurately extract the time-frequency spectrum of the maximum power point signal from these main frequency components, as shown in Figure 8. It reveals that the maximum power point of the distributed marine photovoltaic monitoring system exhibits distinct multi-spectral motion characteristics. Specifically, five relatively independent motion spectra are identified, corresponding to the main frequencies of 12.9 Hz, 35.5 Hz, 87.3 Hz, 176.3 Hz, and 335.2 Hz, respectively. This analysis provides valuable data support and theoretical guidance for the subsequent tracking and control of the maximum power point.
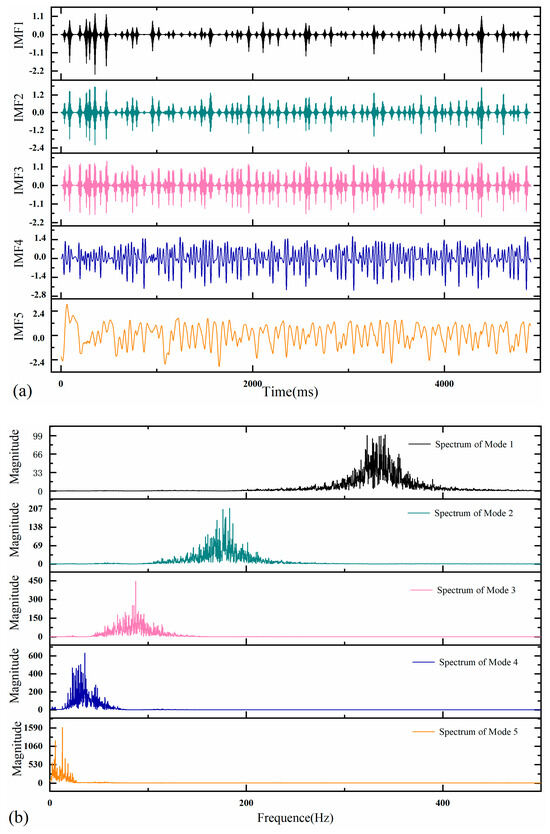
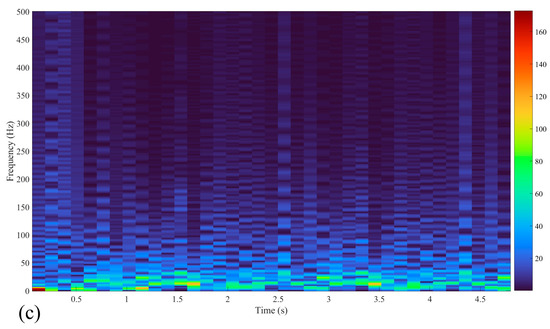
Figure 8.
Extraction of output maximum power motion temporal spectrum: (a) VMD motion component, (b) Fast-ICA motion main frequency, (c) HHT temporal spectrum.
3.2.3. Comparison of Maximum Power Point Inference Results
To further demonstrate the generalization capability of the CPO-CNN-LSTM-Attention model and analyze the impact of the SE-Attention and the CPO on model accuracy, the distributed marine photovoltaic monitoring data are simultaneously fed into the CNN-LSTM, CPO-CNN-LSTM, and CNN-LSTM-Attention models for comparison with the constructed model. The constructed model is compared with other models that lacked certain algorithms but have the same parameter settings otherwise. Figure 9 shows the comparison of the actual values and inference values for the four models.
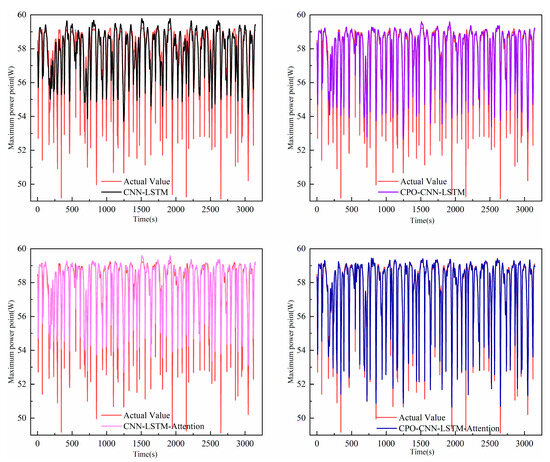
Figure 9.
Comparison of the maximum power point inference values and actual values for four different models.
As shown in Figure 9, the inference values of the four models exhibit relative consistency with the actual values, and the variations in the inference curves are similar to those in the actual curves. However, the deviations are slightly larger near the local troughs. It is also evident that the accuracy of the CPO-CNN-LSTM-Attention model is significantly better than the other three models.
Table 5 and Figure 10 provide the evaluation results of the four models. Overall, the CPO-CNN-LSTM-Attention achieves the best performance across all evaluation metrics, significantly outperforming the other comparative models. The coefficient of determination (R2) of the four models, in descending order, are CPO-CNN-LSTM-Attention, CPO-CNN-LSTM, CNN-LSTM-Attention, and CNN-LSTM, with values of 0.9863, 0.9344, 0.9267, and 0.9023, respectively.
Table 5.
Evaluation results for four models.
Figure 10.
Bar chart of evaluation results for the four models.
Comparing the CNN-LSTM model with the CNN-LSTM-Attention model and the CPO-CNN-LSTM model with the CPO-CNN-LSTM-Attention model, the introduction of the SE-Attention leads to notable improvements in key performance metrics. Specifically, for the CNN-LSTM-Attention model compared to the CNN-LSTM model, the MAE, MAPE and RMSE are reduced from 0.2232, 8.17%, and 0.8658 to 0.1801, 5.09%, and 0.4268, respectively. Meanwhile, for the CPO-CNN-LSTM-Attention model compared to the CPO-CNN-LSTM model, the MAE, MAPE, and RMSE decreased from 0.1122, 6.29%, and 0.5239 to 0.0679, 1.30%, and 0.2463, respectively. These results indicate that SE-Attention enhances the model’s focus on global low-frequency motion information by dynamically adjusting the weights of different characteristics, thereby significantly improving the accuracy of the maximum power point inference.
In addition, when comparing CNN-LSTM with CPO-CNN-LSTM and CNN-LSTM-Attention with CPO-CNN-LSTM-Attention, the evaluation metrics are further enhanced after optimization using the CPO algorithm. This demonstrates that CPO-based hyperparameter optimization allows the model to achieve high-precision recognition of the multi-spectral motion characteristics for the maximum power point output. Moreover, the comparison results show that CPO algorithm leads to a greater improvement in model accuracy compared to the introduction of the SE-Attention alone.
In summary, the experimental results fully demonstrate the effectiveness and superiority of the proposed maximum power point inference model for distributed marine photovoltaic monitoring. The model is capable of effectively capturing the high- and low-frequency motion characteristics. In addition, it can achieve high-precision maximum power point inference, thereby providing methodological guidance and technical support for the maximum power point tracking control of distributed marine photovoltaic monitoring.
4. Conclusions and Future Work
The maximum power point of distributed marine photovoltaic monitoring corresponds to the optimal operating state under specific conditions. Its maximum power point is influenced by the coupling of motion and environmental factors, exhibiting high- and low-frequency fluctuations as well as nonlinear and multi-spectral motion characteristics. Therefore, to effectively obtain the maximum power point of distributed marine photovoltaic monitoring and analyze its motion characteristics, this paper constructs a spatiotemporal inference model for the maximum power point based on the CPO-CNN-LSTM-Attention. The main contributions and conclusions are as follows:
- In terms of technical contribution, a nonlinear inference scheme for the maximum power point of distributed marine photovoltaic monitoring is proposed. This scheme can accurately and reliably capture the motion characteristics of the photovoltaic system, providing an effective approach for characterizing the multi-spectral motion attributes of output power. It has demonstrated high accuracy and engineering feasibility in practice.
- In terms of scientific contribution, a method for analyzing the maximum power point of distributed marine photovoltaic monitoring based on the CPO-CNN-LSTM-Attention model is proposed. It addresses the issue of incomplete sample data, enhances the perception of high- and low-frequency motions, and achieves high-precision recognition of the motion characteristics. It provides theoretical support for the maximum power point tracking technology of distributed marine photovoltaic monitoring.
- The maximum power point of distributed marine photovoltaic monitoring exhibits multi-spectral motion characteristics, with the highest frequency at 335.2 Hz and the lowest frequency at 12.9 Hz.
- The maximum power point inference method proposed in this paper solves the difficulty of obtaining high and low-frequency output power, with an accuracy of 98.63%.
- SE-Attention enhances the focus on low-frequency global motion information by dynamically adjusting the weights of different characteristics, effectively improving the accuracy of the maximum power point inference results. The Crested Porcupine Optimizer optimizes the model’s hyperparameters, enabling high-precision identification of the maximum power point. Compared to the introduction of the SE-Attention, the model’s accuracy is further enhanced after Crested Porcupine Optimizer hyperparameter optimization.
- The next steps will focus on the lightweight deployment of the inference model on edge devices, constructing edge computing models and developing embedded hardware deployment methods to achieve collaborative control of photovoltaic energy harvesting under dynamic conditions. The research will focus on the development of prototype testing machines and algorithm software to meet the requirements of multi-spectral aliasing and random spatial motion of the modules. This work aims to provide fundamental theories and technical support for the technology and engineering applications of distributed marine photovoltaic monitoring energy harvesting.
Author Contributions
Y.C.: Conceptualization, Methodology, Validation, Writing—review and editing. J.W.: Methodology, Data curation, Writing–original draft, Writing—review and editing. L.P.: Methodology, Writing—review and editing, Validation, Funding acquisition. J.Q.: Software, Writing—review and editing. All authors have read and agreed to the published version of the manuscript.
Funding
This work was supported by the Shanghai Science and Technology Program (Grant No. 22010501600).
Data Availability Statement
The original contributions presented in the study are included in the article, further inquiries can be directed to the corresponding author.
Conflicts of Interest
The authors declare no conflicts of interest.
References
- Zhang, Y.; Wen, Y.; Han, X.; Zhang, W.; Gao, F.; Chen, W. Gyroscopic wave energy converter with a self-accelerating rotor in WEC-glider. Ocean. Eng. 2023, 273, 113819. [Google Scholar] [CrossRef]
- Liu, Z.; Zhang, Y.; Yu, X.; Yuan, C. Unmanned surface vehicles: An overview of developments and challenges. Annu. Rev. Control 2016, 41, 71–93. [Google Scholar] [CrossRef]
- Zhang, H.; Zhang, D.; Zhang, A. An Innovative Multifunctional Buoy Design for Monitoring Continuous Environmental Dynamics at Tianjin Port. IEEE Access 2020, 8, 171820–171833. [Google Scholar] [CrossRef]
- Bi, W.; Zhang, M.; Chen, H.; Zhang, A. Cooperative task allocation method for air-sea heterogeneous unmanned system with an application to ocean environment information monitoring. Ocean. Eng. 2024, 309, 118496. [Google Scholar] [CrossRef]
- Kumar, N.; Pachauri, R.K.; Kuchhal, P.; Nkenyereye, L. Floating photovoltaic system based electrical power generation study in Indian context. Renew. Sustain. Energy Rev. 2025, 212, 115442. [Google Scholar] [CrossRef]
- Micheli, L.; Talavera, D.L.; Tina, G.M.; Almonacid, F.; Fernández, E.F. Techno-economic potential and perspectives of floating photovoltaics in Europe. Sol. Energy 2022, 243, 203–214. [Google Scholar] [CrossRef]
- Xu, W.; Zhang, X.; Sun, Y.; He, Z. Hydrodynamic characteristics and technoeconomic analysis of floating photovoltaic arrays considering different mooring forms. Ocean. Eng. 2025, 320, 120288. [Google Scholar] [CrossRef]
- Hussain, A.; Garg, M.M.; Korukonda, M.P.; Hasan, S.; Behera, L. A Parameter Estimation Based MPPT Method for a PV System Using Lyapunov Control Scheme. IEEE Trans. Sustain. Energy 2019, 10, 2123–2132. [Google Scholar] [CrossRef]
- Yuan, L.; Wang, X.; Sun, Y.; Liu, X.; Dong, Z. Multistep photovoltaic power forecasting based on multi-timescale fluctuation aggregation attention mechanism and contrastive learning. Int. J. Electr. Power Energy Syst. 2025, 164, 110389. [Google Scholar] [CrossRef]
- Wei, L.; Li, Y. Research on maximum power point tracking of photovoltaic power generation based on improved hybrid optimization algorithm. Sci. Rep. 2025, 15, 3991. [Google Scholar] [CrossRef]
- Peng, L.; Liu, B.; Zheng, S.; Chen, X.; Zhong, Q.; Chai, X. A new dynamic 2D fusion model and output characteristic analysis of floating photovoltaic modules considering motion and environmental factors. Energy Convers. Manag. 2023, 294, 117588. [Google Scholar] [CrossRef]
- Liu, Y.; Ning, C.; Zhang, Q.; Yuan, G.; Li, C. Utilizing VMD and BiGRU to predict the short-term motion of buoys. Ocean. Eng. 2024, 313, 119237. [Google Scholar] [CrossRef]
- Cai, C.; Rong, Z.; Chen, Z.; Xu, B.; Wang, Z.; Hu, S.; Wang, Y.; Dong, M.; Quan, X.; Si, Y.; et al. A resident subsea docking system with a real-time communication buoy moored by an electro-optical-mechanical cable. Ocean. Eng. 2023, 271, 1113729. [Google Scholar] [CrossRef]
- Wei, Y.; Khojasteh, D.; Windt, C.; Huang, L. An interdisciplinary literature review of floating solar power plants. Renew. Sustain. Energy Rev. 2025, 209, 115094. [Google Scholar] [CrossRef]
- Andrasto, T.; Primadiyono, Y.; Hidayat, S.; Sandyawan, B.; Fauzi, A.R.; Azis, M.K. Incremental Conductance Method in Maximum Power Point Tracking. IOP Conf. Ser. Earth Environ. Sci. 2024, 1381, 012023. [Google Scholar] [CrossRef]
- Badawi, A.S.; Hasbullah, N.F.; Yusoff, S.H.; Hashim, A.H.; Zyoud, A. Novel technique for hill climbing search to reach maximum power point tracking. Int. J. Power Electron. Drive Syst. 2020, 11, 2019–2029. [Google Scholar] [CrossRef]
- Nagi, F.; Kumaran, V.; Mansor, M.; Verayiah, R.; Bin Mohamed, H.; Permal, N. Maximum power point tracking controller with online adaptive reference voltage generator for disturbance rejection. Renew. Energy 2025, 241, 122277. [Google Scholar] [CrossRef]
- Endiz, M.S. Design and implementation of microcontroller-based solar charge controller using modified incremental conductance MPPT algorithm. J. Radiat. Res. Appl. Sci. 2024, 17, 100938. [Google Scholar] [CrossRef]
- Liu, H.-D.; Lin, C.-H.; Pai, K.-J.; Lin, Y.-L. A novel photovoltaic system control strategies for improving hill climbing algorithm efficiencies in consideration of radian and load effect. Energy Convers. Manag. 2018, 165, 815–826. [Google Scholar] [CrossRef]
- Chellakhi, A.; El Beid, S.; El Marghichi, M.; Bouabdalli, E.M.; Harrison, A.; Abouobaida, H. Implementation of a low-cost current perturbation-based improved PO MPPT approach using Arduino board for photovoltaic systems. E-Prime-Adv. Electr. Eng. Electron. Energy 2024, 10, 100807. [Google Scholar] [CrossRef]
- Swetha, K.T.; Reddy, V.; Robinson, A. An innovative grey wolf optimizer with Nelder–mead search method based MPPT technique for fast convergence under partial shading conditions. Sustain. Energy Technol. Assess. 2023, 59, 103412. [Google Scholar]
- Ibrahim, A.W.; Farh, H.M.H.; Fang, Z.; Al-Shamma’a, A.A.; Xu, J.; Alaql, F.; Alfraidi, W.; Zafar, M.H. A comprehensive comparison of advanced metaheuristic photovoltaic maximum power tracking algorithms during dynamic and static environmental conditions. Heliyon 2024, 10, e37458. [Google Scholar] [CrossRef]
- Yang, B.; Wu, S.; Huang, J.; Guo, Z.; Wang, J.; Zhang, Z.; Xie, R.; Shu, H.; Jiang, L. Salp swarm optimization algorithm based MPPT design for PV-TEG hybrid system under partial shading conditions. Energy Convers. Manag. 2023, 292, 117410. [Google Scholar] [CrossRef]
- Li, L.; Zhao, W.; Wang, H.; Xu, Z.; Ding, Y. Sand cat swarm optimization based maximum power point tracking technique for photovoltaic system under partial shading conditions. Int. J. Electr. Power Energy Syst. 2024, 161, 110203. [Google Scholar] [CrossRef]
- Kong, L.G.; Wang, B.; Fan, D.J.; Shi, S.; Ouyang, X.; Xu, M. Optimize photovoltaic MPPT with improved snake algorithm. Energy Rep. 2024, 11, 5033–5045. [Google Scholar] [CrossRef]
- Refaat, A.; Ali, Q.A.; Elsakka, M.M.; Elhenawy, Y.; Majozi, T.; Korovkin, N.V.; Elfar, M.H. Extraction of maximum power from PV system based on horse herd optimization MPPT technique under various weather conditions. Renew. Energy 2024, 220, 119718. [Google Scholar] [CrossRef]
- Zhou, Z.; Fang, Y. Eel and Grouper Optimizer improvement three-stage algorithm for photovoltaic MPPT. Results Eng. 2025, 25, 103877. [Google Scholar] [CrossRef]
- Yang, B.; Duan, J.; Li, M.; Liu, B.; Cao, P.; He, P.; Chen, Y.; Jiang, L. Optimal placement of hybrid solar-wind-wave systems for maximum energy harvesting via chaotic artificial rabbits algorithm. Energy Convers. Manag. 2024, 322, 119143. [Google Scholar] [CrossRef]
- Guo, A.; Xu, Y.; Alireza, R. Performance improvement of maximum power point tracking for photovoltaic system using grasshopper optimization algorithm based ANFIS under different conditions. Optik 2022, 270, 169965. [Google Scholar]
- Sarwar, S.; Javed, M.Y.; Asghar, A.B.; Iqbal, W.; Ejsmont, K.; Jaffery, M.H. A Coronavirus Optimization (CVO) algorithm to harvest maximum power from PV systems under partial and complex partial shading conditions. Energy Rep. 2024, 11, 1693–1710. [Google Scholar] [CrossRef]
- Zhu, J.; He, Y. A novel photovoltaic power probabilistic forecasting model based on monotonic quantile convolutional neural network and multi-objective optimization. Energy Convers. Manag. 2025, 323, 119219. [Google Scholar] [CrossRef]
- Wang, J.; Kou, M.; Li, R.; Qian, Y.; Li, Z. Ultra-short-term wind power forecasting jointly driven by anomaly detection, clustering and graph convolutional recurrent neural networks. Adv. Eng. Inform. 2025, 65, 103137. [Google Scholar] [CrossRef]
- Tao, J.; Wang, S.; Cao, W.; Fernandez, C.; Blaabjerg, F.; Cheng, L. An innovative multitask learning-Long short-term memory neural network for the online anti-aging state of charge estimation of lithium-ion batteries adaptive to varying temperature and current conditions. Energy 2025, 314, 134272. [Google Scholar] [CrossRef]
- Piantadosi, G.; Dutto, S.; Galli, A.; De Vito, S.; Sansone, C.; Di Francia, G. Photovoltaic power forecasting: A Transformer based framework. Energy AI 2024, 18, 100444. [Google Scholar] [CrossRef]
- Adaileh, A.; Ghiassi, B.; Briganti, R. Deep generative modelling for nonlinear analysis and in-situ assessment of masonry using multiple mechanical fields. Constr. Build. Mater. 2024, 456, 138745. [Google Scholar] [CrossRef]
- Zhang, C.; Wen, W.; Zhai, C.; Jia, J.; Zhou, B. Structural nonlinear seismic time-history response prediction of urban-scale reinforced concrete frames based on deep learning. Eng. Struct. 2024, 317, 118702. [Google Scholar] [CrossRef]
- Malkawi, A.M.A.; Alsaqqa, Z.A.B.; Al-Mosa, T.O.; JadAllah, W.M.; Sadeddin, M.M.H.; Al-Quraan, A.; AlMashagbeh, M. Maximum power point tracking enhancement for PV in microgrids systems using dual artificial neural networks to estimate solar irradiance and temperature. Results Eng. 2025, 25, 104275. [Google Scholar] [CrossRef]
- Yin, L.; Li, J.; Wang, N.; Gao, F. Deep predictive data representation model control for photovoltaic maximum power point tracking under partial shading conditions. Energy Convers. Manag. 2024, 322, 119171. [Google Scholar] [CrossRef]
- Zhou, N.; Shang, B.; Xu, M.; Peng, L.; Feng, G. Enhancing photovoltaic power prediction using a CNN-LSTM-attention hybrid model with Bayesian hyperparameter optimization. Glob. Energy Interconnect. 2024, 7, 667–681. [Google Scholar] [CrossRef]
- Çırak, C.R.; Çalık, H. Hotspots in maximum power point tracking algorithms for photovoltaic systems—A comprehensive and comparative review. Eng. Sci. Technol. Int. J. 2023, 43, 101436. [Google Scholar] [CrossRef]
- Pal, A.; Nagarajaiah, S. Data fusion based on short-term memory Kalman filtering using intermittent-displacement and acceleration signal with a time-varying bias. Mech. Syst. Signal Process. 2024, 216, 111482. [Google Scholar] [CrossRef]
- Zheng, X.; Dong, Y.; Zhao, Y.; Zhang, B.; Li, M. TSF-GINS: Based on time-fixed sliding window with factor graph a global navigation satellite system and inertial measurement unit tightly coupled localization system. Measurement 2025, 239, 115421. [Google Scholar] [CrossRef]
- Reza-Asl, K.; Rad, E.G.; Abouali, O. A novel Eulerian-Lagrangian solver for resolving translational and rotational motion dynamics of ellipsoidal fibers. Comput. Phys. Commun. 2025, 309, 109481. [Google Scholar] [CrossRef]
- Singh, O.; Ray, A.K.; Ghosh, A. Photovoltaic module performance: Modeling, parameter estimation, and environmental effects. E-Prime-Adv. Electr. Eng. Electron. Energy 2024, 8, 100529. [Google Scholar] [CrossRef]
- Harrison, A.; Alombah, N.H.; Kamel, S.; Ghoneim, S.S.M.; El Myasse, I.; Kotb, H. Towards a simple and efficient implementation of solar photovoltaic emulator: An explicit PV model based approach. Eng. Proc. 2023, 56, 261. [Google Scholar]
- Campanelli, M.B. Comparison of calibrations of a single-diode model of photovoltaic module performance using performance matrix vs. specification datasheet. Sol. Energy 2024, 278, 112712. [Google Scholar] [CrossRef]
- Harrison, A.; Alombah, N.H.; Kamel, S.; Kotb, H.; Ghoneim, S.S.M.; El Myasse, I. A Novel MPPT-Based Solar Irradiance Estimator: Integration of a Hybrid Incremental Conductance Integral Backstepping Algorithm for PV Systems with Experimental Validation. Eng. Proc. 2023, 56, 262. [Google Scholar]
- Jukte, N.R.; Swamy, A.K. Deep learning based methodological approach for prediction of dynamic modulus and phase angle of asphalt concrete. Eng. Appl. Artif. Intell. 2025, 145, 110269. [Google Scholar] [CrossRef]
- Luo, S.; Wang, B.; Gao, Q.; Wang, Y.; Pang, X. Stacking integration algorithm based on CNN-BiLSTM-Attention with XGBoost for short-term electricity load forecasting. Energy Rep. 2024, 12, 2676–2689. [Google Scholar] [CrossRef]
- Xu, Y.; Zhang, H. Convergence of deep ReLU networks. Neurocomputing 2024, 571, 127174. [Google Scholar] [CrossRef]
- Eckle, K.; Schmidt-Hieber, J. Acomparison of deep networks with ReLU activation function and linear spline-type methods. Neural Netw. 2019, 110, 232–242. [Google Scholar] [CrossRef] [PubMed]
- Ni, J.C.; Lee, S.H.; Shen, Y.C.; Yang, C.S. Improved U-Net based on ResNet and SE-Net with dual attention mechanism for glottis semantic segmentation. Med. Eng. Phys. 2025, 136, 104298. [Google Scholar] [CrossRef] [PubMed]
- Fournier, C.; Fernandez-Fernandez, R.; Cirés, S.; López-Orozco, J.A.; Besada-Portas, E.; Quesada, A. LSTM networks provide efficient cyanobacterial blooms forecasting even with incomplete spatio-temporal data. Water Res. 2024, 267, 122553. [Google Scholar] [CrossRef] [PubMed]
- Jlifi, B.; Ferjani, S.; Duvallet, C. A Genetic Algorithm based Three HyperParameter optimization of Deep Long Short Term Memory (GA3P-DLSTM) for Predicting Electric Vehicles energy consumption. Comput. Electr. Eng. 2025, 123, 110185. [Google Scholar] [CrossRef]
- Zhao, W.; Zhang, Z.; Khodadadi, N.; Wang, L. A deep learning model coupled with metaheuristic optimization for urban rainfall prediction. J. Hydrol. 2025, 651, 132596. [Google Scholar] [CrossRef]
- Abdel-Basset, M.; Mohamed, R.; Abouhawwash, M. Crested Porcupine Optimizer: A new nature-inspired metaheuristic. Knowl.-Based Syst. 2024, 284, 111257. [Google Scholar] [CrossRef]
- Kang, J.; Zhu, X.; Shen, L.; Li, M. Fault diagnosis of a wave energy converter gearbox based on an Adam optimized CNN-LSTM algorithm. Renew. Energy 2024, 231, 121022. [Google Scholar] [CrossRef]
- Xu, Y.; Huang, X.; Zheng, X.; Zeng, Z.; Jin, T. VMD-ATT-LSTM electricity price prediction based on grey wolf optimization algorithm in electricity markets considering renewable energy. Renew. Energy 2024, 236, 121408. [Google Scholar] [CrossRef]
Disclaimer/Publisher’s Note: The statements, opinions and data contained in all publications are solely those of the individual author(s) and contributor(s) and not of MDPI and/or the editor(s). MDPI and/or the editor(s) disclaim responsibility for any injury to people or property resulting from any ideas, methods, instructions or products referred to in the content. |
© 2025 by the authors. Licensee MDPI, Basel, Switzerland. This article is an open access article distributed under the terms and conditions of the Creative Commons Attribution (CC BY) license (https://creativecommons.org/licenses/by/4.0/).