
Investigating the Effects of Leading- and Trailing-Edge Shapes of a Flapping Wing on Power Extraction Performance


Abstract
1. Introduction
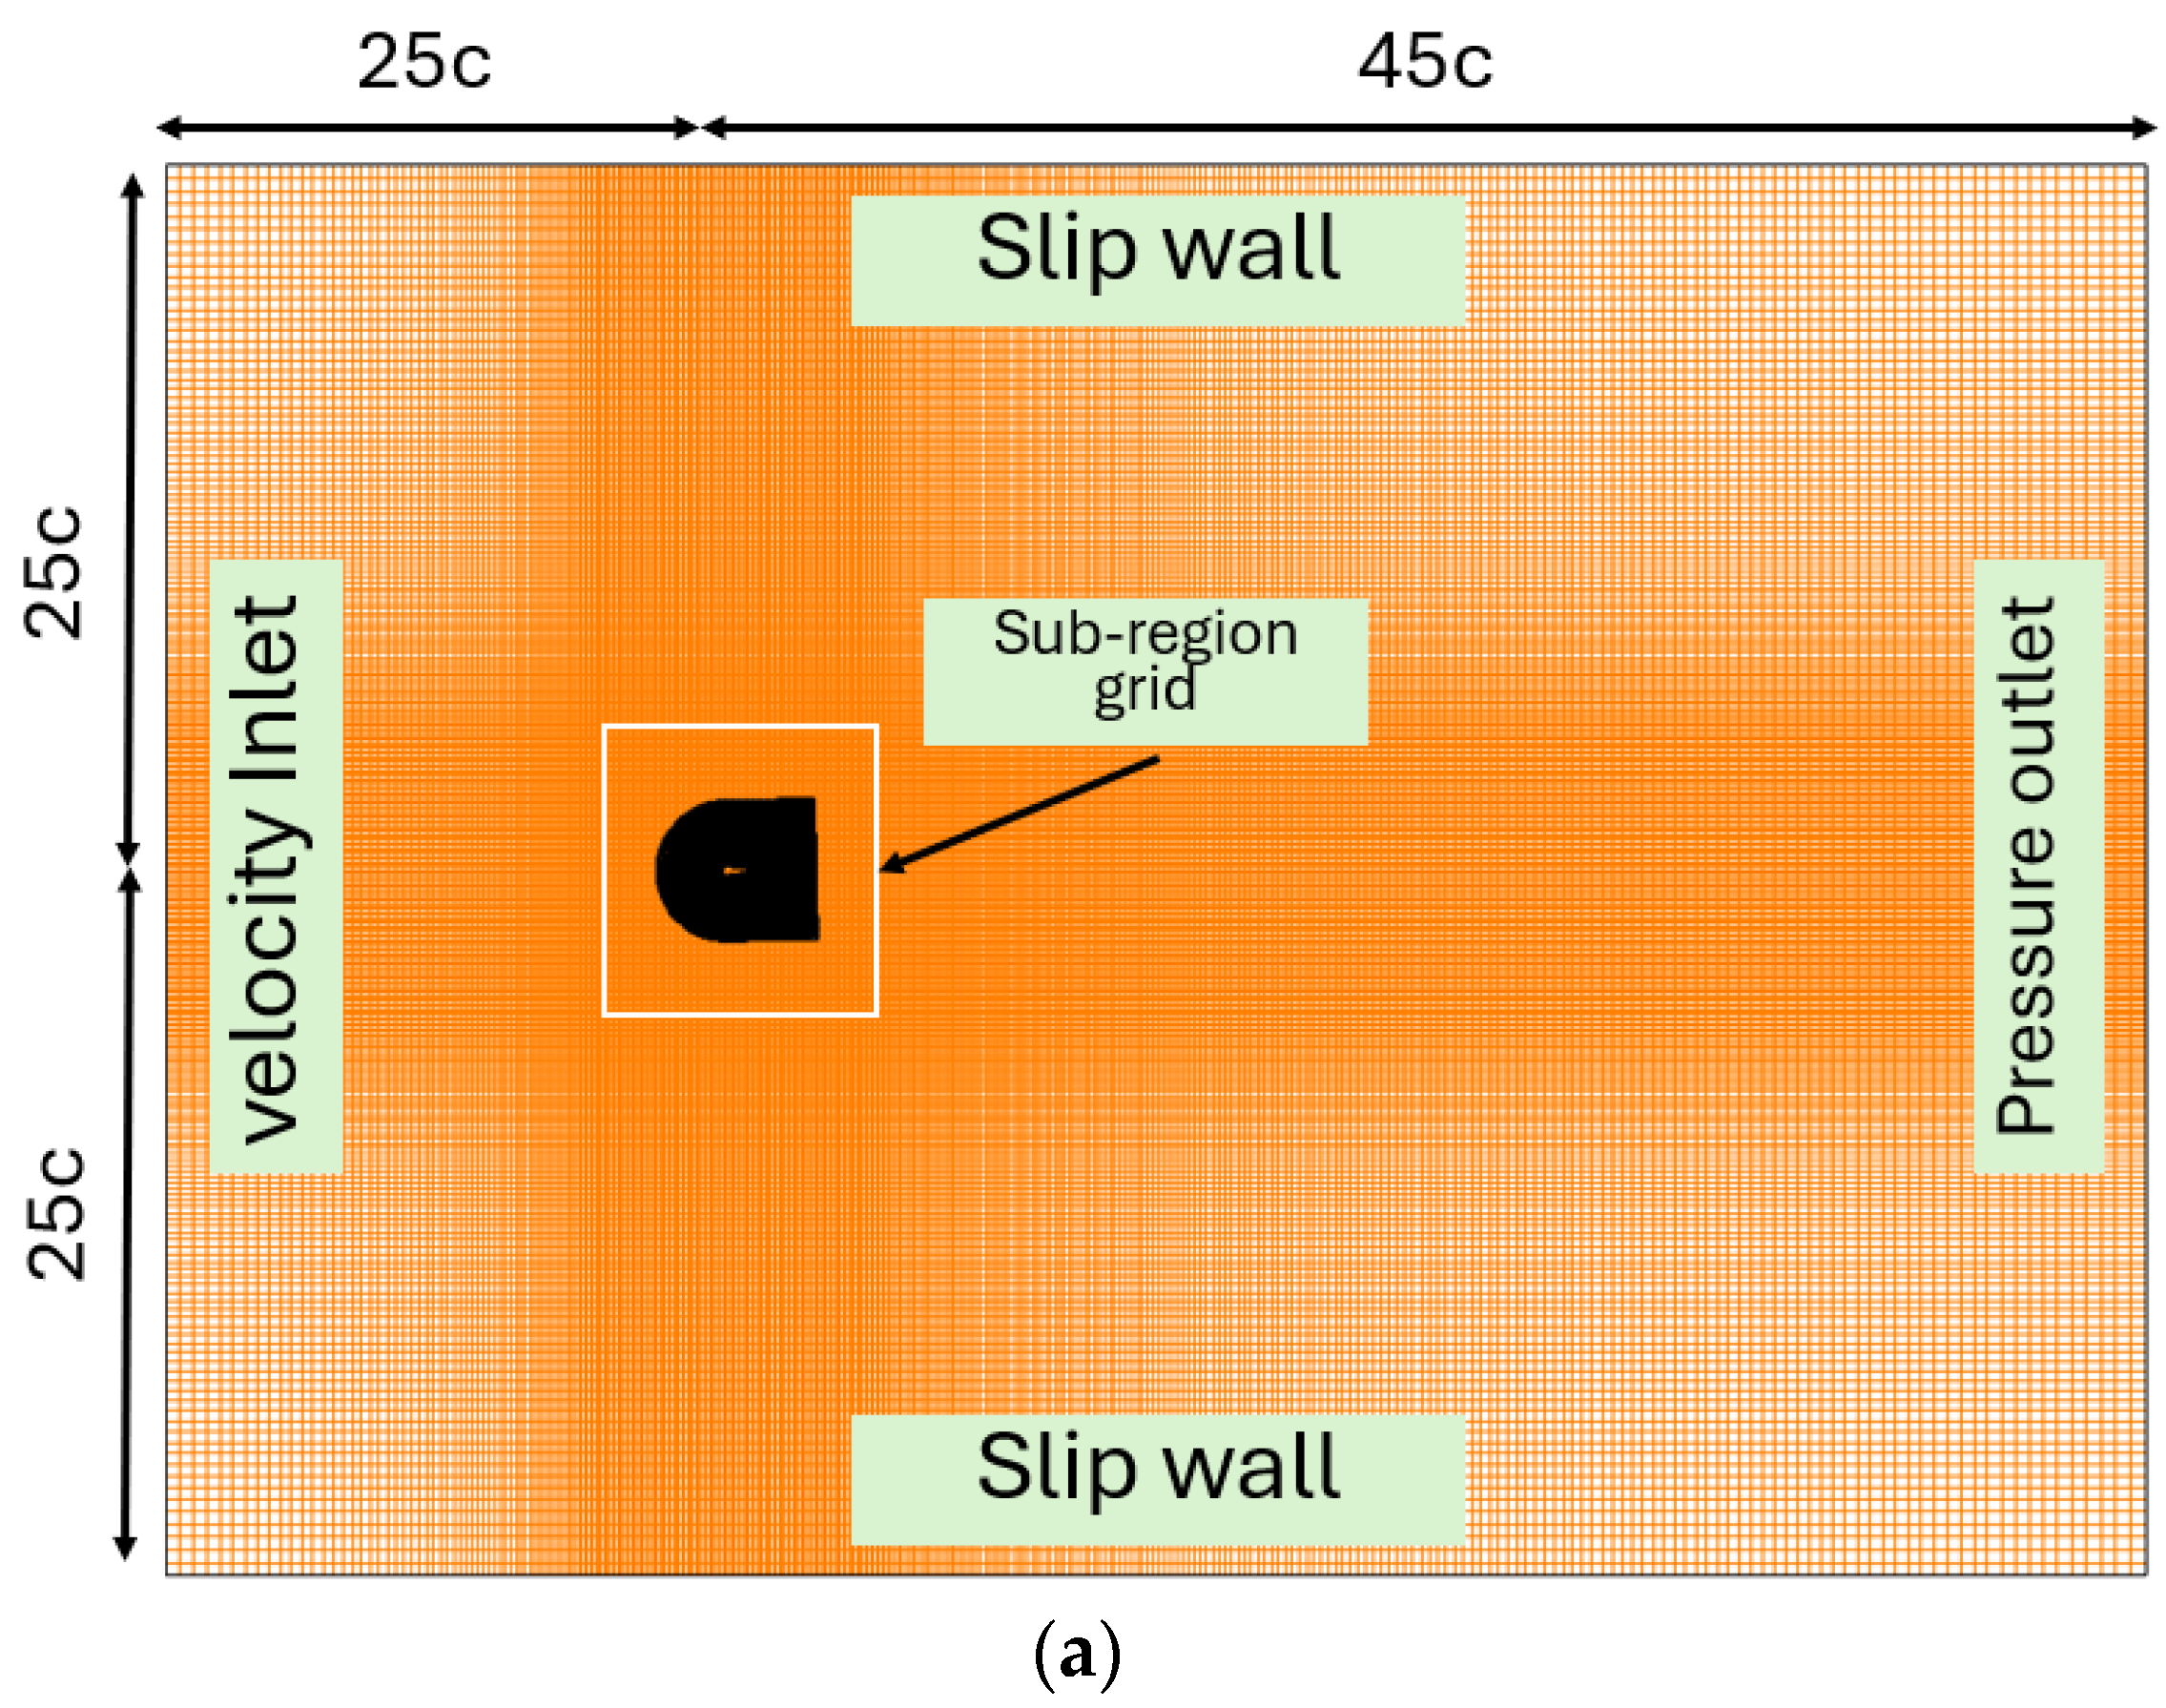
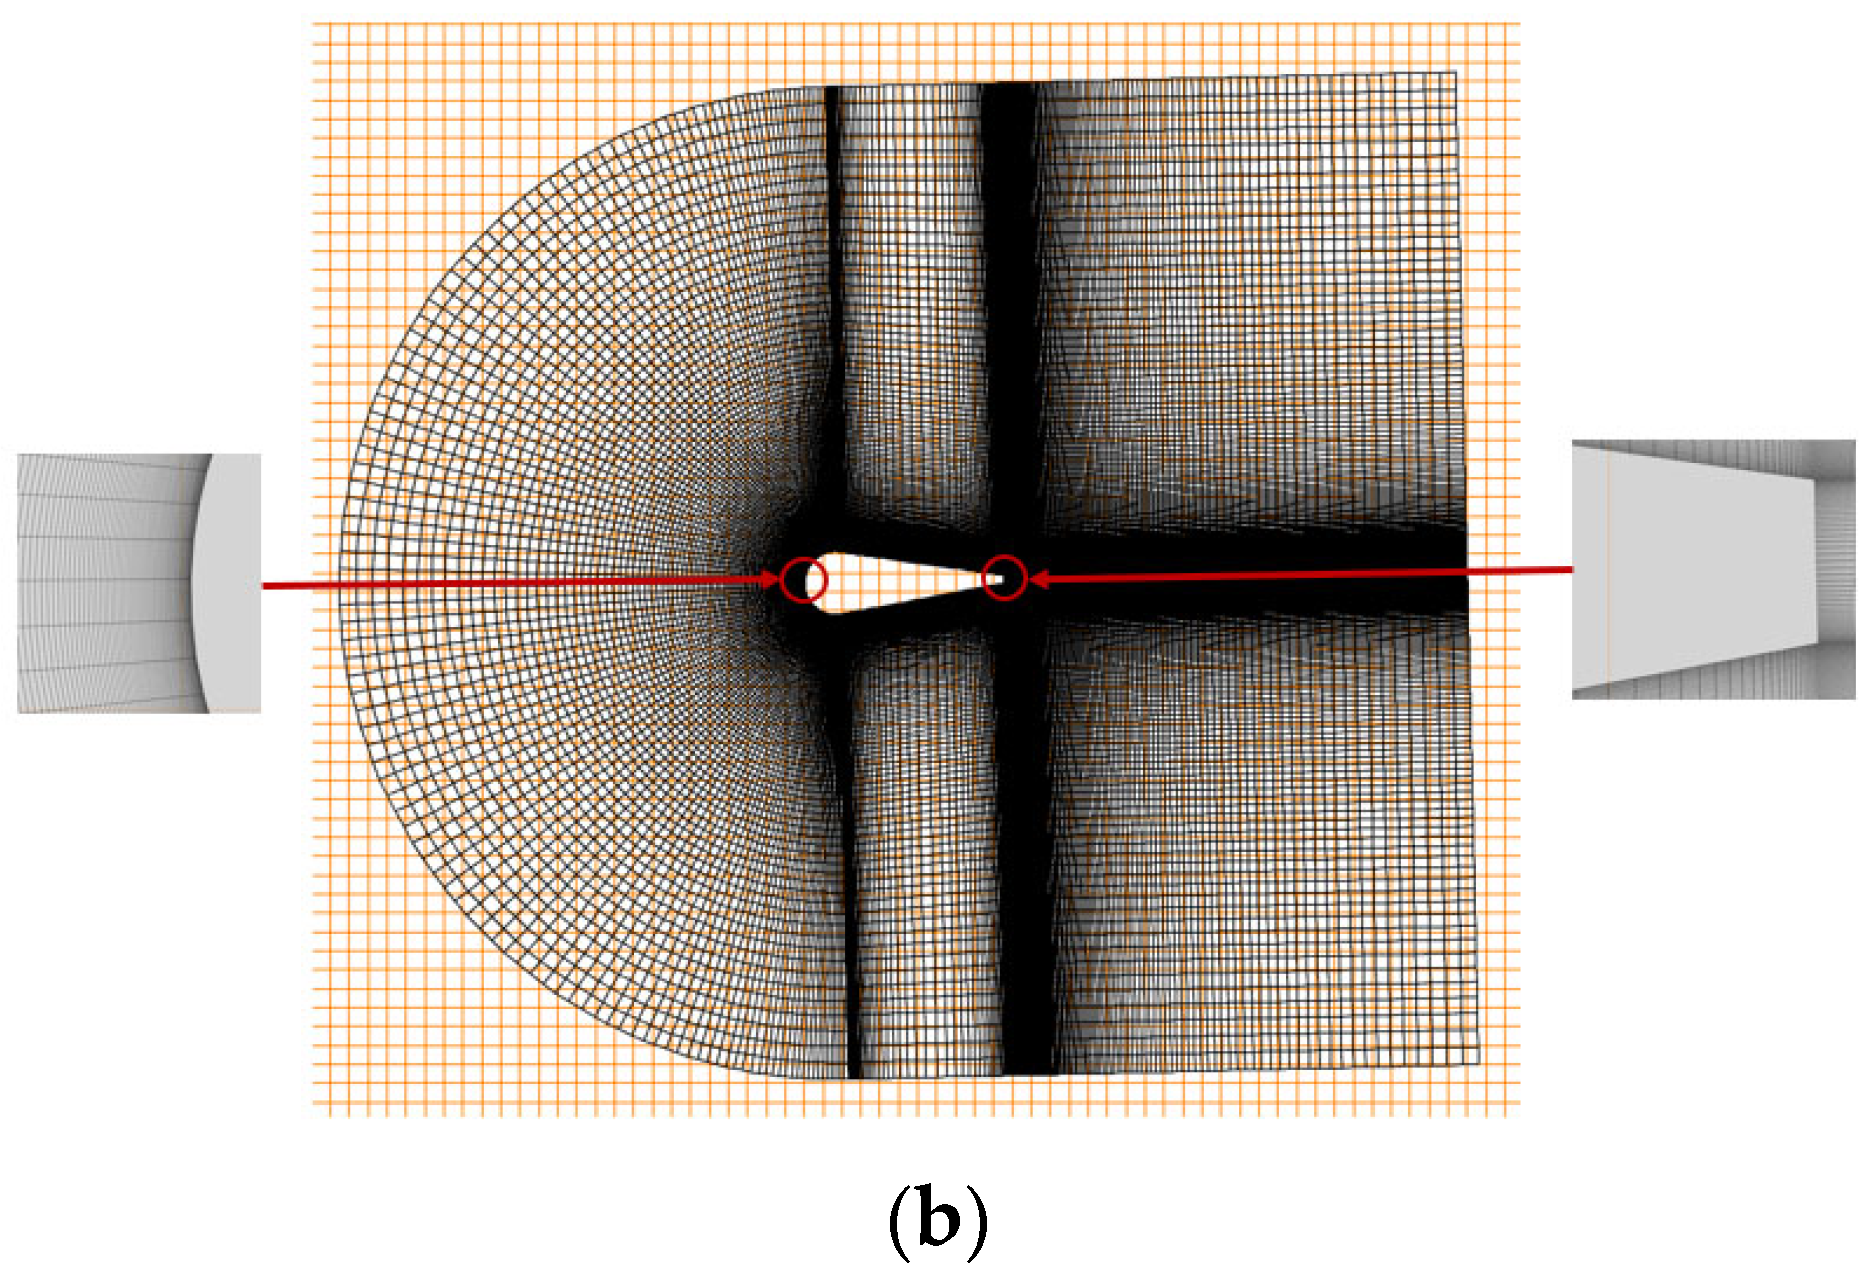
2. Numerical Methodology
3. Results and Discussion
3.1. Impact of the Leading-Edge Thickness on the Output Power
3.2. Impact of the Shape of the Flapping Wing on the Energy Extraction Performance
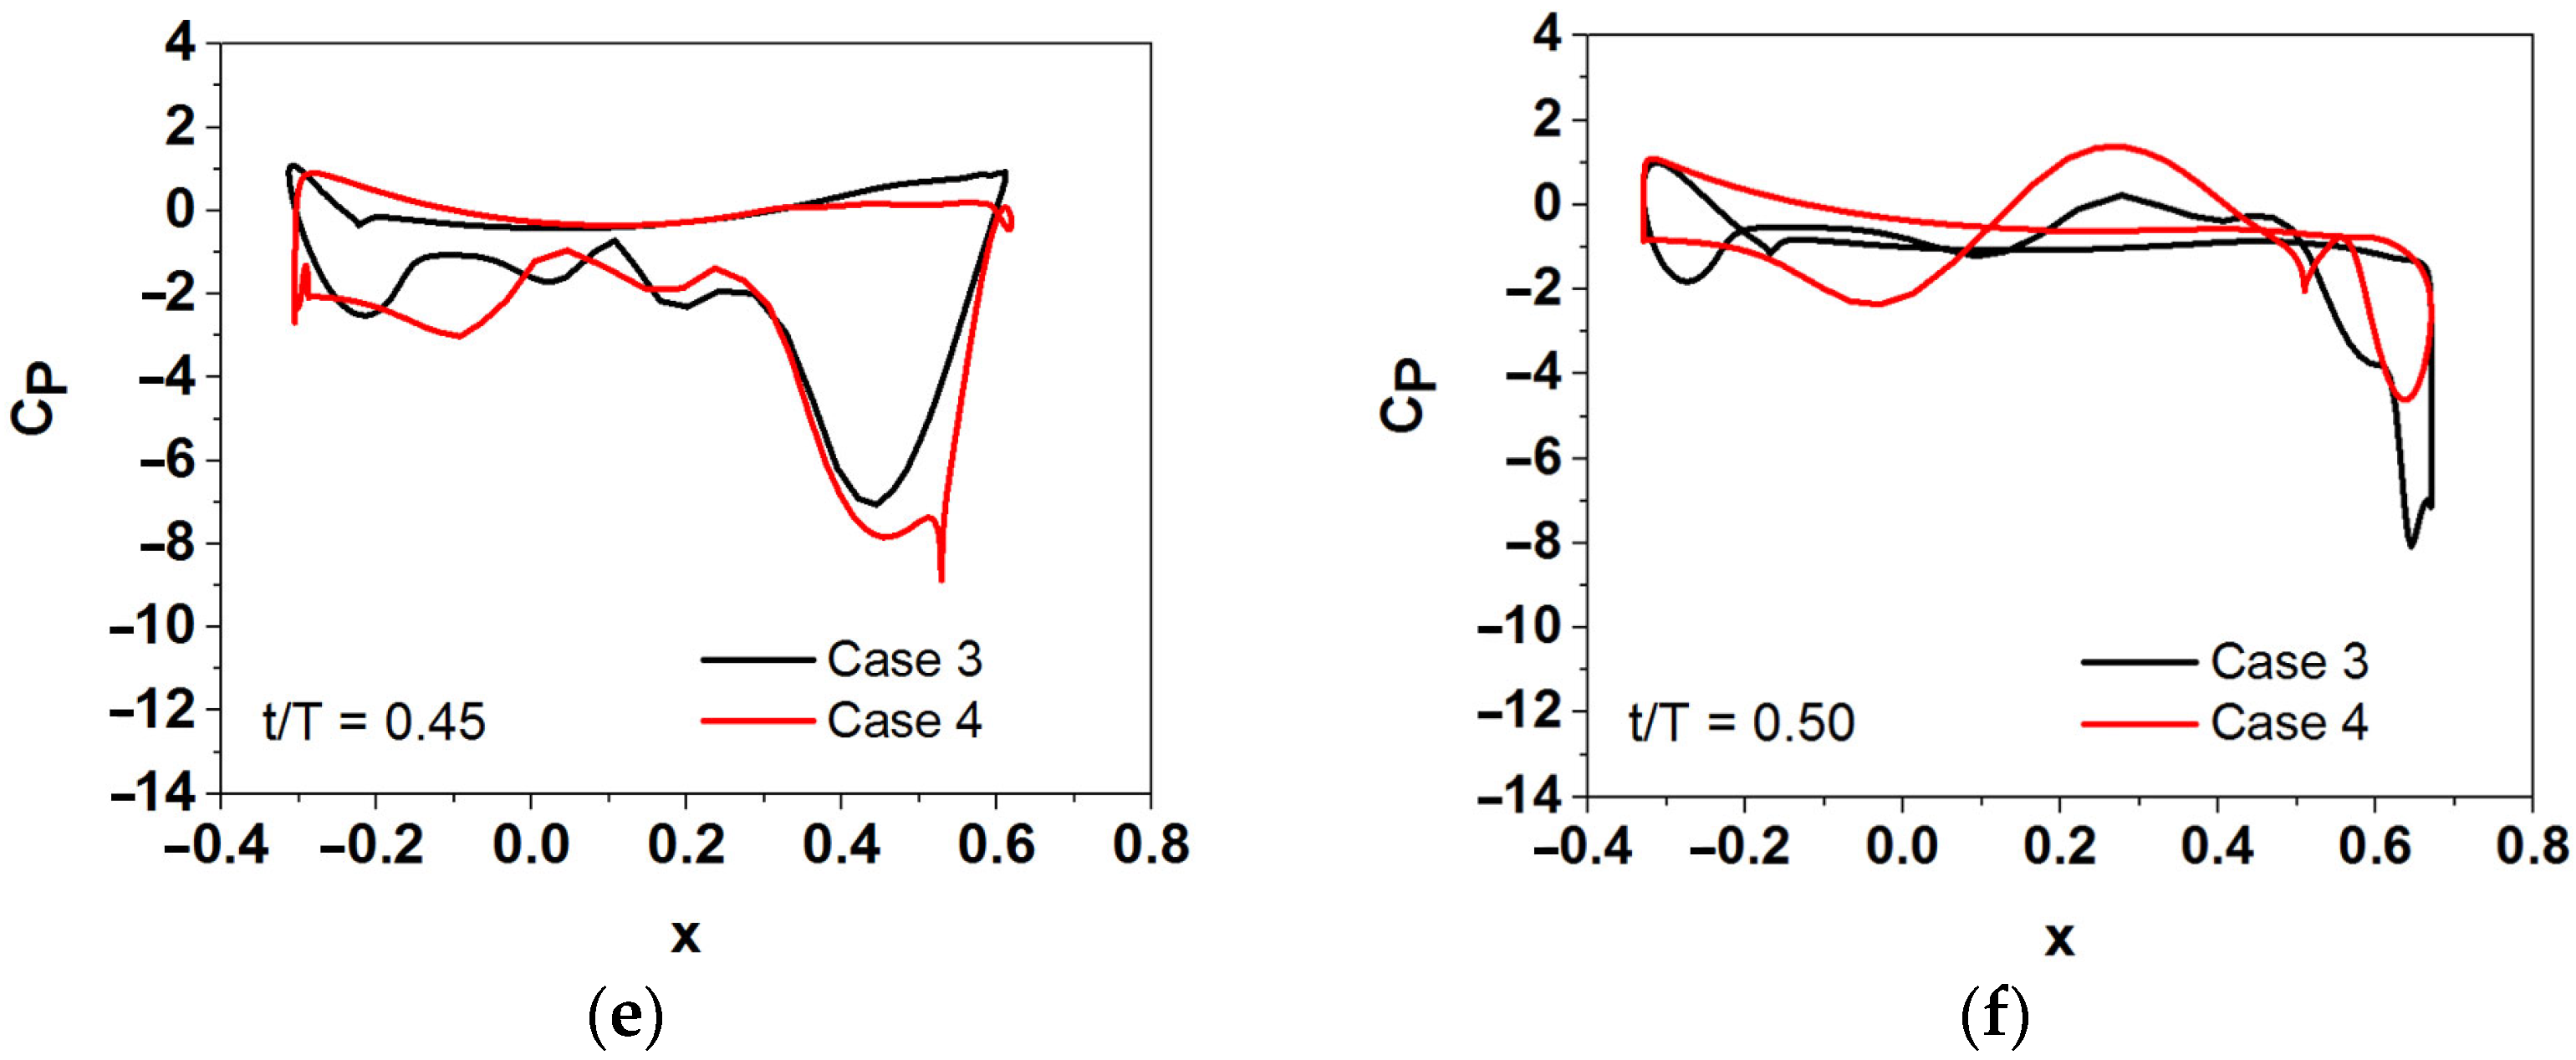
3.3. The Effect of Leading- and Trailing-Edge Shapes
4. Conclusions
Author Contributions
Funding
Data Availability Statement
Conflicts of Interest
Nomenclature
| Symbol | Description |
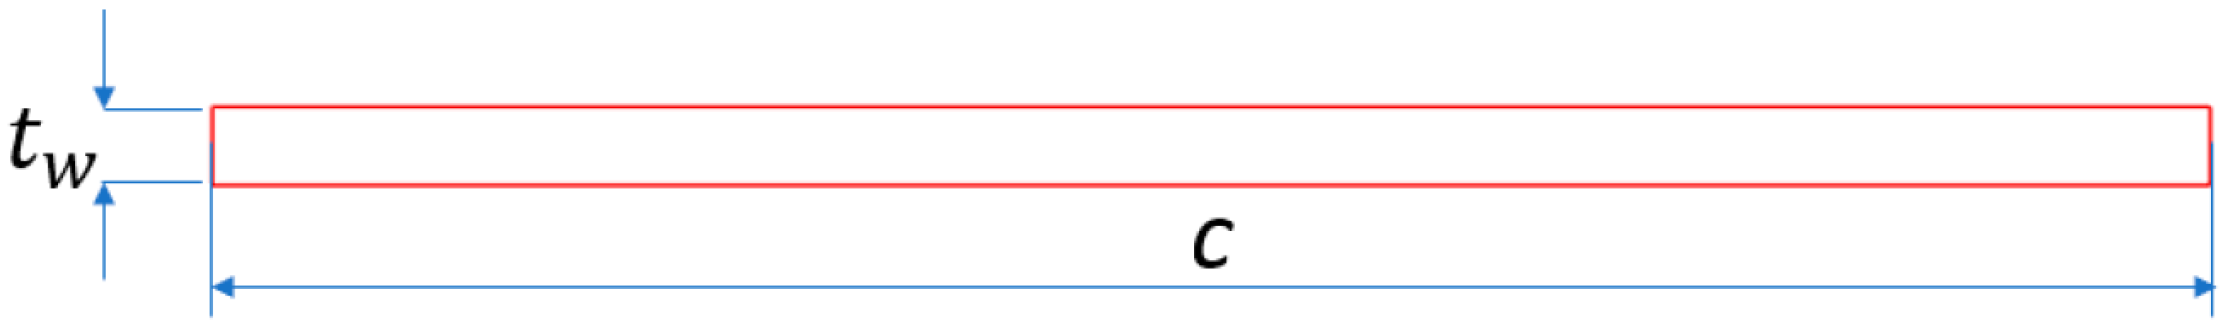
| Wing thickness | |
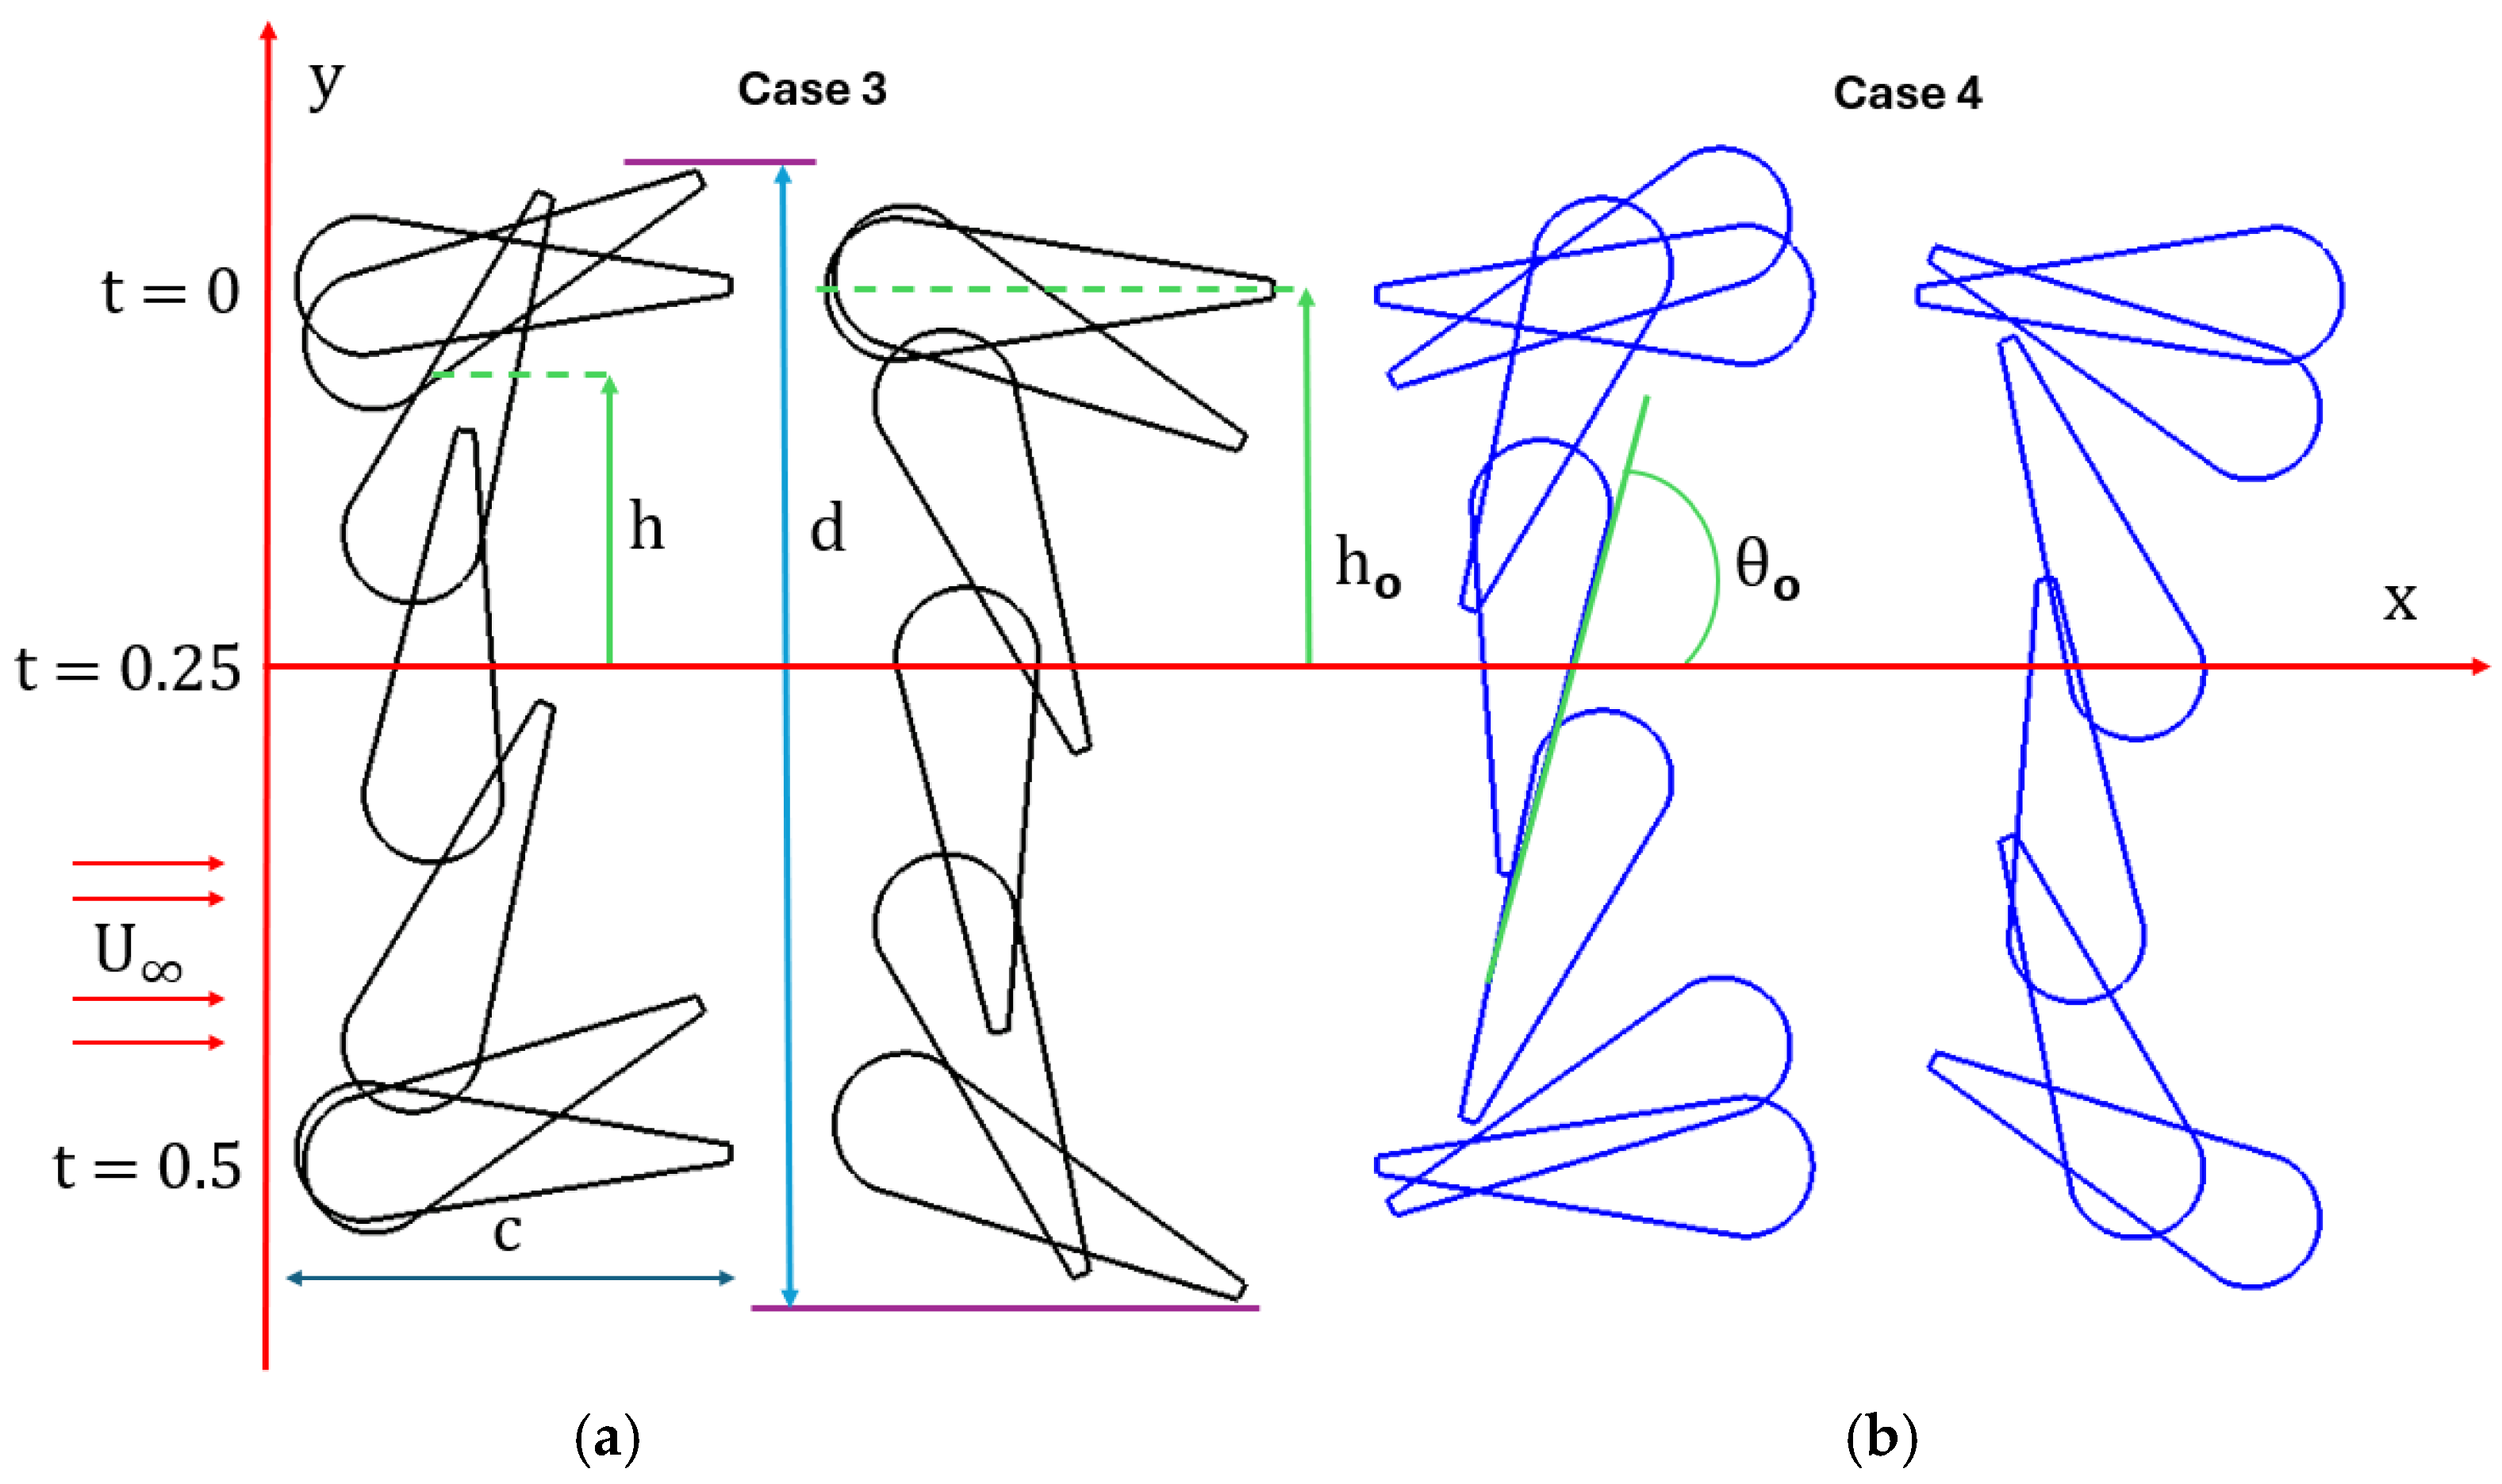
| d | Overall vertical displacement |
| x | Wing projected length along x-direction |
| Pitch point | |
| c | Chord length |
| h | Instantaneous heave amplitude |
| Maximum heaving amplitude | |
| θ(t) | Instantaneous pitch amplitude of the wing |
| θ0 | Maximum pitch amplitude of the wing |
| Instantaneous pitching amplitude of the leading flap | |
| Maximum pitching amplitude of the leading flap | |
| f | Oscillation frequency |
| Reduced frequency (fc/) | |
| ω | Angular frequency |
| Reynolds number | |
| St | Strouhal number |
| Phase angle | |
| ρ | Fluid density |
| Free stream velocity | |
| μ | Dynamic viscosity |
| Pushing force coefficient | |
| Moment coefficient | |
| Pushing power coefficient | |
| Pitching moment power coefficient | |
| Total power coefficient | |
| Y(t) | Pushing force |
| P | Power required |
| T | Time period |
| ƞ | Power extraction efficiency |
References
- Wu, T.Y.-T. Extraction of flow energy by a wing oscillating in waves. J. Ship Res. 1972, 16, 66–78. [Google Scholar] [CrossRef]
- McKinney, W.; DeLaurier, J. Wingmill: An oscillating-wing windmill. J. Energy 1981, 5, 109–115. [Google Scholar] [CrossRef]
- Li, Y.; Pan, Z.; Zhang, N. Numerical analysis on the propulsive performance of oscillating wing in ground effect. Appl. Ocean Res. 2021, 114, 102772. [Google Scholar] [CrossRef]
- Hu, J.; Xuan, H.; Yu, Y.; Zhang, J. Effects of continuously increasing pitching and plunging amplitudes on the aerodynamic forces of flapping airfoils. AIP Adv. 2019, 9, 085008. [Google Scholar] [CrossRef]
- Qi, Z.; Jia, L.; Qin, Y.; Shi, J.; Zhai, J. Propulsion performance of the full-active flapping foil in time-varying freestream. Appl. Sci. 2020, 10, 6226. [Google Scholar] [CrossRef]
- Zhao, G.; Zhao, Q.; Chen, X. Wind-tunnel tests of synthetic jet control effects on airfoil flow separation. Sci. Rep. 2022, 12, 21994. [Google Scholar] [CrossRef]
- Zhiyong, L.; Zhenbing, L.; Qiang, L.; Yan, Z. Modulation of driving signals in flow control over an airfoil with synthetic jet. Chin. J. Aeronaut. 2020, 33, 3138–3148. [Google Scholar]
- Sun, G.; Wang, Y.; Xie, Y.; Lv, K.; Sheng, R. Research on the effect of a movable gurney flap on energy extraction of oscillating hydrofoil. Energy 2021, 225, 120206. [Google Scholar] [CrossRef]
- Mo, W.; He, G.; Wang, J.; Zhang, Z.; Gao, Y.; Zhang, W.; Sun, L.; Ghassemi, H. Hydrodynamic analysis of three oscillating hydrofoils with wing-in-ground effect on power extraction performance. Ocean Eng. 2022, 246, 110642. [Google Scholar] [CrossRef]
- Yang, H.; He, G.; Mo, W.; Wang, W. Energy Extraction Performance of Tandem Ground-effect Hydrofoils. IOP Conf. Ser. Earth Environ. Sci. 2021, 809, 012001. [Google Scholar]
- Zhu, B.; Zhang, J.; Zhang, W. Impact of the ground effect on the energy extraction properties of a flapping wing. Ocean Eng. 2020, 209, 107376. [Google Scholar] [CrossRef]
- Dong, L.; Xie, P.; Zhu, J.-Y.; Wang, C.; Zhang, P. Study on the power extraction performance of a flapping airfoil power generator using jet flow method. J. Braz. Soc. Mech. Sci. Eng. 2023, 45, 79. [Google Scholar] [CrossRef]
- Bai, Y.; Zheng, M. Energy harvesting characteristics of a flapping wing with the oscillating aspirators in uniform flows and shear flows. Energy Rep. 2022, 8, 9554–9568. [Google Scholar] [CrossRef]
- Yang, H.; He, G.; Mao, W.; Mo, W.; Ghassemi, H. Blockage effect and ground effect on oscillating hydrofoil. Ocean Eng. 2023, 286, 115680. [Google Scholar] [CrossRef]
- Hou, L.; Yang, P.; Du, D.; Zhu, B. An adaptive plate at flapping wing’s trailing edge in promoting energy extraction performance. J. Mech. Sci. Technol. 2021, 35, 591–600. [Google Scholar] [CrossRef]
- AlQadi, I.; Khalid, M.; Hafez, S. Aerodynamic performance studies with a trailing edge jet flap. In Proceedings of the 51st AIAA Aerospace Sciences Meeting including the New Horizons Forum and Aerospace Exposition, Grapevine, TX, USA, 7–10 January 2013; p. 239. [Google Scholar]
- Wang, G.; Ng, B.F. Energy harvesting performance of a tandem-hydrofoil based closely-interconnected tidal array. Energy Convers. Manag. 2023, 280, 116796. [Google Scholar] [CrossRef]
- Li, G.; Wu, J.; Zhang, Y.; Chen, L. Unsteady Aerodynamic Performance of Tandem Configurations of Three Flapping and Fixed Airfoils. Aerosp. Sci. Technol. 2025, 160, 110032. [Google Scholar] [CrossRef]
- Jiang, W.; Gao, X.; Hu, X.; Fang, D.; Chen, T.; Hou, Y. Performance Potential of Fully-passive Airborne Wind Energy System Based on Flapping Airfoil. Energy 2024, 306, 132231. [Google Scholar] [CrossRef]
- Petikidis, N.; Papadakis, G. Investigation of Submergence Depth and Wave-Induced Effects on the Performance of a Fully Passive Energy Harvesting Flapping Foil Operating Beneath the Free Surface. J. Mar. Sci. Eng. 2023, 11, 1559. [Google Scholar] [CrossRef]
- Alam, M.; Sohn, C.H. Parametric analysis of an oscillating wing energy harvester with a trailing edge flap. J. Mech. Sci. Technol. 2023, 37, 3563–3573. [Google Scholar] [CrossRef]
- He, G.; Mo, W.; Gao, Y.; Zhang, Z.; Wang, J.; Wang, W.; Liu, P.; Ghassemi, H. Modification of effective angle of attack on hydrofoil power extraction. Ocean Eng. 2021, 240, 109919. [Google Scholar] [CrossRef]
- Lv, Z.; Zhang, G.; Sun, X. Research on energy harvesting characteristics of a flapping foil with trailing edge jet flap. Appl. Ocean Res. 2024, 146, 103951. [Google Scholar] [CrossRef]
- Alam, M.; Sohn, C.H. Enhancing the Performance of an Oscillating Wing Energy Harvester Using a Leading-Edge Flap. J. Mar. Sci. Eng. 2023, 12, 62. [Google Scholar] [CrossRef]
- Zhang, S.; Yang, X.; Song, B.; Li, Z.; Wang, B. Experimental investigation of lift enhancement and drag reduction of discrete co-flow jet rotor airfoil. Appl. Sci. 2021, 11, 9561. [Google Scholar] [CrossRef]
- Wang, R.; Ma, X.; Zhang, G.; Ying, P.; Wang, X. Numerical simulation of continuous morphing wing with leading edge and trailing edge parabolic flaps. J. Aerosp. Eng. 2023, 36, 04023051. [Google Scholar] [CrossRef]
- Haolin, Z.; Zhenhao, Z.; Yujin, L.; Shuanghou, D.; Tianhang, X. Aerodynamic performance enhancement of co-flow jet airfoil with simple high-lift device. Chin. J. Aeronaut. 2021, 34, 143–155. [Google Scholar]
- Xu, K.; Zha, G. Enhancing aircraft control surface effectiveness by co-flow jet flap at low energy expenditure. Aerosp. Sci. Technol. 2023, 133, 108145. [Google Scholar] [CrossRef]
- Traub, L.W.; Agarwal, G. Aerodynamic characteristics of a Gurney/jet flap at low Reynolds numbers. J. Aircr. 2008, 45, 424–429. [Google Scholar] [CrossRef]
- Swain, P.K.; Dora, S.P.; Barik, A.K. Energy extraction performance of tandem flapping foil undergoing elliptical motion trajectory. Ocean Eng. 2023, 268, 113390. [Google Scholar] [CrossRef]
- Liu, F.-R.; Zhang, W.-M.; Zhao, L.-C.; Zou, H.-X.; Tan, T.; Peng, Z.-K.; Meng, G. Performance enhancement of wind energy harvester utilizing wake flow induced by double upstream flat-plates. Appl. Energy 2020, 257, 114034. [Google Scholar] [CrossRef]
- Sitorus, P.E.; Ko, J.H. Power extraction performance of three types of flapping hydrofoils at a Reynolds number of 1.7 E6. Renew. Energy 2019, 132, 106–118. [Google Scholar] [CrossRef]
- Saleh, S.; Sohn, C.-H. Numerically Investigating the Energy-Harvesting Performance of an Oscillating Flat Plate with Leading and Trailing Flaps. Energies 2024, 17, 3010. [Google Scholar] [CrossRef]
- Xiao, Q.; Liao, W.; Yang, S.; Peng, Y. How motion trajectory affects energy extraction performance of a biomimic energy generator with an oscillating foil? Renew. Energy 2012, 37, 61–75. [Google Scholar] [CrossRef]
- Lu, K.; Xie, Y.; Zhang, D. Nonsinusoidal motion effects on energy extraction performance of a flapping foil. Renew. Energy 2014, 64, 283–293. [Google Scholar] [CrossRef]
- Davids, S.T. A Computational and Experimental Investigation of a Flutter Generator. Doctoral Dissertation, Naval Postgraduate School, Monterey, CA, USA, 1999. [Google Scholar]
- Li, Y.; Zhou, G.; Wu, J. Synthetic jet control on the propulsion behavior of a foil in plunge-pitch motion. J. Bionic Eng. 2020, 17, 303–314. [Google Scholar] [CrossRef]
- Kinsey, T.; Dumas, G. Parametric study of an oscillating airfoil in a power-extraction regime. AIAA J. 2008, 46, 1318–1330. [Google Scholar] [CrossRef]
- Bashir, M.; Longtin-Martel, S.; Botez, R.M.; Wong, T. Aerodynamic design optimization of a morphing leading edge and trailing edge airfoil–application on the uas-s45. Appl. Sci. 2021, 11, 1664. [Google Scholar] [CrossRef]
- Shen, Y.; Xu, Y.; Zhang, S.; Chen, T.; Huang, W.; Shi, Q. Aerodynamic analysis of complex flapping motions based on free-flight biological data. Bioinspiration Biomim. 2025, 20, 026002. [Google Scholar] [CrossRef]
- Belkacem, L.; Laala, G.; Taher, B.M.; Zereg, A.; Nora, B.; Eddine, B.D. New Kinematic of Droop-Nose Leading-Edge (DNLE) to Increase the Extracted Power by Flapping Wing. J. Inst. Eng. Ser. C 2025, 106, 609–623. [Google Scholar] [CrossRef]
- Wang, F.; Zhu, B.; Xiao, Q.; Zhang, W.; Zhang, H. Numerical analysis of energy harvesting property and wake evolution characteristics for semi-passive flapping airfoil with various pitching amplitudes. Meccanica 2025, 60, 271–293. [Google Scholar] [CrossRef]
- Soto, C.; Bhattacharya, S. The effect of dynamic twisting on the flow field and the unsteady forces of a heaving flat plate. Bioinspiration Biomim. 2023, 18, 026010. [Google Scholar] [CrossRef]
- Joshi, K.; Bhattacharya, S. The unsteady force response of an accelerating flat plate with controlled spanwise bending. J. Fluid Mech. 2022, 933, A56. [Google Scholar] [CrossRef]
- Li, W.; Wang, W.-Q.; Yan, Y.; Tian, F.-B. Effects of pitching motion profile on energy harvesting performance of a semi-active flapping foil using immersed boundary method. Ocean Eng. 2018, 163, 94–106. [Google Scholar] [CrossRef]
- Deng, J.; Teng, L.; Pan, D.; Shao, X. Inertial effects of the semi-passive flapping foil on its energy extraction efficiency. Phys. Fluids 2015, 27, 053103. [Google Scholar] [CrossRef]
- Teng, L.; Deng, J.; Pan, D.; Shao, X. Effects of non-sinusoidal pitching motion on energy extraction performance of a semi-active flapping foil. Renew. Energy 2016, 85, 810–818. [Google Scholar] [CrossRef]
- Lv, Z.; Sun, X. Performance enhancement of a semi-active flapping foil energy harvester via airfoil with modified trailing edge and jet flap. Ocean Eng. 2024, 312, 119080. [Google Scholar] [CrossRef]
- Saleh, S.; Sohn, C.-H. Power Extraction Performance by a Hybrid Non-Sinusoidal Pitching Motion of an Oscillating Energy Harvester. Energies 2024, 17, 2451. [Google Scholar] [CrossRef]
- Saleh, S.; Sohn, C.-H. Enhanced Power Extraction via Hybrid Pitching Motion in an Oscillating Wing Energy Harvester with Leading Flap. Energies 2024, 17, 6108. [Google Scholar] [CrossRef]
- Saleh, S.; Sohn, C.-H. Investigating the Power Extraction of Applying Hybrid Pitching Motion on a Wing with Leading and Trailing Flaps. Actuators 2025, 14, 62. [Google Scholar] [CrossRef]
- Zheng, M.; Yao, H.; Bai, Y.; Bo, Q.; Chi, X.; Chen, J. The power-extraction regime of a figure-eight trajectory flapping-foil turbine. Phys. Fluids 2024, 36, 025136. [Google Scholar] [CrossRef]
- Tian, C.; Liu, X. Numerical study on the energy extraction characteristics of a flapping foil with movable lateral flaps. Renew. Energy 2024, 225, 120244. [Google Scholar] [CrossRef]
- Usoh, C.; Young, J.; Lai, J.; Ashraf, M. Numerical analysis of a non-profiled plate for flapping wing turbines. In Proceedings of the 18th Australasian Fluid Mechanics Conference, Launceston, Australia, 3–7 December 2021. [Google Scholar]
- Chern, M.-J.; Chou, T.-Y.; Tewolde, D.G.; Suprianto, F.D. Fully Passive Energy Harvesting from Heaving and Pitching Airfoils: Oscillation Response Patterns and Vortex Dynamics in Fluid Flow. J. Fluids Struct. 2025, 133, 104255. [Google Scholar] [CrossRef]
- Kloos, G.; Gonzalez, C.; Finnigan, T. The bioSTREAM tidal current energy converter. In Proceedings of the 8th European Wave and Tidal Energy Conference EWTEC, Uppsala, Sweden, 7–10 September 2009. [Google Scholar]
- Tidal Devices: EMEC: The European Marine Energy Centre Ltd. Available online: https://www.emec.org.uk/marine-energy/tidal-devices/ (accessed on 23 August 2024).
- DualWingGenerator, F. Available online: https://www.festo.com/ch/en/e/about-festo/research-and-development/bionic-learning-network/highlights-from-2013-to-2014/dualwinggenerator-id_33589/ (accessed on 23 August 2024).
- Wang, B.; Zhu, B.; Zhang, W. New type of motion trajectory for increasing the power extraction efficiency of flapping wing devices. Energy 2019, 189, 116072. [Google Scholar] [CrossRef]
- Ansys, I. ANSYS Fluent User’s Guide, Release 2021 R1; Ansys, Inc.: Canonsburg, PA, USA, 2021. [Google Scholar]
- Kinsey, T.; Dumas, G. Computational fluid dynamics analysis of a hydrokinetic turbine based on oscillating hydrofoils. J. Fluids Eng. 2012, 134, 021104. [Google Scholar] [CrossRef]
- Alam, M.; Sohn, C.H. Enhanced Performance of Oscillating Wing Energy Harvester Using Active Controlled Flap. J. Mech. Sci. Technol. 2023, 37, 2405–2415. [Google Scholar] [CrossRef]


| Description | Symbol | Value |
|---|---|---|
| Time | t | |
| Thickness of the flat plate | 4%c | |
| Thickness | T1 | (8%–48%c) |
| Chord length | c | 1.0 |
| Pivot point | c/3 | |
| Heaving amplitude | /c | 1.0 |
| Frequency | ||
| Angular frequency | ω = 2πf | |
| Reduced frequency | = | 0.14 |
| Reynolds number | = | 500,000 |
| Strouhal number | St = | 0.28 |
| Phase angle | 90° |
| Mesh Type | Element Count | Time Step/Cycle | (%) Variation with Grid | (%) Variation with Time Step | η (%) | ||
|---|---|---|---|---|---|---|---|
| Wing | Background | ||||||
| Coarse | 0.6 × | 0.3 × | 2000 | 0.891 | 34.53 | ||
| Medium | 1.2 × | 0.6 × | 500 | 0.904 | 35.03 | ||
| 2000 | 0.887 | 0.44 | 1.88 | 34.37 | |||
| 4000 | 0.883 | 0.45 | 34.22 | ||||
| Fine | 2.6 × | 1.2 × | 2000 | 0.886 | 0.11 | 34.34 | |
| Case Number | Pitch Angle | Thickness | η (%) | (%) Increment | η (%) Increment | |||
|---|---|---|---|---|---|---|---|---|
| Baseline case | 75° | 4%c | 0.96 | 0.08 | 1.04 | 40.31 | ||
| Case 1 | 85° | 32%c | 1.163 | 0.043 | 1.206 | 45.61 | 15.96 | 13.14 |
| Case 2 | 85° | 32%c | 0.656 | −0.086 | 0.570 | 19.86 | −45.19 | −50.73 |
| Case 3 | 85° | 32%c | 1.194 | 0.020 | 1.214 | 45.46 | 16.73 | 12.77 |
| Case 4 | 85° | 32%c | 0.789 | 0.075 | 0.865 | 31.59 | −16.82 | −21.63 |
| Case 5 | 85° | 32%c | 0.521 | 0.435 | 0.956 | 35.80 | −8.07 | −11.18 |
| Case 6 | 85° | 32%c | 0.866 | −0.227 | 0.639 | 23.93 | −38.55 | −40.63 |
Disclaimer/Publisher’s Note: The statements, opinions and data contained in all publications are solely those of the individual author(s) and contributor(s) and not of MDPI and/or the editor(s). MDPI and/or the editor(s) disclaim responsibility for any injury to people or property resulting from any ideas, methods, instructions or products referred to in the content. |
© 2025 by the authors. Licensee MDPI, Basel, Switzerland. This article is an open access article distributed under the terms and conditions of the Creative Commons Attribution (CC BY) license (https://creativecommons.org/licenses/by/4.0/).
Share and Cite
Saleh, S.; Sohn, C.-H. Investigating the Effects of Leading- and Trailing-Edge Shapes of a Flapping Wing on Power Extraction Performance. Energies 2025, 18, 2749. https://doi.org/10.3390/en18112749
Saleh S, Sohn C-H. Investigating the Effects of Leading- and Trailing-Edge Shapes of a Flapping Wing on Power Extraction Performance. Energies. 2025; 18(11):2749. https://doi.org/10.3390/en18112749
Chicago/Turabian StyleSaleh, Suleiman, and Chang-Hyun Sohn. 2025. "Investigating the Effects of Leading- and Trailing-Edge Shapes of a Flapping Wing on Power Extraction Performance" Energies 18, no. 11: 2749. https://doi.org/10.3390/en18112749
APA StyleSaleh, S., & Sohn, C.-H. (2025). Investigating the Effects of Leading- and Trailing-Edge Shapes of a Flapping Wing on Power Extraction Performance. Energies, 18(11), 2749. https://doi.org/10.3390/en18112749