1. Introduction
Achieving a highly reliable transmission network and utility of electrical installation is possible mainly through the use of leading manufacturers’ equipment, the reliability of which is confirmed by many safety tests predicting the possibility of various unforeseen situations of potential danger. These situations are mainly caused by various factors, such as human errors, current overloads or short circuits, occurring in various network operation scenarios. Disturbances caused by overloads and short circuits are manifested by an increase in operating parameters to values exceeding the nominal parameters of the network system’s operating elements; the impact of these factors can lead to their damage. The use of protective devices in network systems reduces the risk of occurrence of the above-mentioned phenomena, thus significantly extending the life of the installation. The most commonly used elements protecting LV power systems against potential dangers are circuit breakers. Depending on the intended rated currents, air circuit breakers, compact circuit breakers and modular overcurrent circuit breakers are distinguished. Compact circuit breakers, thanks to their specific design, effectively protect circuits against the effects of overload currents and short circuits while allowing the creation of a safe insulation break. This is achieved by using thermo-magnetic break-off mechanisms during overload currents and short circuits. A characteristic feature of this category of devices is a wide range of dedicated additional equipment, such as trip units, rotary and motor drives, which allows remote control. Currently, it is difficult to imagine the functioning of design departments in many industries without access to environments supporting design and analysis in a 3D environment, such as computer-aided design and computer-aided engineering (CAD and CAE). The software with a wide range of possibilities used during the design of 3D models of advanced structures is ANSYS. This software also allows for conducting advanced simulation analyses based on the 3D models created and subjecting them to advanced coupled analyses. The development of a 3D model (
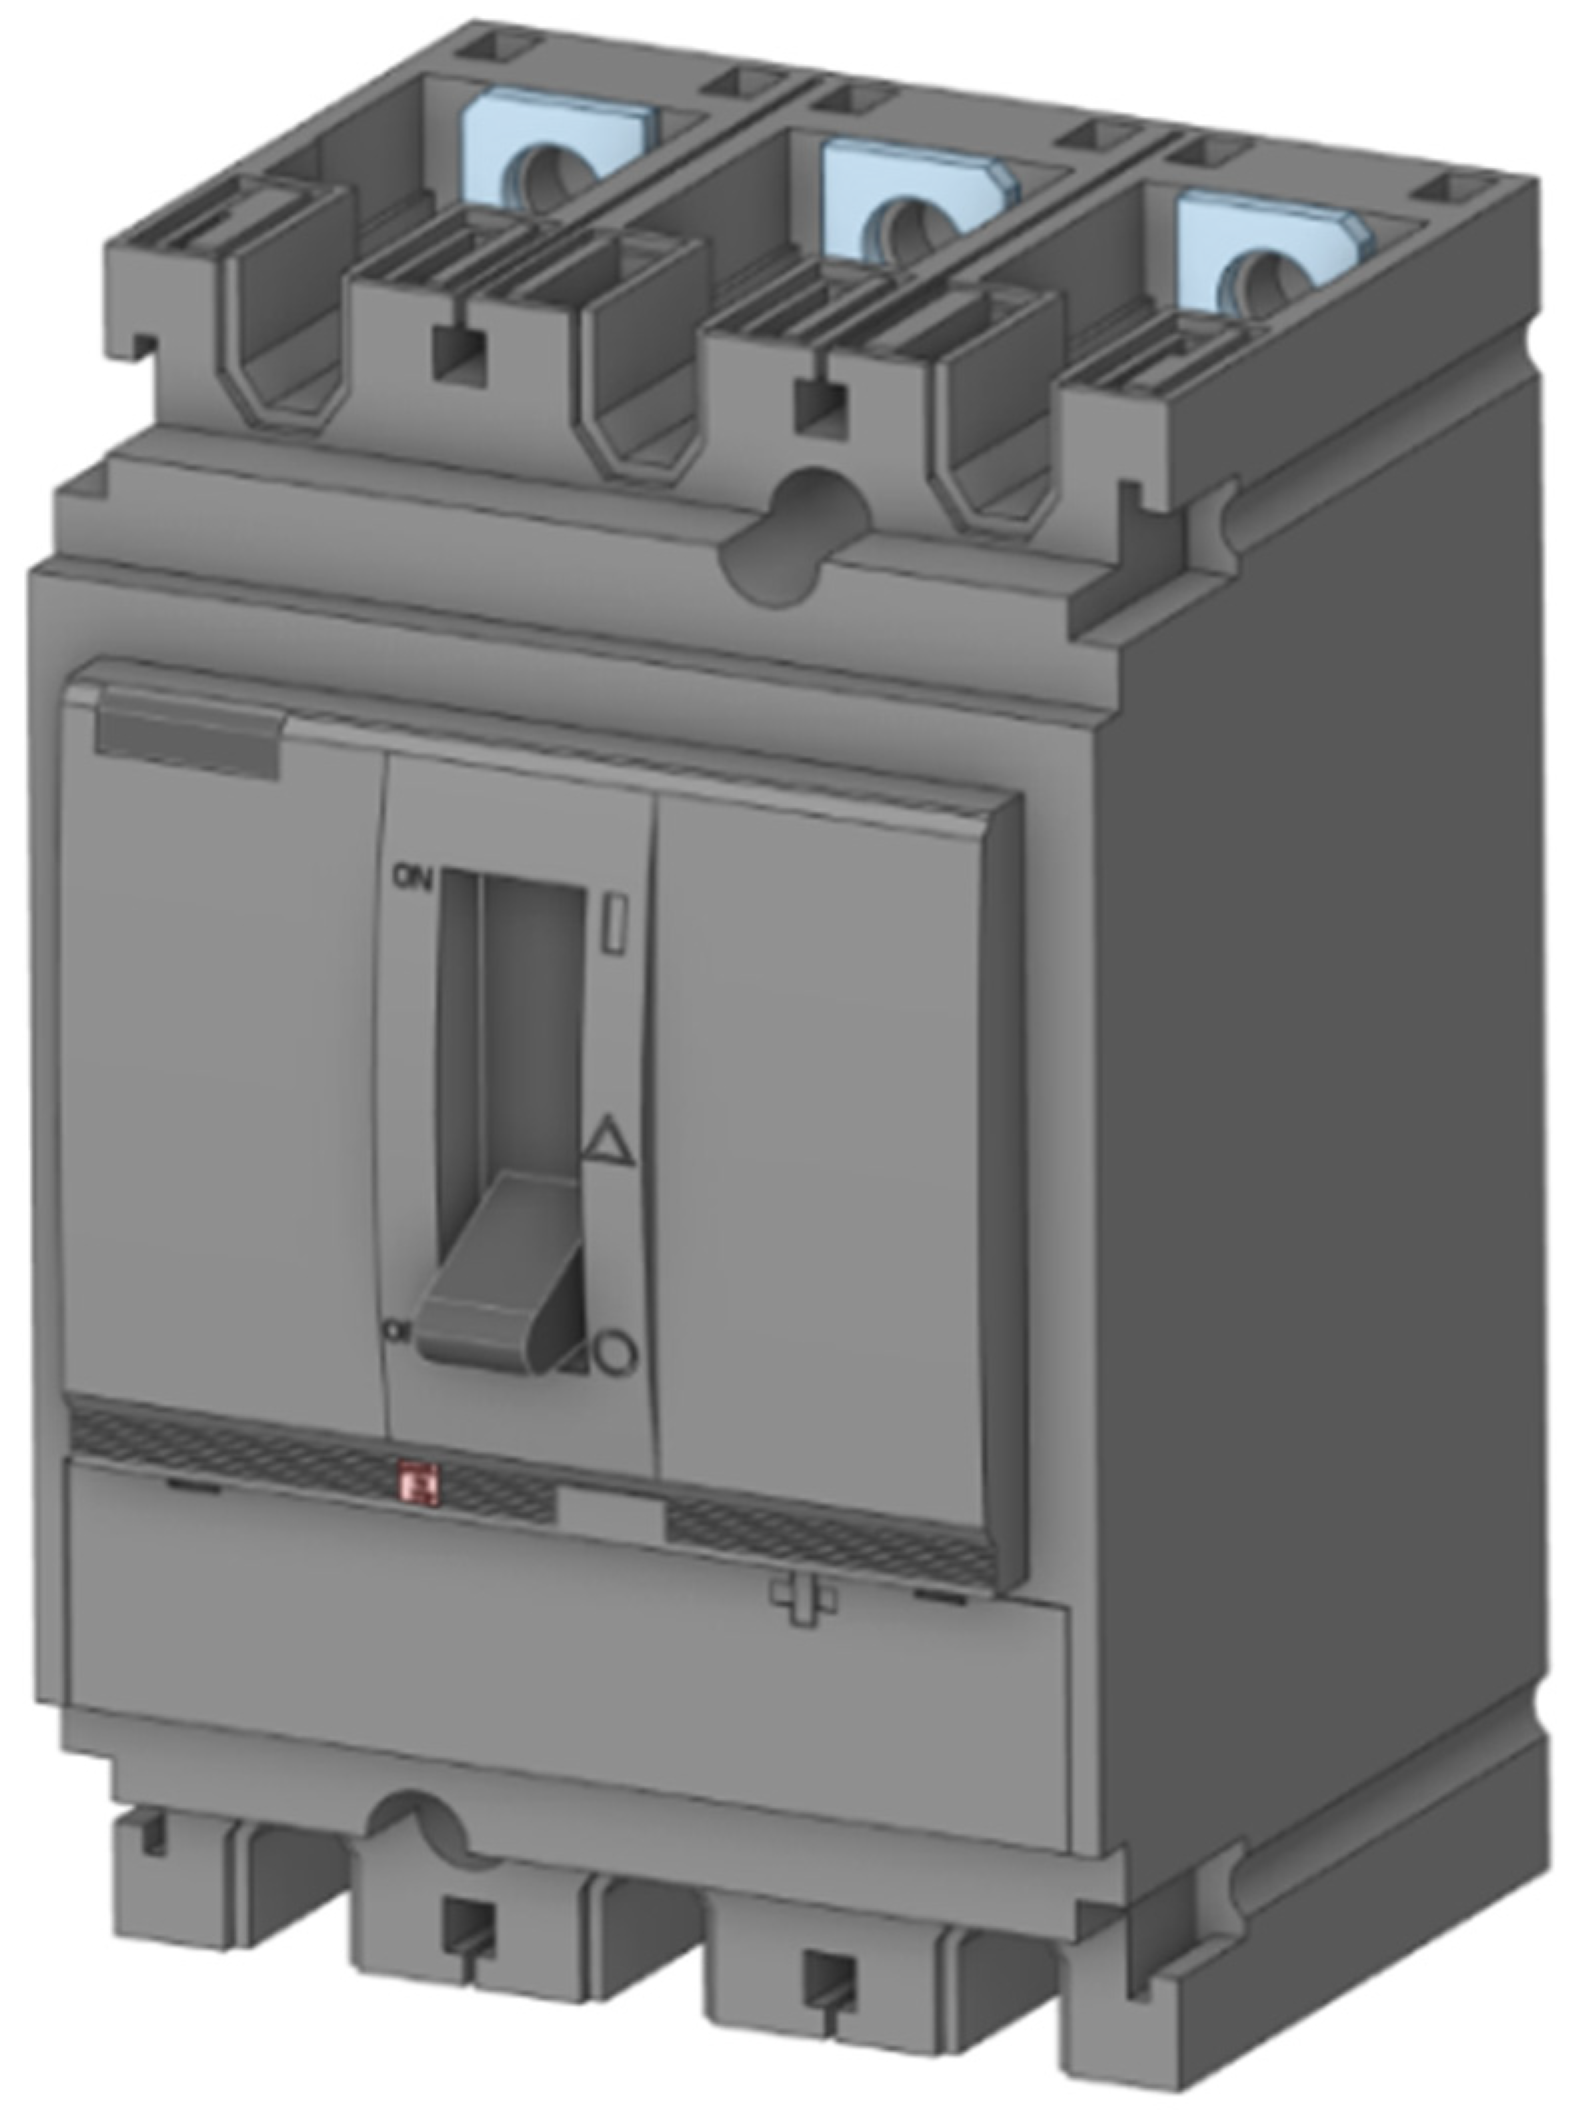
Figure 1 below) characterized by a high accuracy of the physical representation of the NSX 250F compact circuit breaker with a rated current of 250 A was achieved by using ANSYS software (2024 R1). Creating such an accurate model allowed for conducting coupled simulation analyses, allowing for examining the influence of the current flowing through individual elements of the current path of the analyzed circuit breaker and the temperature distribution over time. In order to validate the obtained results, a classic analysis was performed on the real circuit breaker model in relation to the simulations performed. For this purpose, thermocouples placed on the working elements of the tested current path were used; the signals generated by the measuring system were recorded using a temperature recorder. The induction temperature distribution on the circuit breaker elements was compared with the FEM simulation results. During the simulation and experimental considerations, only the case of flow through the current path of the circuit breaker with a rated current, i.e.,: In = 250 A, was analyzed.
In publication [
1], the authors present the molded case circuit breaker (MCCB) as a protective device used in low-voltage power distribution systems. It is capable of conducting and interrupting the current under both normal and fault conditions. During normal operation, the current flowing through the MCCB’s conductive elements causes heat generation, leading to a temperature increase within the device. For safe operation, this temperature must remain within the limits defined by relevant standards. The proposed three-dimensional thermal model was initially analyzed using ANSYS software and subsequently validated through experimental testing [
1]. This work provides a valuable foundation for further research. Our study aims to supplement and expand upon the findings presented in [
1].
The significance of research into MCCB devices is further underscored by the issue of partial discharges. As highlighted in [
2], ongoing miniaturization—accompanied by increased power density and operating voltages—leads to insulation degradation, primarily due to material outgassing. Thermal studies and material analyses are thus essential for optimizing the design of both modular and compact circuit breakers.
In [
3], the authors investigate the thermal effects resulting from voltage increases across phases, which may lead to damage within the MCCB. Their findings point to the need for continued research on the thermal reliability of protection devices under abnormal operating conditions.
Publication [
4] brings attention to the increasing integration of advanced technologies in both residential and industrial sectors. Compared to a decade ago, these systems place a significantly higher load on the power grid. Because modern equipment is costly, it is essential to protect it from all types of disturbances in the power supply. The protective system, including the MCCB, plays a vital role in ensuring reliable and safe operation. If the temperature within the MCCB exceeds a critical threshold without triggering a trip response, it may result in equipment damage. In [
4], the authors analyze the thermal dissipation capabilities of the heating element and bimetallic strip under standard operating conditions, which is particularly relevant to the present research.
The focus of our publication is the contact system within the MCCB. Nonetheless, valuable insights are also drawn from the modeling of physical phenomena and the design of arc quenching chambers. In [
5], the authors propose an innovative arc chamber design aimed at improving gas evacuation when an electric arc is generated during switching operations. Typically, the arc chamber must cool and fragment the arc through magnetic-force-driven movement. The new design introduces variable spacing between the arc-splitting plates, which enhances gas mobility and cooling. However, the interaction of conductive particles with the plasma poses a risk of arc re-ignition. The simulation results obtained via ANSYS using the finite element method (FEM) provide a graphical representation of the gas flow under atmospheric conditions, which supports the experimental findings [
5].
In the context of power electronics, publication [
6] investigates the methods for achieving high power density and reliability in power converters. The junction temperature of semiconductor devices is a key metric for health monitoring and thermal management. The authors present an improved temperature-dependent Cauer-type thermal network model for insulated-gate bipolar transistor (IGBT) modules. This model takes into account the thermal behavior of both the IC and ceramic layers. Using FEM simulations, the authors derive a heat flux profile along the module’s centerline to accurately reflect real-world heat dissipation. This approach enables precise and analytical calculation of the effective heat transfer area in each layer. Compared with traditional FEM-based modeling, the proposed method reduces the simulation time by a factor of 20 while maintaining high accuracy [
6].
Building on these results, publication [
7] introduces a new three-dimensional, fast temperature field prediction model for IGBT modules based on an enhanced POD-Galerkin method. The model is validated through comparison with the finite volume method (FVM) across four different scenarios: two steady-state problems with distinct boundary conditions and two transient problems with varying power losses. The high correlation between both methods confirms the model’s accuracy, and the significantly reduced computational time demonstrates its efficiency. The ability to rapidly and precisely capture the full temperature field is essential for thermal stress monitoring and the development of digital twin technologies for power devices [
7].
In [
8], the authors analyze the operation of a molded case circuit breaker (MCCB), focusing on arc formation during switching. The arc, formed as separate contacts, is directed into the arc chamber, and its behavior significantly affects the interruption performance. To evaluate this, the study uses detailed simulations to model the arc plasma, aiming to predict arc voltage—a key factor in effective current interruption. A circuit model is integrated to observe the current-limiting effect, and the results are validated against experimental data. The strong correlation confirms the model’s reliability. These findings contribute to optimizing MCCB design by improving arc control and enhancing current-limiting capabilities, ultimately leading to more effective low-voltage protection.
In publication [
9], the authors emphasize the importance of thermal analysis in the design of gas-insulated power equipment. A multiple species transport method is proposed to address the heat transfer problem, incorporating both ambient air and SF6 gas in the solution. The FEM is used to analyze the coupled eddy current, fluid and thermal fields, considering temperature-dependent material properties. The power losses from the electromagnetic analysis serve as heat inputs for the thermal analysis, eliminating the need for convective boundary conditions. The method is applied to analyze both single- and three-phase busbars, with results validated through comparison with analytical and experimental data from the literature.
In publication [
10], the authors discuss the permanent magnet claw pole machine (PMCPM), a type of transverse flux machine with a 3D magnetic flux path. For accurate performance analysis, a 3D finite element method (FEM) is required to evaluate both electromagnetic characteristics and thermal distribution, but it can be time-consuming, especially when considering the coupling effects. To address this, a combined 3D magnetic and thermal network method is proposed, where core loss, calculated using the 3D network, serves as the heat source in the thermal analysis. The method offers fast calculations and close magnetothermal coupling, with results verified by 3D FEM.
In publication [
11], the authors address the complex issue of supporting insulation in SF6-insulated high-voltage direct current (HVDC) equipment, involving the coupling of electric field distribution, heat transfer and SF6 gas properties. This study simulates the state parameter distribution in a ±800-kV DC wall bushing under various coupled fields. The results show that considering the fluid behavior of SF6 gas significantly alters the temperature and electric field distribution compared to previous studies. Notably, high electric field concentrations and elevated temperatures near the metal shell threaten the insulator’s long-term performance, increasing the risk of flashover. The article also explores the impact of different supporting structures and material properties on insulation performance, offering suggestions for insulator design and material selection. This work provides valuable insights for the design and fault analysis of SF6-insulated HVDC equipment.
In publication [
12], the authors explore the potential of vegetable-based oils, such as corn and palm oil, as alternatives to petroleum-based mineral oils for insulation and cooling in electric power equipment. Since mineral oils are non-biodegradable, there is a need to develop more environmentally friendly options. The study focuses on understanding the partial discharge (PD) characteristics of natural ester oils used as dielectric fluids in power transformers and other electrical apparatus. Laboratory experiments, following IEC test procedures, are conducted to evaluate the breakdown voltage and PD behavior of both virgin and thermally aged natural esters. A comparative analysis with mineral oil is presented, along with time and frequency domain analysis of PD pulses in different electrode configurations. Statistical analysis is also carried out to assess the suitability of natural ester oils for insulation in high-voltage applications.
In publication [
13], the authors examine the use of vacuum-hybrid DC circuit breaking methods, which reduce arc burning time by switching off short-circuit currents more quickly. This requires a drive, such as the Thomson coil actuator (TCA), capable of rapidly opening the vacuum interrupter (VI). The IDD is powered by a pre-charged capacitor, forming an LC circuit that generates a high-frequency current pulse. The paper investigates modifying the IDD power supply by adding semiconductor diodes to improve current pulse shaping and performance. The authors also analyze the impact of connection quality and length on the drive force, concluding that a circuit with a reverse diode on the IDD coil is the most effective in improving pulse performance.
In publication [
14], the authors calculate the electromagnetic forces on three-phase busbar conductors caused by short-circuit currents in both vertical and horizontal arrangements. Short-circuit current densities are mathematically determined, assuming the peak steady-state AC current equals the peak short-circuit current. The electromagnetic forces are calculated based on IEC Standard 865/1993 [
15]. The study finds that the electromagnetic force in the vertical arrangement is approximately twice as high as in the horizontal arrangement. The busbar arrangement significantly affects the strength of the electromagnetic force, and simulation results using the finite element method for the vertical arrangement align with the calculations from IEC Standard 865/1993.
In publication [
16], the authors investigate the electrodynamic forces acting on the contacts of a tulip contact system used in high-voltage circuit breakers. These circuit breakers often include two such systems: one for arcing, made of tungsten-coated elements, and the other with crown laces to increase the contact area and reduce transition resistance. Validating these forces through dynamic measurements is challenging due to the specific conditions inside the switch chamber, which is filled with CO
2 or SF
6 gas. To address this, the authors propose using the finite element method (FEM) to calculate the electrodynamic forces on the contact system through detailed 3D simulations. The results provide valuable insights into the operation of these contact systems under short-circuit conditions.
In publication [
17], the authors explore the application of digital twin technology for simulating electrodynamic forces in three-phase high-voltage disconnectors. The paper presents, validates and discusses a reduced-order model (ROM) based on advanced field models, aimed at overcoming the challenges of measuring electrodynamic forces in real-scale conditions. Despite modern computing resources, the research process remains costly and difficult. The proposed approach allows for efficient simulations, particularly for large devices like transformers and disconnectors, where full-scale simulations can be time-consuming or impractical. The digital twin model’s results were compared with short-circuit test data from the Institute of Power Engineering, confirming the model’s accuracy and practical applicability for both research and industry.
In publication [
18], the authors evaluate the induced current in a buried cable shield by solving Maxwell’s equations using the finite element method (FEM). Three lightning channel models are considered: straight inclined, bent and tortuous. The study investigates how factors such as channel shape, angle, bent height and lightning current waveform affect the induced current. The results show that both the peak and waveform of the induced current are significantly influenced by the channel shape, with the tortuous channel providing a better approximation than the inclined lightning model. Statistical analysis indicates that the effect of channel shape is more pronounced when the lightning current has a faster rise time.
In publication [
19], the authors present a modern computer modeling method for analyzing low-voltage extinguishing chambers used in modular devices. The study focuses on the effect of ferromagnetic plates, which enhance arc blow-out by distorting the magnetic field generated by the electric arc. This distortion creates a magnetic force that directs the arc toward the plate, improving the current interruption process. The paper introduces a tool for examining the physical phenomena inside the extinguishing chamber, allowing for the analysis of geometry and material changes in the arc extinguishing process. The model can be applied to both alternating and direct current devices and is scalable for various device parameters.
In publication [
20], the authors present a coupled electric–magnetic–thermal–mechanical analysis of busbar systems under short-circuit currents using the finite element method. Unlike previous studies that focus only on the peak short-circuit current, this method evaluates the magnetic force, temperature rise, mechanical displacement and their interactions over time. The results show that busbar support type significantly influences conductor displacement, while the temperature rise has a minor effect on displacement.
In publication [
21], the authors investigate a three-phase busbar arrangement with rigid conductors carrying short-circuit currents. Electromagnetic forces are calculated by numerically solving the electromagnetic field diffusion equation using finite elements, with results compared to IEC Standard 865/1993. The study examines various arrangements used in AC indoor installations, with the finite element procedure automated for minimal human intervention. An artificial neural network (ANN) is employed for automatic mesh generation, and the calculated forces align excellently with the IEC Standard.
In publication [
22], the authors use a 3D finite element model to optimize the design and monitor the condition of GIS. The model computes the electromagnetic field and forces in a three-phase bus capsule, considering the busbar connector’s contact resistance and material properties. The study calculates eddy power losses and electromagnetic forces, examining the impact of operating and short-circuit currents. It finds that the current density and electromagnetic force distributions in the conductors and tank are non-uniform, with forces during short circuits being sufficient to overcome contact spring hold forces.
According to the reading above, in order to completely comprehend and enhance the design of compact electrical protective devices, thermal analysis elements are essential. Both rated currents and short-circuit currents are to be the direct cause of it. Through the development of a functional three-dimensional finite element model (FEM), our work presents various novelties to the thermal analysis of tiny circuit breaker inserts:
maintaining a detailed, realistic model with accurate physical properties;
the digital model used in the normal operating state can also be used to analyze the transient state (analysis for short-circuit currents);
the models studied can be used to calculate power and energy losses during operation in various conditions;
the model was verified through the literature and experimental studies carried out by the author’s team;
shortening the design and implementation time of new electrical devices by solving validated FEMs—in this case, compact circuit breakers;
versatility of the model used for modeling compact circuit breakers taking into account other current-voltage parameters in relation to other electrical devices. Studies of heating with rated current are necessary for each electrical device and switchboard;
a transparent and flexible method of describing thermal physical phenomena, resulting in a reduction in the number of prototypes and thus increasing economic efficiency and reducing the impact on the natural environment;
the publications available so far are important, and the authors of the manuscript have analyzed them. However, the available literature does not address issues related to an organized and formalized approach to the construction of thermal models of main circuits of compact circuit breakers. The study can be used in research institutes when designing or improving the construction of electrical devices.
The work presented is important from the aspect of better understanding physical phenomena in compact instruments. From the point of view of the analysis of available literature sources, it is a decent work. A careful analysis of such scientific works available in the literature carried out by the authors made it possible to develop an article where a unique full-scale 3D model of MCCB with current paths was used, which was subjected to advanced transient thermal simulation analyses. The presented 3D model is also usable for transients (electrodynamic forces, short-circuit currents).
2. Thermal Phenomena in Current Paths of Electrical Devices
During the research operation of an electrical device and during the flow of current through current paths, thermal energy is generated resulting from the following sources [
6,
7,
8,
9]:
power losses caused by the Joule effect;
power losses resulting from eddy currents induced in the device as well as hysteresis effects in active magnetic circuits, both in active parts of electrical devices and in their metal structural elements;
dielectric losses;
other losses that appear in the device during the performance of work tests.
During the testing of a device equipped with a current path with a constant cross-section over its entire length, for the flow of current with a constant value, the value of power losses is [
10,
11,
12]
where
P—value of power loss,
I—value of current,
R—value of resistance of the current path.
As a result of current flow for a period longer than a short one, a clearly noticeable dangerous increase in the temperature of the current conduction path is observed, and consequently, its resistance value also increases, which is confirmed by the following Equation (2) [
13,
14]:
where
—resistance at 0 °C,
—coefficients with constant values.
The table below shows example constant values of the
coefficient (
Table 1).
Considering the problem of losses in the case of current paths with non-uniform cross-sections, determining the losses becomes a much more difficult task. Using the following Equation (3), it is possible to determine the generated power losses [
16,
17]:
where
J—current density,
ρ—resistivity value of the conducting material,
V—volume of the conducting element.
When conducting research aimed at indicating losses generated as a result of the flow of alternating current through the current paths, it is necessary to take into account the skin factor and the proximity factor in the case of additional current paths. A non-uniform area of the current density distribution shown in the cross-section of the conductor indicates the skin effect phenomenon in the tested current path. This value intensifies with increasing distance from the center of the conductor cross-section [
18,
19,
20]. Currents flowing in individual sections of the conductor cross-section exhibit a common phase shift relative to the voltage, as shown in
Figure 2.
The non-uniform value of the current flow through the conductor structure affects the increase in the resistance value of the analyzed current path, which can be described using the following Equation (4):
where
—skin effect factor value,
—resistance value of the conductor used, taking into account the skin effect,
—resistance value of the conductor used during the analysis using direct current flow.
The above skin factor shows a strong dependence on
the frequency at which the alternating current flows through a given element of the current path;
the resistance of the current path;
the geometry of the cross-section occurring for the current path.
During the conducted laboratory tests, a strong degree of correlation was confirmed between the increase in the intensity of the skin effect and the value of the frequency, which confirms the belief that this parameter determines the depth of penetration of magnetic field waves into the internal structures of the conductor, which is illustrated in
Figure 3 below.
In the context of performing practical calculations for the current paths, it is generally assumed that the skin factor value is no greater than
= 1.1–1.2 (
Figure 4):
During the tests, a significant influence of the current density distribution on the approach effect resulting from the joint interaction of variable magnetic fields generated by currents flowing in adjacent current paths was also observed [
13,
16]. This is shown in
Figure 5 below.
The figure shows the differences in the current density distribution resulting from the proximity effect in the tested conductors [
16]:
the case when currents flow in the same directions,
the case when currents flow in opposite directions.
Considering the first case, when currents flow in the same direction, the conductors attract each other. However, if a case is considered in which the currents flow in opposite directions, the conductors repel each other. The proximity effect is carefully taken into account during the analyses by the
coefficient, which is described in detail below (5) [
17]:
where
—value of the conductor resistance, taking into account the skin effect.
The value of the coefficient is influenced by such parameters as
properties of the material used to produce the conductor,
geometry of the tested object,
frequency value of the current flowing through the conductor.
Determining this coefficient is a task that requires experimental analysis, which is shown in the attached
Figure 6.
4. A 3D Model of the Molded Case Circuit Breaker
It is difficult to imagine designing prototype solutions for electrical devices without using computer systems that allow the use of numerical tools, mainly advanced programs designed to support the design of new structures. Particularly useful tools are CAD and computer-aided engineering (CAE) devices. SolidEdge, SolidWorks (2024) and ANSYS (2024 R1) are undoubtedly leaders among environments that allow the creation and analysis of complex structures. Using them significantly speeds up obtaining the required assumptions of the tested structural stresses, temperature increases, and it also allows for precise analysis of the distribution of electromagnetic induction density and many other values in the designed device.
Creating a 3D model of a molded case circuit breaker allows for carrying out the simulations mentioned above. The object of the research is a three-pole compact circuit breaker with a rated current of 250 A and a thermomagnetic release type with appropriate manual settings enabling a wide range of adjustments. In the “SpaceClaim Geometry” software, all individual structural elements of the molded case circuit breaker were modeled successively.
During the design of the current path elements of the molded case circuit breaker, they were made with the maximum possible precision, which determines the accuracy of the obtained simulations, which is why it is so important to reproduce their dimensions, shape and relative position inside the circuit breaker. The main working elements of the current path of the molded case circuit breaker are
moving contact;
fixed contacts;
two arc-extinguishing chambers;
housing of each connection chamber (3P—three connection chambers);
upper and lower terminal of the circuit breaker.
In
Figure 8 below, selected elements of the current path of the molded case circuit breaker under consideration are presented.
After manufacturing all the circuit breaker components, it was possible to perform a 3D assembly of the connection chamber of one pole of the molded case circuit breaker, as shown in
Figure 9.
A 3D assembly of the entire molded case circuit breaker was prepared. After developing a 3D model of the compact circuit breaker, it was possible to model the power cables of the analyzed device, as shown in
Figure 10 below. The 3D model of the compact circuit breaker prepared in this way was ready to be imported into the appropriate calculation modules in ANSYS Workbench, which allow for performing coupled analyses, which, after complex calculation iterations, allow for checking how the selected physical phenomena interact with each other.
5. Thermal Analysis of the Double-Break Contact of a Molded Case Circuit Breaker—FEM Simulation
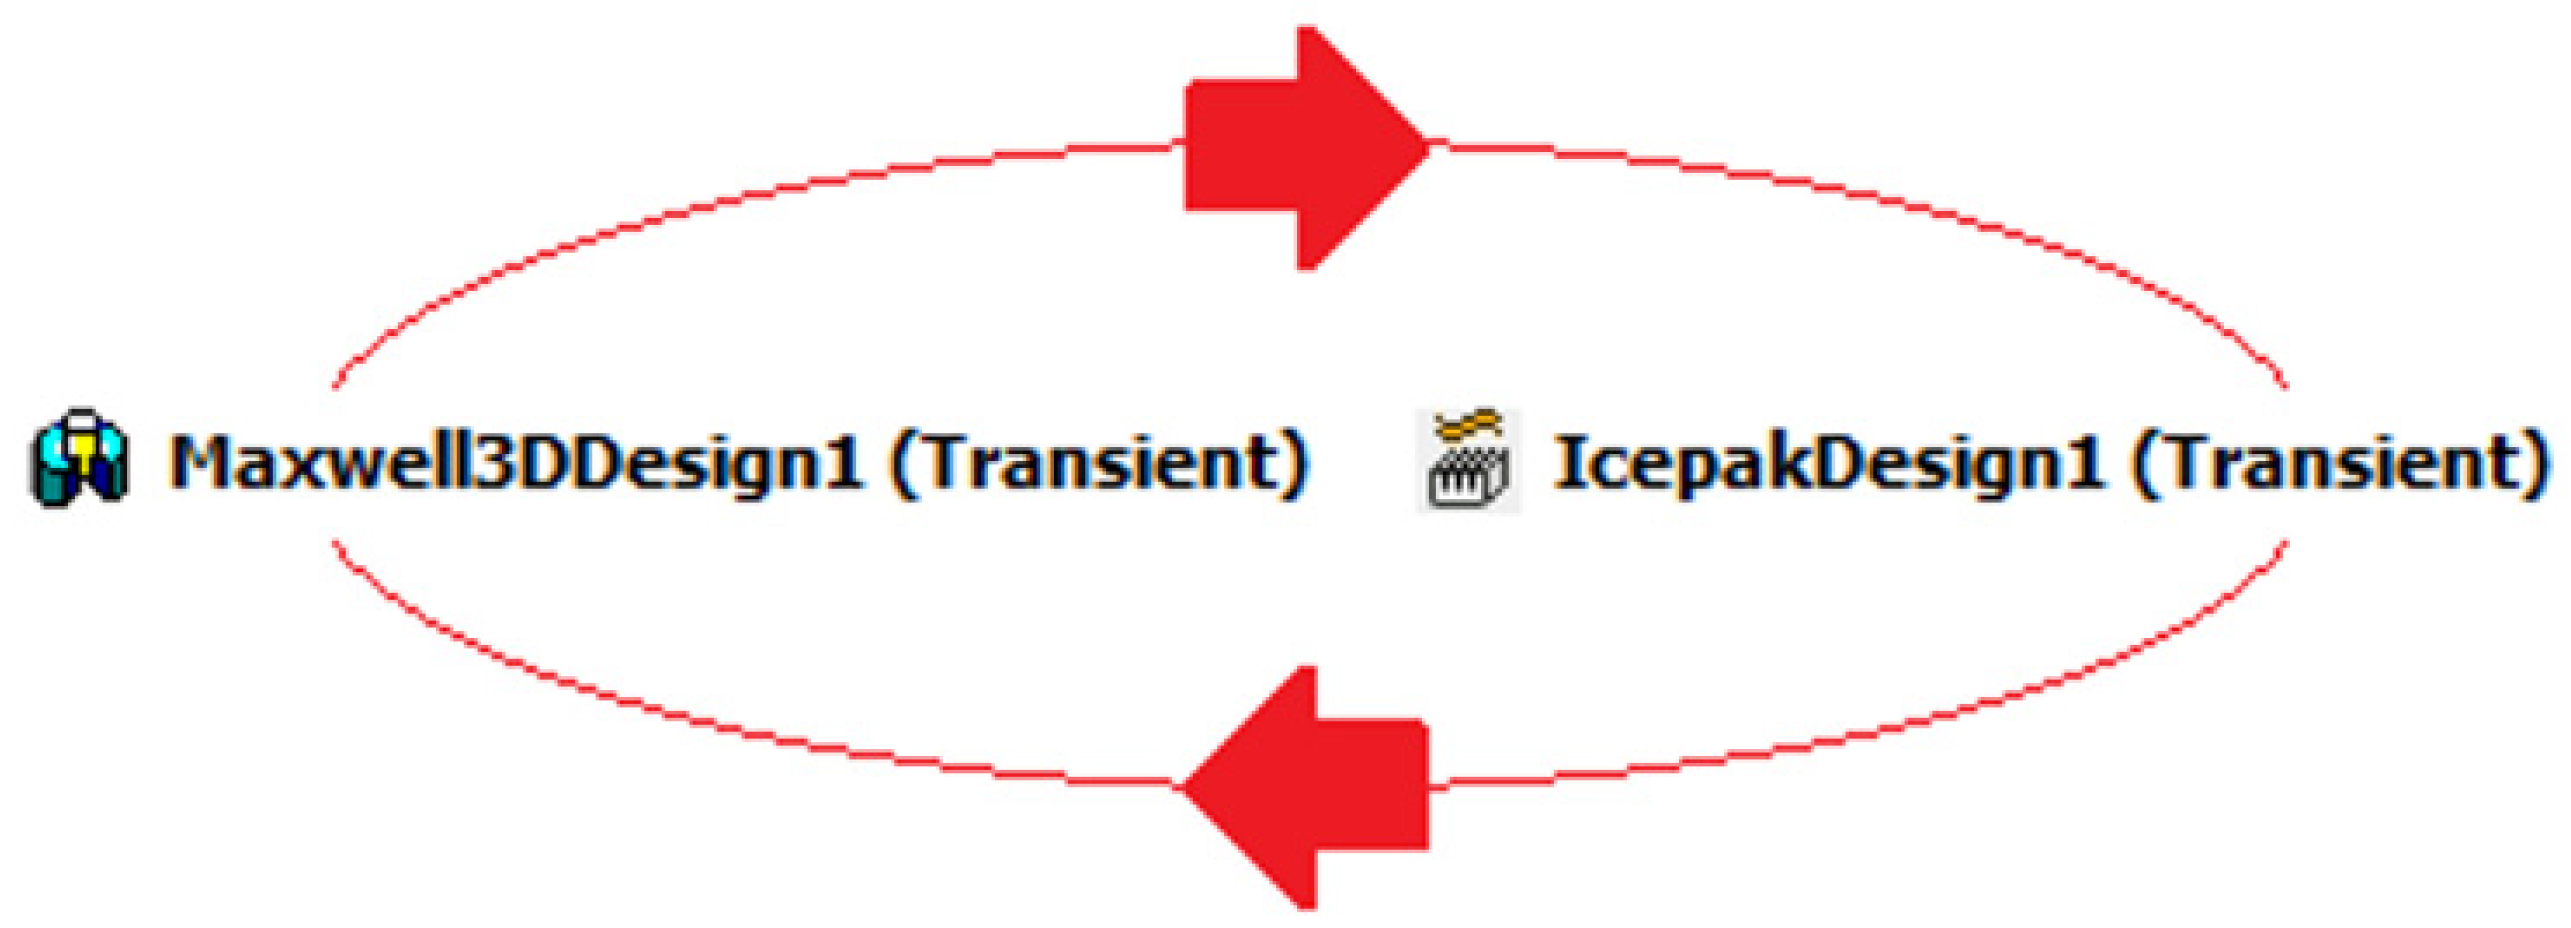
Using the software capabilities for the work, a coupled analysis was performed between two solvers: Maxwel 3D ⇔ Icepak. A simplified diagram of the calculations for the compact circuit breaker under consideration is shown below in
Figure 11.
The first step that started the analysis was to import the previously generated model into the “Maxwell 3D” solver, which gave the possibility to select the appropriate solver to start the computational analysis: “Solution type” → “Magnetic -> Transient”. Then, the boundaries of the area (region) for the planned analysis were defined. This was possible by using the “Create region” function and specifying the dimensions. In this case, this area was “filled” with air. By outlining the area surrounding the tested switch, it was possible to assign appropriate physical properties to all structural elements. Thanks to extensive libraries of material properties, it was possible to select appropriate materials, such as steel, copper, aluminum and many others. The software capabilities allow for editing them and creating one’s own, when necessary. The next important step was to apply the current flow force on the compact switch model; in the analyzed case, the rated current value was 250 A for a particular phase. Through the “Analysis” tab using the “Add solution setup…” option, it was possible to specify the maximum number of iterations for the object under consideration. When modeling this type of simulation, the duration of the “Transient” simulation was assumed to be 3600 s. The time step was assumed to be 1 s, which gave 3600 computational iterations. By using the “Mesh Operations” option, it was possible to specify the initial number of elements of the computational mesh generated in the Maxwell 3D solver. Initially, this number was set to 1,000,000 elements. As the analysis progressed, the solver adjusted the mesh density appropriately in places particularly burdened by the flow of current through the switch. After the simulation was completed, the number of its elements was 1,316,844. After performing the calculations in Maxwell 3D, it was possible to move on to the next computational solver, which was ANSYS Icepak, where thermal calculations were performed. The possibility of loading the geometry from the previous solver was used, in which material properties had to be assigned to each loaded part of the circuit breaker—the same as in the case of calculations in Maxwell 3D. A library of materials was used, in which the necessary material properties were selected and assigned to the construction elements of the circuit breaker during the modeled simulations. The next stage consisted of again developing a computational mesh similar to the previous calculations; it had 9,713,913 computational nodes. The following system capabilities were used: “Imported Load” allowed for importing the generated power losses, previously determined in the Maxwell 3D solver. This step leads to the start of the computational analysis completed with data from the previous solver. In the last stage, the “Temperature” option located in the “Field Overlays” tab was used, thanks to which it was possible to analyze the temperature distribution on the tested current paths. The computational simulation time in the Icepak module was assumed to be 3600 s. The software allows for setting the appropriate simulation duration via the “Analysis—Icepak Solve Setup” tab.
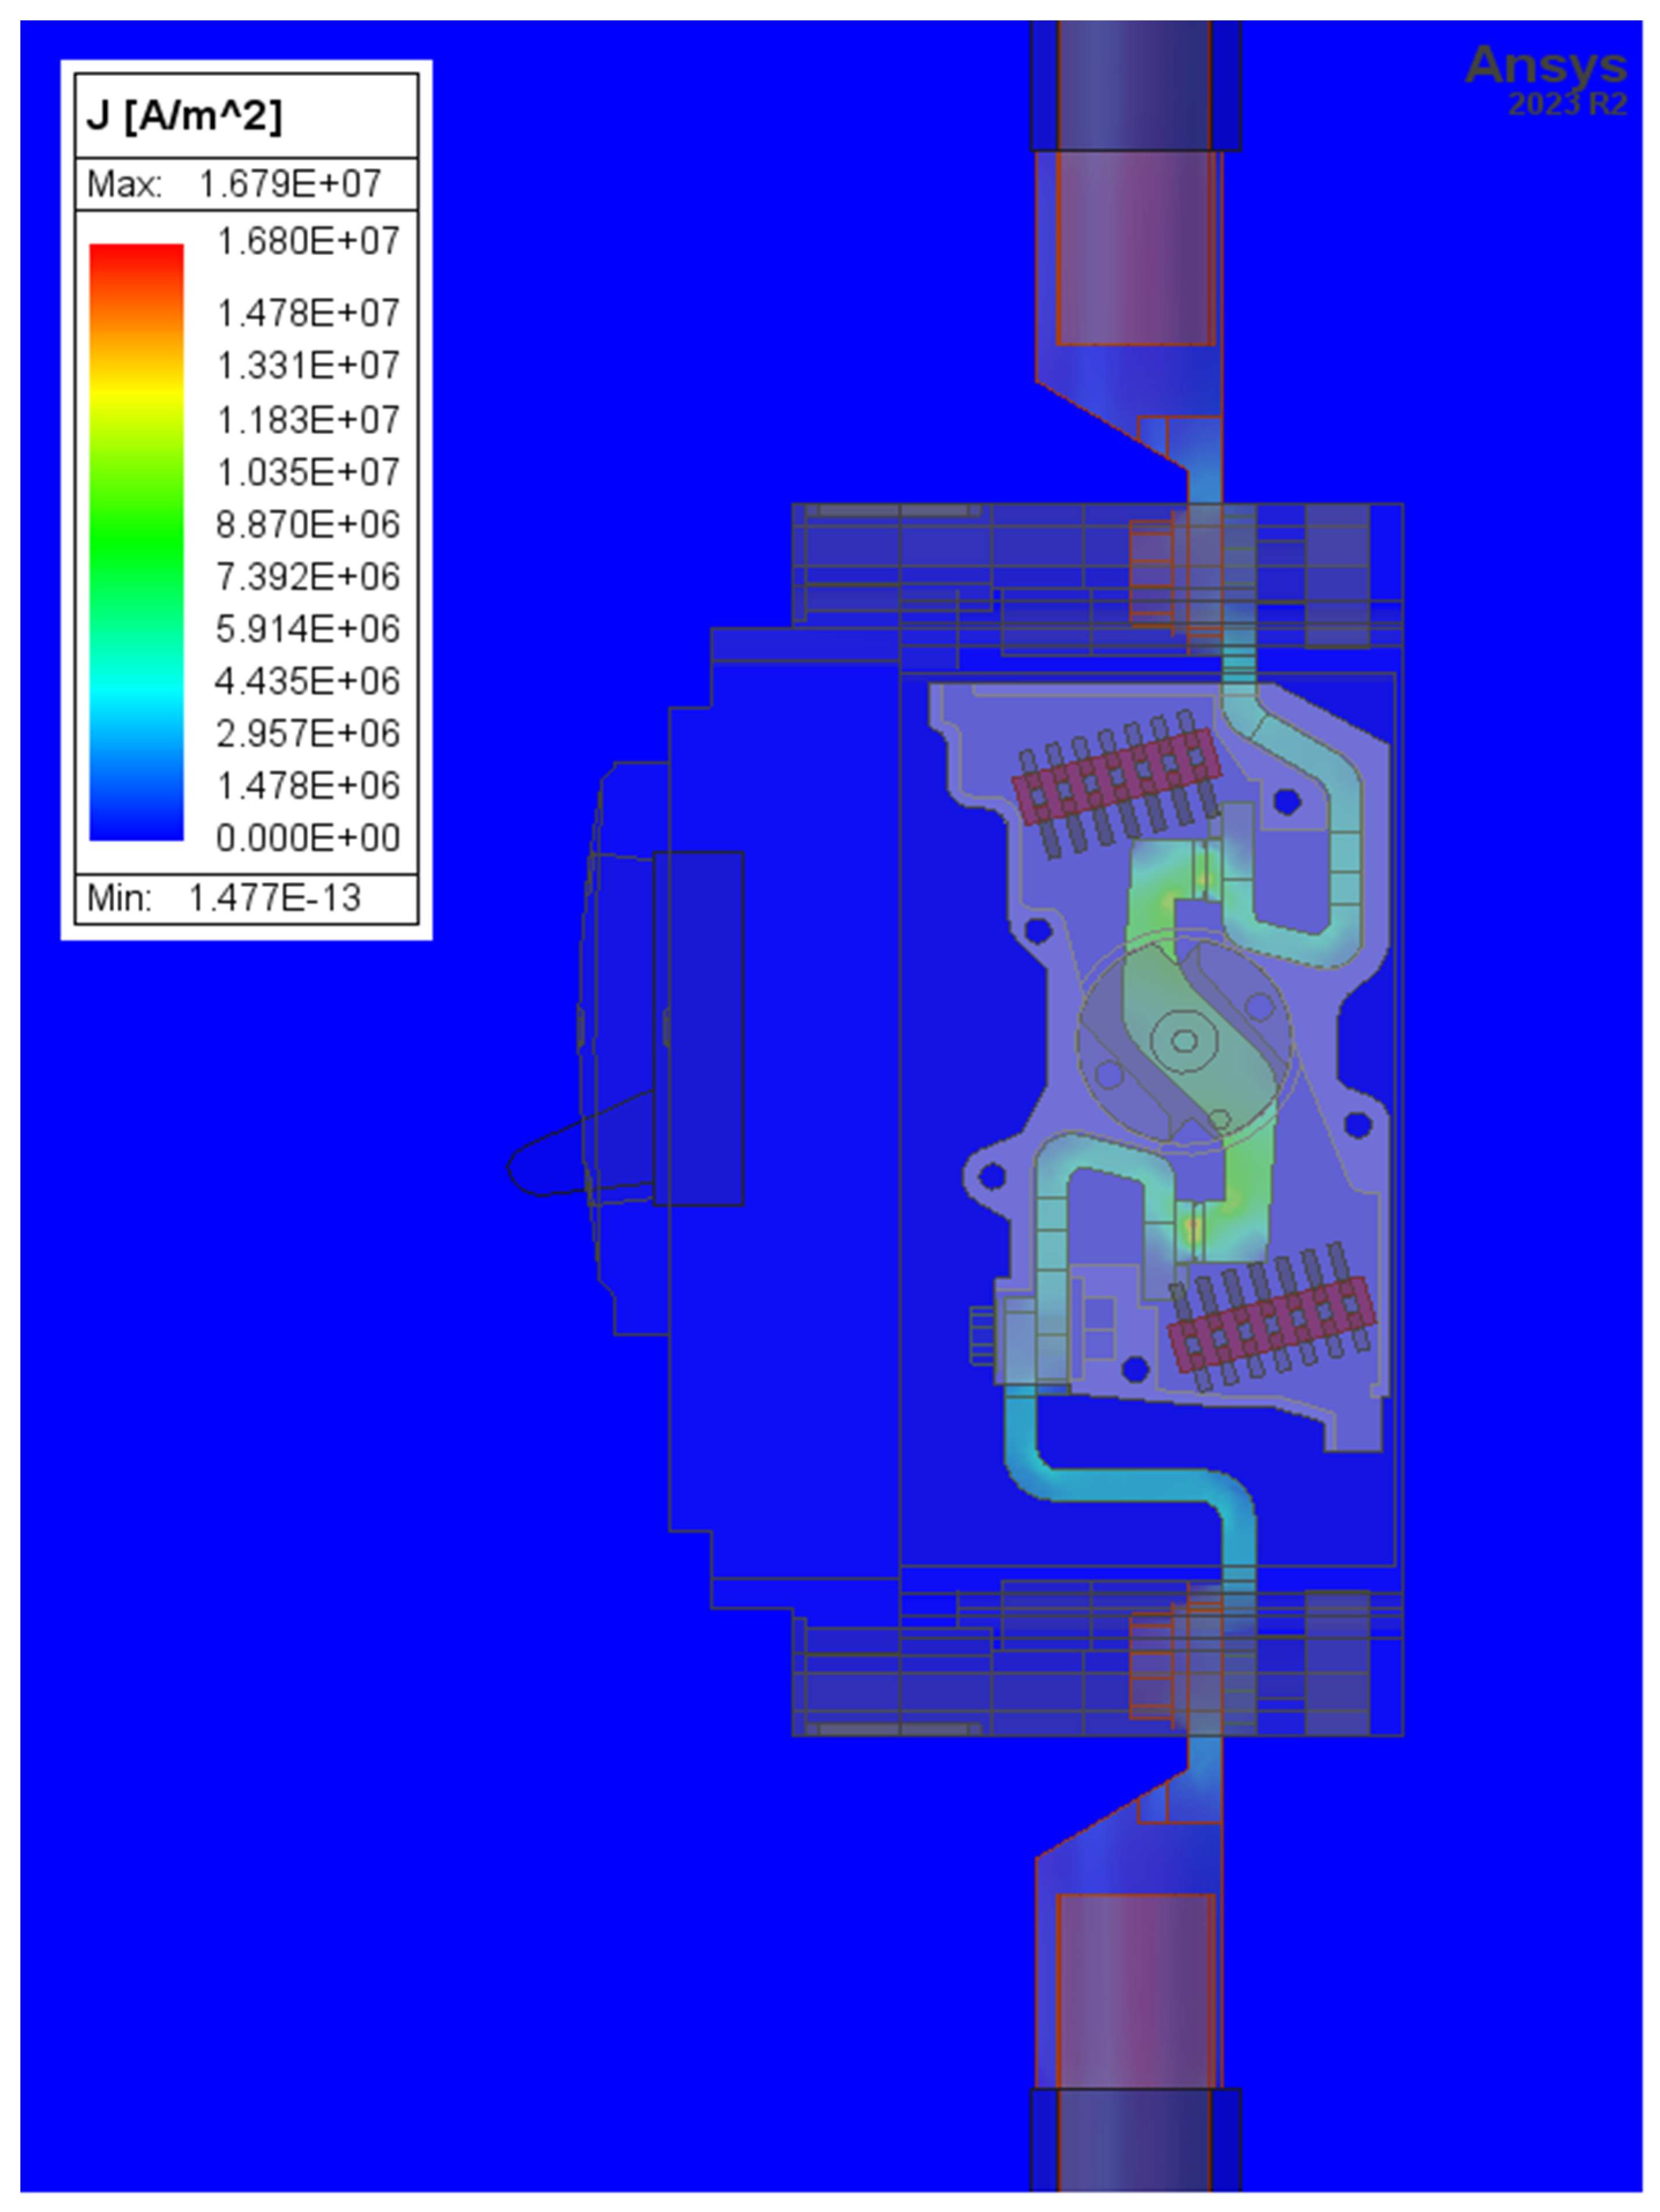
The coupled analysis modeled using ANSYS based on two basic environments, Maxwell 3D and Icepak, obtained a visualization showing precise results related to the current flowing (250 A) through the tested compact circuit breaker. The current density distribution in the circuit breaker current paths was the highest at the contact point of the contact plates, as shown in
Figure 12 below.
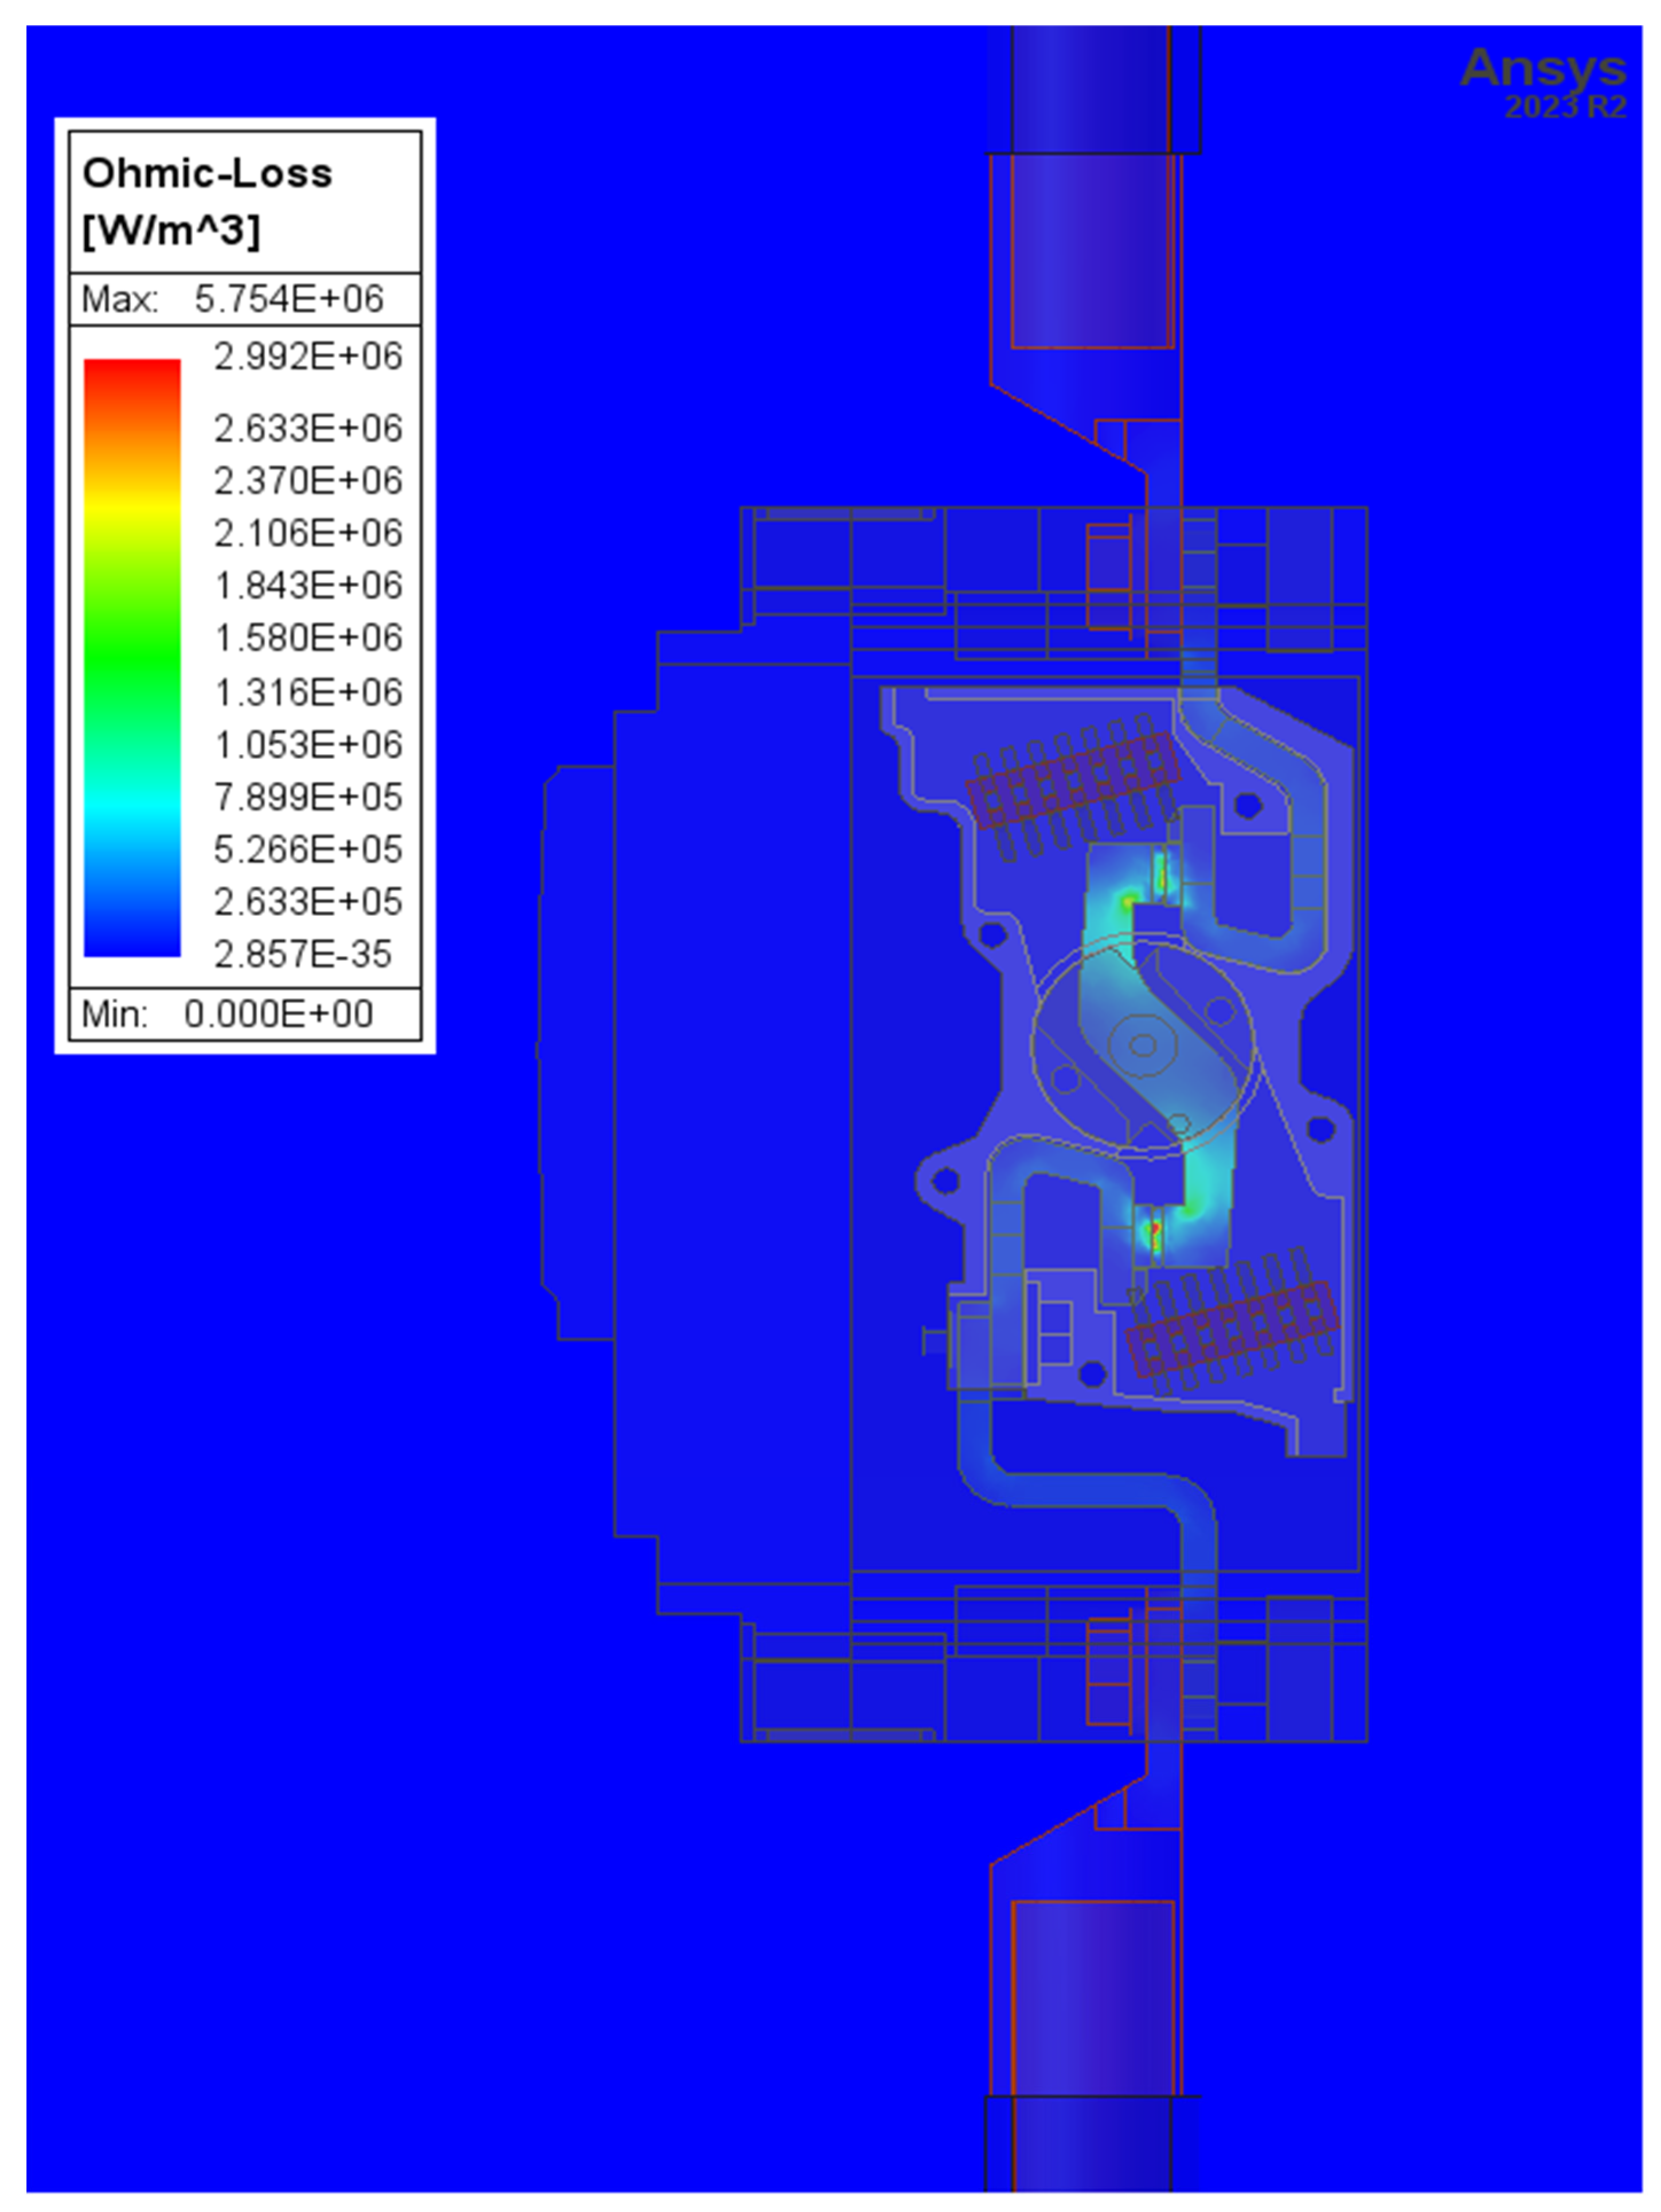
The current flowing through the circuit breaker current paths induced power losses in the form of heat emitted by active structural components. The intensity of these losses can be observed in
Figure 13 below.
After performing the numerical calculations considering the phenomenon of current flow through the system, the current flow through individual elements of the track and the temperature distribution for the selected times in the operating conditions of the switch were analyzed. Analyzing the obtained visualization, it was noticed that the highest amount of heat was generated and accumulated in the contacts, reaching a temperature value of 124 °C. The obtained temperature distribution is shown in
Figure 14 below.
The heating curves of the active elements in the current path, shown in
Figure 15, served to verify the results obtained from simulations of rated current flow through the tested mechanism. To determine the thermal behavior of a compact circuit breaker rated at 250 A, a 3D model of its structural components was developed. For this purpose, the ANSYS software suite was utilized, enabling the coupling of two solvers: Maxwell 3D and Icepak Transient.
Strict adherence to the appropriate calculation steps was essential to ensure accurate numerical simulation. The analysis began with calculations in Maxwell 3D to model the flow of rated current through the path elements, resulting in data on current density distribution and Ohmic losses. These results were then transferred to Icepak Transient, which allowed for the determination of temperature distribution along the current path after a defined number of simulation iterations.
The resulting temperature profiles enabled experimental validation of the heating process of the circuit breaker’s current path under real-world rated current loading conditions. This validation is discussed in detail in the subsequent sections of the work.
6. Experimental Tests of the Double-Break Contact of the Molded Case Circuit Breaker
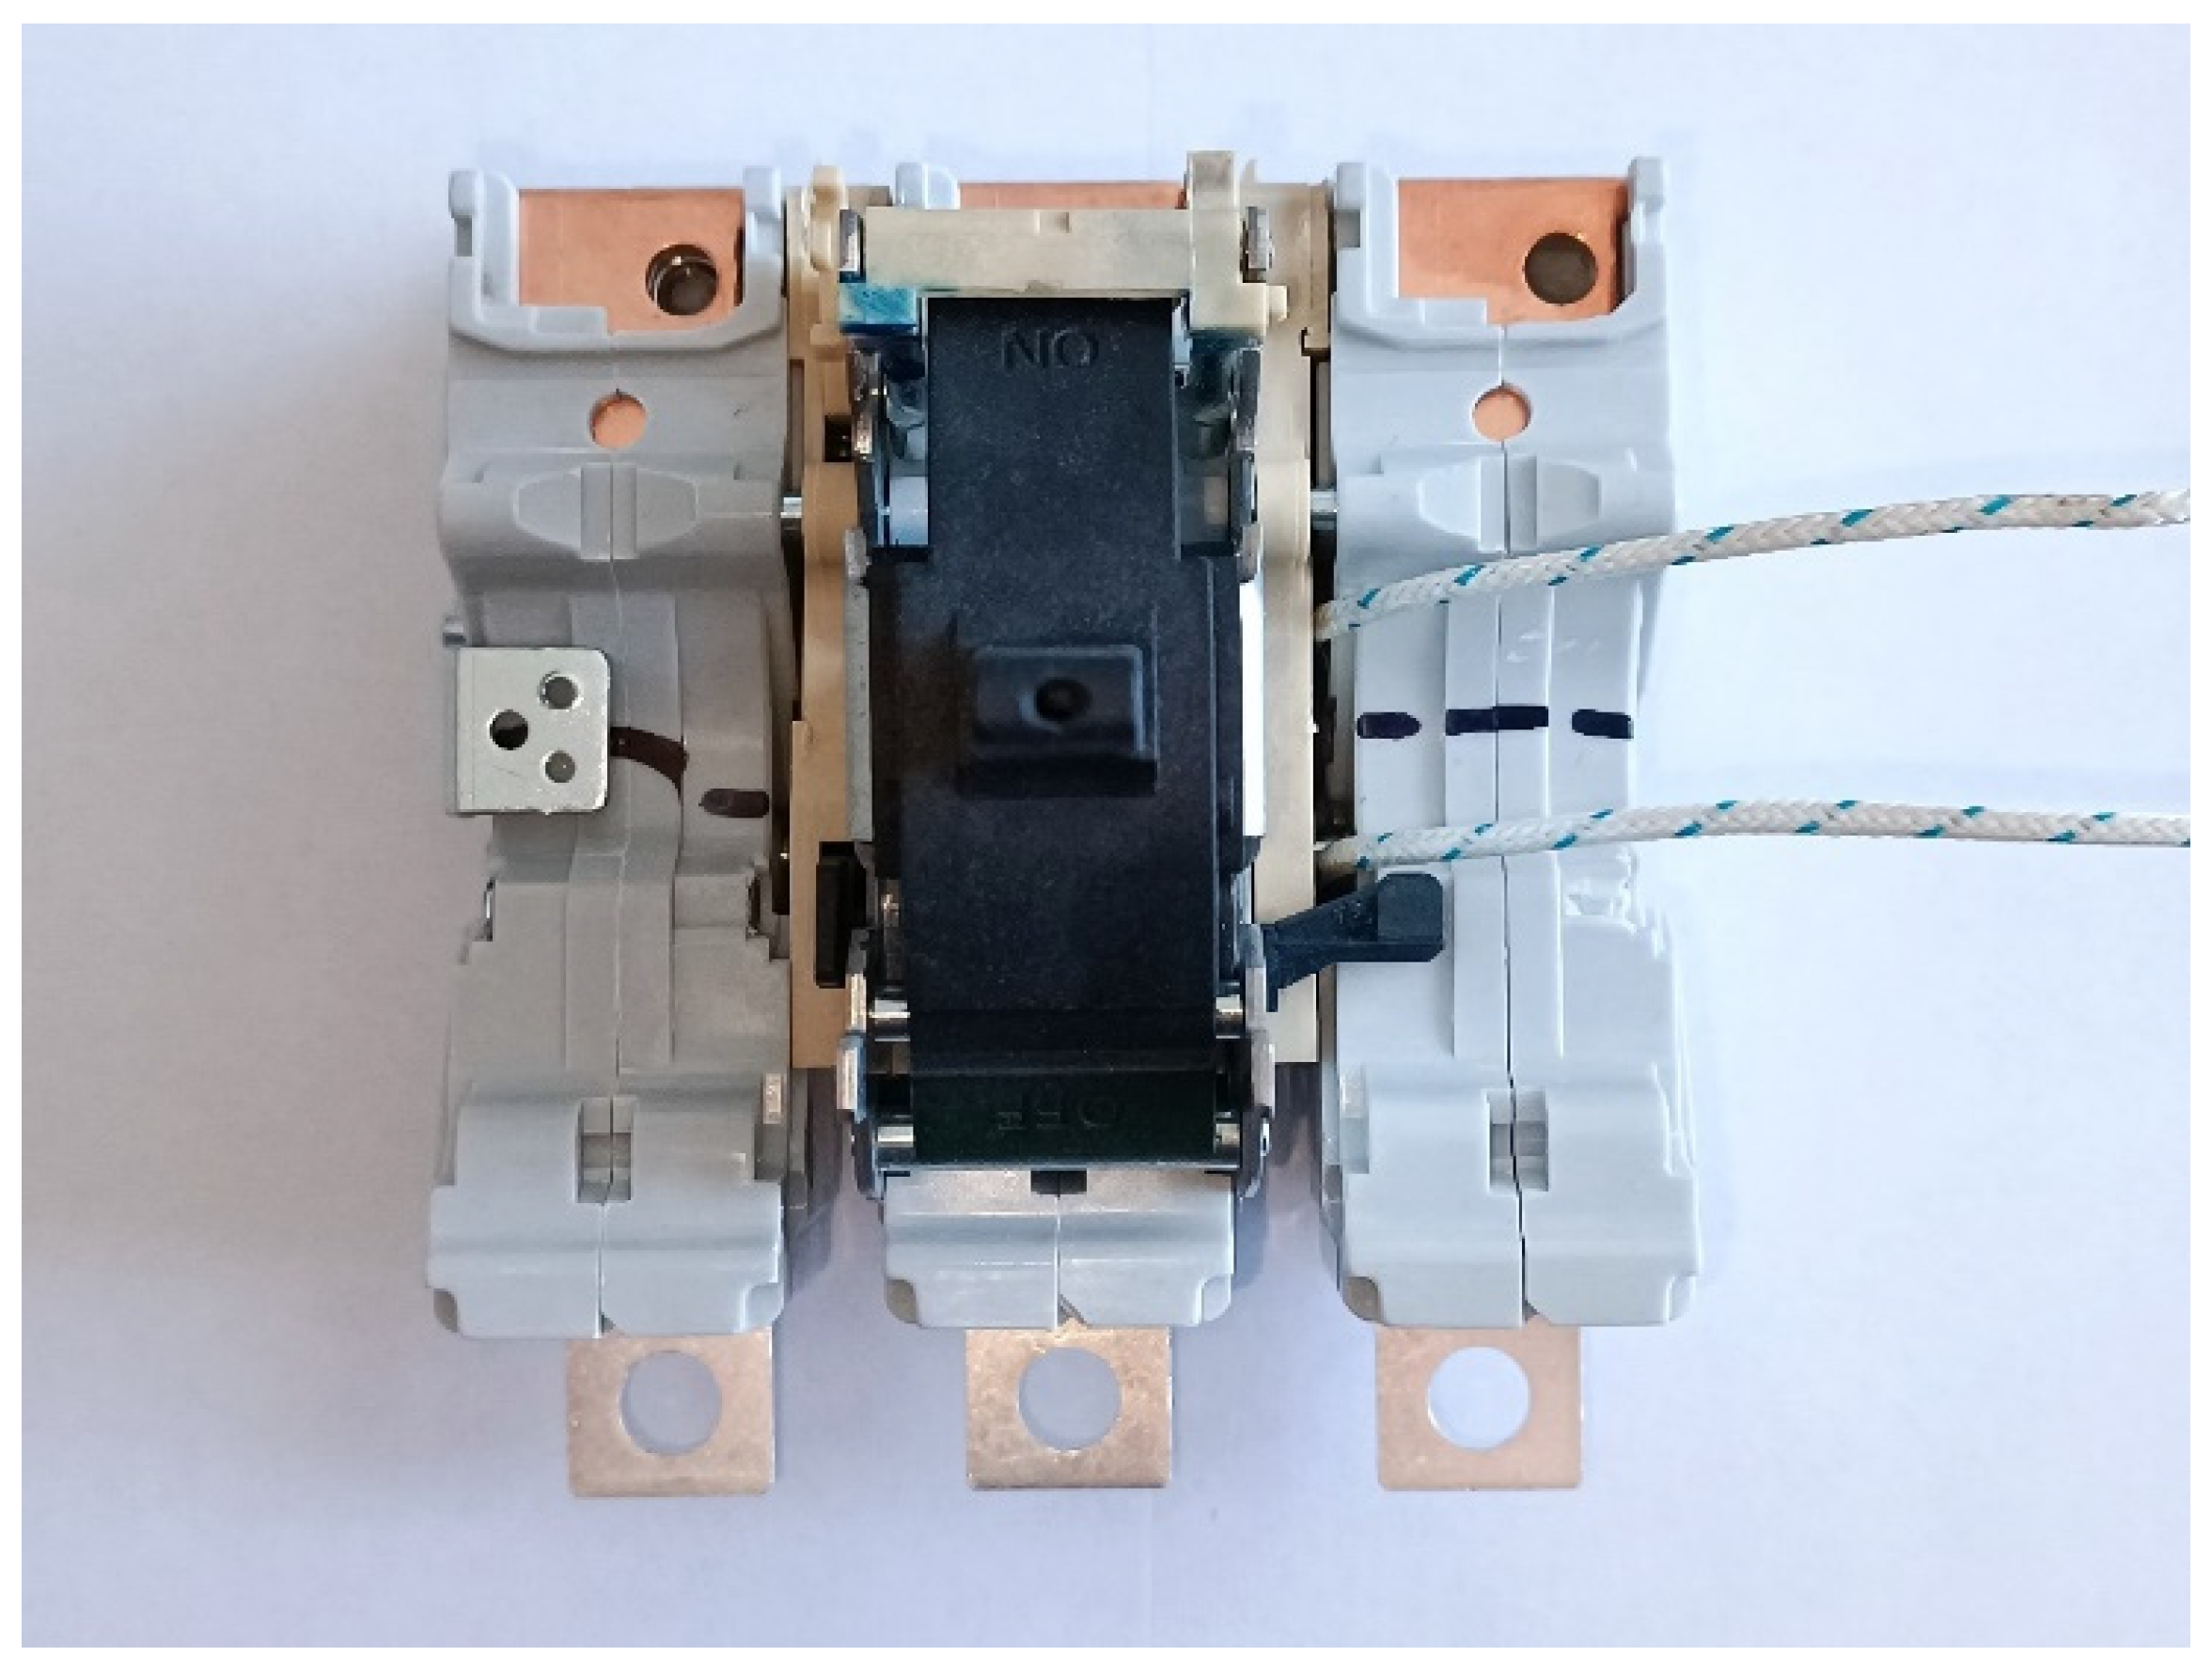
To validate the results obtained from numerical simulations regarding the flow of rated current through the tested mechanism, experimental studies were conducted. These studies aimed to assess the temperature rise in individual elements of the current path of a compact circuit breaker with a rated current of 250 A. For this purpose, type K thermocouples were used and mounted in a way that allowed temperature measurement without interfering with the proper functioning of the breaker’s disconnection mechanism (
Figure 16).
In accordance with the requirements of the PN-EN 60947-2 standard [
23], the temperature measurements were conducted without removing or unscrewing the breaker’s housing cover, which is crucial to maintaining the integrity of the tested devices. The experimental tests aimed to confirm the accuracy of the numerical simulations and verify whether the results obtained during the simulations corresponded to the actual operating conditions of the circuit breaker under rated current load.
During the experiments, temperature changes in various elements of the current path were monitored, allowing for an evaluation of the impact of temperature rise on the device’s performance under real-world loading conditions. The obtained results served as a benchmark for further analysis and comparison with the simulation results.
The use of a set of type K thermocouples as sensors allowed for measuring the temperature increase on the active elements of the current path subjected to testing. The use of high-quality thermally conductive glue allowed for minimizing measurement errors in the system. The previously performed computational analyses for the 3D model of the switch helped to precisely locate the thermocouple installation. The test results obtained in this way were compared with the results obtained during the simulations. Below is a diagram of the arrangement of sensors in appropriate places of the elements of the tested current path (
Figure 17).
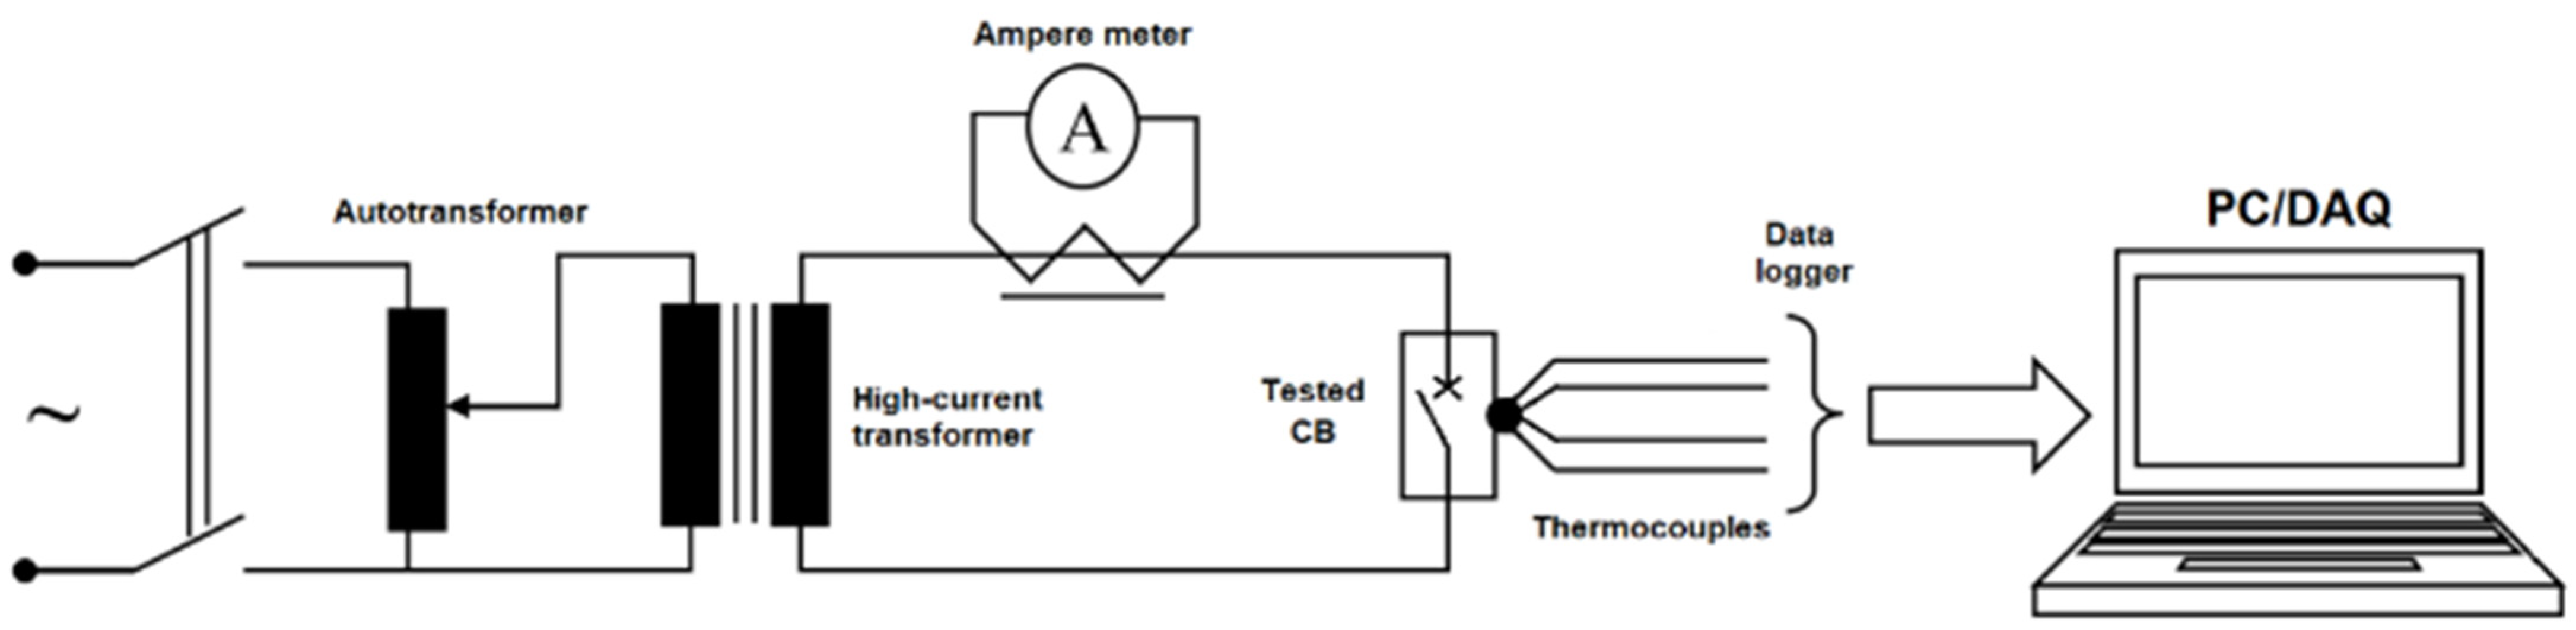
The device modified in this way was reassembled to a state technically corresponding to its original state. The precision during the assembly of thermocouples allowed for maintaining a high level of tightness in the system, which in no way affected the functioning of the switch mechanism and did not cause any problems with maintaining correct operation. Apart from creating the technological holes necessary to introduce thermocouples to the tested elements, the adaptation of the system did not include any other drilling or other types of modifications in the construction of the tested object, which could affect the accuracy of the temperature increase measurements by generating additional losses and interference. The adaptation of a special measurement station allowed for the subsequent stages of the tests, consisting of recording the temperature increase occurring inside the current path elements at a specific rated current. During the tests, a single-phase high-current transformer was used, which was coupled with a single-phase autotransformer, thanks to which the possibility of smooth regulation of the current at the output of the high-current transformer was obtained. An ammeter (clamp meter) was placed on the power supply cable of the tested device: the compact circuit breaker. The peaking process and data recording from the sensors implemented in the circuit breaker were enabled by the installed four-channel temperature recorder with an accuracy of 0.1 °C, with a sampling frequency of 1 s (temperature measurement on all four thermocouples every second). Using the USB interface, the parameters read from the tested system were sent online to the recorder software on a PC. This facilitated the process of generating heating graphs of the analyzed current path elements in the compact circuit breaker. A schematic diagram (
Figure 18) of the applied measurement system is shown below.
Using the vessel with oil, it was possible to measure the ambient temperature, consisting of placing a temperature sensor from an additional recorder in it. The oil played the role of a heat transfer medium here and, at the same time, allowed for maintaining the accuracy of the measurements; the readings showed that it oscillated around 23 °C. The cables used during the tests were 1 m long from the bottom of the switch and 1 m from the top of the switch, in accordance with the standard.
Figure 19 shows the actual measurement system of the compact circuit breaker used.
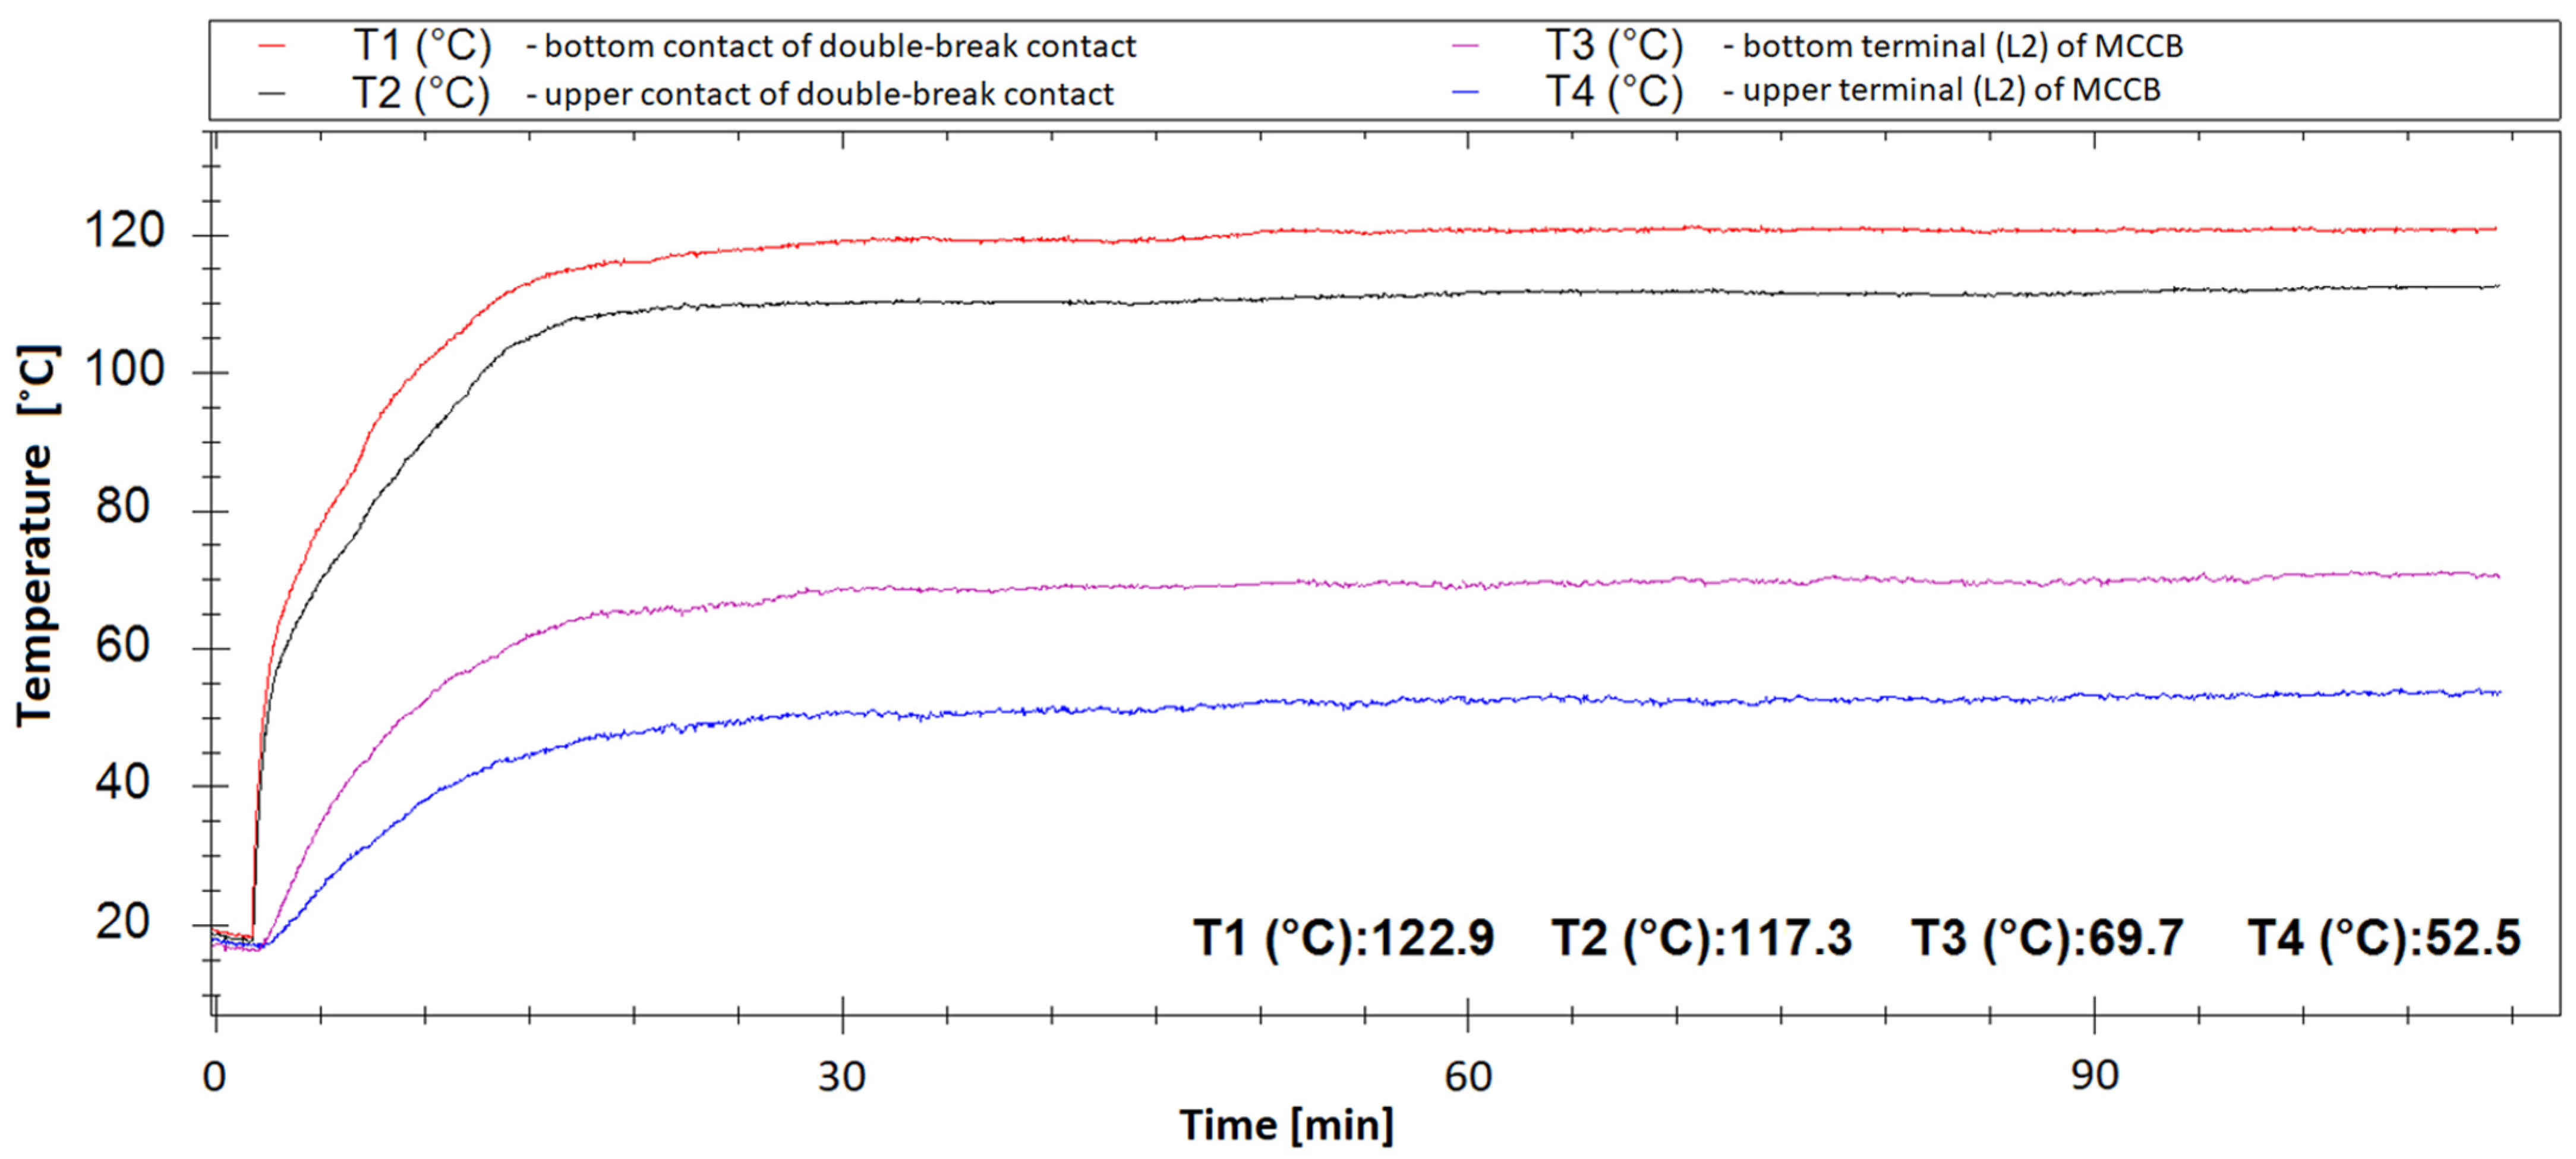
The analysis covered the process of heat generation growth in the active elements of the analyzed current path of the compact circuit breaker under the influence of the flow of rated current of In = 250 A; the parameters were regulated using an autotransformer. A graph (
Figure 20) of the heating process of the conductive elements was drawn from the observed temperature changes, where the highest temperature value was recorded in the area of the lower contact of the circuit breaker, slightly over 122.9 °C; the temperature increase for the area of the lower contact was 117 °C. On the surface of the lower connection terminal, the temperature reached 69.7 °C, and on the surface of the upper terminal, it reached 52.5 °C. A comparison of the simulation analysis results showed high convergence with experimental test results. The obtained temperature values for individual elements of the analyzed current path showed an error of no more than 5%, which is a satisfactory result for the conducted analyses.
7. Summary and Conclusions
The temperature rise in the selected components of the circuit breaker was determined through measurement experiments, focusing on heat generated in the current path elements and influenced by the thermal properties of the construction materials. The recorded data under rated current conditions (In = 250 A) were used to plot heating curves.
The highest current density was observed in the contact areas due to both design geometry and temperature influence. Temperature increases remained within permissible limits. The upper contact reached just over 117 °C, while the lower contact peaked at 122.9 °C. Surface temperatures of the lower and upper terminals were 69.7 °C and 52.5 °C, respectively.
The maximum temperature of 123 °C did not affect the mechanical integrity or function of the breaker; no deformation or damage occurred. Measurements were conducted using type K thermocouples connected to a precise data acquisition system. The simulation results were compared with experimental data and are summarized in
Figure 21.
The subject of this study was the current path of a compact circuit breaker with a rated current of 250 A. The device enables the switching of operating, overload and short-circuit currents and can be expanded with additional actuators and releases, significantly enhancing its functionality. The main objective was to perform a thermal analysis of the current path using computer simulations, confirmed through experimental tests.
The simulation process involved several key stages: precise 3D modeling of individual components and the entire device (including power cables), followed by importing the model into the ANSYS environment. One of ANSYS’s advantages is the ability to couple different solvers, such as Maxwell 3D and Icepak, allowing efficient data exchange. The simulation carried out for the rated current provided the values of current density and Ohmic losses, helping identify the areas of highest heating and understand heat distribution.
Based on the coupled analysis, heating curves for the active elements were generated and later compared with experimental results. For testing, a specially adapted breaker was used with type K thermocouples placed inside, without affecting the device’s mechanical or electrical performance. These sensors enabled precise temperature monitoring of the contacts and terminals. Data were recorded with a high-accuracy temperature logger, allowing for the creation of detailed heating curves.
The close correlation between simulation and experimental results confirmed the accuracy of the method. Thermal simulations using Icepak were consistent with real-world measurements, proving useful for the design teams, especially during prototype development. The work on this project allowed the author to expand technical knowledge and gain deeper insights into the current flow processes within electrical device components.
Thermal analysis of molded case circuit breakers is vital for both scientific and engineering purposes. A detailed FEM model was used and validated by experimental results, demonstrating high accuracy and practical application. The model offers several advantages:
- -
Dynamic modeling of a double-gap device;
- -
Scalability for different power ranges and design modifications;
- -
High engineering value for R&D departments;
- -
Advanced coupled-field modeling with validated results.
Thus, the proposed model is a valuable tool that supports the design process, reduces costs and accelerates research on new types of molded case circuit breakers.


 ,
, 


