Article

The Development of a MATLAB/Simulink-SCADA/EMS-Integrated Framework for Microgrid Pre-Validation

1
School of Electrical Engineering, Korea University, Seoul 02841, Republic of Korea
2
Department of Electrical Engineering, Pohang University of Science and Technology, Pohang 37673, Republic of Korea
*
Author to whom correspondence should be addressed.
Energies 2025, 18(11), 2739; https://doi.org/10.3390/en18112739
Submission received: 11 April 2025 / Revised: 19 May 2025 / Accepted: 21 May 2025 / Published: 25 May 2025

Abstract

:
To validate microgrid systems, precise simulations are necessary beforehand. Traditional Hardware-in-the-Loop Simulation (HILS) is used to validate systems by creating a digital twin environment that integrates software and hardware to mimic reality. However, HILS requires high investment costs for hardware, posing a significant hurdle for companies. To address this issue, this study proposes a Software-in-the-Loop Simulation (SILS) framework using SCADA/EMS and MATLAB/Simulink(R2024a). The proposed SILS framework is highly compatible with Energy Management Systems (EMSs) and Supervisory Control and Data Acquisition (SCADA), allowing near real-time data exchange and scenario-based analysis without relying on physical hardware. According to the simulation results, SILS effectively replicates the dynamic behavior of microgrid components such as solar power generation systems, energy storage systems (ESSs), and diesel generators. Solution providers can quickly conduct feasibility tests through systems that simulate actual power systems. They can test the operation of SCADA/EMS at a lower cost and reduce on-site time, thereby reducing business costs and preemptively addressing potential issues in the field. This paper demonstrates how SILS can contribute to establishing optimal operation strategies and power supply stability through case studies, including daily operation optimization and autonomous operation scenarios for microgrids. This research provides a foundation for the feasibility of microgrid solution construction by enabling software performance evaluations and the verification of economic expected returns in the early stages of a project.

1. Introduction

Microgrids are small-scale power systems that include distributed energy resources such as loads, generators, and batteries. They can optimize operating costs and manage energy distribution efficiently by operating in conjunction with the main power grid according to a pre-planned schedule. Sometimes, large-scale power outages can occur due to unusual weather phenomena or equipment failures. It is crucial to efficiently utilize power system resources in preparation for power outages. Distributed energy resources (DERs) within the power grid play a vital role in maintaining the balance between power demand and supply [1]. Recent studies have increasingly adopted Software-in-the-Loop Simulation (SILS) methods for pre-validating microgrid control strategies due to the high costs associated with Hardware-in-the-Loop Simulation (HILS). Research in [2,3,4,5] introduced SILS architectures for validating control algorithms, inverter models, and simplified microgrid environments. However, most of these studies were limited to component-level validations and lacked full integration with real-time SCADA or Energy Management System (EMS) platforms. Furthermore, SILS environments presented in [6,7,8,9] primarily focused on isolated functions such as battery performance modeling or controller parameter tuning without addressing holistic microgrid operation scenarios.
Energy Management Systems (EMSs) are crucial for validating the appropriateness of generated control inputs and thoroughly analyzing interactions between various distributed energy resources within microgrids. However, building actual microgrids requires significant preparation time and costs. In contrast, this study proposes a fully integrated MATLAB /Simulink(R2024a)-SCADA/EMS-based SILS framework that supports real-time, sub-minute-resolution data exchange, enabling dynamic operational analysis and validation for both grid-connected and islanded microgrid scenarios. To minimize on-site work, we conduct pre-validation using Hardware-in-the-Loop Simulation (HILS) tools like PSCAD and RTDS [10,11,12,13,14,15,16]. Nevertheless, setting up a test environment requires substantial costs and equipment.
Software-in-the-Loop Simulation (SILS) plays a vital role in meeting these requirements. SILS consists of a distributed architecture that separates controllers and software-based virtual models over a network. The controller outputs serve as inputs to the virtual model, which simulates the behavior of the physical system in a highly sophisticated, real-time environment based on commands received from the controller [2]. Controller outputs are used as inputs for virtual models, which simulate the physical system’s behavior in real-time according to controller commands. The SILS environment offers a secure platform for controller validation by replacing physical hardware with virtual models. Additionally, SILS environments support real-time data exchange between controllers and virtual models, enabling the pre-evaluation of how control commands affect actual systems. While the proposed SILS environment does not interact with physical hardware directly like HILS, it does facilitate near real-time data exchange with SCADA and EMS platforms. In this framework, real-time refers specifically to the ability of SCADA/EMS to send and receive simulation data at sub-minute intervals (e.g., 1 s resolution), allowing prompt feedback and operational analysis during the simulation runtime. This functional real-time communication method enables dynamic testing and operational scheduling verification without relying on hardware-level measurements. This allows for the correction of inefficient control strategies and the maximization of operational efficiency, saving time and costs when constructing actual microgrids.
SILS is being utilized in various fields for research and validation processes [3,4,5]; specifically, SILS has proven to be an effective pre-validation method for evaluating control algorithm performance and analyzing dynamic behavior in power systems, especially microgrids. Previous studies [6,7] proposed methods combining SILS and Hardware-in-the-Loop Simulation (HILS) for synchronous condenser parameter optimization and Volt/Var control, respectively. However, these studies were limited to HILS-based simulation environments. Prior research [8] implemented a SILS environment using MATLAB/Simulink and validated inverter and motor performance by integrating it with a real-time platform. In [9], the battery energy storage system (BESS) model’s applications are proposed to simplify the modeling and computational time using MATLAB/Simulink. But these studies were limited to specific control elements. Reference [17] implemented SILS using commercial EMS software and utilized it as a validation tool for optimization algorithms; however, it neither proposed a detailed SILS framework structure nor supported real-time operation integration. Another study [17,18] proposed a MATLAB/Power Factory-based SILS framework through the Python 3.8.6 interface but only suggested a simulation environment without EMS integration. Most notably, prior works such as [17,18] lacked real-time integration with EMS and did not implement a complete SILS framework capable of end-to-end testing of control strategies. The following abbreviations are used throughout the manuscript to represent key system components and technical terms. Table 1 compares and analyzes the differences between the proposed method and previous studies.
This study proposes a new MATLAB/Simulink-based framework that makes SILS more extensible and flexible. The proposed framework communicates with SCADA/EMS to support the pre-validation of microgrid control and operation strategies. The integration of Energy Management Systems (EMSs) in microgrids plays a crucial role in optimizing distributed energy resources while minimizing operational costs. Prior research has demonstrated that employing advanced optimization strategies within EMS significantly enhances grid stability and economic efficiency [19]. This framework enables optimal daily operation planning for microgrids by leveraging SCADA/EMS, allowing it to produce optimal daily operation results for the microgrid being constructed. SCADA/EMS provides initial values based on optimal scheduling and collects data in real-time. To control actual distributed resources, a PLC-based replica microgrid controller (R-MGC) is used to send virtual signals to actual resources. An IEEE 13-bus-based testbed was designed, and key operation scenarios were presented and analyzed to verify the expandability and effectiveness of the proposed SILS framework, constructing a reliable feasibility study environment that can connect to actual control signals. The main contributions of this study are summarized as follows:
  • The study presents a fully integrated SILS-EMS-SCADA framework that enables cost-effective and scalable pre-validation of microgrid operations.
  • A detailed grid optimal operation algorithm is proposed and implemented on an IEEE 13-bus system with real-world constraints including ESS, EVCS, and DG.
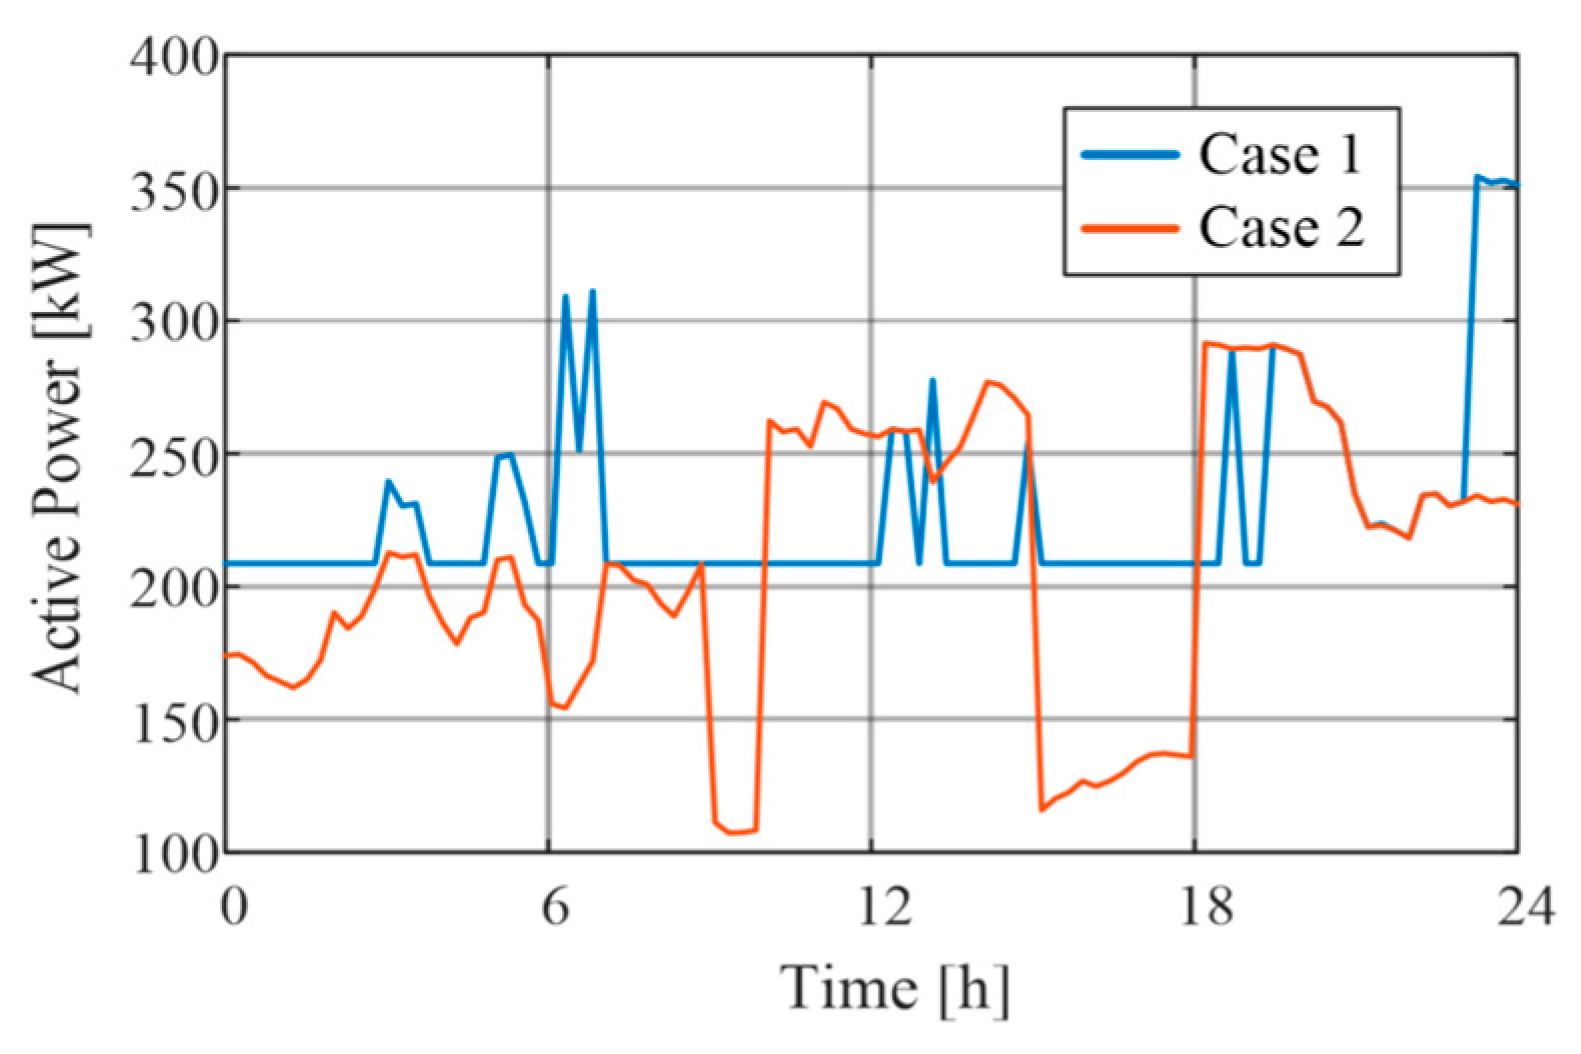
  • The proposed model demonstrates a 17.84% cost reduction and significant flattening of the load profile, improving grid flexibility.
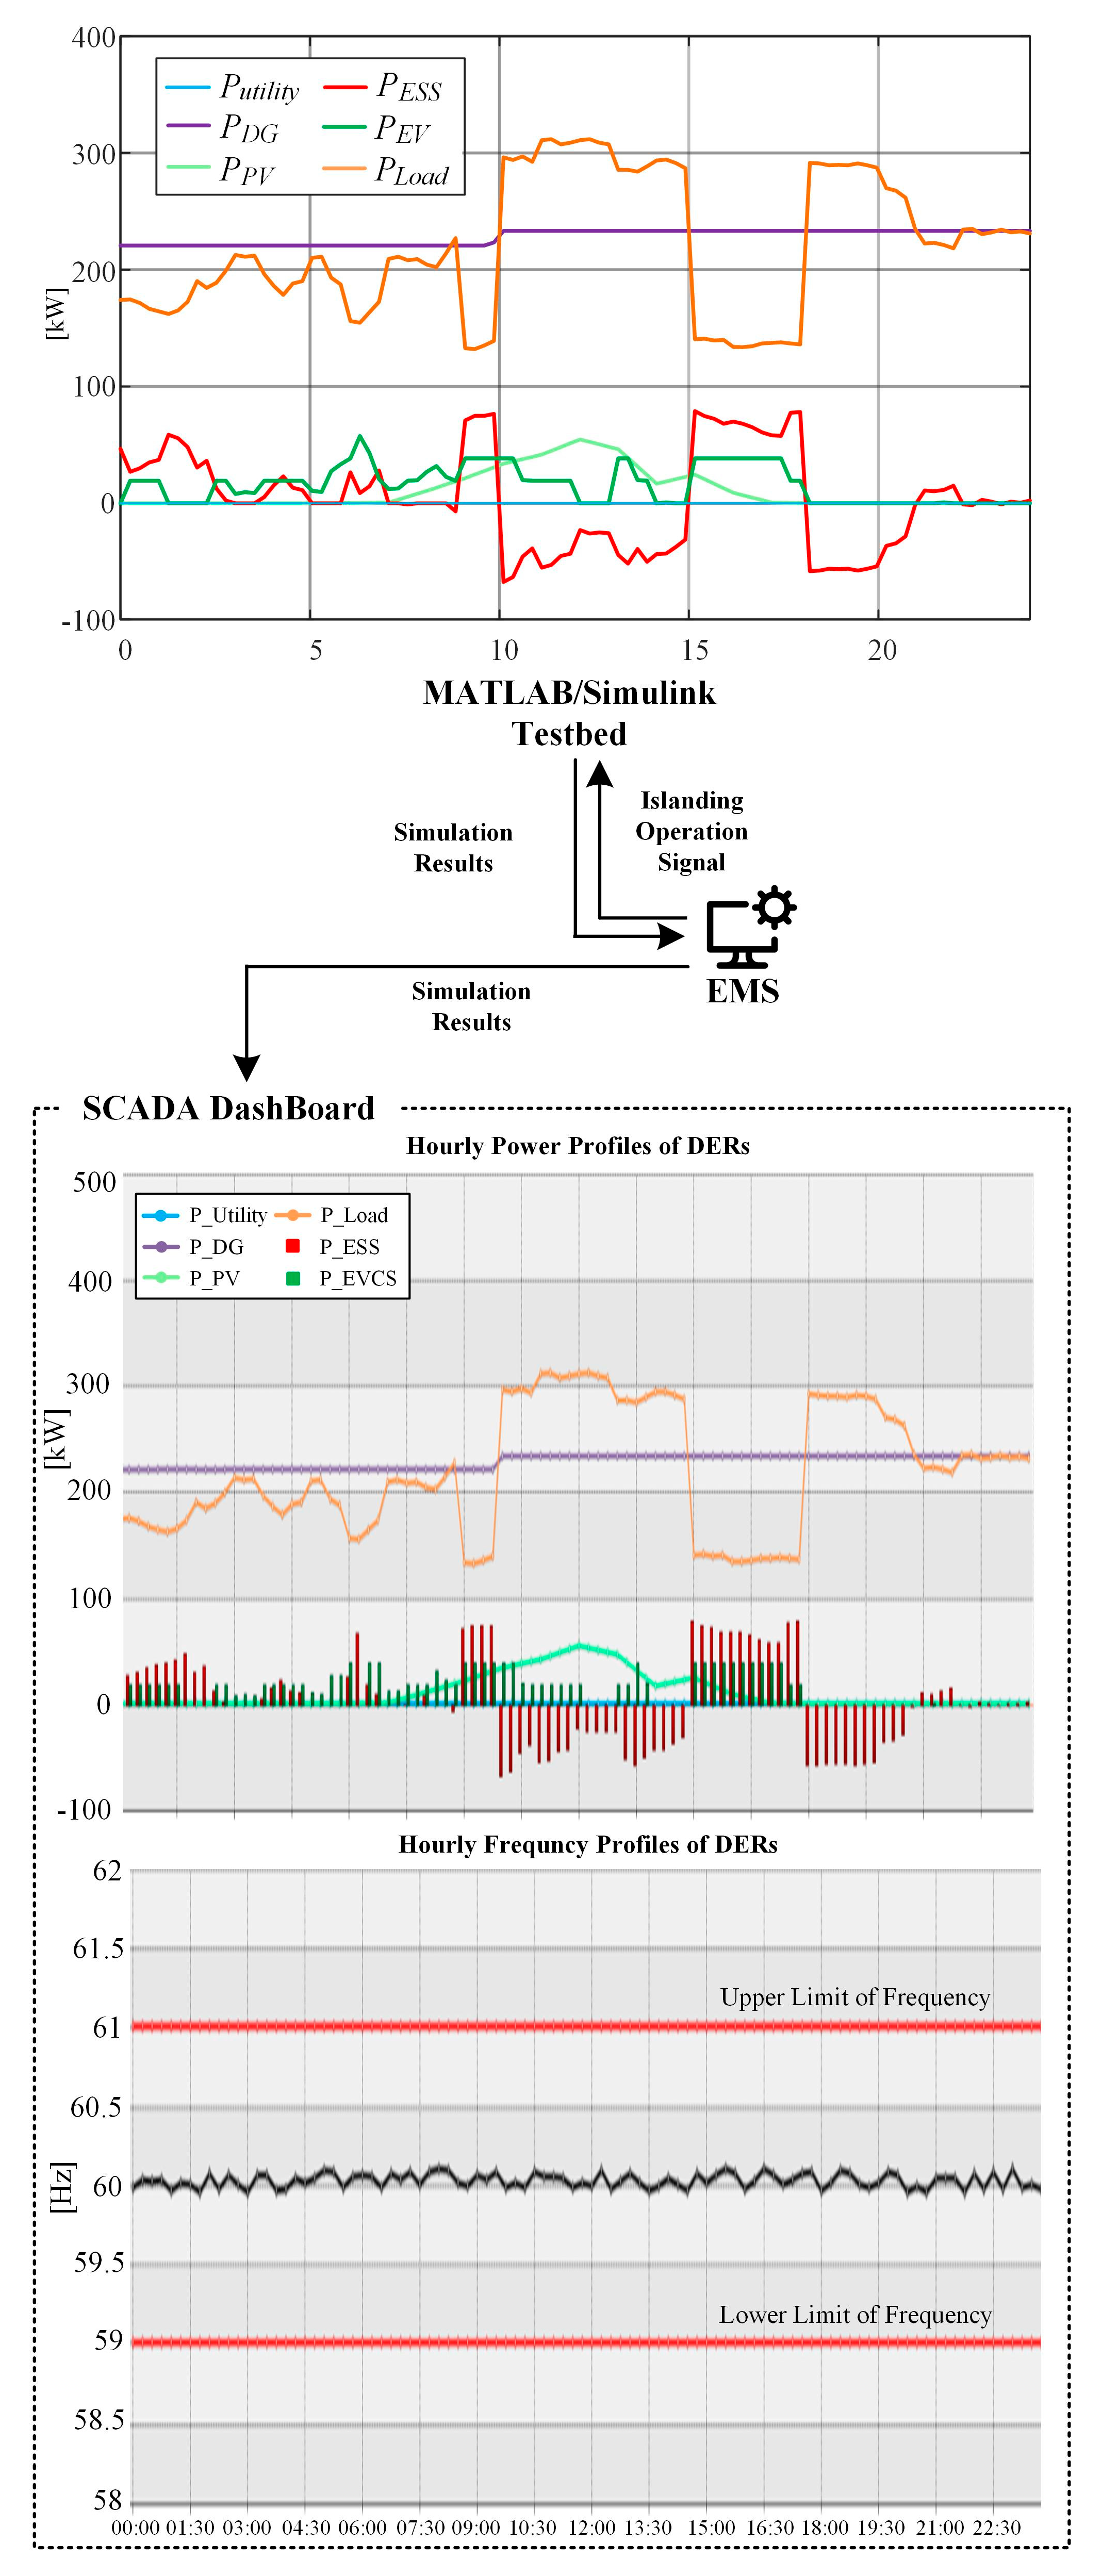
  • The framework supports both grid-connected and islanded scenarios and enables a real-time simulation interface via APIs and database management using Python.
  • A novel SILS framework that seamlessly integrates with SCADA/EMS platforms through HTTP-based APIs for real-time simulation and monitoring.
  • The implementation of a day-ahead optimal scheduling algorithm for DERs using MILP, validated through dynamic SILS testbed simulations.
  • The demonstration of operational cost savings, load curve flattening, and stability enhancement in both connected and islanded modes.

2. Methodology

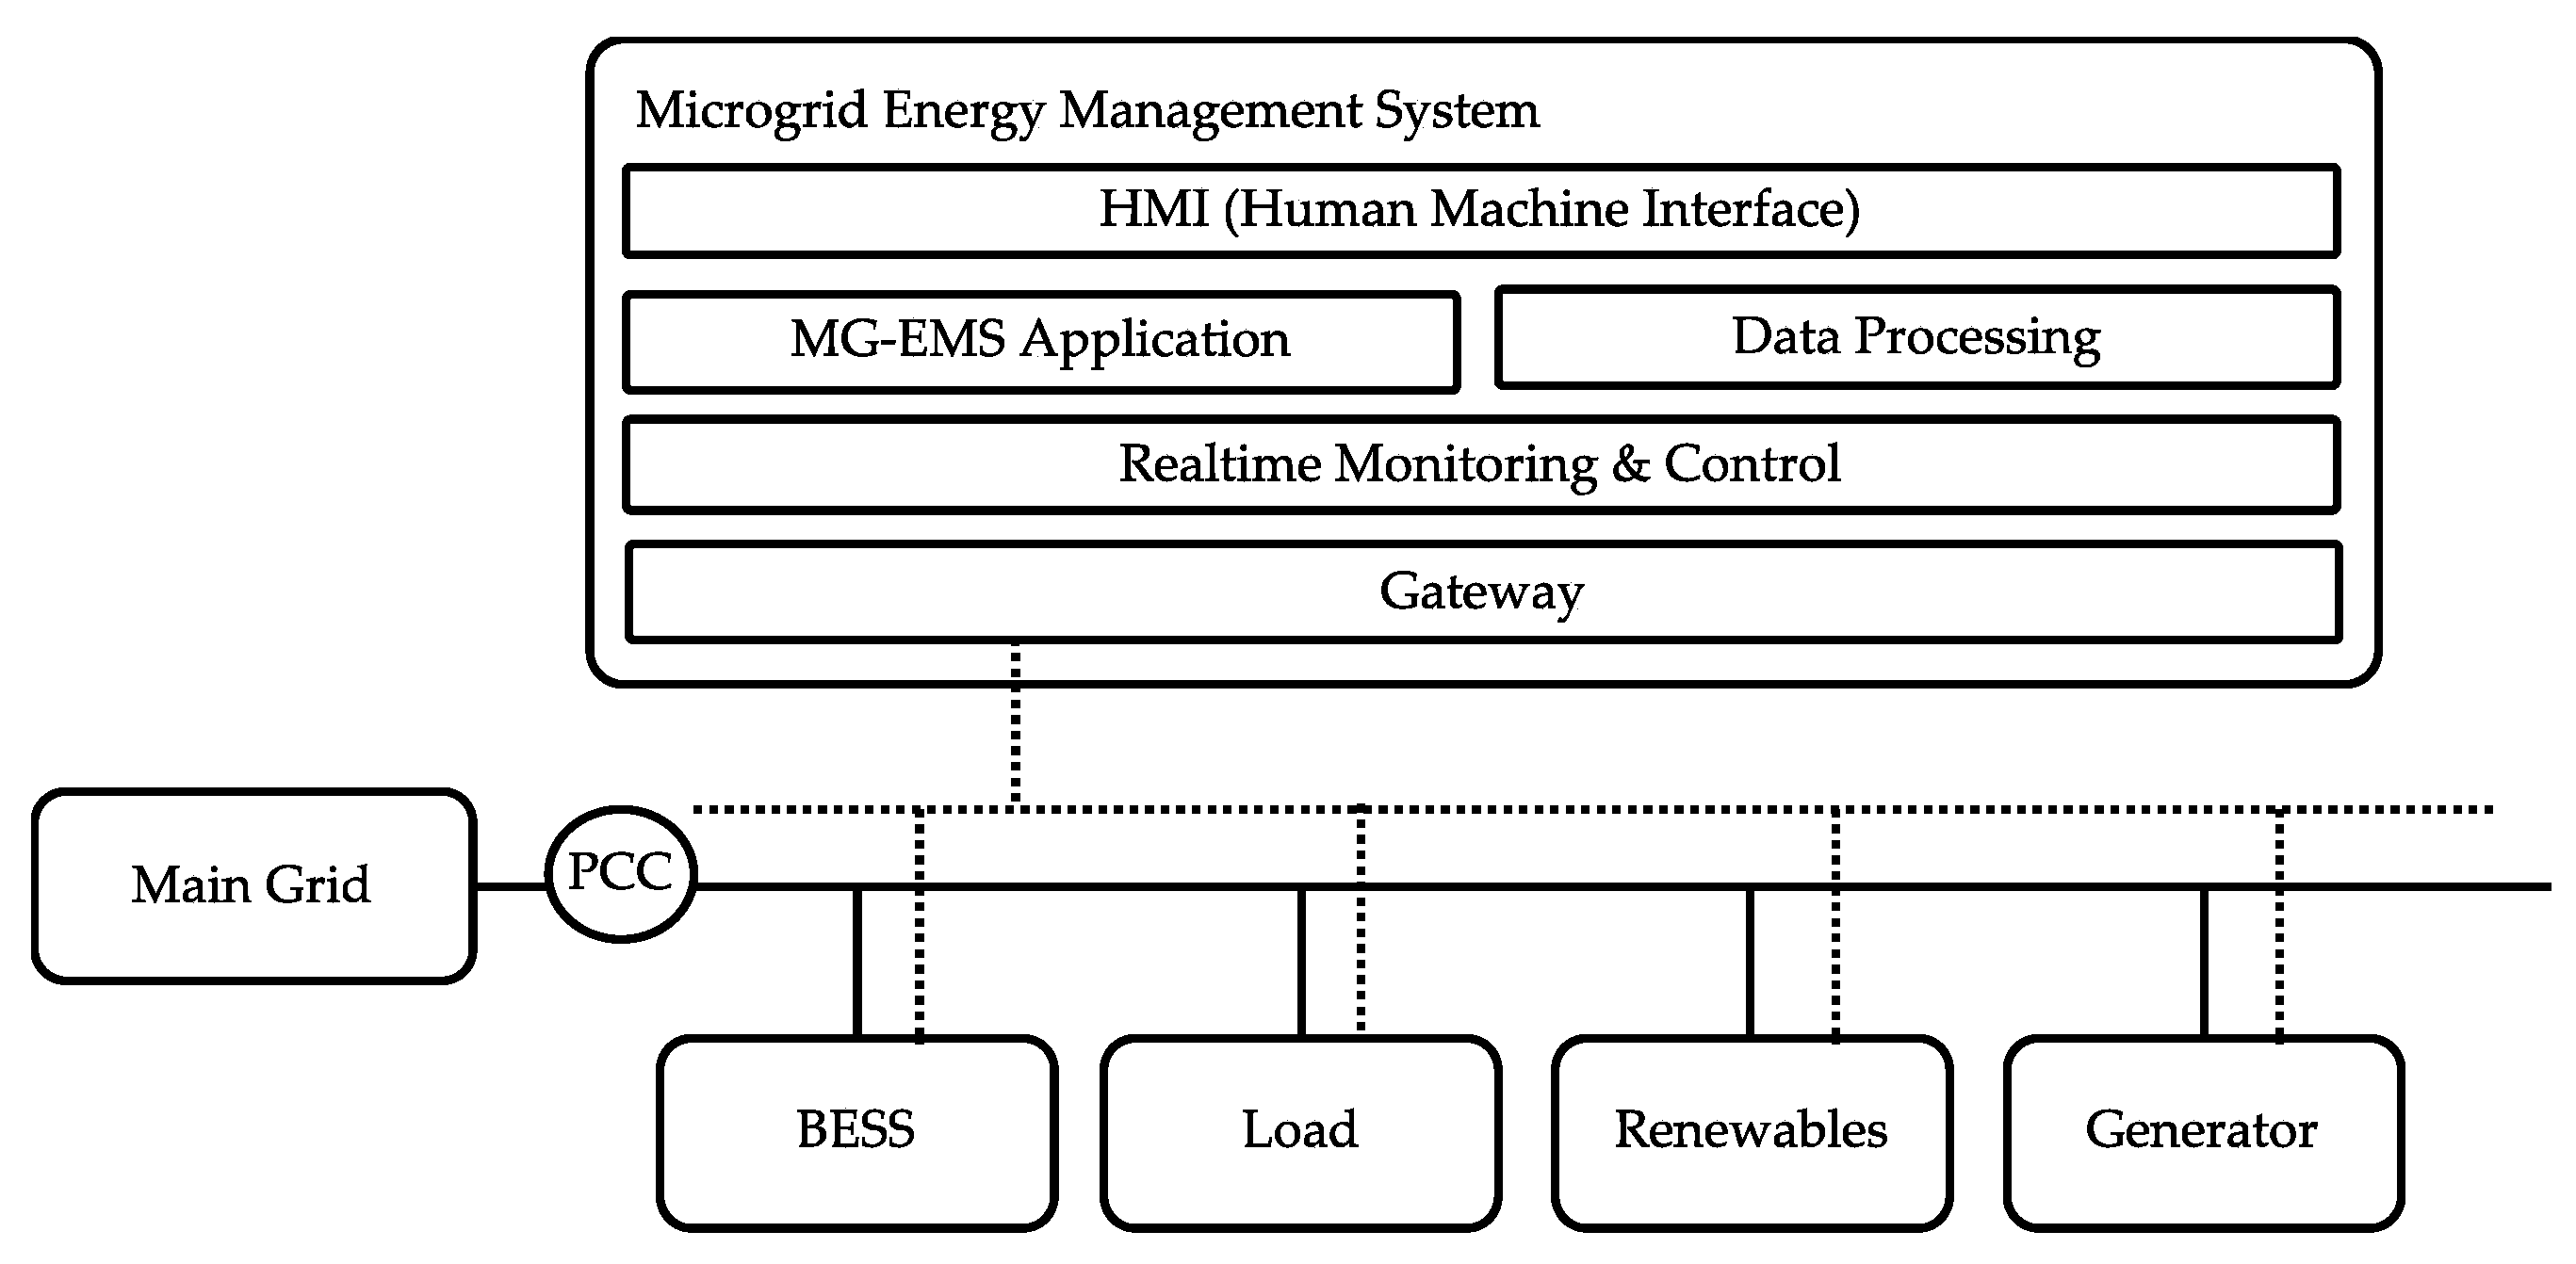
2.1. Energy Management System (EMS)

Microgrid EMS monitors and controls various distributed resources and loads connected to the main grid. It collects and monitors real-time data in compliance with standards such as the IEC 61850 power device communication protocol and the IEC 61131-3 PLC standard. The system provides data storage capabilities and includes alarm, report, and dashboard functions to effectively control distributed resources. By monitoring the status of power facilities and the grid based on real-time data, it enables MG applications such as state estimation, fault diagnosis, prediction, and optimization to operate effectively.
The architecture of the microgrid Energy Management System (EMS) is illustrated in Figure 1. It supplies power from various distributed energy resources and the main grid. Under normal conditions, the system operates the grid with a focus on economic efficiency and environmental sustainability. In certain situations, it also supports islanded operation during power outages. The overall structure of the microgrid simulation is shown in Figure 2, with key components including data processing, SCADA/EMS for monitoring and control, and data collection, as well as SILS and PLC.
The power system is configured using Matlab/Simulink, allowing for the setting of initial modeling values for distributed power sources and the power system. Data processing is responsible for preprocessing and storing data collected from the designed microgrid site. The OPC-UA (Open Platform Communication Unified Architecture) protocol is used for data communication between the microgrid site and the data processing hub, providing high compatibility and security. The system includes an EMS (Energy Management System) server, which contains a database for storing operational and simulation result data of the microgrid. The EMS supports real-time optimization based on the designed system values. It monitors real-time operational data and simulation results of the microgrid and updates the distributed power source profile of the actual microgrid EMS. The updated control signals are transmitted to the replica PLC (programmable logic controller) to perform local control via AGC signals. In this process, it is crucial to pre-validate the appropriateness of the generated control signals to ensure power grid stability and optimized operation. This study proposes a SILS (Software-In-the-Loop Simulation) framework as a validation tool for this purpose.
Compared to previous approaches [8,9,17,18] that often relied on partial simulations or lacked real-time SCADA interactions, the proposed framework enables bidirectional data flow between SCADA/EMS and MATLAB/Simulink environments. While earlier studies validated limited control components or static scenarios, this study addresses complete microgrid operational strategies including optimal scheduling, dynamic behavior simulation, and flexible switching between grid-connected and islanded modes. By supporting a real-time feedback loop, the proposed SILS platform enhances the reliability and scalability of pre-validation processes for practical microgrid deployments.

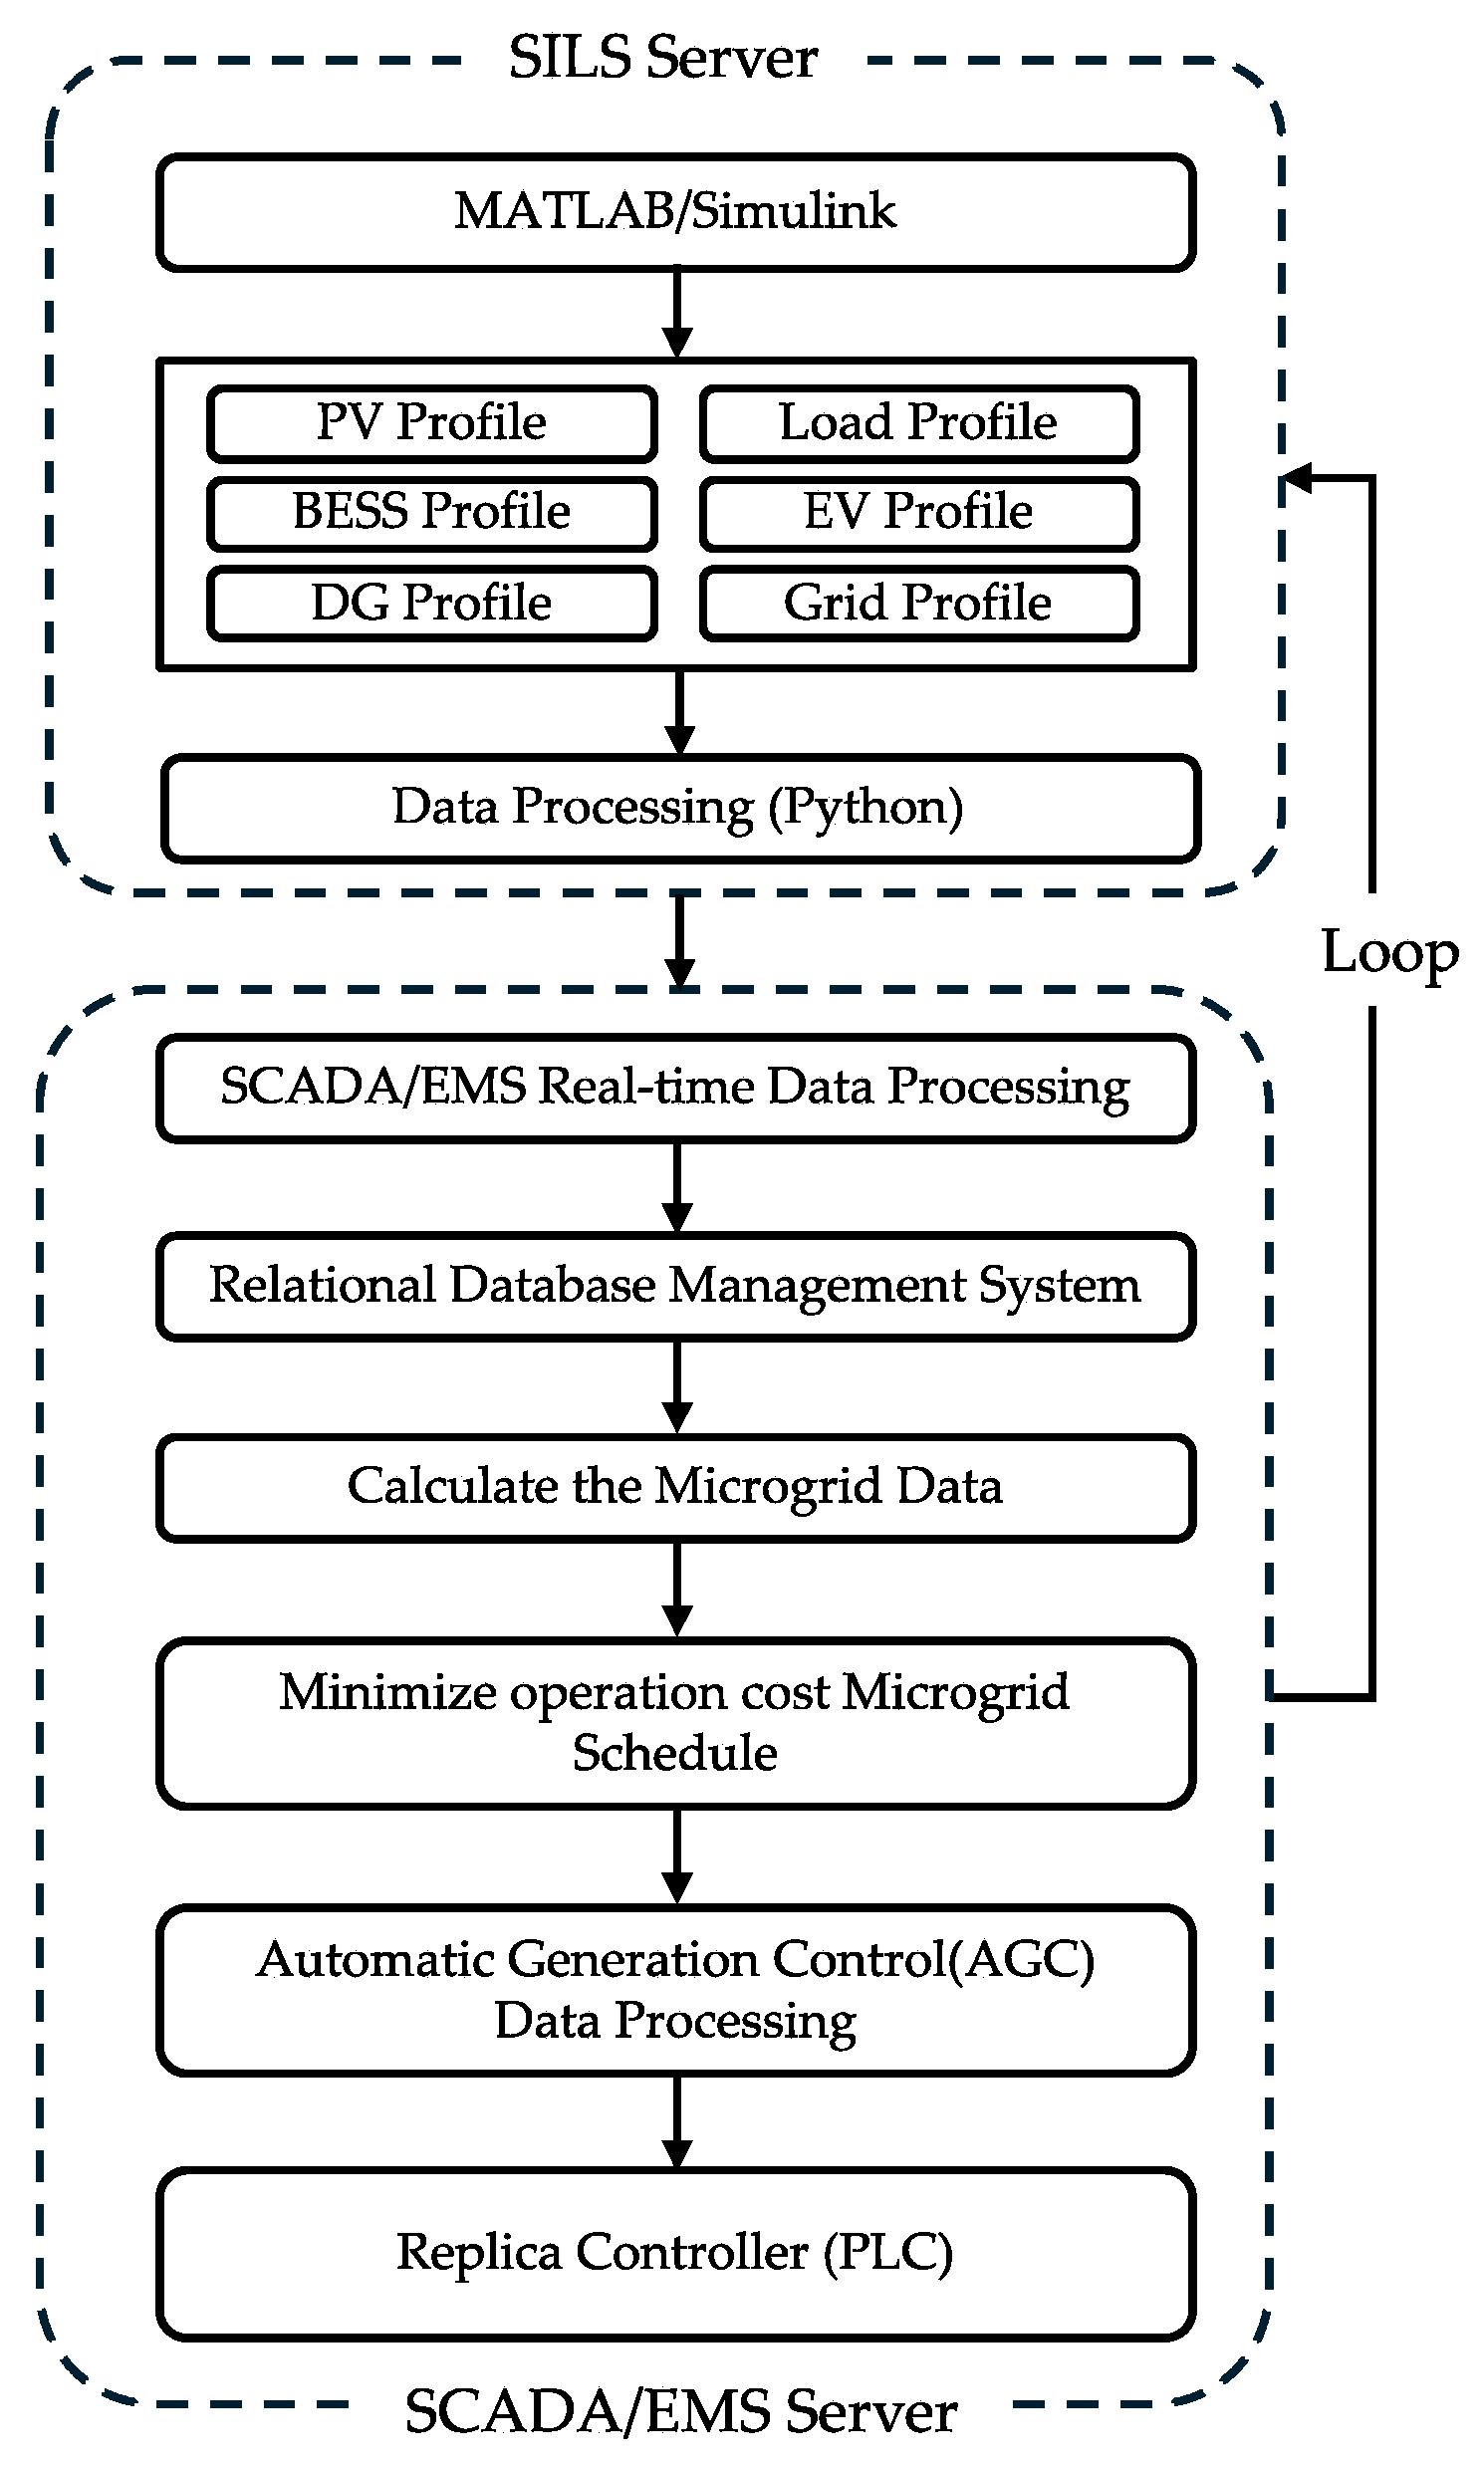
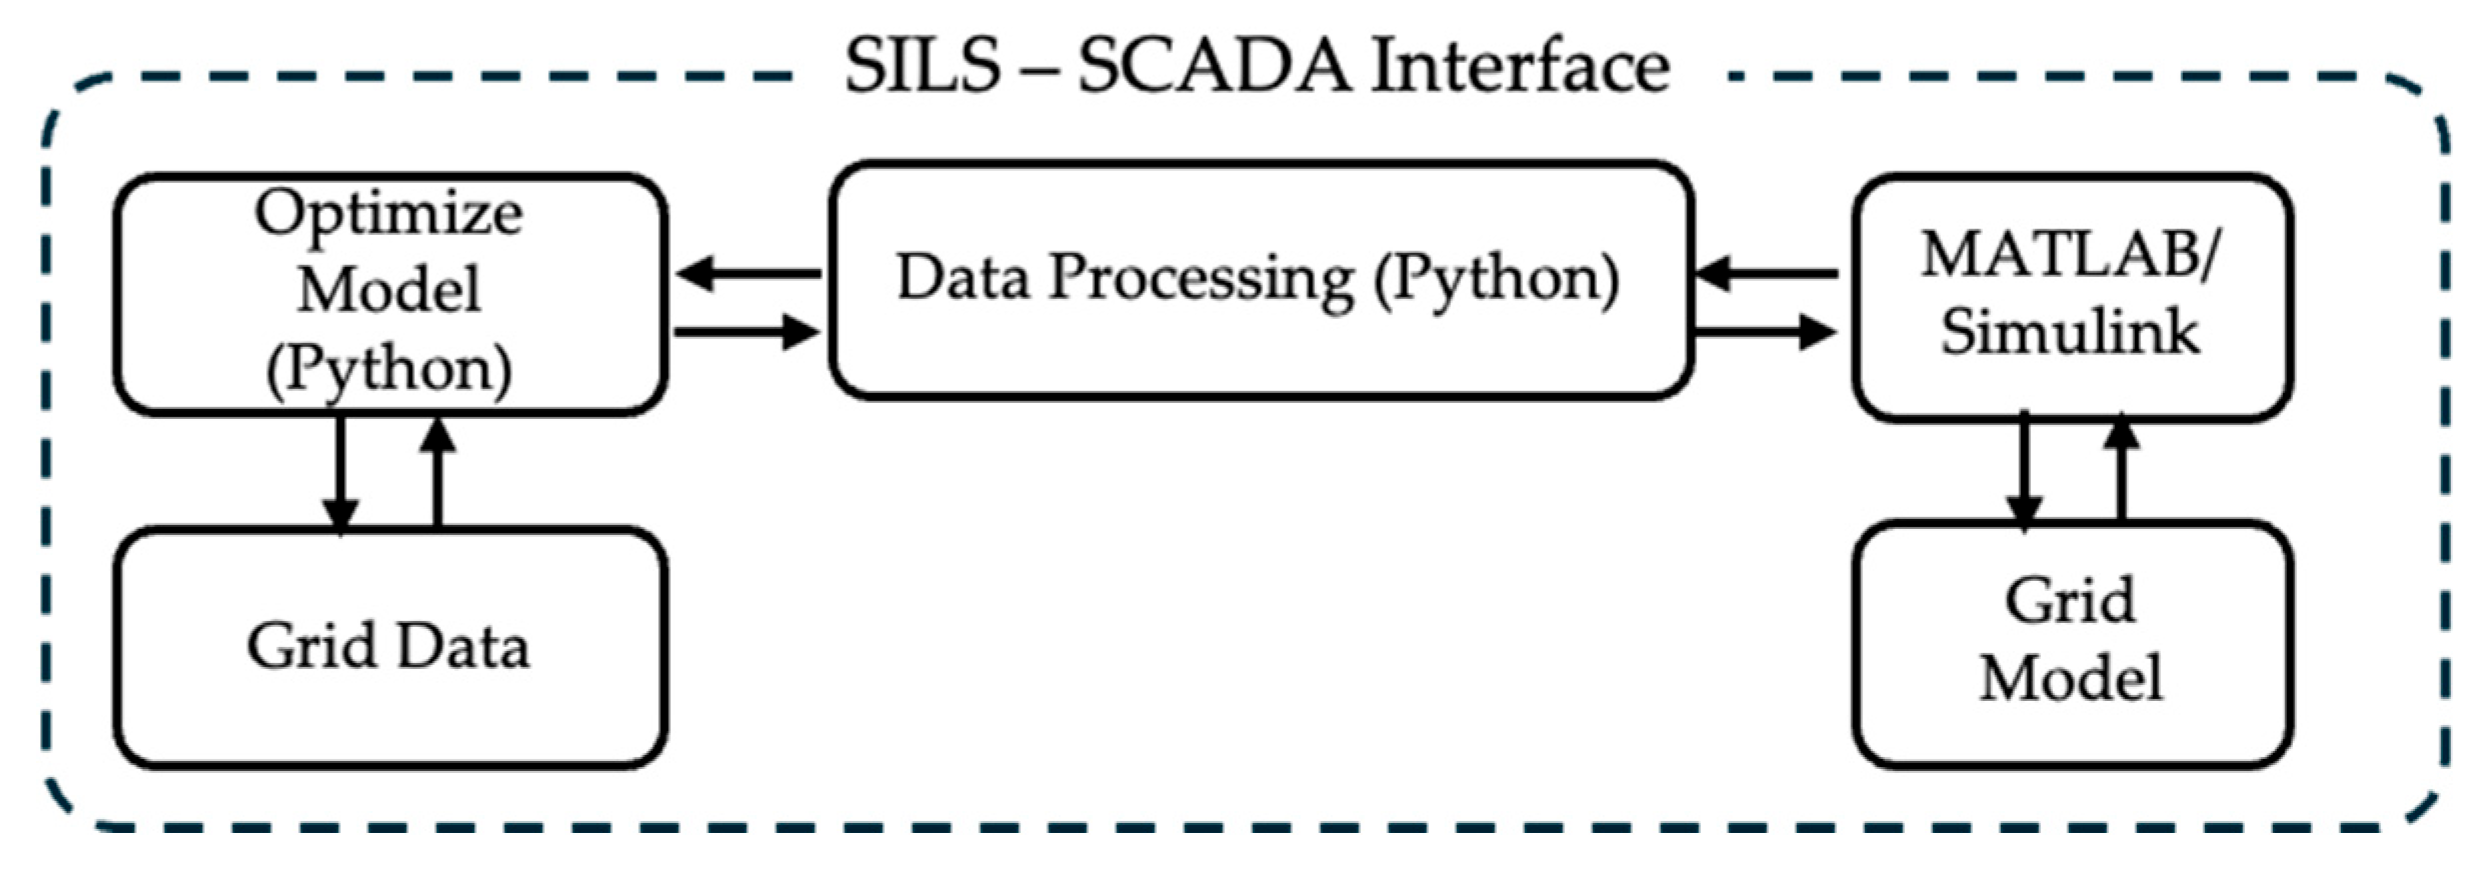
2.2. SILS (Software-in-the-Loop Simulation) Framework

The simulation setup in the SILS environment is configured by integrating SCADA using API (application programming interface) calls through HTTP (hypertext transfer protocol) requests. The HTTP-based request method offers the advantage of being usable in various network environments without relying on specific network infrastructure. The API acts as an interface that enables data exchange between SCADA and the SILS environment, supporting standardized system interactions. SCADA transmits operational data and simulation parameters, such as load profiles and ESS capacity, to SILS via HTTP requests. SILS then performs simulations based on these data and returns simulation results, including frequency and voltage data, back to SCADA.
This framework is built based on MATLAB/Simulink and SCADA systems. By effectively combining the advantages of both software platforms, it enables the simulation and validation of complex systems like microgrids. It is updated using Python and a database to ensure efficient and precise operations. MATLAB/Simulink is a powerful tool that allows for intuitive power system modeling and analysis, control algorithms, and ƒ dynamic simulations. It provides libraries that can model various power system components and simulate their dynamic responses, making it suitable for analyzing detailed microgrid characteristics. However, MATLAB/Simulink may have limited flexibility when integrating with external libraries and tools. For tasks such as repetitive data processing or simulation automation, languages like Python are more effective.
Python data processing plays a crucial role in integrating with the EMS server and SCADA. It processes simulation configurations and operational data provided by SCADA, converting them into simulation parameters for MATLAB/Simulink. The generated simulation results are transmitted to the EMS server via SCADA for monitoring. Interface scripts between Python and MATLAB facilitate the transfer of data into the MATLAB/Simulink environment.
As illustrated in Figure 3, the SILS-SCADA interface is built using HTTP APIs to enable real-time communication between simulation and monitoring systems. In the MATLAB/Simulink environment, simulations are performed using transmitted data (load profiles and distributed resource input values), and the generated simulation results, such as voltage profiles and transmission line power data, are saved as CSV files. These files are then transmitted to the Python environment via the Python interface. These data are stored in a database that is designed to be visualized through the SCADA dashboard. The process is designed to record data at 15 min intervals in the Python environment and at 1 s intervals in the MATLAB/Simulink environment. This integrated structure provides a SILS framework that minimizes errors in the data exchange process while maintaining the independence of Python and MATLAB/Simulink, ensuring smooth operation. Figure 4 shows the physical configuration of the SILS testbed, including controller interfaces and network connectivity.

2.3. Optimal Grid Operation Algorithm
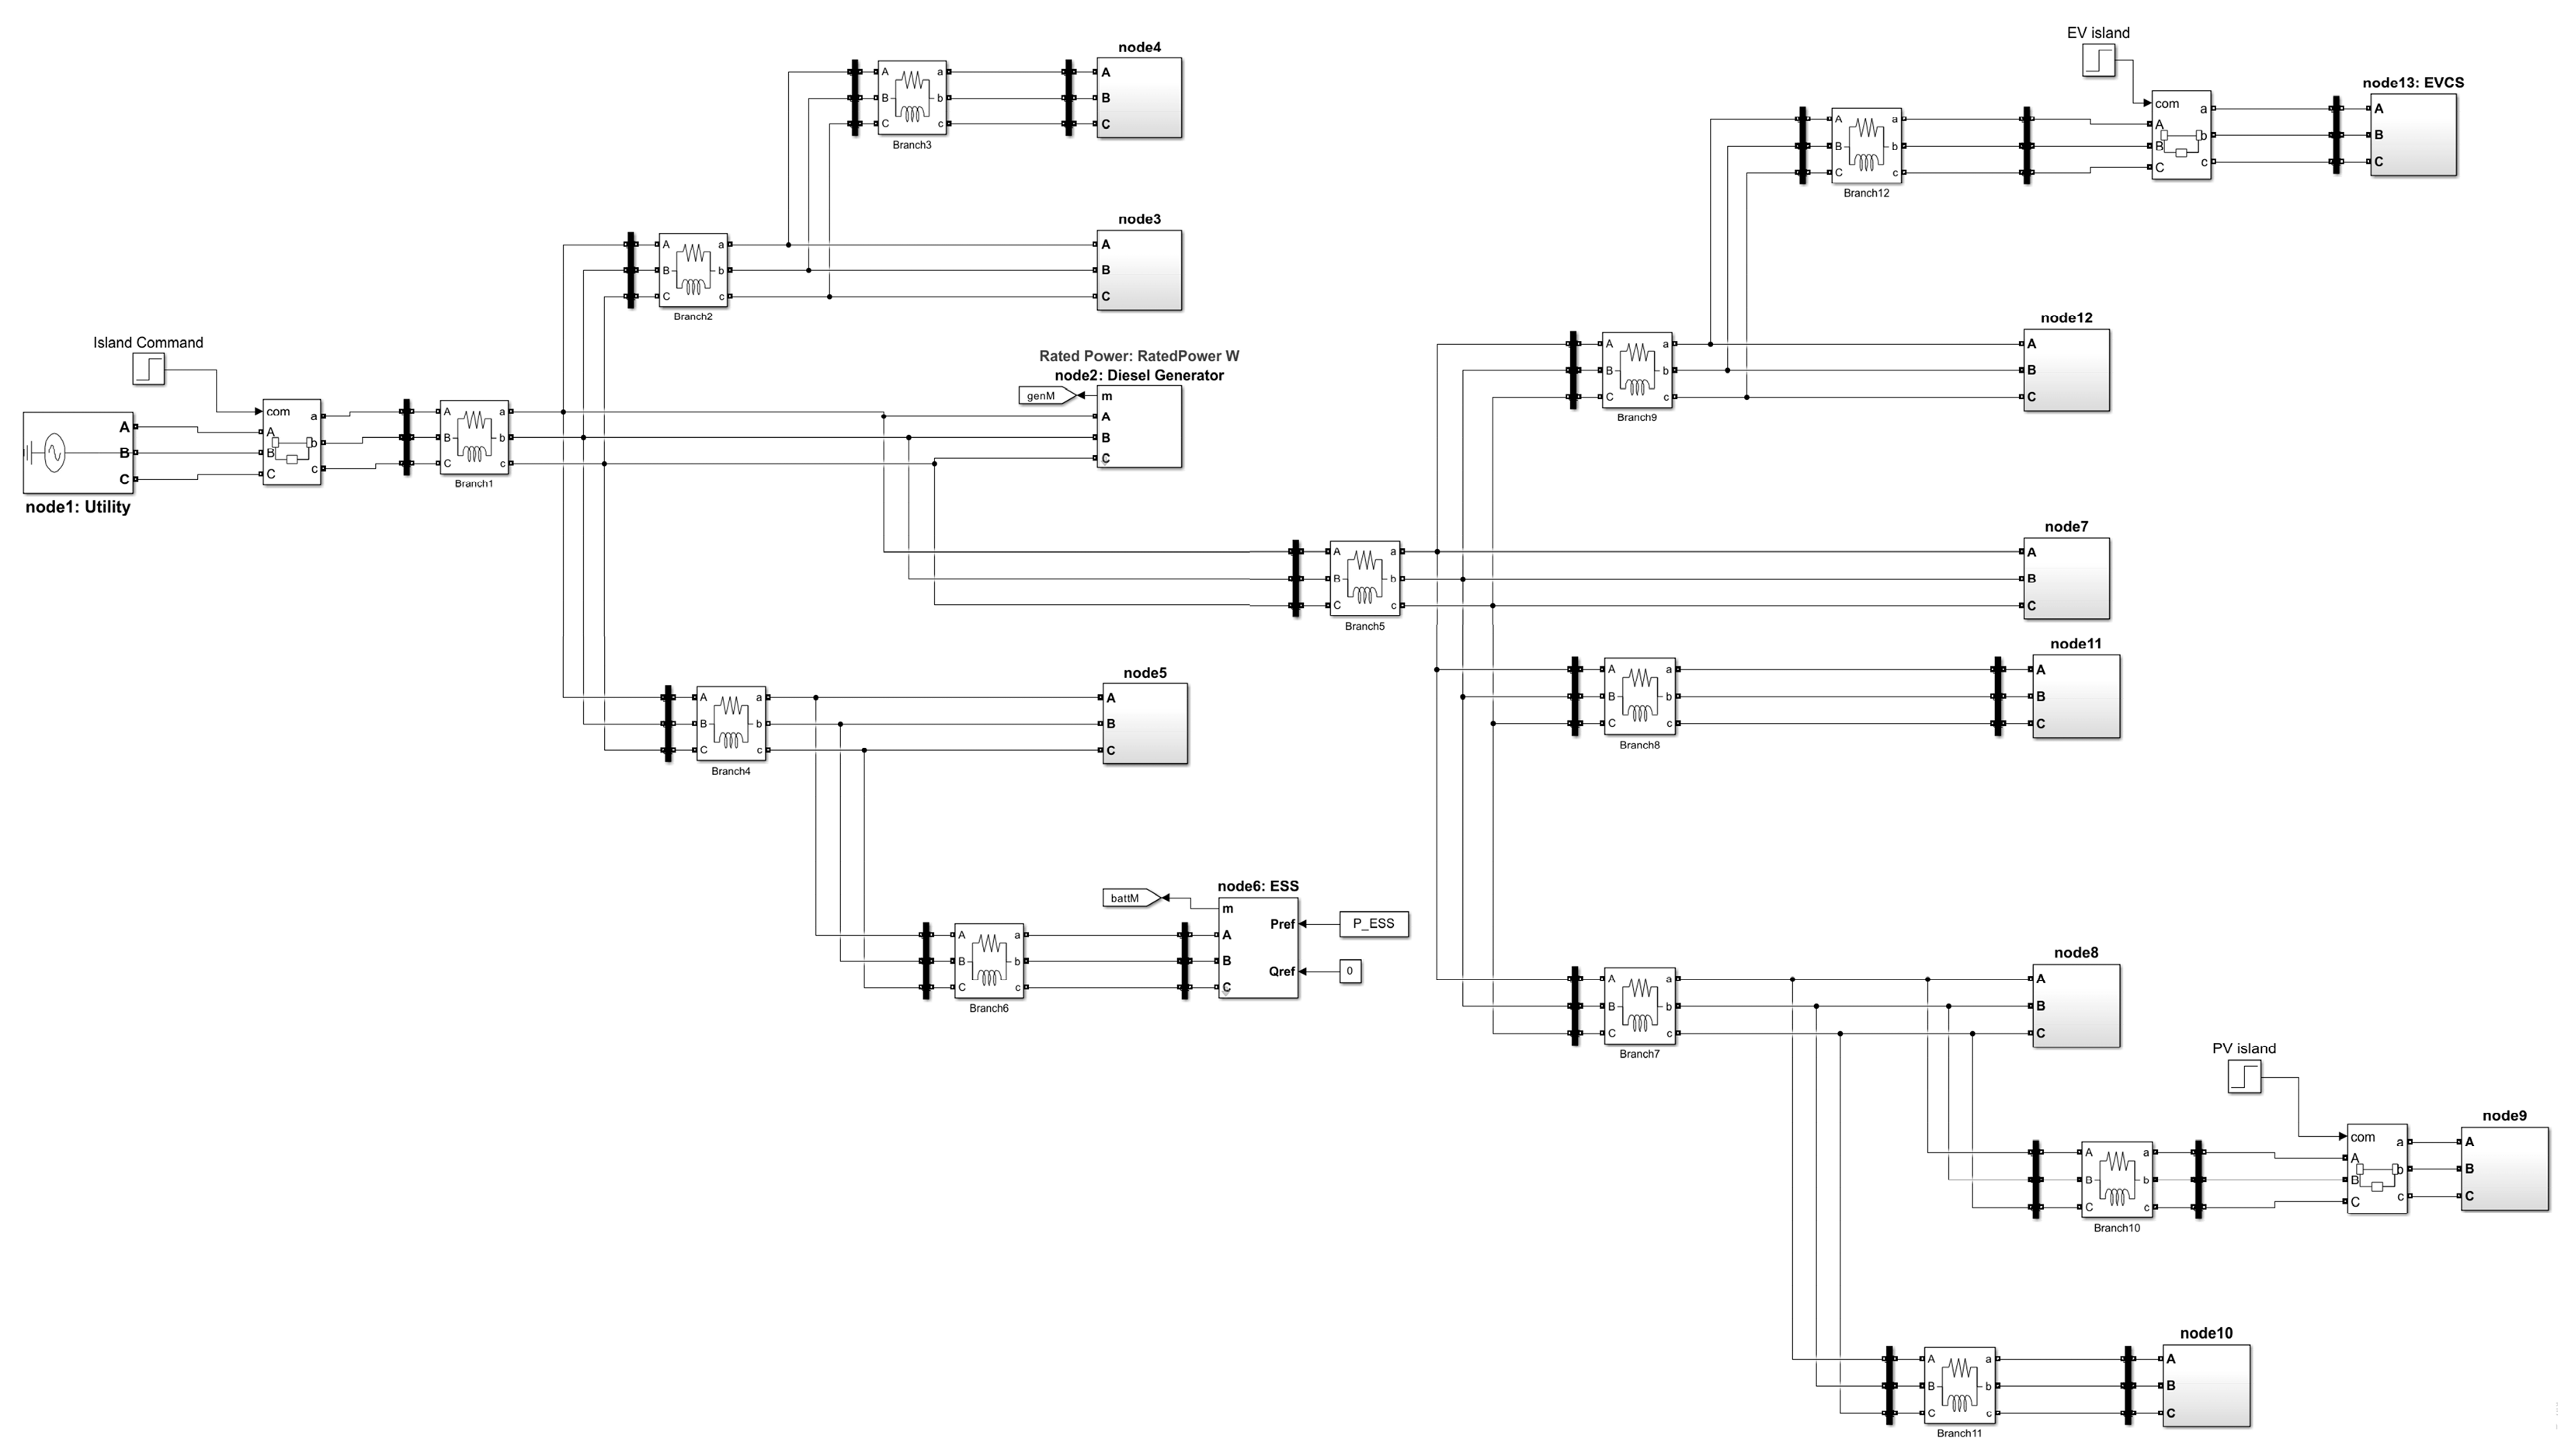
This chapter provides a detailed explanation of the optimization simulation method designed to achieve the economic operation of a microgrid system that incorporates various Distributed Energy Resources (DERs). This chapter aims to achieve the economic operation of a microgrid system that includes various distributed power sources. It presents the topology of the proposed system, which consists of a common coupling point (PCC) with the main power grid, diesel generators, solar power generation, energy storage systems (ESSs), and electric vehicle charging stations, among other distributed energy resources. The system topology of the microgrid is depicted in Figure 5, which starts from Node 1 representing the main grid, and includes PV, ESS, DG, and EVCS units across an IEEE 13-bus network.
To address the energy management of a small-scale microgrid, we formulated a day-ahead scheduling optimization problem that aims to minimize the total operational cost over a 24 h horizon with hourly resolution. The microgrid consists of various distributed energy resources (DERs), including energy storage systems (ESSs), loads, diesel generators, and electric vehicle charging stations (EVCSs). The problem accounts for the operational constraints of these DERs while determining their optimal hourly dispatch. The optimization model is formulated as a mixed-integer linear programming (MILP) problem. Integer variables are introduced to capture the discrete nature of certain operational decisions, such as the charging/discharging status of the ESS and the parking/non-parking status of EVs.
The optimization problem is implemented in Python using the OR-Tools optimization library, with the CBC (Coin-or branch and cut) solver employed to solve the MILP. OR-Tools is a high-level optimization framework developed by Google, and its integration with the open-source CBC solver enables the efficient and flexible handling of mixed-integer linear problems (MILPs) in Python environments. The solver was configured with a relative MIP gap tolerance of 1 × 10⁻⁴ and a time limit of 300 s to ensure a balance between computational efficiency and solution precision. These settings allow the optimization process to terminate once a near-optimal solution is found within a reasonable margin, thereby avoiding excessive computation time without compromising practical accuracy. In typical cases, such as the IEEE 13-bus system with a 24 h scheduling horizon, the solution was obtained within 0.718 s. Nonetheless, the overall computation time and convergence behavior are influenced by factors such as the number of distributed energy resources (DERs), time granularity, and the system’s topology.
Overall, this formulation and computational setup allowed for an efficient and realistic exploration of day-ahead operational strategies in microgrids, providing valuable insights into the coordinated use of storage and generation assets under cost-minimization objectives.
The objective function to minimize the operating cost of a microgrid can be formalized as follows, though Equation (2) is not provided in your text. Generally, such a function might look like this:
m i n t T c t P t u + k N D G F k D G P t , k , s D G c t e v P t c h , E V S + α 1 U 1 , t
U 1 , t = m a x 0 , P t u P cont  
F k D G P t , k , s D G = s N k seg   π k , s D G P t , k , s D G 0 U 1 , t M I t U
P t u P cont   U 1 , t P t u P cont   + M 1 I t U
where
c t P t u : the power purchase cost of grid import at time t;
k : the index for a diesel generator;
s : linear segments of a diesel generator;
N D G : the number of diesel generators;
F k D G P t , k , s D G : The section sss cost of diesel generator k at time t;
c t e v P t c h , E V S : EVCS charging revenue at time t;
α 1 U 1 , t : The penalty cost for exceeding the contracted power at time t;
P cont   : contracted power;
N k s e g : the number of linear sections of generator k;
π k , s D G P t , k , s D G : the linearization coefficient at section sss of diesel generator k;
I t U : A binary variable indicating whether the contracted power is exceeded at time t.
In Equation (2), since the penalty cost for exceeding the contracted power includes a maximum operation and is therefore nonlinear, the Big M method was applied as shown in Equation (4) to achieve linearization. Additionally, piecewise linearization was introduced in Equation (3) to approximate the nonlinear relationship between the diesel generator cost and the output power as a linear function. Through this approach, the output curve of the diesel generator was linearized [20].
P D G m i n P D G P D G m a x
Q D G m i n Q D G Q D G m a x
r d P D G t P D G t 1 r u
P t , k D G = s = 1 N k S e g P t , k , s D G
P t , k , s D G S e g k , s
where
r d , r u : the down and up ramp rate limits of the diesel generator;
S e g k , s : the size of linear section sss of diesel generator k.
Equations (5) and (6) constrain the minimum and maximum limits of active and reactive power outputs of the diesel generator. Additionally, Equation (7) restricts the output power variation in the diesel generator from time t−1 to t to remain within specified limits. These constraints ensure that the diesel generator operates stably while complying with technical and physical limitations. Equation (8) represents that the sum of diesel generator outputs across linear segments equals the total diesel generator output, while Equation (9) constrains the diesel generator output in each linear segment s to not exceed the size of that linear segment. Equation (6) represents the state of charge (SOC) calculation from time t to t + 1, incorporating the charging and discharging efficiencies of the Energy Storage System (ESS). By introducing the binary variable I E S S , Equations (7) and (8) constrain the ESS to maintain only one state between charging and discharging, thereby preventing the physically impossible situation of simultaneous charging and discharging. Furthermore, Equation (9) enforces compliance with minimum and maximum SOC limits to prevent performance degradation due to the overcharging and over-discharging of the ESS. For daily ESS operation planning, Equation (10) ensures operational continuity for the next day by requiring the SOC at the end of the planning period (T) to recover to its initial SOC value.
S O C t + 1 , n = S O C t , n + P t , n c h η n c h P t , n d c h / η n d c h Q n Δ t
0 P t , n c h P t , n c h , m a x I t , n E S S
0 P t , n d c h P t , n d c h , m a x 1 I t , n E S S
S O C n m i n S O C t , n S O C n m a x
S O C f i n a l , n = S O C i n i t , n
where
n: the index of ESS;
η n c h , η n d c h : the charging and discharging efficiency of ESS n;
Q n : the capacity of ESS n;
P t , n d h , P t , n d c h : the charging and discharging power of ESS n at time t;
I t , n E S S : A binary variable for the ESS activation state.
Equation (10) calculates the state of charge (SOC) transition from time ttt to t + 1t + 1t + 1 by reflecting the charging and discharging efficiency of the ESS. A binary variable is introduced in Equations (11) and (12) to constrain the ESS to either a charging or discharging state, ensuring that the ESS does not physically perform both charging and discharging simultaneously. Additionally, Equation (13) enforces the minimum and maximum SOC limits to prevent performance degradation due to overcharging or over-discharging. For the daily operation planning of the ESS, Equation (14) ensures that the SOC at the end of the planning period (TTT) returns to its initial SOC, maintaining continuity for the next day’s operation.
S O C t + 1 , e E V = S O C t , e E V E V P t , e c h , E V η e c h Q n Δ t t a t < t d
S O C e E V , m i n S O C t , e E V S O C e E V , m a x t a t < t d
0 P t , e c h , E V P e c h , E V , m a x I t , e E V t a t t d
P t , e c h , E V = 0 t < t a , t t d
S O C t a , e E V = S O C i n i t , e E V
e N E V I t , e E V N C S
where
e : the number of EVs (electric vehicles);
t a : the arrival time of an EV at the charging station;
t d : the departure time of an EV from the charging station;
I t , e E V : A binary variable for EV charging status;
N C S : The number of charging stations.
Equations (15)–(21) define the operational constraints for the EVCS. Equations (15) and (16) represent the SOC variation from the EV’s arrival time ( t e ) to departure time ( t d ) at the charging station, specifying constraints to maintain it within the minimum and maximum SOC limits. Equation (17) constrains the charging power to not exceed the maximum allowable charging power while the EV remains at the charging station, with the charging status determined by the binary variable. Equation (18) constrains the charging power to be zero during periods before arrival and after departure from the charging station. Additionally, Equations (19) and (20) ensure operational continuity by setting SOC values at arrival and departure times. Furthermore, practical considerations are incorporated by imposing constraints to ensure the number of EVs does not exceed the number of charging stations.
P t u = l P t , l Load   + n P t , n c h P t , n d c h m P t , m P V k P t , k D G + e P t , e c h , E V
Q t u = l Q t , l Load   k   Q t , k D G
P j + 1 = P j p j + 1 c + p j + 1 g
Q j + 1 = Q j q j + 1 c + q j + 1 g
V j + 1 = V j r j P j + x j Q j
P ¯ i j P i j P ¯ i j
V m i n V j V m a x
where l, n, m, k, and e: the number of loads, ESSs (Energy Storage Systems), PV (Photovoltaic) systems, diesel generators, and EVs (electric vehicles), respectively;
l : the index of the load;
m : the index of photovoltaic (PV) generation;
p j + 1 g p j + 1 c : Active power injection at bus j + 1;
q j + 1 g q j + 1 c : Reactive power injection at bus j + 1.
Equations (22) and (23) represent the active and reactive power balance for the entire system at time t, which are essential constraints ensuring the match between power supply and demand across the system. Equations (24) and (25) apply the Linearized DistFlow model to express power flow and voltage constraints in the radial distribution system. The conventional DistFlow model includes nonlinear equations for representing power flow in distribution systems; therefore, the Linearized DistFlow model was employed for computational efficiency. Equations (24) and (25) represent active and reactive power balance equations at each bus, incorporating power flow from parent bus j and power injection at child bus j + 1. Equation (26) represents the voltage drop, maintaining the voltage profile at each bus by calculating voltage drops while considering the active and reactive power in each line. These power flow and voltage constraints of the Linearized DistFlow model ensure distribution network security by imposing additional constraints in Equations (27) and (28) to satisfy line active power limits and bus voltage allowable ranges, respectively.

2.4. Grid Modeling

In this study, we implemented a SILS testbed based on the IEEE 13-bus system using MATLAB/Simulink. Figure 6 illustrates the Simulink model structure of the implemented system, which was designed with major distributed resource blocks centered around the main grid (utility), including diesel generators (DG), energy storage systems (ESSs), photovoltaic power systems (PV array), and electric vehicle charging stations (EVCSs). Additionally, the system includes measurement blocks to record and monitor output data that reflect changes in reference values, complementing its main components. Furthermore, breaker blocks were added to simulate islanded operation and distributed resource disconnection scenarios, enabling dynamic behavior analysis and system stability verification across various operating conditions. Notably, the output values from the grid optimal operation algorithm proposed in Section 2.3 are utilized as reference input values for each distributed energy resource for optimal microgrid operation.
The diesel generator was modeled as a synchronous generator incorporating an excitation system and a governor turbine, as shown in Figure 7 for frequency and voltage control.
In the grid-connected microgrid mode, the diesel generator is configured to operate by referencing output values derived from the optimal operation algorithm. Conversely, in islanded microgrid operation scenarios, the diesel generator functions as the primary frequency control source of the microgrid, maintaining system frequency stability. This ensures dynamic stability and reliability in the islanded microgrid environment.

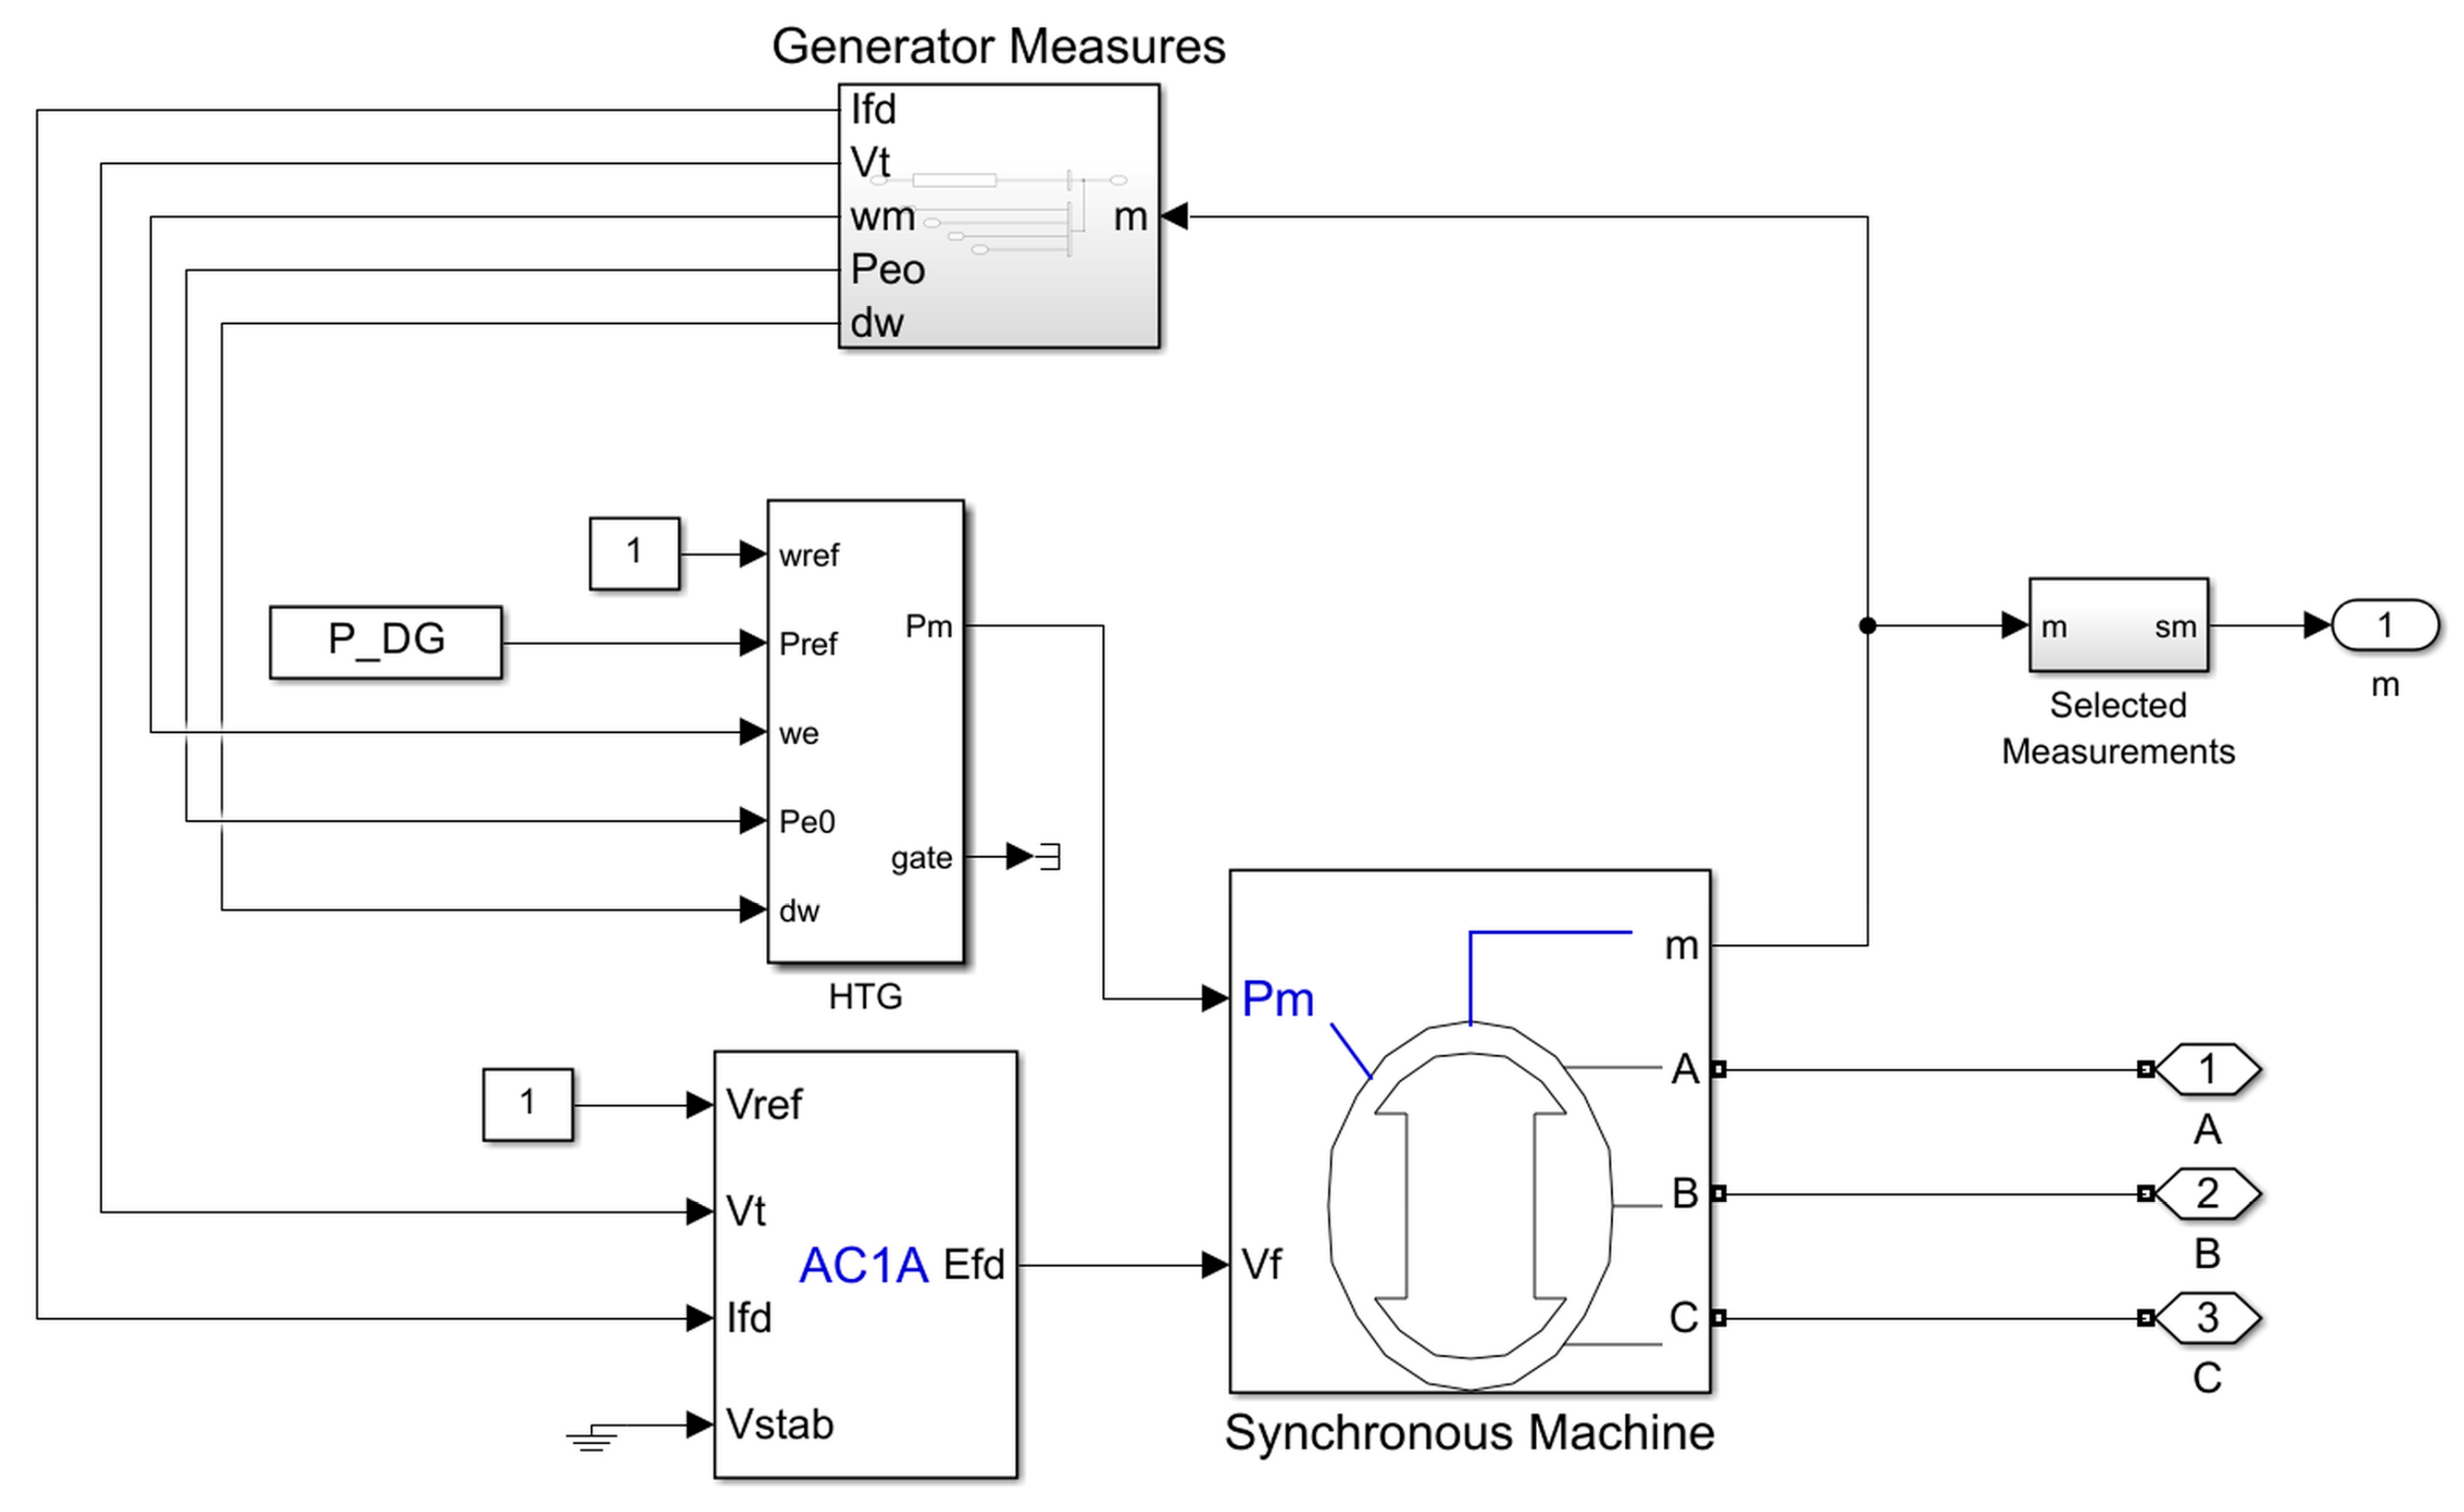
2.4.1. Diesel Generator Model

The diesel generator is implemented as a synchronous machine equipped with a voltage regulation system and a governor-based frequency controller. It operates under a power-based (PQ) control mode, allowing for the independent specification of active and reactive power references. The synchronous machine model adopts a dq reference frame and includes electrical reactance parameters that reflect the internal dynamics of both direct and quadrature axes. Time constants are defined to capture the transient response behavior of the generator under dynamic operating conditions. Additionally, the excitation system (modeled as an IEEE standard AC1A type) regulates terminal voltage using gain and time constant settings, along with voltage limits and saturation characteristics. The detailed model parameters of the diesel generator are summarized in Table 2 and Table 3. These configurations enable the generator to participate in voltage and frequency support, particularly under islanded operating scenarios.

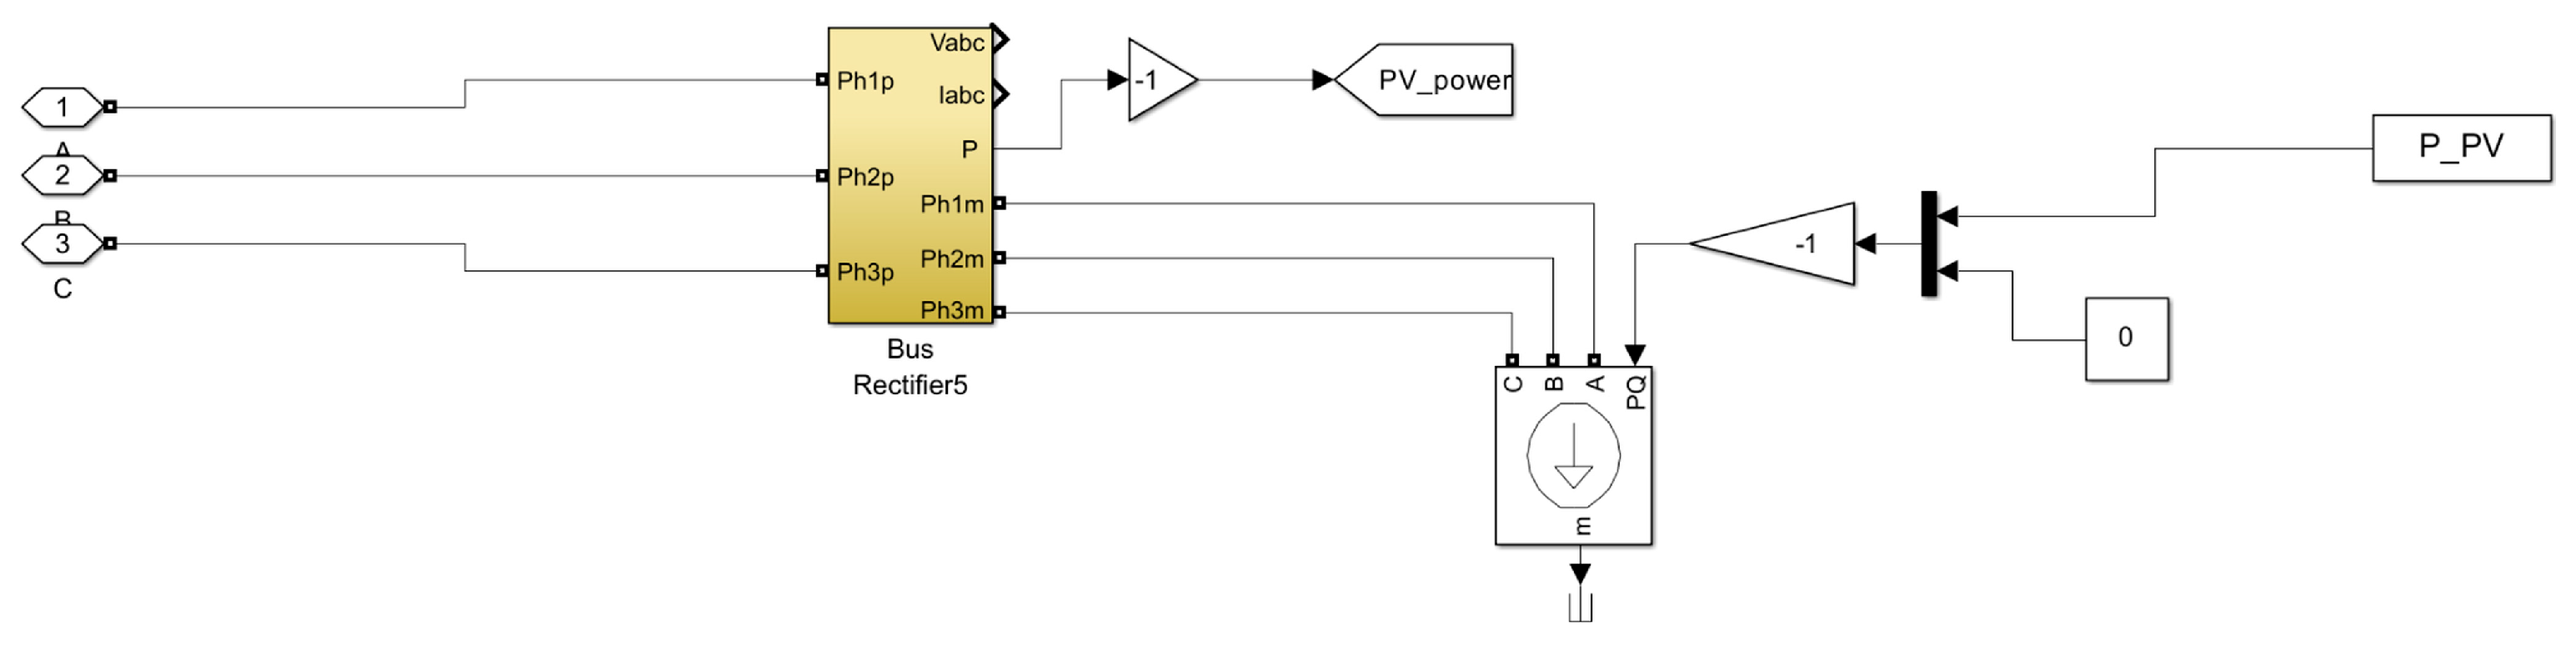
2.4.2. PV Generator Model
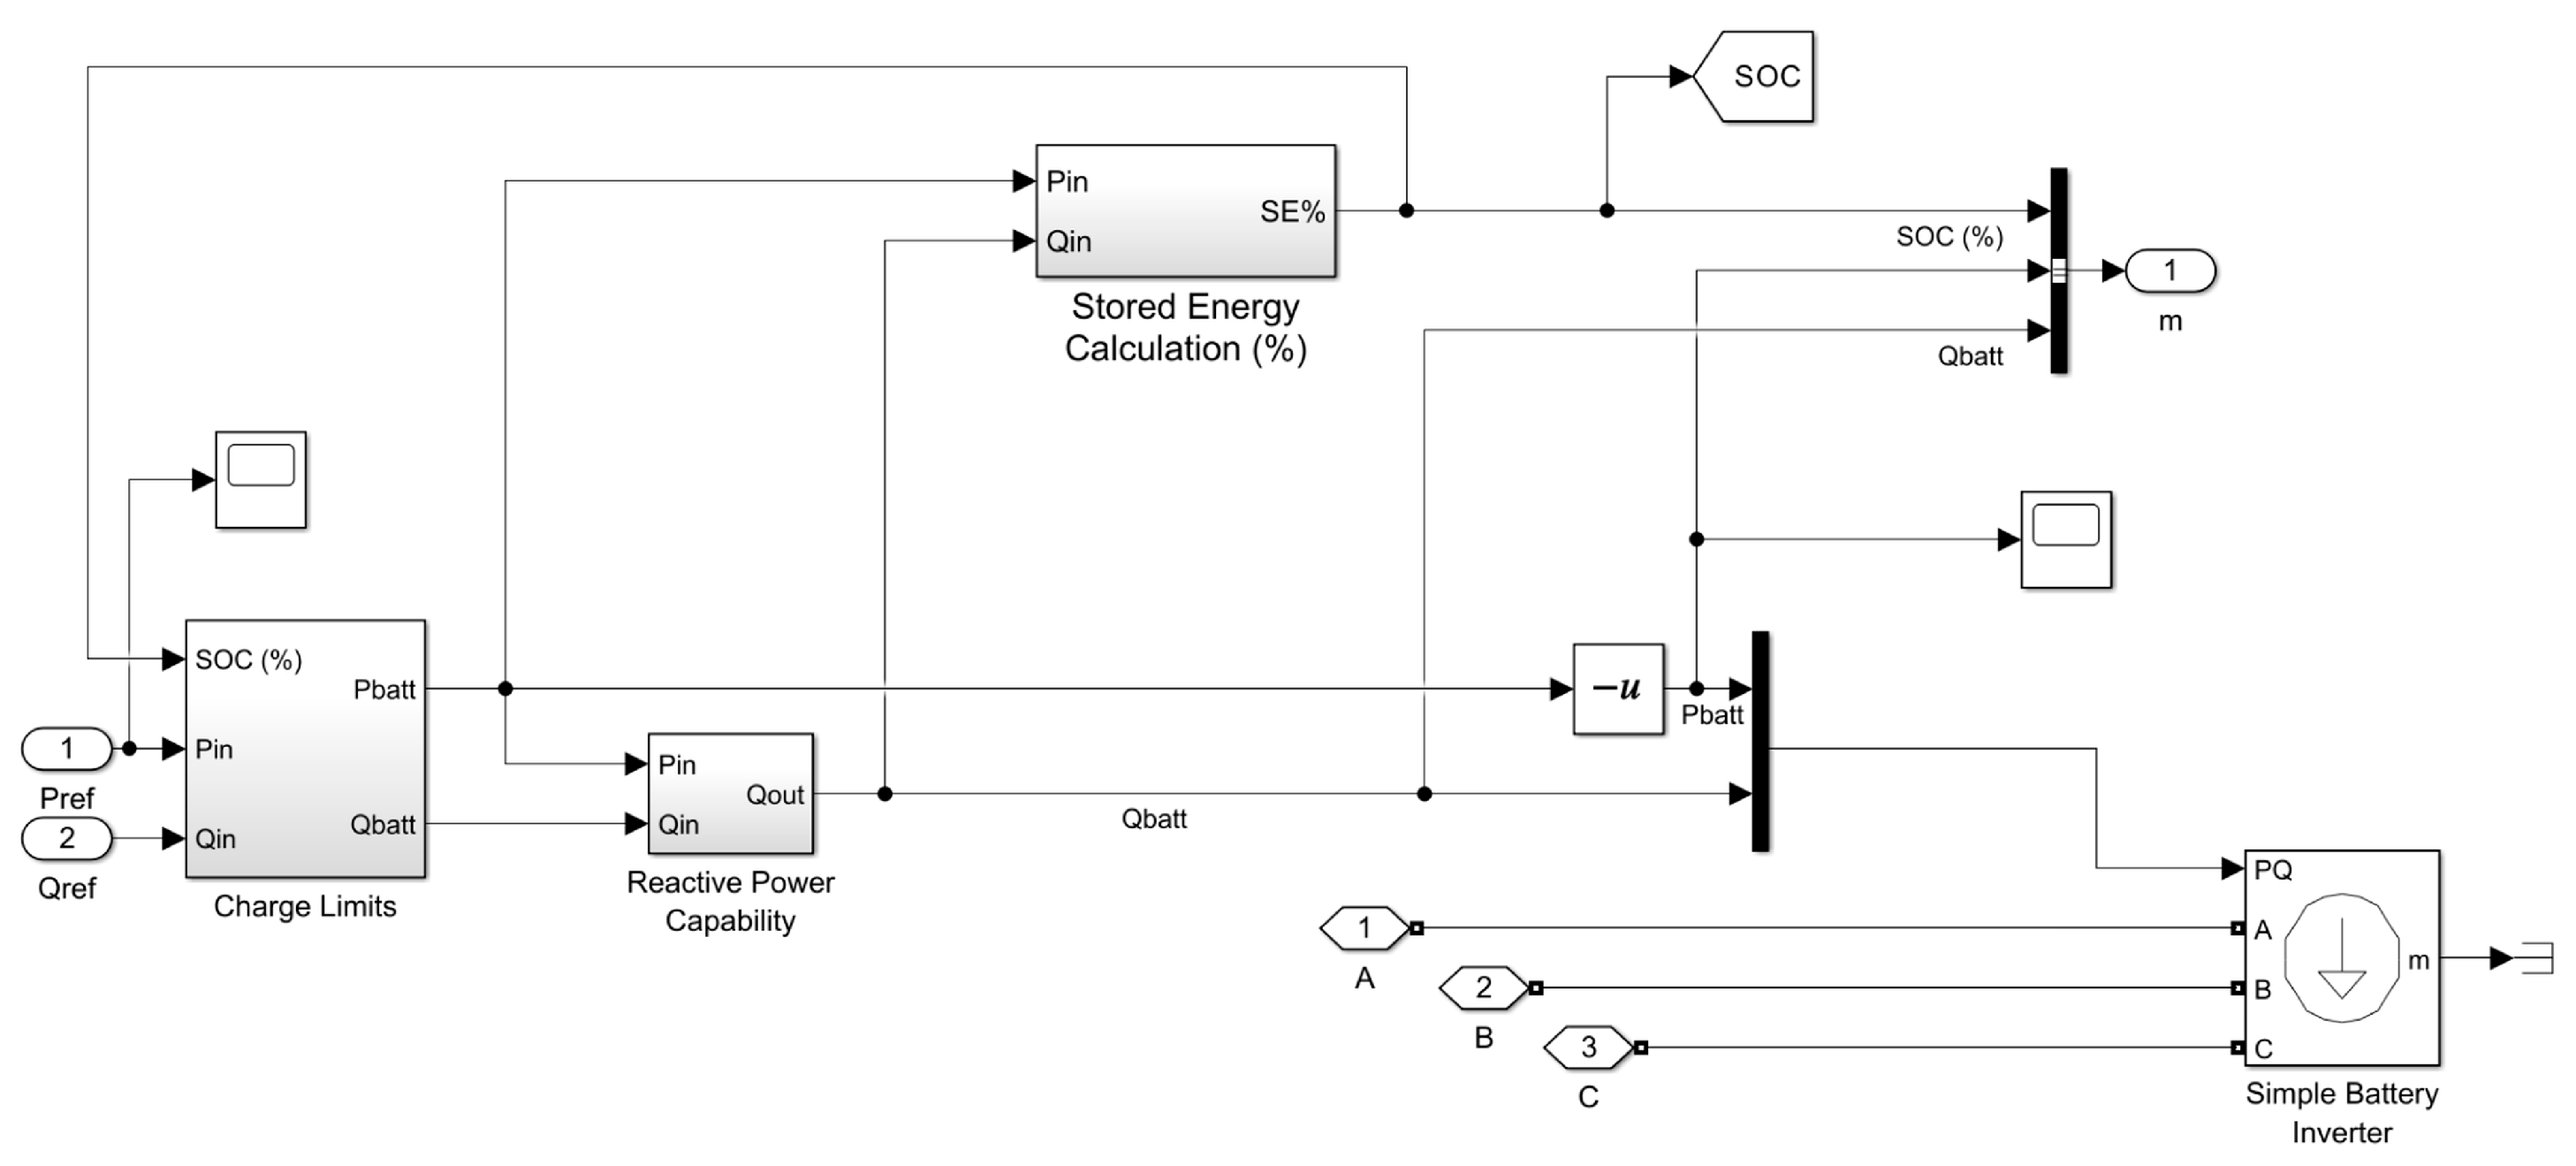
As shown in Figure 8, the photovoltaic system, electric vehicle charging station, and variable load models were implemented based on the three-phase dynamic load block in MATLAB/Simulink. The photovoltaic generation system was modeled to supply power to the grid using predicted generation as the reference input. The electric vehicle charging station was modeled as a variable load consuming power from the grid while taking into accounting charging patterns.

2.4.3. ESS Model

The ESS model, as shown in Figure 9, was represented as a model incorporating charging and discharging efficiencies, including energy storage capacity constraints and the state of charge calculations.
The ESS is modeled as a power block operating under PQ control, reflecting the practical constraints of SOC and efficiency. It has a rated capacity of 480 kWh and a maximum power flow of 30 kW. The SOC is constrained between 10% and 90% to prevent degradation, with automatic recharge enabled below 18%. Charging/discharging efficiencies are reflected via an overall system efficiency of 90%. The detailed parameters of the ESS model are summarized in Table 4. These parameters enable the accurate simulation of dynamic ESS behavior within the SILS environment. The dynamic load model can express simplified operation of PLL-based PQ-controlled distributed resources, which is a widely used method to ensure real-time simulation environments [21]. This approach improves computational speed by minimizing calculation complexity while maintaining the key operational characteristics of each distributed resource. The potential errors in dynamic response characteristics due to simplification will be analyzed in detail through subsequent research. Additionally, the efficiency of real-time data recording was enhanced by generating data storage points at one-second intervals using MATLAB/Simulink’s Decimation feature. Furthermore, simulation speed was accelerated using the accelerator mode. This approach provides a foundation for SILS environments to validate various operational scenarios under conditions close to the real environment.

3. Results

The proposed algorithm was designed to optimize the cost-efficient operation of each resource in conjunction with market prices while ensuring operational stability and reliability.

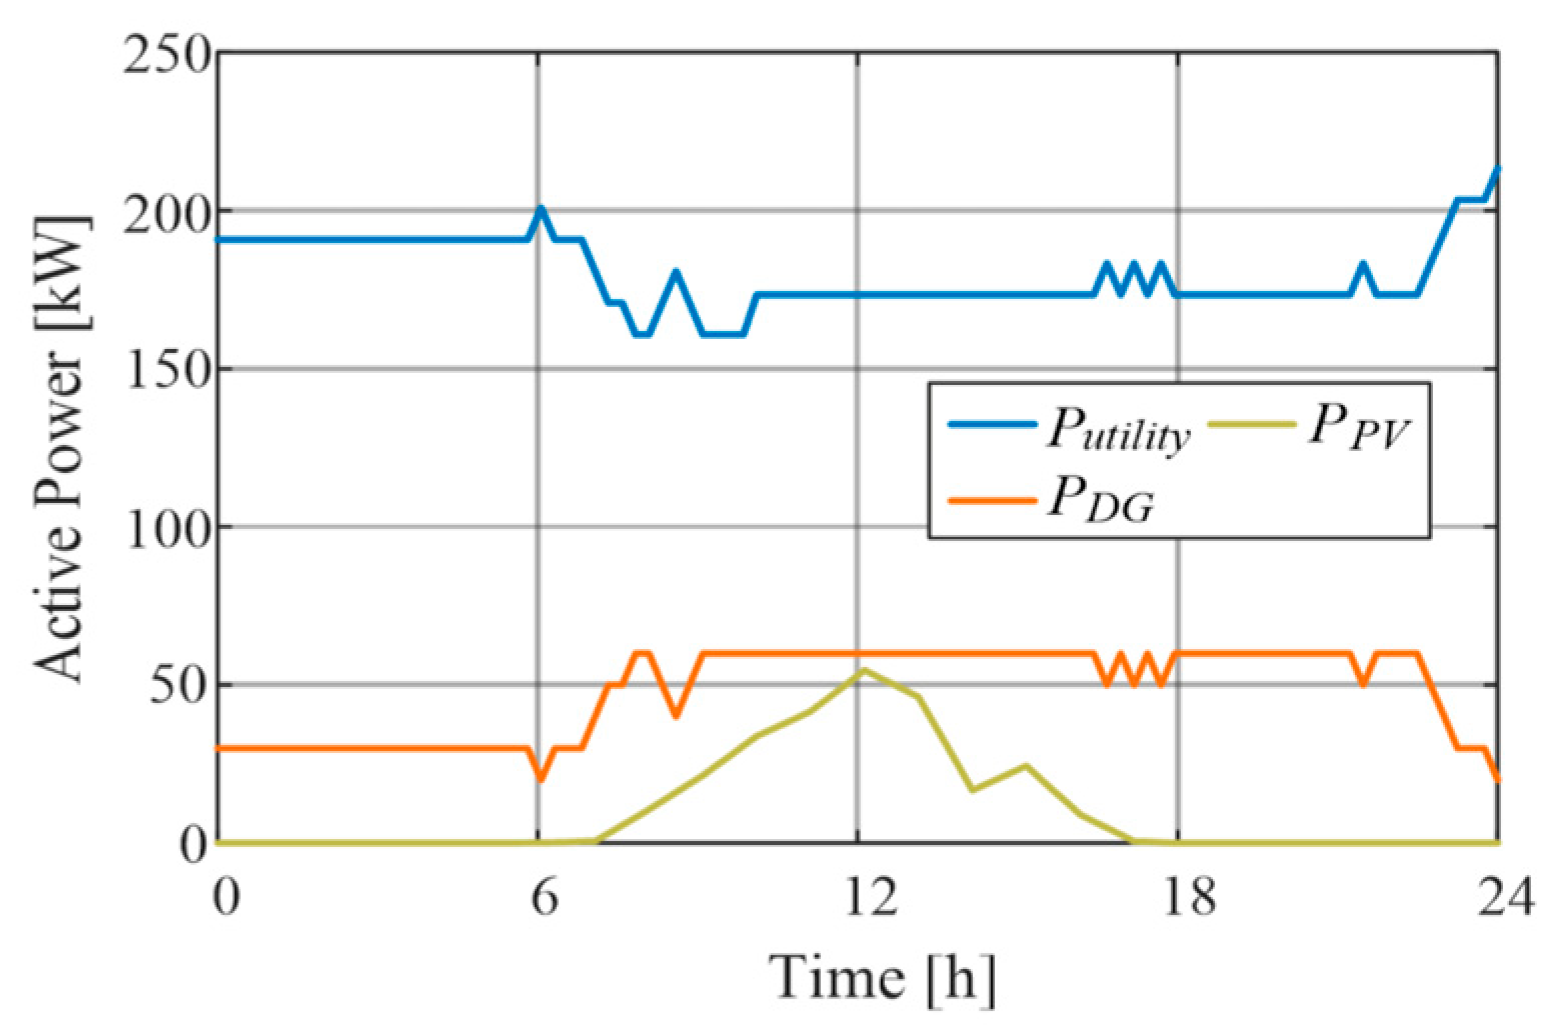
3.1. Optimal Grid Operation Algorithm Simulation

The proposed algorithm optimizes the cost of each resource in line with market prices, ensuring stable and reliable operation. Figure 10 compares the hourly net load across different scenarios. Case 1 shows the optimal operation of a microgrid that includes the proposed energy storage system (ESS) and electric vehicle charging station (EVCS), while Case 2 represents a scenario without these components. This comparison highlights the load profile flattening effect achieved by the proposed algorithm. Figure 11 and Figure 12 display the hourly effective power profiles of distributed resources for Case 1 and Case 2, respectively. Through this, we confirmed that ESS can enhance power grid flexibility by flattening the load profile while contributing to energy cost reduction [22].
Additionally, as shown in Table 5, the proposed algorithm demonstrated a cost reduction effect of approximately 17.84% compared to Case 2.

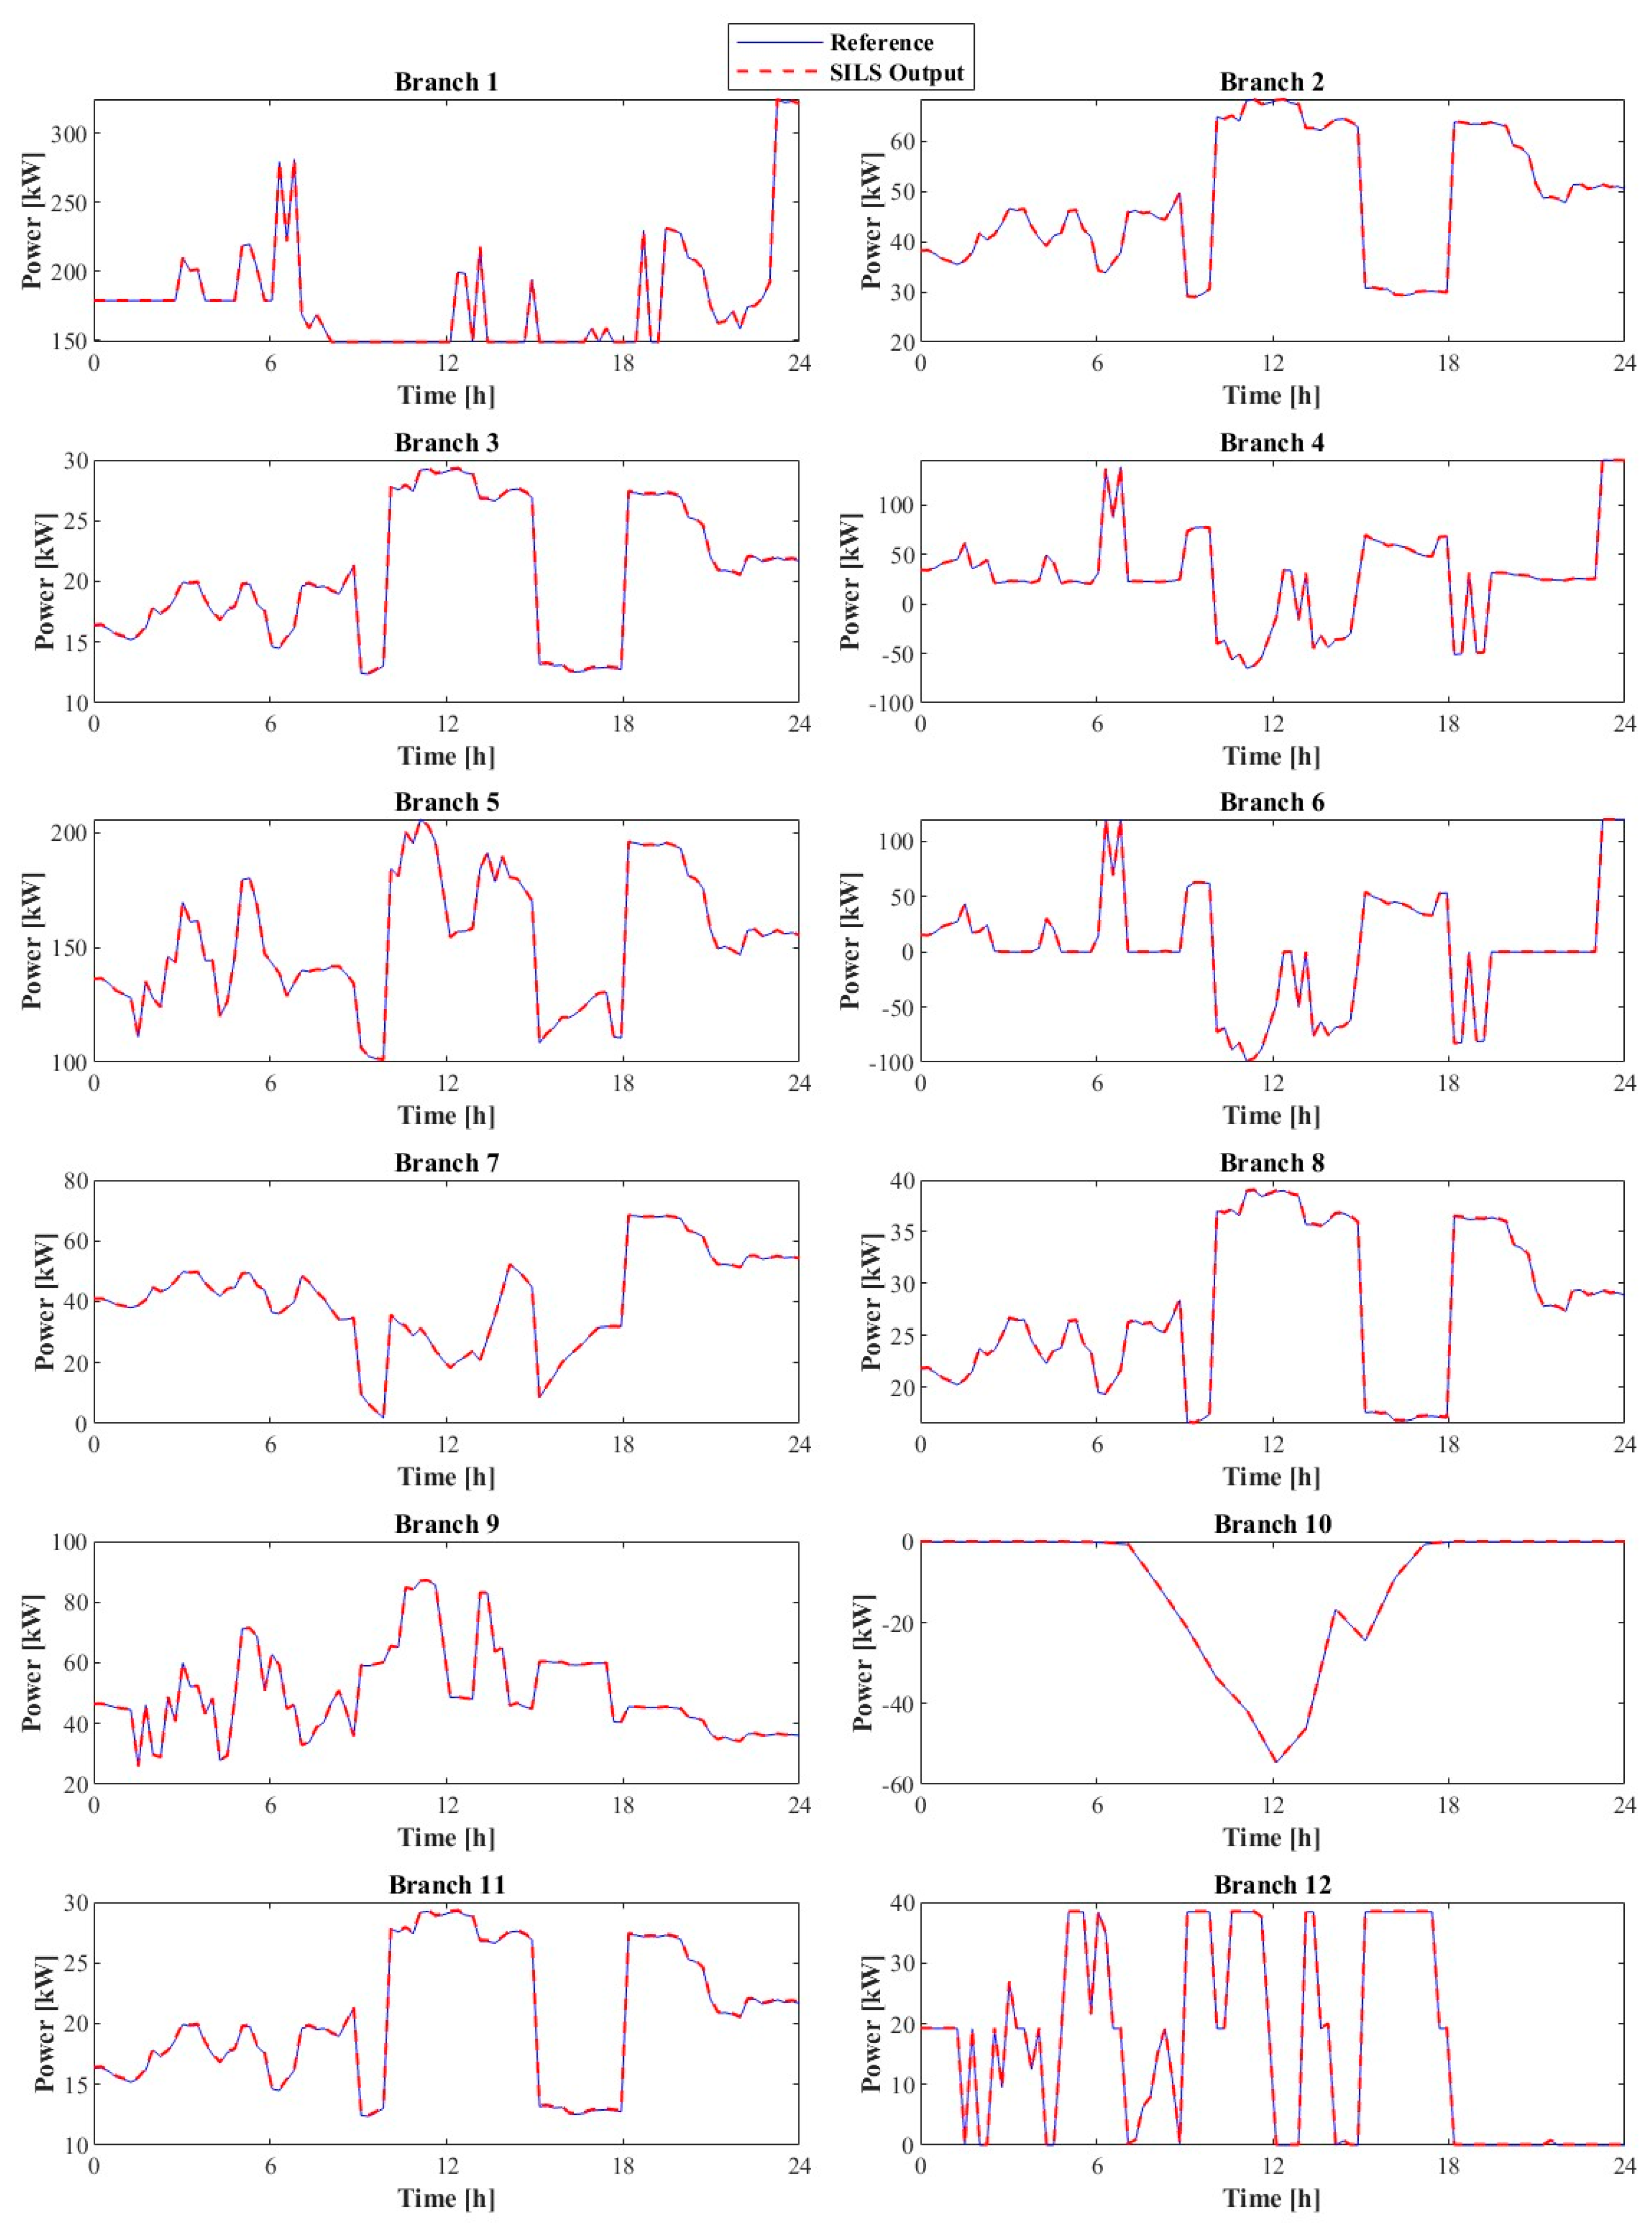
3.2. Modeling Validation Results

The optimal operation algorithm, corresponding to Case 1, which includes ESS and EVCS, was applied. Figure 13 presents the results from the SILS testbed, comparing the output power of each distributed resource with the reference power provided as the input. The solid line represents the reference, while the dashed line represents the output values. By analyzing the consistency between these two, we verified whether the testbed accurately tracks the reference values. Figure 14 shows a comparison between the reference values calculated from the optimal operation scheduling and the line power output values derived from the SILS-based system model. Here, the solid line indicates the reference values from the optimal scheduling, and the dashed line represents the output values from the SILS model. The high consistency between these values validated the accuracy of power balancing in the SILS environment for the microgrid testbed. Although the results for Case 2 also showed accurate tracking of the reference values, they are omitted in the main text due to space constraints.

3.3. Case Study on Load Curve Flattening

Load curve flattening, which is achieved by optimally charging an energy storage system (ESS) during off-peak hours and discharging it during peak demand, offers substantial benefits for the operating efficiency and stability of a microgrid. By dampening sharp demand excursion, the system experiences improvements in several key performance indices, such as the load factor, the peak-to-average ratio (PAR), and the peak–valley gap. The definitions of these key indices are provided in Table 6. Additionally, as shown in Table 7, the proposed algorithm demonstrated a cost reduction effect of approximately 17.84% compared to Case 2.
A higher load factor in Case 2 (0.7159 vs. 0.6445 in Case 1) demonstrates more uniform power consumption and better utilization of the installed capacity, reducing infrastructure oversizing needs and associated costs. However, while Case 2 shows improved load factor and PAR metrics, its larger peak–valley gap (184.14 kW vs. 145.61 kW) indicates that the system must accommodate a wider operational range despite the average load being closer to peak values. From a stability standpoint, the smaller peak–valley gap in Case 1 offers advantages by minimizing extreme fluctuations that could trigger voltage and frequency instabilities. This more constrained operational envelope in Case 1 helps maintain system stability by reducing the magnitude of potential disturbances, allowing microgrid components to operate within more optimal conditions and enhancing overall reliability.

3.4. Case Study on Islanded Operation

To evaluate the scalability of the proposed MATLAB/Simulink-based testbed, SILS was designed to include islanded microgrid operation and pre-validate whether it can operate the power supply independently without external grid support. To achieve this, breaker opening signals in the testbed environment were set as input variables for Python scripts, supporting the generation of control signals for islanded operation scenarios through the EMS.
In the islanded operation scenario, the diesel generator plays a crucial role in frequency control, with its governor system functioning as a key component that regulates the generator’s output and frequency. The governor of the diesel generator performs primary frequency control (PFC) by immediately responding to frequency deviations caused by load variations and grid disconnection and adjusting its output accordingly. PFC helps restore frequency fluctuations within the allowable range, ensuring system stability. In this study, secondary frequency control (SFC) was omitted to simplify the simulation and facilitate real-time implementation.
As shown in Figure 15, users transmit control signals for islanded operation scenarios to the MATLAB/Simulink-based testbed through the SCADA dashboard. Simulations are executed in the testbed, and the result data are stored in the EMS server. Subsequently, these results are visualized on the SCADA dashboard through API calls, allowing users to monitor them in real time. This enables users to monitor frequency response characteristics and output power variations in real time, verifying that the proposed SILS testbed can maintain allowable frequency ranges and ensure system stability even in islanded scenarios. Furthermore, through the coordinated integration of SILS and SCADA, we demonstrated the scalability potential for various operating scenarios and real-time control reliability.

4. Conclusions

This study proposed a Python-MATLAB/Simulink-based EMS-integrated Software-In-The-Loop Simulation (SILS) framework. The proposed framework was designed to pre-validate microgrid control and operation strategies by integrating Python’s data processing capabilities and flexibility with MATLAB/Simulink’s precise simulation environment. Specifically, for cost-effective microgrid operation, the optimal testbed operation algorithms for distributed resources were developed. The testbed was designed based on the IEEE 13-bus system, and the algorithms demonstrated significant achievements in terms of operational cost reduction and load profile flattening. Furthermore, by providing scalability to flexibly respond to various operation scenarios in the SILS environment, we presented its potential as a practical tool for microgrid operation. Future research aims to expand the testbed by incorporating secondary frequency control and additional control mechanisms, as well as by analyzing business feasibility based on a power economics model.

Author Contributions

Conceptualization, S.K.; methodology, S.K. and Y.-J.K.; software, S.K.; formal analysis, S.K. and Y.-J.K.; writing—original draft, S.K.; writing—review and editing, S.C.; supervision, S.C. All authors have read and agreed to the published version of the manuscript.

Funding

This work was supported in part by the National Research Foundation of Korea (NRF) grant funded by the Korea government (MSIT) (No. RS-2023-00218377) and in part by Korea Electric Power Corporation (No. R20XO02-19).

Data Availability Statement

The original contributions presented in the study are included in the article, further inquiries can be directed to the corresponding author.

Conflicts of Interest

The authors declare no conflicts of interest.

Abbreviations

The following abbreviations are used in this manuscript:
EMSEnergy Management System
ESSEnergy Storage System
BESSBattery Energy Storage System
EVCSElectric Vehicle Charging Station
DERDistributed Energy Resources
SILSSoftware-in-the-Loop Simulation
HILSHardware-in-the-Loop Simulation
SCADASupervisory Control and Data Acquisition
SOCState of Charge
PQActive and Reactive Power Control
MILPMixed-Integer Linear Programming
APIApplication Programming Interface
OPC-UAOpen Platform Communication Unified Architecture
R-MGCReplica Microgrid Controller
PFCPrimary Frequency Control
SFCSecondary Frequency Control
PCCPoint of Common Coupling
DGDiesel Generator
PVPhotovoltaic
PLCProgrammable Logic Controller

Nomenclature

The nomenclature for the defined symbols.
SymbolsDescription
P g , t Power purchase from the grid at time t
C k , s , t Section cost of diesel generator k at segment s and time t
δ t Binary variable for contracted power violation at time t
α k , s Linearization coefficient for diesel generator k at section s
P EVCS ,   t Charging revenue at EVCS at time t
S O C n , t State of charge of ESS n at time t
η n c h , η n d i s Charging and discharging efficiency of ESS n
P n , t c h , P n , t d i s Charging and discharging power of ESS n at time t
E V e Number of electric vehicles
S O C e , a , S O C e , d State of charge of EV at arrival (a) and departure (d)
V j Bus voltage at node j
P j , Q j Active and reactive power injection at bus j

References

  1. Son, Y.; Woo, H.; Noh, J.; Dehghanian, P.; Zhang, X.; Choi, S. Optimization of energy storage scheduling considering variable-type minimum SOC for enhanced disaster preparedness. J. Energy Storage 2024, 93, 112366. [Google Scholar] [CrossRef]
  2. Clausen, C.S.B.; Jørgensen, B.N.; Ma, Z.G. A scoping review of In-the-loop paradigms in the energy sector focusing on software-in-the-loop. Energy Inform. 2024, 7, 12. [Google Scholar] [CrossRef]
  3. Vignati, M.; Debattisti, N.; Bacci, M.L.; Tarsitano, D. A Software-in-the-Loop Simulation of Vehicle Control Unit Algorithms for a Driverless Railway Vehicle. Appl. Sci. 2021, 11, 6730. [Google Scholar] [CrossRef]
  4. Kuntuarova, S.; Licklederer, T.; Huynh, T.; Zinsmeister, D.; Hamacher, T.; Perić, V. Design and simulation of district heating networks: A review of modeling approaches and tools. Energy 2024, 305, 132189. [Google Scholar] [CrossRef]
  5. Moustafa, A.M.; Abdelghany, M.B.; Younis, A.-S.A.; Moness, M.; Al-Durra, A.; Guerrero, J.M. Software-defined control of an emulated hydrogen energy storage for energy internet ecosystems. Int. J. Hydrog. Energy 2024, 50, 893–909. [Google Scholar] [CrossRef]
  6. Nguyen, H.T.; Yang, G.; Nielsen, A.H.; Jensen, P.H. Hardware- and Software-in-the-Loop Simulation for Parameterizing the Model and Control of Synchronous Condensers. IEEE Trans. Sustain. Energy 2019, 10, 1593–1602. [Google Scholar] [CrossRef]
  7. Guerrero, C.A.V.; da Silveira, P.M.; Carvalho, J.M.; Bonatto, B.D.; Oliveira, D.Q.; Santos, M.; Marujo, D.; Zambroni, A.C.; Felver, L.A.; Oliveira, J.A.; et al. A new software-in-the-loop strategy for real-time testing of a coordinated Volt/Var Control. In Proceedings of the 2016 IEEE PES PowerAfrica, Livingstone, Zambia, 28 June–3 July 2016; pp. 6–10. [Google Scholar]
  8. Casolino, G.M.; AlizadehTir, M.; Andreoli, A.; Albanesi, M.; Marignetti, F. Software-in-the-loop simulation of a test system for automotive electric drives. In Proceedings of the IECON 2016-42nd Annual Conference of the IEEE Industrial Electronics Society, Florence, Italy, 23–26 October 2016; pp. 1882–1887. [Google Scholar]
  9. Tan, R.H.G.; Tinakaran, G.K. Development of battery energy storage system model in MATLAB/Simulink. Int. J. Smart Grid Clean Energy 2020, 9, 180–188. [Google Scholar] [CrossRef]
  10. Faruque, M.D.O.; Strasser, T.; Lauss, G.; Jalili-Marandi, V.; Forsyth, P.; Dufour, C.; Dinavahi, V.; Monti, A.; Kotsampopoulos, P.; Martinez, J.A.; et al. Real-Time Simulation Technologies for Power Systems Design, Testing, and Analysis. IEEE Power Energy Technol. Syst. J. 2015, 2, 63–73. [Google Scholar] [CrossRef]
  11. Guillaud, X.; Faruque, M.O.; Teninge, A.; Hariri, A.H.; Vanfretti, L.; Paolone, M.; Dinavahi, V.; Mitra, P.; Lauss, G.; Dufour, C.; et al. Applications of Real-Time Simulation Technologies in Power and Energy Systems. IEEE Power Energy Technol. Syst. J. 2015, 2, 103–115. [Google Scholar] [CrossRef]
  12. JJeon, H.; Kim, J.-Y.; Kim, H.-M.; Kim, S.-K.; Cho, C.; Kim, J.-M.; Ahn, J.-B.; Nam, K.-Y. Development of Hardware In-the-Loop Simulation System for Testing Operation and Control Functions of Microgrid. IEEE Trans. Power Electron. 2010, 25, 2919–2929. [Google Scholar] [CrossRef]
  13. Gutiérrez-Escalona, J.; Roncero-Clemente, C.; González-Romera, E.; Milanés-Montero, M.I.; Husev, O.; Romero-Cadaval, E. PV-Battery Assisted Three-Level T-Type Inverter for AC Residential Nanogrid Realized With Small-Scale HIL Units. IEEE Access 2023, 11, 48007–48021. [Google Scholar] [CrossRef]
  14. Kotsampopoulos, P.; Lagos, D.; Hatziargyriou, N.; Faruque, M.O.; Lauss, G.; Nzimako, O.; Forsyth, P.; Steurer, M.; Ponci, F.; Monti, A.; et al. A Benchmark System for Hardware-in-the-Loop Testing of Distributed Energy Resources. IEEE Power Energy Technol. Syst. J. 2018, 5, 94–103. [Google Scholar] [CrossRef]
  15. Wang, J.; Song, Y.; Li, W.; Guo, J.; Monti, A. Development of a Universal Platform for Hardware In-the-Loop Testing of Microgrids. IEEE Trans. Ind. Inform. 2014, 10, 2154–2165. [Google Scholar] [CrossRef]
  16. Lin, F.J.; Liao, J.C.; Zhang, Y.M.; Huang, Y.C. Optimal Economic Dispatch and Power Generation for Microgrid Using Novel Lagrange Multipliers-Based Method With HIL Verification. IEEE Syst. J. 2023, 17, 4533–4544. [Google Scholar] [CrossRef]
  17. Bonassi, F.; La Bella, A.; Fagiano, L.; Scattolini, R.; Zarrilli, D.; Almaleck, P. Software-in-the-loop testing of a distributed optimal scheduling strategy for microgrids’ aggregators. In Proceedings of the 2020 IEEE PES Innovative Smart Grid Technologies Europe (ISGT-Europe), The Hague, The Netherlands, 26–28 October 2020; pp. 985–989. [Google Scholar]
  18. Mütherig, M.; Puleo, G.; Zdrallek, M.; Schönbauer, A. Development of a software in the loop environment to control a microgrid. In Proceedings of the 7th International Hybrid Power Plants & Systems Workshop (HYB 2023), Hybrid Conference, Tórshavn, Faroe Islands, 23–24 May 2023; pp. 103–107. [Google Scholar]
  19. Lee, G.-H.; Park, J.-Y.; Ham, S.-J.; Kim, Y.-J. Comparative Study on Optimization Solvers for Implementation of a Two-Stage Economic Dispatch Strategy in a Microgrid Energy Management System. Energies 2020, 13, 1096. [Google Scholar] [CrossRef]
  20. Lambert, M.; Hassani, R. Diesel genset optimization in remote microgrids. Appl. Energy 2023, 340, 121036. [Google Scholar] [CrossRef]
  21. Rajashekaraiah, K.; Iurlaro, C.; Bruno, S.; De Carne, G. Modelling of 3-Phase p-q Theory-Based Dynamic Load for Real-Time Simulation. IEEE Open Access J. Power Energy 2023, 10, 654–664. [Google Scholar] [CrossRef]
  22. Hwang, J.S.; Kim, J.-S.; Song, H. Handling Load Uncertainty during On-Peak Time via Dual ESS and LSTM with Load Data Augmentation. Energies 2022, 15, 3001. [Google Scholar] [CrossRef]
Figure 1. Microgrid energy management system architecture.
Energies 18 02739 g001
Figure 2. SILS framework for microgrid pre-validation.
Energies 18 02739 g002
Figure 3. SILS-SCADA interface.
Energies 18 02739 g003
Figure 4. Physical configuration for pre-validation.
Energies 18 02739 g004
Figure 5. IEEE 13-bus system topology.
Energies 18 02739 g005
Figure 6. Simulink system topology (IEEE 13-bus).
Energies 18 02739 g006
Figure 7. Diesel generator modeling.
Energies 18 02739 g007
Figure 8. PV generator modeling.
Energies 18 02739 g008
Figure 9. ESS generator modeling.
Energies 18 02739 g009
Figure 10. Comparison of hourly net load profile.
Energies 18 02739 g010
Figure 11. Hourly net load profile (Case 1).
Energies 18 02739 g011
Figure 12. Hourly power profile (Case 2).
Energies 18 02739 g012
Figure 13. Comparison of hourly output power profiles (Case 1).
Energies 18 02739 g013
Figure 14. Comparison of hourly line power profiles (Case 1).
Energies 18 02739 g014
Figure 15. Islanded operation scenario result.
Energies 18 02739 g015
Table 1. Comparative analysis of recent SILS-based microgrid studies.
Study (Ref.)EMS
Integration
SCADA
Interaction
Real-Time CapabilityModeling ScopeNotes
[6]xxxBasic power flow control onlyNo EMS or SCADA interface
[7]xxxPV–ESS configuration validationLacks dynamic operation
[8]xoxSILS–Python interfaceNo control strategy validation
[9]o (HIL)oo
(via HILS)
Diesel–PV–ESS controlRequires physical HIL hardware
[17]oxxSILS-based EMS schedulingNo dynamic or SCADA integration
[18]xoxPython–MATLAB–SCADA interfacingNo EMS or optimization
Proposed workooo
(sub-minute)
Full EMS–SCADA–SILS loop with PV/ESS/EVCSFunctional real-time validation without HIL
Table 2. Diesel generator model parameters.
ParameterValue
Rated Power2000 kW
Rated Voltage4.16 kV
Rated Frequency60 Hz
Initial Output Power0.1 pu
Friction and Inertia Constants3.7, 1 (H, pole pairs)
Stator Resistance0.003 ohms
Reactances X d = 1.305 and X q = 0.296
Table 3. Diesel Generator Excitation System (AC1A) Model Parameters.
ParameterValue
Exciter Gain/Time Constant K e = 1.0 and T e = 0.80
Voltage Limits ( V e 1 , V e 2 )4.8 pu and 14.0 pu
Saturation Curve ( S e ( V e )) S e ( V e 1 ) = 0.1 and S e ( V e 2 ) = 0.03
Demagnetizing Factor ( K d )0.38
Rectifier Loading Factor ( K c ) 0.20
Table 4. Energy storage system (ESS) parameters.
ParameterValue
Rated Capacity480 kWh
Rated Voltage4.16 kV
Rated Frequency60 Hz
Overall Efficiency90%
SOC Operating Range10–90%
SOC to Recharge Trigger18%
Table 5. The cost reduction effect of the proposed algorithm.
CaseTotal Cost [KRW]
Case 11,290,093
Case 21,570,235
Reduction Rate [%]17.84
Table 6. Definition of key load-flattening indices.
SymbolDefinitionFormula
Load factorUtilization efficiency of installed capacity F m = P a v g P p e a k
Peak-to-Average RatioInverse of the load factor P A R = P p e a k P a v g
Peak–Valley GapSpread of extreme loads P p e a k P m i n
Table 7. Comparative results for Case 1 and Case 2.
MetricCase 1 (with ESS, EVCS)Case 2 (Without ESS, EVCS)
Load factor F m 0.64450.7159
PAR (= 1 / F m )1.5521.397
Peak–Valley Gap [kW]145.61184.14
Disclaimer/Publisher’s Note: The statements, opinions and data contained in all publications are solely those of the individual author(s) and contributor(s) and not of MDPI and/or the editor(s). MDPI and/or the editor(s) disclaim responsibility for any injury to people or property resulting from any ideas, methods, instructions or products referred to in the content.

