Article

Experimental Evaluation of a Radiant Panel System for Enhancing Sleep Thermal Comfort and Energy Efficiency

1
School of Energy and Power Engineering, Chongqing University, Chongqing 400044, China
2
Key Laboratory of Low—Grade Energy Utilization Technology and Systems, Chongqing University, Ministry of Education of the People’s Republic of China, Chongqing 400044, China
*
Author to whom correspondence should be addressed.
Energies 2025, 18(11), 2724; https://doi.org/10.3390/en18112724
Submission received: 1 May 2025 / Revised: 19 May 2025 / Accepted: 21 May 2025 / Published: 23 May 2025

Abstract

:
This study aims to experimentally evaluate a personal comfort system based on a radiant panel (R-PCS) that can regulate the thermal environment of the sleep zone during summer, with a focus on improving both the thermal comfort and energy efficiency of this system. To investigate thermal comfort under the coupling effect of different covering conditions and operating parameters of the R-PCS, the changing pattern of thermal environment parameters in the berth area and human skin temperature are analyzed. Then, the Predicted Mean Vote (PMV) -Predicted Percent Dissatisfied (PPD) index is employed for assessing the thermal comfort of the human body and energy-saving efficiency of the system. The results show that this system can satisfy the thermal comfort requirements of the human body in the berth area. Meanwhile, the corresponding cooling energy consumption of the R-PCS is significantly lower than that of the traditional HVAC system, indicating that the developed system has significant energy-saving potential in building design.

1. Introduction

About one-third of a human’s life is spent in sleep, so a comfortable sleep thermal environment can ensure the quality of human sleep, which is beneficial to human physical and mental health [1]. With increasing expectations for thermal comfort in the sleep environment, the energy consumption of Heating Ventilation and Air Conditioning (HVAC) has been increasing as well. In 2021, operational buildings contributed to roughly 30% of worldwide end-use energy consumption while generating approximately 27% of total greenhouse gas emissions globally [2]. An online survey containing 4127 questionnaires shows that more than 80% of the occupants in hot summer regions turn on the air conditioning to maintain the indoor temperature during sleep [3]. However, the escalating operational load of HVAC systems has also led to a marked increase in associated energy consumption.
Compared with traditional convection air conditioning systems, radiant air conditioning systems reduce draft risk, and numerous studies have shown that radiant air conditioning systems consume less energy [4,5,6,7], which has been receiving increasing attention. Shin et al. [8] utilized a simulation model to evaluate the cooling performance of an open-type Ceiling Radiant Cooling Panel (CRCP). The research results demonstrated that, compared to traditional closed-type radiant cooling systems, the CRCP exhibited an increase in cooling capacity ranging from 54% to 80%. Choi et al. developed a fan-assisted Ceiling Radiant Cooling Panel system. In comparison to conventional ceiling radiant systems, this system showed an enhancement in refrigeration capacity ranging from 73% to 112%, resulting in an indoor temperature reduction of 0.4 °C to 0.92 °C [9]. Through computational fluid dynamics and experimental testing, Liang et al. evaluated the thermal environment of a small room with a cooling unit and discovered that this device fits the human thermal comfort criteria effectively [10]. Jia et al. analyzed the radiant ceiling panel system and the radiant slab system in a typical office environment, and the result showed that both systems achieved lower stratification temperatures, which could meet better thermal comfort [11]. However, these air conditioning systems typically heat or cool the entire indoor environment, leading to excess energy consumption. Additionally, due to variations in individual preferences for thermal comfort, it is often difficult for traditional air conditioning systems to meet the heating or cooling needs of all occupants. The personal comfort system (PCS) refers to a system or device designed to enhance human comfort by improving the local thermal conditions of one or more body parts [12,13,14,15]. It allows for a moderate relaxation of the thermal environmental requirements in other areas, thereby achieving lower energy consumption [16]. Ismail and Ouahrani designed a personal comfort system based on radiant air conditioning to meet the needs of energy saving and thermal comfort in daily work; it was proved that this system can reduce cooling energy by 18% compared to conventional air conditioning systems [17]. Thus, integrating radiant air conditioning with the PCS is also a favorable solution.
It is worth noting that the PCS is usually used in office environments. The sleeping environment, similar to the office setting, involves individuals predominantly situated in a fixed position. Consequently, the PCS used in the sleep environment has also received the attention of many scholars. Wang et al. developed a heated bed system that used circulating hot water for warmth, enhancing the thermal response by incorporating a fan beneath the bed [12]. Pan et al. designed a bed-based PCS with bulky air ducts and plenums [18]. Mao et al. then refined it by providing a ductless air supply and return vents, but it led to a cold draft [19]. To solve this problem, a new system that installed a radiant top plate directly above the bed with an air inlet was developed based on Mao’s system; this system can eliminate the uncomfortable feeling caused by cold drafts by providing the necessary fresh air [20]. Thus, it can be seen that the PCS can be effectively applied in the sleep environment.
In addition, thermal comfort in sleep areas has been extensively studied. Research has demonstrated that temperature plays a more crucial role in thermal comfort than other environmental factors like humidity and lighting, as evidenced by chamber experiments [21,22]. Lan et al. measured thermal comfort in different air temperature conditions through subjective questionnaires and an Electroencephalogram (EEG), and 23 °C was the thermally neutral temperature [23]. Ismail et al. investigated the thermal environments of the sleeping area with radiant surfaces using computational fluid dynamics [4]. They found that setting a suitable panel temperature and air supply temperature could make a thermally comfortable environment for occupants. Xin et al. [24] developed a personal comfort sleep system based on a radiant panel and investigated the heating efficiency of the system under different supply water temperatures; the results demonstrated that the system can provide excellent thermal comfort even at supply water temperatures of 30–36 °C. Regarding the level of human thermal comfort during sleep, the thermal resistance of the bedding system cannot be ignored in addition to indoor thermal environment factors [25]. Pan et al. analyzed the impact of different bedding systems on sleep thermal comfort. The experimental results indicate that bedding systems have a significant effect on average skin temperature. Regression analysis shows that the sensitivity coefficient of bedding systems to Predicted Mean Vote (PMV) is 0.1733 [26]. This confirms that the bedding system has a very essential impact on human thermal comfort. Wang et al. found that almost all participants covered different types of quilts to improve the thermal environment through questionnaire surveys, no matter in summer or winter [3]. The thermal resistance of bedding is also a key factor influencing human thermal comfort. Lin and Deng measured the total insulation of the bedding system [27]; they found that when the total insulation varied greatly from 0.90 to 4.89 clo under different bedding conditions, the thermally neutral indoor temperature changed from 30.1 °C to 8.9 °C. Through experiments conducted by Yan et al. on down comforters with different thermal resistances, it has been confirmed that increasing the thermal resistance of the comforter can expand the thermal comfort zone of the ambient temperature [28]. Zhang et al. also designed experiments to investigate the relationship between bedding conditions and thermal comfort, and they found that the higher the bedding insulation and indoor air temperature, the more the thermal comfort of the participants was affected [29]. This was consistent with the research findings by Cao et al. [21]. Due to the critical effect of bedding conditions on thermal comfort, the bedding system is also crucial and requires more attention.
Based on the above, this study considered both radiant cooling technology and personal comfort systems (R-PCSs), using capillary network radiation top panels to regulate the sleep thermal environment. As one of the key factors affecting thermal comfort, the specific impact of the bedding system on human thermal comfort is not clearly understood when coupled with the R-PCS. Therefore, this study focused on examining the impact of covering conditions on thermal comfort under different system operating conditions. This study initiates with a systematic exposition of the experimental apparatus design principles and testing environment configurations. Subsequently, a multidimensional evaluation framework is established, integrating thermal environmental parameters, human mean skin temperature, and PMV-PPD thermal comfort indices. The investigation culminates in an energy efficiency assessment model to quantify the system’s energy-saving characteristics and optimization potential.

2. Materials and Methods

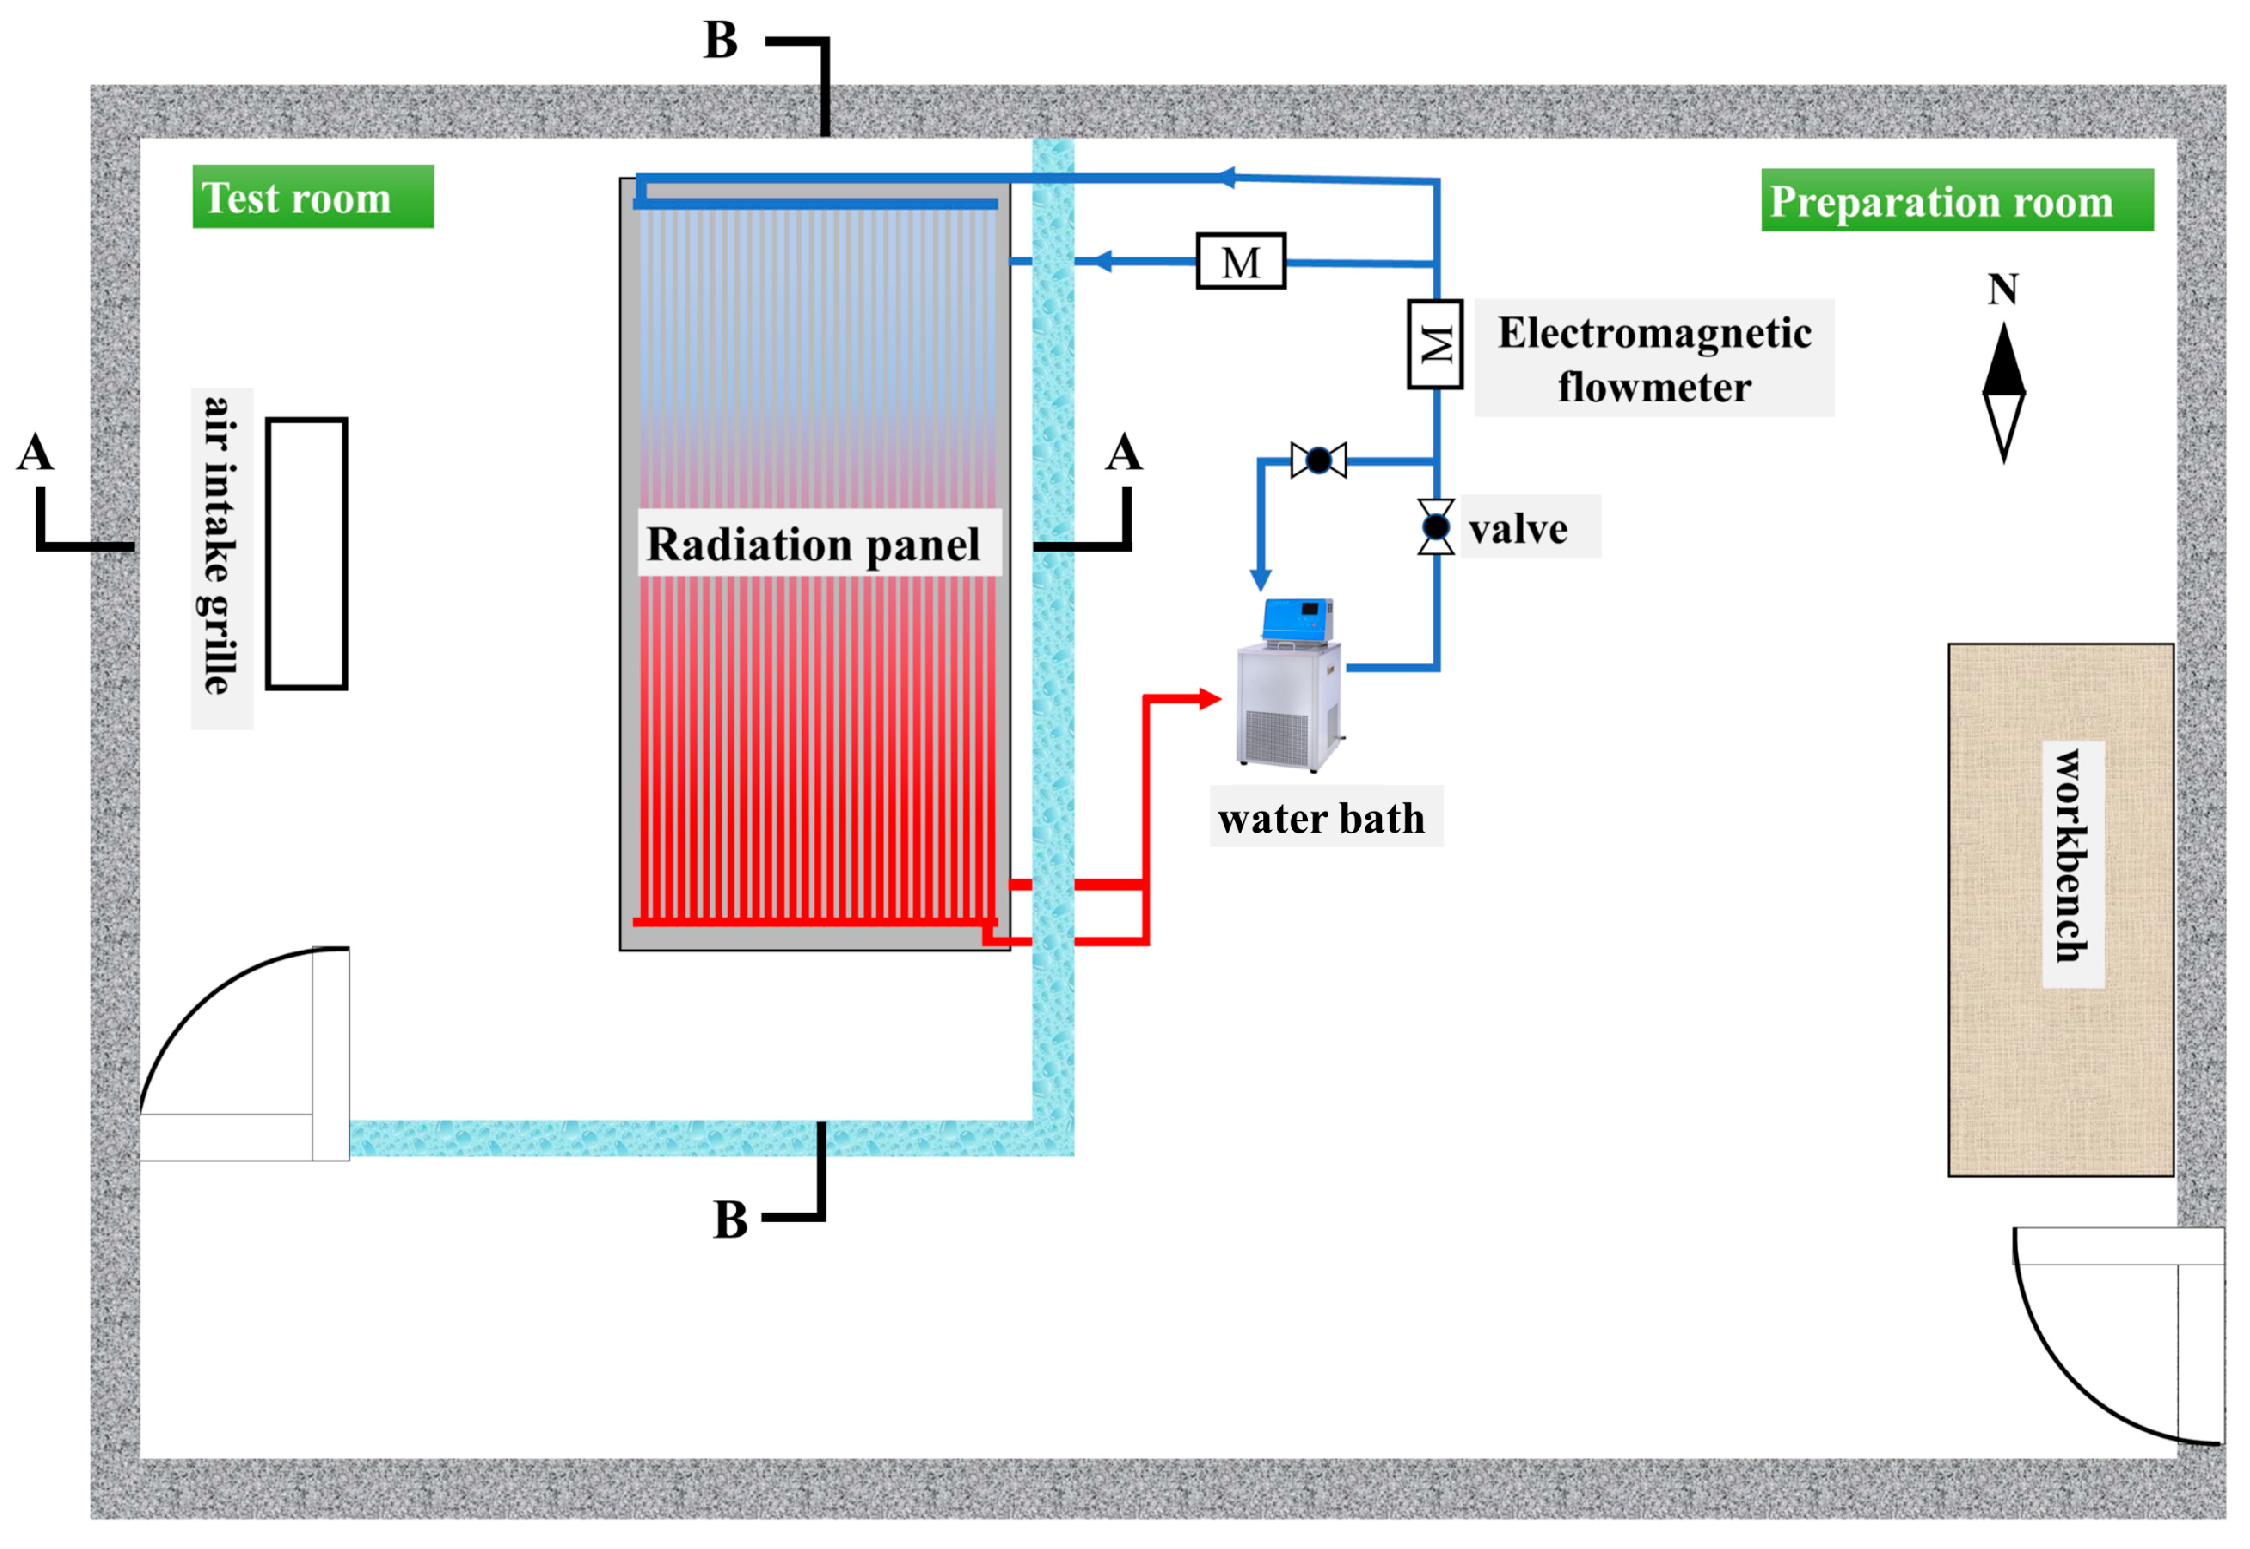
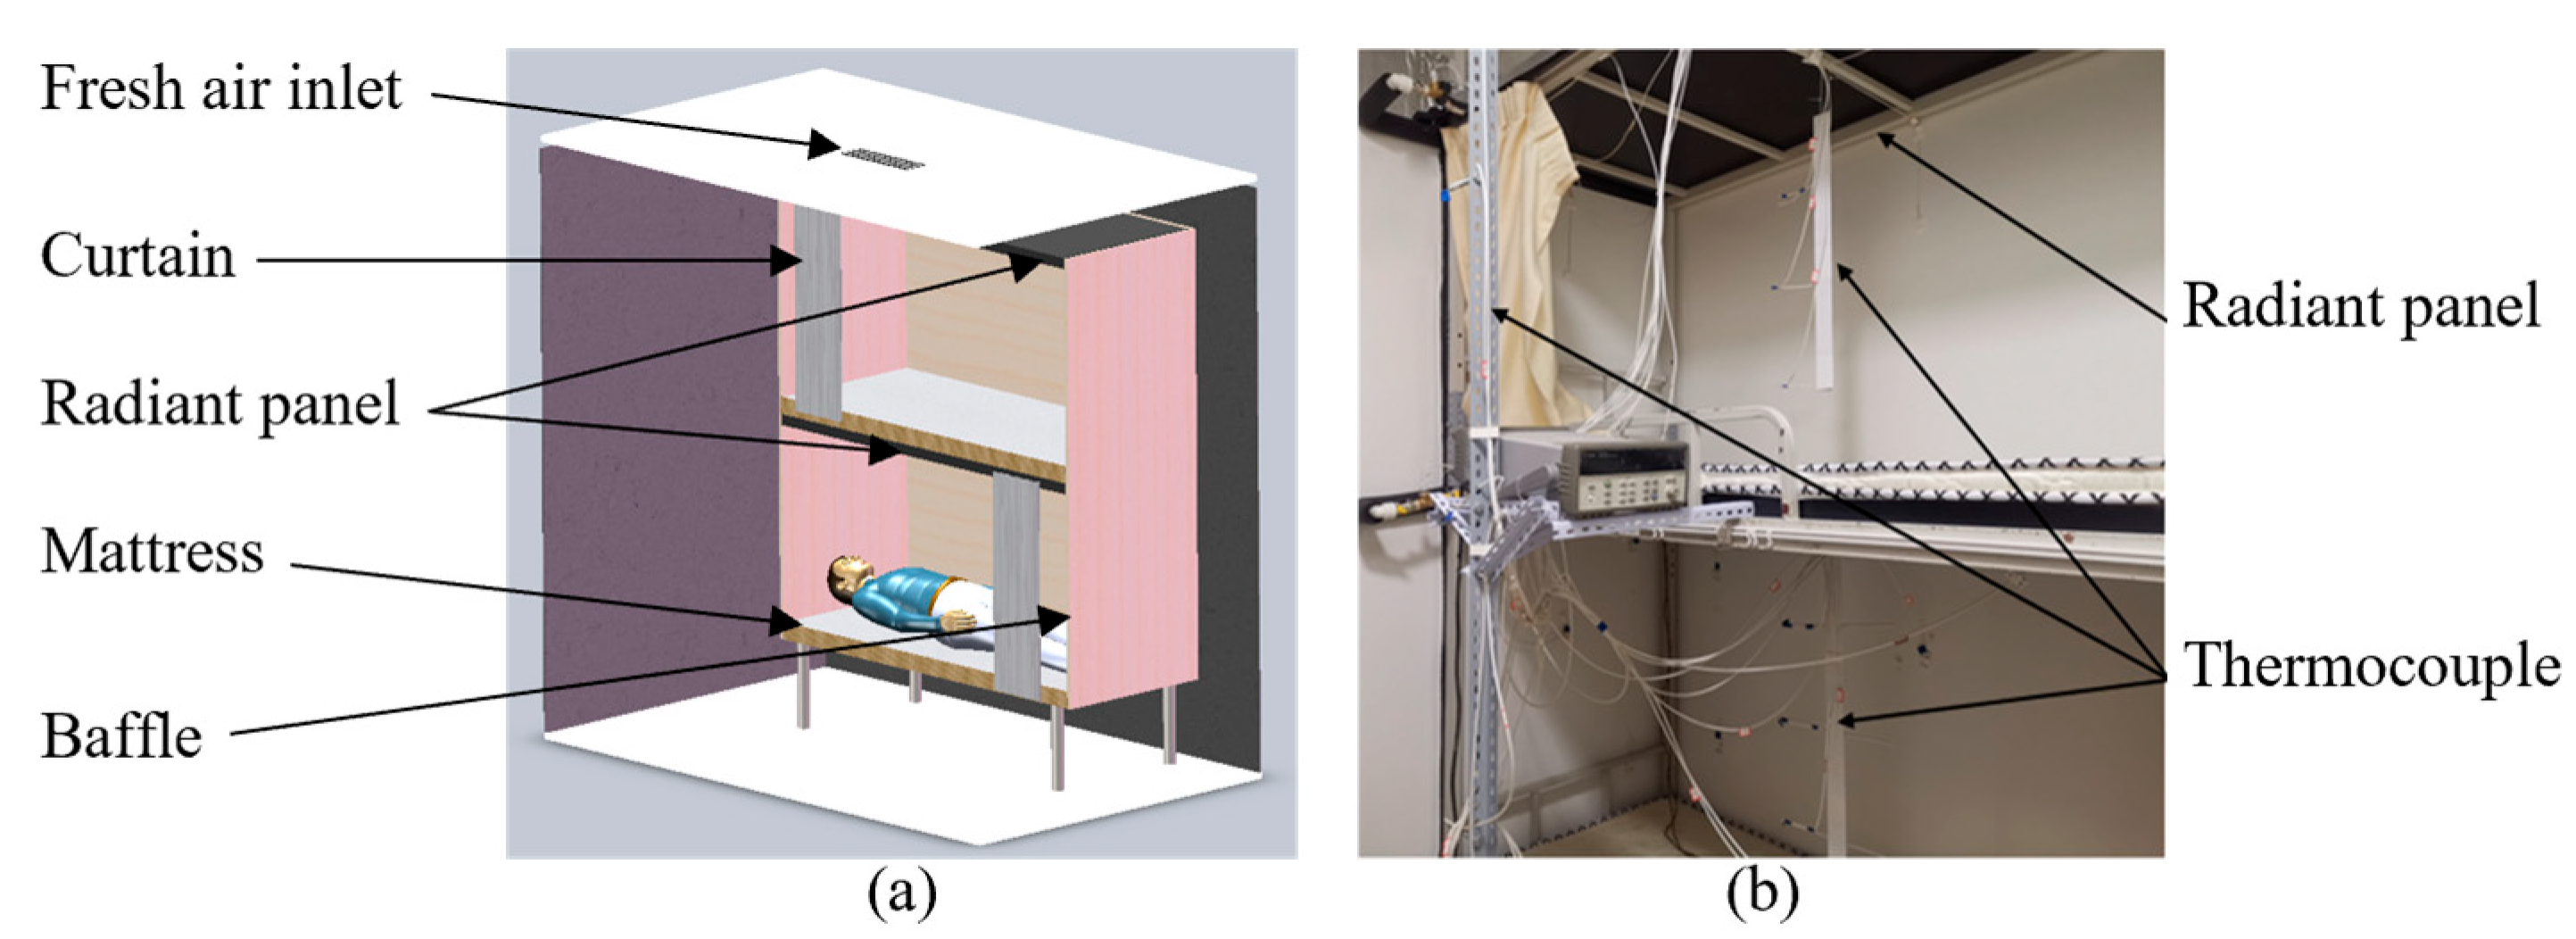
2.1. Experimental Setup

Our research group has carried out experimental research on the thermal comfort and heat transfer performance of an R-PCS, and this experimental system was developed based on Xin’s design [24], which is illustrated in Figure 1. The laboratory is divided into two parts: the preparation room and the test room, respectively. The exterior walls of the test room are well insulated and regarded as adiabatic surfaces in the tests.
The experimental devices for adjusting the water supply parameters are placed in the preparation room. The experimental equipment includes the following: a thermostatic circulating water bath HX-20, water distributor, water collector, ball valves, and electromagnetic flow meters. A double-decker berth with a capillary radiant panel is situated on the east side of the test room. The area occupied by a bed is termed the berth area, while the corresponding corridor area, which is separated by 1.5 mm thick flax curtain curtains from the berth area, is defined as the corridor area, and the dimensions of each berth area are 2000 mm (L) × 800 mm (W) × 900 mm (H). The berth area of the R-PCS is surrounded by a capillary network radiation roof, three baffles, and a mattress. The insulation cotton of 15 mm thickness is covered on the baffles. Additionally, there is a fresh air intake grille located on the ceiling, which provides fresh air and regulates the ambient temperature and humidity in the corridor area of the test room. Refer to Figure 2 for laboratory scene photographs and three-dimensional views.
The R-PCS comprises two identical radiant panels (1900 mm × 800 mm × 50 mm), which are installed at 900 mm above the mattress, respectively. A capillary tube (1800 mm × 700 mm) is laid inside each radiant panel, and an insulation layer is placed on top of the radiant panel, as shown in Figure 3. The water is circulated through the constant temperature circulator to reach the specified temperature and then loaded into the capillary tube. The temperature range of 0–100 °C and control accuracy of ±0.1 °C are ensured by the circulator.

2.2. Measurements

The main parameters measured during the experiment include the surface temperatures of the envelopes within the berth area, the air temperature and humidity in each area of the test chamber, the inlet and outlet water temperatures, the water flow rate of the R-PCS, the temperature of human skin, and the airflow velocity within the berth area. The detailed specifications of the instruments used in the experiment are summarized in Table 1.
The specific experimental data were measured in the following manners:
(1)
Surface temperature of the envelope within the berth area: The T-thermocouple probes were attached to the surface of the envelope in the berth area using foam tape for surface temperature measurements and distributed at the center of each of the six faces in the berth area.
(2)
Air temperature: measurement brackets were installed in each area of the test chamber to hold T-type thermocouple probes to measure the air temperature. These points were located in the horizontal center of the area. Figure 4 shows the arrangement of air temperature measurement points from the A-A and B-B views (indicated in Figure 1), respectively. The relative humidity of the air was measured by Bluetooth Thermo hygrometers attached to the berth area and the corridor area, respectively.
(3)
Inlet and outlet water temperature: The inlet and outlet of the radiant panel were fitted with thermocouple sleeves in which T-type thermocouple probes were placed and filled with thermally conductive silicone grease to measure the capillary inlet and outlet temperatures.
(4)
Water supply flow: Electromagnetic flow meters were installed in series in the system’s water supply trunk and lower bunk water supply bypass, respectively, to monitor the water supply flow in the upper and lower bunk capillaries.
(5)
Human skin temperature: The local skin temperature of the individuals was measured using a Thermotron button thermometer, i.e., iButton® DS1922L. (Analog Devices, San Jose, CA, USA) A four local skin temperatures (right upper arm, left chest, right thigh front, and right calf front) method was used to identify the mean skin temperature in the tests.
(6)
Airflow velocity in the berth area: The hot-wire anemometer was used to measure the airflow velocity in the berth area. During the tests, the hot-wire anemometers were fixed in the center of the berth area, and the monitored data were transmitted wirelessly via Bluetooth, which could be observed and recorded by the experimenters in real time.
The T-type thermocouples used in the test were calibrated with a constant temperature water bath before the experiment, and the button thermometers were also compared with the calibrated T-type thermocouple; it was found that the difference between the two temperature measurements was minimal and met the requirements for a human skin surface temperature measurement. The T-type thermocouple temperature data obtained in the experiments were recorded by an Agilent 34970A (Agilent Technologies, Santa Rosa, CA, USA) data acquisition instrument with a time interval of 1 min.

2.3. Calculation of Environment Indexes and the Mean Skin Temperature

Mean air temperature (ta) is one of the important thermal environment indicators that directly influences the convective heat transfer between the human body and the indoor environment. In the case of a sleeping thermal environment with a radiant panel, the impact of radiative heat transfer is extremely important, so the mean radiation temperature (MRT) is taken into account to evaluate the radiative heat transfer between the human body and the enclosure structure in the berth area. According to Horikoshi et al. [30] and Nagano et al. [31], the MRT in this study can be calculated as shown in Equations (1) and (2):
M R T = i M R T i A i i A i
M R T i = j F i j T j
where Fi–j is the angle factor of face i (face of the simplified human body model) to face j (face of the envelopes of the berth area), Ai is the area of face i in m2, and Tj is the average temperature of face j in °C.
However, the MRT cannot fully reflect the overall heat exchange between the human body and the indoor environment. To comprehensively compare the convective and radiative heat transfer between the human body and the indoor environment under different working conditions, it is necessary to introduce the mean operating temperature (to) for evaluation. The to can reflect the thermal effect caused by convection and radiation between the indoor environment and the human body. It is defined as the weighted average of air temperature ta and MRT. The to in this study can be described as shown in Equation (3):
t o = h r M R T + h c t a h r + h c
where hr is the radiative heat transfer coefficient in W/(m2·°C), which is 4.7 W/(m2·°C) for the supine human body based on ASHRAE [32]; hc is the convective heat transfer coefficient in W/(m2·°C), which is 5.1 W/(m2·°C) when the airflow velocity is lower than 0.15 m/s [33].
Human skin temperature is one of the most important physiological factors which reflects the degree of cold and heat stress in the human body and the state of heat exchange between the human body and the ambient temperature. Skin temperature is determined by the thermal balance between heat flow from the body core to the skin surface and heat loss from the skin surface to the environment [34]. When the skin temperature changes, temperature receptors located in the skin sense this change and produce sensations of warmth or cold.
Liu et al. evaluated different methods of skin temperature measurement [35]. Compared to other measurement methods, the 4-point model requires fewer measurement points while ensuring high measurement reliability, which was also adopted by Lan [36]. Therefore, this method will be used in this experiment to measure skin temperature. The formula was calculated as follows:
t ¯ sk = 0.3 t Right upperarm + 0.3 t Left   chest + 0.2 t Right thigh front + 0.2 t Right calf anterior

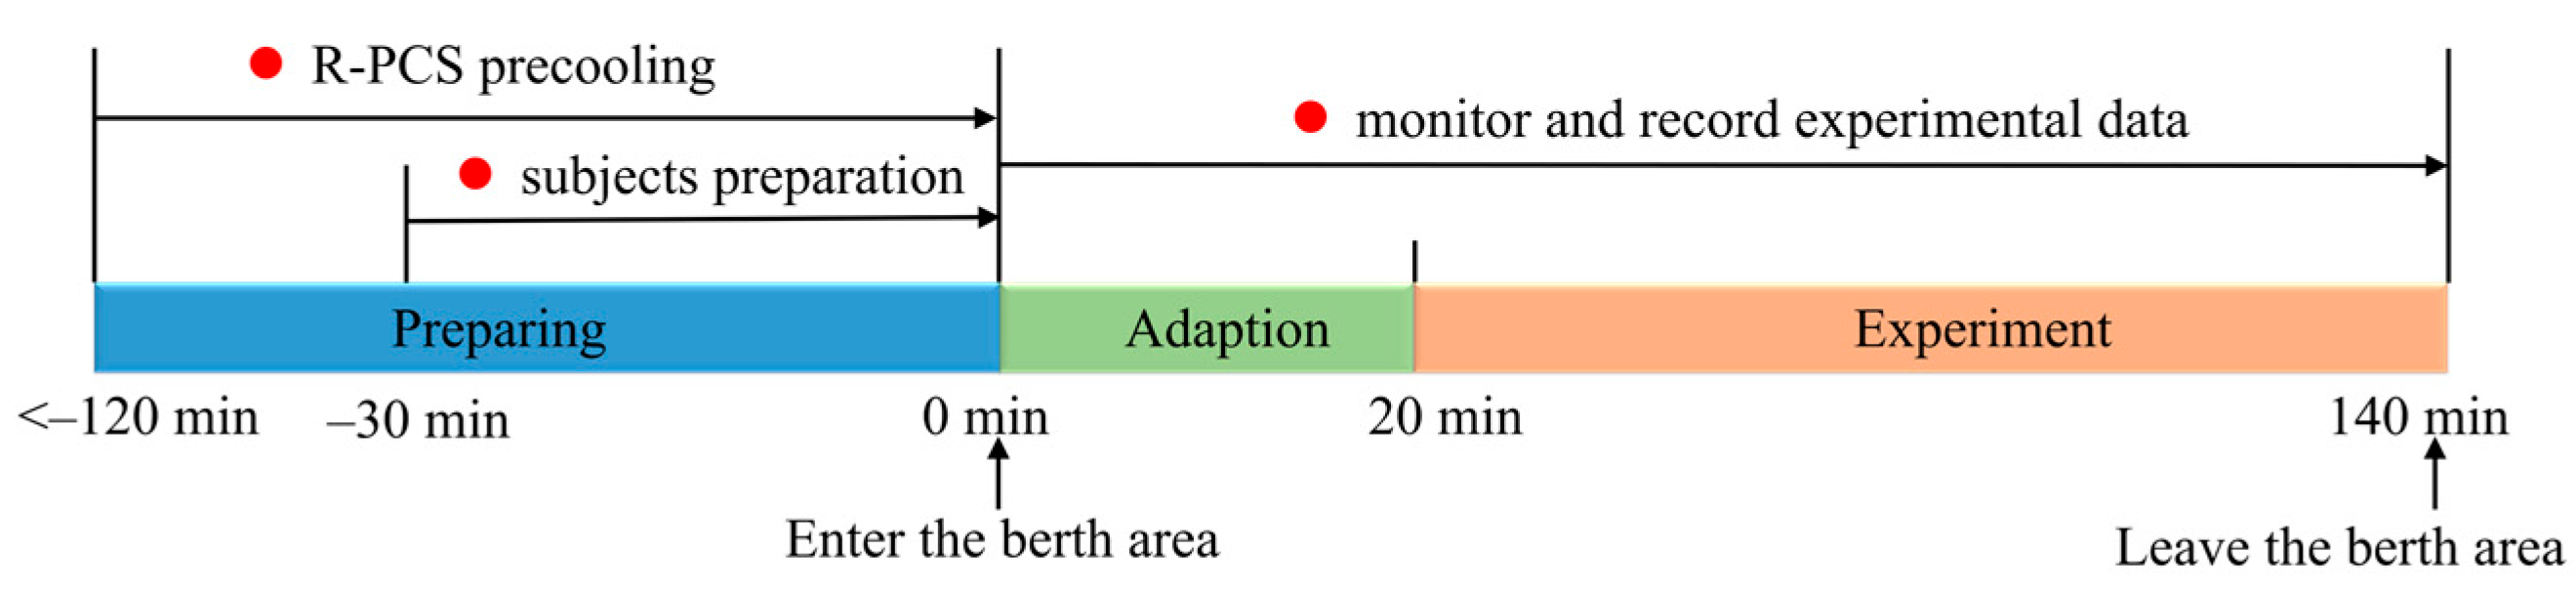
2.4. Experimental Procedure

The summer experiments were conducted from July to September. During the experiment, participants were not informed of the specific test conditions for each session to prevent behavioral biases arising from subjective expectations, thereby ensuring the authenticity of the experimental data. The specific flow of each experiment is shown in Figure 5. The experiments were divided into the preoperation phase, the adaptive phase, and the experimental phase.
First of all, the system must be pre-run for at least 2 h before the start of each experiment to stabilize the thermal environment of the test chamber. The subjects arrived at the lab 30 min in advance for preparation. After arrival, within the first 10 min, the subjects needed to adjust their clothing to a uniform typical summer outfit (short sleeves, shorts, and underwear) and used medical tape to attach the skin temperature measurement instrument to the skin surface of the designated human skin measurement point. Subsequently, the subjects were required to sit quietly in the preparation room for more than 20 min to adjust their physiological state. Then, the subjects entered the berth area, after pulling down the curtains and putting the covers on. The subjects remained in a supine position and rested. The first 20 min was for the subject to adapt to the bed mattress environment. Followed by the experimental phase, after another 2 h, the subjects were asked to remain as motionless as possible in the lying position until the end of the test. Furthermore, the participants did not undergo consecutive experimental sessions; adjustment periods were scheduled after each trial to ensure the independence of the experimental samples. To enhance the robustness of the findings, five valid repeated measurements were conducted for each experimental condition, effectively mitigating the impact of random factors on the reliability of the results.

2.5. Subjects

Nine male volunteers from the university (21–25 years, mean ± STD: 23.3 ± 1.8 years; 165–178 cm, 171.75 ± 6.25 cm, 60–65 kg, 66.25 ± 3.5 kg) were recruited for this study. Notably, good sleeping and eating habits before conducting formal experiments were extremely important for the subjects, and they were familiarized with the specific procedures and precautions to be taken during the experiments. Since the percentage of body surface covered by the quilt affected the thermal insulation performance of the bed mattress system, the subjects were required not to adjust the position of the bedding to assure that the thermal resistance value of the bedding system was consistent during the tests. Additionally, the R-PCS continuously provided cold water at the set temperature, while the experimental apparatus also continuously monitored the data until the end of the experiment. All of the experimental protocols were approved by the Institutional Academic Committee and adhered to the ethical guidelines stipulated in the Declaration of Helsinki. Prior to participation, informed consent was obtained from all participants.

2.6. Experimental Cases

The bedding system consists of a bed, mattress, quilt, and clothing worn by the subject during the experiment. There was an iron-framed wooden plank bed with a 10 mm thick cedar wood synthetic bed board and a 35 mm thick coconut palm mattress in the test, and the quilt and pillow were filled with polyester fiber, 100% cotton sheets, and pillowcases. Three different thicknesses of quilts were selected for the experiments so that the thermal resistance values of the bedding system varied. In this experiment, 94.1% of the subjects’ bodies were covered by the quilt, i.e., only the head was exposed to indoor air. The total thermal resistance values (Rt) for three types of bedding materials, from low to high, were 0.28 (m2·K)/W, 0.34 (m2·K)/W, and 0.53 (m2·K)/W, which were denoted as Q1, Q2, and Q3, respectively. The thermal resistance of the bedding system when the subjects wore only typical summer clothing was 0.18 (m2·K)/W, namely Q0. The Rt is calculated according to the ASHRAE Handbook [32] and a Schematic diagram of heat transfer in the triangular air layer [37].
Based on the previous study by Xin et al. [24], the surface temperature of the radiant panel was more influenced by the water supply temperature rather than the water supply flow rate of the R-PCS. Therefore, in this experiment, we concentrated on the effect of the water supply temperature on human thermal comfort. The corresponding set water supply temperatures were 14 °C, 16 °C, and 18 °C, respectively, while the water supply flow rate was constant at 3.33 × 10⁻⁵ m3/s. Considering the energy savings of the system in summer, a higher corridor area temperature was set to 26 °C, 28 °C, 30 °C, and 32 °C, respectively. According to the experimental test, it is known that the air flow velocity in the berth area is less than 0.15 m/s, and the relative humidity of air was regulated between 40% and 60% by the convection air conditioning system.
In summary, this study aims to examine the effects of both the operating parameters of the R-PCS and indoor environmental parameters on human thermal comfort during the summer, particularly when the human body is covered with a quilt. The investigation was structured into four distinct groups denoted as Q0, Q1, Q2, and Q3, each representing different coverages. Within each experimental group, a matrix of scenarios was considered. So, the experimental design entailed six unique experiments within each group, resulting in a total of 24 experiments across all groups.

2.7. Statistical Analysis

The experimental data were first subjected to the Kolmogorov–Smirnov test using SPSS v28 to assess their normality. For data conforming to a normal distribution, a repeated-measures analysis of variance (ANOVA) was performed to examine significant differences among the factors, yielding statistically significant results between the comparison groups. A significance level of 0.05 (p < 0.05) was adopted throughout the analysis. To enhance visual clarity, selected charts omitted partial error bars.

3. Results

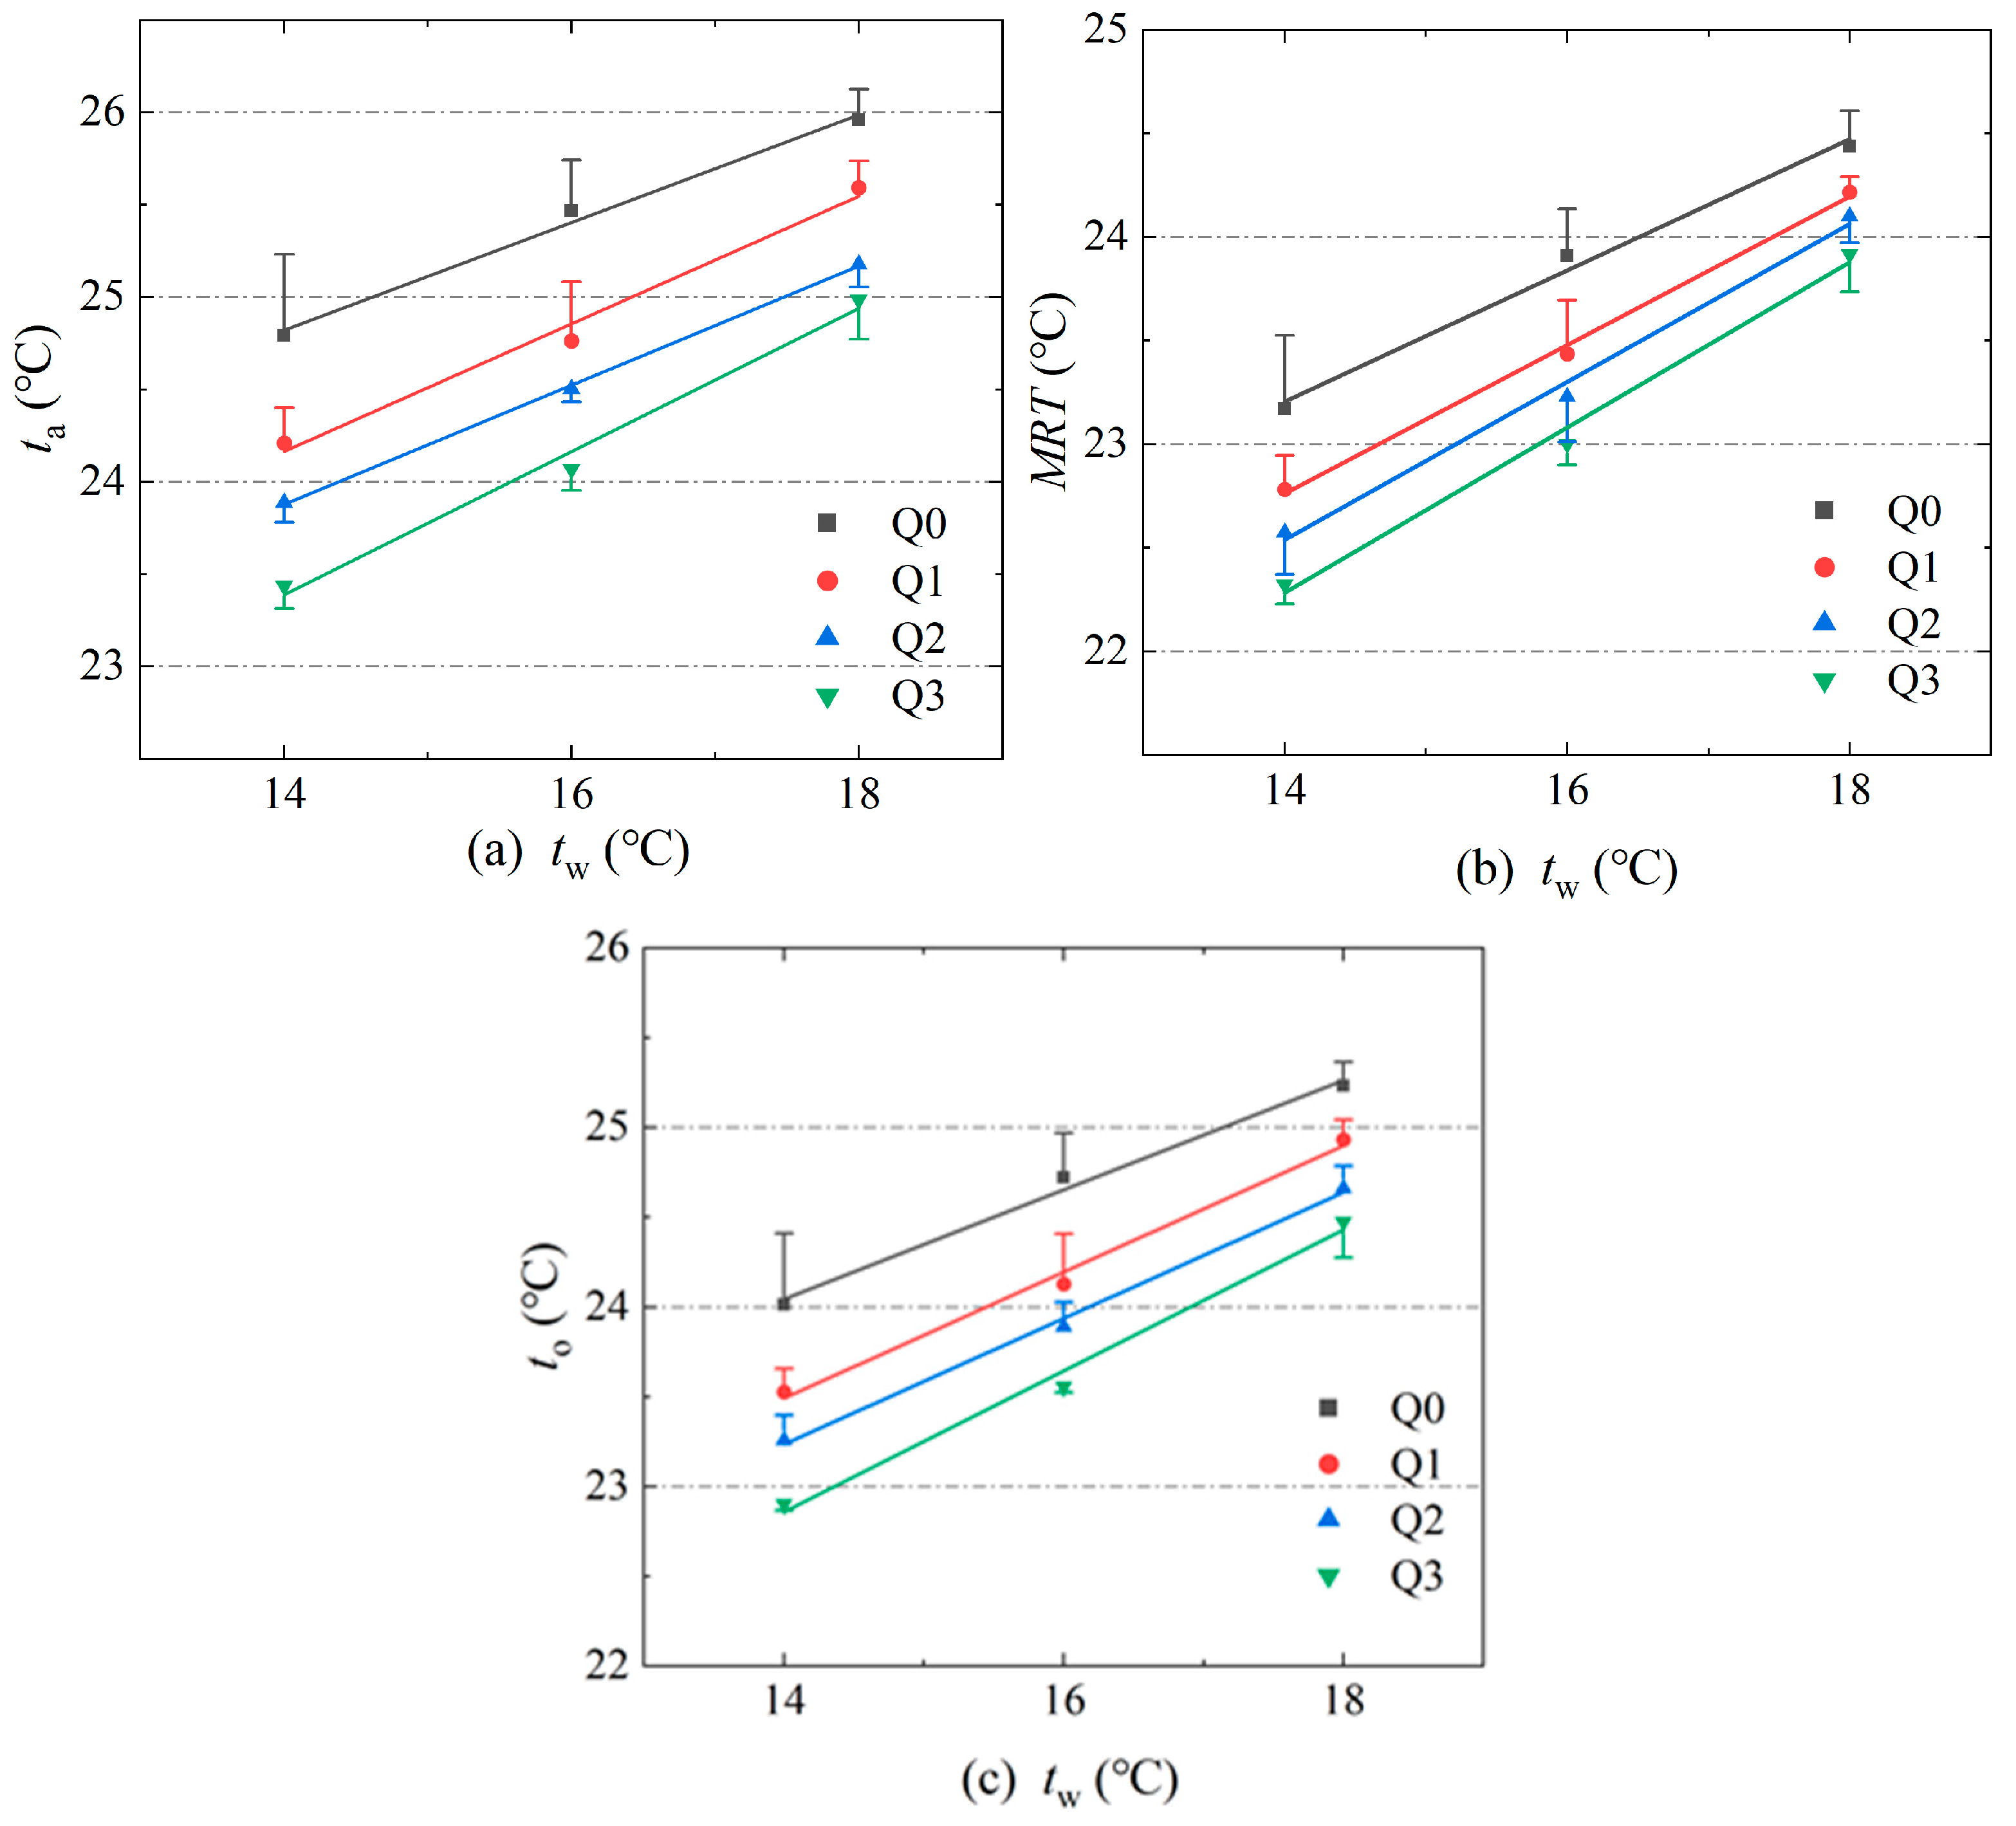
3.1. Thermal Environment Temperature Index

Figure 6 depicts the linear relationships between mean air temperature (ta), mean radiation temperature (MRT), mean operating temperature (to), and radiant panel supply water temperature (tw) under different covering conditions when the corridor area temperature (tc) is 26 °C. Obviously, as tw increases, the ta, MRT, and to in the berth area also gradually rise (p < 0.05). Due to the influence of the quilt, when other parameters (tw and tc) are consistent, the condition in which the subjects are not covered by the quilt (Q0) results in higher ta, MRT, and to in the berth area compared to the Q1, Q2, and Q3 conditions. Moreover, as the thermal resistance of the quilt increases under the same tw and tc, the ta, MRT, and to decrease, which implies that the heat transfer from the human body to the berth area decreases as the thermal resistance of the quilt increases.
Figure 7 illustrates the relationship between ta, MRT, to, and tc under different covering conditions when tw is 14 °C. Similarly, there is also a positive correlation between tc and ta, MRT, and to in the berth area. Due to the obstructive effect of the quilt on the human body’s heat dissipation, ta, MRT, and to in the berth area for the Q0 condition are lower than in the Q1, Q2, and Q3 conditions. The magnitude of the slopes can indicate the degree to which ta, MRT, and to are influenced by tw and tc. It can be concluded from the comparison between Figure 6 and Figure 7 that changes in corridor temperature have a more significant impact on ta, MRT, and to in the berth area under the same covering condition, in contrast to changes in the supply water temperature.

3.2. Human Skin Temperature

Figure 8 reveals how the mean skin temperature ( t _ sk ) varies with changes in tc and tw under different covering conditions. When the subjects are covered by the same quilt, t _ sk shows a positive linear correlation with tw and tc, respectively. The higher tw and tc create a warmer environment, thereby reducing the temperature difference between the human body and the berth area. To maintain normal heat dissipation from the human skin to the berth area, t _ sk increases accordingly (p < 0.05).
According to the patterns of changes in the mean skin temperature, it can be observed that when the human body is covered by the quilt (Q1, Q2, Q3), the t _ sk is higher compared to when the body is not covered by the quilt (Q0). Furthermore, under the same supply water temperature tw and corridor area temperature tc, the greater the thermal resistance of the quilt, the higher t _ sk is. This is because an increase in thermal resistance hinders heat exchange between the human skin and the indoor ambient temperature. To maintain a normal heat exchange from the human body to the ambient temperature, the skin temperature consequently rises. Moreover, it is worth noting that the slope of change in t _ sk varies with respect to tw, and tc is lower when the subjects are covered by the quilt than when the subjects are not covered by the quilt. This also means that the higher thermal resistance of the quilt mitigates the impact of the external environment on t _ sk .

4. Discussion

4.1. Objective Evaluation of Human Thermal Comfort

In this section, the thermal comfort of the subjects is assessed by objective indexes of Predicted Mean Vote (PMV) and Predicted Percent Dissatisfied (PPD). A negative PMV signifies a feeling of cold, while a positive PMV indicates a feeling of warmth. And a value of 0 represents a neutral thermal environment for the individual. According to ISO 7730 [38], an indoor thermal environment of −0.5 < PMV < 0.5 and PPD < 10% is considered to be the target range for human thermal comfort. Given the physical differences between sleep and wakefulness, an improved PMV index for the sleep environment was improved by Lin et al., as shown in Equations (5) and (6) [39]:
L = 40 { 1 R t [ ( 34.6 t o ) + 0.3762 ( 5.52 p a ) ] + 0.056 ( 34 t a ) + 0.692 ( 5.87 p a ) }
PMV = [ 0.303 exp ( 0.036 M ) + 0.028 ] L
where Rt (m2·K/W) is the overall thermal resistance of clothing and the bedding system; pa (kPa) is the partial pressure of indoor water vapor; and psk,s (kPa) is saturated vapor pressure for skin temperature. to (°C) is the mean operating temperature obtained in Section 3.1. However, the subjects in our tests were in a reclined state rather than in a sleeping state, so the metabolic rate M of the subjects was set to 46.5 W/m2, as suggested in [38]. Then, the PMV can be obtained by combining the mean skin temperature tsk (°C) as follows:
PMV = 0.0848 46.5 1 R t t ¯ sk t o + 0.3762 p sk , s p a                   0.0848 0.0651 34 t a + 0.80445 5.87 p a
The PPD can be calculated as shown in Equation (8) [39]:
PPD = 100 95 exp 0.03353 PMV 4 + 0.2179 PMV 2
Figure 9 shows the PMV-PPDs’ variation in the berth area with water supply temperatures tw under different covering conditions. Under the same covering conditions, the PMV values all increase moderately as the tw increases (p < 0.05). Likewise, under the same tw, the higher thermal resistance of quilt means higher PMV values. For the Q0 experiment condition for which the subjects are not covered, the PMV values are all lower than −0.5, and the PPD values are higher than 10%, indicating that the subjects are in a slightly cold state and more than 10% of individuals express dissatisfaction with the prevailing thermal conditions. As the tw increases, the PMV approaches the comfort range, and the PPD gradually decreases, implying that more individuals are content with the existing thermal conditions. When the subjects are covered by the Q1 quilt, the PMV values are all in the target thermal comfort range. Especially when tw = 14 °C or 16 °C, the participants are in a thermally neutral state. When the subjects are covered by the Q2 quilt, tw at 14 °C or 16 °C is effective at maintaining the PMV within the target range. A slight sensation of overheating occurs when the water supply temperature reaches 18 °C. Notably, even at the lowest tw of 14 °C in the Q3 condition, the PMV values consistently exceed 1, indicating that individuals experience a sensation of overheating.
Figure 10 shows the relationship between PMV-PPDs’ variation with the corridor area temperatures tc under different covering conditions (The dashed lines and blue areas represent the boundaries and ranges for PMV values of ±0.5 and PPD values of ±10%, respectively, as does Figure 10). Similarly, there is a positive correlation between PMV values and tc as well as the thermal resistance of the quilt. In the Q0 condition, with the increase in temperatures in the corridor area, the thermal sensation of the human body changes from a slightly cool state to a thermally comfortable state, but it soon gradually changes to a slightly warm state, so the proportion of the subjects dissatisfied with the thermal environment first decreases and then increases (p < 0.05). As the subjects are covered by the quilt with higher thermal resistance, they may feel slightly warm when the corridor temperatures exceed 28 °C for the Q1 condition and 26 °C for the Q2 condition. In the Q3 condition, the PMV values significantly deviate from the target range under all four corridor temperatures, which could cause the human body to perceive a sensation of being very hot.
From the above, it is clear that the covering condition is a key factor in maintaining thermal comfort during sleep. Being covered by a quilt can effectively reduce the sensation of cold in the body. Meanwhile, it is reconfirmed that if the human body is covered with a poorly insulated quilt in summer, the R-PCS can achieve a moderate level of thermal comfort in the berth area. However, if the quilt with excessive thermal resistance is chosen, it may hinder the effective regulation of thermal comfort by the R-PCS. From Figure 9 and Figure 10, it is evident that the corridor temperature significantly influences human thermal perception. Under appropriate corridor temperatures, adjustment of the local thermal environment can be achieved through the R-PCS, thereby ensuring human thermal comfort. Thus, this system can relax the ambient temperature in the corridor area and satisfy the thermal comfort of subjects, which has an energy-saving potential.
In summary, two conditions are close to achieving a state where the human body approaches thermal neutrality: one is Rt = 0.28 (m2·K)/W, tw = 14 °C, tc = 26 °C, and the other is Rt = 0.28 (m2·°C)/W, tw = 16 °C, tc = 26 °C. The corresponding thermally neutral air temperatures are 24 °C and 24.5 °C, which are higher than the thermally neutral air temperature of 23 °C given by Lan et al. [22], although the subjects in their study wore a set of clothes with a lower insulation value of 0.6 clo (0.093 m2·K/W). This implies a greater amount of cooling capacity consumption to be saved. Under both experimental conditions of thermal neutrality, it can be found that the t _ sk of the subjects was about 33.2 °C, as seen in Figure 8, which is consistent with the research of Liu et al. [40]. Lan [41] and Song [42] found that the t _ sk of the human body at thermal neutrality was 34.6 °C, which is more than 1 °C higher. This difference may be attributed to the difference in metabolic rate M between sleeping and awake states according to Fanger’s theory of thermal comfort [43].

4.2. Energy-Saving Analysis

To quantify the energy-saving potential of the R-PCS in summer, it is necessary to calculate the total energy consumption of the R-PCS. The condition of Rt = 0.28 (m2·K)/W, tc = 26 °C, and tw = 14 °C, in which thermal neutrality be can achieved, is used to calculate the total energy consumption of the R-PCS to assess energy-saving efficiency. Under the identical conditions of bedding insulation, air velocity, and relative humidity as in this experiment, to achieve thermal neutrality for an individual in a lying position, the indoor temperature should be approximately 25 °C when utilizing a conventional HVAC system [29]. Hence, an indoor environment at 25 °C is selected as the reference condition.
For hotel rooms with interior design temperature of 25 °C, the design cooling load is typically in the range of 70 to 100 W/m2 [44]. Taking into account the enhanced thermal insulation of the building envelope, a lower cooling design load of 70 W/m2 is selected. In this experiment, the total area of the test space is approximately 5.52 m2, with the berth area occupying 1.6 m2 and the corridor area covering 3.92 m2.
Therefore, when the entire cooling load of the room is handled by a traditional HVAC system, the total cooling load is 386.4 W.
However, when using the R-PCS for cooling during the summer, the total cooling load is composed of two parts. The first part is the cooling load achieved by the HVAC to regulate the corridor area temperature, and the second part is maintained by the radiant panel to address the cooling load in the berth area. Based on the required cooling load in the corridor area, the first part of the cooling load is calculated to be 274.4 W. For the second part, the cooling load provided by the radiant panel can be described with the following formula:
Q p a n e l = ρ c p q Δ t
where Qpanel represents the cooling capacity provided by the radiant panel, ρ represents the density of water, cp represents the specific heat capacity of water, q represents the water flow rate, and Δ t represents the temperature difference between inlet and outlet water in this R-PCS. tc = 26 °C, and tw = 14 °C, ρ = 998.2 kg/m3, cp = 4188 J/(kg·K). In our tests, the water flow rate q is maintained at 3.33 × 10⁻⁵ m3/s. And the mean temperature difference Δ t is about 0.55 °C for this experimental condition. Thus, Qpanel is 76.6 W with an uncertainty of ±18%.
It is assumed that cold water to the radiant panels and the corridor area air conditioning system are from air-source heat pumps. The water temperature supplied to the fan coil unit is usually 7 °C, for which the COP is approximately 2.50. When the water temperature required for the radiant cooling panels is 14 °C, the air-source heat pump operates under variable conditions. Based on the required outlet water temperature of the air-source heat pump and the outdoor temperature, the COP of the unit connected to the radiant panels can be estimated to be 3.20 [44].
Hoyt et al. mentioned that the energy consumption of the traditional HVAC system can be reduced by approximately 10% for every 1 °C growth in the set temperature [45]. Thus, when using the R-PCS to maintain a corridor area temperature of 26 °C, the energy consumption of the HVAC is estimated to be around 98.8 W, and the cooling load by the radiant panel is 23.9 W. Therefore, the total energy consumption for summer cooling when using the R-PCS while maintaining thermal comfort is 122.7 W. In contrast, when the traditional air conditioning system cools the whole experiment room, the total energy consumption is estimated to be approximately 154.6 W. The calculation results are shown in Table 2.
In summary, compared to traditional air conditioning, the R-PCS can save 20.6% energy while maintaining the same human thermal sensation.

4.3. Limitations

In this study, only male college students were recruited as participants, and the gender differences among the subjects were not taken into consideration. In fact, there are significant differences in skin temperature between men and women [46], which may lead to differences in thermal comfort, as women tend to prefer warmer environments than men [47]. Age [48] and metabolic rate [39] also significantly influence human skin temperature distribution and response mechanisms to thermal environments. Therefore, future studies should further consider individual differences in thermal perception and expand the number of individuals involved in this study.
Moreover, the temperature of the sleep environment may change over time [49], which in turn affects human’s thermal sensation during sleep [50,51,52], potentially influencing sleep quality. Consequently, Lan et al. designed a programmed air temperature system and found that the energy savings of this system could achieve 34.3% while maintaining both thermal comfort and sleep quality [35]. Compared with traditional air conditioning, the results show that the R-PCS can achieve a more energy-saving effect [53,54,55], and its upfront investment is lower. Thus, adjusting the radiant cooling panel temperature based on the thermal sensation characteristics of different sleep stages may better balance the requirements of thermal comfort and energy conservation. Finally, the current system lacks a closed-loop control strategy based on physiological signals, and in the future, changes in human physiological signals can be incorporated into the basis of system regulation.

5. Conclusions

In this study, we obtained the thermal environment parameters in the berth area and human skin temperature while the R-PCS was turned on under different operating conditions through experimental measurements. The PMV–PPD index for human was used to evaluate human overall thermal comfort, and the energy consumption of the R-PCS was analyzed. The main research results are as follows:
(1)
Under the same covering conditions, the air temperature, radiation temperature, operating temperature in the berth area, and human skin temperature during the test are positively and linearly related to the water supply temperature and corridor area temperature, respectively.
(2)
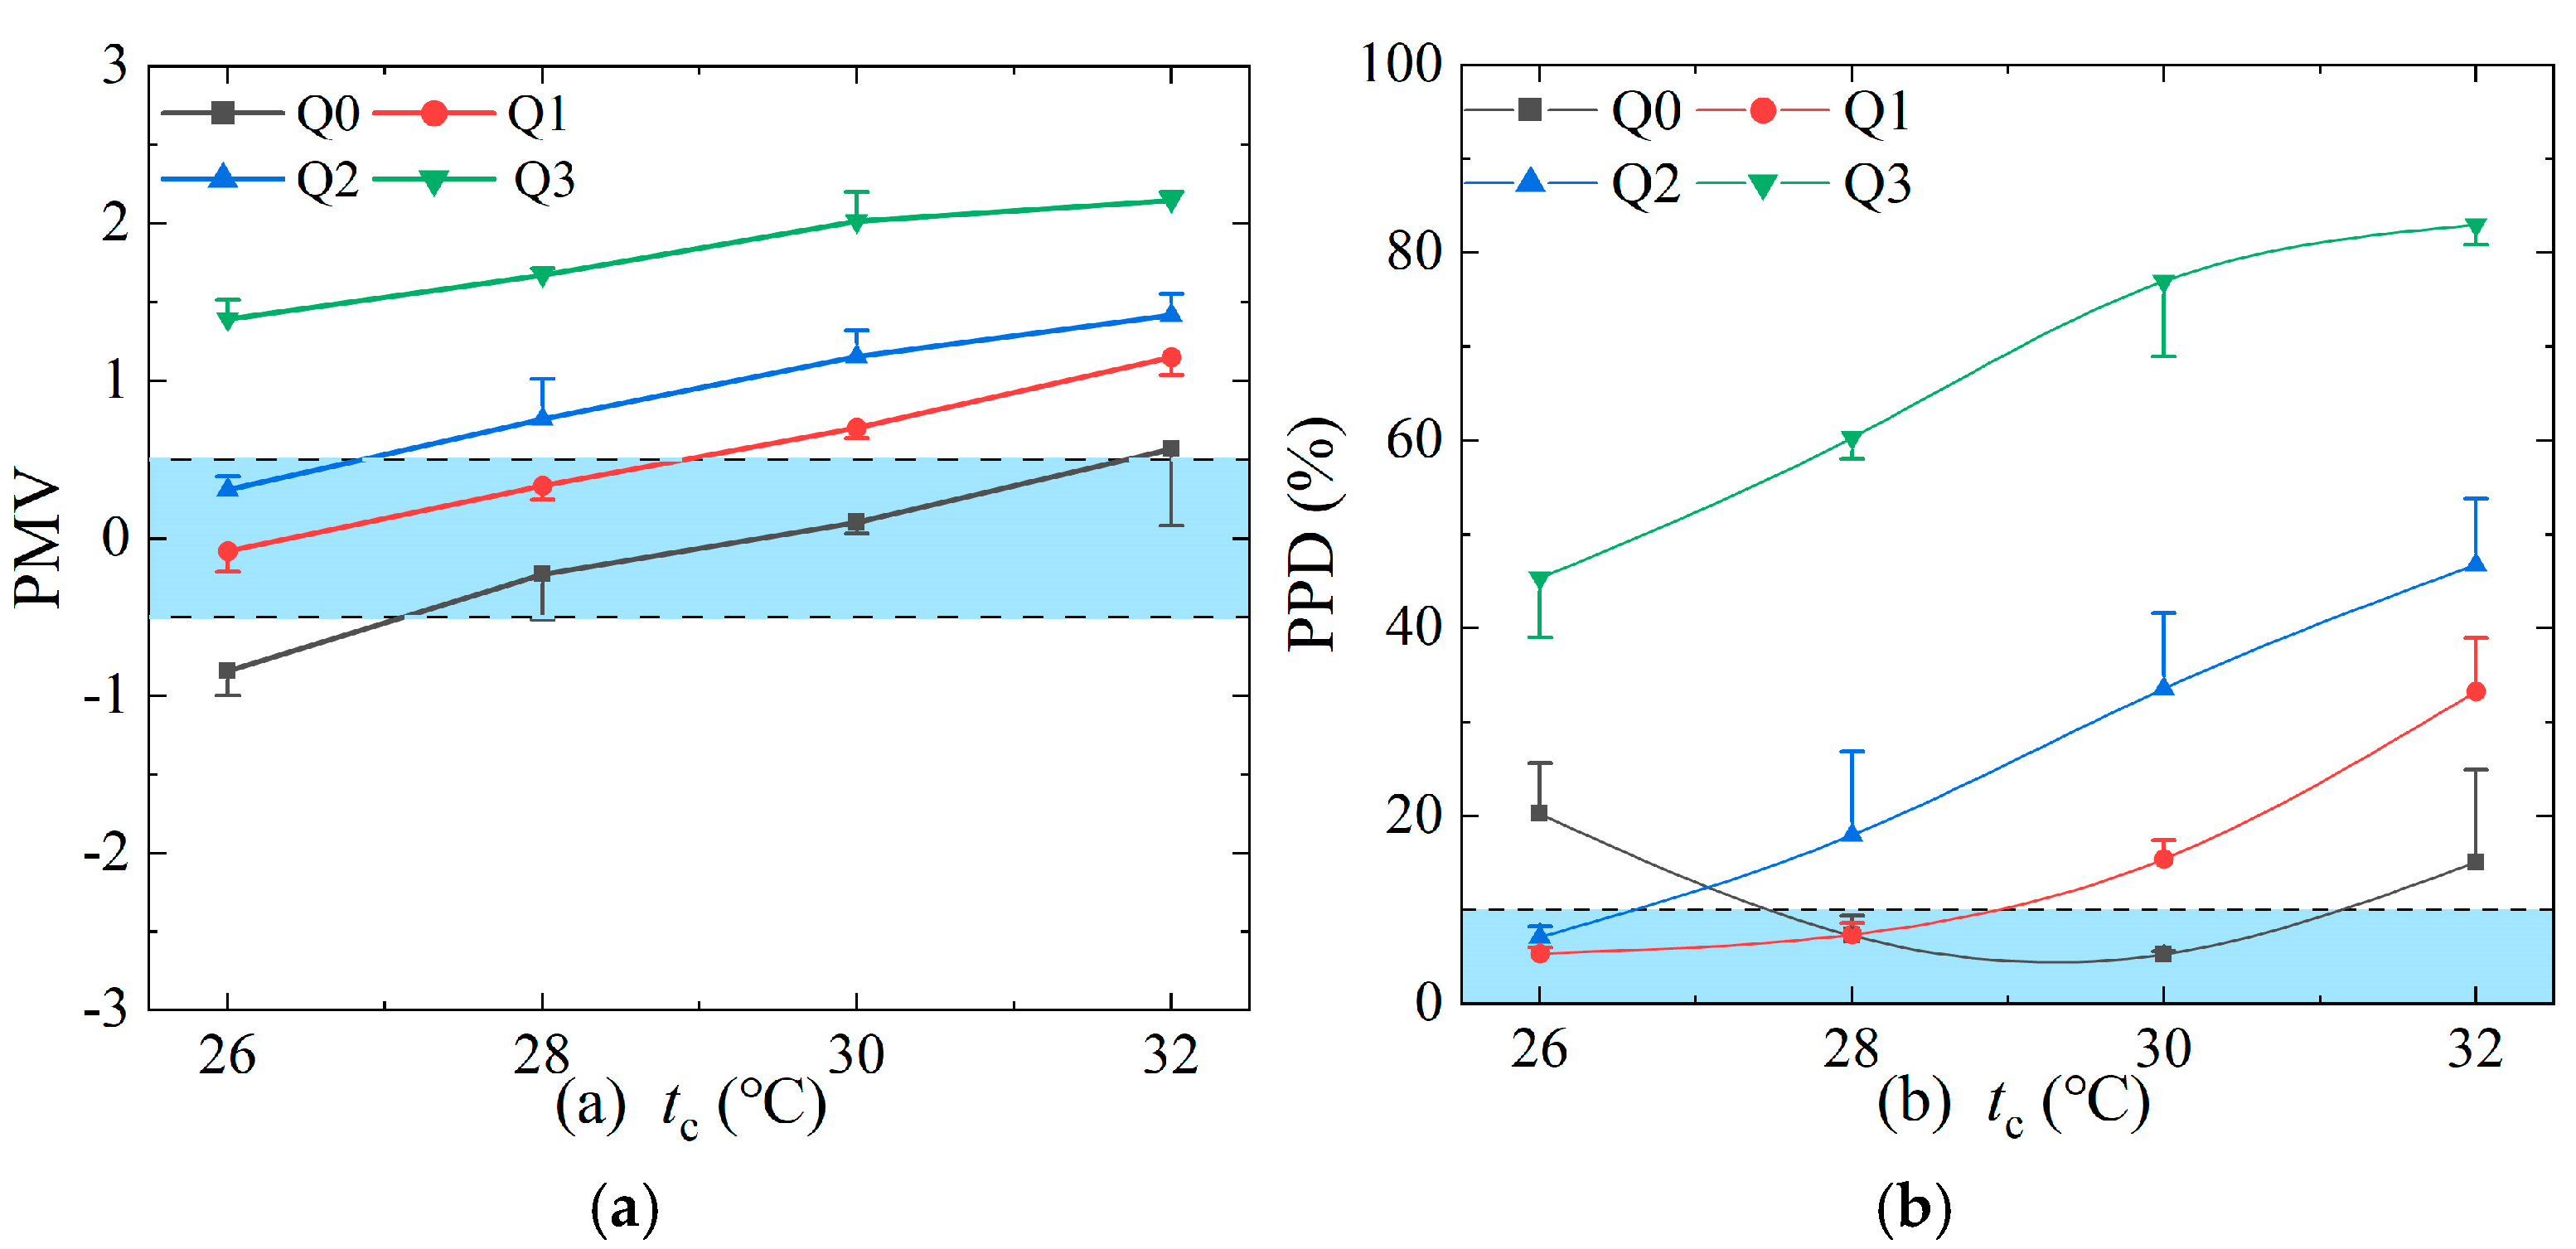
Through the PMV–PPD index of the human body under different experimental operating conditions, it was revealed that the higher water supply temperature, corridor area temperature, and insulation of quilts could lead to a higher human thermal sensation. The experimental conditions that are close to thermal neutrality are (1) Rt = 0.28 (m2·K)/W, tw = 14 °C, tc = 26 °C; (2) Rt = 0.28 (m2·K)/W, tw = 16 °C, tc = 26 °C.
(3)
The experimental condition (Rt = 0.28 (m2·°C)/W, tw = 14 °C, tc = 26 °C) that reached the specification-recommended thermal neutrality was analyzed for its energy efficiency. It was found that the R-PCS can save 20.6% of energy compared with conventional air conditioning systems.

Author Contributions

Conceptualization, W.X. and W.C.; formal analysis, W.X., Y.L., and X.W.; funding acquisition, W.C.; methodology, W.C., Y.L., and X.W.; supervision, W.C.; validation, Y.L.; writing—original draft, W.X. and Y.L.; writing—review and editing, W.X. and W.C. All authors have read and agreed to the published version of the manuscript.

Funding

This research received no external funding.

Institutional Review Board Statement

This study was conducted in accordance with the Declaration of Helsinki, and the study was exempted from ethics approval by the Ethics Committee of the School of Energy and Power Engineering, Chongqing University, on 28 November 2023.

Informed Consent Statement

Informed consent was obtained from all subjects involved in this study.

Data Availability Statement

The original contributions presented in this study are included in the article. Further inquiries can be directed to the corresponding author.

Conflicts of Interest

The authors declare no conflicts of interest.

References

  1. Boor, B.E.; Spilak, M.P.; Laverge, J.; Novoselac, A.; Xu, Y. Human exposure to indoor air pollutants in sleep microenvironments: A literature review. Build. Environ. 2017, 125, 528–555. [Google Scholar] [CrossRef]
  2. Cui, Y.; Wang, Y.P.; Zhu, L. Performance analysis on a building–integrated solar heating and cooling panel. Renew. Energy 2015, 74, 627–632. [Google Scholar] [CrossRef]
  3. Wang, Z.H.; Cao, B.; Zhu, Y.X. Questionnaire survey and field investigation on sleep thermal comfort and behavioral adjustments in bedrooms of Chinese residents. Energy Build. 2021, 253, 111462. [Google Scholar] [CrossRef]
  4. Ismail, O.A.; Kassem, M.A.; Hassan, M.A. Sleeping pods with radiant cooling panels: A first assessment of thermal comfort and cooling capacity. Energy Build. 2021, 250, 111282. [Google Scholar] [CrossRef]
  5. Aryal, A.; Chaiwiwatworakul, P.; Chirarattananon, S. An experimental study of thermal performance of the radiant ceiling cooling in office building in Thailand. Energy Build. 2023, 283, 112849. [Google Scholar] [CrossRef]
  6. Chen, J.B.; Yu, H.Z.; Liu, G. The Comparison of Cooling Performance Between New-type Capillary Radiant Panel and Traditional Radiant Panel. In Proceedings of the 8th International Symposium on Heating, Ventilation and Air Conditioning, Xi’an, China, 19–21 October 2013; Volume 262, pp. 317–325. [Google Scholar] [CrossRef]
  7. Guo, Y.L.; Wu, H.J.; Du, K.; Huang, G.S.; Xu, X.H. Experimental study on radiant cooling with double-skin infrared-transparent membranes. Energy Build. 2023, 278, 112654. [Google Scholar] [CrossRef]
  8. Shin, M.S.; Rhee, K.N.; Park, S.H.; Yeo, M.S.; Kim, K.W. Enhancement of cooling capacity through open-type installation of cooling radiant ceiling panel systems. Build. Environ. 2019, 148, 417–432. [Google Scholar] [CrossRef]
  9. Choi, J.S.; Jung, G.J.; Rhee, K.N. Cooling performance evaluation of a fan–assisted ceiling radiant cooling panel system. Energy Build. 2023, 281, 112760. [Google Scholar] [CrossRef]
  10. Liang, Y.Y.; Zhang, N.; Wu, H.J.; Xu, X.H.; Du, K.; Yang, J.M.; Sun, Q.; Dong, K.J.; Huang, G.S. Thermal environment and thermal comfort built by decoupled radiant cooling units with low radiant cooling temperature. Build. Environ. 2021, 206, 108342. [Google Scholar] [CrossRef]
  11. Jia, H.Y.; Pang, X.F.; Haves, P. Experimentally-determined characteristics of radiant systems for office buildings. Appl. Energy 2018, 221, 41–54. [Google Scholar] [CrossRef]
  12. Wang, D.J.; Chen, P.H.; Liu, Y.F.; Wu, C.J.; Liu, J.P. Heat transfer characteristics of a novel sleeping bed with an integrated hot water heating system. Appl. Therm. Eng. 2017, 113, 79–86. [Google Scholar] [CrossRef]
  13. Kim, B.Y.; Ham, Y. Personal thermal comfort modeling based on facial expression. J. Build. Eng. 2023, 75, 106956. [Google Scholar] [CrossRef]
  14. Song, W.F.; Zhang, C.J.; Lai, D.D.; Wang, F.M.; Kuklane, K. Use of a novel smart heating sleeping bag to improve wearers’ local thermal comfort in the feet. Sci. Rep. 2016, 6, 19326. [Google Scholar] [CrossRef]
  15. Xue, W.P.; Zhang, G.F.; Chen, L.; Li, K.J. Developing a novel personal thermoelectric comfort system for improving indoor occupant’s thermal comfort. J. Build. Eng. 2024, 84, 108561. [Google Scholar] [CrossRef]
  16. Zhang, H.; Arens, E.; Zhai, Y.C. A review of the corrective power of personal comfort systems in non–neutral ambient environments. Build. Environ. 2015, 91, 15–41. [Google Scholar] [CrossRef]
  17. Ismail, N.; Ouahrani, D. Modelling of cooling radiant cubicle for an office room to test cooling performance, thermal comfort and energy savings in hot climates. Energy 2022, 244, 123185. [Google Scholar] [CrossRef]
  18. Pan, D.M.; Chan, M.Y.; Xia, L.; Xu, X.G.; Deng, S.M. Performance evaluation of a novel bed-based task/ambient conditioning (TAC) system. Energy Build. 2012, 44, 54–62. [Google Scholar] [CrossRef]
  19. Mao, N.; Pan, D.M.; Chan, M.Y.; Deng, S.M. Experimental and numerical studies on the performance evaluation of a bed-based task/ambient air conditioning (TAC) system. Appl. Energy 2014, 136, 956–967. [Google Scholar] [CrossRef]
  20. Du, J.; Chan, M.Y.; Deng, S.M. An experimental study on the performances of a radiation–based task/ambient air conditioning system applied to sleeping environments. Energy Build. 2017, 139, 291–301. [Google Scholar] [CrossRef]
  21. Cao, T.; Lian, Z.W.; Ma, S.; Bao, J.K. Thermal comfort and sleep quality under temperature, relative humidity and illuminance in sleep environment. J. Build. Eng. 2021, 43, 102575. [Google Scholar] [CrossRef]
  22. Cao, T.; Lian, Z.W.; Zhu, J.W.; Xu, X.B.; Du, H.; Zhao, Q.T. Parametric study on the sleep thermal environment. Build. Simulat. 2021, 15, 885–898. [Google Scholar] [CrossRef]
  23. Lan, L.; Pan, L.; Lian, Z.W.; Huang, H.Y.; Lin, Y.B. Experimental study on thermal comfort of sleeping people at different air temperatures. Build. Environ. 2014, 73, 24–31. [Google Scholar] [CrossRef]
  24. Xin, Y.L.; Cui, W.Z.; Zeng, J.K. Experimental study on thermal comfort in a confined sleeping environment heating with capillary radiation panel. Energy Build. 2019, 205, 109540. [Google Scholar] [CrossRef]
  25. Wang, Z.; Zhang, N.; Cao, B.; Zhu, Y.X. Thermal sensation and sleep quality in different combinations of indoor air temperature and bedding system conditions. Build. Environ. 2023, 243, 110729. [Google Scholar] [CrossRef]
  26. Pan, D.M.; Lin, Z.P.; Mao, N.; Song, M.J. A study on the effects of different bedding systems on thermal comfort—Quantifying the sensitivity coefficient used for calculating Predicted Mean Vote (PMV) in sleeping environments. Energy Procedia 2017, 142, 1939–1946. [Google Scholar] [CrossRef]
  27. Lin, Z.P.; Deng, S.M. A study on the thermal comfort in sleeping environments in the subtropics—Measuring the total insulation values for the bedding systems commonly used in the subtropics. Build. Environ. 2008, 43, 905–916. [Google Scholar] [CrossRef]
  28. Yan, F.Y.; Zheng, Q.; Ke, Y. Effect of quilt thermal resistance on bedding system and sleep thermal comfort. J. Therm. Biol. 2023, 117, 103713. [Google Scholar] [CrossRef]
  29. Zhang, N.; Cao, B.; Wang, Z.H.; Zhu, Y.X. Effects of bedding insulation and indoor temperature on bed microclimate and thermal comfort. Energy Build. 2020, 233, 110097. [Google Scholar] [CrossRef]
  30. Horikoshi, T.; Kobayashi, Y. Configuration factors between a rectangular solid as a model of the human body and rectangular planes, for evaluation of the influence of thermal radiation on the human body: I. calculation of configuration factors for the rectangular solids. Trans. Archit. Inst. Jpn. 1977, 253, 91–102. [Google Scholar] [CrossRef]
  31. Nagano, K.; Mochida, T. Experiments on thermal environmental design of ceiling radiant cooling for supine human subjects. Build. Environ. 2004, 39, 267–275. [Google Scholar] [CrossRef]
  32. ASHRAE. ASHRAE Handbook of Fundamentals (SI); ASHRAE: Atalanta, GA, USA, 2021. [Google Scholar]
  33. Colin, J.; Houdas, Y. Experimental determination of coefficient of heat exchanges by convection of human body. J. Appl. Physiol. 1967, 22, 31–38. [Google Scholar] [CrossRef] [PubMed]
  34. Nadel, E.R.; Mitchell, J.W.; Stolwijk, J.A. Differential thermal sensitivity in human skin. Pflug. Arch. 1973, 340, 71–76. [Google Scholar] [CrossRef]
  35. Liu, W.W.; Lian, Z.W.; Deng, Q.H.; Liu, Y.M. Evaluation of calculation methods of mean skin temperature for use in thermal comfort study. Build. Environ. 2011, 46, 478–488. [Google Scholar] [CrossRef]
  36. Lan, L.; Lian, Z.W.; Qian, X.L.; Dai, C.Z. The effects of programmed air temperature changes on sleep quality and energy saving in bedroom. Energy Build. 2016, 129, 207–214. [Google Scholar] [CrossRef]
  37. Pan, D.M.; Lin, Z.P.; Deng, S.M. A mathematical model for predicting the total insulation value of a bedding system. Build. Environ. 2010, 45, 1866–1872. [Google Scholar] [CrossRef]
  38. ISO 7730:2005; Ergonomics of the Thermal Environment–Analytical Determination and Interpretation of Thermal Comfort Using Calculation of the PMV and PPD Indices and Local Thermal Comfort Criteria. International Organization for Standardization: Geneva, Switzerland, 2005.
  39. Lin, Z.P.; Deng, S.M. A study on the thermal comfort in sleeping environments in the subtropics—Developing a thermal comfort model for sleeping environments. Build. Environ. 2008, 43, 70–81. [Google Scholar] [CrossRef]
  40. Liu, W.W.; Lian, Z.W.; Deng, Q.H. Use of mean skin temperature in evaluation of individual thermal comfort for a person in a sleeping posture under steady thermal environment. Indoor Built Environ. 2015, 24, 489–499. [Google Scholar] [CrossRef]
  41. Lan, L.; Xia, L.L.; Tang, J.Y.; Wyon, D.P.; Liu, H. Mean skin temperature estimated from 3 measuring points can predict sleeping thermal sensation. Build. Environ. 2019, 162, 106292. [Google Scholar] [CrossRef]
  42. Song, C.; Zhao, T.T.; Song, Z.Y.; Liu, Y.F. Effects of phased sleeping thermal environment regulation on human thermal comfort and sleep quality. Build. Environ. 2020, 181, 107108. [Google Scholar] [CrossRef]
  43. Fanger, P.O. Thermal Comfort; Danish Technical Press: Copenhagen, Denmark, 1970. [Google Scholar]
  44. Lu, Y.Q. Practical Heating, Ventilation, and Air Conditioning Design Manual; China Architecture & Building Press: Beijing, China, 2008. (In Chinese) [Google Scholar]
  45. Hoyt, T.; Arens, E.; Zhang, H. Extending air temperature setpoints: Simulated energy savings and design considerations for new and retrofit buildings. Build. Environ. 2015, 88, 89–96. [Google Scholar] [CrossRef]
  46. Tsang, T.W.; Mui, K.W.; Wong, L.T. Investigation of thermal comfort in sleeping environment and its association with sleep quality. Build. Environ. 2021, 187, 107406. [Google Scholar] [CrossRef]
  47. Pan, L.; Lian, Z.W.; Lan, L. Investigation of Gender Differences in Sleeping Comfort at Different Environmental Temperatures. Indoor Built Environ. 2012, 21, 811–820. [Google Scholar] [CrossRef]
  48. Tang, Y.; Yu, H.; Mao, H.; Zhang, K.; Wang, M. Indoor thermal comfort and ageing: A systematic review. J. Build. Eng. 2025, 100, 111714. [Google Scholar] [CrossRef]
  49. Wakamura, T.; Tokura, H. Circadian rhythm of rectal temperature in humans under different ambient temperature cycles. J. Therm. Biol. 2002, 27, 439–447. [Google Scholar] [CrossRef]
  50. Candas, V.; Libert, J.P.; Muzet, A. Heating and cooling stimulations during SWS and REM sleep in man. J. Therm. Biol. 1982, 7, 155–158. [Google Scholar] [CrossRef]
  51. Jennings, J.R.; Reynolds, C.F.; Bryant, D.S.; Berman, S.R.; Buysse, D.J.; Dahl, R.E.; Hoch, C.C.; Monk, T.H. Peripheral thermal responsivity to facial cooling during sleep. Psychophysiology 1993, 30, 374–382. [Google Scholar] [CrossRef]
  52. Lan, L.; Qian, X.L.; Lian, Z.W.; Lin, Y.B. Local body cooling to improve sleep quality and thermal comfort in a hot environment. Indoor Air 2017, 28, 135–145. [Google Scholar] [CrossRef]
  53. Zhao, K.; Liu, X.H.; Jiang, Y. Application of radiant floor cooling in large space buildings—A review. Renewable Sustainable Energy Rev. 2016, 55, 1083–1096. [Google Scholar] [CrossRef]
  54. Imanari, T.; Omori, T.; Bogaki, K. Thermal comfort and energy consumption of the radiant ceiling panel system: Comparison with the conventional all–air system. Energy Build. 1999, 30, 167–175. [Google Scholar] [CrossRef]
  55. Antonopoulos, K.A.; Vrachopoulos, M.; Tzivanidis, C. Experimental evaluation of energy savings in air-conditioning using metal ceiling panels. Appl. Therm. Eng. 1988, 18, 1129–1138. [Google Scholar] [CrossRef]
Figure 1. A schematic diagram of the experimental setup for the R-PCS.
Energies 18 02724 g001
Figure 2. (a) Three-dimensional view of the laboratory; (b) a photograph of the berth area site.
Energies 18 02724 g002
Figure 3. (a) An on-site photo of the radiant panel; (b) internal structure diagram of the radiant panel.
Energies 18 02724 g003
Figure 4. Measuring points of air temperature in the test room.
Energies 18 02724 g004
Figure 5. Experimental procedure.
Energies 18 02724 g005
Figure 6. Variations in (a) mean air temperature, (b) mean radiation temperature, and (c) mean operating temperature during the experiments (tc = 26 °C) (error bars represent the standard deviation, STD).
Energies 18 02724 g006
Figure 7. Variations in (a) mean air temperature, (b) mean radiation temperature, and (c) mean operating temperature during the experiments (tw = 14 °C) (error bars represent the standard deviation, STD).
Energies 18 02724 g007
Figure 8. Variations in mean human skin temperature (a) tc = 26 °C; (b) tw = 14 °C. (Error bars represent the standard deviation, STD).
Energies 18 02724 g008
Figure 9. Variations in (a) PMVs and (b) PPDs (tc = 26 °C) (error bars represent the standard deviation, STD).
Energies 18 02724 g009
Figure 10. Variations in (a) PMVs and (b) PPDs (tw = 14 °C) (error bars represent the standard deviation, STD).
Energies 18 02724 g010
Table 1. Parameters of measuring instruments.
InstrumentsInstrument ModelMeasuring RangePrecision
ThermocoupleTT–T–30–SLE−200~150 °C±0.1 °C
Button thermometeriButton DS1922L−40~85 °C±0.5 °C
Electromagnetic flowmeterCKLDG–D20–W0.1~15 m/s±0.5%
Hot-wire anemometerTesto–405i0~30 m/s±(0.1 m/s + 5%rdg) (0–2 m/s)
±(0.3 m/s + 5%rdg) (2–15 m/s)
HygrometerCOS–03–5−40~80 °C
0~100% RH
±0.1 °C
±1.5% RH
Table 2. Comparison of summer cooling energy consumption between R-PCS and conventional HVAC.
Type of Air
Conditioner
AreaCOPCooling Load/WEnergy Consumption
/W
Energy Saving/%
ConventionalEntire space2.50386.4154.620.6%
R-PCSCorridor area2.50274.498.8
Berth area3.2076.623.9
Disclaimer/Publisher’s Note: The statements, opinions and data contained in all publications are solely those of the individual author(s) and contributor(s) and not of MDPI and/or the editor(s). MDPI and/or the editor(s) disclaim responsibility for any injury to people or property resulting from any ideas, methods, instructions or products referred to in the content.

