

Multi-Level Simulation Framework for Degradation-Aware Operation of a Large-Scale Battery Energy Storage Systems


Abstract
1. Introduction
1.1. Literature Review
1.2. Paper Highlights and Structure
2. Structure of the Multi-Level Simulation Framework
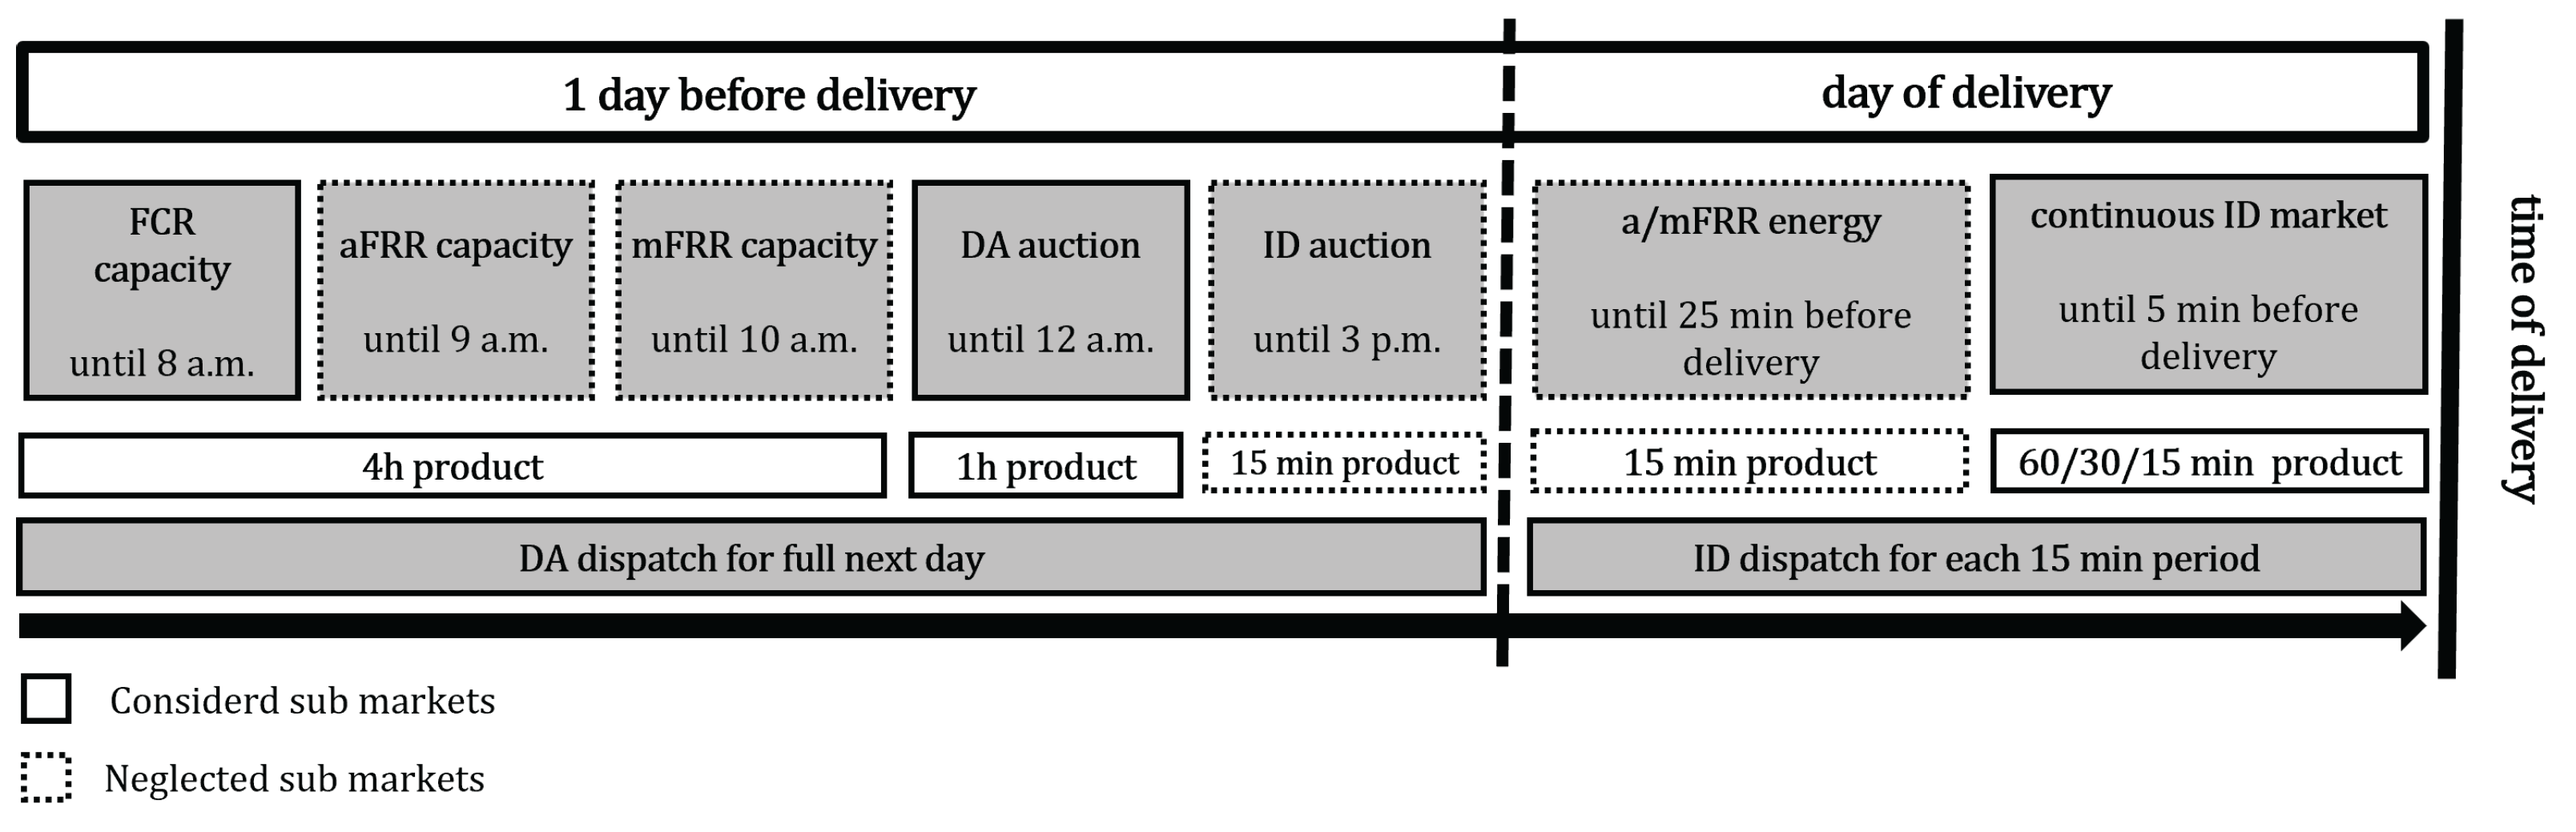
2.1. Day-Ahead Dispatch Level
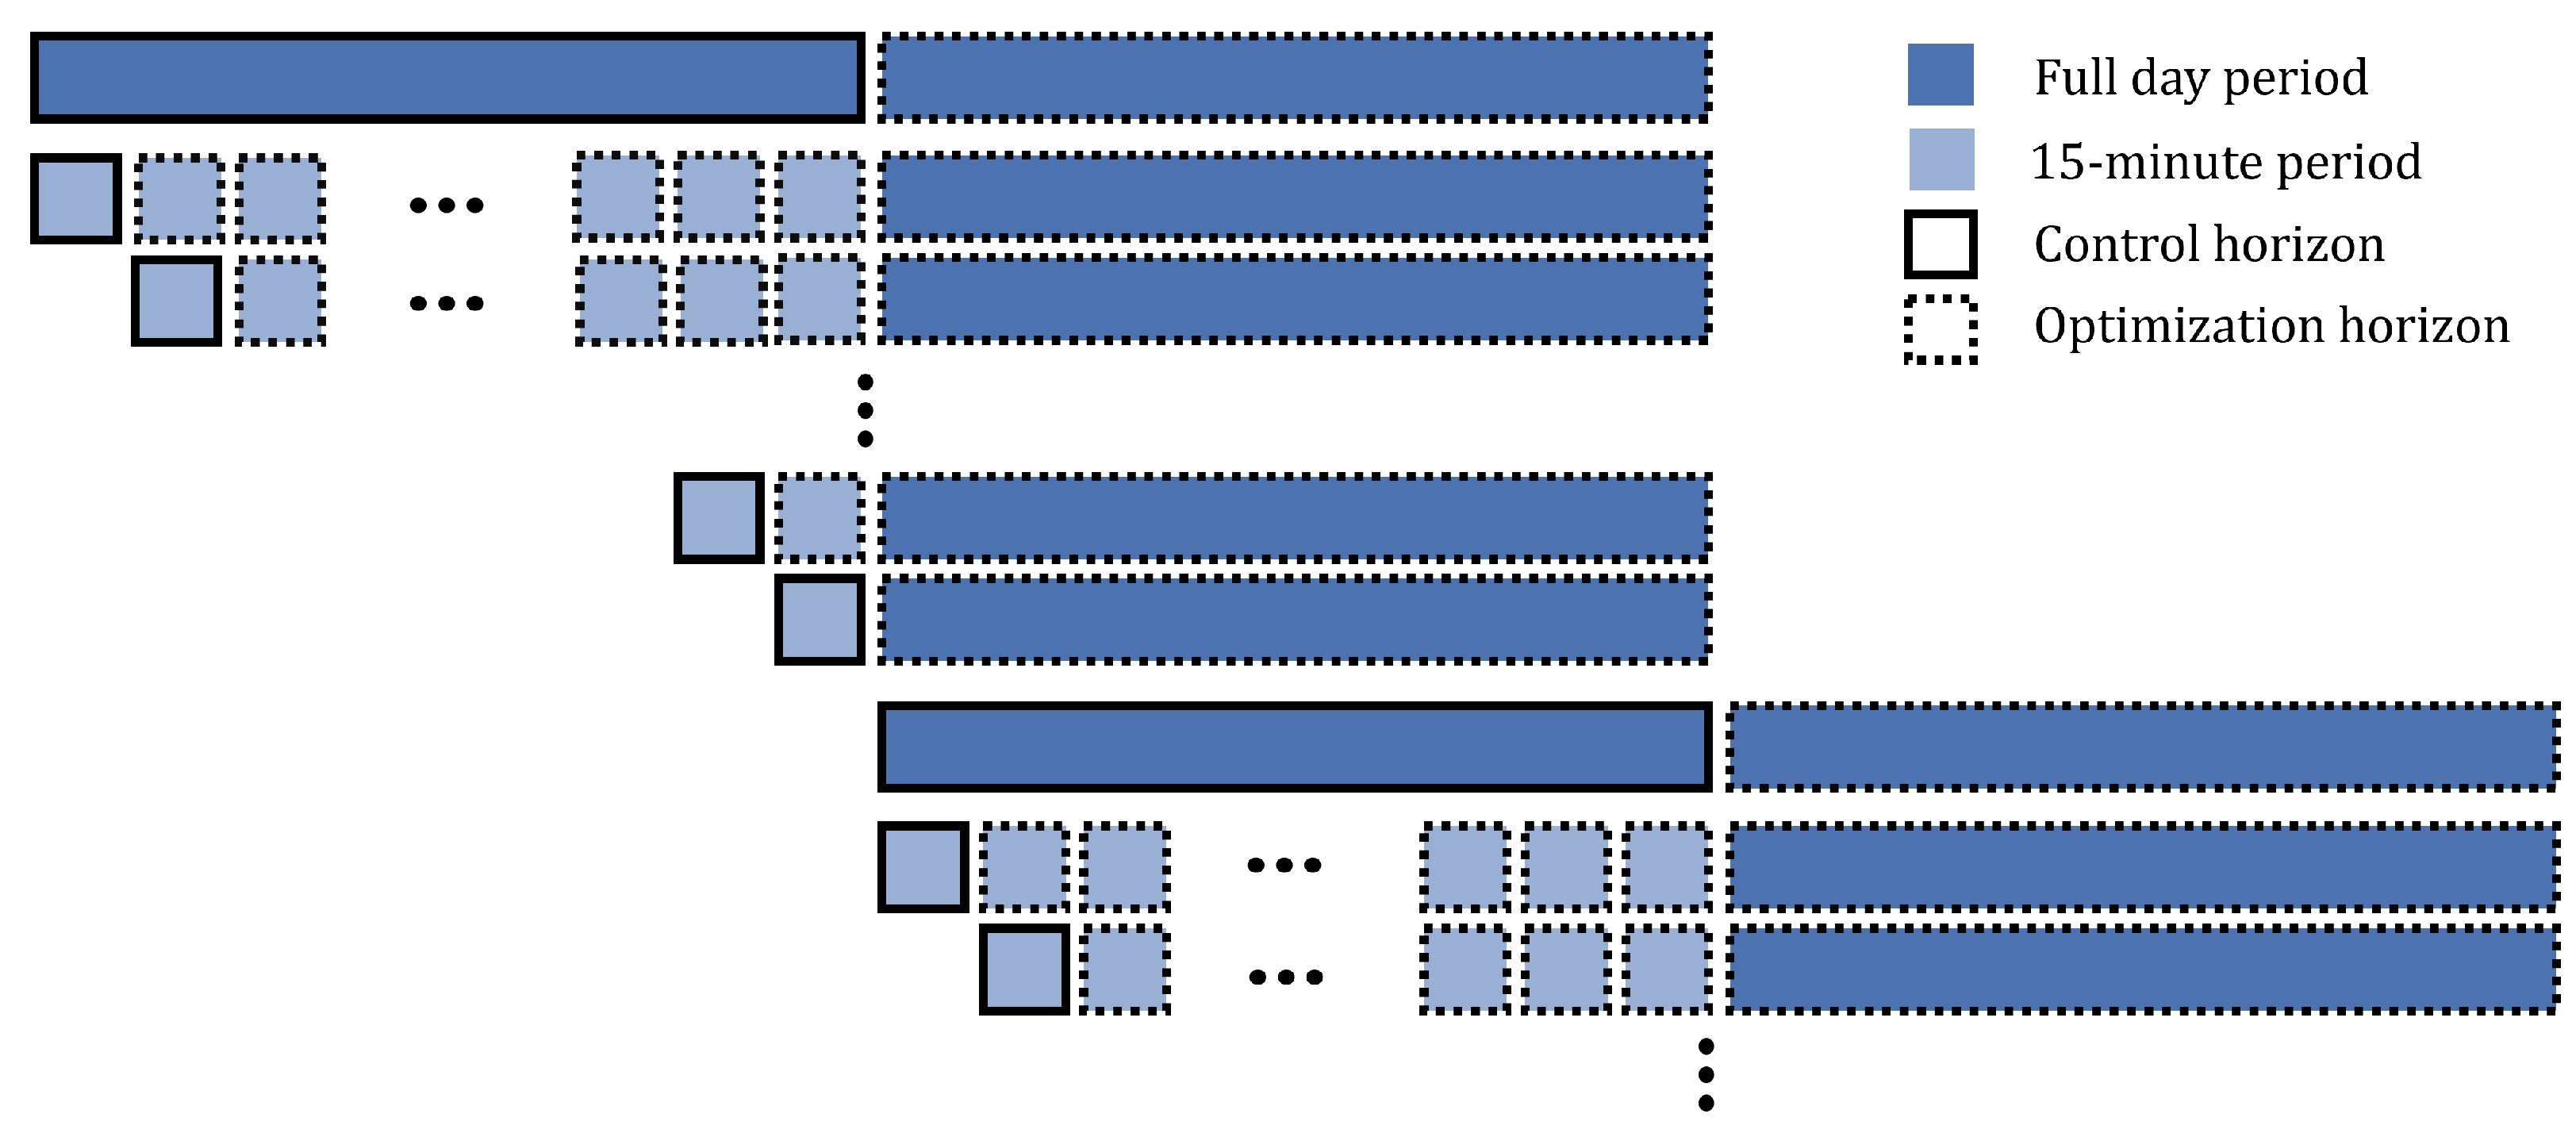
2.2. Intraday Dispatch Level
2.3. Simulation Level
2.4. Input Data for the Chase Study
3. Results
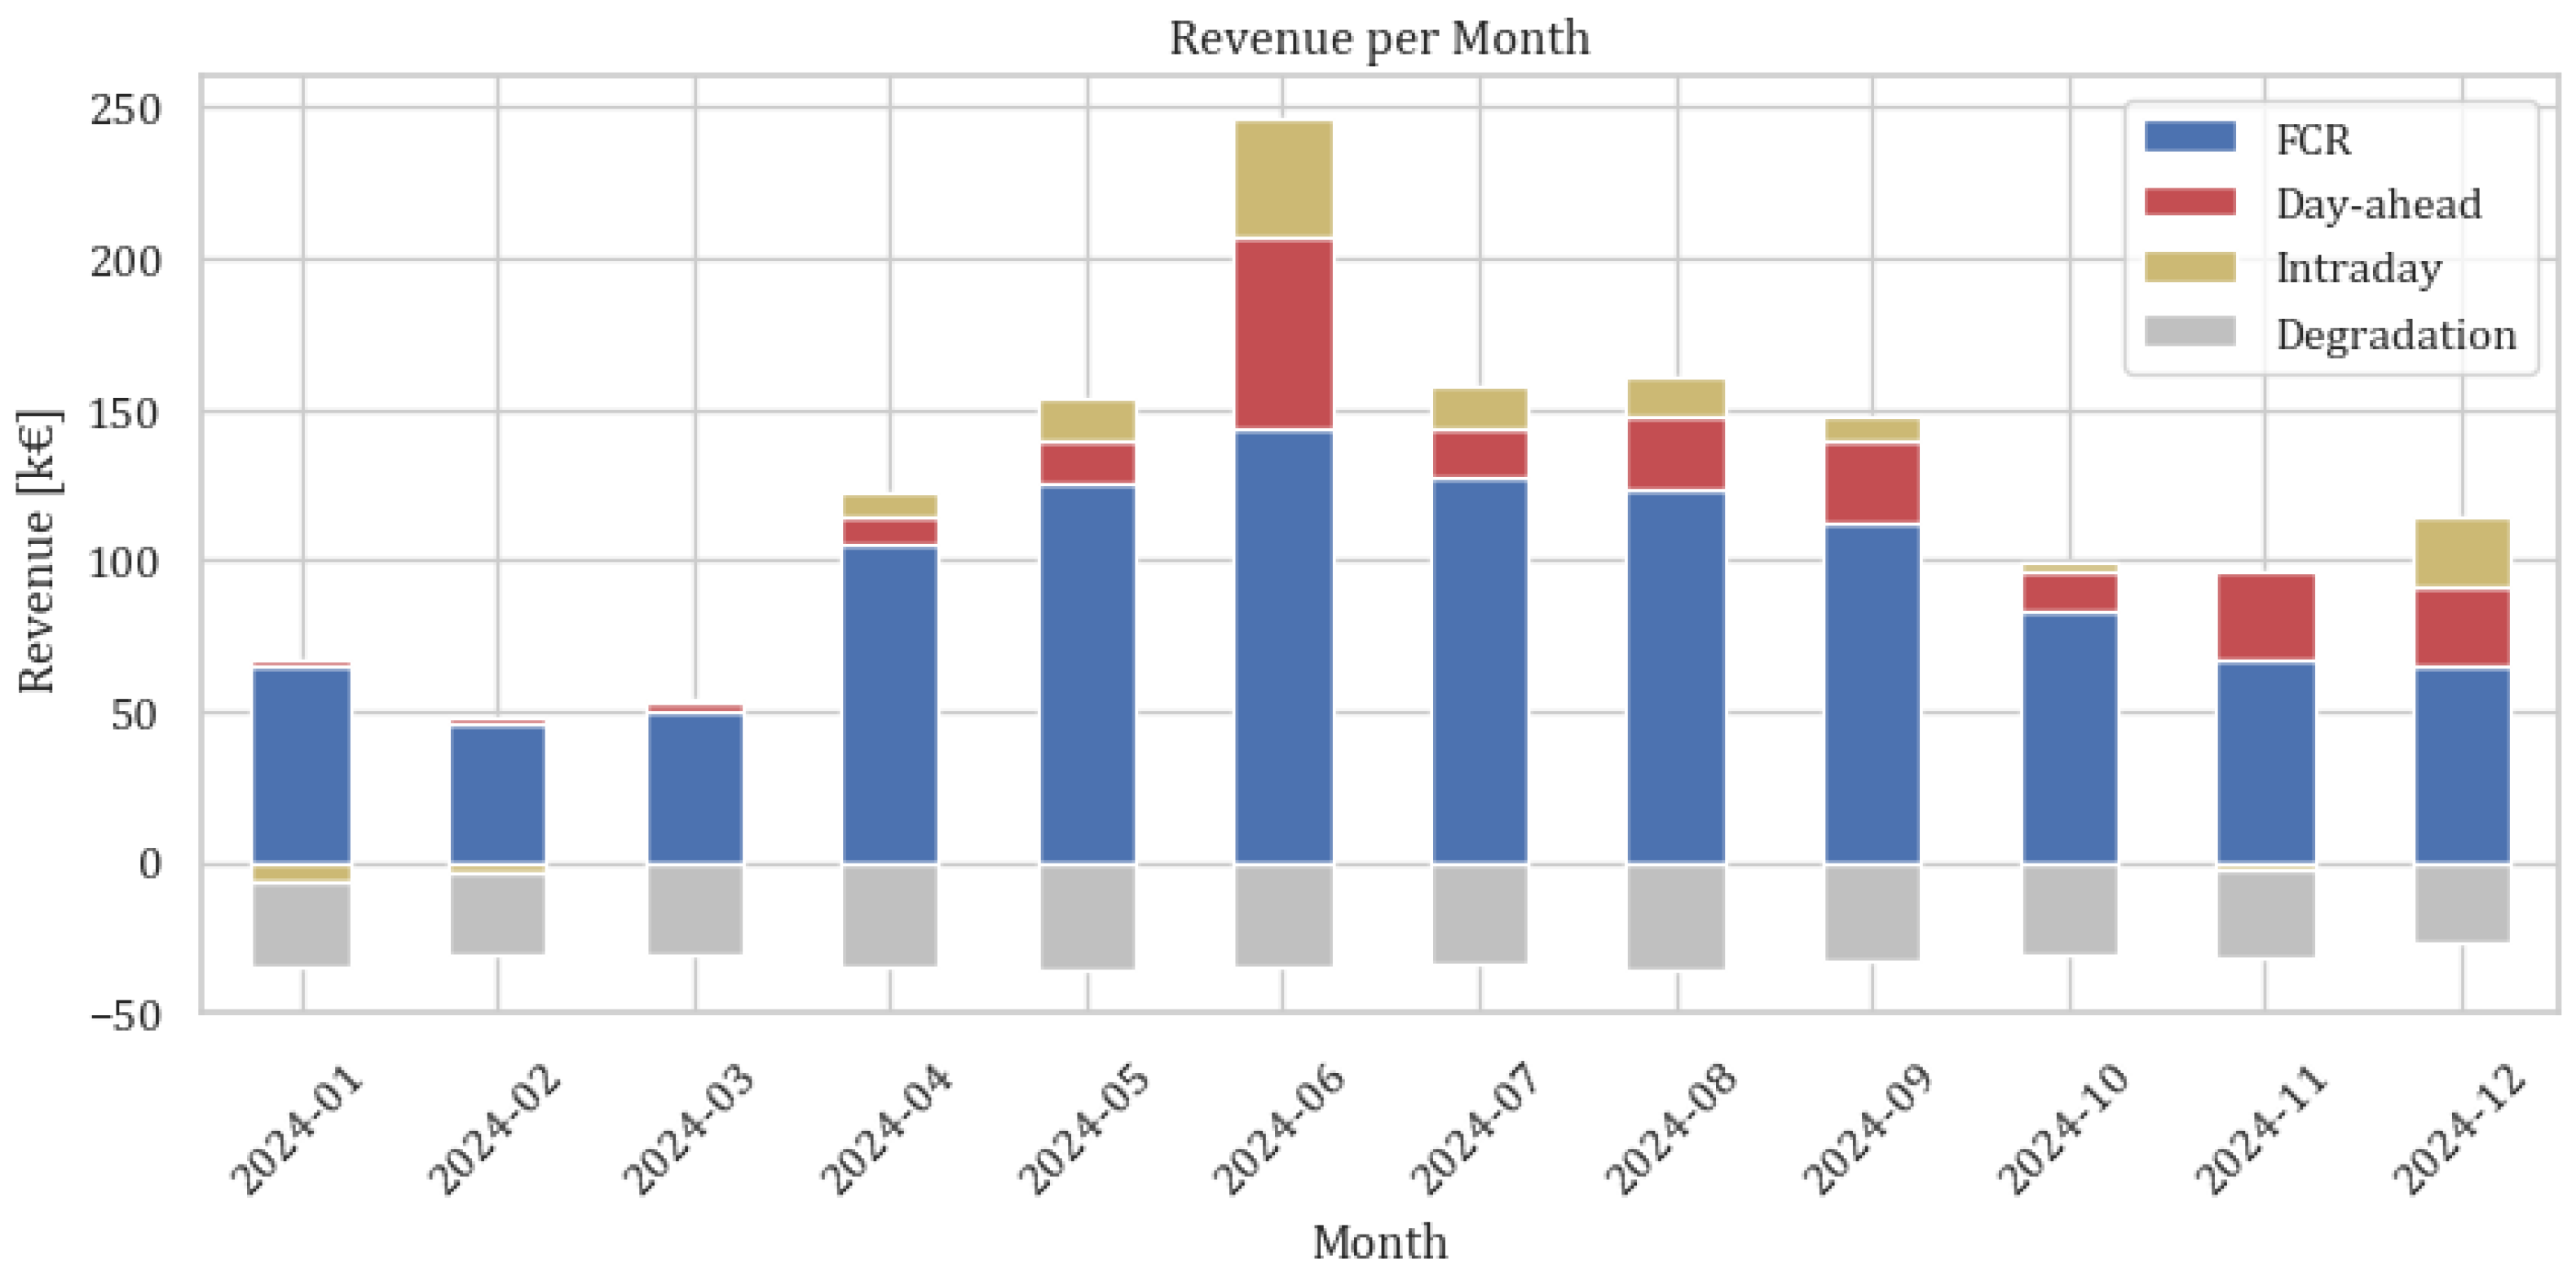
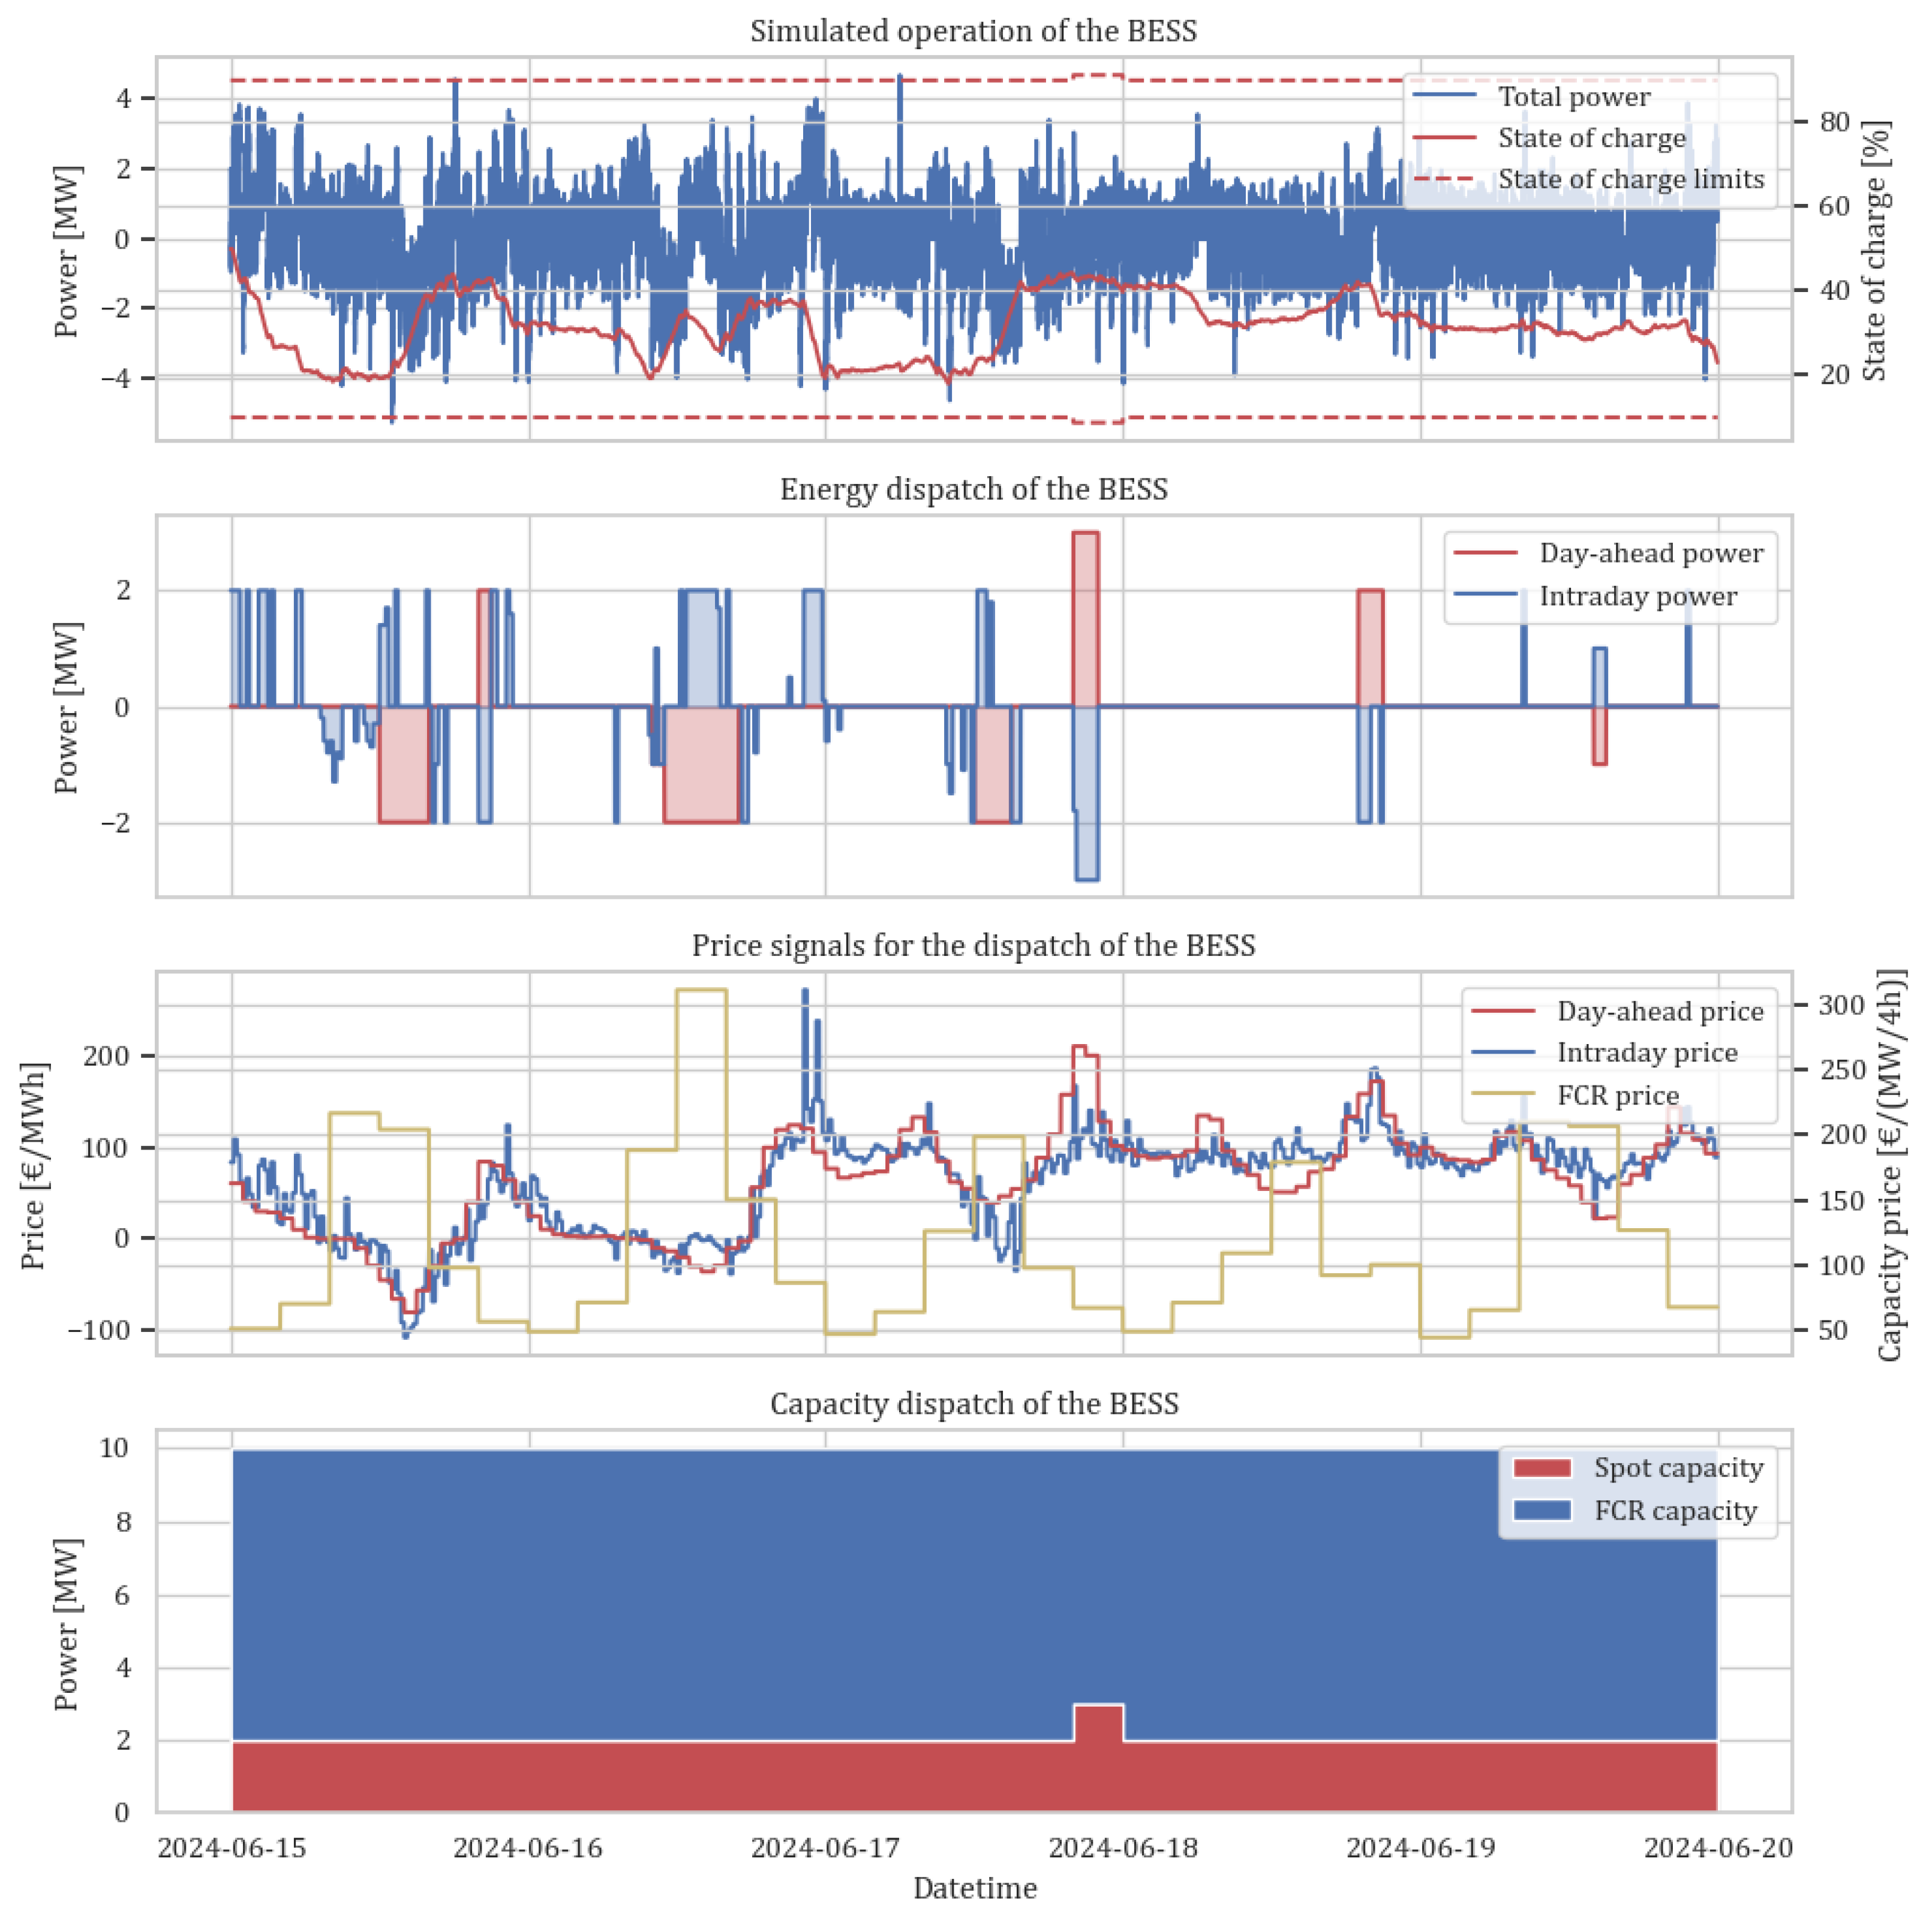
3.1. Resulting Dispatch and Operation
3.2. Degradation Costs
4. Discussion and Conclusions
Author Contributions
Funding
Data Availability Statement
Conflicts of Interest
Abbreviations
| Abbreviations | |
| aFRR | automatic Frequency Restoration Reserve |
| BESS | Battery Energy Storage System |
| BTM | Behind the Meter |
| C-rate | Charge rate |
| DA | Day-ahead |
| DoD | Depth of Discharge |
| EoL | End of Life |
| FCR | Frequency Containment Reserve |
| FEC | Full Equivalent Cycle |
| FTM | Front of the Meter |
| ID | Intraday |
| mFRR | manual Frequency Restoration Reserve |
| MILP | Mixed Integer Linear Programming |
| SoC | State of Charge |
| SoH | State of Health |
| TSO | Transmission System Operator |
| Nomenclature | |
| Change in number of FECs [-] | |
| Time step duration [h] | |
| Efficiency of the battery system [%] | |
| Day-ahead price [€/MWh] | |
| Intraday price [€/MWh] | |
| FCR capacity [MW] | |
| FCR price coefficient [€/(MW/h)] | |
| Degradation cost per FEC [€] | |
| Spot market capacity [-] | |
| Nominal energy capacity [MWh] | |
| Charging power [MW] | |
| Day-ahead power [MW] | |
| Intraday power [MW] | |
| Discharging power [MW] | |
| Activated FCR power [MW] | |
| Nominal power capacity [MW] | |
| State of Charge [%] | |
| State of Health of the battery [%] | |
| Binary charging state [-] | |
| Binary discharging state [-] | |
| Penalty term [-] | |
| Weight for penalty term [-] | |
References
- Interantional Energy Agency (IEA). Batteries and Secure Energy Transitions. Available online: https://www.iea.org/reports/batteries-and-secure-energy-transitions (accessed on 17 March 2025).
- Figgener, J.; Hecht, C.; Haberschusz, D.; Bors, J.; Spreuer, K.G.; Kairies, K.P.; Stenzel, P.; Sauer, D.U. The development of battery storage systems in Germany: A market review (status 2023). arXiv 2022, arXiv:2203.06762. [Google Scholar]
- Englberger, S.; Jossen, A.; Hesse, H. Unlocking the potential of battery storage with the dynamic stacking of multiple applications. Cell Rep. Phys. Sci. 2020, 1, 100238. [Google Scholar] [CrossRef]
- Thien, T.; Schweer, D.; vom Stein, D.; Moser, A.; Sauer, D.U. Real-world operating strategy and sensitivity analysis of frequency containment reserve provision with battery energy storage systems in the german market. J. Energy Storage 2017, 13, 143–163. [Google Scholar] [CrossRef]
- Fleer, J.; Zurmühlen, S.; Meyer, J.; Badeda, J.; Stenzel, P.; Hake, J.F.; Sauer, D.U. Price development and bidding strategies for battery energy storage systems on the primary control reserve market. Energy Procedia 2017, 135, 143–157. [Google Scholar] [CrossRef]
- Astero, P.; Evens, C. Optimum operation of battery storage system in frequency containment reserves markets. IEEE Trans. Smart Grid 2020, 11, 4906–4915. [Google Scholar] [CrossRef]
- Braeuer, F.; Rominger, J.; McKenna, R.; Fichtner, W. Battery storage systems: An economic model-based analysis of parallel revenue streams and general implications for industry. Appl. Energy 2019, 239, 1424–1440. [Google Scholar] [CrossRef]
- Casla, I.M.; Khodadadi, A.; Söder, L. Optimal day ahead planning and bidding strategy of battery storage unit participating in nordic frequency markets. IEEE Access 2022, 10, 76870–76883. [Google Scholar] [CrossRef]
- Nitsch, F.; Deissenroth-Uhrig, M.; Schimeczek, C.; Bertsch, V. Economic evaluation of battery storage systems bidding on day-ahead and automatic frequency restoration reserves markets. Appl. Energy 2021, 298, 117267. [Google Scholar] [CrossRef]
- Zhang, L.; Yu, Y.; Li, B.; Qian, X.; Zhang, S.; Wang, X.; Zhang, X.; Chen, M. Improved cycle aging cost model for battery energy storage systems considering more accurate battery life degradation. IEEE Access 2021, 10, 297–307. [Google Scholar] [CrossRef]
- Singh, A.; Pareek, P.; Sampath, L.P.M.I.; Goel, L.; Gooi, H.B.; Nguyen, H.D. A Stress-Cognizant Optimal Battery Dispatch Framework for Multimarket Participation. IEEE Trans. Ind. Inform. 2024, 20, 7259–7268. [Google Scholar] [CrossRef]
- Keske, C.; Srinivasan, A.; Sansavini, G.; Gabrielli, P. Optimal economic and environmental arbitrage of grid-scale batteries with a degradation-aware model. Energy Convers. Manag. X 2024, 22, 100554. [Google Scholar] [CrossRef]
- Hesse, H.C.; Kumtepeli, V.; Schimpe, M.; Reniers, J.; Howey, D.A.; Tripathi, A.; Wang, Y.; Jossen, A. Ageing and efficiency aware battery dispatch for arbitrage markets using mixed integer linear programming. Energies 2019, 12, 999. [Google Scholar] [CrossRef]
- Collath, N.; Tepe, B.; Englberger, S.; Jossen, A.; Hesse, H. Aging aware operation of lithium-ion battery energy storage systems: A review. J. Energy Storage 2022, 55, 105634. [Google Scholar] [CrossRef]
- He, G.; Chen, Q.; Kang, C.; Pinson, P.; Xia, Q. Optimal bidding strategy of battery storage in power markets considering performance-based regulation and battery cycle life. IEEE Trans. Smart Grid 2015, 7, 2359–2367. [Google Scholar] [CrossRef]
- Shi, Y.; Xu, B.; Tan, Y.; Kirschen, D.; Zhang, B. Optimal battery control under cycle aging mechanisms in pay for performance settings. IEEE Trans. Autom. Control 2018, 64, 2324–2339. [Google Scholar] [CrossRef]
- Shi, Y.; Xu, B.; Wang, D.; Zhang, B. Using battery storage for peak shaving and frequency regulation: Joint optimization for superlinear gains. IEEE Trans. Power Syst. 2017, 33, 2882–2894. [Google Scholar] [CrossRef]
- Kumtepeli, V.; Hesse, H.; Morstyn, T.; Nosratabadi, S.M.; Aunedi, M.; Howey, D.A. Depreciation Cost is a Poor Proxy for Revenue Lost to Aging in Grid Storage Optimization. arXiv 2024, arXiv:2403.10617. [Google Scholar]
- Li, Y.; Liu, K.; Foley, A.M.; Zülke, A.; Berecibar, M.; Nanini-Maury, E.; Van Mierlo, J.; Hoster, H.E. Data-driven health estimation and lifetime prediction of lithium-ion batteries: A review. Renew. Sustain. Energy Rev. 2019, 113, 109254. [Google Scholar] [CrossRef]
- Naumann, M.; Schimpe, M.; Keil, P.; Hesse, H.C.; Jossen, A. Analysis and modeling of calendar aging of a commercial LiFePO4/graphite cell. J. Energy Storage 2018, 17, 153–169. [Google Scholar] [CrossRef]
- Sarasketa-Zabala, E.; Gandiaga, I.; Rodriguez-Martinez, L.; Villarreal, I. Calendar ageing analysis of a LiFePO4/graphite cell with dynamic model validations: Towards realistic lifetime predictions. J. Power Sources 2014, 272, 45–57. [Google Scholar] [CrossRef]
- Naumann, M.; Spingler, F.B.; Jossen, A. Analysis and modeling of cycle aging of a commercial LiFePO4/graphite cell. J. Power Sources 2020, 451, 227666. [Google Scholar] [CrossRef]
- Sarasketa-Zabala, E.; Gandiaga, I.; Martinez-Laserna, E.; Rodriguez-Martinez, L.; Villarreal, I. Cycle ageing analysis of a LiFePO4/graphite cell with dynamic model validations: Towards realistic lifetime predictions. J. Power Sources 2015, 275, 573–587. [Google Scholar] [CrossRef]
- Wicke, M.; Bocklisch, T. Hierarchical Energy Management of Hybrid Battery Storage Systems for PV Capacity Firming and Spot Market Trading Considering Degradation Costs. IEEE Access 2024, 12, 52669–52686. [Google Scholar] [CrossRef]
- Dowling, A.W.; Kumar, R.; Zavala, V.M. A multi-scale optimization framework for electricity market participation. Appl. Energy 2017, 190, 147–164. [Google Scholar] [CrossRef]
- Mayer, K.; Trück, S. Electricity markets around the world. J. Commod. Mark. 2018, 9, 77–100. [Google Scholar] [CrossRef]
- 50Hertz Transmission GmbH; Amprion GmbH; TenneT TSO GmbH; TransnetBW GmbH. Basics of Balancing Services. Available online: https://www.regelleistung.net/en-us/Basics-of-balancing-services (accessed on 17 March 2025).
- Dunbar, A.; Tagliaferri, F.; Viola, I.M.; Harrison, G. The impact of electricity price forecast accuracy on the optimality of storage revenue. In Proceedings of the 3rd Renewable Power Generation Conference (RPG 2014), Naples, Italy, 24–25 September 2014; IET: Stevenage, UK, 2014; pp. 1–6. [Google Scholar]
- Van Rossum, G.; Drake, F.L., Jr. The Python Language Reference; Python Software Foundation: Wilmington, DE, USA, 2014. [Google Scholar]
- Bynum, M.L.; Hackebeil, G.A.; Hart, W.E.; Laird, C.D.; Nicholson, B.L.; Siirola, J.D.; Watson, J.P.; Woodruff, D.L. Pyomo-Optimization Modeling in Python; Springer: Berlin/Heidelberg, Germany, 2021; Volume 67. [Google Scholar]
- Gurobi Optimization LLC. Gurobi Optimizer Reference Manual; Gurobi Optimization LLC: Beaverton, OR, USA, 2023. [Google Scholar]
- Tadayon, L.; Meiers, J.; Ibing, L.; Erdelkamp, K.; Frey, G. Coordinated operation of pumped hydro energy storage with reversible pump turbine and co-located battery energy storage system. at-Automatisierungstechnik 2025, 73, 136–144. [Google Scholar] [CrossRef]
- 50Hertz Transmission GmbH; Amprion GmbH; TenneT TSO GmbH; TransnetBW GmbH. Präqualifikationsverfahren für Regelreserveanbieter (FCR, aFRR, mFRR) in Deutschland (“PQ-Bedingungen”). Available online: https://www.regelleistung.net/xspproxy/api/StaticFiles/Regelleistung/Infos_f%C3%BCr_Anbieter/Wie_werde_ich_Regelenergieanbieter_Pr%C3%A4qualifikation/Pr%C3%A4qualifikationsbedingungen_FCR_aFRR_mFRR/PQ-Bedingungen-2024_07_05.pdf (accessed on 17 March 2025).
- 50Hertz Transmission GmbH; Amprion GmbH; TenneT TSO GmbH; TransnetBW GmbH. Datacenter. Available online: https://www.regelleistung.net/en-us/Data (accessed on 17 March 2025).
- EPEX SPOT SE. Market Data. Available online: https://www.epexspot.com/en/market-results (accessed on 17 March 2025).
- 50Hertz Transmission GmbH; Amprion GmbH; TenneT TSO GmbH; TransnetBW GmbH. Balancing Capacity Data. Available online: https://www.netztransparenz.de (accessed on 17 March 2025).
- Schmidt, O.; Staffell, I. Monetizing Energy Storage: A Toolkit to Assess Future Cost and Value; Oxford University Press: Oxford, UK, 2023. [Google Scholar]
- ISEA RWTH Aachen and Enspired GmbH. Battery Revenue Index (Beta-Version). Available online: https://battery-charts.rwth-aachen.de/battery-revenue-index-beta-version-2/ (accessed on 17 March 2025).
- Spotnitz, R. Simulation of capacity fade in lithium-ion batteries. J. Power Sources 2003, 113, 72–80. [Google Scholar] [CrossRef]
- Park, J.; Appiah, W.A.; Byun, S.; Jin, D.; Ryou, M.H.; Lee, Y.M. Semi-empirical long-term cycle life model coupled with an electrolyte depletion function for large-format graphite/LiFePO4 lithium-ion batteries. J. Power Sources 2017, 365, 257–265. [Google Scholar] [CrossRef]


| Literature | Region | Applications | Levels | Degradation | Time Step |
|---|---|---|---|---|---|
| [3] | Germany | FCR, ID | Optimization | Cycle counting | 5 min |
| [4] | Germany | FCR, ID | Simulation | - | 1 s |
| [5] | Germany | FCR | Simulation | Calendar and cycle Ageing | 1 s |
| [6] | Nordics | FCR, DA | Optimization + Simulation | Calendar and cycle Ageing | 1 h, 1 min |
| [7] | Germany | FCR, DA, ID | Optimization | Calendar and cycle Ageing | 15 min |
| [8] | Nordics | FFR, FCR | Optimization | Cycle counting | 1 min |
| [9] | Germany | aFRR, DA | Optimization | - | 1 h |
| [11] | USA | DA, ID | Optimization | Cycle ageing | 15 min |
| [12] | Germany | DA | Optimization | Cycle ageing | 1 h |
| [13] | Germany | FCR, DA, ID | Optimization | Calendar and cycle ageing | 15 min |
| [18] | Germany | ID | Optimization | Calendar and cycle ageing | 15 min |
| [24] | Germany | ID | Optimization + Simulation | Calendar and cycle ageing | 15 min, 1 min |
| This work | Germany | FCR, DA, ID | Optimization + Simulation | Cycle counting + calendar and cycle ageing | 1 h, 15 min, 1 min |
| Parameter | Value |
|---|---|
| 10 MW | |
| 20 MWh | |
| 90% | |
| 380,000 €/MWh [2] | |
| 3500 FEC [37] | |
| 80% [14] | |
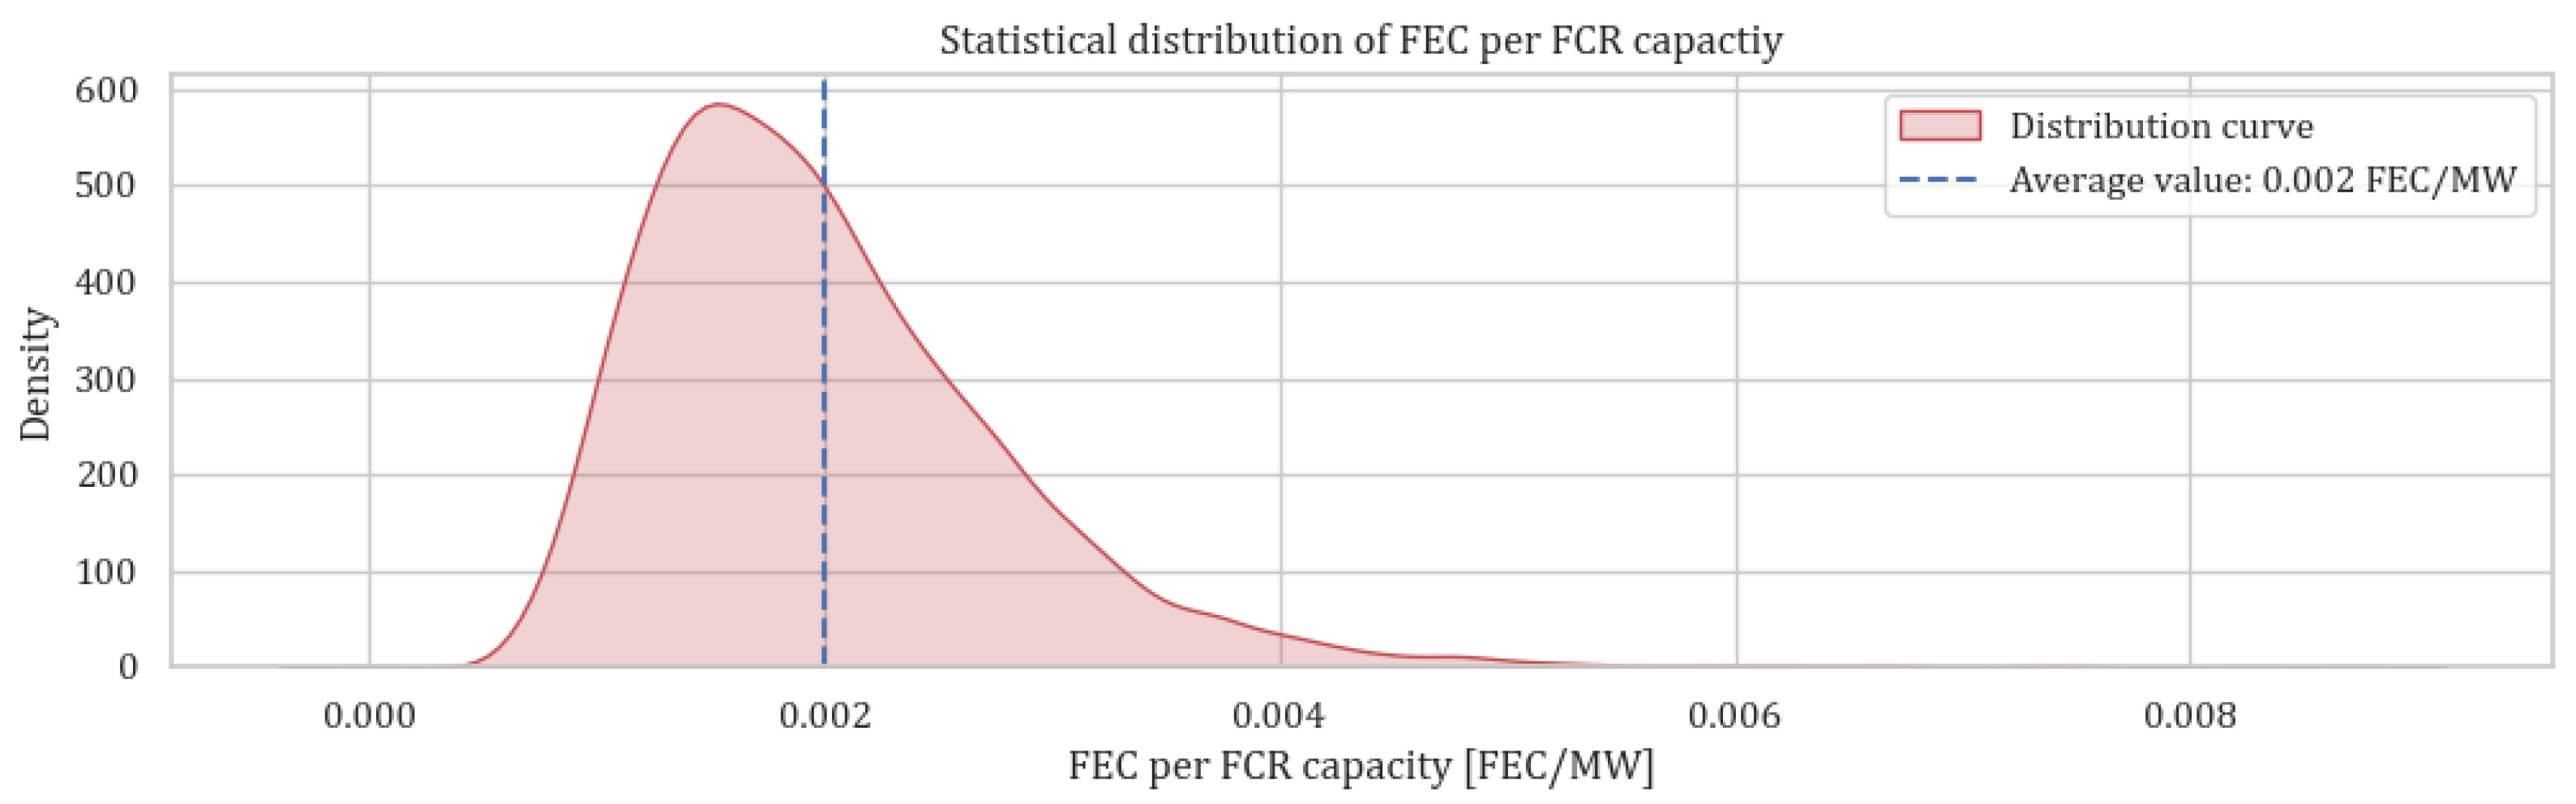
| 0.002 FEC/MW |
| Revenue Component | Revenue |
|---|---|
| FCR | 1,114,370.71 € |
| Day-ahead | 230,006.18 € |
| Intraday | 110,104.58 € |
| Degradation | −379,970.42 € |
| Total | 1,074,511.05 € |
| Degradation Model | Degradation Value | Degradation Cost |
|---|---|---|
| FEC-based | 174.98 FEC | 379,970.42 € |
| SoH-based () | 3.12% | 1,186,015.03 € |
| SoH-based () | 1.40% | 532,694.61 € |
| SoH-based () | 0.77% | 292,432.41 € |
Disclaimer/Publisher’s Note: The statements, opinions and data contained in all publications are solely those of the individual author(s) and contributor(s) and not of MDPI and/or the editor(s). MDPI and/or the editor(s) disclaim responsibility for any injury to people or property resulting from any ideas, methods, instructions or products referred to in the content. |
© 2025 by the authors. Licensee MDPI, Basel, Switzerland. This article is an open access article distributed under the terms and conditions of the Creative Commons Attribution (CC BY) license (https://creativecommons.org/licenses/by/4.0/).
Share and Cite
Tadayon, L.; Frey, G. Multi-Level Simulation Framework for Degradation-Aware Operation of a Large-Scale Battery Energy Storage Systems. Energies 2025, 18, 2708. https://doi.org/10.3390/en18112708
Tadayon L, Frey G. Multi-Level Simulation Framework for Degradation-Aware Operation of a Large-Scale Battery Energy Storage Systems. Energies. 2025; 18(11):2708. https://doi.org/10.3390/en18112708
Chicago/Turabian StyleTadayon, Leon, and Georg Frey. 2025. "Multi-Level Simulation Framework for Degradation-Aware Operation of a Large-Scale Battery Energy Storage Systems" Energies 18, no. 11: 2708. https://doi.org/10.3390/en18112708
APA StyleTadayon, L., & Frey, G. (2025). Multi-Level Simulation Framework for Degradation-Aware Operation of a Large-Scale Battery Energy Storage Systems. Energies, 18(11), 2708. https://doi.org/10.3390/en18112708