
Measurements and Analysis of Electromagnetic Compatibility of Railway Rolling Stock with Train Detection Systems Using Track Circuits


Abstract
1. Introduction
2. Materials and Methods
- 1
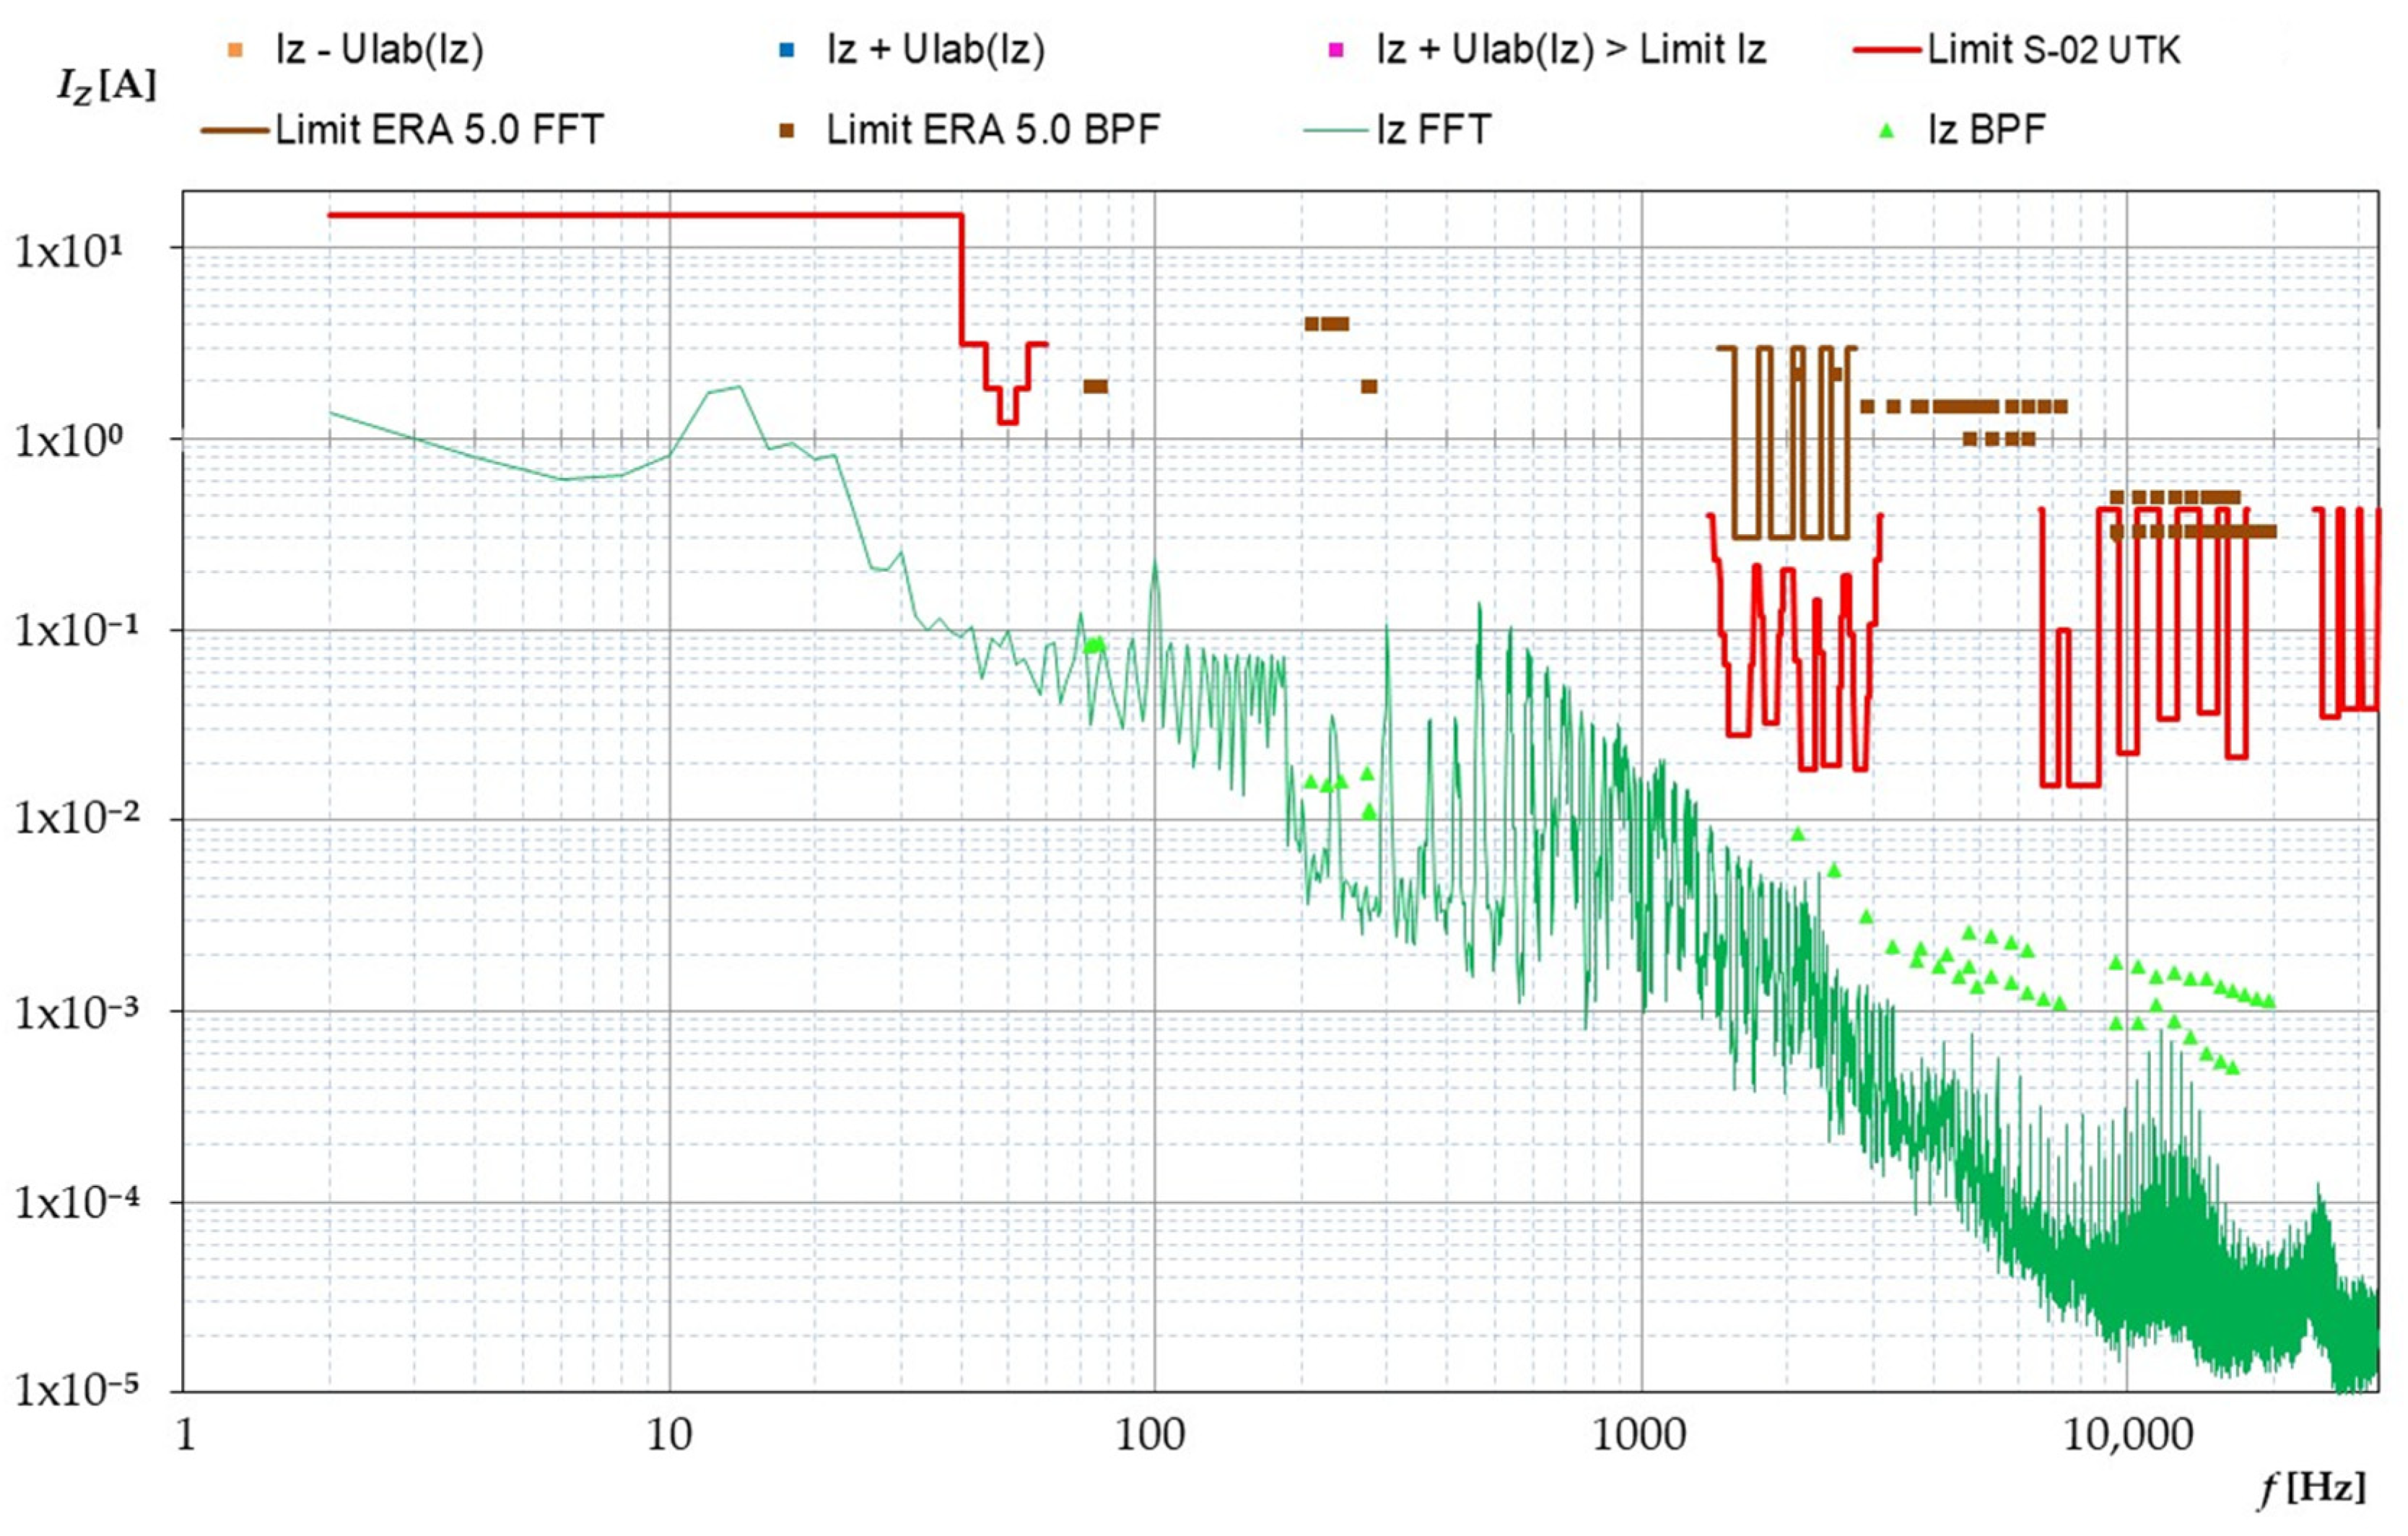
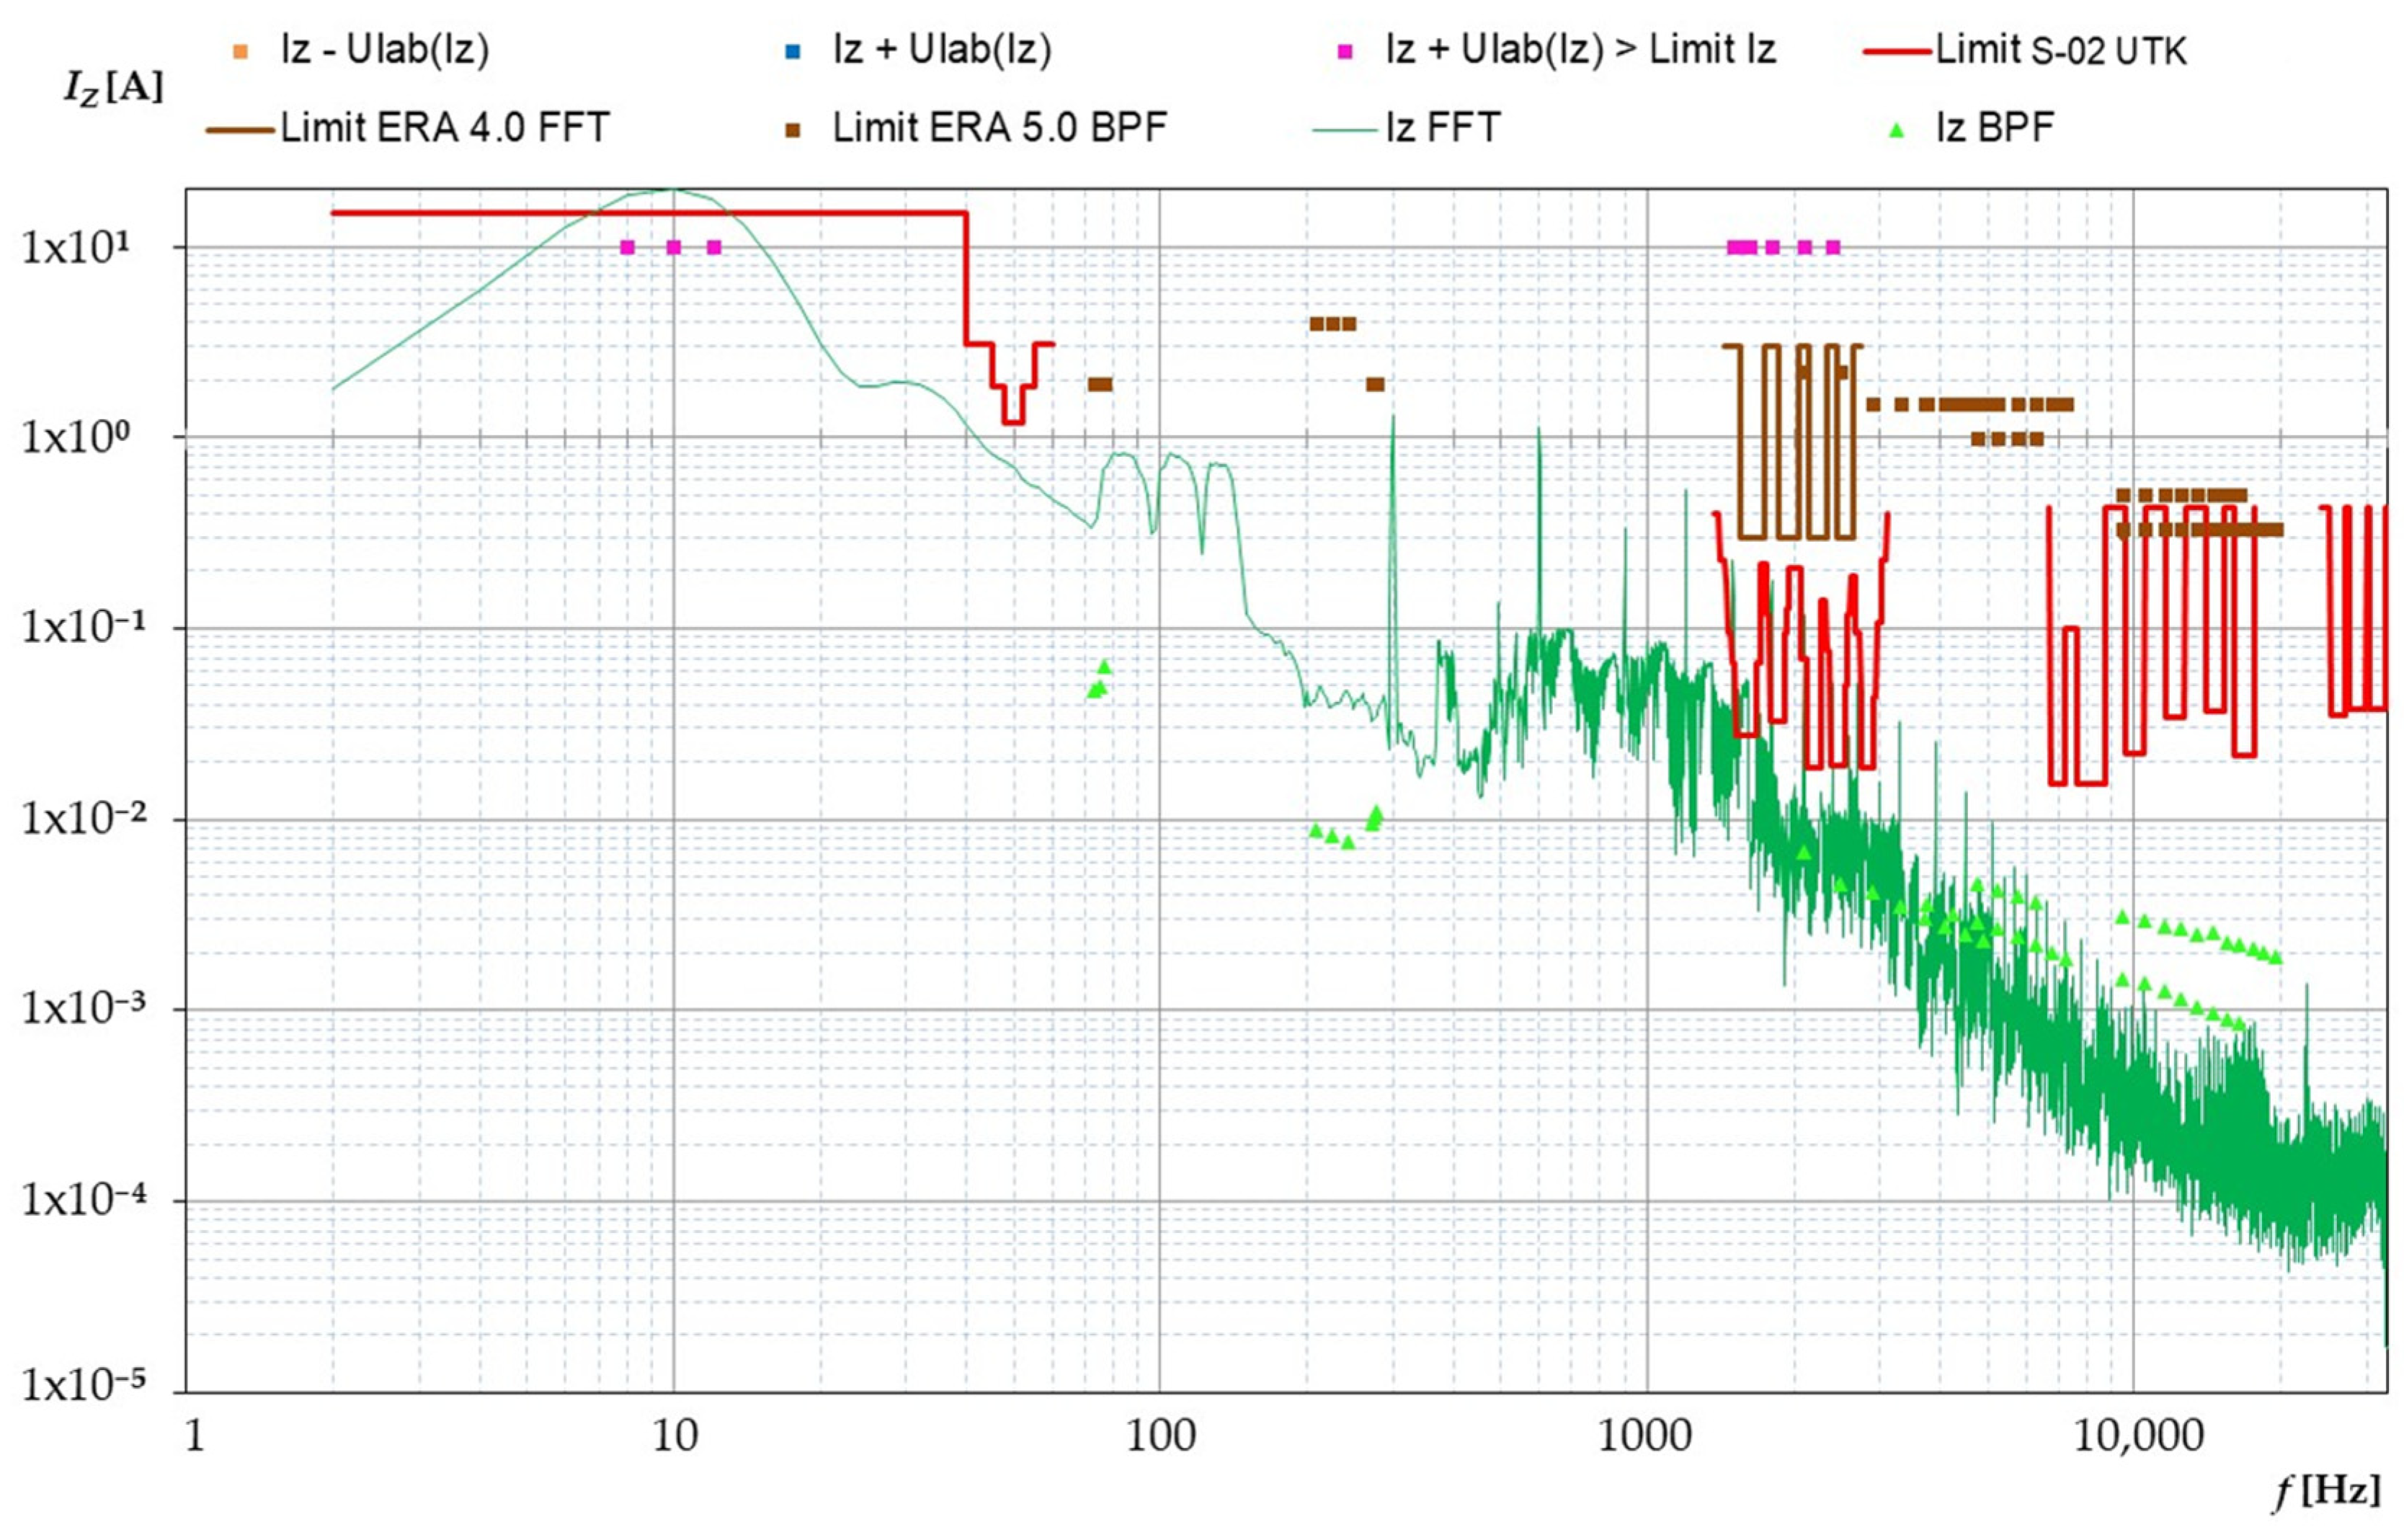
- Algorithm using the fast Fourier transform (FFT);
- 2
3. Results and Discussion
- (a)
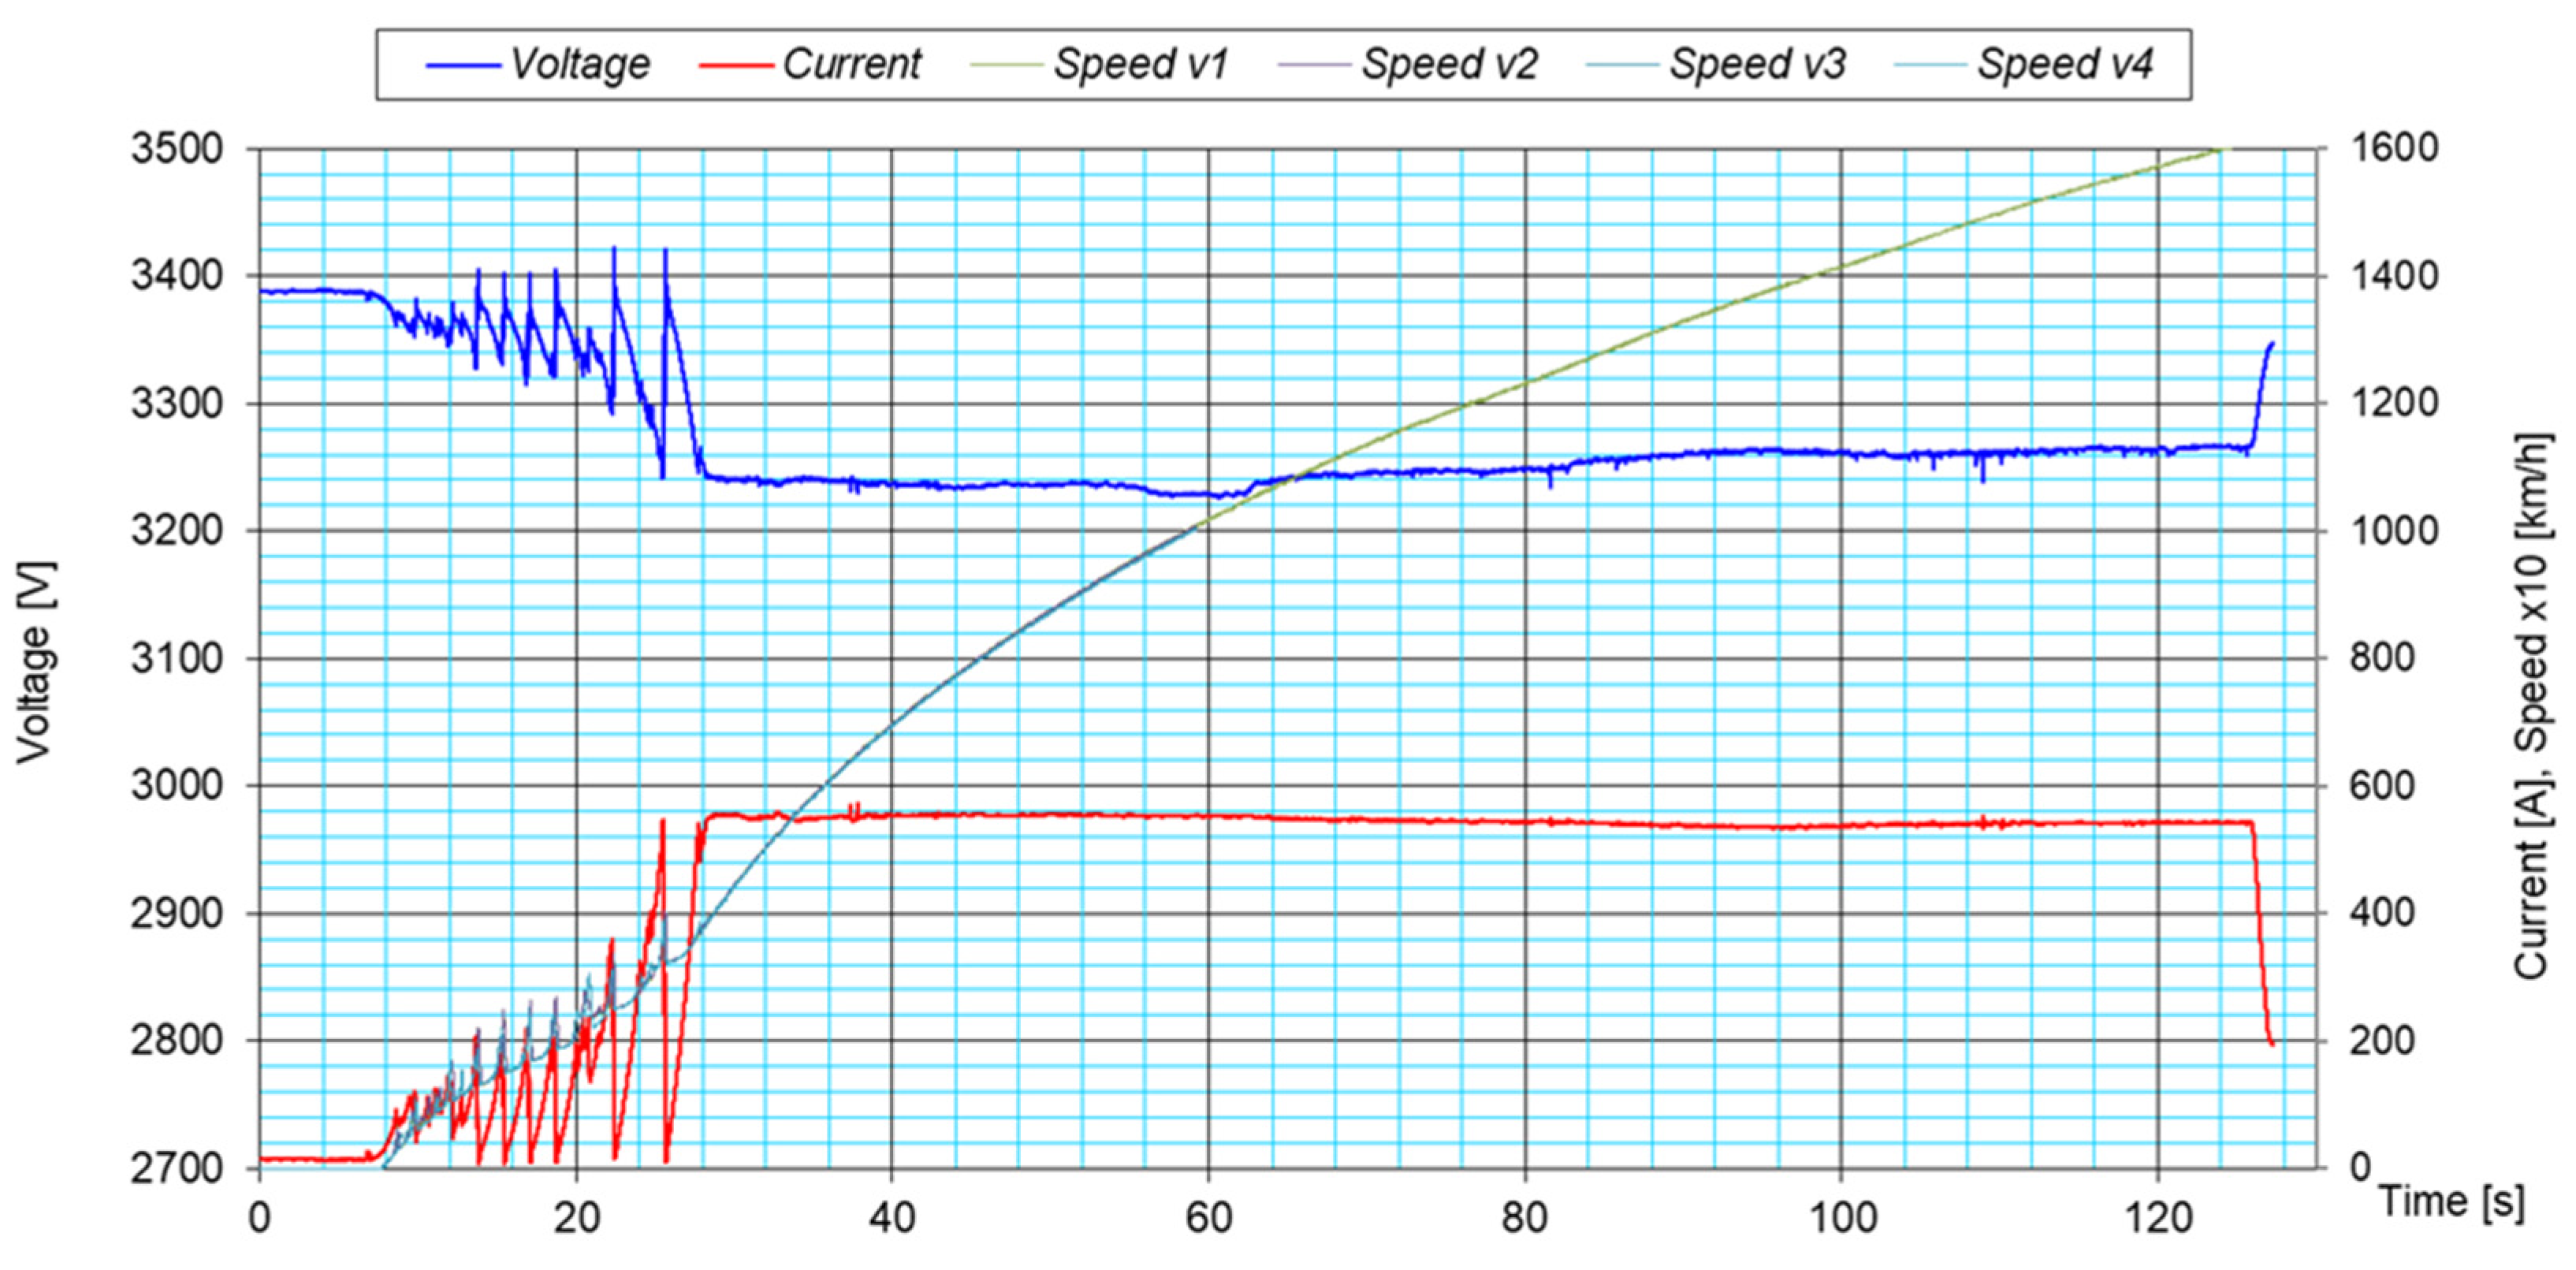
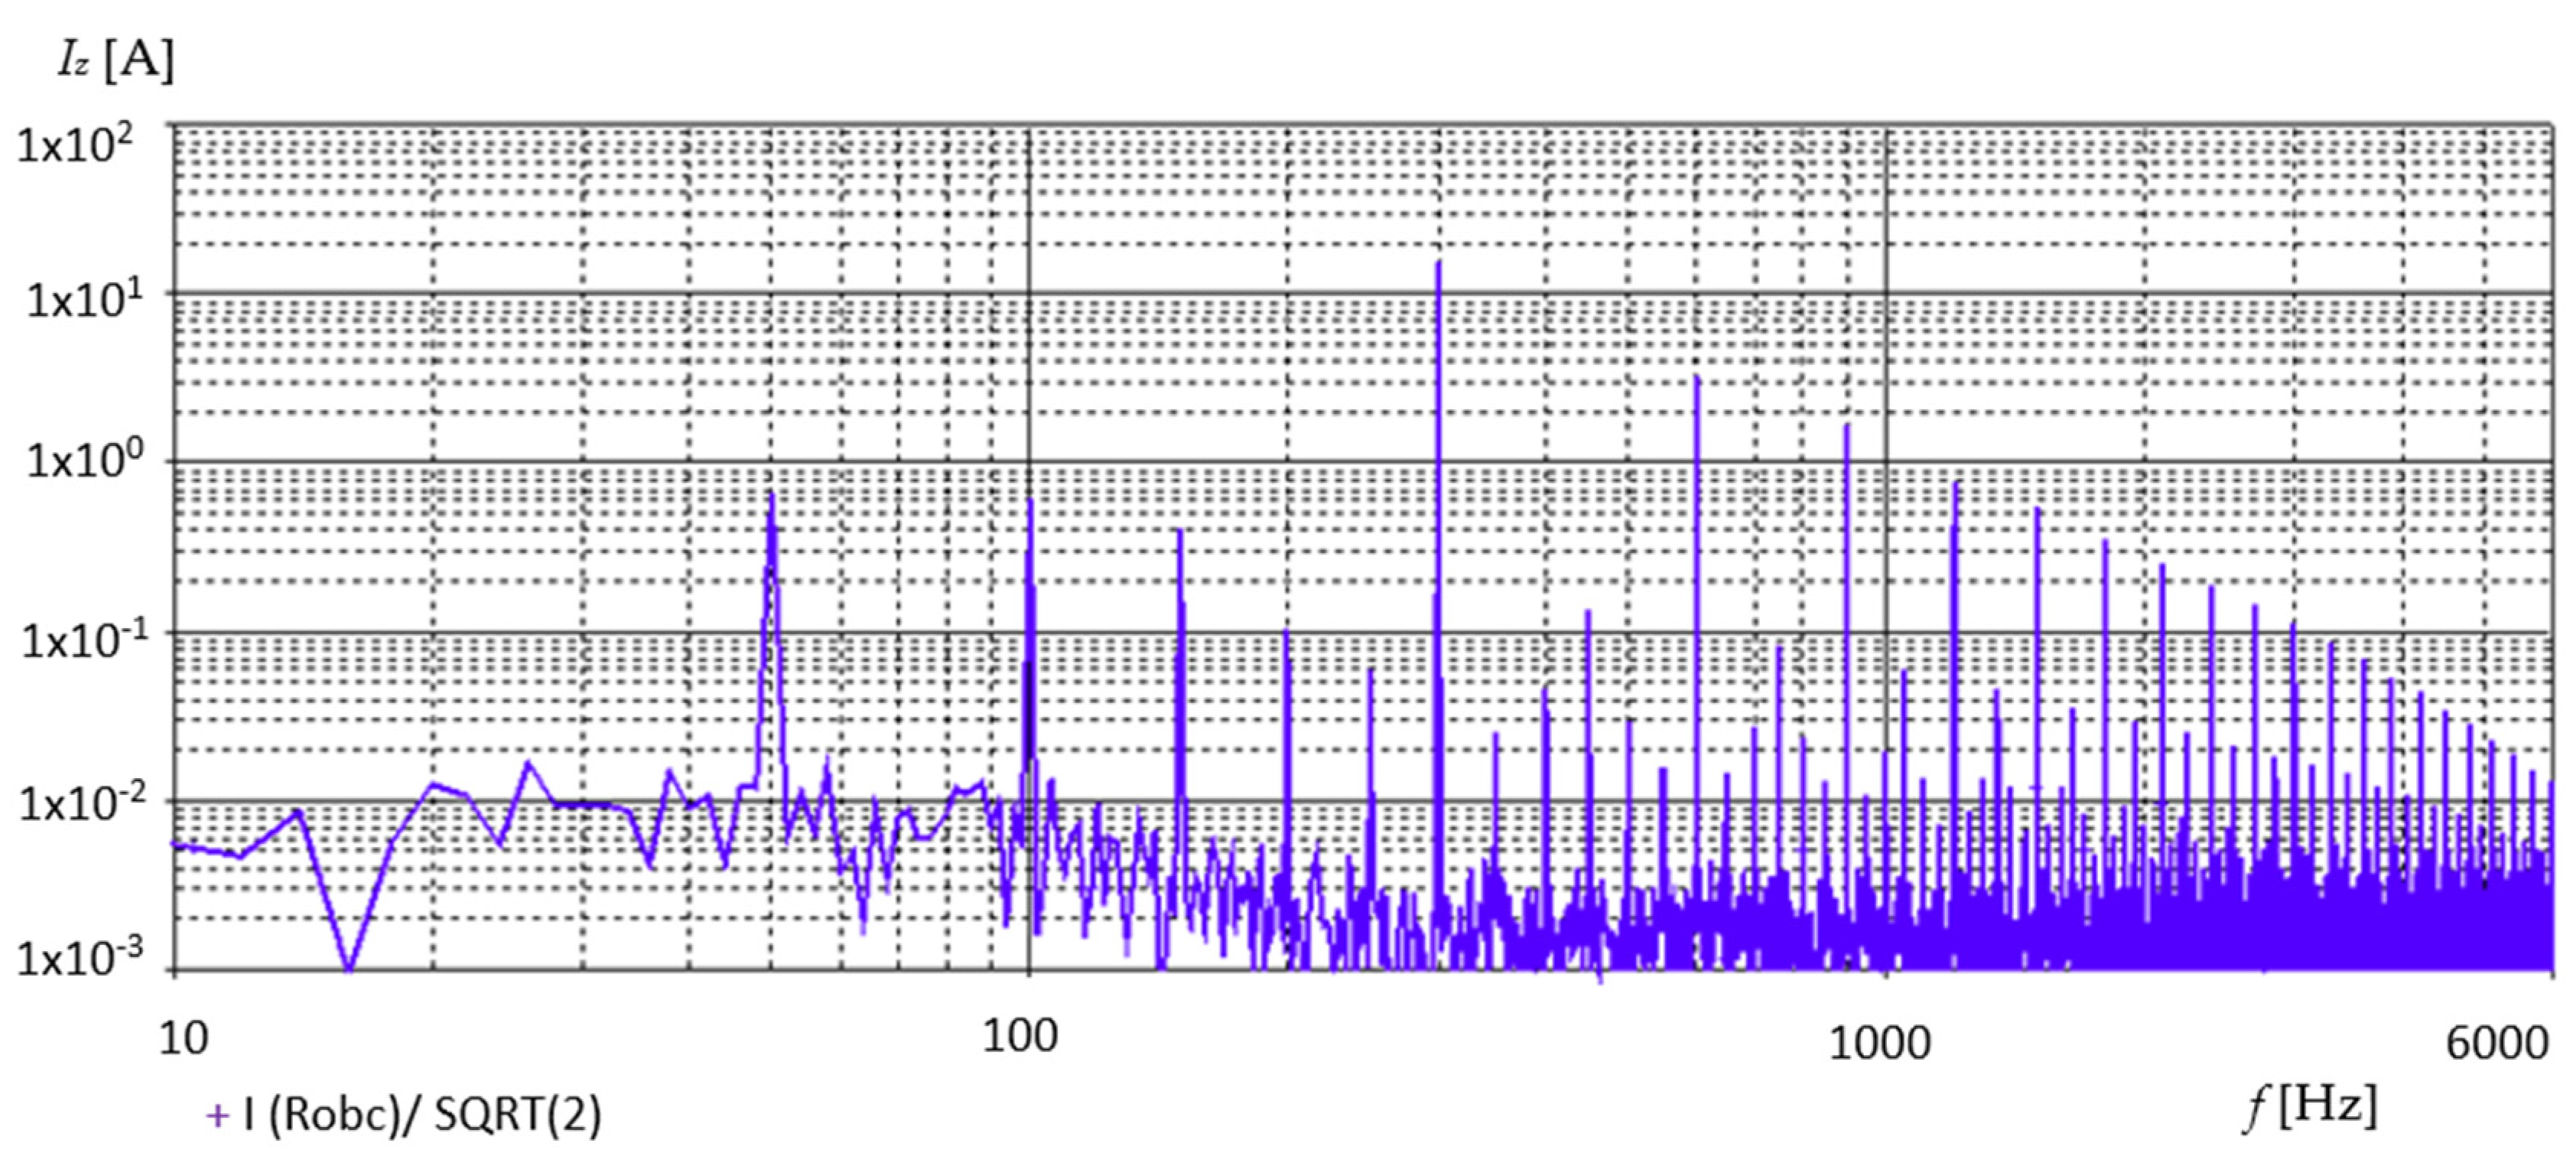
- Measurement of the alternating component of the traction current Iz—Rogowski coil;
- (b)
- Measurement of traction current It—current–voltage transducer;
- (c)
- Measurement of the traction network voltage Ut—voltage transducer;
- (d)
- Measurement of vehicle speed and deceleration v, a—VBOX device;
- (e)
- Speed measurement v1–v4—axial sensor with 1–4 axes.
4. Conclusions
Author Contributions
Funding
Data Availability Statement
Conflicts of Interest
References
- Cabrane, Z.; Lee, S.H. Control and Management of Railway System Connected to Microgrid Stations. IEEE Access 2022, 10, 40445–40455. [Google Scholar] [CrossRef]
- Ye, J.; Sun, M.; Song, K. An Energy Management Strategy for an Electrified Railway Smart Microgrid System Based on Integrated Empirical Mode Decomposition. Energies 2024, 17, 268. [Google Scholar] [CrossRef]
- Menicanti, S.; di Benedetto, M.; Marinelli, D.; Crescimbini, F. Recovery of Trains’ Braking Energy in a Railway Micro-Grid Devoted to Train plus Electric Vehicle Integrated Mobility. Energies 2022, 15, 1261. [Google Scholar] [CrossRef]
- Jafari Kaleybar, H.; Hafezi, H.; Brenna, M.; Faranda, R.S. Smart AC-DC Coupled Hybrid Railway Microgrids Integrated with Renewable Energy Sources: Current and Next Generation Architectures. Energies 2024, 17, 1179. [Google Scholar] [CrossRef]
- Midya, S.; Thottappillil, R. An Overview of Electromagnetic Compatibility Challenges in European Rail Traffic Management System. Transp. Res. Part C Emerg. Technol. 2008, 16, 515–534. [Google Scholar] [CrossRef]
- Drózd, P.; Rosiński, A. Increasing the Readiness of Railway Traffic Control Devices Using a Functional Test Generation Method. Appl. Sci. 2023, 13, 7717. [Google Scholar] [CrossRef]
- Wróbel, Z. The Electromagnetic Compatibility in Researches of Railway Traffic Control Devices. In Analysis and Simulation of Electrical and Computer Systems; Mazur, D., Gołębiowski, M., Korkosz, M., Eds.; Springer International Publishing: Cham, Switzerland, 2018; pp. 275–287. ISBN 978-3-319-63949-9. [Google Scholar]
- Paś, J.; Rosiński, A.; Wetoszka, P.; Białek, K.; Klimczak, T.; Siergiejczyk, M. Assessment of the Impact of Emitted Radiated Interference Generated by a Selected Rail Traction Unit on the Operating Process of Trackside Video Monitoring Systems. Electronics 2022, 11, 2554. [Google Scholar] [CrossRef]
- Serdiuk, T.; Serdiuk, K.; Profatylov, V.; Adhena, H.H.; Thomas, D.; Greedy, S. Analysis of Electrified Systems and Electromagnetic Interference on the Railways. IEEE Lett. Electromagn. Compat. Pract. Appl. 2023, 5, 67–71. [Google Scholar] [CrossRef]
- Hatsukade, S.; Wada, K. Pre-Accreditation With a Unified Coil for Radiated Interference Between Unspecified Balises and Railway Traction Inverters. IEEE Access 2024, 12, 71145–71156. [Google Scholar] [CrossRef]
- Mariscotti, A. Critical Review of EMC Standards for the Measurement of Radiated Electromagnetic Emissions from Transit Line and Rolling Stock. Energies 2021, 14, 759. [Google Scholar] [CrossRef]
- Wang, C.; Liang, X.; Adajar, E. Evaluation and Mitigation of Electromagnetic Interference Between Railways and Nearby Power Lines: A Review. IEEE Access 2021, 9, 149609–149618. [Google Scholar] [CrossRef]
- Serdiuk, T.; Feliziani, M.; Serdiuk, K. About Electromagnetic Compatibility of Track Circuits with the Traction Supply System of Railway. In Proceedings of the 2018 International Symposium on Electromagnetic Compatibility (EMC EUROPE), Amsterdam, The Netherlands, 27–30 August 2018; pp. 242–247. [Google Scholar]
- Li, Z.; Liu, S. Interference Mechanism Analysis and Mitigation Measures with Railway Signalling Equipment from Harmonics in the Traction System. Transp. Saf. Environ. 2020, 2, 271–282. [Google Scholar] [CrossRef]
- Markowska, R.; Wróbel, Z. Selected Issues of Safe Operation of the Railway Traffic Control System in the Event of Exposition to Damage Caused by Lightning Discharges. Energies 2021, 14, 5808. [Google Scholar] [CrossRef]
- Jakubowski, K.; Paś, J.; Rosiński, A. The Issue of Operating Security Systems in Terms of the Impact of Electromagnetic Interference Generated Unintentionally. Energies 2021, 14, 8591. [Google Scholar] [CrossRef]
- Białoń, A.; Furman, J.; Kazimierczak, A.; Zawadka, Ł. Dopuszczalne parametry zakłóceń dla obwodów torowych stosowanych na PKP. Logistyka 2011, 6, 177–186. [Google Scholar]
- Feng, J.; Cao, J.G.; Wu, Z.H. Analysis and Research on Electromagnetic Compatibility of High Speed Railway Traction Current Harmonics to Track Circuit. IEEE Trans. Appl. Supercond. 2021, 31, 1–4. [Google Scholar] [CrossRef]
- Zhu, J.; Hu, H.; He, Z.; Guo, X.; Pan, W. A Power-Quality Monitoring and Assessment System for High-Speed Railways Based on Train-Network-Data Center Integration. Rail. Eng. Sci. 2021, 29, 30–41. [Google Scholar] [CrossRef]
- Chatterjee, D.; Szeląg, A.; Steczek, M. Analysis of Disturbing Effect of 3 kV DC Supplied Traction Vehicles Equipped with Two-Level and Three-Level VSI on Railway Signalling Track Circuits. Bull. Pol. Acad. Sci. Tech. Sci. 2017, 65, 663–674. [Google Scholar]
- Zhang, J.; Yang, S.; Song, K.; Wang, Y.; Konstantinou, G.; Wu, M. Railway Signaling System Interference by Unbalanced Traction Harmonic Current: Mechanism, Modeling, and Solutions Based on Engineering Practice. IEEE Trans. Transp. Electrif. 2024, 10, 1850–1862. [Google Scholar] [CrossRef]
- Mariscotti, A. Behavior of Single-Point Harmonic Producer Indicators in Electrified AC Railways. Metrol. Meas. Syst. 2020, 27, 641–657. [Google Scholar] [CrossRef]
- CLC/TS 50238-2:2020; Railway Applications—Compatibility Between Rolling Stock and Train Detection Systems—Part 2: Compatibility with Track Circuits. European Committee for Electrotechnical Standardization: Brussels, Belgium, 2020.
- ERA/ERTMS/033281; Interfaces Between Control-Command and Signaling Trackside and Other Subsystems. Version 5.0. European Rail Traffic Management System (ERTMS): Valenciennes, France, 2023.
- ERA/ERTMS/033281; Interfaces Between Control-Command and Signaling Trackside and Other Subsystems. Version 4.0. European Rail Traffic Management System (ERTMS): Valenciennes, France, 2018.
- List of the President of the Office of Rail Transport on the Relevant National Technical Rules and Standardization Documents, the Use of Which Allows to Meet the Essential Requirements Regarding the Interoperability of the Rail System, Warszawa, 14 February 2024. Available online: https://bip.utk.gov.pl/bip/interoperacyjnos/lista-prezesa-utk/1036,Lista-Prezesa-UTK-podsystem-tabor-z-14-lutego-2024-r.html (accessed on 19 May 2025).
- PN-EN 50121-3-1:2017-05; Railway Applications. Electromagnetic Compatibility—Part 3-1: Rolling Stock. Train and Complete Vehicle. Polish Committee for Standardization: Warsaw, Poland, 2017.
- PN-EN 50388-1:2023-05; Railway Applications—Fixed Installations and Rolling Stock—Technical Criteria for the Coordination between Electric Traction Power Supply Systems and Rolling Stock to Achieve Interoperability—Part 1: General. Polish Committee for Standardization: Warsaw, Poland, 2023.
- Commission Regulation (EU) No 1302/2014 of 18 November 2014 Concerning a Technical Specification for Interoperability Relating to the ‘Rolling Stock—Locomotives and Passenger Rolling Stock’ Subsystem of the Rail System in the European. Version M5 Dated 08.09.2023. Available online: https://eur-lex.europa.eu/eli/reg/2014/1302/oj/eng (accessed on 19 May 2025).
- PN-EN 15595:2019-03; Railway Applications. Braking. Wheel Slide Protection. Polish Committee for Standardization: Warsaw, Poland, 2019.
- ILAC-G8:09/2019; Guidelines on Decision Rules and Statements of Conformity. ILAC: Silverwater, NSW, Australia, 2019.
- Sikora, A.; Kulesz, B. Influence of Diode Commutation Processes on Rectifier Transformers Operation. In Proceedings of the XIX International Conference on Electrical Machines—ICEM 2010, Rome, Italy, 6–8 September 2010; pp. 1–5. [Google Scholar]
- ITU-T Recommendation G.223; International Analogue Carrier Systems. General Characteristics Common to All Analogue Carrier-Transmission Systems. Assumptions for the Calculation of Noise on Hypothetical Reference Circuits for Telephony. ITU-T: Geneva, Switzerland, 1998.


| No. | Standardization Document | Standardized Testing Procedures |
|---|---|---|
| 1 | CLC/TS 50238-2:2020 | Methodology for measuring the interference current |
| 2 | PN-EN 50121-3-1:2017-05 | Psophometric current requirements and measurements |
| 3 | PN-EN 50388-1:2023-05 | Transient current requirements and measurement |
| 4 | ERA/ERTMS/033281 | Requirements for interference currents |
| 5 | List of the President of the Office of Rail Transport | Specific Polish requirements for interference currents |
| 6 | PN-EN 15595:2019-03 | Method of determining the initial adhesion coefficient |
| 7 | ILAC-G8:09/2019 | Method of determining the compliance of the result with the requirements |
| 8 | Commission Regulation (EU) No 1302/2014 | Introduces the requirement to measure interference currents |
| No. | Type of Test | Speed [km/h] | |
|---|---|---|---|
| 1 | Background | - | |
| 2 | Starting the vehicle | - | |
| 3 | Turning off the vehicle | - | |
| 4 | Standby (near the substation) | - | |
| 5 | Standby (far from substation) | - | |
| 6 | Changing the speed manually | 60 ⇒ Vmax Vmax ⇒ 60 | |
| 7 | |||
| 8 | Cruise control speed change | 60 ⇒ Vmax Vmax ⇒ 60 | |
| 9 | |||
| 10 | 100% traction power—measurement close to the substation | Start | 0 ⇒ Vmax |
| 11 | Braking | Vmax ⇒ 0 | |
| 12 | 100% traction power—measurement far from the substation | Start | 0 ⇒ Vmax |
| 13 | Braking | Vmax ⇒ 0 | |
| 14 | 50% of traction power—measurement close to the substation | Start | 0 ⇒ Vmax |
| 15 | Braking | Vmax ⇒ 0 | |
| 16 | 50% of traction power—measurement far from the substation | Start | 0 ⇒ Vmax |
| 17 | Braking | Vmax ⇒ 0 | |
| 18 | Inverter turned off—measurement close to the substation (failure simulation) | Start | 0 ⇒ Vmax |
| 19 | Braking | Vmax ⇒ 0 | |
| 20 | Inverter turned off—measurement far from the substation (failure simulation) | Start | 0 ⇒ Vmax |
| 21 | Braking | Vmax ⇒ 0 | |
| 22 | 100% traction power—limited traction (measurement close to the substation) | Start | 0 ⇒ Vmax |
| 23 | Braking | Vmax ⇒ 0 | |
| 24 | 100% traction power—limited traction (measurement far from the substation) | Start | 0 ⇒ Vmax |
| 25 | Braking | Vmax ⇒ 0 | |
| Sensor Type | Frequency [Hz] | Current [A] | Sensor Type | Frequency [Hz] | Current [A] |
|---|---|---|---|---|---|
| Classic circuits track | 2–40 | 15 | SOT—1 | 2680–2730 | 0.095 |
| 40–45 | 3.11 | 2740 | 0.044 | ||
| 45–48 | 1.85 | 2750–2900 | 0.018 | ||
| 48–52 | 1.20 | 2910–2950 | 0.044 | ||
| 52–55 | 1.85 | 2960–3030 | 0.108 | ||
| 55–60 | 3.11 | 3040–3090 | 0.231 | ||
| SOT—1 | 1370–1400 | 0.396 | 3100–3120 | 0.396 | |
| 1410–1440 | 0.231 | SOT—2 | 6650–6700 | 0.425 | |
| 1450 | 0.175 | 6710–7210 | 0.015 | ||
| 1460–1480 | 0.094 | 7220–7600 | 0.100 | ||
| 1490–1510 | 0.066 | 7610–8720 | 0.015 | ||
| 1520–1670 | 0.027 | 8730–9590 | 0.425 | ||
| 1680–1700 | 0.066 | 9600–10,500 | 0.022 | ||
| 1710–1750 | 0.217 | 10,510–11,650 | 0.425 | ||
| 1760–1780 | 0.117 | 11,660–12,700 | 0.034 | ||
| 1790–1910 | 0.032 | 12,710–14,040 | 0.425 | ||
| 1920–1930 | 0.095 | 14,050–15,290 | 0.037 | ||
| 1940–1950 | 0.127 | 15,300–16,110 | 0.425 | ||
| 1960–2060 | 0.207 | 16,120–17,590 | 0.021 | ||
| 2070–2120 | 0.068 | 17,600–17,650 | 0.425 | ||
| 2130–2270 | 0.018 | EOC | 24,300–25,100 | 0.425 | |
| 2280–2320 | 0.141 | 25,300–27,130 | 0.035 | ||
| 2330–2370 | 0.076 | 27,140–27,690 | 0.425 | ||
| 2380–2550 | 0.019 | 27,700–29,900 | 0.038 | ||
| 2560–2570 | 0.050 | 30,000–30,300 | 0.425 | ||
| 2580–2600 | 0.118 | 30,400–32,700 | 0.038 | ||
| 2610–2670 | 0.189 | 32,800–33,000 | 0.425 |
| Frequency [Hz] [Hz] | Current [A] [A] | Algorithm |
|---|---|---|
| 70.5–79.5 | 1.9 | band-pass filters (BPFs) |
| 205.5–245.4 | 4.0 | |
| 270.5–279.5 | 1.9 | |
| 1900–2700 | 2.2 | |
| 2700–5100 | 1.5 | |
| 3450–7550 | 1.5 | |
| 4650–6360 | 1 | |
| 9200–16,800 | 0.5 | |
| 9320–16,755 | 0.33 | |
| 1500–3200 | 0.3/3 1 | FFT transform |
| 9436–9564 2 | 0.3 |
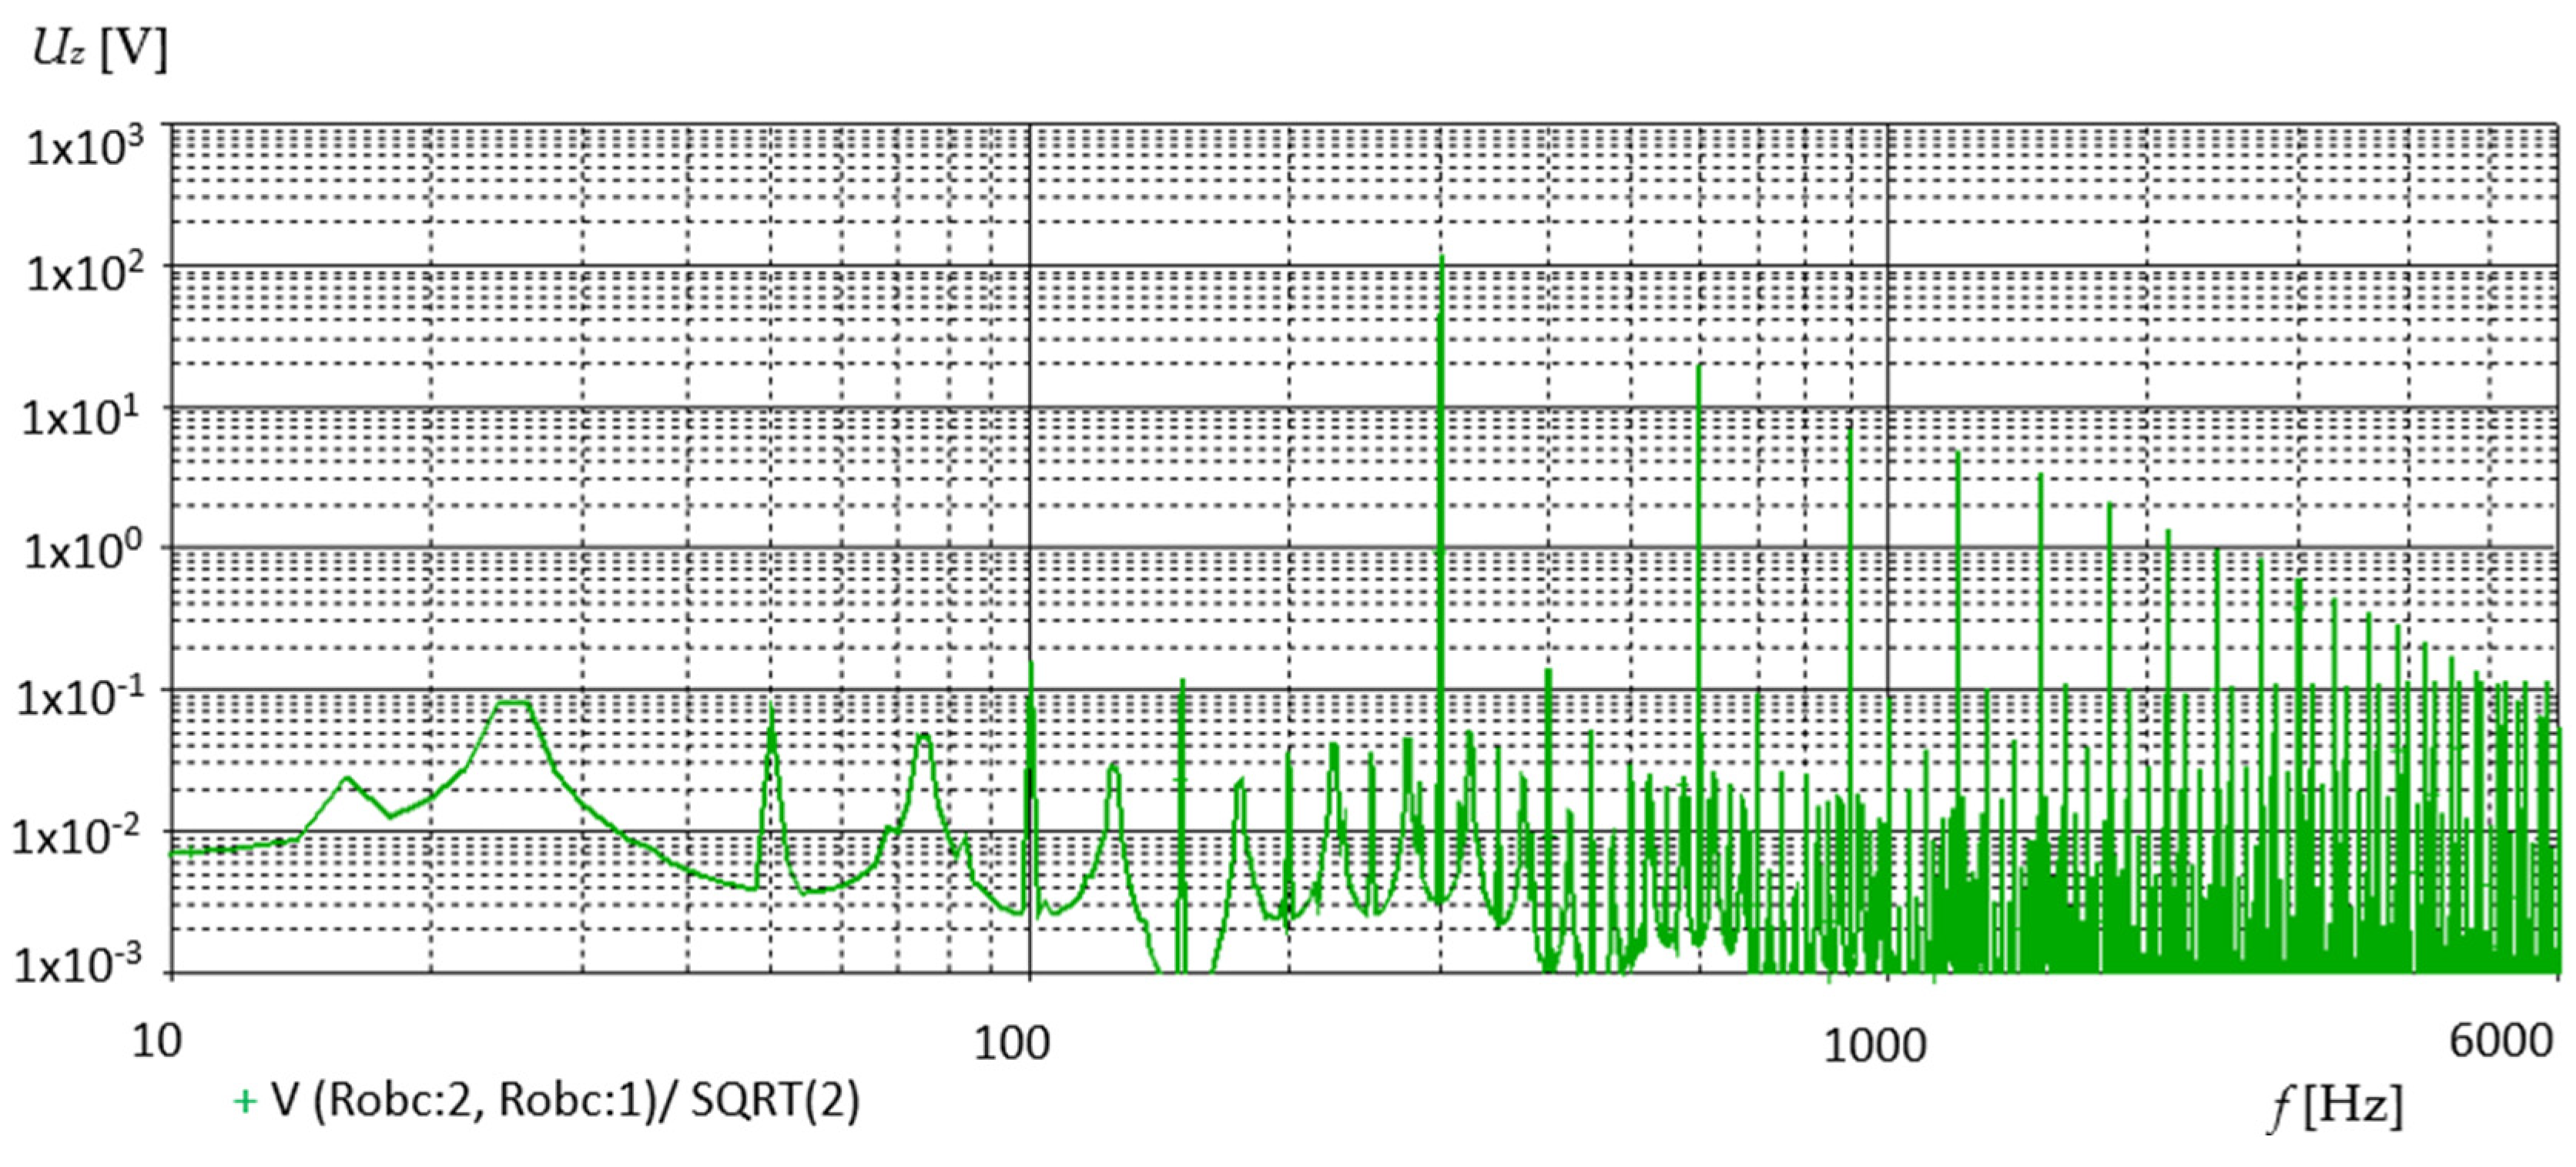
| Order of Harmonic n | Frequency [Hz] | Harmonic Voltage Value [V] | Share Value [%] |
|---|---|---|---|
| 6 | 300 | 133.32 | 4.04 |
| 12 | 600 | 32.67 | 0.99 |
| 18 | 900 | 14.52 | 0.44 |
| 24 | 1200 | 8.25 | 0.25 |
| 30 | 1500 | 5.28 | 0.16 |
| 36 | 1800 | 3.63 | 0.11 |
| 42 | 2100 | 2.64 | 0.08 |
| 48 | 2400 | 1.98 | 0.06 |
| 54 | 2700 | 1.65 | 0.05 |
| 60 | 3000 | 1.32 | 0.04 |
| T [ms] | Required di/dt [A/ms] |
|---|---|
| <20 | di/dt < 60 |
| >20 | di/dt < 20 |
Disclaimer/Publisher’s Note: The statements, opinions and data contained in all publications are solely those of the individual author(s) and contributor(s) and not of MDPI and/or the editor(s). MDPI and/or the editor(s) disclaim responsibility for any injury to people or property resulting from any ideas, methods, instructions or products referred to in the content. |
© 2025 by the authors. Licensee MDPI, Basel, Switzerland. This article is an open access article distributed under the terms and conditions of the Creative Commons Attribution (CC BY) license (https://creativecommons.org/licenses/by/4.0/).
Share and Cite
Garczarek, A.; Stachowiak, D. Measurements and Analysis of Electromagnetic Compatibility of Railway Rolling Stock with Train Detection Systems Using Track Circuits. Energies 2025, 18, 2705. https://doi.org/10.3390/en18112705
Garczarek A, Stachowiak D. Measurements and Analysis of Electromagnetic Compatibility of Railway Rolling Stock with Train Detection Systems Using Track Circuits. Energies. 2025; 18(11):2705. https://doi.org/10.3390/en18112705
Chicago/Turabian StyleGarczarek, Adam, and Dorota Stachowiak. 2025. "Measurements and Analysis of Electromagnetic Compatibility of Railway Rolling Stock with Train Detection Systems Using Track Circuits" Energies 18, no. 11: 2705. https://doi.org/10.3390/en18112705
APA StyleGarczarek, A., & Stachowiak, D. (2025). Measurements and Analysis of Electromagnetic Compatibility of Railway Rolling Stock with Train Detection Systems Using Track Circuits. Energies, 18(11), 2705. https://doi.org/10.3390/en18112705