Article

The Optimal Dispatch for a Flexible Distribution Network Equipped with Mobile Energy Storage Systems and Soft Open Points

1
State Grid Shanghai Energy Interconnection Research Institute, Shanghai 200120, China
2
State Grid Zhejiang Electric Power Company, Hangzhou 310007, China
*
Author to whom correspondence should be addressed.
Energies 2025, 18(11), 2701; https://doi.org/10.3390/en18112701
Submission received: 18 April 2025 / Revised: 17 May 2025 / Accepted: 19 May 2025 / Published: 23 May 2025
(This article belongs to the Topic Advances in Power Science and Technology, 2nd Edition)

Abstract

:
This paper proposes a flexible distribution network operation optimization strategy considering mobile energy storage system (MESS) integration. With the increasing penetration of renewable energy in power systems, its stochastic and intermittent characteristics pose significant challenges to grid stability. This study introduces an MESS, which has both spatial and temporal controllability, and soft open point (SOP) technology to build a co-scheduling framework. The aim is to achieve rational power distribution across spatial and temporal scales. In this paper, a case study uses a regional road network in Chengdu coupled with an IEEE 33-node standard grid, and the model is solved using the non-dominated sorting genetic algorithm III (NSGA-III) algorithm. The simulation results show that the use of the MESS and SOP co-dispatch in the grid not only reduces the net loss and total voltage deviation but also obtains considerable economic benefits. In particular, the net load peak-to-valley difference is reduced by 20.1% and the total voltage deviation is reduced by 52.9%. This demonstrates the effectiveness of the proposed model in improving the stability and economy of the grid.

1. Introduction

As the goals of peak carbon emissions and carbon neutrality continue to progress, the integration of renewable energy sources into power systems is on the rise. However, the inherent randomness and intermittent nature of renewable energy generation presents significant challenges to maintaining grid stability [1,2,3]. In this context, energy storage systems (ESSs), which have both flexible regulation capability and energy time-shift characteristics, have become a key technological direction to enhance the resilience of power systems [4,5,6]. It is worth noting that the mobile energy storage system (MESS), which is carried by a vehicle platform, is breaking through the static layout limitation of traditional energy storage by virtue of its dual space–time controllability, and realizing the innovative application mode of “power on-demand distribution” through dynamic coupling with the power grid [7,8,9]. At the same time, soft open point (SOP) technology, based on fully-controlled power electronic devices, provides a new path to improve the resilience of the distribution network [10]. By replacing the traditional contact switches, SOP can realize continuous and accurate active/reactive power regulation between feeders, and its fast response characteristics can effectively suppress the fluctuation of renewable energy sources, improve the voltage quality of nodes, and optimize the distribution of network currents [11].
From the perspective of operational control, the core function of the SOP is to suppress voltage overruns and reduce network losses under the normal operating conditions of distribution networks. To address the power coordination issue in multi-voltage-level hybrid distribution networks, a fault recovery method for active distribution networks has been proposed, combining three-terminal intelligent SOPs with island partitioning [12]. Additionally, a novel two-stage co-optimization model of SOP and energy storage systems has been introduced, which significantly reduces the loss cost of active distribution networks through time series-coupled optimization [13]. In the field of voltage control, relevant studies have established a fault recovery model for active distribution networks considering translatable loads and SOPs [14] and proposed a multi-objective optimization control strategy for distribution station SOPs to enhance the distributed generation (DG) consumption capability of distribution networks by utilizing multiple SOPs [15]. In terms of SOP applications, a self-governing active power dispatch control method has been introduced, which overcomes the previous limitations by using angle difference control based on local measurements [16]. Meanwhile, a distributed fault recovery method based on the synergy between SOPs and traditional contact switches has been proposed to ensure voltage support capability and transient stability during the fault recovery phase [17]. These research findings have systematically expanded the theoretical application boundaries of SOPs in distribution networks and provided important support for subsequent technological development.
Current research has progressively initiated practical explorations of MESSs. For instance, a dynamic optimal scheduling model based on MESSs has been developed to enhance power supply reliability in scenarios with a high penetration rate of photovoltaic (PV) grid connections [18]. This model effectively manages the operational risks associated with high-penetration PV distribution systems. Another study has proposed a resilient dispatch strategy for MESSs that considers renewable energy uncertainty, thereby strengthening the distribution network’s ability to recover swiftly following high-impact, low-probability extreme events [19]. In the realm of economic benefit optimization, a spatiotemporal co-optimization mechanism for MESSs has been introduced, leveraging the nodal marginal tariff response to verify the multi-dimensional arbitrage value of MESSs through a tariff-load spatiotemporal coupling analysis [20]. Additionally, a cooperative scheduling framework for multiple types of MESSs and mobile resources has been constructed, revealing the synergistic mechanisms of heterogeneous resource complementary effects in enhancing distribution network recovery efficiency [21]. Regarding optimization scheduling frameworks, a two-layer optimization scheduling framework has been proposed, where the upper layer optimization addresses fault repair and network reconfiguration issues, while the lower layer optimization tackles the dynamic scheduling problems of MESSs and gas turbines [22]. A two-tier optimization framework for mobile energy storage financial equity revenue based on locational marginal pricing has also been presented, effectively reducing distribution network costs [23]. Furthermore, a two-stage stochastic mixed-integer programming (SMIP) model has been introduced to maximize the potential of MESSs [24]. Lastly, a disaster management method for active distribution networks using MESS active regulation has been proposed and validated, demonstrating the feasibility of a dynamic dispatch model for post-disaster scenarios with time-varying distributed power outputs [25].
On the one hand, SOPs enable the spatial transfer of electrical energy but do not offer temporal storage capabilities. On the other hand, MESSs, while characterized by their compact size and rapid response, encounter efficiency challenges in spatial energy transfer due to factors such as traffic congestion. The strategic integration and optimization of SOPs with MESSs can lead to a more balanced distribution of electrical power across the grid. The main contributions of this article are as follows:
  • This paper proposes an SOP and MESS co-scheduling framework that leverages the complementary strengths of SOPs and MESSs to address the challenges associated with high DG penetration.
  • The proposed co-dispatch model not only quantifies the various costs and benefits, but also takes into account the stability of the grid, aiming to ensure the stability of the grid while maximizing the grid benefits.
The structure of this article is as follows: Section 1 introduces the background and significance of the research, highlighting the challenges posed by the increasing penetration of renewable energy and the potential solutions offered by MESSs and SOPs. Section 2 details the methods used, including the road network and grid topology, and describes the shortest path calculation and MESS operating constraints. Section 3 outlines the objective function, including the net benefit of scheduling and total voltage deviation. Section 4 presents the case study, validating the proposed algorithms through simulations and analyzing the cost–benefit and grid stability. Section 5 discusses the results, suggesting future research directions and potential improvements. The final section concludes the article, summarizing the key findings and contributions of the research.

2. MESS and SOP Co-Scheduling Model

When developing day-ahead scheduling strategies for MESSs and SOPs, not only its economic benefits but also the stability of the grid need to be fully considered. Therefore, in this paper, the access location and the charging and discharging power at each moment of the MESS and the power at each moment of the SOP are used as the decision variables to maximize the net benefit of the dispatch and minimize the total voltage deviation.

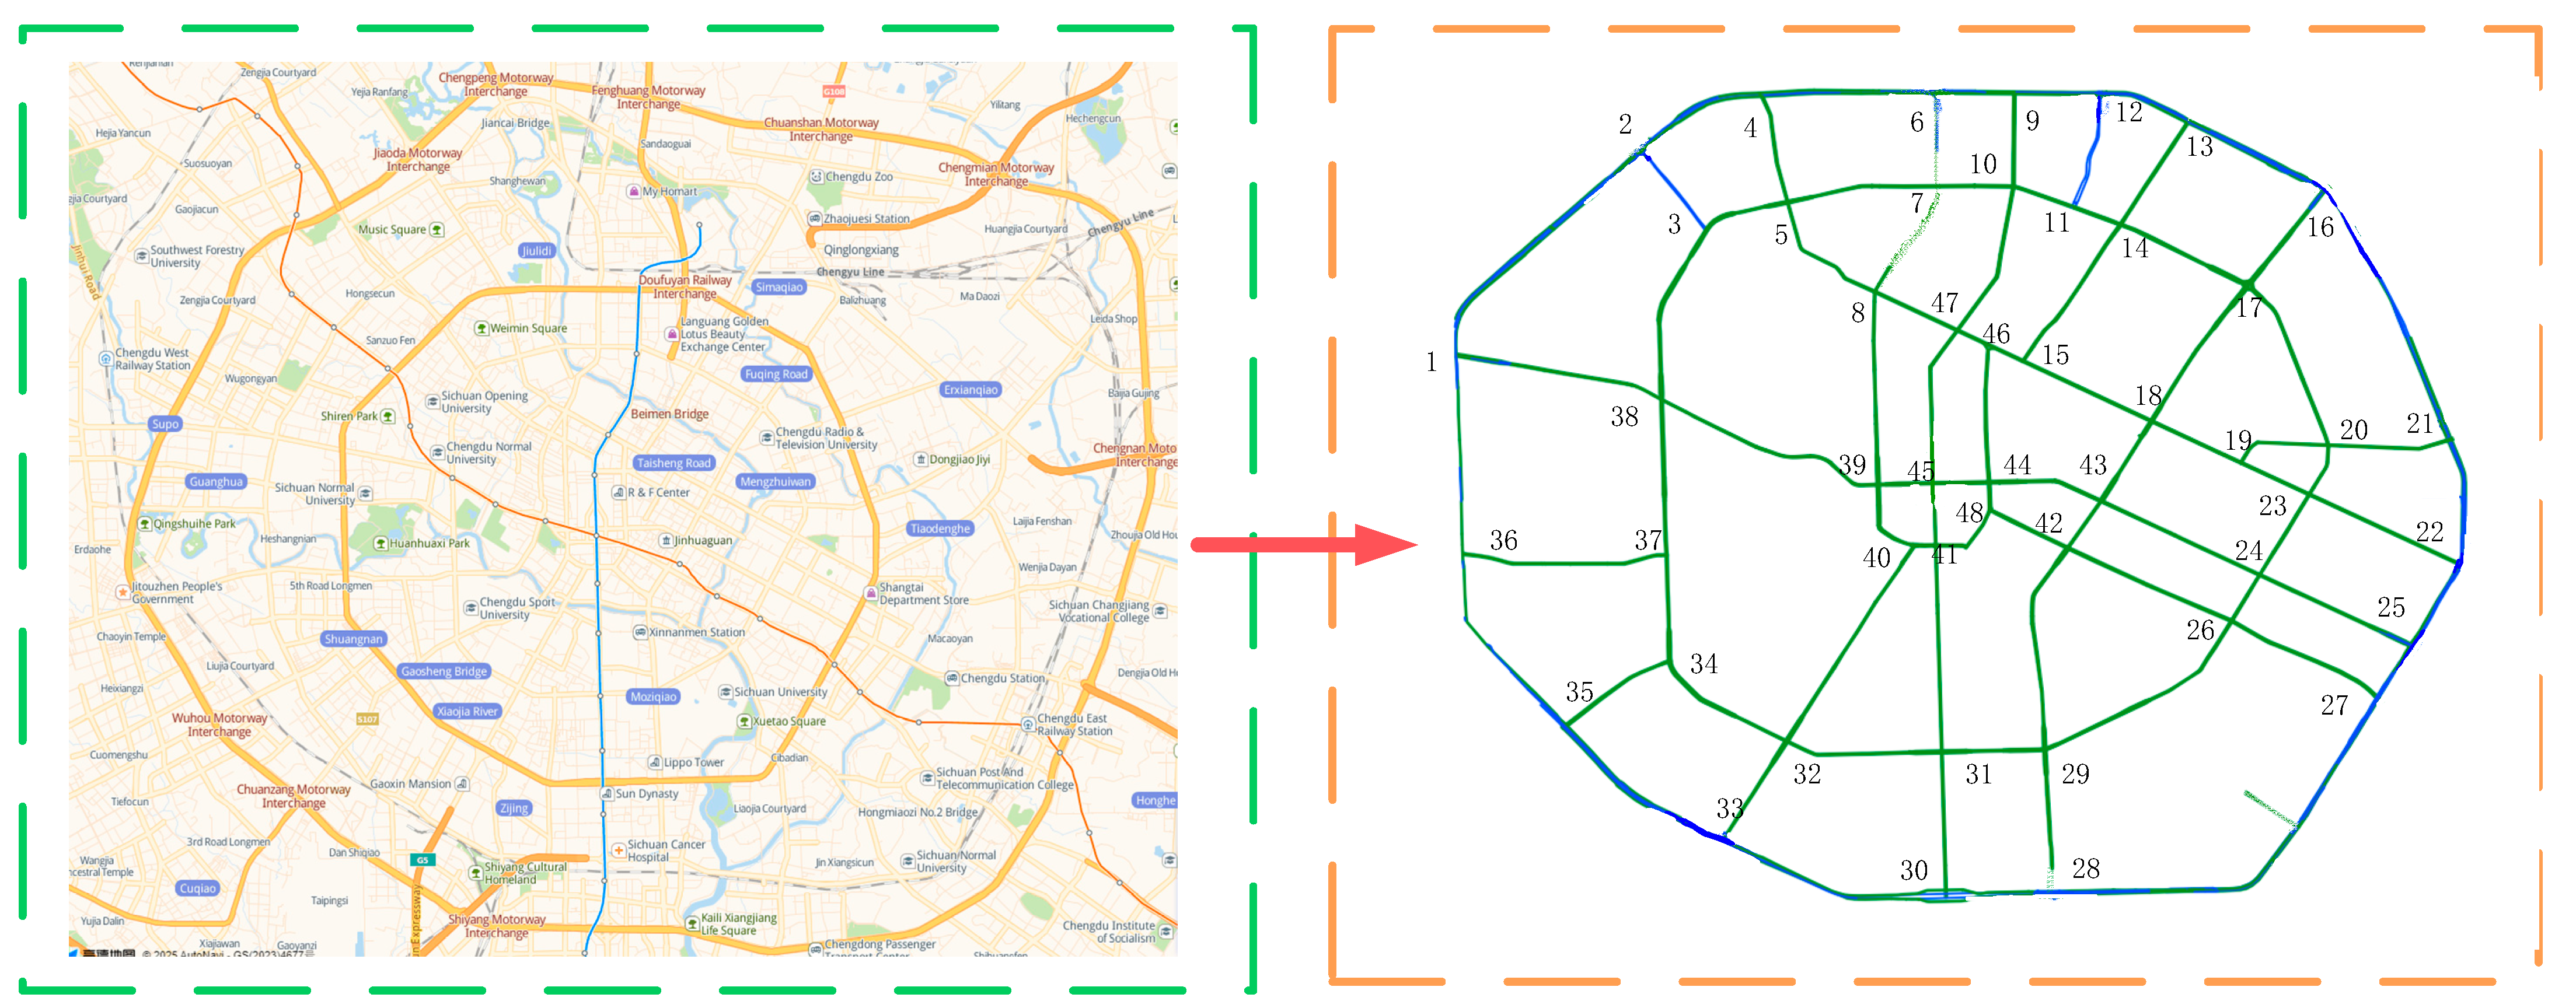
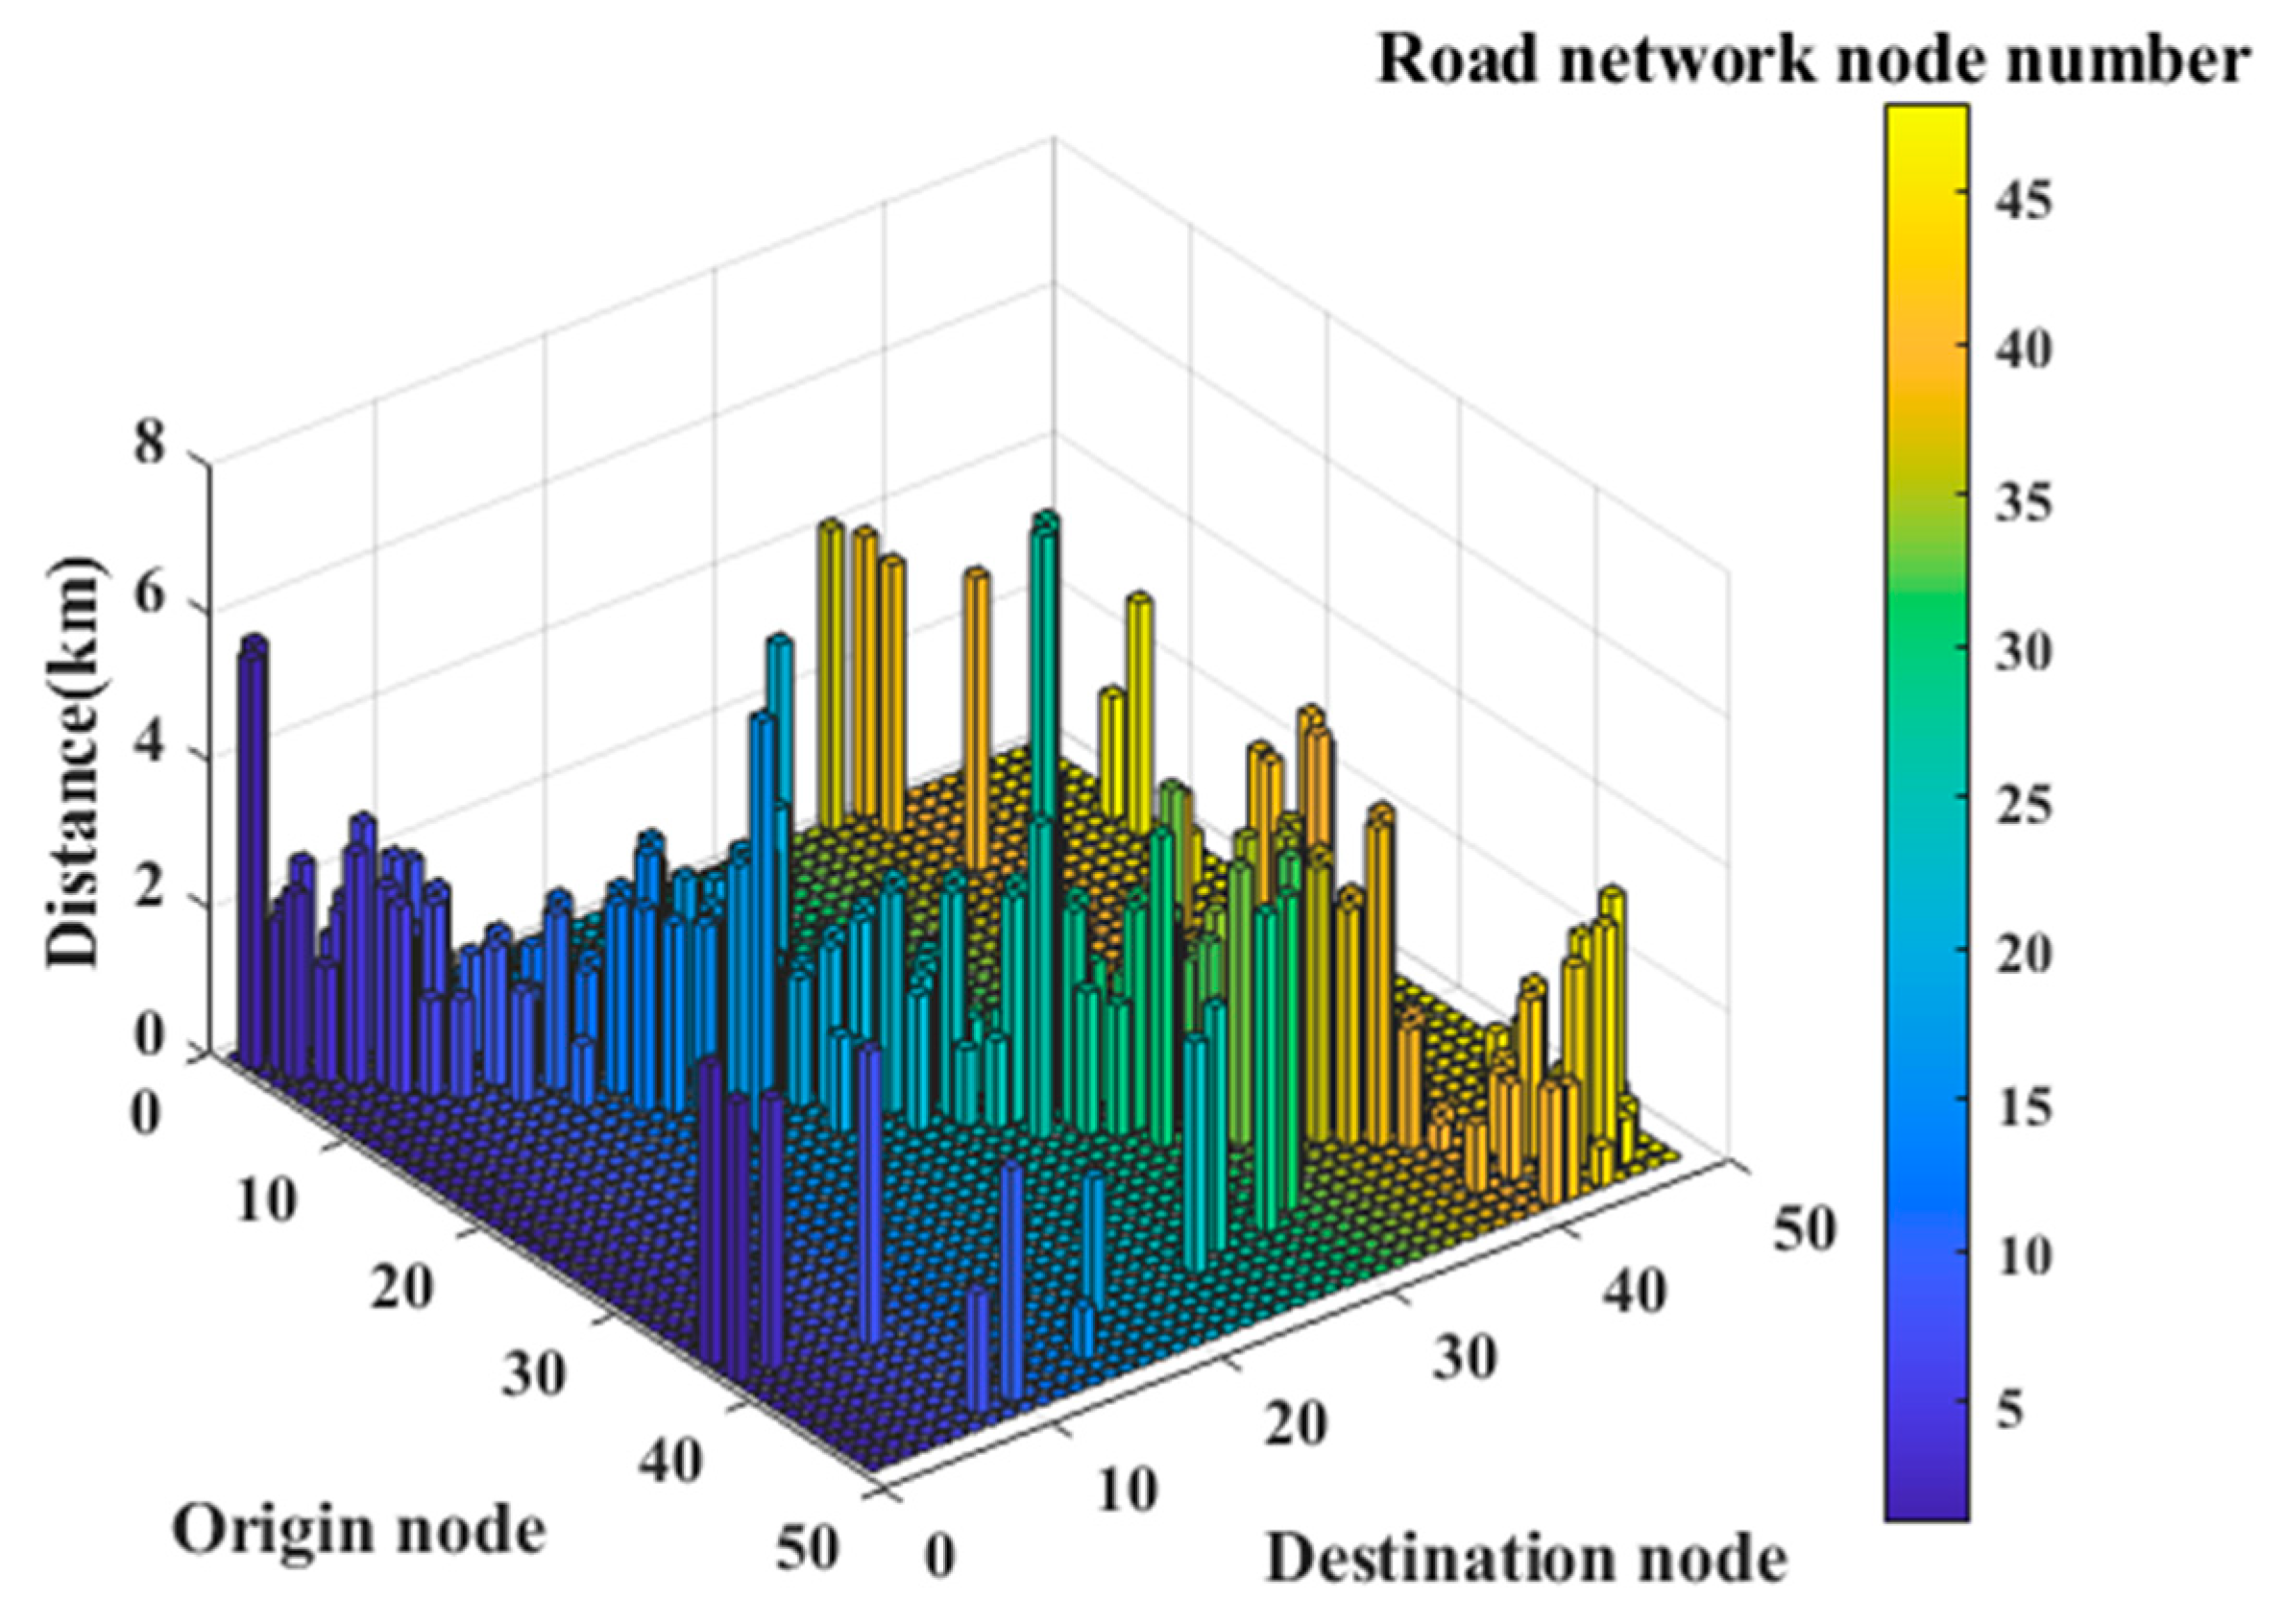
2.1. Road Network Model

In this paper, a graph-theoretic analysis approach is used to model the road network. Specifically, the road network is modeled as a graph where the nodes represent intersections and the roads connecting these points are denoted as road segments. Nodes are typically identified by important intersections, connections, and roadway endpoints, while roadway segments are defined by the contiguous roadway segments that connect these nodes.
Chengdu, a major economic and transportation hub in Southwest China, is renowned for its rich historical heritage, rapid modern development, and well-developed urban infrastructure. In order to facilitate the scheduling of MESSs in the region, it is necessary to obtain the road topology of the scheduling region in the following steps. First, the road data of Chengdu City, Sichuan Province, China, are obtained via the OpenStreetMap (OpenStreetMap is a global geodata project, collaboratively contributed to by community members, that provides a map of the world that anyone can freely access and update) website. Secondly, QGIS (QGIS is an open source geographic information system software that supports a variety of geographic data formats and provides a wealth of map production, spatial analysis, and data management functions) software is used to visualize the data. The QGIS version number is 3.34.1. Finally, major roads are retained as components of the transportation road network, and the road nodes are numbered from 1 to 48 (road nodes usually represent key points in the actual road network, such as intersections, or the beginning and end of a road), with the topology shown in Figure 1.

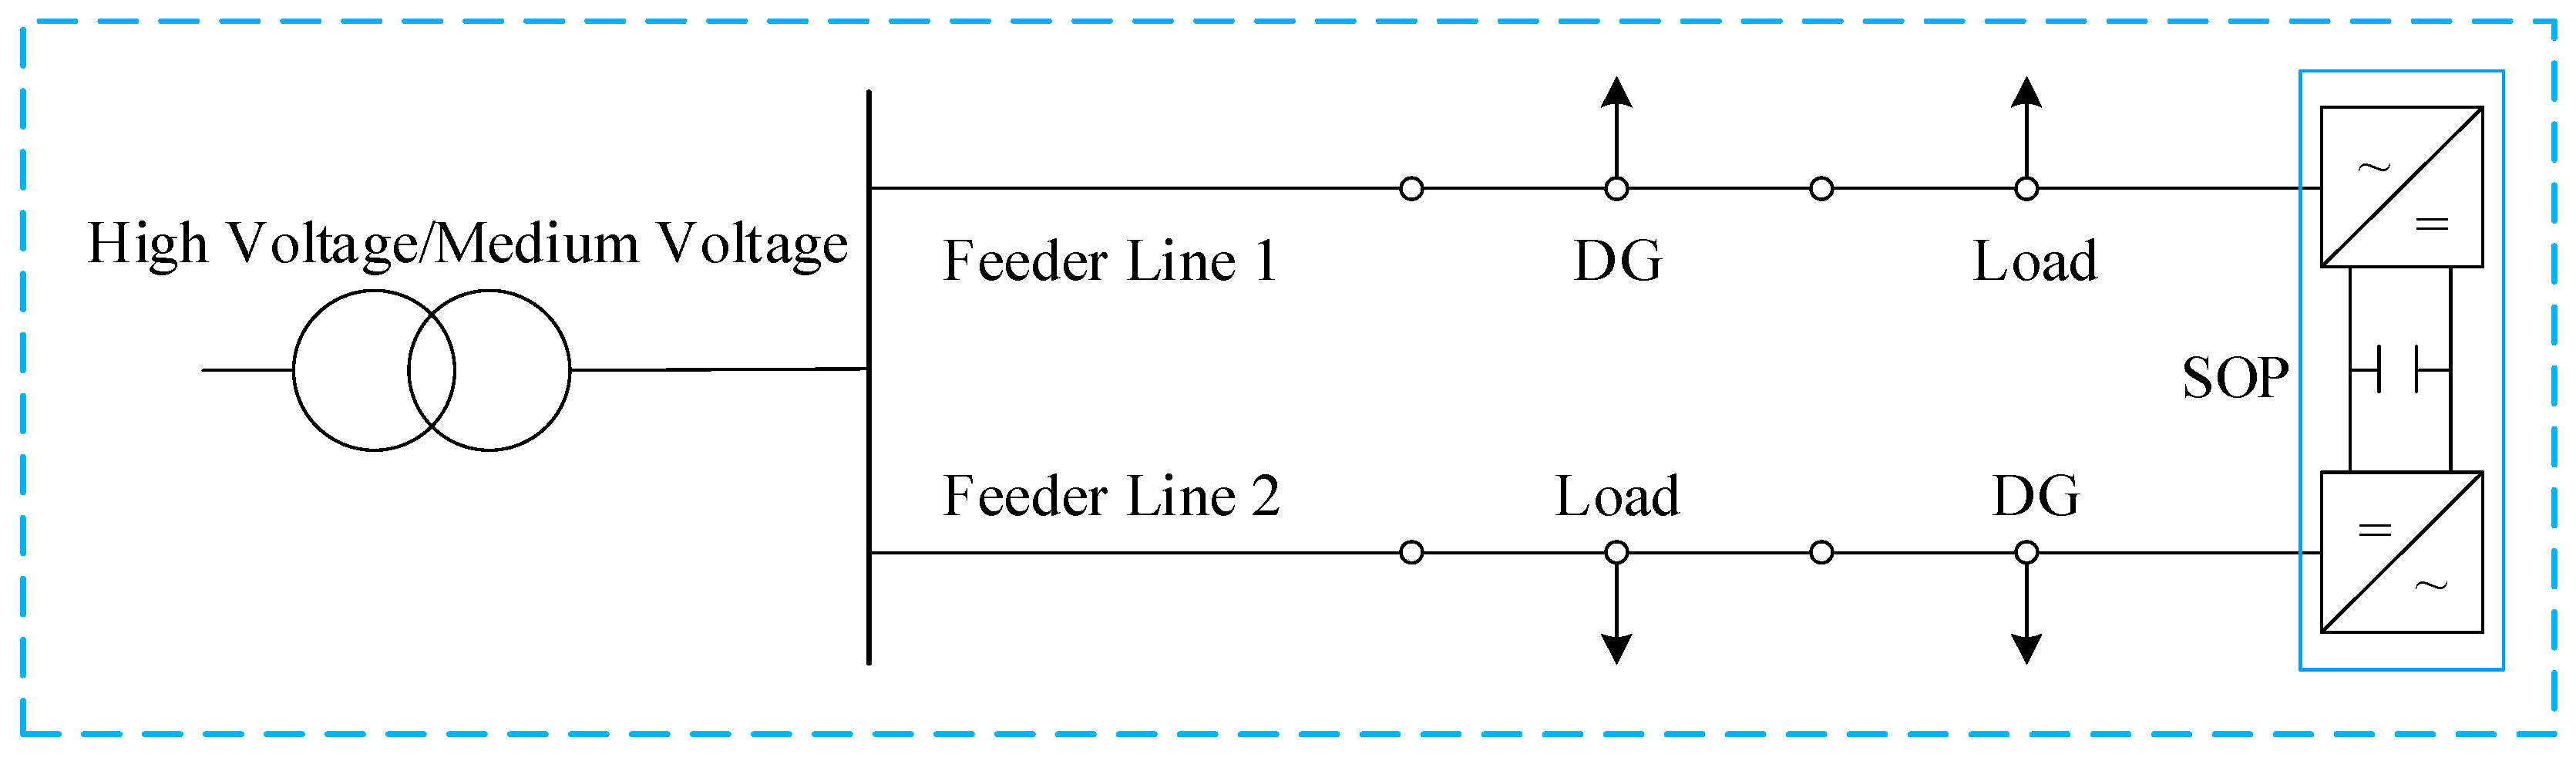
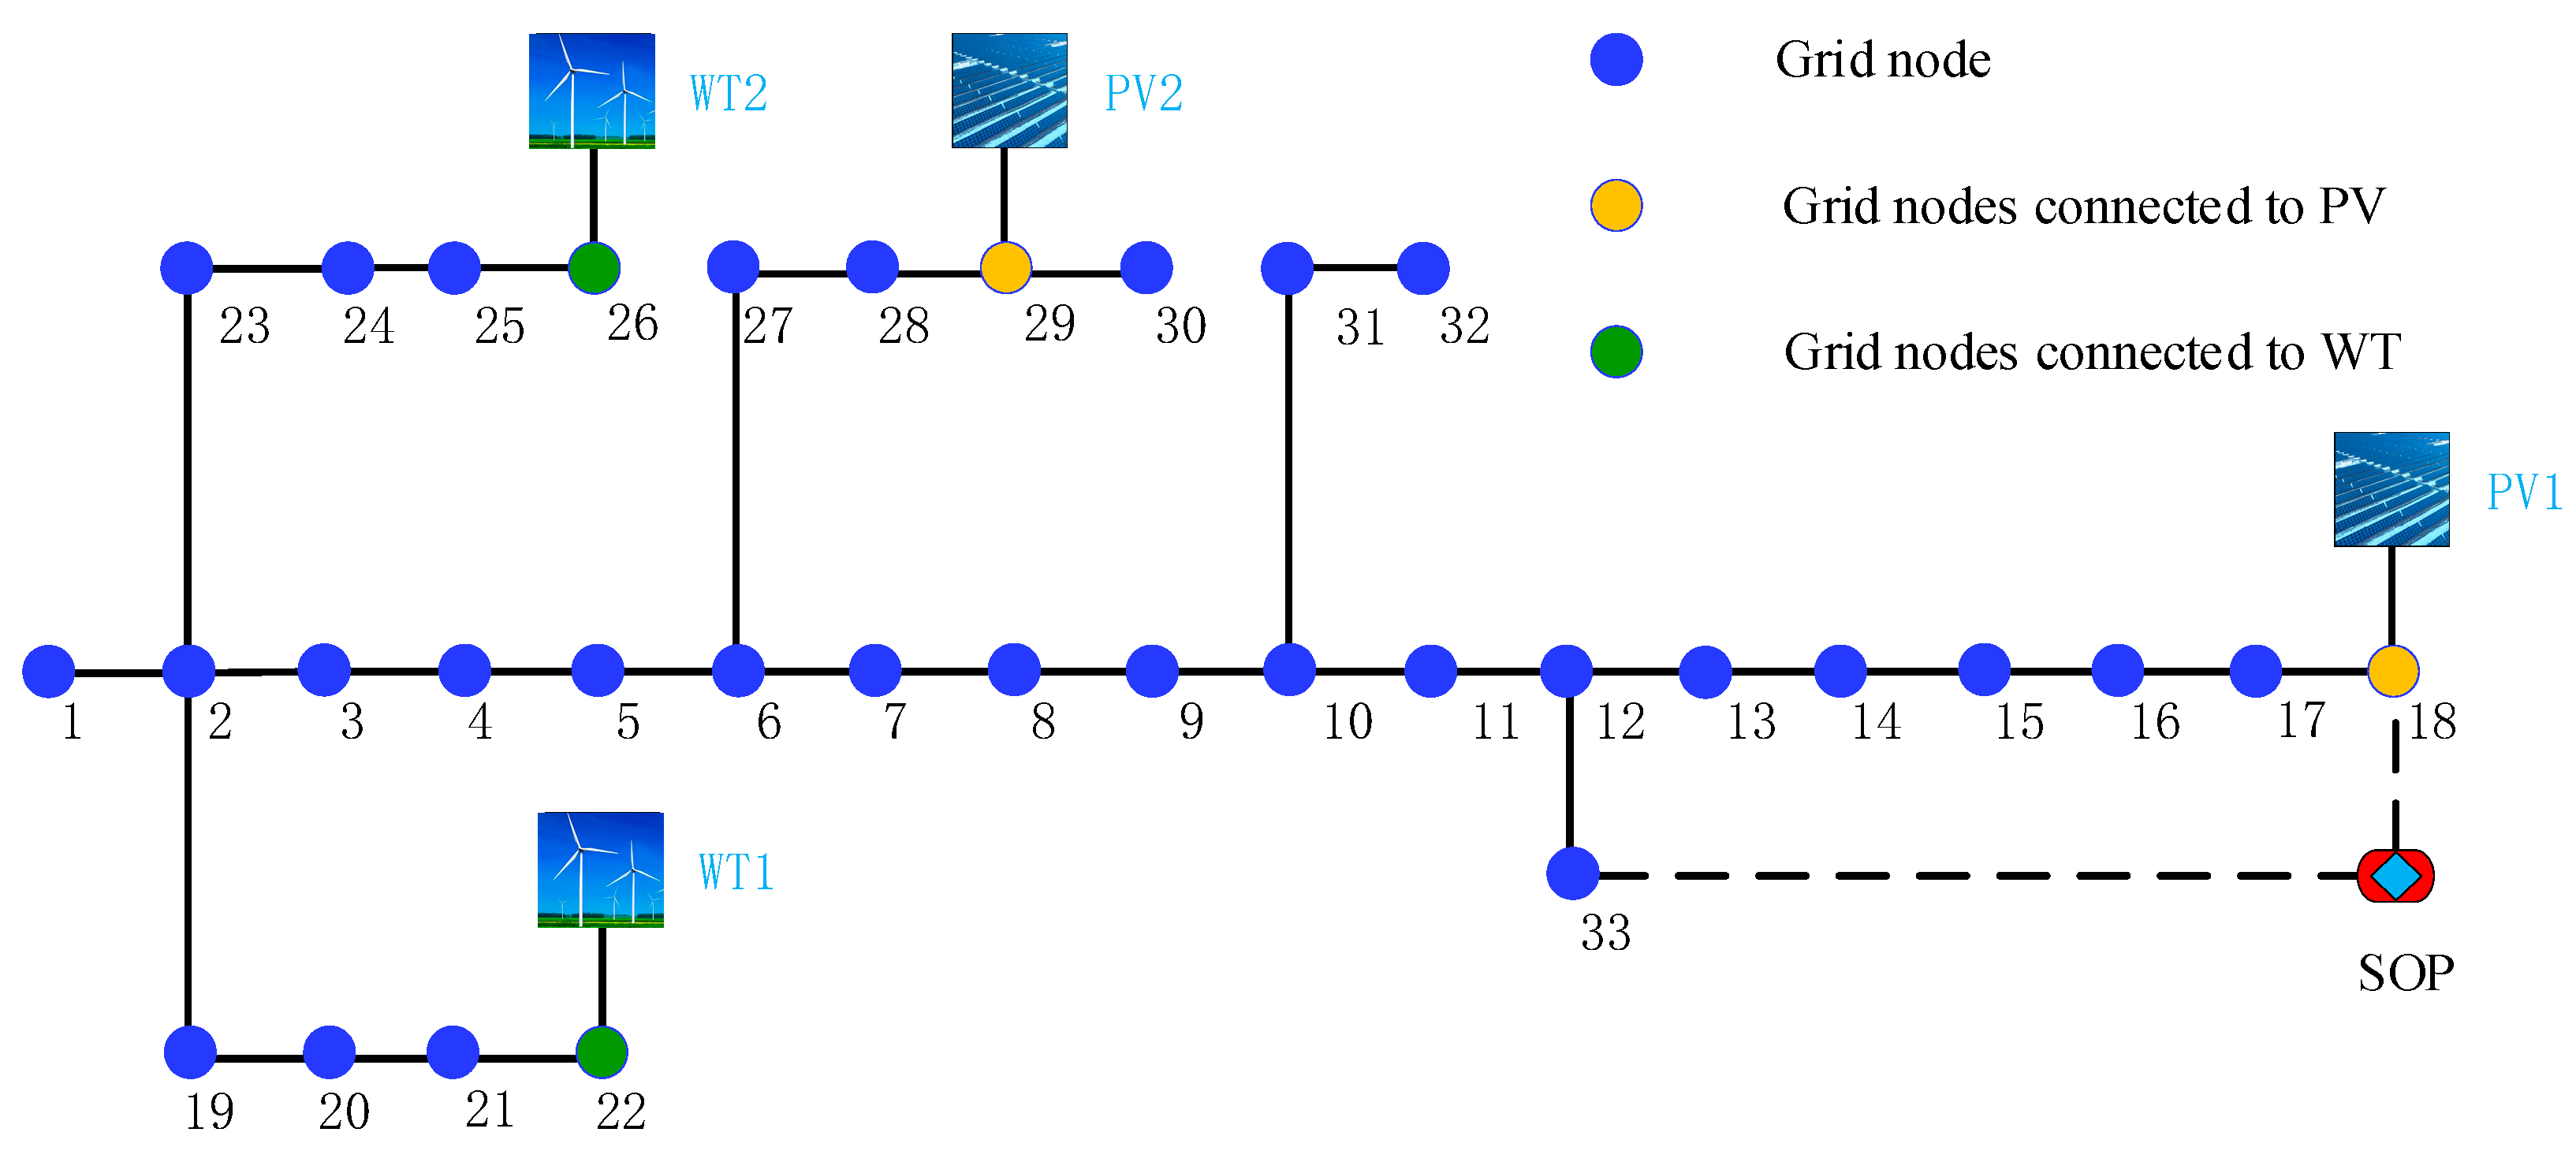
2.2. SOP-Based Distribution Network Configuration

This study employs a back-to-back voltage source converter (VSC)-based SOP. In distribution networks, SOPs are installed between adjacent feeders to replace traditional contact switches, as depicted in Figure 2.
The SOPs are primarily implemented using fully controlled power electronics, allowing for the precise control of the active and reactive powers of the connected feeders. The active and reactive power outputs of the two converters are used as decision variables. For modeling simplicity, SOP power losses are assumed negligible, considering the high efficiency of back-to-back VSCs. The DC isolation ensures that the reactive power outputs of the two converters are independent, requiring only that they meet their respective capacity constraints.
The topology of the grid is shown in Figure 3, where an IEEE 33-node network is used, with the wind turbines (WTs) located at nodes 22 and 26, the PV at nodes 18 and 29, and the SOPs connected between nodes 18 and 33.

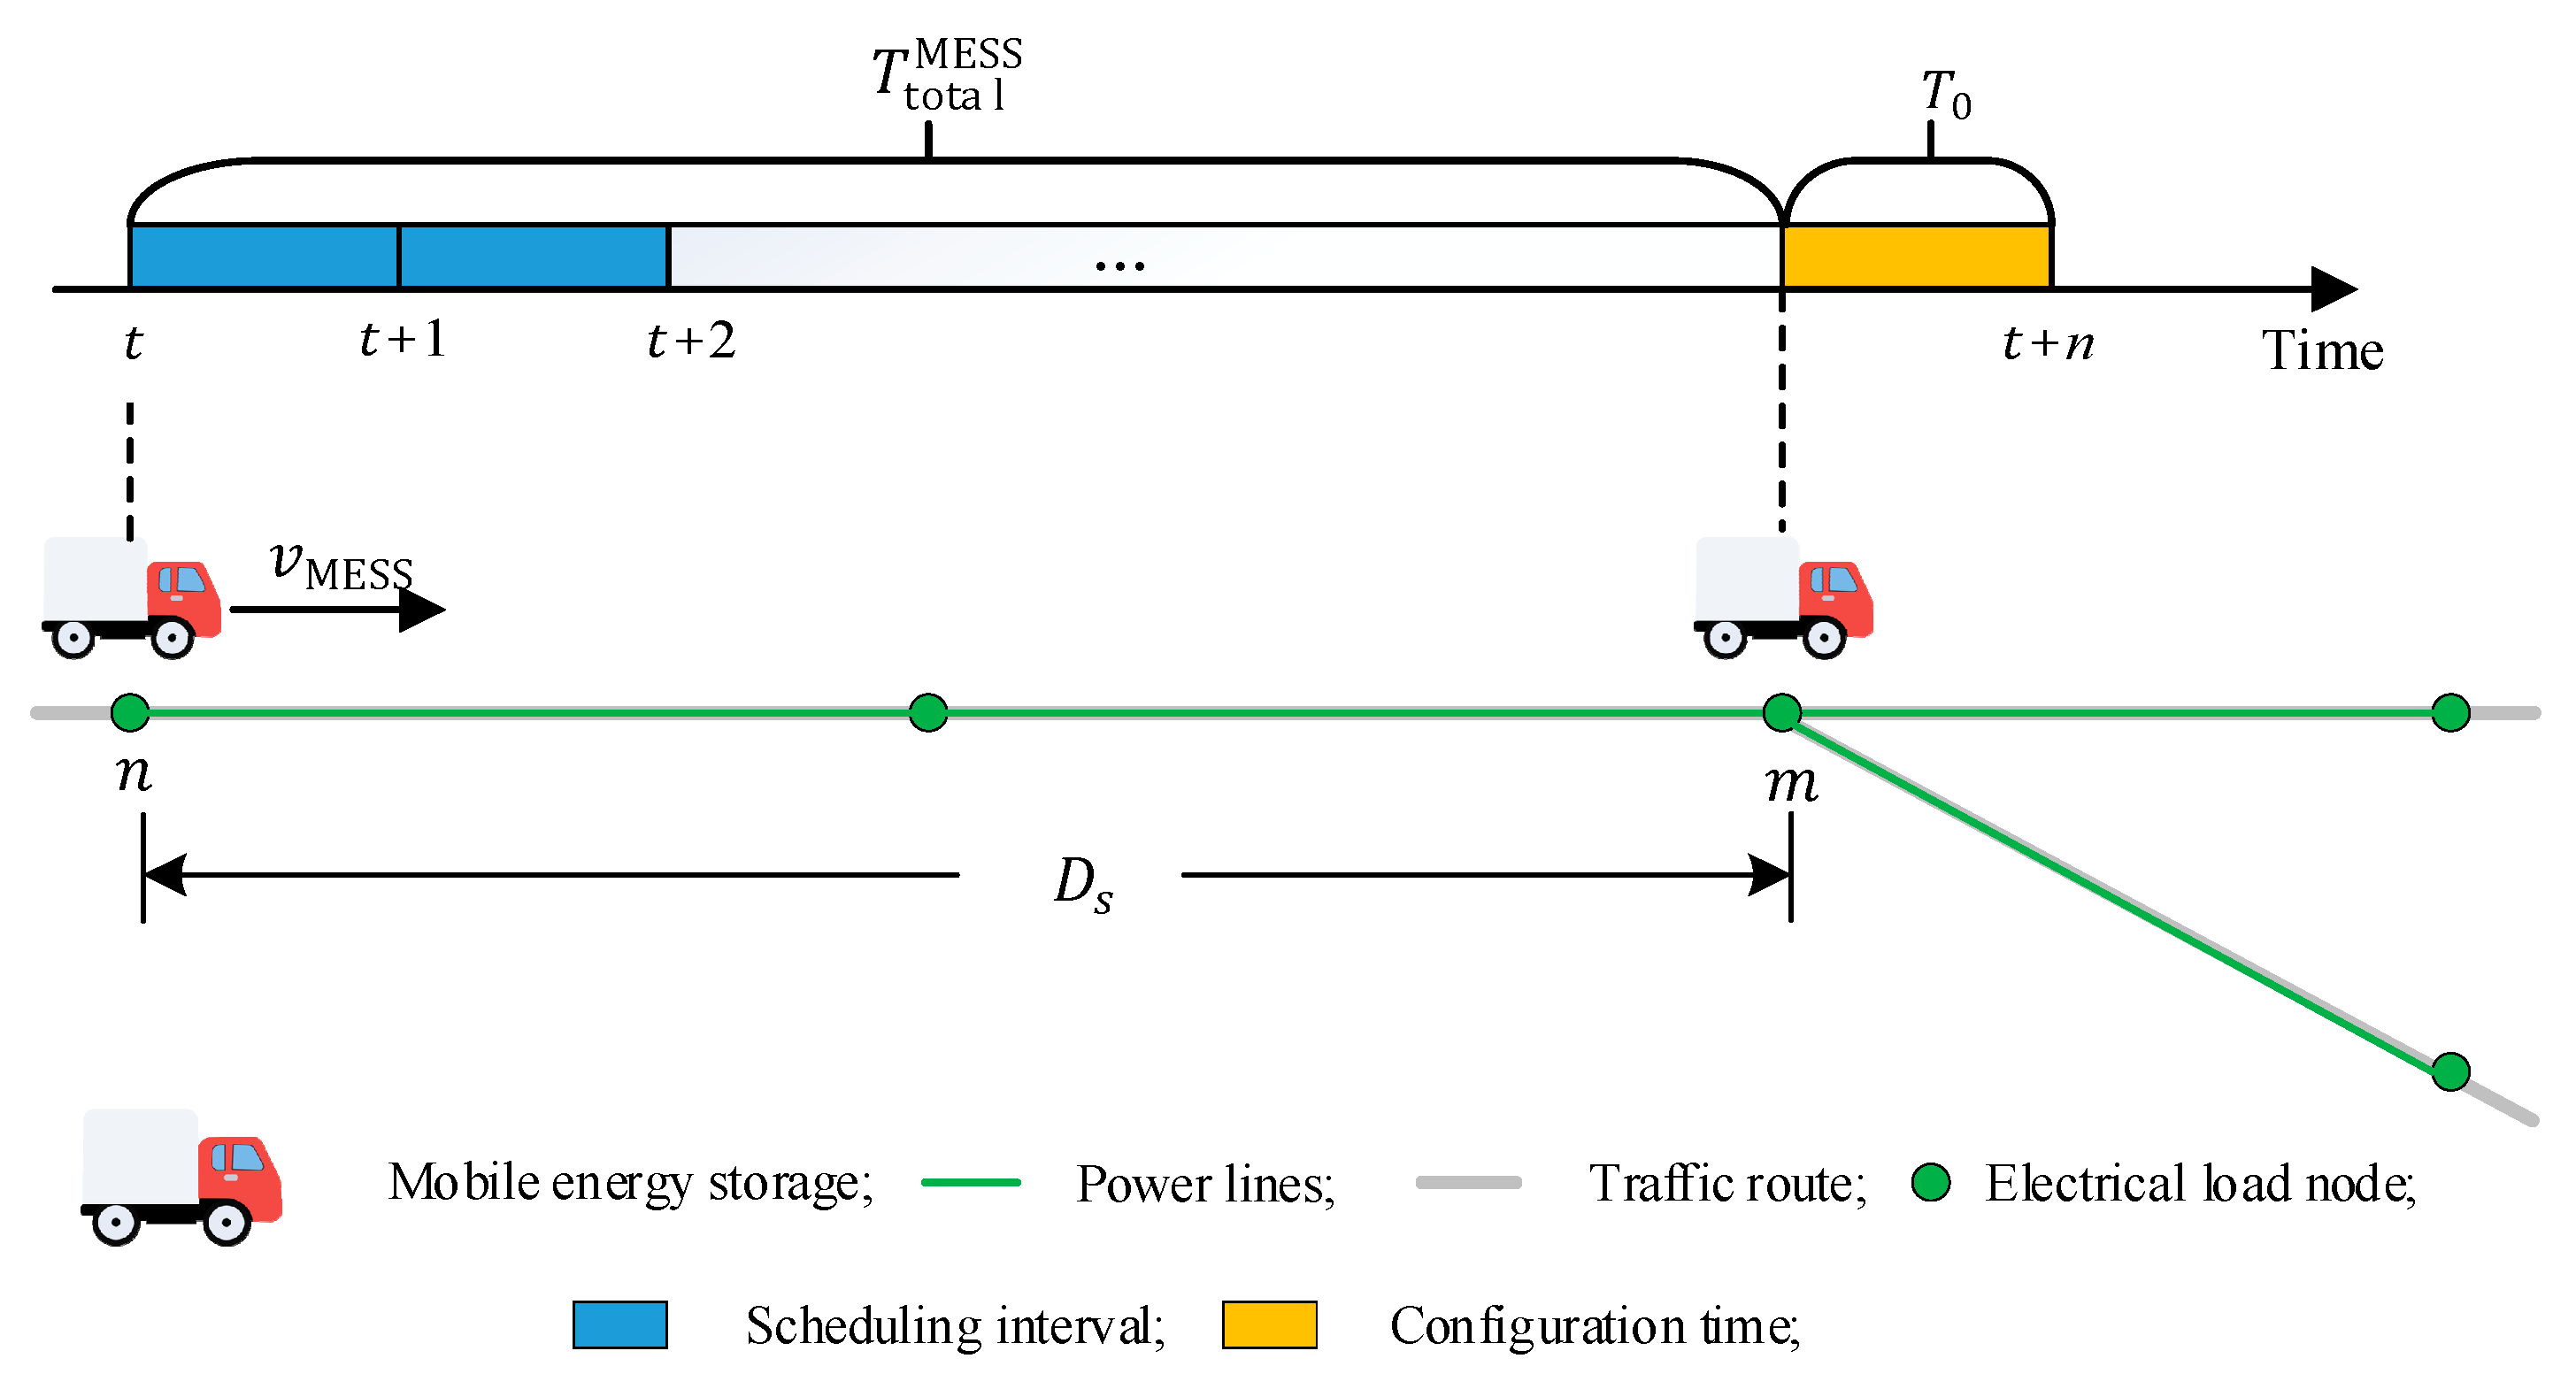
2.3. Path Optimization for the MESS

Connecting the MESS to the grid at the right time and location can effectively reduce the grid losses and total voltage deviation; therefore, during the scheduling process, the MESS needs to move between the road network nodes within a specified period of time to ensure that it is connected to the grid nodes at the right time. In addition, reducing the traveling distance also helps to reduce the traveling cost of the MESS. Consequently, in order to reduce the traveling distance and time of the MESS, it is necessary to plan the traveling path of the MESS.
As Figure 4 shows the spatial–temporal scheduling model of MESSs. In the figure, n and m are denoting the starting and ending points of the MESS traveling, v M E S S is the traveling speed of the MESS, and D S is the total weight. The weights here are equivalent to the distance of the MESS traveling the road during the dispatch process. During the MESS scheduling process, the timely deployment of the MESS can be affected by various traffic conditions, such as road congestion and signal delays at the road network nodes. Given that driving conditions are generally favorable under normal conditions, the MESS usually avoids frequent node transitions to save costs. Therefore, to simplify the model, this paper only considers the road distance and uses Dijkstra’s algorithm to optimize the driving path of the MESS to reduce the driving time and distance of the MESS in order to ensure the timely deployment of the MESS.

3. Objective Function

3.1. Net Benefit of Scheduling

The net benefit of dispatch consists of several key components: first, the gain from arbitrage through the MESS, second, the gain from reducing network losses, and finally, the sum of the costs of running the MESS and SOPs. In particular, the cost of running the MESS includes the cost of battery degradation and the cost of traveling [26]. These factors together determine the economic efficiency of the power dispatch, which is calculated by maximizing the net dispatch benefit, i.e., the arbitrage benefit plus the benefit of reducing network losses, minus the cost of running the SOP and MESS.
m a x F 1 = M d + M l C b C d C s o p
where F 1 denotes the net scheduling gain; the arbitrage gain of the MESS is represented by M d ; the gain of reducing network losses is denoted by M l ; the cost of battery decline is C b ; C d is the cost of traveling for the MESS; and C s o p is the running cost of the SOP.
The arbitrage gain from the MESS is the economic benefit from the charging and discharging operations that take advantage of the difference in electricity prices during different time periods. The calculation of this gain is based on the sum of the product of the total charging and discharging power of all the energy storage systems and the time-of-use (TOU) tariff during each time period.
M d = t = 1 T a = 1 N M E S S C t P c , a M E S S t + P d , a M E S S t
where P c , a M E S S t and P d , a M E S S t are the total powers of charging and discharging, respectively, and C t is the TOU electricity price.
The benefit of reducing network losses is the economic benefit that results from optimizing the electricity transmission path and reducing power losses. The calculation of this benefit is based on the sum of the product of the difference in active power losses before and after optimization and the time-of-day tariff for all grid branches in each time period.
M l = t = 1 T b = 1 B n P l o s s , b t P l o s s , b t C t
where P l o s s , b t and P l o s s , b t are, respectively, the b th branch’s active power at time t before and after the optimization power loss; and the number of grid branches is denoted by B n .
The battery degradation cost reflects the cost of battery performance degradation due to chemical and physical changes during charging and discharging. This cost is calculated based on the product of the sum of the absolute value of the charging power and discharging power and the battery degradation cost factor for all the energy storage systems in each time period.
C b = λ b t = 1 T ( | P c M E S S t | + P d M E S S t )
where λ b is the linearity battery degradation cost factor; P c M E S S t denotes the actual charging power of the MESS at moment t ; and P d M E S S denotes the actual discharging power of the MESS at moment t .
The MESS drive cost takes into account the cost of moving the MESS while performing charging and discharging tasks. This cost is calculated based on the sum of the product of the set of distances traveled by all the energy storage systems and the per-unit distance cost factor in each time period [27].
C d = σ D a D t = 1 T a = 1 N M E S S D a t
where σ is the cost coefficient of the MESS per unit distance; and D a is the set of distances traveled by the a th MESS.

3.2. Total Voltage Deviation

Total voltage deviation measures how much each node’s voltage varies from the average, crucial for power system stability. It is optimized by minimizing the sum of absolute voltage differences from the average at each time period, reducing the overall grid deviation and enhancing the power quality.
min F 2 = a = 1 n Grid t = 1 T V a t V a ¯
where n Grid is the number of grid nodes; V a t denotes the voltage of the a th node at time t ; and V a ¯ is the average voltage of a node [28].

3.3. SOP Operation and Protection Constraints

The operational limits and protection constraints of the SOP system are comprehensively accounted for in the model to ensure its safe and efficient operation within the power system [29]. The model incorporates active power balance constraints, requiring that the active power injected by node i through the SOP is equal to the active power absorbed by node j , thereby maintaining the power balance between the connected nodes and satisfying the constraints defined in Equation (7). Additionally, the model enforces capacity constraints to prevent overloading, ensuring that both the active and reactive power levels passing through the SOP remain within its rated capacity and predefined upper and lower limits, as specified in Equations (8) and (9). These constraints collectively safeguard the SOP’s stable operation and maintain the overall system integrity.
P S , i t + P S , j t = 0
P S , i 2 t + Q S , i 2 t S S , i j P S , j 2 t + Q S , j 2 t S S , i j
Q S , i , m i n Q S , i t Q S , i , m a x Q S , j , m i n Q S , j t Q S , j , m a x
where S S , i j is the rated capacity of SOPs; P S , i t and P S , j t are the active power injected by node i and node j via the SOPs at time t , respectively; Q S , i t and Q S , j t are the reactive power injected by node i and node j , respectively, via the SOP at moment t ; Q S , i , m a x , Q S , i , m i n , and Q S , j , m a x , Q S , j , m i n are the upper and lower bounds of the reactive power injected by the SOPs at node i and node j , respectively.

3.4. Distribution Network Operational Constraints

The distribution network operational constraints are designed to ensure that the nodes and lines in the distribution network operate under safe and stable conditions [30]. This includes ensuring that the active and reactive powers at the nodes is balanced, and that the voltage magnitudes and line current magnitudes do not exceed the preset maximum and minimum values. These constraints help to prevent over- or under-voltage and the overloading of lines, thus ensuring a stable operation and the security of supply in the distribution network.
P i t = j Ω i   V i t V j t ( G i j cos θ i j t + B i j sin θ i j t )
G i i V i 2 t = P S , i t + P D G , i t P L , i t
Q i t = j Ω i   V i t V j t ( G i j sin θ i j t B i j cos θ i j t )
B i i V i 2 t = Q S , i t + Q D G , i t Q L , i t
I i j 2 t = G i j 2 + B i j 2 V i 2 t + V j 2 t 2 V i t V j t c o s θ i j I i j , m a x 2
V i , m i n V i t V i , m a x
The DG constraints are designed to ensure that DG units operate within safe and efficient limits [31]. This includes ensuring that the active and reactive power outputs of the DG do not exceed its rated capacity and remain within preset upper and lower limits. These constraints help prevent the overloading of the DG and ensure their stable operation in the power system while optimizing the active and reactive power distribution in the grid. This paper makes assumptions about renewable energy generation, including accurate forecasts and stable output.
P D G , i ( t ) = P DG , i pre t Q DG , i t = P DG , i t tan β DG , i t
P D G , i 2 t + Q D G , i 2 t S D G , i 2
where P i t and Q i t are the active and reactive powers injected at node i at moment t , respectively; Ω i denotes the summation of all the nodes j that are directly connected to node i physically; V i t and θ i j t are the voltage magnitudes at node j   at moment t and the phase angle difference between nodes i and j ; G i i , B i i and G i j , B i j are, respectively, the node conductance matrices of the self-conductance, self-conductance, and mutual conductance; P DG , i pre t is the predicted value of the DG output active power; P D G , i t and Q D G , i t are the active and reactive power outputs from the DG at node i in time period t , respectively; P L , i t and Q L , i t are the active and reactive powers injected by the load at node i before time period t ; V i , m a x and V i , m i n are the upper and lower limits of the voltage amplitude at node i , respectively; I i j and I i j , m a x are the upper and lower limits of the branch current amplitude at time t , respectively; and β DG , i t and S D G , i ( t ) are the power factor angles of the DG at node i at time t , respectively.

3.5. Energy Storage System Operating Constraints

The operational constraints of the MESS are critical to ensure that they operate in a safe and efficient manner. These constraints include the charging and discharging power limits of the MESS and the state of charge (SOC) limits [32]. The charging and discharging power constraints need to ensure that the charging and discharging power of the MESS does not exceed its rated power at any given point in time. These constraints are based on the principles that “the absolute value of the charging power does not exceed the rated power” and “the discharging power is between zero and the rated power”. These principles prevent the system from overloading and ensure its stability and reliability, as expressed in Equation (18). The SOC of the MESS encapsulates the relationship between the MESS’s charging and discharging actions and its SOC levels. This relationship is governed by constraints that dictate maximum and minimum allowable SOC values, as outlined in Equations (19) and (20). In particular, Equation (19) incorporates the energy losses associated with the charging and discharging operations of the MESS. When determining the SOC, it is essential to consider not only the energy that is being charged or discharged but also the energy that is lost due to the inefficiencies inherent in these processes, where the efficiency does not reach 100%.
| P c , a M E S S t P r , a M E S S 0 P d , a M E S S t P r , a M E S S
E a M E S S t = E a M E S S t 1 P c , a M E S S t η D t E r , a M E S S P d , a M E S S t t η C E r , a M E S S
S o C m i n E a M E S S t S o C m a x
where P c , a M E S S t and P d , a M E S S t are the charge and discharge power of the a th MESS at time t , respectively; P r , a M E S S is the rated power of the a th MESS; E a M E S S t is the SOC of the a th MESS at time t ; η C and η D are the efficiency of charge and discharge, respectively; E r , a M E S S represents the rated capacity of the a th MESS; and S o C m a x and S o C m i n are the upper and lower limits of the SOC.

3.6. Timing Constraint

To ensure that the scheduling of the MESS must begin at or after the start of the scheduling cycle, the first start charge/discharge time ( T o n ( 1 ) ) of the MESS needs to satisfy the constraints of Equation (21). In addition, the sum of the charge/discharge end time, node transition, and charge/discharge preparation time needs to satisfy the constraints of Equation (22) to ensure that the scheduling cycle is not exceeded.
T o n 1 1
T e n d N + T t o t a l M E S S N + T 0 N p
The start time of each MESS charging or discharging operation must be earlier than the end time of that operation. This ensures that each individual operation can be completed within a predetermined time and avoids overlapping or incomplete operations, as shown in the expression in Equation (23). In addition, to ensure that the MESS has enough time for node switching and charging/discharging preparation after the completion of the last charging/discharging operation, the constraints of Equation (24) also need to be satisfied [33].
T o n n < T e n d n , n = 1,2 , , N
T e n d h + T t o t a l M E S S h + T r e < T o n h + 1 , h = 1,2 , , N 1
where T o n n and T e n d n are the start and end time of the n th charge and discharge; N is the number of charges and discharges in a day; T 0 is the charge and discharge preparation time; N p is the scheduling cycle; and T t o t a l M E S S h is the travel time of the h th charging and discharging node transition.

3.7. Power Balance Constraint
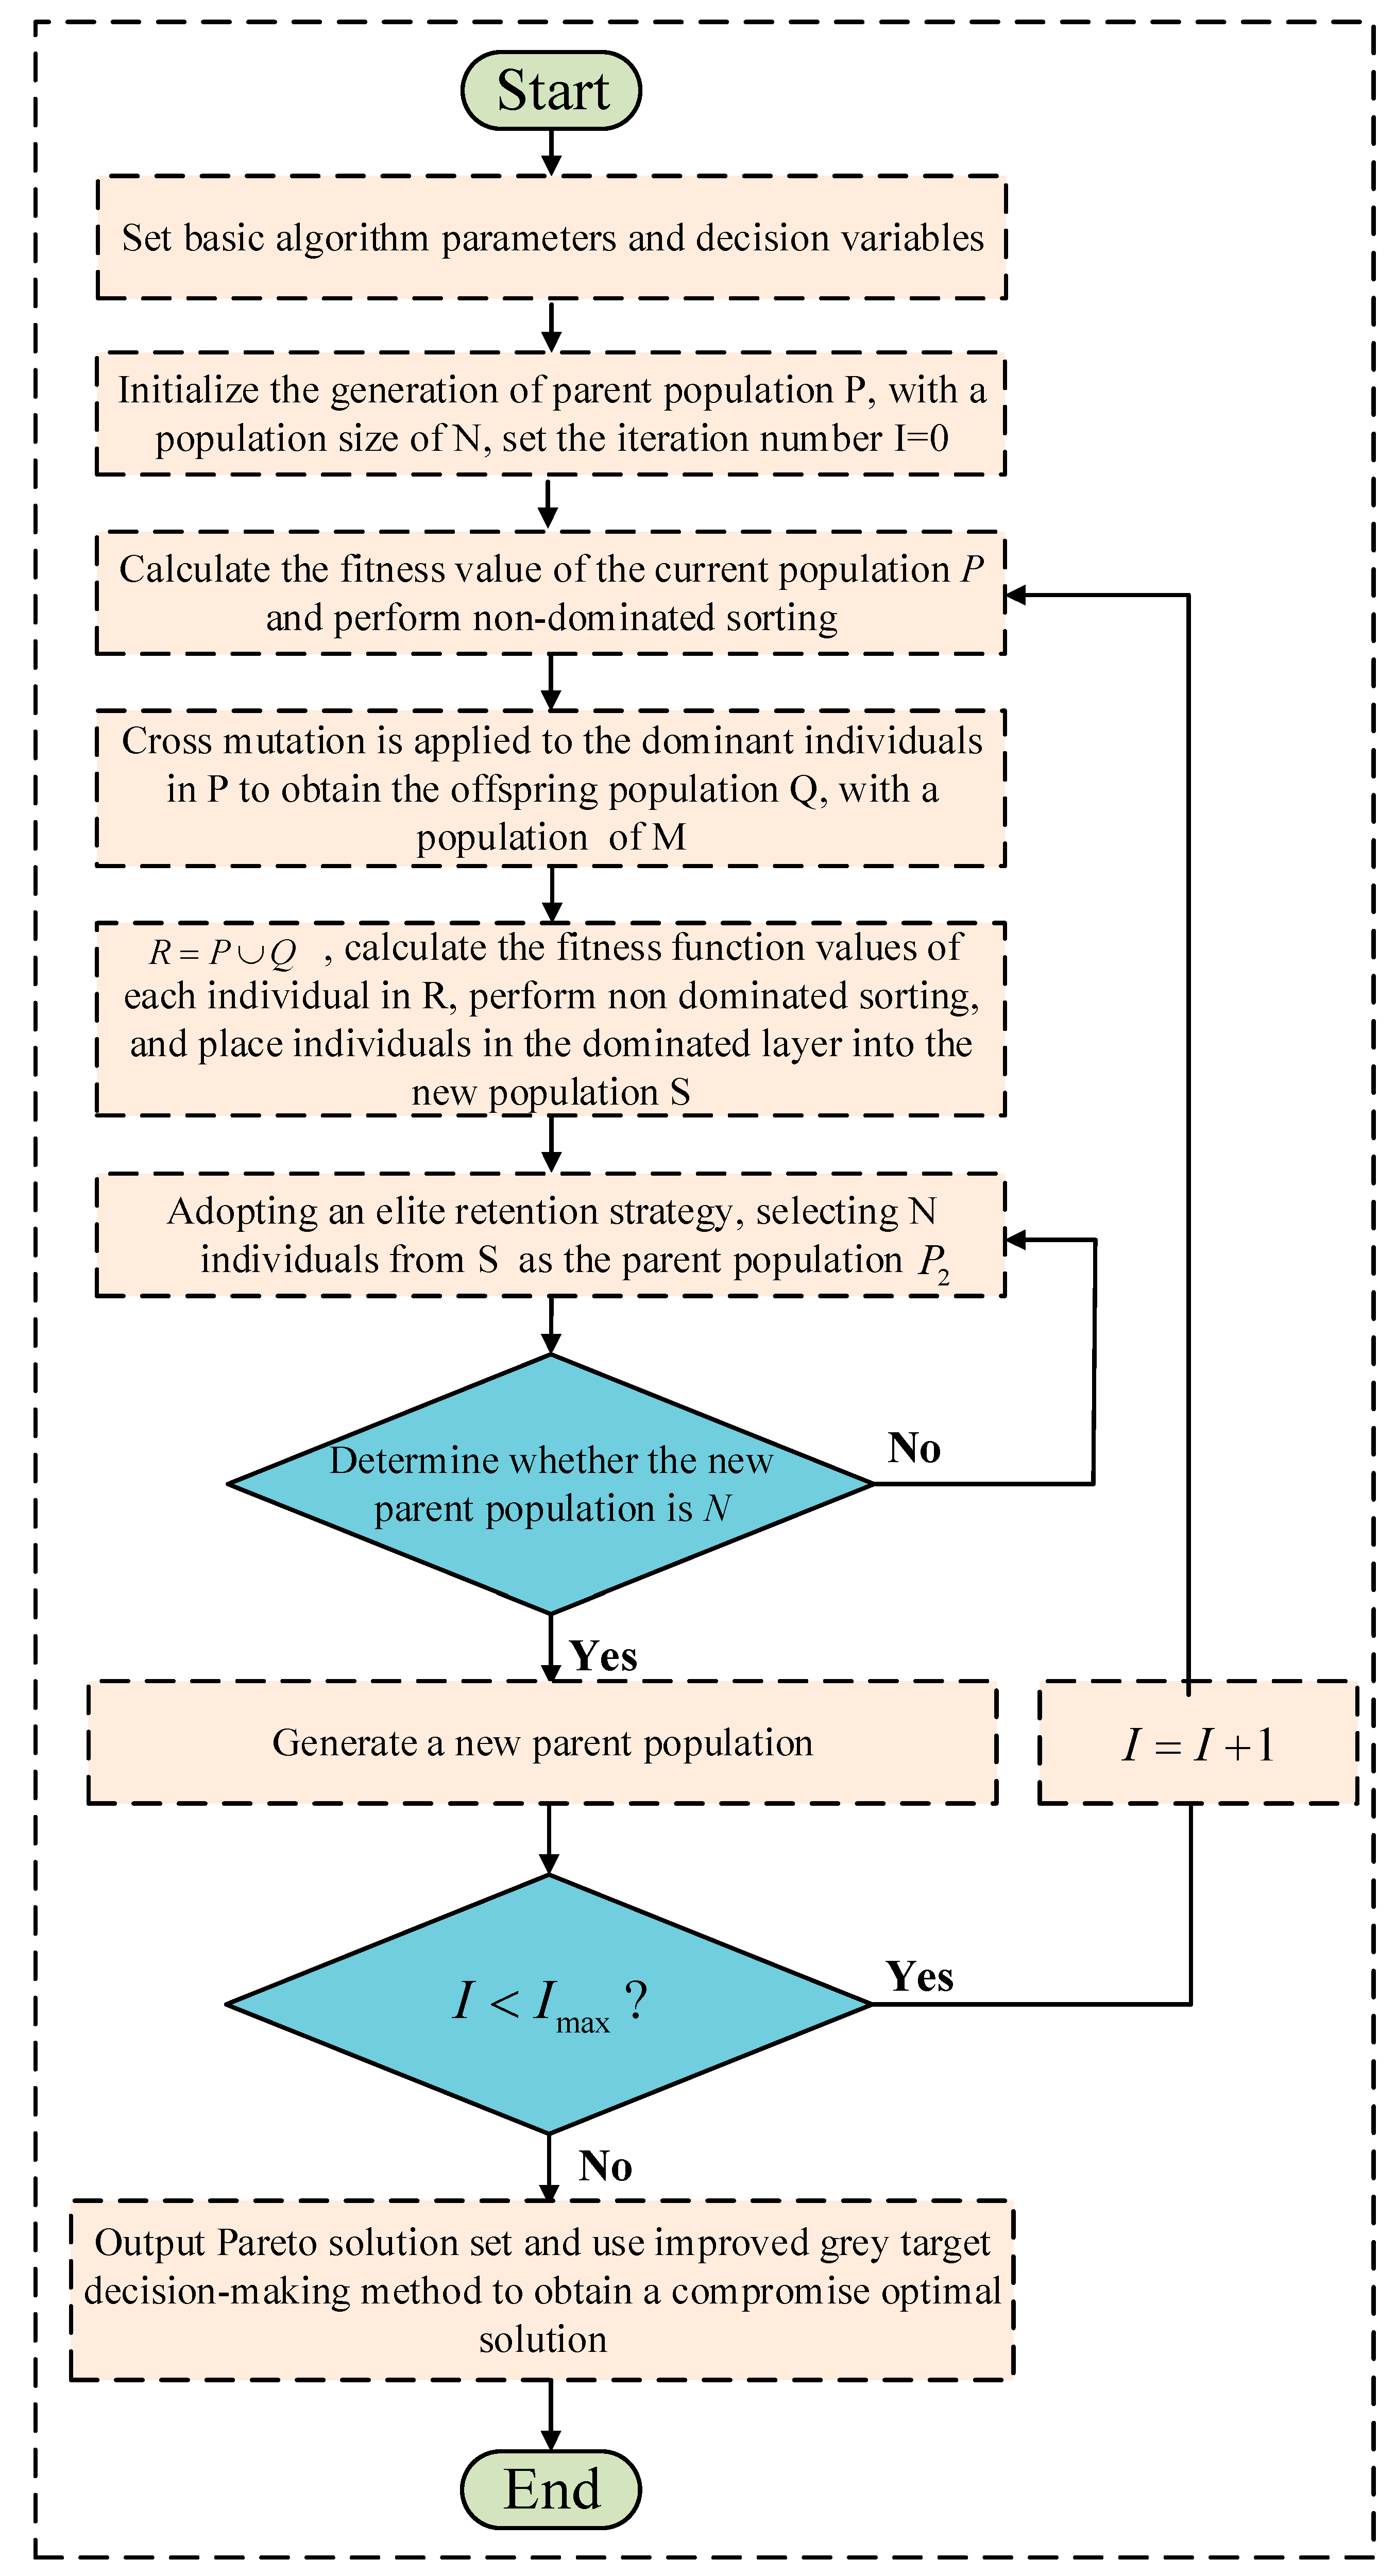
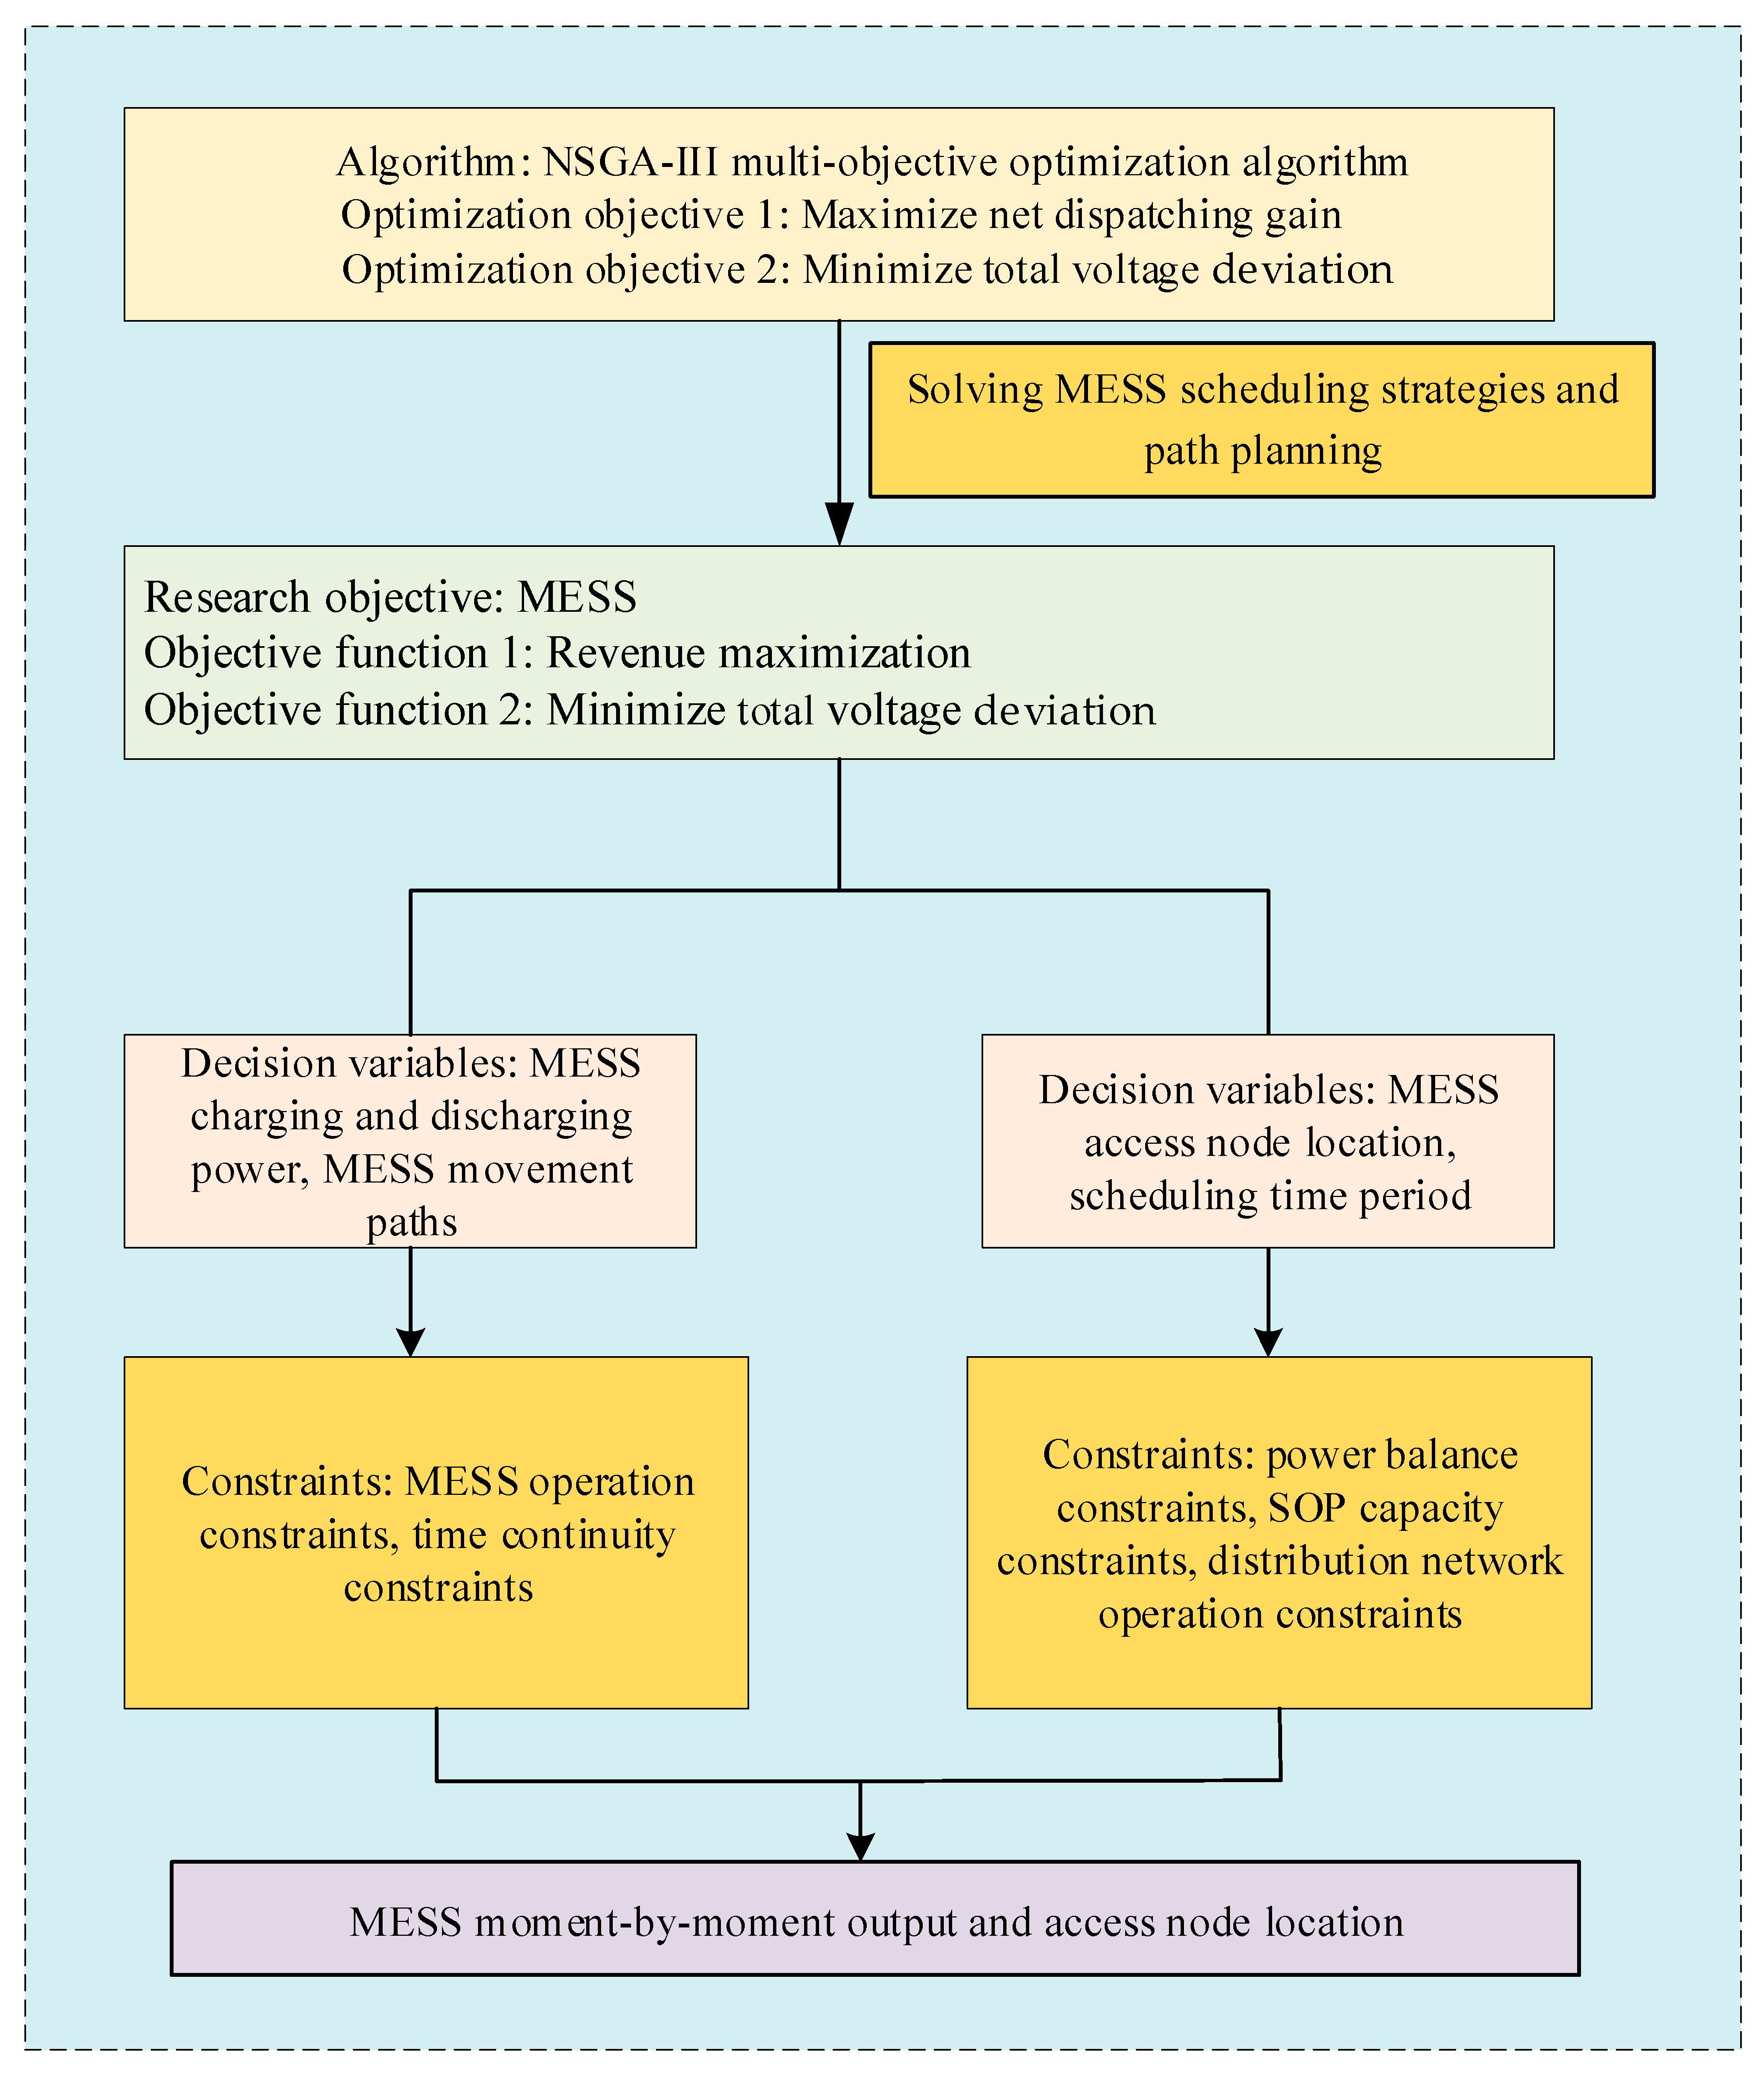
Maintaining power balance is a fundamental requirement to ensure stable system operation [34]. The specific expressions are as follows:
a = 1 N M E S S P d , a M E S S + j = 1 N P V P PV , j t + l = 1 N W T P WT , l t + P g t = P load t + P loss t + a = 1 N M E S S P c , a M E S S
where P g t is the supply power of the grid; P loss t is the loss power; P PV , j t and P WT , l t are the output power of PV and WT; P load t is the load demands; and N P V and N W T are the numbers of PV and WT.

4. Model Solution

In this study, the decision variables of the optimization problem include continuous variables (e.g., the charging and discharging power of the MESS and the active and reactive power outputs of the SOP) and integer variables (the access node location of the MESS). There are nonlinear terms in the objective function (e.g., the minimization of total voltage deviation) and some constraints (e.g., power balance constraints, voltage–current constraints, etc.), and, since the optimization problem contains both continuous and integer decision variables, the problem belongs to Mixed-Integer Nonlinear Programming (MINLP). The solution of this problem is difficult to solve by traditional single-objective optimization algorithms and mathematical programming methods and usually requires the use of special optimization algorithms, such as NSGA-III (available via github) [35], which, as a multi-objective heuristic algorithm, has the advantages of strong optimization ability and fast convergence speed and is usually used for solving complex nonlinear problems. Therefore, NSGA-III is adopted in this paper to solve the MESS optimized scheduling model. In addition, the solution process of NSGA-III is shown in Figure 5.
Figure 6 presents a comprehensive optimization framework aimed at optimizing the dispatch strategy and path planning of an MESS by applying the NSGA-III multi-objective optimization algorithm. The framework has two core objectives: maximizing the net dispatch gain and minimizing the total voltage deviation, which together guide the optimization process.
The research objectives focus on the MESS and are achieved through two main objective functions: firstly, maximizing the revenue; and secondly, minimizing the total voltage deviation. To achieve these objectives, the framework defines a set of decision variables including the charging and discharging power of the MESS, the mobility path, the access node location, and the scheduling time period. These variables are the key parameters in the optimization process and can be adjusted to achieve the optimization of the objective function.
During the optimization process, several constraints also need to be considered to ensure the feasibility and practicality of the solution. These constraints include ESS operation constraints, time continuity constraints, power balance constraints, SOP capacity constraints, and distribution network operation constraints. These constraints ensure that the optimization process is feasible in practice and avoid producing impractical solutions.
Ultimately, this optimization framework enables the determination of the time-by-time outputs of the MESS and the location of the access nodes, which are the direct outputs of the optimization process and provide clear guidance for practical operation. The whole framework provides a systematic solution for the scheduling and path planning of the MESS by comprehensively considering the objective function and constraints, aiming to improve the operational efficiency and economic benefits of the system.

5. Case Study

The algorithms in this paper are validated using MATLAB (MATLAB is a widely used high-performance numerical computation and visualization software that provides an easy-to-understand and -use programming environment that is particularly well suited for technical computing) for simulations on a computer with an Intel Core i9-13900KF processor (3.00 GHz) and 128 GB of RAM. The MATLAB version number is 2022a. The time taken to solve the model using NSGA-III was 6476 s.

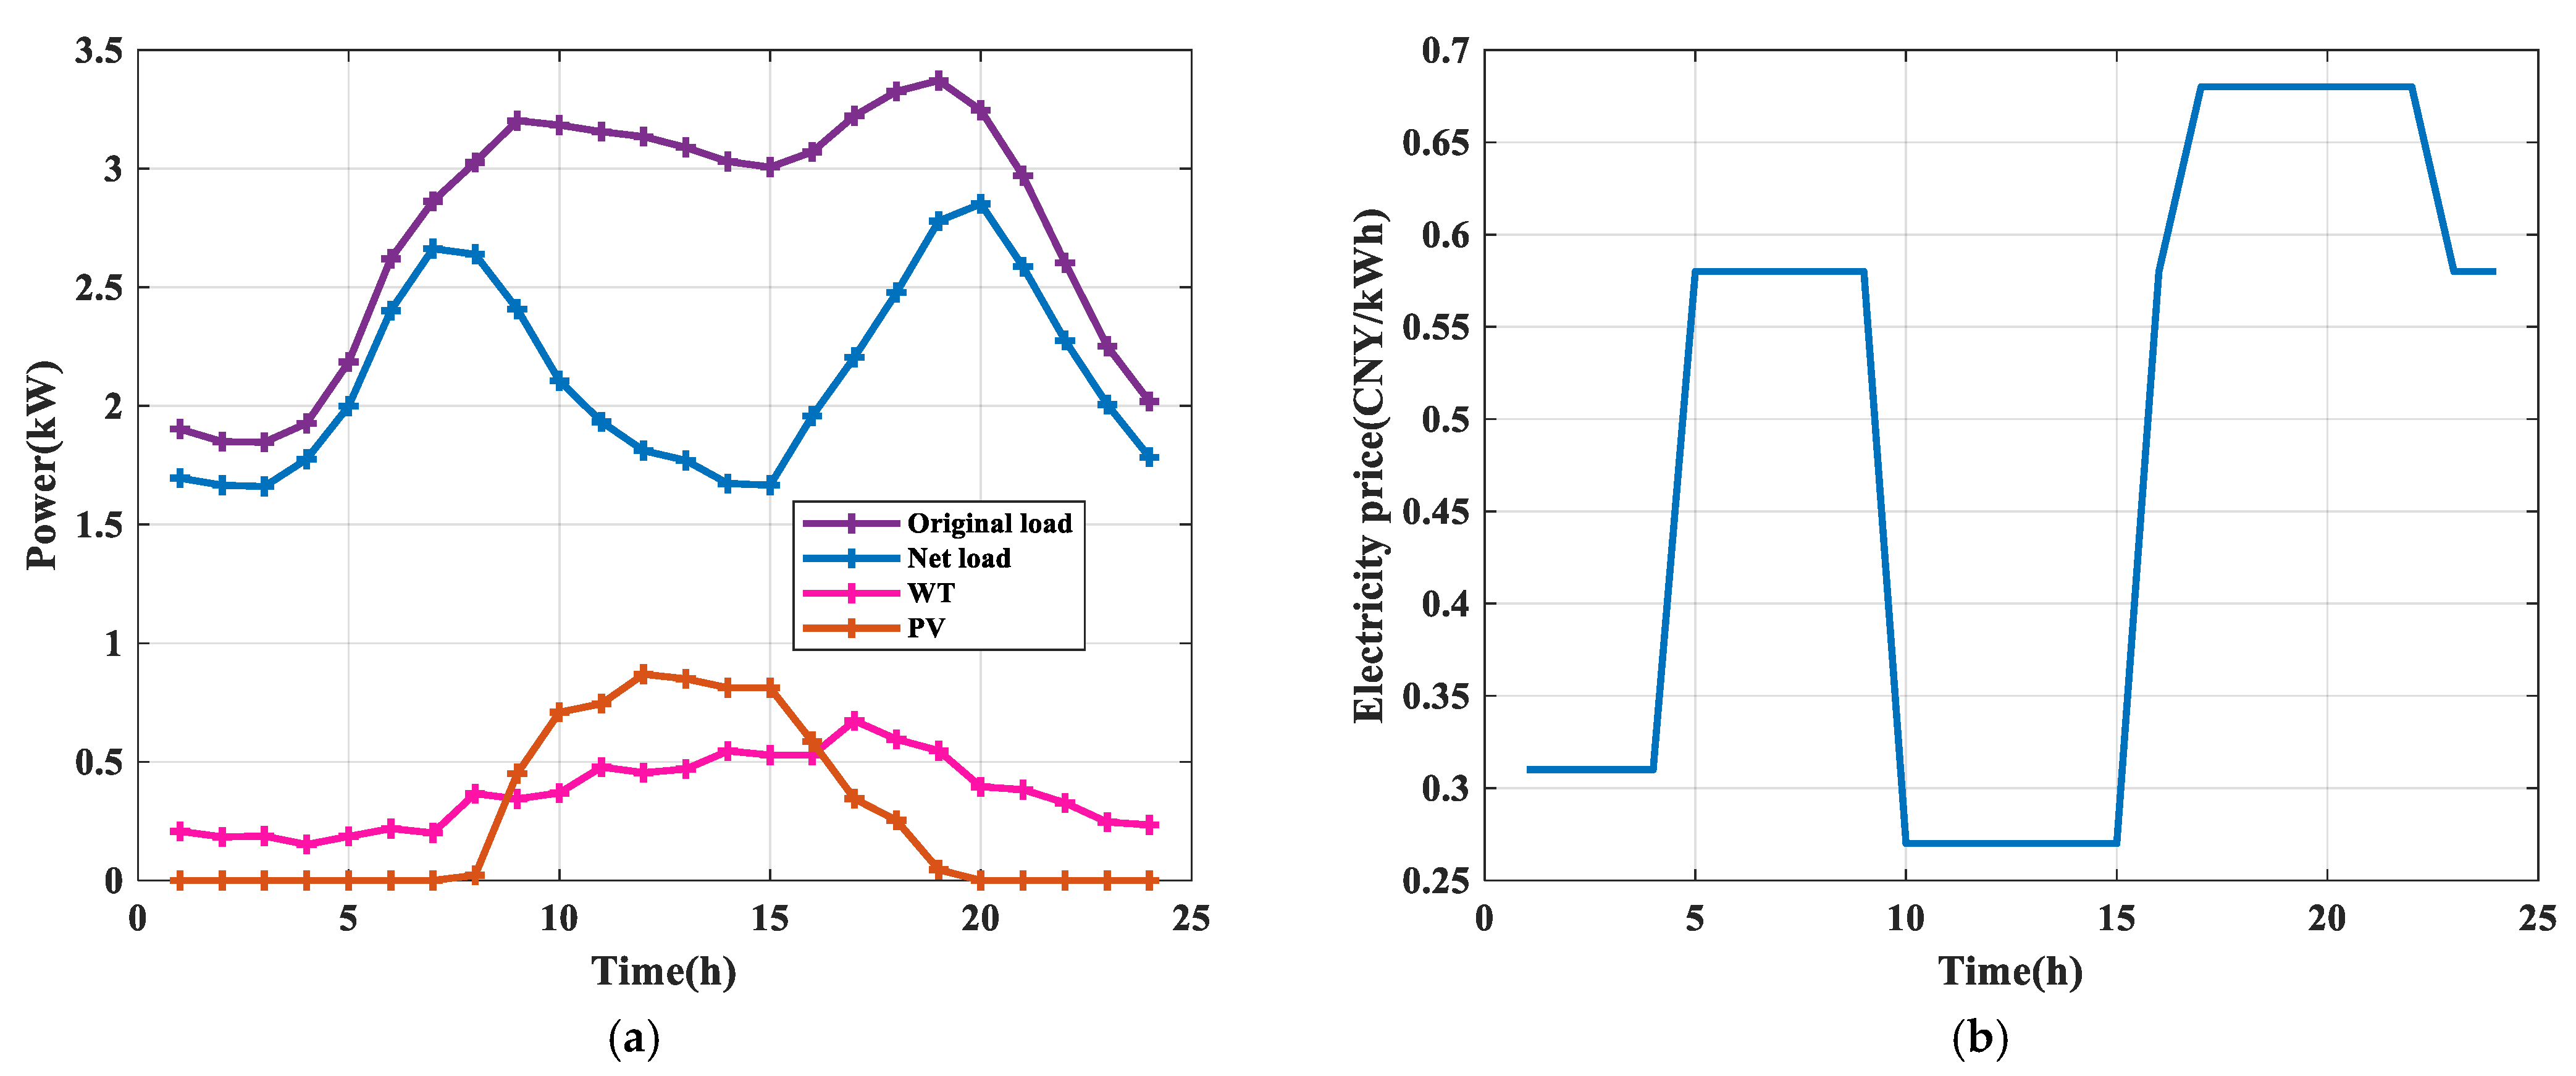
5.1. Parameter Settings

In this paper, the road network in some areas of Chengdu City, Sichuan Province, China, is coupled with the IEEE-33 standard grid to verify the effectiveness of the scheduling scheme in this paper. The predicted 24 h original load, net load, and WT and PV power output curves of the grid are shown in Figure 7a. Specifically, P W T 1 + P W T 2 = P W T , P P V 1 + P P V 2 = P P V , P W T 1 = P W T 2 , and P P V 1 = P P V 2 . In order to prolong the battery life, the SOC is set in the range of 0.1 to 0.9, and a one-charging–one-discharging strategy is adopted. The rated power of the MESS is 300 kW, and the rated capacity is 1200 kWh. The allowable range of the grid voltage is [0.95, 1.05]. The time-sharing tariff data are shown in Figure 7b. The road network road data are shown in Figure 8. The scheduling period is one day and the day is divided into 24 time slots. The NSGA-III and multi-objective stochastic paint optimizer (MOSPO) algorithm parameters are set as shown in Table 1. The system parameters are set as shown in Table 2.

5.2. Cost–Benefit Analysis

Figure 9 shows the TOU, as well as the power variation, of the MESS at different time periods. From the figure, it can be seen that when the TOU tariff is at a low level, the MESS starts the charging mode to actively store power, while, when the tariff rises to a high level, the MESS switches to the discharging mode to release the stored power. This flexible charging and discharging strategy enables the MESS to effectively utilize electricity price fluctuations for arbitrage, thereby reducing the overall cost of the electricity and improving energy utilization efficiency.
As shown in Table 3, through the synergistic scheduling of the MESS and SOP, the arbitrage revenue is CNY 425.84, accounting for 90.7% of the total revenue, which is the main component of the revenue. In addition, the revenue from the reduction in the grid network loss is CNY 43.50, which accounts for a relatively low percentage. In addition, the total cost of dispatch is CNY 245.3. In this case, the MESS has a travel path of 1 38 39 40 39 38 1 and a travel distance of 19.62 km, and its travel cost is CNY 25.51. After considering the costs and benefits together, this collaborative optimization scheduling strategy achieves a combined net benefit of CNY 223.91. It illustrates the economic feasibility of the MESS and SOP co-optimized scheduling strategy and highlights the key role of power arbitrage and grid loss reduction in improving economic efficiency.
Compared to the scenario without integrating the SOP and MESS into the grid, the inclusion of these technologies has introduced additional costs. However, the economic benefits generated by their integration are significantly higher than the associated costs. Specifically, the total cost incurred by incorporating the SOP and MESS into the grid is CNY 245.3. In contrast, the combined net benefit achieved through their joint scheduling amounts to CNY 223.91. The ratio of net benefit to cost is 0.91 (223.91/245.3 ≈ 0.91). The ratio is close to 1, indicating that the benefits are almost equal to the costs, highlighting the great economic advantages and feasibility of the joint scheduling of the SOP and MESS.

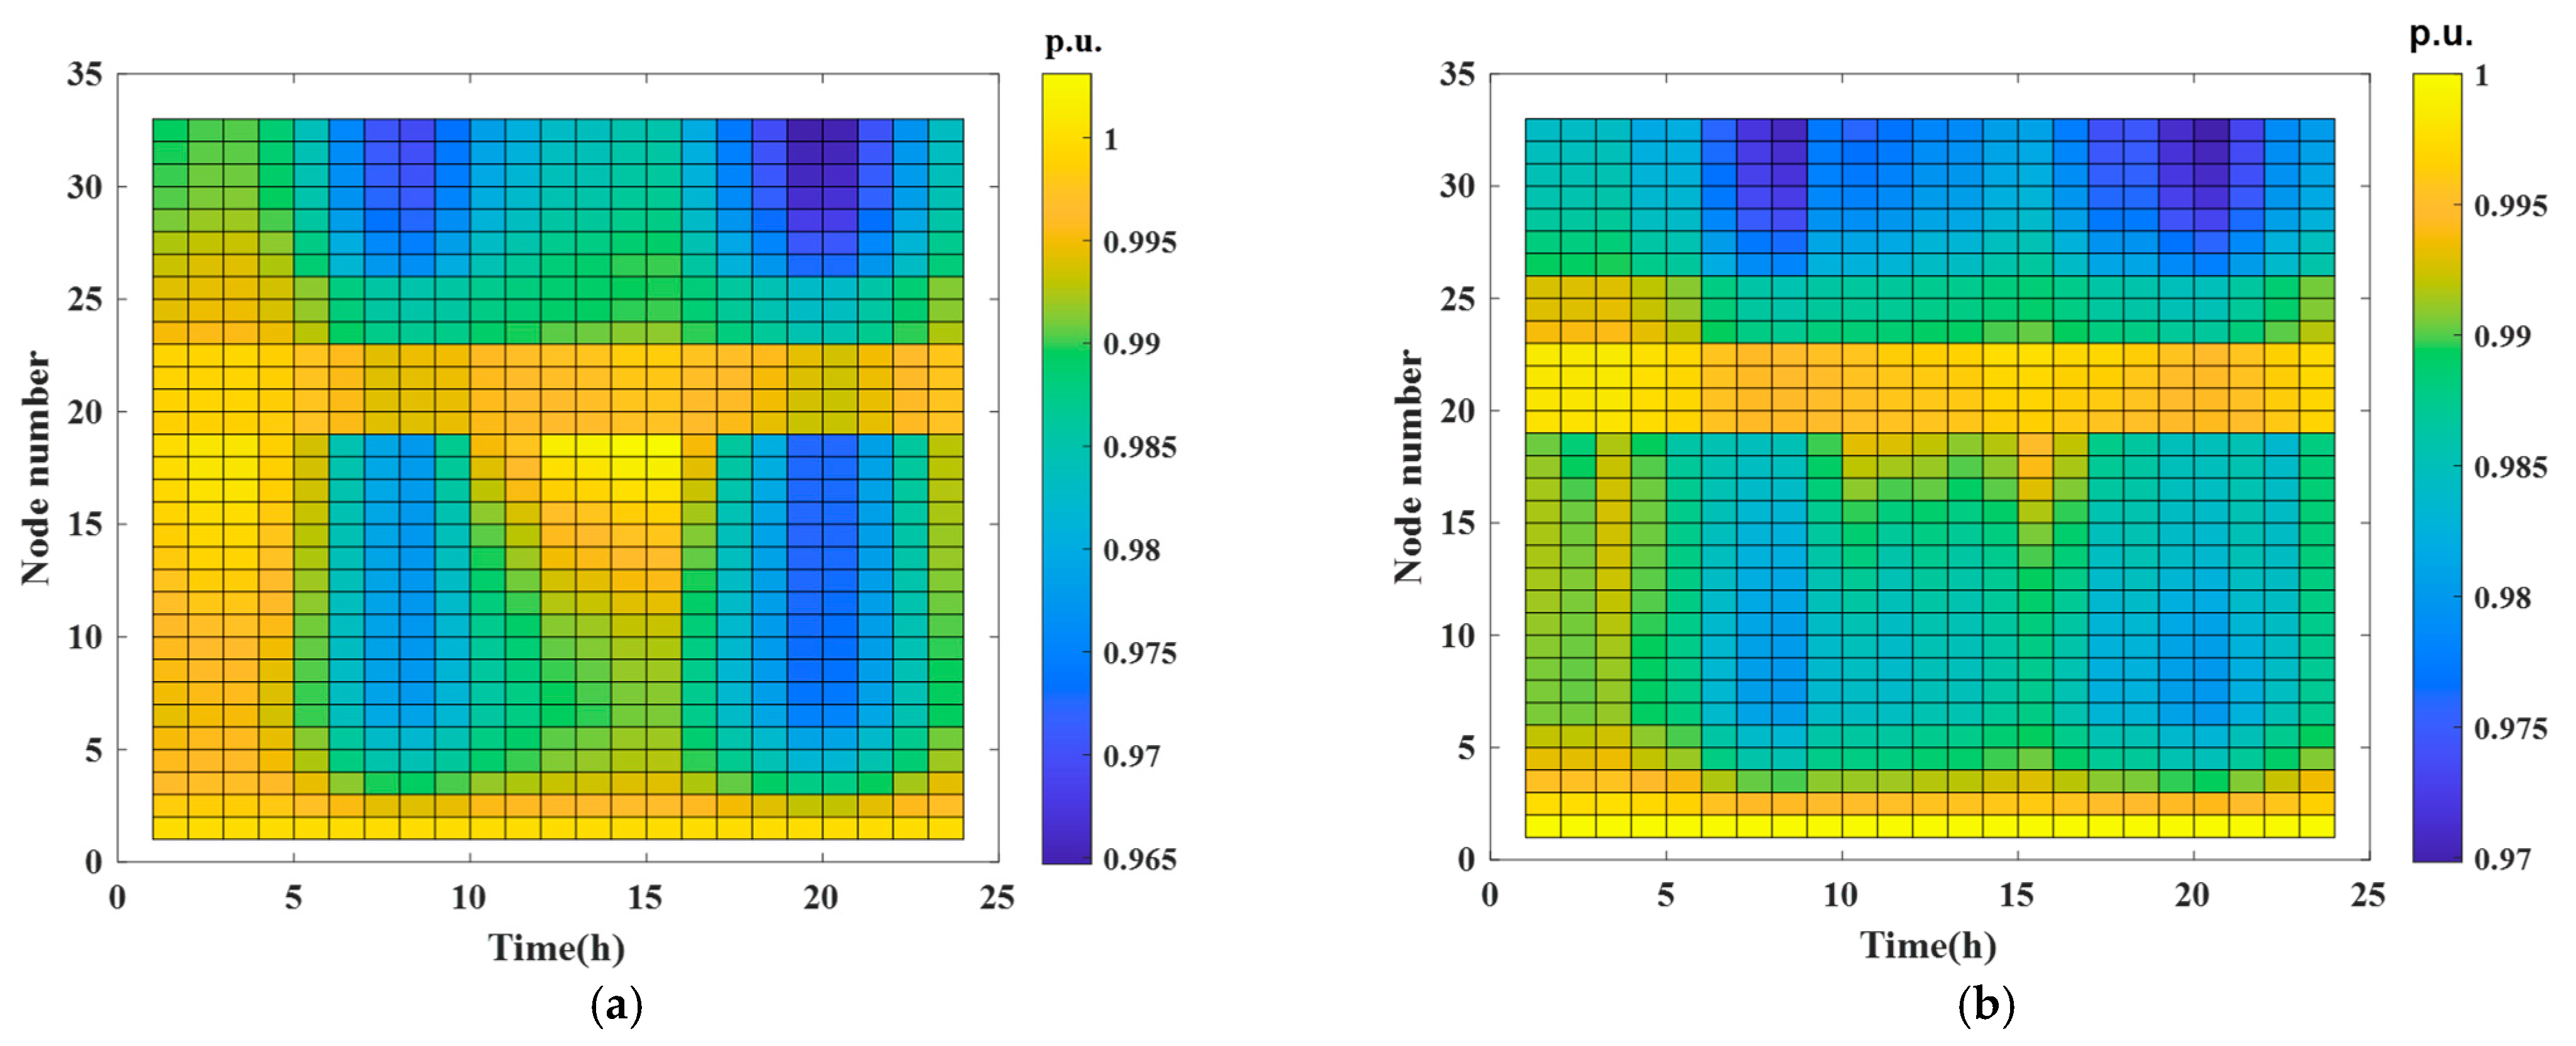
5.3. Grid Stability Analysis

The net load curves before and after the MESS and SOP scheduling are shown in Figure 10, which shows that the fluctuation of the net load curves is significantly reduced after adding the MESS and SOP optimized scheduling, and the peak-to-valley difference is reduced from 1.191 MW to 0.941 MW, which is a decrease of 20.1%. It shows that compared to the case without access to the MESS and SOP, access to the MESS and SOP can effectively reduce the peak-to-valley difference of the grid, smooth the net load curve, and improve the stability of the grid.
In order to evaluate the performance of NSGA III, the benchmark problems for the Schaefer function (SF), Rastrigin function (RF) and generalized Schwefel function (GSF) (refer to the literature [36] for the exact formulations) were solved using MOSPO, PESA-II, and NSGA III and then compared. All the problems are configured as two-dimensional, i.e., each objective function considers minimizing two decision variables (x1 and x2). The algorithms were tested under 100 iterations and a population size of 80.
The optimization results are shown in Table 4. The performance of the three algorithms (PESA-II, MOSPO, and NSGAIII) is compared when solving three benchmark problems (Schaffer’s function, Rastrigin’s function, and the generalized Schwefel’s function). The results show that the NSGAIII algorithm achieves the optimal solution (0) on all the problems tested, while the MOSPO algorithm performs better on the SF and RF problems but is slightly inferior to PESA-II on the GSF problem. The PESA-II algorithm performs the worst on the GSF problem.
In solving the model of this paper, two better performing algorithms are selected to solve the model and the results are compared. As shown in Figure 11, the Pareto front results of the NSGA-III and MOSPO solving are shown. During the algorithm solving, the algorithm solving ends when the maximum number of iterations is reached. Subsequently, the algorithm is analyzed for convergence based on the obtained Pareto solution set. When the Pareto front is uniformly distributed and stable, the algorithm converges. Comparing Figure 11a,b, it can be seen that the solution obtained by the NSGA-III solving is superior to the solution obtained by the MOSPO solving, both from the point of view of the voltage deviation and the net gain of scheduling.
In addition, further analysis of Figure 11 shows that, when the total voltage deviation decreases, the corresponding dispatch gain also decreases, indicating that, in order to improve the stability of the grid, it is inevitably necessary to sacrifice some of the economics.
As shown in Figure 12, the SOP can achieve the continuous regulation of the active and reactive powers. From 01:00 to 10:00, the MESS is not connected to the grid and the SOP works alone to reduce grid losses and the total voltage deviation. For example, at 3:00, when the grid is not connected to the MESS and SOP, the grid loss is 0.0303 MW and the node voltage deviation is 0.00290, whereas, after connecting to the SOP, the grid loss and voltage deviation are 0.0261 MW and 0.00185 p.u., which are decreased by 14% and 36%, respectively, compared to the values without connecting to MESS and SOP.
The power and SOC changes of the MESS are shown in Figure 13. From 11:00 to 15:00, when the electricity price is low and the PV output is at its peak, the MESS is transferred in advance from road network node 1 to road network node 40 and connected to grid node 13 to reduce the local curtailment of PV power and to reduce the voltage deviation in the area where grid node 13 is located. From 18:00 to 21:00, when the electricity price is high and the electricity consumption load is at its peak, the SOP and the MESS work together to reduce the peak electricity consumption load to reduce grid losses and the voltage deviation. Finally, the MESS returns to road network node 1.
As shown in Figure 14, after the grid is connected to the MESS and SOP, the minimum value of the voltage is significantly improved, while the maximum value is decreased. This change makes the voltage distribution of the whole system become more centralized and effectively reduces the voltage fluctuation range. Specifically, the total voltage deviation of the grid was significantly reduced from 0.1999 p.u. to 0.0941 p.u., a reduction of 52.9%. This significant improvement not only optimizes the voltage quality but also enhances the stability of the grid and reduces the potential risks associated with voltage fluctuations. Combined with the data in Table 2, it can be seen that the synergistic scheduling of the mobile energy storage system and the soft switching points can effectively ensure the stable operation of the power grid while realizing significant economic benefits. This collaborative optimization strategy plays a key role in improving the efficiency and economy of the grid operation and provides strong support for the efficient operation of modern distribution grids. In addition, this strategy also provides more reliable grid support for the access of high-penetration distributed energy sources, which further promotes the wide application of renewable energy.
Compared to the case without the MESS and SOP co-dispatch, the inclusion of the MESS and SOP co-dispatch not only reduces the net load peak-to-valley difference but also reduces the total voltage deviation of the grid during the peak period of load and renewable energy generation, thus effectively improving the stability of the grid. This strategy ensures that the grid can operate more efficiently and stably while supporting the wide application of renewable energy.

6. Discussion

Previous studies have emphasized the challenges posed by the increasing prevalence of renewable energy sources in power systems, especially their stochastic and intermittent nature, which can lead to severe grid instability. The integration of an MESS and an SOP has been demonstrated to be effective in addressing these challenges by providing flexible power distribution and voltage regulation.
Previous studies have mainly focused on the deployment of MESSs or SOPs individually rather than their combined use. For this reason, this paper proposes a framework for co-scheduling the MESS and SOP to fully utilize the respective advantages of SOPs and MESSs. The simulation results show that the joint scheduling of the MESS and SOP not only significantly reduces network losses and voltage deviations but also achieves considerable benefits.

7. Conclusions

To cope with the high penetration of renewable energy in the grid and to ensure the economy and stability of the grid, this paper proposes an MESS and SOP co-scheduling model, which provides a new solution for the efficient operation of modern distribution networks. The main findings and conclusions of this paper are as follows:
(1)
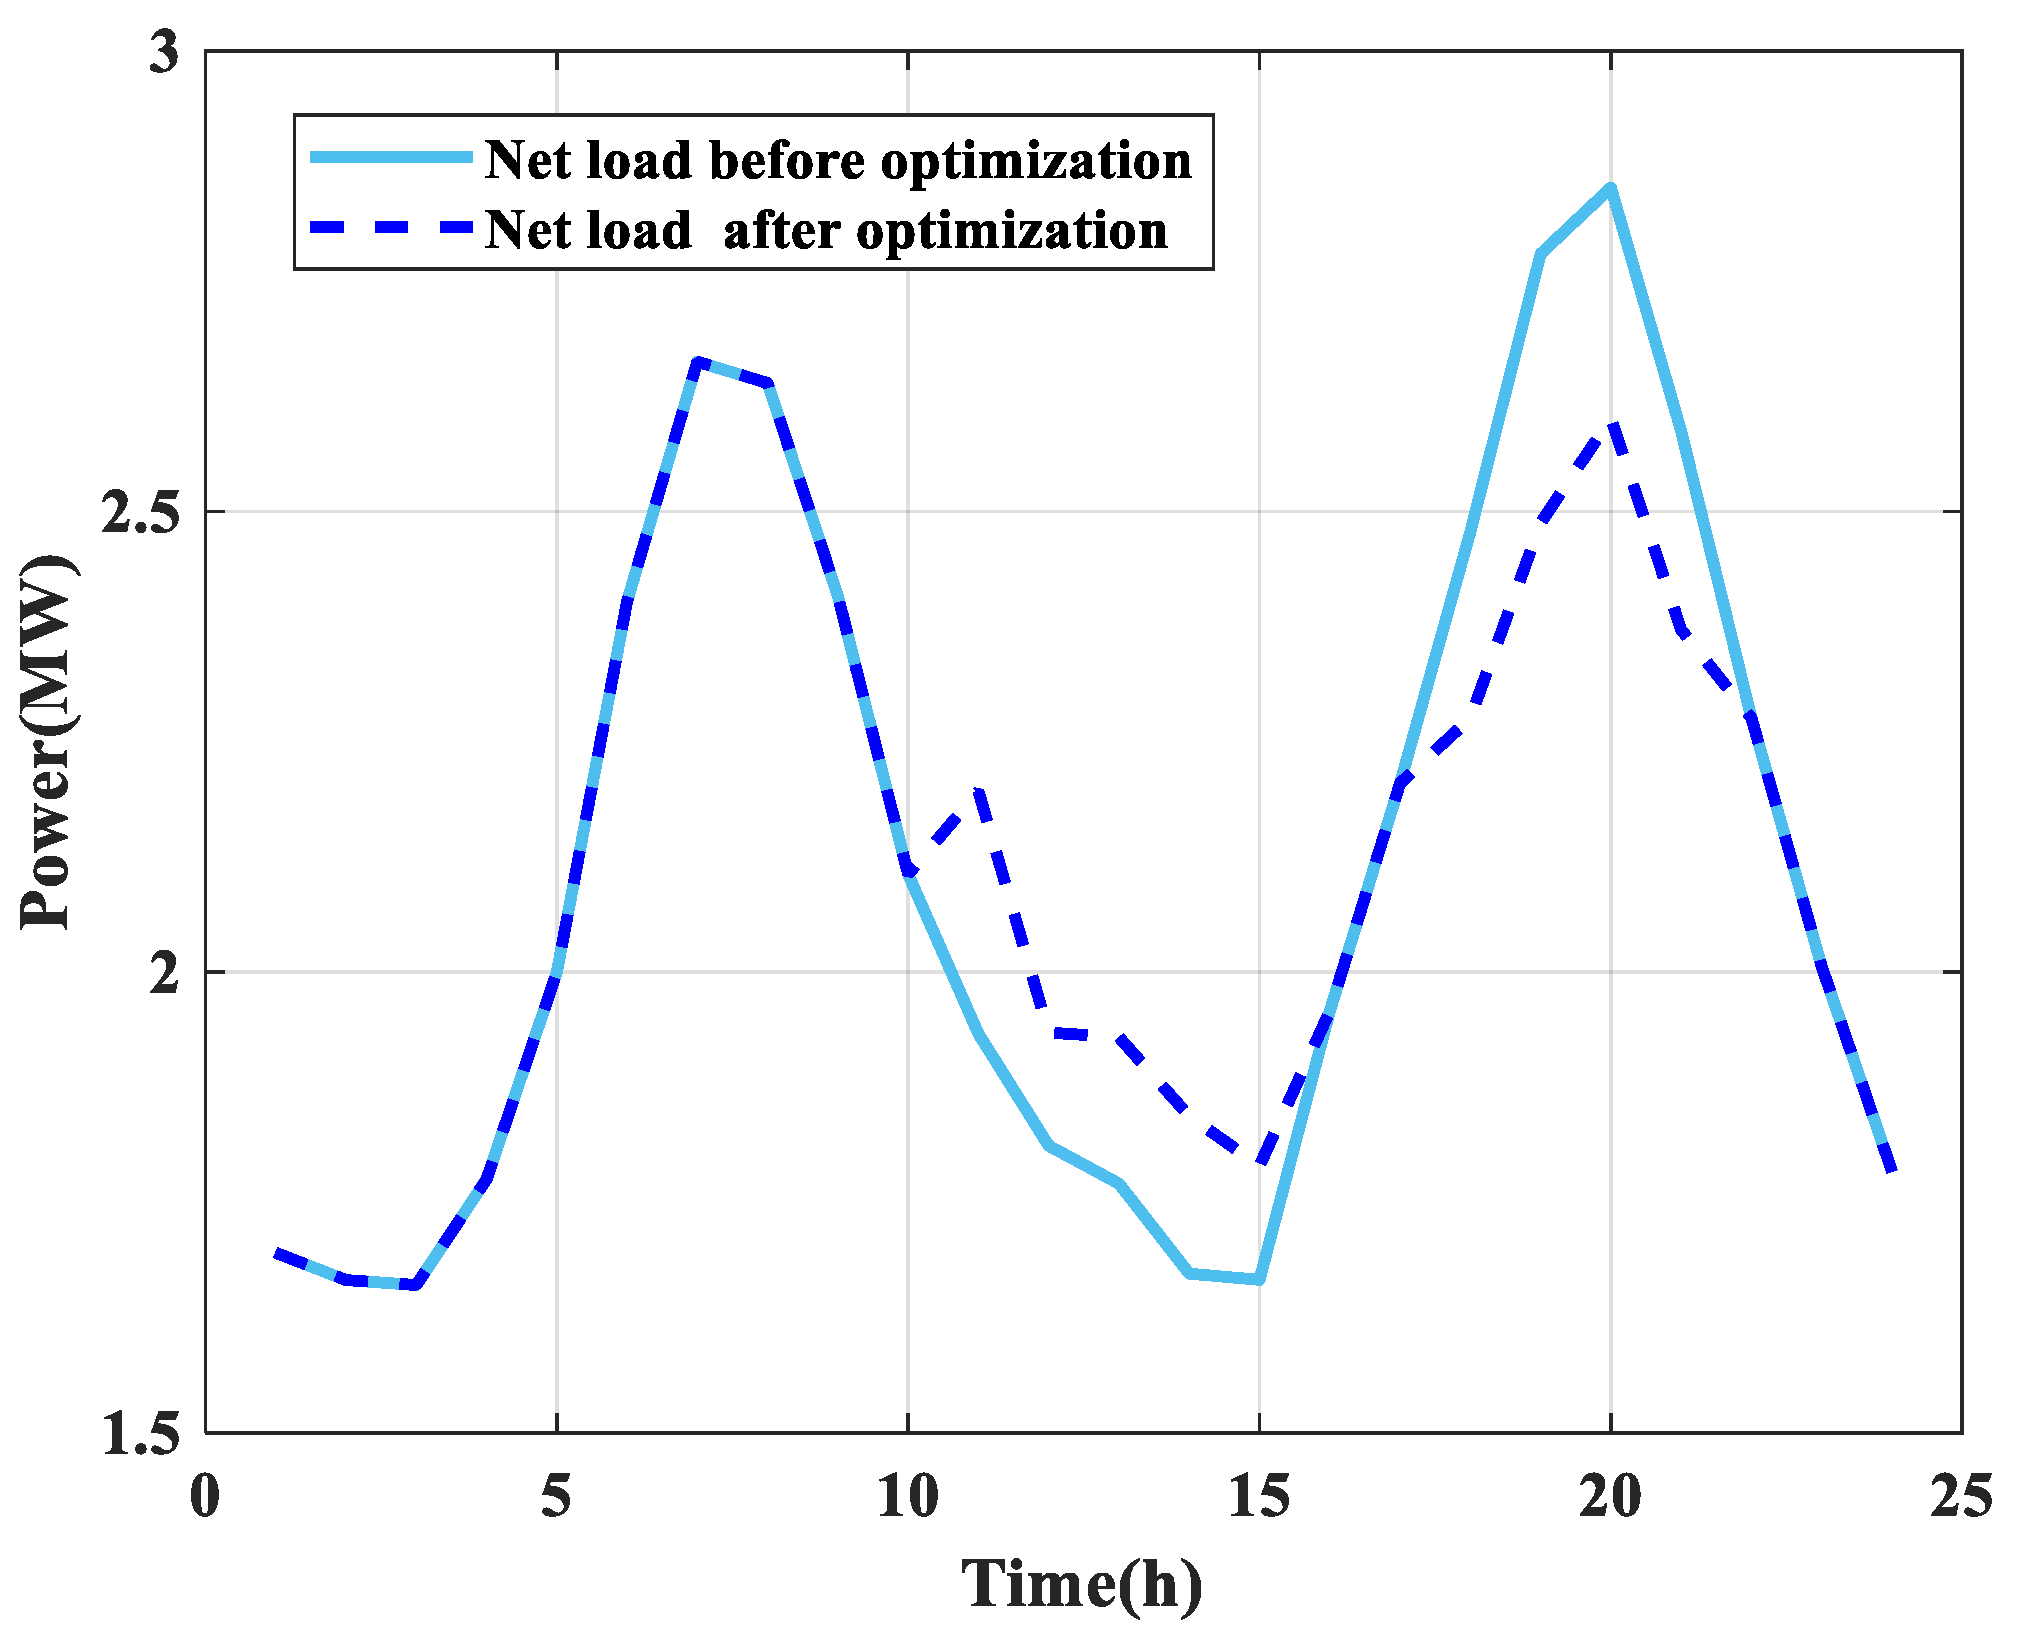
Through the cooperative scheduling of the MESS and SOP, the peak-to-valley difference of the grid is reduced by 20.1% and the total voltage deviation is reduced by 52.9%, compared to a scenario without the MESS and SOP. This not only effectively promotes the consumption of renewable energy but also achieves significant economic benefits (mainly from the arbitrage income of the MESS, accounting for about 90.7%), while ensuring the stability of the grid. The dual enhancement of economy and stability provides strong support for the sustainable development of the distribution network.
(2)
An SOP can effectively compensate for the limitation that a MESS cannot be continuously connected to the power grid. When not connected to the MESS, the SOP can operate independently, effectively reducing grid losses and voltage deviations, thereby continuously ensuring the economy and stability of the grid. During periods of peak load or high renewable energy generation, the MESS and SOP are jointly dispatched to not only enhance the system stability but also reduce network losses, utilizing the MESS for arbitrage. This not only improves the operational quality of the grid but also provides more reliable grid support for the access of high-penetration distributed energy sources and further promotes the widespread application of renewable energy.
Although this study has achieved some results in the cooperative scheduling of MESSs and SOPs, there are still some deficiencies. For example, although this study mentions the use of road network data in Chengdu and the planning of MESS travel paths by Dijkstra’s algorithm, it does not consider the actual traffic conditions. However, these factors may lead to an increase in the actual traveling time of the MESS, which affects its dispatch efficiency among the grid nodes. Moreover, this study lacks a sensitivity analysis of renewable energy volatility and forecast errors, which may limit the robustness of the dispatch strategy in actual grid operation. Meanwhile, this study lacks a consideration of real-time dispatch, and the proposed model needs further validation and testing in terms of applicability and scalability. In addition, due to the limitations of MESS power and capacity, the strategy in this paper is more suitable for localized regulation and distributed energy management within the grid. For large-scale grid regulation, it may need to be combined with other types of energy storage systems or demand-side management measures. Furthermore, this study could further improve its analysis of the cost–benefit calculations arising from the application of an MESS and its charging/discharging processes, and it overlooks the efficiency of SOPs, both of which may impact the economic outcomes.
To address these shortcomings, future research directions will include the following: introducing a sensitivity analysis of real-time traffic data and renewable energy forecast errors to improve the practicality and robustness of the dispatch strategies; exploring the integration of real-time data and dynamic adjustment mechanisms into existing dispatch strategies to achieve more flexible and responsive grid management; exploring more advanced scheduling algorithms, such as deep reinforcement learning, to further improve the optimization efficiency and adaptability; expanding this study to larger scale and more complex grid systems to validate the effectiveness and scalability of the model in complex scenarios; conducting a more comprehensive analysis of the economic issues related to the MESS application and its charging/discharging processes, including factors such as truck wear-and-tear costs, and taking into account the efficiency of SOPs to more accurately assess economic outcomes; and exploring the integration of MESSs with fixed energy storage systems to enhance large-scale grid regulation capabilities, achieving high-capacity storage and rapid response.

Author Contributions

Conceptualization, Y.J.; methodology, L.C.; validation, Y.Z.; formal analysis, C.X.; investigation, W.W.; writing—original draft preparation, Y.J.; and writing—review and editing, Y.J. and J.Z. All authors have read and agreed to the published version of the manuscript.

Funding

This work was supported by the Science and Technology Project of State Grid: research on technology to improve active consumption and collaborative management and control capabilities of high-proportion distributed resources based on virtual power plants (no. SGZJNB00HWJS2200981).

Data Availability Statement

The data are contained within the article.

Conflicts of Interest

Author Lei Chen was employed by the company State Grid Zhejiang Electric Power Company. The remaining authors declare that the research was conducted in the absence of any commercial or financial relationships that could be construed as a potential conflict of interest.

Nomenclature

Abbreviations C s o p Running cost of SOP
DGDistributed generation C t TOU electricity price
ESSEnergy storage system P l o s s , b t Active loss of line b before optimization at time t
MESSMobile energy storage system P l o s s , b t Optimized active loss of line b at time t
NSGA-IIINon-dominated sorting genetic algorithm III λ b Degradation cost factor
PVPhotovoltaic σ Unit distance cost factor
SMIPStochastic mixed-integer programming D a t Distance travelled by the a th MESS at time t
SOCState of charge F 2 Total voltage deviation
SOPSoft open point V a t Voltage value at the a th node at time t
TOUTime-of-use n Grid Total number of nodes in the grid
VSCVoltage source converter P S , i t Active power injected by SOP at node i at time t
WTWind turbine Q S , i t Reactive power injected by SOP at node i at time t
Variables S S , i j SOP rated capacity between nodes i and j
P c , a M E S S t Charging power of the a th MESS at time t Q S , i , m a x SOP reactive power max at node i
P d , a M E S S t Discharge power of the a th MESS at time t Q S , i , m i n SOP reactive power min at node i
P r , a M E S S Power rating of the a th MESS Q S , j , m a x SOP reactive power max at node j
E a M E S S t SOC of the a th MESS at time t Q S , j , m i n SOP reactive power min at node j
η C Charging efficiency P i t Active power at node i at time t
η D Discharge efficiency Q i t Reactive power at node i at time t
S o C m i n Minimum value of the SOC V j t Voltage amplitude at node i at time t
S o C m a x Maximum value of the SOC θ i j t Voltage phase difference between nodes i and j at time t
T o n n Start time of the n th charge/discharge G i i Self-conductance of node i
T e n d n End time of the n th charge/discharge B i i Self-conductance of node i
T t o t a l M E S S h Travel time of the h th charging and discharging node transition G i j Mutual conductance between nodes i and j
T 0 Preparation time for charging and discharging B i j Mutual electrodynamics between nodes i and j
N p Total time frame for daily movement control P D G , i P r e DG predicted active power at node i at time t
F 1 Net movement gains β D G , i DG power factor angle at node i at time t
M d Economic gains from MESS charge/discharge arbitrage S D G , i ( t ) DG rated capacity of node i at time t
M l Economic gains from reduced network losses I i j ( t ) Current amplitude of line i j at time t
C b Costs of MESS battery performance degradation V i , m i n Minimum value of voltage at node i
C d Cost of traveling for MESS V i , m a x Maximum value of voltage at node i

References

  1. Yang, B.; Yu, L.; Chen, Y.; Ye, H.; Shao, R.; Shu, H.; Yu, T.; Zhang, X.; Sun, L. Modelling, applications, and evaluations of optimal sizing and placement of distributed generations: A critical state-of-the-art survey. Int. J. Energy Res. 2021, 45, 3615–3642. [Google Scholar] [CrossRef]
  2. He, X.; Ai, Q.; Wang, J.; Tao, F.; Pan, B.; Qiu, R.; Yang, B. Situation awareness of energy internet of things in smart city based on digital twin: From digitization to informatization. IEEE Internet Things J. 2023, 10, 7439–7458. [Google Scholar] [CrossRef]
  3. Hu, Y.; Yang, B.; Wu, P.; Wang, X.; Li, J.; Huang, Y.; Su, R.; He, G.; Yang, J.; Su, S.; et al. Optimal planning of electric-heating integrated energy system in low-carbon park with energy storage system. J. Energy Storage 2024, 99, 113327. [Google Scholar] [CrossRef]
  4. Li, J.; Yang, B.; Huang, J.; Guo, Z.; Wang, J.; Zhang, R.; Hu, Y.; Shu, H.; Chen, Y.; Yan, Y. Optimal planning of electricity hydrogen hybrid energy storage system considering demand response in active distribution network. Energy 2023, 273, 127142. [Google Scholar] [CrossRef]
  5. Hosseinpour, J.; Rizvandi, O.; Braun, R. Enhancing thermal management in a reversible solid oxide cell system utilizing thermal energy storage. J. Energy Storage 2025, 114, 115806. [Google Scholar] [CrossRef]
  6. Hao, Y.; Xu, X.; Wang, F.; Wang, Y.; Du, J.; Wu, C.; Li, Q. Dynamic characteristics of gas-liquid type compressed CO2 energy storage system with focus on high-pressure liquid energy release process. Energy 2025, 316, 134502. [Google Scholar] [CrossRef]
  7. Yang, B.; Wang, J.; Chen, Y.; Li, D.; Zeng, C.; Chen, Y.; Guo, Z.; Shu, H.; Zhang, X.; Yu, T.; et al. Optimal sizing and placement of energy storage system in power grids: A state-of-the-art one-stop handbook. J. Energy Storage 2020, 32, 101814. [Google Scholar] [CrossRef]
  8. Yang, B.; Li, J.; Shu, H.; Cai, Z.; Tang, B.; Huang, X.; Zhu, M. Recent advances of optimal sizing and location of charging stations: A critical overview. Int. J. Energy Res. 2022, 46, 17899–17925. [Google Scholar] [CrossRef]
  9. Kim, S.; Joo, S. Spatiotemporal operation method for mobile virtual power line in power system with mobile energy storage systems. J. Energy Storage 2025, 108, 115196. [Google Scholar] [CrossRef]
  10. Su, J.; Chen, B.; Xiong, J.; Zhou, Y.; Qiang, D. Research on insulation coordination for back-to-back flexible modular multilevel converter high voltage direct current converter station. Electr. Eng. 2020, 21, 84–89. [Google Scholar]
  11. Liu, H.; Li, Q.; Zhang, Q.; Xu, Z.; Lu, S. Optimal dispatch of unbalanced distribution networks with phase-changing soft open points based on safe reinforcement learning. Sustain. Energy Grids Netw. 2024, 40, 101521. [Google Scholar]
  12. Xia, Z.; Ma, W.; Yang, D. Fault recovery strategy of active distribution network considering the coordination between islanding partition and three-terminal intelligent soft open point. J. Electr. Power Sci. Technol. 2024, 39, 124–133. [Google Scholar]
  13. Sun, C.; Li, J.; Yuan, K.; Song, G.; Ji, J.; Li, P. Two-stage optimization method of soft open point and energy storage system in distribution network based on interval optimization. High Volt. Eng. 2021, 47, 45–54. [Google Scholar]
  14. Pandzic, H.; Tomin, N.; Yang, D.; Tomin, N. Fault recovery of active distribution network considering translatable load and soft open point. J. Electr. Power Sci. Technol. 2024, 39, 183–192. [Google Scholar]
  15. Liu, W.; Dong, W.; Chen, Y.; He, S.; Chen, J.; Jia, D. Multi-objective optimization control strategy for soft open point in distribution network with high penetration of DG. Electr. Power 2025, 58, 85–92. [Google Scholar]
  16. Oleaoregui, E.; Eguia-López, P.; Sanchez-Ruiz, A.; Canas-Acena, J. Autonomous active power dispatching control of soft open points in distribution networks. IEEE Trans. Smart Grid 2025, 16, 2087–2099. [Google Scholar] [CrossRef]
  17. Lou, G.; Gu, Y.; Gu, W. Distributed restoration method for distribution networks based on the synergy of soft open points and traditional contact switch. Autom. Electr. Power Syst. 2025, 1–17. [Google Scholar] [CrossRef]
  18. Lu, Z.; Xu, X.; Yan, Z.; Shahidehpour, M. Routing and scheduling of mobile energy storage in coupled transportation and power distribution networks. IEEE Trans. Transp. Electrif. 2022, 8, 2583–2594. [Google Scholar] [CrossRef]
  19. Nazemi, M.; Dehghanian, P.; Lu, X.; Chen, C. Uncertainty-aware deployment of mobile energy storage systems for distribution grid resilience. IEEE Trans. Smart Grid 2021, 12, 3200–3214. [Google Scholar] [CrossRef]
  20. He, G.; Michalek, J.; Kar, S.; Chen, Q.; Zhang, D.; Whitacre, J. Utility-scale portable energy storage systems. Joule 2020, 5, 379–392. [Google Scholar] [CrossRef]
  21. Hu, S.; Liao, K.; Yang, J.; Li, B.; Yang, W. Power supply restoration strategy of urban power grid based on V2G technology. Electr. Power Autom. Equip. 2023, 43, 53–61. [Google Scholar]
  22. Xu, W.; Sui, Q.; Cao, S.; Lin, X.; Li, Z. Dual-layer optimal dispatching strategy for integrated energy system after disasters considering dynamic grid recovery and flexible resource support. Proc. CSU-EPSA 2024, 36, 67–77. [Google Scholar]
  23. Tian, K.; Zang, Y.; Wang, J.; Zhang, X. Electricity arbitrage for mobile energy storage in marginal pricing mechanism via bi-level programming. Int. J. Electr. Power Energy Syst. 2024, 162, 110330. [Google Scholar] [CrossRef]
  24. Chen, H.; Xiong, X.; Zhu, J.; Wang, J.; Wang, W.; He, Y. A two-stage stochastic programming model for resilience enhancement of active distribution networks with mobile energy storage systems. IEEE Trans. Power Deliv. 2024, 39, 2001–2014. [Google Scholar] [CrossRef]
  25. Zhang, M.; Fu, H.; Wang, X.; Shu, D.; Yang, J.; Yu, P.; Zhu, M.; Tao, J. Disaster management approaches for active distribution networks based on Mobile Energy Storage System. Electr. Power Syst. Res. 2025, 239, 111242. [Google Scholar] [CrossRef]
  26. Wu, C.; Zhou, D.; Lin, X.; Sui, Q.; Wei, F.; Li, Z. A novel energy cooperation framework for multi-island microgrids based on marine mobile energy storage systems. Energy 2022, 252, 124060. [Google Scholar] [CrossRef]
  27. Shi, Y.; Sun, Y.; Wang, J.; Lu, X.; Li, H.; Yao, Y.; Xin, Y. Pre-configuration method and scheduling strategy of mobile energy storage vehicles in distribution network considering intermittent load of rural network. Electr. Power Autom. Equip. 2024, 44, 204–212. [Google Scholar]
  28. Meng, H.; Jia, H.; Xu, T.; Wei, W.; Wu, Y.; Liang, L.; Cai, S.; Liu, Z.; Wang, R.; Li, M. Optimal configuration of cooperative stationary and mobile energy storage considering ambient temperature: A case for Winter Olympic Game. Appl. Energy 2022, 325, 119889. [Google Scholar] [CrossRef]
  29. Kamel, T.; Zangiabadi, M.; Dong, H.; Tian, Z.; Wade, N.; Pickert, V.; Tricoli, P. Practical demonstration and novel optimization control for a smart soft open point to maximize the synergy between the dc metro line and the lv distribution grid. IEEE Trans. Transp. Electrif. 2025, 11, 1298–1312. [Google Scholar] [CrossRef]
  30. Bai, L.; Jiang, T.; Li, F.; Chen, H.; Li, X. Distributed energy storage planning in soft open point based active distribution networks incorporating network reconfiguration and DG reactive power capability. Appl. Energy 2018, 210, 1082–1091. [Google Scholar] [CrossRef]
  31. Wu, Z.; Zhou, M.; Li, G.; Zhao, T.; Zhang, Y.; Liu, X. Interaction between balancing market design and market behaviour of wind power producers in China. Renew. Sustain. Energy Rev. 2020, 132, 110060. [Google Scholar] [CrossRef]
  32. Tong, W.; Lu, Z.; Zhao, H.; Han, M.; Zhao, G.; Hunt, J. The structure and control strategies of hybrid solid gravity energy storage system. J. Energy Storage 2023, 67, 107570. [Google Scholar] [CrossRef]
  33. Wu, Z.; Li, Y.; Zhang, X.; Zheng, S.; Zhao, J. Distributed voltage control for multi-feeder distribution networks considering transmission network total voltage deviation based on robust deep reinforcement learning. Appl. Energy 2025, 379, 124984. [Google Scholar] [CrossRef]
  34. Shen, Y.; Qian, T.; Li, W.; Zhao, W.; Tang, W.; Chen, X.; Yu, Z. Mobile energy storage systems with spatial–temporal flexibility for post-disaster recovery of power distribution systems: A bilevel optimization approach. Energy 2023, 282, 128300. [Google Scholar] [CrossRef]
  35. Li, Y.; Zhou, S.; Liu, J.; Tong, J.; Dang, J.; Yang, F.; Ouyang, M. Multi-objective optimization of the Atkinson cycle gasoline engine using NSGA III coupled with support vector machine and back-propagation algorithm. Energy 2023, 262, 125262. [Google Scholar] [CrossRef]
  36. Naderi, E.; Mirzaei, L.; Trimble, J.P.; Cantrell, D.A. Multi-objective optimal power flow incorporating flexible alternating current transmission systems: Application of a wavelet-oriented evolutionary algorithm. Electr. Power Compon. Syst. 2023, 52, 766–795. [Google Scholar] [CrossRef]
Figure 1. Chengdu road network map.
Energies 18 02701 g001
Figure 2. Installation position of SOP.
Energies 18 02701 g002
Figure 3. Schematic diagram of grid topology.
Energies 18 02701 g003
Figure 4. Spatial–temporal dynamic scheduling of MESS.
Energies 18 02701 g004
Figure 5. Solution process of NSGA-III.
Energies 18 02701 g005
Figure 6. A framework for the optimal scheduling and path planning of the MESS.
Energies 18 02701 g006
Figure 7. Power system operation and TOU electricity price data: (a) original load, net load, WT, and PV outputs; and (b) TOU electricity price data.
Energies 18 02701 g007
Figure 8. Road network road data.
Energies 18 02701 g008
Figure 9. TOU electricity price and power of MESS at different time periods.
Energies 18 02701 g009
Figure 10. Comparison of net load curves before and after optimization.
Energies 18 02701 g010
Figure 11. Pareto frontier results for NSGA-III and MOSPO solutions: (a) Pareto frontier results for NSGA-III solutions; and (b) Pareto frontier results for MOSPO solutions.
Energies 18 02701 g011
Figure 12. Active and reactive powers of SOPs at different time periods: (a) active power; and (b) reactive power.
Energies 18 02701 g012
Figure 13. SOC and power of MESS at different time periods.
Energies 18 02701 g013
Figure 14. Voltage before and after grid node optimization for different time periods: (a) voltage before grid node optimization for different time periods; and (b) voltage after optimization of grid nodes for different time periods.
Energies 18 02701 g014
Table 1. NSGA-III and MOSPO algorithms parameter settings.
NSGA-III Algorithm ParametersValueMOSPO Algorithm ParametersValue
Maximum iterations600Maximum iterations600
Population size500Population size500
Reference points15Grid inflation parameter0.1
Crossover percentage0.5Number of grids per each dimension30
Mutation percentage0.5Leader selection pressure parameter4
Mutation rate0.04Extra (to be deleted) repository member selection pressure2
Table 3. Cost–benefit results.
Net Benefits of Scheduling (CNY)Arbitrage Revenue (CNY)Benefits of Reducing Network Losses (CNY)Total Cost of Dispatch (CNY)Traveling Cost (CNY)
223.91425.8443.50245.4325.51
Table 4. The best results obtained by different algorithms in solving the benchmark problem.
ArithmeticSFRFGSF
PESA-II0.00971650.440083.2582
MOSPO0.0001690.00830.0045
NSGA III000
Table 2. System parameter settings.
η C 0.97
η D 0.97
v M E S S (km/h)80
σ (CNY/km)1.3
T 0 (min)20
S o C m i n 0.1
S o C m a x 0.9
Disclaimer/Publisher’s Note: The statements, opinions and data contained in all publications are solely those of the individual author(s) and contributor(s) and not of MDPI and/or the editor(s). MDPI and/or the editor(s) disclaim responsibility for any injury to people or property resulting from any ideas, methods, instructions or products referred to in the content.

