Abstract
The flow rate strategies of deionized water have a significant impact on the mass transfer process of proton exchange membrane (PEM) electrolyzers, which are critical for the efficient and safe operation of hydrogen production systems. Electrochemical impedance spectroscopy is an effective tool for distinguishing different kinetic processes within the electrolyzer. In this study, three different Ti-felt porous transport layers (PTLs) are tested with two flow rate modes, constant flow (50 mL/min) and periodic cycling flow (10 mL/min–50 mL/min–10 mL/min), to investigate the influence of flow rate strategies on the mass transfer impedance of the electrolyzer. The following observations were made: (1) For PTL with better performance, the flow rate of the periodic cycling flow has little effect on its mass transfer impedance, and the mass transfer impedance of the periodic circulation flow mode is not much different from that of the constant flow. (2) For PTL with poorer performance, in the periodic cycling mode, the mass transfer impedance at 10 mL/min is smaller than that at 50 mL/min, but both are higher than the impedance under constant flow. The conclusions of this study provide a theoretical basis for the flow management of PEM electrolytic hydrogen production systems.
1. Introduction
Green hydrogen is an important tool for reducing carbon emissions, and it can be applied in the chemical industry and the transportation sector. Water electrolysis using renewable energy is the primary method for obtaining green hydrogen [1,2]. The electrolysis of water for hydrogen production converts electrical energy into chemical energy; it can also be utilized in the energy storage field to balance the fluctuations of wind and solar power generation [3,4]. Among the various technological routes for water electrolysis to produce hydrogen, the PEM water electrolyzer (PEMWE) exhibits several advantageous characteristics, including high current density, compact structure, and robust adaptability to input fluctuations [5], rendering it highly suitable for integration with renewable energy systems.
The PEM electrolytic hydrogen production system consists of the PEM electrolysis stack, gas–water separator, circulation pump, ion exchanger, heat exchanger, and valves [6,7], as shown in Figure 1. The PEM electrolysis stack is the core device of the hydrogen production system and the place where hydrogen is generated. The gas–water separator is the place where gas and deionized water (DI) are separated. Oxygen is generated at the anode of the PEM electrolyzer. The gas–water mixture produced then enters the gas–water separator through pipelines. The gas enters the gas collection device or the air, while the DI re-enters the water circulation of the hydrogen production system. The circulation pump is used to drive the water circulation. The ion exchanger is used to remove impurities from the recirculating water. The heat exchanger prevents the water temperature at the stack inlet from being excessively high. Valves, including the gas pressure valve, the water supply valve, and others, are utilized to control the gas pressure, water supply, and other aspects of the hydrogen production system.
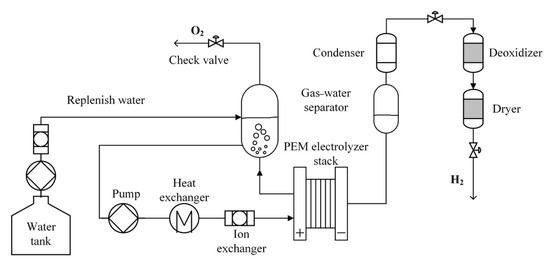
Figure 1.
Schematic diagram of PEM electrolytic hydrogen production system.
The main operating conditions that affect the performance of PEM electrolyzers are the temperature of the electrolyzers, the flow rate of DI, and the gas pressure. Millet et al. [8] conducted tests on the polarization curves of the electrolyzers within a range of 25 °C to 80 °C. The performance of the electrolyzers at low and medium current densities increases with the increase in temperature, suggesting that the electrochemical performance of the electrolyzer is enhanced with the temperature increase. The ohmic impedance decreases with the increase in temperature, and the kinetic activity of the electrodes is also enhanced by increasing the temperature. This phenomenon conforms to electrical common sense and the Butler–Volmer equation.
For the temperature control of the PEM electrolytic hydrogen production system, the stack is primarily heated by waste heat generated during electrolysis. Meanwhile, a cooler is activated to prevent excessive inlet water temperature when the temperature of DI exceeds a certain threshold. Consequently, during the cold start process of the PEM electrolytic hydrogen production system, the heating process of the stack is relatively uncontrollable. However, the cooling process is more manageable when the temperature of the electrolyzer stack is high. Garcia-Navarro et al. [9] found that the increase in anode pressure has no significant effect on the mass transfer impedance of the electrolyzer, while the increase in cathode pressure will increase the mass transfer impedance and have a negative impact on the performance of the electrolyzer. According to the Nernst equation, an increase in the partial pressure of hydrogen will raise the reversible voltage of the electrolysis reaction. However, from the perspective of a hydrogen production and gaseous storage system, high-pressure hydrogen generation can enhance the overall energy conversion efficiency of the system.
The flow rate of DI water is a critical operational condition affecting the performance of the electrolyzer. Not only does the DI water flow rate impact the temperature uniformity within the electrolyzer stack [10], but it also affects the gas–liquid mass transfer performance of the electrolyzer. Garcia-Navarro et al. [9] found that the mass transfer impedance of the electrolyzer increases with an increase in the DI water flow rate, and the increase in flow rate on the cathode side has a greater impact on the performance of the electrolyzer than the increase on the anode side. Selamet et al. [11] investigated the impact of flow rate on the performance of a 10-cell stack and found that an increase in flow rate caused an increase in the voltage of the electrolyzer, and the rate of temperature rise in the stack decreased. It is because the flow rate not only affects the mass transfer kinetics process of each cell inside the electrolyzer stack but also influences the heat exchange process within the electrolyzer stack. Upadhyay et al. [12] conducted three-dimensional modeling of the electrolyzer, indicating that for an electrolyzer with an active area of 314 cm2, the performance improves with an increase in flow rate within the range of 1 L/min to 10 L/min. They also investigated the influence of flow rate on the PEM water electrolyzer with the circular flow field [13]. They found two recirculation zones (clockwise and anticlockwise), where the highest velocity was observed at the center region and lower velocity magnitude toward the periphery, and the averaged mean velocity value increases with an increase in water flow rate. According to the Nernst equation, an increase in gas partial pressure will raise the overpotential of the electrolytic reaction, thereby reducing the electrolytic efficiency and increasing heat generation. In summary, the flow rate has a significant impact on the internal flow field, further affecting the partial pressure distribution of gases in PEMWE, ultimately leading to the uneven distribution of the overpotential and the temperature of the electrolyzer. Therefore, research on the flow rate strategy of the electrolyzer is of great importance for enhancing its performance and safety. An et al. [14] developed a three-dimensional PEMWE multi-physics field model to analyze the influence of the water supply flow rate on the bubble effect and proposed a flow rate control strategy for the PEM hydrogen production system based on the performance preset control. However, they have not conducted a more in-depth study on the mechanism of the mass transfer process in the electrolyzer as the operating conditions change.
The main contributions of this study are as follows: First, electrochemical impedance was conducted on PEM electrolyzers assembled with three different types of Ti-felt PTLs under different flow strategies. Electrochemical impedance spectroscopy (EIS) can effectively distinguish the dynamic processes occurring on different time scales of the PEM electrolyzer. Second, this study analyzes the impact of varying flow strategies on the mass transfer impedance of the electrolyzers, revealing the change in the internal dynamics of the electrolyzers under different flow strategies. Lastly, by comparing different flow strategies in PEM electrolyzers assembled with varying types of Ti-felt PTL, it examines the coupling effects of flow strategies and the physical properties of Ti-felt PTL on the mass transfer process.
2. Experiment
In this work, a commercial catalyst-coated membrane (CCM) was used with the IrOx loading of 1.0 mg/cm2 on the anode and a Pt–C loading of 0.5 mg/cm2 on the cathode. The PEM is 125 μm Chemours N115, and the active area of CCM is 4 cm2. The bipolar plate is a platinum-plated titanium plate, and the flow channel structure is pin-shaped. The width of the rib is 0.8 mm, the distance between ribs is 0.9 mm, and the depth of channel is 2 mm. The gas diffusion layer of the cathode side is carbon paper (Toray, Tokyo, Japan, TGP-H-060). The anode PTL numbers were named PTL-1, PTL-2, and PTL-3. The structural parameters of PTL-1, PTL-2, and PTL-3 are 0.2 mm with the porosity of 60.99%, 0.4 mm with the porosity of 60.99%, and 0.4 mm with the porosity of 68.71%, respectively. All tests were conducted with hydrogen in oxygen maintained below 1.2%, but due to the precision limitations of the testing equipment, the changes in hydrogen within the oxygen of the electrolyzer are not precisely quantified. The test bench is shown in Figure 2.
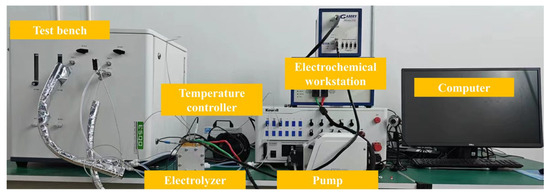
Figure 2.
The test bench used in this study.
The Gamry electrochemical workstation reference 3000 (Gamry Instruments, Warminster, PA, USA) was used for EIS measurements. The EIS test procedure is as follows: After the CCM is activated, keep the test conditions running stably for 5 min, then measure the open circuit voltage (OCV) for 100 s, and then conduct the EIS test. The AC excitation is 10% of the DC, with a frequency range of 100 kHz to 0.1 Hz, and 10 frequency points are measured for each decade.
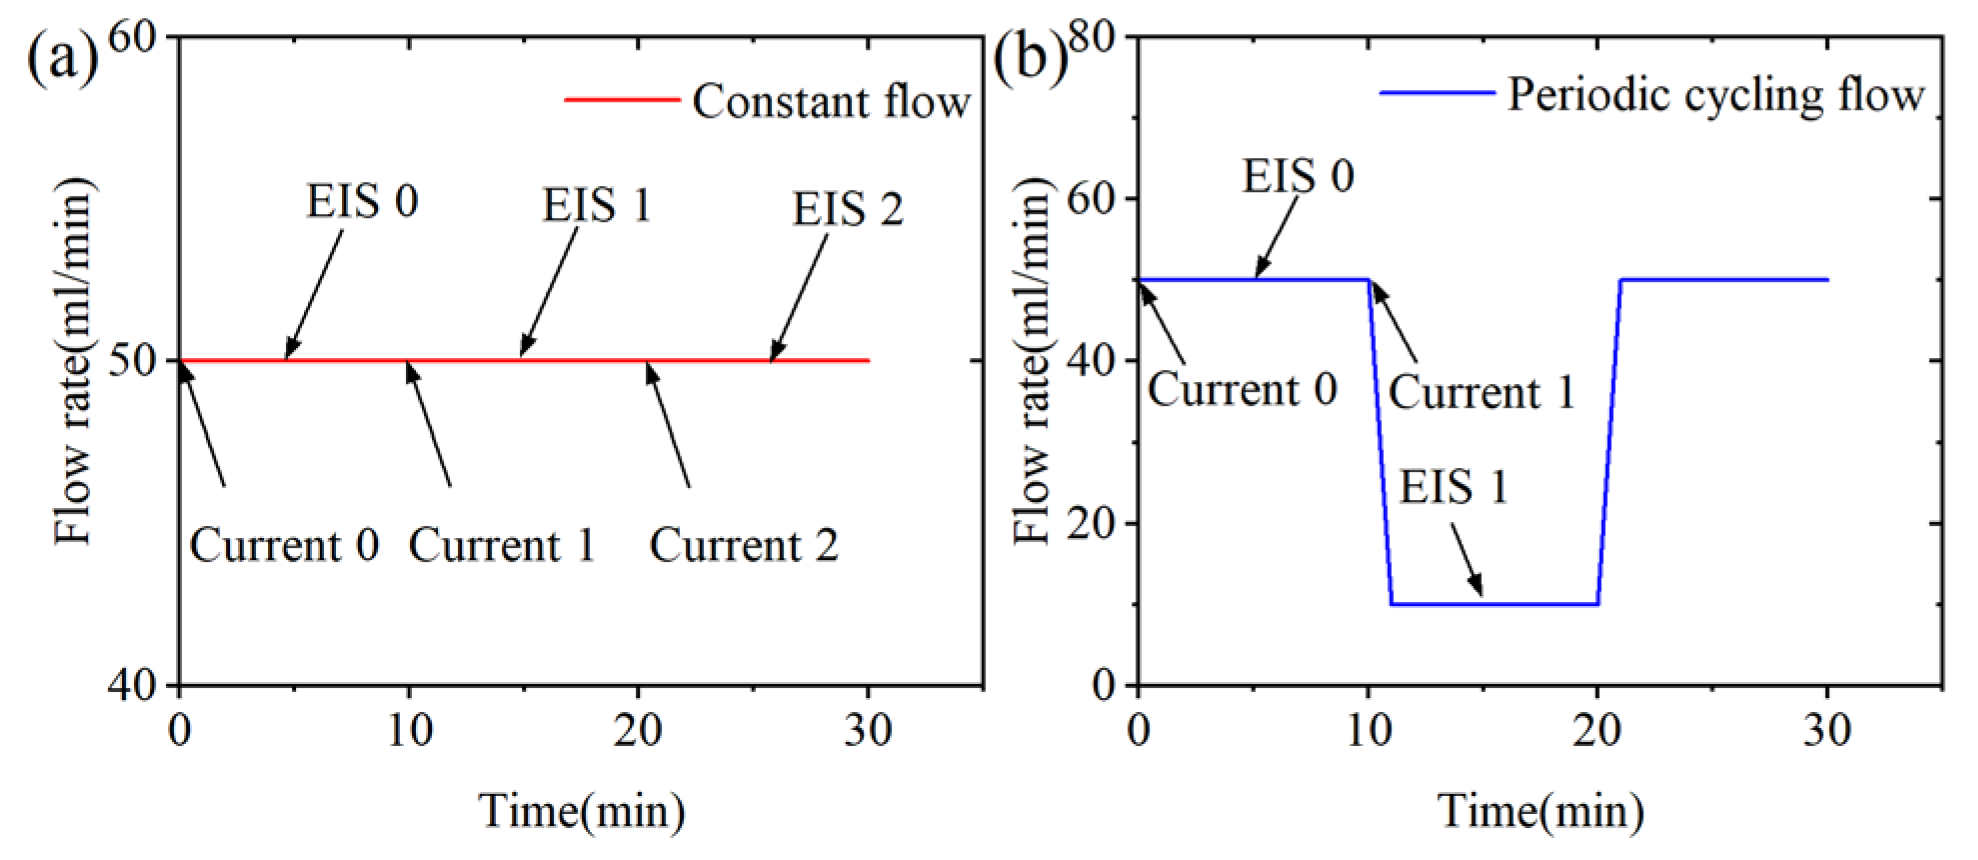
In this study, some operating conditions remain unchanged in all experiments: water is supplied to the anode side of the cell, the water and cell temperatures are maintained at 60 °C, and the back pressure of the anode side is atmospheric. Two different flow rate strategies were used and named constant flow (50 mL/min) and periodic cycling flow (10 mL/min–50 mL/min–10 mL/min). Combined with the EIS testing process, the variation of test conditions over time is shown in Figure 3.
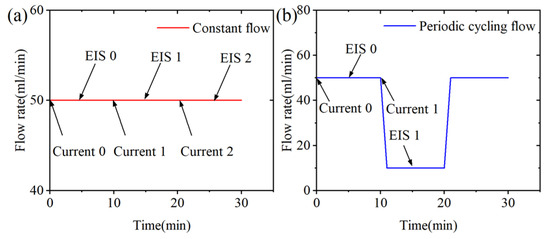
Figure 3.
Schematic diagrams of two flow rate strategies: (a) Constant flow (b) Periodic cycling flow.
3. Results
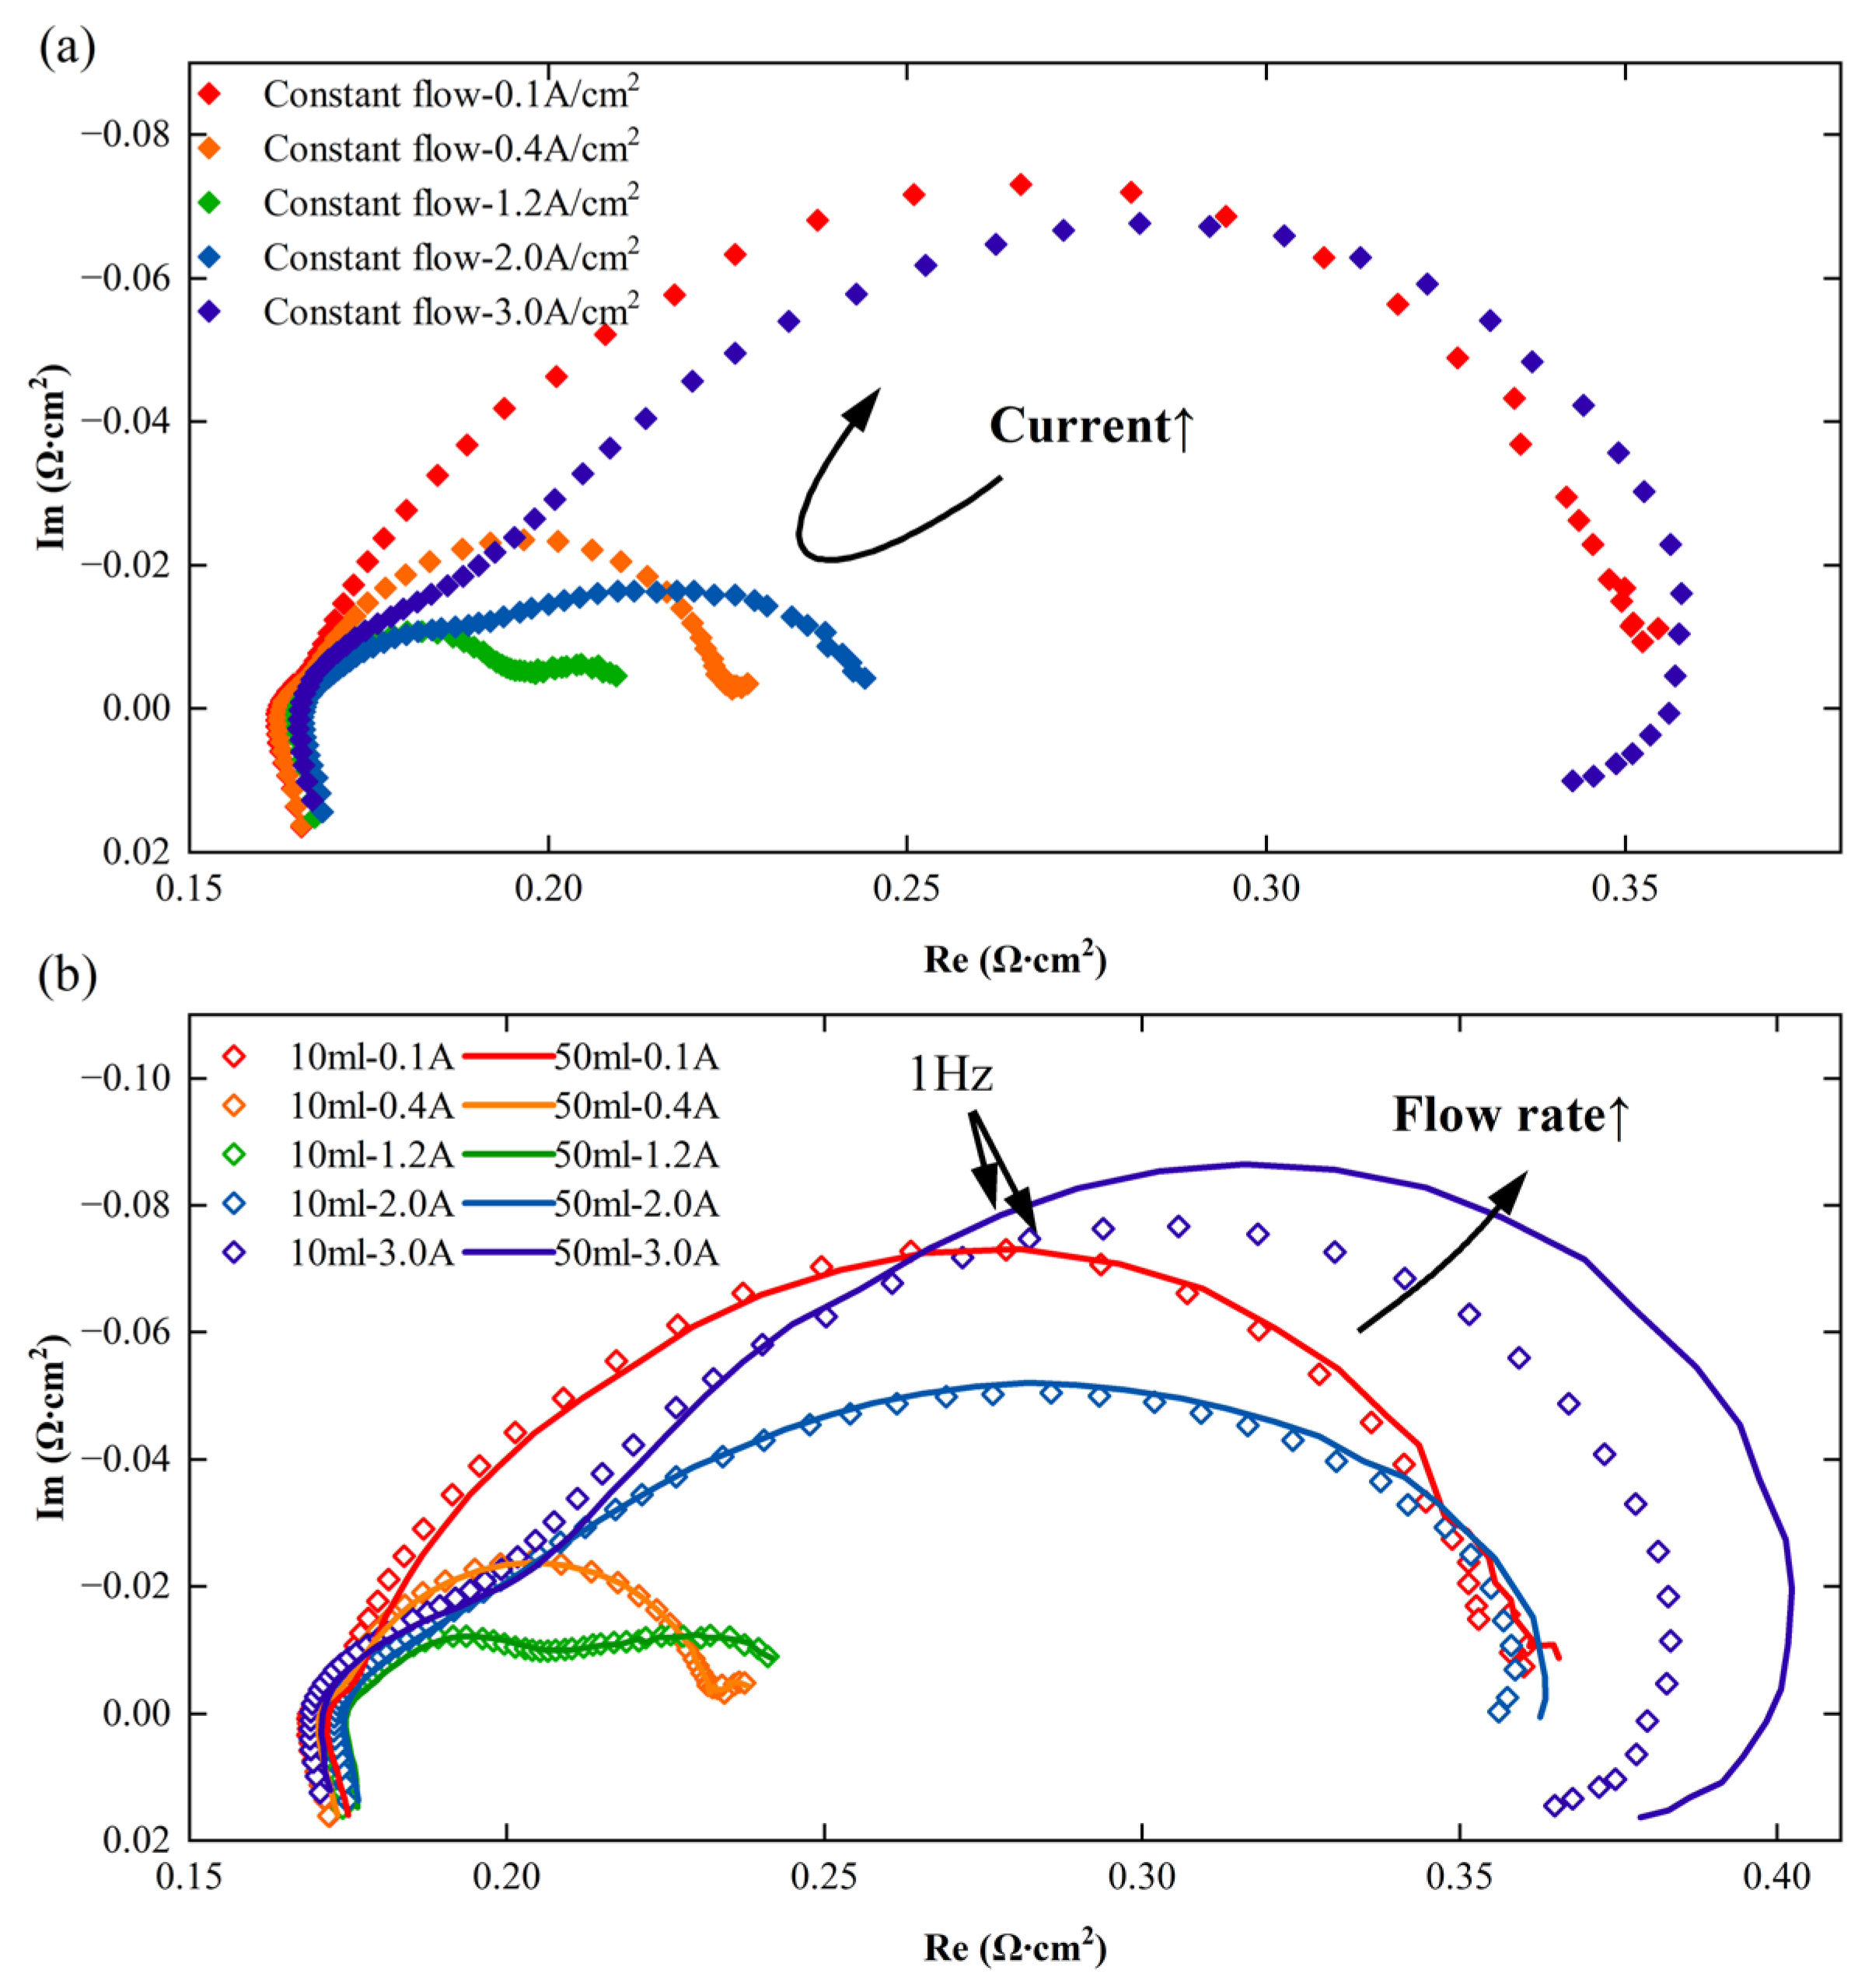
As shown in Figure 4a, the electrochemical impedance spectrum of the PEM electrolyzer first increases and then decreases with the increase in current density. It is generally accepted that the first semicircle (high frequency) represents charge transfer impedance of the PEM electrolyzer, while the second semicircle corresponds to mass transport impedance. The charge transfer impedance is the resistance associated with the kinetic barrier of electron transfer across the electrode–electrolyte interface during a faradaic process. It is a key parameter in EIS analysis, reflecting the difficulty of charge transfer in redox reactions. The charge transfer impedance of the PEM electrolyzer decreases with an increase in current density, while the mass transfer impedance increases with an increase in current density [15,16].
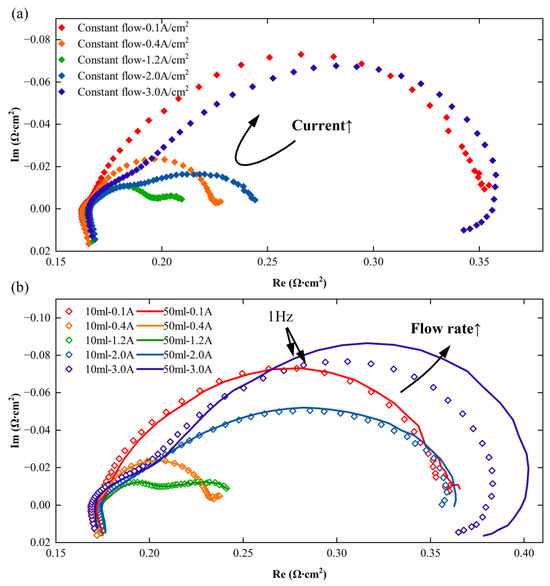
Figure 4.
EIS of the PTL-2 assembled electrolyzer under two flow rate strategies: (a) Constant flow (b) Periodic cycling flow.
As can be seen from Figure 4b, at low current densities, the EIS of the electrolyzer shows no significant difference between the flow rates of 10 mL/min and 50 mL/min. However, at higher current densities (for PTL-2, this is greater than 2.0 A/cm2), the EIS of the PEM electrolyzer at a flow rate of 10 mL/min is less than that at 50 mL/min, and the difference in impedance mainly occurs below 1 Hz, which corresponds to the mass transfer process of the electrolyzer. This reveals that within this operational range, the impedance of the electrolyzer decreases with increasing flow rate. On the other hand, it can be observed that under both flow strategies, at 2.0 A/cm2 and 3.0 A/cm2, even the smaller impedance of periodic cycling flow is larger than the impedance of constant flow, which implies that under these conditions, constant flow leads to a smaller mass transfer impedance in the electrolyzer.
Nevertheless, does this conclusion imply that a lower flow rate is always better for PEM electrolytic hydrogen production, provided safety is ensured? Additionally, what causes the impedance differences between the constant flow and periodic cycling flow conditions, and what factors influence these variations?
To investigate the universality of the observed patterns, this study used three different types of PTLs to explore the general applicability of the findings. Due to the impacts of assembly tolerances and parameters of the PTL on the conductivity of PEM electrolyzers, polarization impedance was employed to compare the mass transfer characteristics among electrolyzers assembled with different PTLs. Figure 5 displays the electrochemical impedance spectroscopy of electrolyzers utilizing the three PTLs at various current densities. It can be seen that at the same current density, the impedance spectroscopy of the electrolyzer assembled with PTL-1 consistently exhibits the lowest values, while those of PTL-3 show the highest values. Furthermore, the difference in impedance spectroscopy between PTL-1 and PTL-3 increases with increasing current density. This reveals that PTL-1 has the best performance, while PTL-3 has the poorest performance.
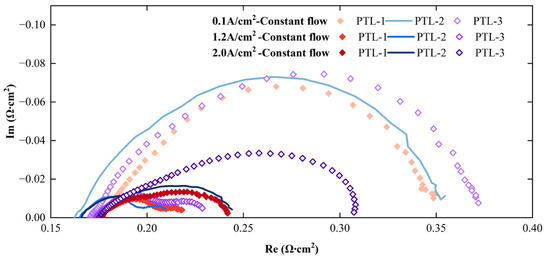
Figure 5.
Electrochemical impedance spectroscopy of three types of PTLs at different current densities.
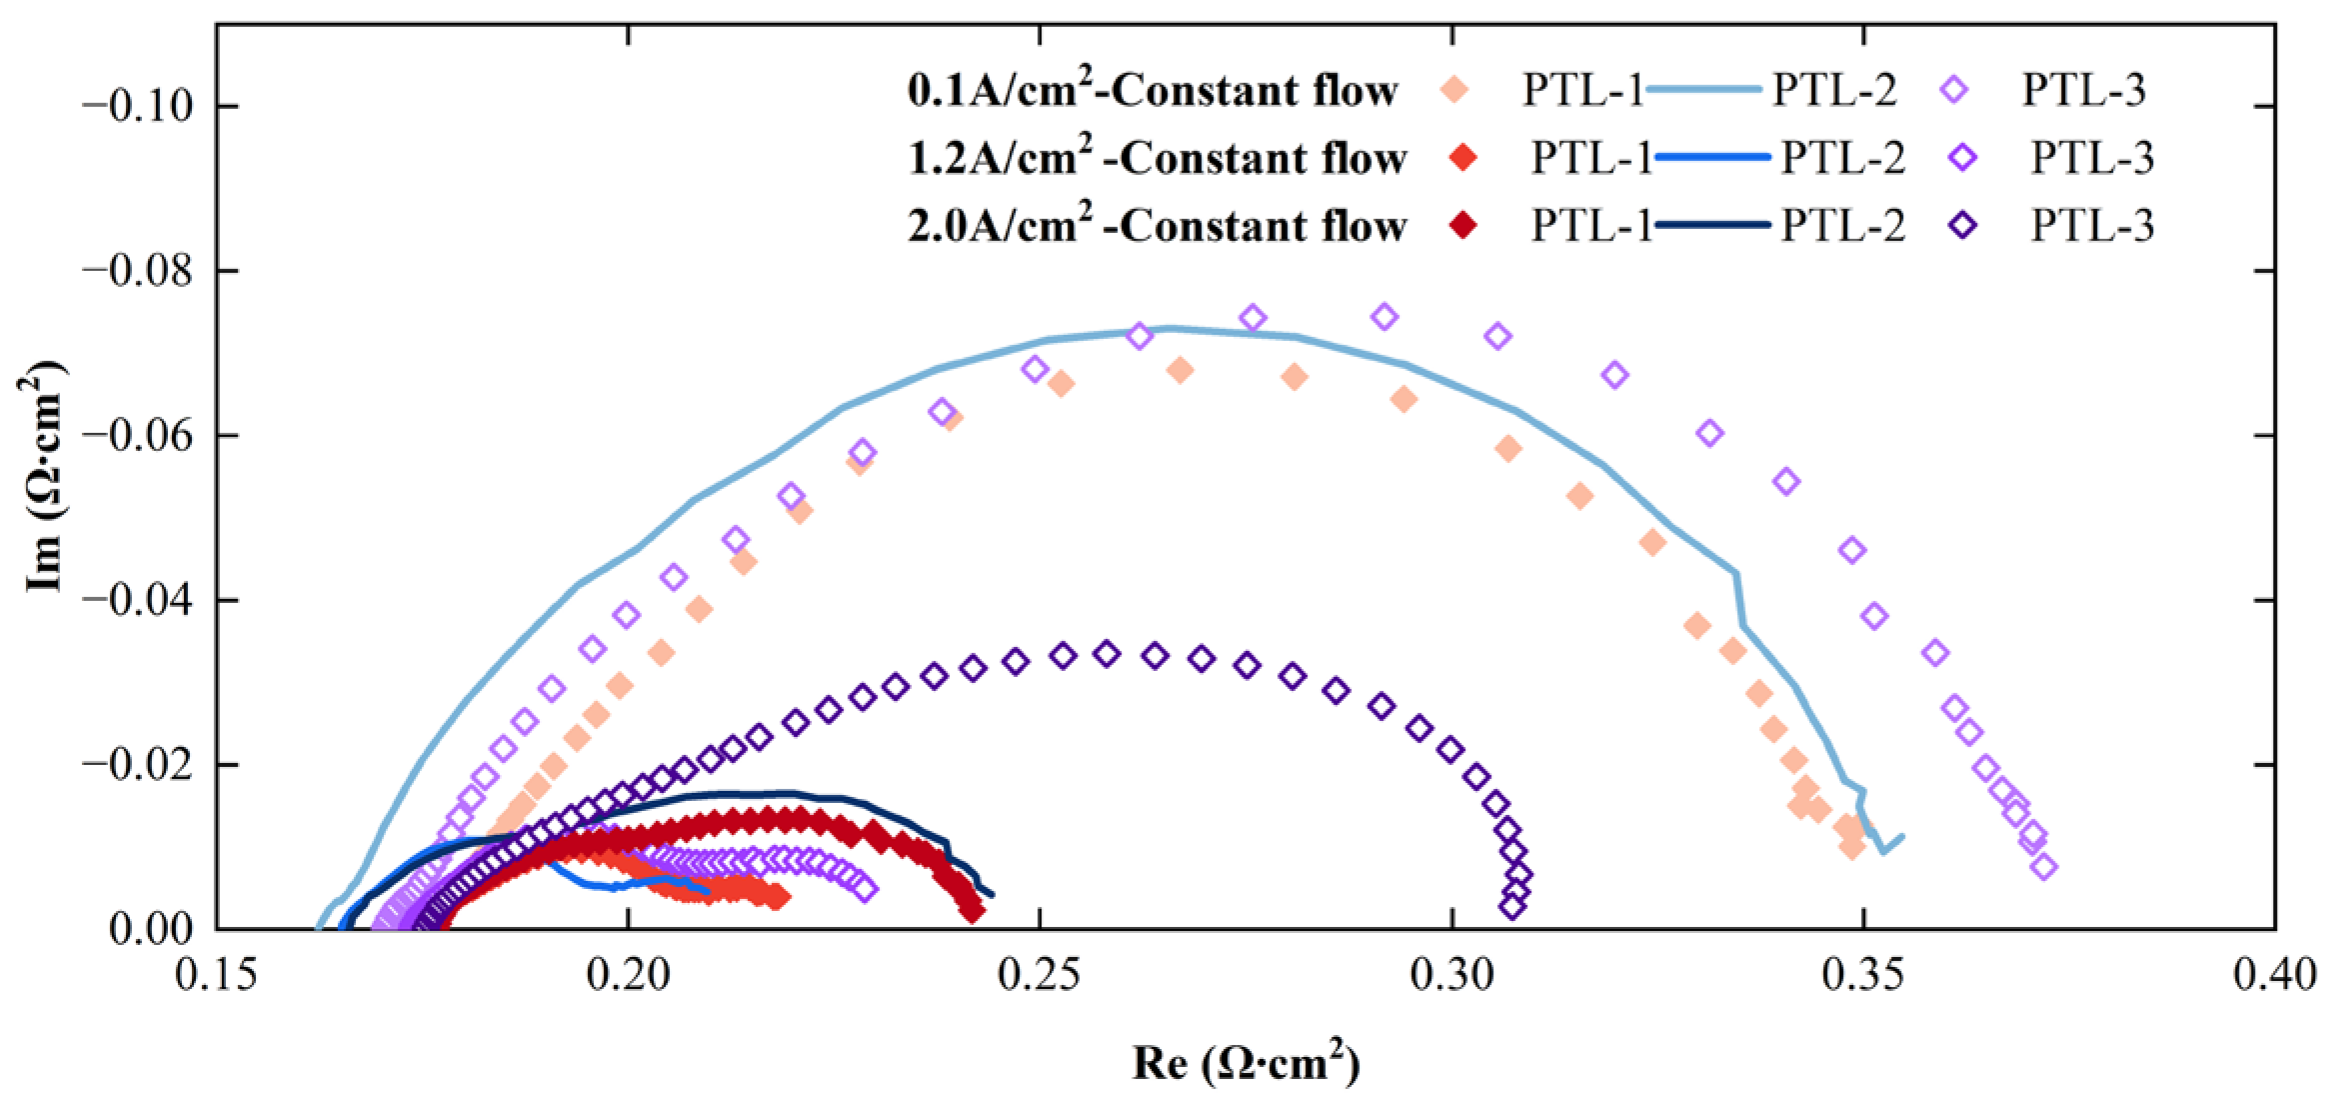
Figure 6 shows the electrochemical impedance spectroscopy for the three types of PTLs measured at different flow rates. At the current density of 0.1 A/cm2, the flow strategy has almost no effect on the impedance spectroscopy of the electrolyzers assembled with the three PTLs. At a current density of 1.2 A/cm2, the impedance for PTL-1 shows little variation across different flow strategies. In contrast, the other two cells exhibit slight differences in their electrochemical impedance spectroscopy depending on the flow strategy employed. It can be observed that the impedance for the periodic group is greater than that for the constant group. Within the periodic group, there is not much difference in impedance between the conditions of 10 mL/min and 50 mL/min. This implies that maintaining a constant flow rate is more beneficial for the performance of the electrolyzers at this time.
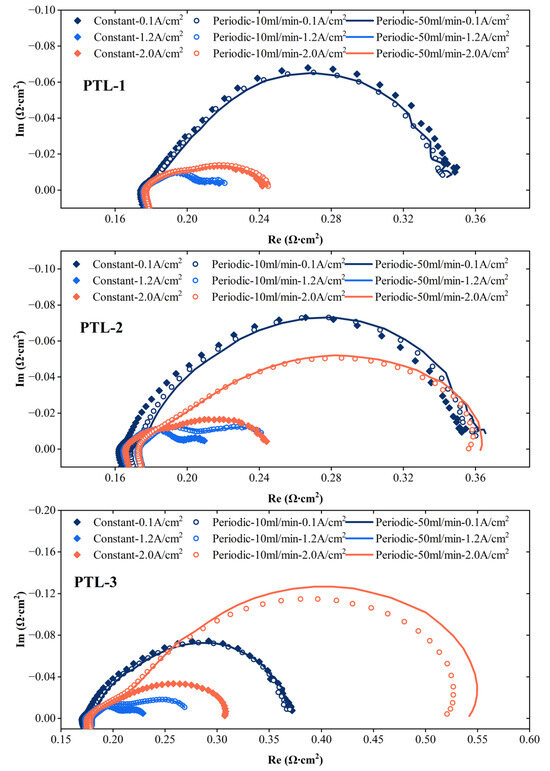
Figure 6.
Electrochemical impedance spectra of three types of PTL under different flow rates.
At the current density of 2.0 A/cm2, the flow strategy has almost no effect on the impedance spectroscopy of the electrolyzers assembled with PTL-1. In contrast, for the electrolyzers assembled with the other two types of PTLs, the order is constant < periodic (10 mL/min) < periodic (50 mL/min), indicating that both periodic conditions exhibit significantly higher impedance than the constant flow. This suggests that for PTL-1, the periodic flow strategy—particularly at a higher flow rate of 50 mL/min—may be marginally more effective in reducing the impedance compared to the constant flow strategy. Conversely, for the other two PTLs, the constant flow strategy is more advantageous, as it yields lower impedance than both periodic cycling flow conditions, which show significantly elevated impedance values.
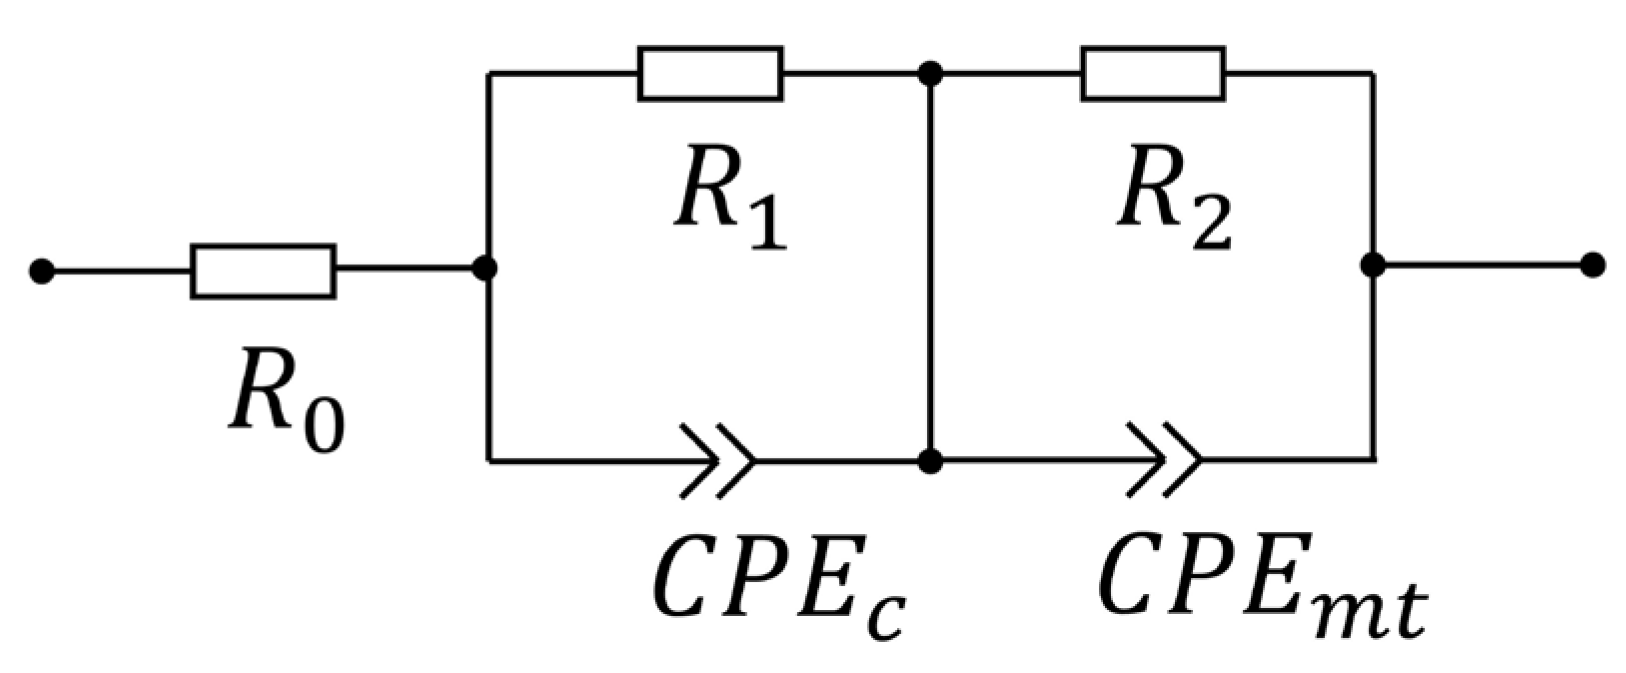
In this study, the second-order R-CPE equivalent circuit was employed to quantify the mass transfer impedance of the PEM electrolyzer, as shown in Figure 7. In the second-order R-CPE equivalent circuit, the first R-CPE element represents the charge transfer impedance of the PEM electrolyzer, and the second R-CPE element represents the mass transfer impedance of the electrolyzer. R0 represents the ohmic impedance of the cell.

Figure 7.
The equivalent circuit model used in this study.
Table 1 shows the R2 difference between the two flow strategies. It is observed that under the condition of 2.0 A/cm2, the periodic strategy increases the impedance of PTL-1 by 1%, which means that the flow rate strategy has little impact on the mass transfer impedance of the electrolyzer assembled with PTL-1. However, the periodic strategy increases the impedance of PTL-2 by 251% and that of PTL-3 by 354%. Table 2 shows the values and errors of R0 and R1.

Table 1.
The R2 difference between the two flow strategies.
Table 2.
Other R value in R-CPE equivalent circuit.
The observed phenomena and their mechanisms can be explained as follows: In the PEM electrolyzer, the transport process of bubbles occurs as follows: the bubble is generated from the catalyst surface [17], moves through the catalyst layer (CL, ~10 μm, porous medium) to the CL/PTL interface, the bubbles then pass through the PTL (~100 μm, porous medium) to the PTL/flow field interface [18], and subsequently flow out of the electrolyzer through the flow channels (pipeline) [19]. Within the CL and PTL, the flow pattern is characterized as a two-phase flow through a porous medium [20], while in the flow channels, it is a two-phase flow within a pipeline. The force on the bubbles during their transport through the porous media within the components of the PEM electrolyzer is illustrated in Figure 8 [21,22]. The transportation and escape of the bubbles are influenced by surface tension force, drag force, buoyancy force, inertia force, drag force in PTL, and pressure force. The flow rate influences the drag force, the current density affects the pressure force, and the temperature indirectly impacts forces by altering water viscosity. The detachment of the bubbles is influenced by the coupling of the drag force and pressure force, implying that the flow rate, current density, and temperature have a combined effect.
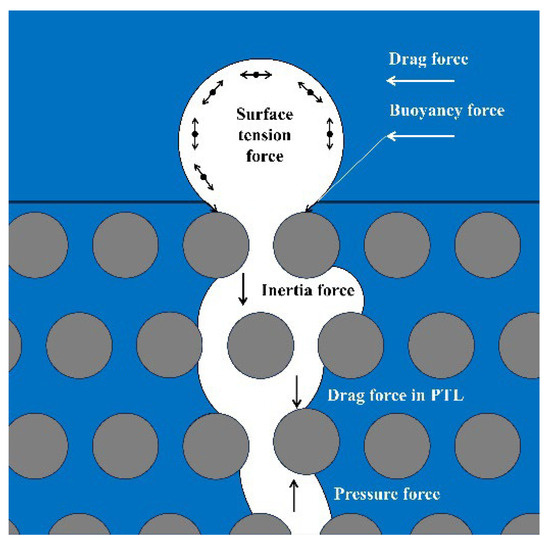
Figure 8.
The schematic of the forces acting on bubbles during their transport through the porous media within the components of the PEM electrolyzer.
In this study, flow rate is the sole variable, and the only varying force is the drag force. For PTL-1, its thickness is relatively small, and the amount of gas accumulated within the PTL is also small, making the gas easier to escape. Therefore, the flow rate strategy has no significant impact on the mass transfer impedance. For PTL-2 and PTL-3, due to their relative thickness, if the drag force is small, gas will accumulate in the voids of the PTL, leading to an increase in oxygen partial pressure and hindering gas discharge [19,23]. According to the Nernst equation, increasing oxygen partial pressure increases the concentration overpotential, which is electrochemically manifested as increased mass transfer impedance in the impedance spectrum. Therefore, under the periodic cycling flow strategy, the impedance of the electrolyzer is larger, and the electrolyzer with greater mass transfer resistance has a more significant increase in mass transfer impedance under the periodic cycling flow strategy. This result reveals that when the PTL thickness is relatively large, it is not advisable to choose a smaller flow rate of periodic cycling flow, as this will lead to the accumulation of gas within the PTL and an increase in mass transfer impedance. When the electrolyzer is shut down, a large flow rate of DI water should be used to remove the remaining oxygen in the PTL to prevent the accumulation of residual oxygen from corroding the materials of the electrolyzer components.
In the electrolytic hydrogen production system, a large stoichiometric ratio is usually adopted to reduce the mass transfer impedance of the electrolyzer stack, but the power consumption of the water circulation pump caused by this accounts for about 5% to 10% of the total system energy consumption. The results from this study show that for different performance PTLs, implementing differentiated flow control strategies can effectively reduce the overpotential of the electrolyzer and reduce the energy consumption of the water pump. However, achieving more precise dynamic flow control in large-scale electrolyzer stacks still faces many technical challenges and requires further research.
4. Conclusions
The flow rate conditions have a significant impact on the mass transfer process in the electrolyzer, which in turn affects the efficiency of hydrogen production and the durability of the components of the electrolyzer. In this study, three different Ti-felt porous transport layers (PTLs) were tested with two flow rate modes, constant flow (50 mL/min) and periodic cycling flow (10 mL/min–50 mL/min–10 mL/min), to investigate the influence of flow rate strategies on the mass transfer impedance of the electrolyzer. The following conclusions were made:
- (1)
- When the current density is relatively low, regardless of the performance of the PTL, the flow rate modes have no significant impact on the mass transfer impedance of the electrolyzer.
- (2)
- When the current density is high, for the PTL with better performance (PTL-1), the periodic cycling flow has no significant effect on the mass transfer impedance of the PEM electrolyzer, while for the two PTLs (PTL-2 and PTL-3) with poorer performance, the periodic cycling flow increases their mass transfer impedance by 251% and 354%, respectively.
- (3)
- By integrating the bubble transport force model within the porous media of PEM electrolyzers, it was found that for the PTL with smaller mass transfer impedance, the periodic flow cycling mode demonstrates negligible interference with gas detachment processes, and the mass transfer impedance of the electrolyzer changes slightly under the two flow rate modes. The PTL with relatively larger mass transfer impedance shows significantly increased mass transfer impedance under periodic flow conditions. The reduced flow velocity during cycling phases impedes effective bubble removal from the porous structure, resulting in the accumulation of gas in the porous medium and consequently elevated mass transfer impedance. This study provides critical insights for optimizing flow field control strategies in PEM water electrolysis systems.
Author Contributions
Conceptualization, H.Z. and X.W.; methodology, H.Y.; software, H.Y.; validation, H.Z.; formal analysis, H.Z.; investigation; H.Z. resources, X.W. and H.D.; data curation, H.Z.; writing—original draft preparation, H.Z.; writing—review and editing, H.Z.; visualization, H.Z.; supervision, X.W. and H.D.; project administration, C.W.; funding acquisition, J.Z. All authors have read and agreed to the published version of the manuscript.
Funding
This research is supported by National Key R&D Program of China (2022YFB4002303).
Data Availability Statement
The raw data supporting the conclusions of this article will be made available by the authors on request.
Conflicts of Interest
The authors declare no conflicts of interest.
Abbreviations
The following abbreviations are used in this manuscript:
| PEM | Proton Exchange Membrane |
| DI | Deionized |
| PTL | Porous Transport Layer |
| CL | Catalyst Layer |
| GDL | Gas Diffusion Layer |
References
- Losiewicz, B. Technology for Green Hydrogen Production: Desk Analysis. Energies 2024, 17, 4514. [Google Scholar] [CrossRef]
- Angelico, R.; Giametta, F.; Bianchi, B.; Catalano, P. Green Hydrogen for Energy Transition: A Critical Perspective. Energies 2025, 18, 404. [Google Scholar] [CrossRef]
- Nafchi, F.M.; Baniasadi, E.; Afshari, E.; Javani, N. Performance assessment of a solar hydrogen and electricity production plant using high temperature PEM electrolyzer and energy storage. Int. J. Hydrogen Energy 2018, 43, 5820–5831. [Google Scholar] [CrossRef]
- Shen, L.F.; Zhang, C.; Shan, F.Y.; Chen, L.; Liu, S.; Zheng, Z.Q.; Zhu, L.T.; Wang, J.D.; Wu, X.Z.; Zhai, Y.J. Review and Prospects of Key Technologies for Integrated Systems in Hydrogen Production from Offshore Superconducting Wind Power. Energies 2025, 18, 19. [Google Scholar] [CrossRef]
- Rego, G.; Rocha, J.; Faria, J.A.; Afonso, J.L.; Monteiro, V. A Review of Hydrogen Production Methods and Power Electronics Converter Topologies for Green Hydrogen Applications. Energies 2024, 17, 5579. [Google Scholar] [CrossRef]
- Salehmin, M.N.I.; Husaini, T.; Goh, J.; Sulong, A.B. High-pressure PEM water electrolyser: A review on challenges and mitigation strategies towards green and low-cost hydrogen production. Energy Convers. Manag. 2022, 268, 115985. [Google Scholar] [CrossRef]
- Wismer, S.E.; Jimenez, A.; Al-Douri, A.; Grabovetska, V.; Groth, K.M. PEM electrolyzer failure scenarios identified by failure modes and effects analysis (FMEA). Int. J. Hydrogen Energy 2024, 89, 1280–1289. [Google Scholar] [CrossRef]
- Millet, P.; Andolfatto, F.; Durand, R. Design and performance of a solid polymer electrolyte water electrolyzer. Int. J. Hydrogen Energy 1996, 21, 87–93. [Google Scholar] [CrossRef]
- Garcia-Navarro, J.C.; Schulze, M.; Friedrich, K.A. Measuring and modeling mass transport losses in proton exchange membrane water electrolyzers using electrochemical impedance spectroscopy. J. Power Sources 2019, 431, 189–204. [Google Scholar] [CrossRef]
- Wang, K.; Feng, Y.; Xiao, F.; Zhang, T.; Wang, Z.; Ye, F.; Xu, C. Operando analysis of through-plane interlayer temperatures in the PEM electrolyzer cell under various operating conditions. Appl. Energy 2023, 348, 121588. [Google Scholar] [CrossRef]
- Selamet, Ö.F.; Acar, M.C.; Mat, M.D.; Kaplan, Y. Effects of operating parameters on the performance of a high-pressure proton exchange membrane electrolyzer. Int. J. Energy Res. 2013, 37, 457–467. [Google Scholar] [CrossRef]
- Upadhyay, M.; Kim, A.; Paramanantham, S.S.; Kim, H.; Lim, D.; Lee, S.; Moon, S.; Lim, H. Three-dimensional CFD simulation of proton exchange membrane water electrolyser: Performance assessment under different condition. Appl. Energy 2022, 306, 118016. [Google Scholar] [CrossRef]
- Upadhyay, M.; Lee, S.; Jung, S.; Choi, Y.; Moon, S.; Lim, H. Systematic assessment of the anode flow field hydrodynamics in a new circular PEM water electrolyser. Int. J. Hydrogen Energy 2020, 45, 20765–20775. [Google Scholar] [CrossRef]
- An, L.; Tian, Y.; Zhao, H. Research on Water Flow Control Strategy for PEM Electrolyzer Considering the Anode Bubble Effect. Energies 2025, 18, 273. [Google Scholar] [CrossRef]
- Yuan, H.; Dai, H.F.; Ming, P.W.; Zhao, L.; Tang, W.; Wei, X.Z. Understanding dynamic behavior of proton exchange membrane fuel cell in the view of internal dynamics based on impedance. Chem. Eng. J. 2022, 431, 134035. [Google Scholar] [CrossRef]
- Li, Y.Y.; Jiang, Y.Y.; Dang, J.; Deng, X.T.; Liu, B.; Ma, J.G.; Yang, F.Y.; Ouyang, M.G.; Shen, X.J. Application of distribution of relaxation times method in polymer electrolyte membrane water electrolyzer. Chem. Eng. J. 2023, 451, 138327. [Google Scholar] [CrossRef]
- Ruiz Diaz, D.F.; Wang, Y. Performance loss due to gas coverage on catalyst surface in polymer electrolyte membrane electrolysis cell. eTransportation 2023, 18, 100263. [Google Scholar] [CrossRef]
- Komini Babu, S.; Yilmaz, A.; Uddin, M.A.; LaManna, J.; Baltic, E.; Jacobson, D.L.; Pasaogullari, U.; Spendelow, J.S. A Goldilocks Approach to Water Management: Hydrochannel Porous Transport Layers for Unitized Reversible Fuel Cells. Adv. Energy Mater. 2023, 13, 2203952. [Google Scholar] [CrossRef]
- Zhang, T.Y.; Cao, Y.P.; Zhang, Y.P.; Wang, K.C.; Xu, C.; Ye, F. Relationship of local current and two-phase flow in proton exchange membrane electrolyzer cells. J. Power Sources 2022, 542, 231742. [Google Scholar] [CrossRef]
- Yilmaz, A.; Babu, S.K.; Kissane, J.; Pasaogullari, U.; Spendelow, J.S. Stratified Porous Transport Layers for Unitized Reversible Fuel Cells. ACS Appl. Energy Mater. 2025, 8, 1986–1993. [Google Scholar] [CrossRef]
- Nouri-Khorasani, A.; Ojong, E.T.; Smolinka, T.; Wilkinson, D.P. Model of oxygen bubbles and performance impact in the porous transport layer of PEM water electrolysis cells. Int. J. Hydrogen Energy 2017, 42, 28665–28680. [Google Scholar] [CrossRef]
- Larimi, S.Z.H.; Ramiar, A.; Esmaili, Q.; Shafaghat, R. The effect of inlet velocity of water on the two-phase flow regime in the porous transport layer of polymer electrolyte membrane electrolyzer. Heat Mass Transf. 2019, 55, 1863–1870. [Google Scholar] [CrossRef]
- Sourya, D.P.; Gurugubelli, P.S.; Bhaskaran, S.; Vorhauer-Huget, N.; Tsotsas, E.; Surasani, V.K. A comparative study on the Lattice Boltzmann Method and the VoF-Continuum method for oxygen transport in the anodic porous transport layer of an electrolyzer. Int. J. Hydrogen Energy 2024, 92, 1091–1098. [Google Scholar] [CrossRef]


Disclaimer/Publisher’s Note: The statements, opinions and data contained in all publications are solely those of the individual author(s) and contributor(s) and not of MDPI and/or the editor(s). MDPI and/or the editor(s) disclaim responsibility for any injury to people or property resulting from any ideas, methods, instructions or products referred to in the content. |
© 2025 by the authors. Licensee MDPI, Basel, Switzerland. This article is an open access article distributed under the terms and conditions of the Creative Commons Attribution (CC BY) license (https://creativecommons.org/licenses/by/4.0/).