Article

Comparison and Application of Pore Pressure Prediction Methods for Carbonate Formations: A Case Study in Luzhou Block, Sichuan Basin

1
Engineering Technology Research Institute, PetroChina Southwest Oil & Gas Field Company, Chengdu 610017, China
2
State Key Laboratory of Oil and Gas Reservoir Geology and Exploitation, Southwest Petroleum University, Chengdu 610500, China
3
Sichuan Oil and Gas Field Branch of China National Petroleum Corporation, Chengdu 610051, China
*
Author to whom correspondence should be addressed.
Energies 2025, 18(10), 2647; https://doi.org/10.3390/en18102647
Submission received: 21 April 2025 / Revised: 13 May 2025 / Accepted: 16 May 2025 / Published: 20 May 2025

Abstract

:
The Luzhou Block in the Sichuan Basin hosts a widely distributed high-quality shale gas reservoir. However, the overlying carbonate strata pose considerable engineering challenges, including severe risks of subsurface fluid loss and wellbore collapse. These challenges are primarily attributed to inaccuracies in pore pressure prediction, which significantly constrains the safety and efficiency of drilling operations in carbonate formations. To address this issue, this study systematically investigates and compares three classical pore pressure prediction approaches—namely, the equivalent depth method, the Eaton method, and the effective stress method—within the geological context of the Luzhou Block. A novel fitting strategy based on laboratory core experimental data is introduced, whereby empirical relationships between field-measured parameters and rock mechanical properties are established to improve model robustness in geologically complex formations. The optimized effective stress model is subsequently applied to the carbonate reservoir interval, and its prediction outcomes are evaluated against measured pore pressure data. The results demonstrate that the effective stress method achieves the highest prediction accuracy, with a maximum deviation of 8.4% and an average deviation of 5.3%. In comparison, the equivalent depth and Eaton methods yield average errors of 12.5% and 12.2%, respectively. These findings suggest that the effective stress method exhibits superior adaptability and reliability for pore pressure prediction in carbonate formations of the Luzhou Block, and holds significant potential for guiding mud density design and improving the operational safety of drilling programs.

1. Introduction

The accurate prediction of pore pressure can guide drilling and production operations safely and efficiently. With increased time, the formation deposition becomes thicker and thicker, the effect of formation pressure becomes more obvious, and the pressure exerted by the fluid in the underground pores becomes greater, resulting in abnormal high pressure in some closed formations [1,2]. The key to oil and gas drilling is understanding the distribution law of pore pressure in the longitudinal formation [3,4]. An accurate understanding of underground pore pressure can effectively avoid complex problems such as blowout, leakage, and wellbore instability [5].
Hubbert and Rubey showed that the porosity of rock decreases as the stress of the overlying rock increases [6]. Therefore, part of the fluid is discharged, and if it does not escape in time, it will produce an abnormal high-pressure area. Hottman and Johnson proposed a method for predicting pore pressure from resistivity and acoustic logging data [7]; this method is more suitable for compacted mudstone formations. Rehm and McClendon [8] proposed a method based on the “d” index proposed by Jorden and Shirley [9], which proceeded to solve Bingham’s [10] universal drilling velocity equation. In addition, pore pressure can be predicted before drilling by converting seismic velocities, especially for abnormal pressures, since high pressures have an effect on seismic velocities, which can be detected [11]. But seismic velocities need to be derived using methods with sufficient resolution to be used for well planning [12]. At the same time, in order to make pore pressure prediction more accurate, the identification of formation compaction history and a good characterization of velocity–pressure relationships under various conditions are essential [13]. However, compaction techniques based on specific formation types require positioning or calibration, which is sometimes difficult in carbonate formations [14]. Later, new techniques were created using measured petrophysical data, resistivity, or acoustic wave and density measurements. These models include the compressibility method, equivalent depth method, Eaton method [15], and effective stress method. The equivalent depth method and Eaton method are mainly solved through the known pore pressure and the establishment of normal compaction trend lines [16]. The equivalent depth method [17,18] assumes that if the acoustic time between two points in the normal compaction section of the formation is equal, then the corresponding effective stress between the two points is equal. The Eaton method [19,20] can predict pore pressure by quantifying the relationship between the measured value of the logging curve and the normal compaction trend line. For the specified research block, the sensitivity of acoustic velocity to pore pressure change is controlled by adjusting the ‘n’ value, and the most suitable ‘n’ value for the research block is found; consequently, an Eaton prediction model suitable for the research block can be established. From the perspective of rock mechanics, the effective stress method [21,22] establishes the relationship between effective stress and parameters that can reflect pore pressure changes (such as changes in porosity, changes in acoustic time, etc.) through a large number of well logging data and measured formation pressure values, and uses Terzaghi’s law of effective stress to calculate pore pressure.
By summarizing a large number of logging data, Eaton [23] found that there is a certain quantitative relationship between pore pressure and resistivity or sound velocity and added a correction index “x” to make the method universally applicable. Foster and Whalen [24] introduced log(S) of the formation factor and slope of depth curve based on Eaton’s method, which has no correction index and does not require the calculation of hydrostatic column pressure. The calculation process is simpler than Eaton’s method, but the applicability of this method for carbonate formations needs to be explored. Based on the Eaton method, Tingay [25] deduces the relationship between the normal compaction trend porosity and well depth and omits the steps that are needed to determine the normal compaction trend line in the Eaton method to simplify the calculation process. On the basis of Eaton’s method, Augustine [26] introduces the Archie cementation index to characterize the influence of cementation strength on pore pressure. Chen et al. [20] proposed that abnormal high pressure would lead to a drop in P-wave velocity, so on the basis of the Eaton method, the calibration factor “C” was introduced and the change in lithology was taken into account. The Eaton–Yale method was proposed to predict pore pressure. Bowers [27] proposes that fluid expansion is one of the causes of abnormal high pressure, which causes the effective stress–acoustic velocity intersection curve to deviate from the normal compaction trend and follow the unloading curve during deposition. On this basis, Bowers proposed a functional relationship between acoustic velocity and effective stress during normal compaction and examined the relationship between acoustic velocity and effective stress when affected by fluid expansion. Zhang et al. [28] followed the idea of unloading curves proposed by Bowers to determine whether fluid expansion occurs at a certain depth by inputting the “maximum depth velocity” (dmax), using this as a basis to propose a method for predicting pore pressures when fluid expansion is the main cause of abnormal high pressure. Based on Terzaghi’s principle of effective stress, Lopez et al. [29] quantified the relationship between effective stress and acoustic velocity by introducing the variable τ. In addition, this method also introduces cation exchange capacity to characterize changes in rock and mineral composition. Based on the Hertz–Mindlin contact theory, Liu et al. [30] deduced the exponential relationship between seismic layer velocity and effective stress. Li and Cheng et al. [31,32] considered the effect of effective stress on wellbore stability and established a wellbore safety model for drilling operations. At the same time, the theoretical velocity Vt is introduced to characterize the influence of fluid pressure. According to the definition of compressibility by Zimmerman and Van Golf-Racht, Atashbari and Tingay [33] propose using the compressibility of rocks to predict pore pressure, which considers that the change in pore pressure is a function of the compressibility of rocks and fluids. Deng et al. [34] proposed a multiple regression model method to predict pore pressure by establishing the relationship between p-wave velocity and parameters such as effective stress and mud content.
Based on the above research progress of carbonate rock pore pressure prediction, the equivalent depth method [35], Eaton method [36], and effective stress method [37] were adopted for the prediction comparison of carbonate rock formations in the Luzhou Block of Sichuan Basin to explore the pore pressure prediction method suitable for the carbonate formation. The optimized model was applied in the field to provide a basis for guiding on-site mud density design.

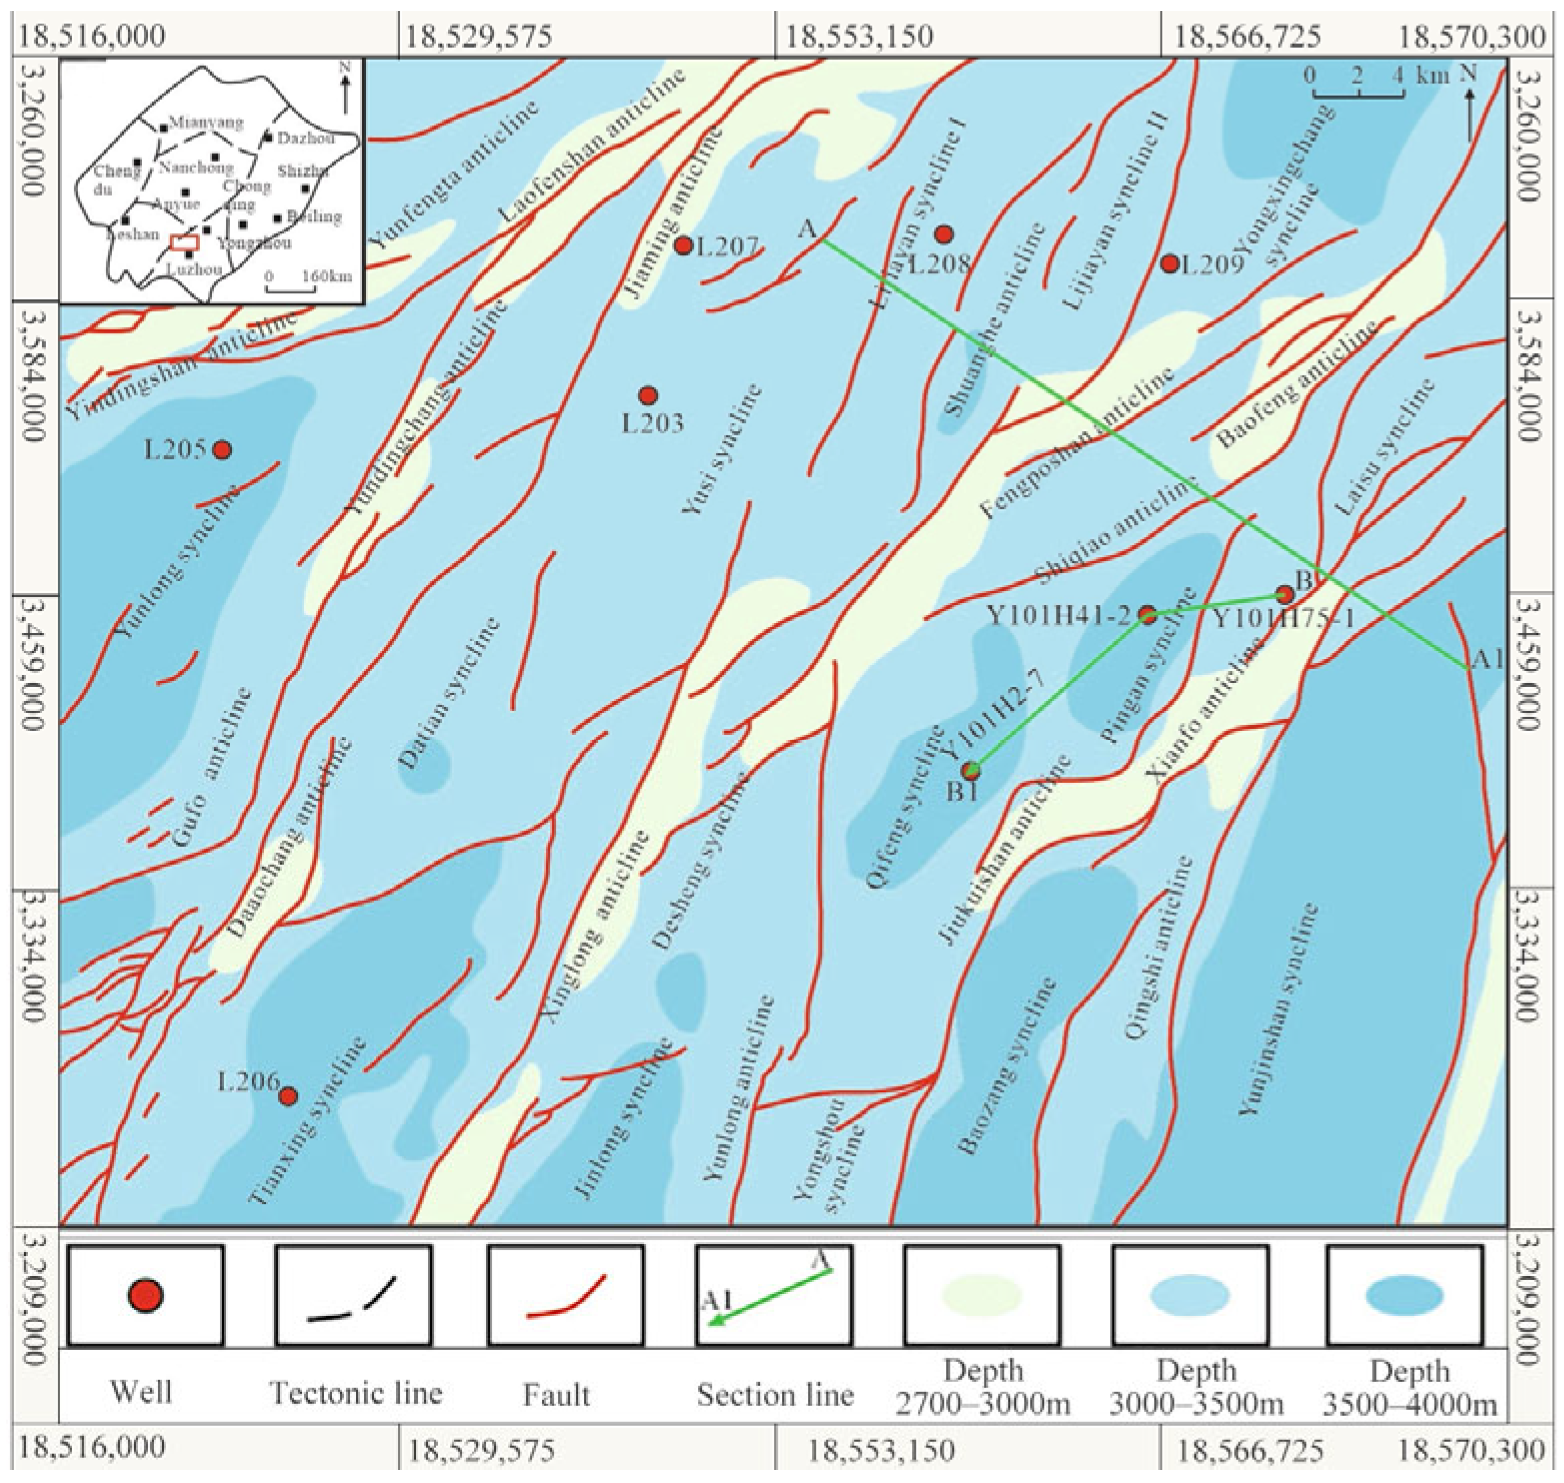
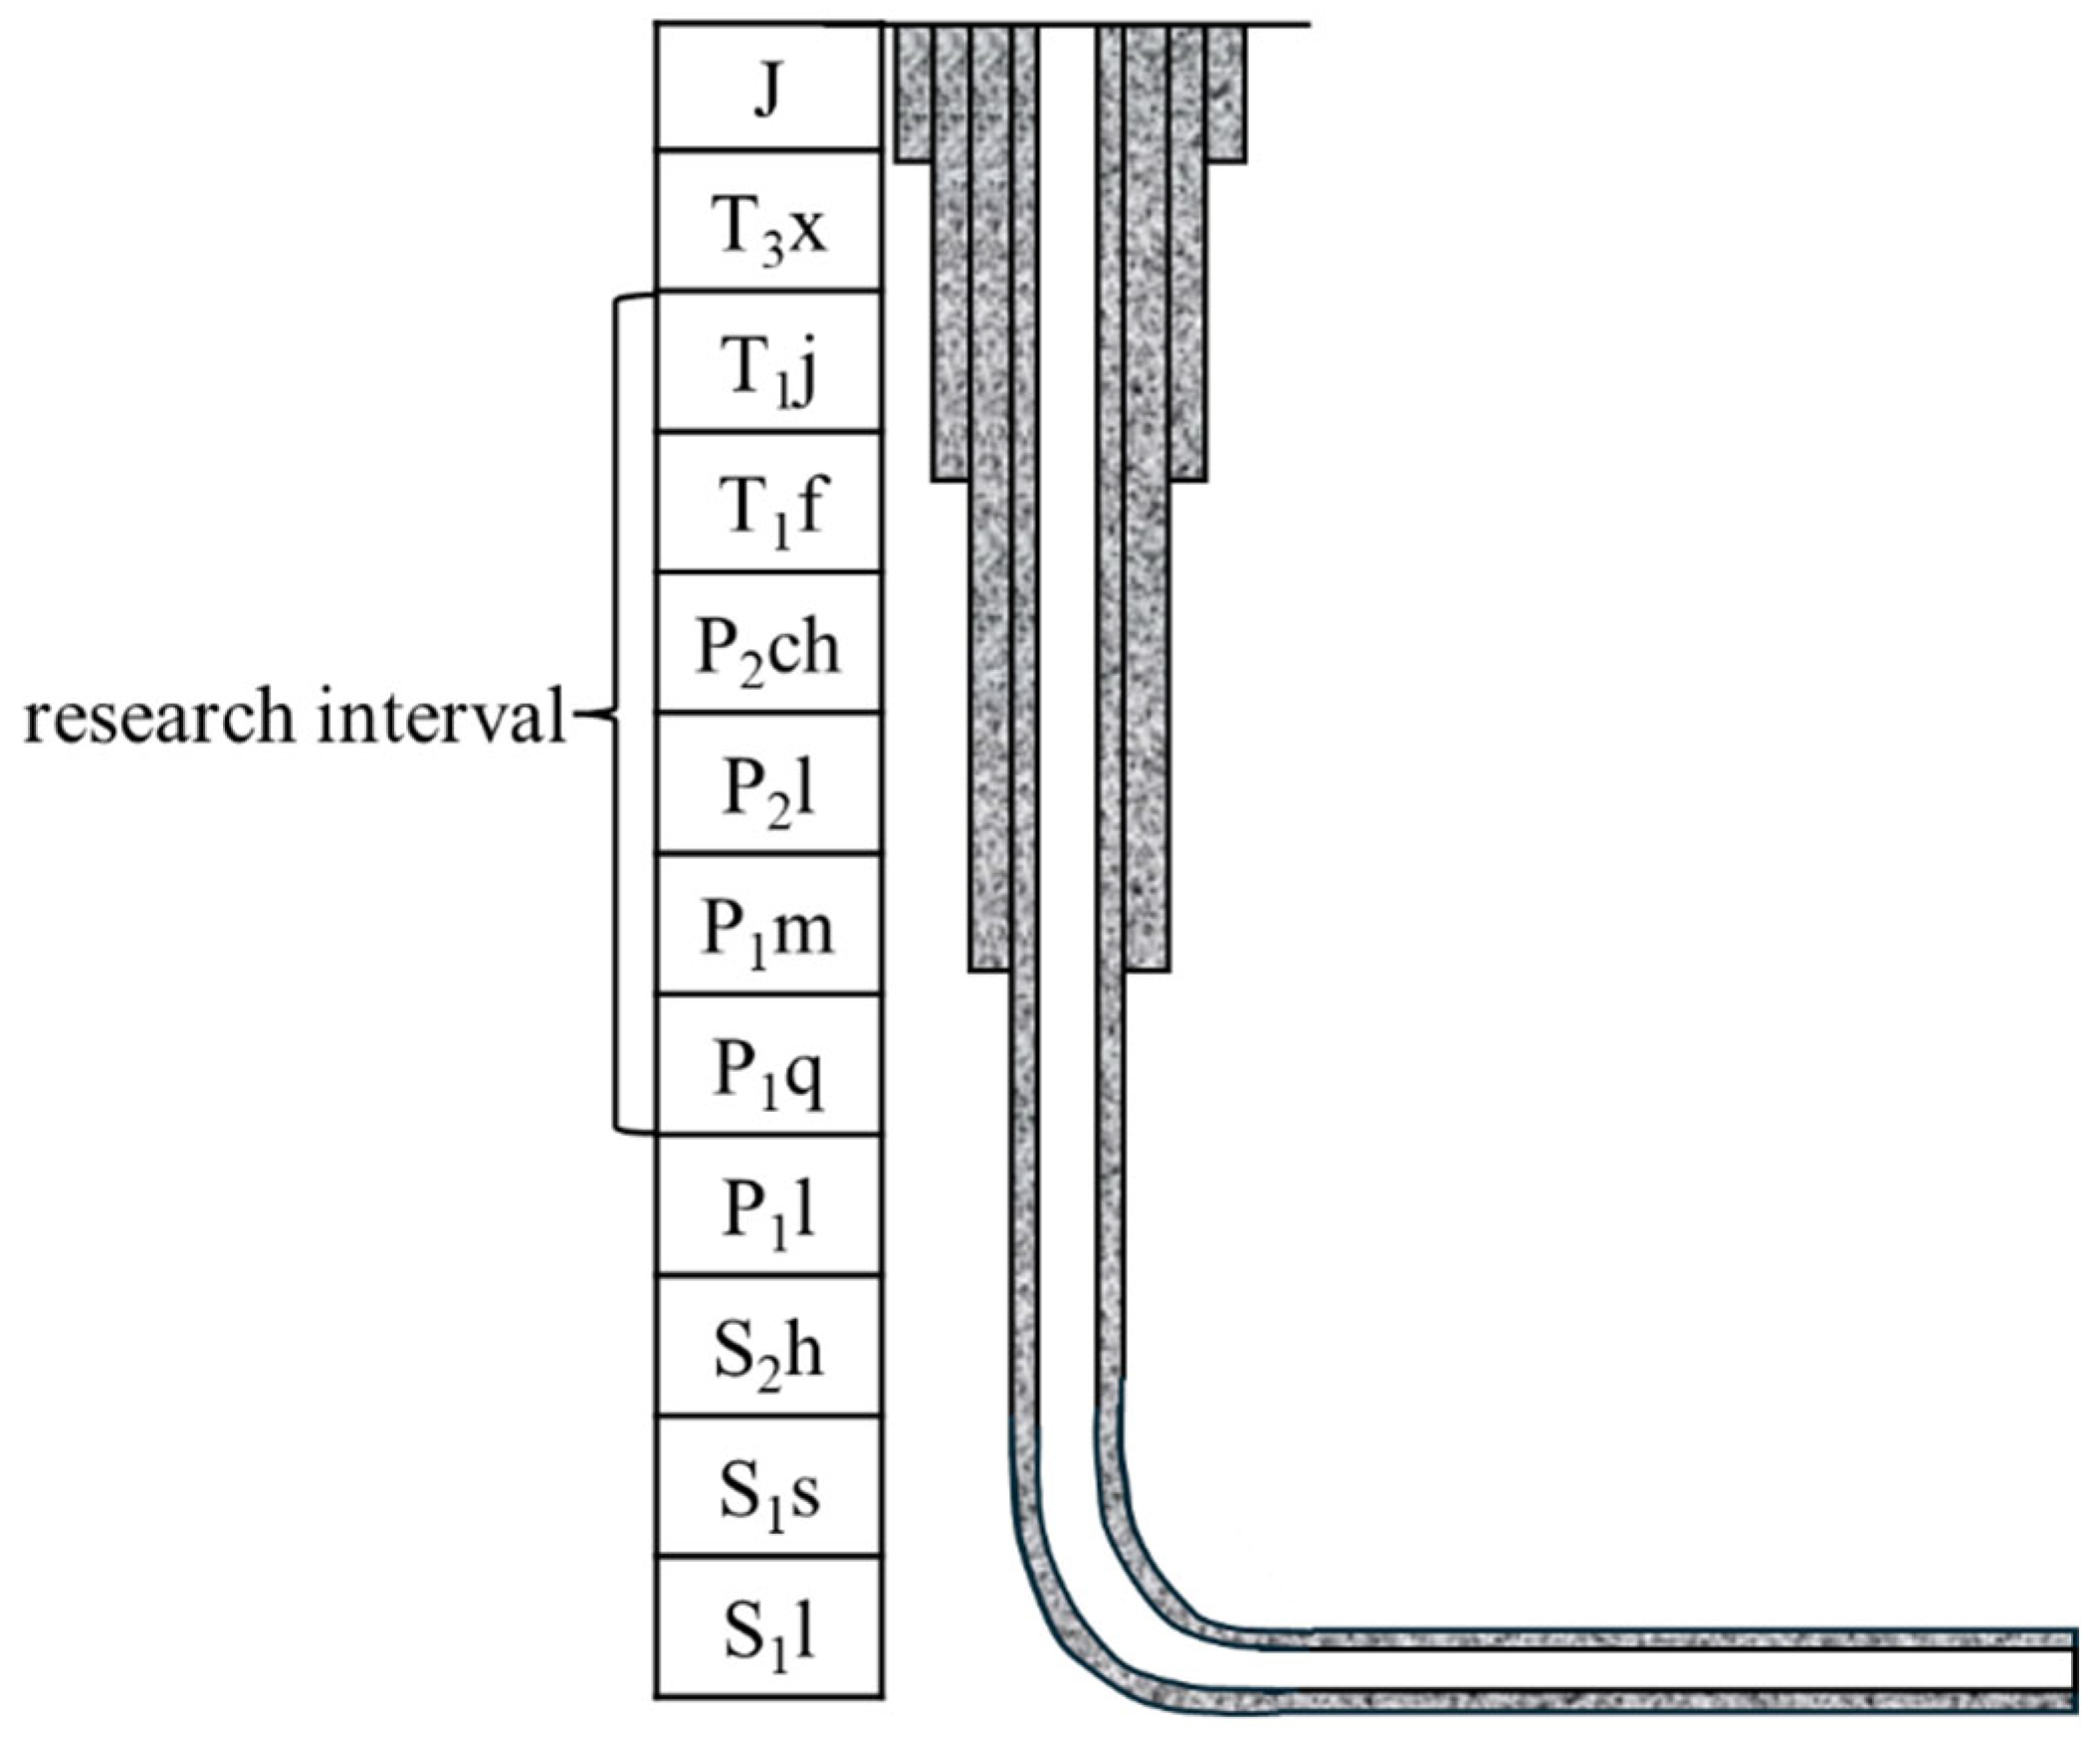
2. Geological Setting

The diagenesis of carbonate rocks is complicated. Besides common compaction, there is also cementation, pressure dissolution, etc., to consider. At the same time, due to the existence of late filling, the secondary pores of carbonate rocks develop and their heterogeneity is strong. The formation mechanism of abnormal high pressure in carbonate rock is complicated due to the development of micro-fractures and the existence of corrosion (such as thermochemical sulfate reduction reactions). The Luzhou Block of Sichuan Basin has a large distribution area of high-quality shale, and is the main block identified for shale gas development for the next 5 to 10 years. The Luzhou Block is located in the northern part of the low–steep structural belt in the southern Sichuan Basin, with developed faults and a series of relatively tight anticlines and broad synclinal structures arranged from north to south in an en-shaped way, featuring multiple folds. Figure 1 provides a geological introduction to the Luzhou Block in southern Sichuan. According to the well drilling data, this block is mainly composed of four well casing structures. The formations calculated in this study range from T1j to P1q, with the specific stratigraphic distribution shown in Figure 2. From top to bottom, the block has successively encountered Jurassic strata, including J2s, J1l, and J1t; Triassic strata, including T3x, T1j, and T1f; Permian strata, including P2ch, P2l, P1m, P1q, and P1l; and Silurian strata, including S2h, S1s, and S1l. Within these, the carbonate formations encountered include T1j, T1f, P2ch, P2l, P1m, and P1q. The lithology is mainly limestone and dolomite, and the formation depth ranges from 1300 to 3500 m.

3. Construction and Optimization of Pore Pressure Prediction Model

Based on the logging data collected in the field and the classical models of different pore pressure prediction methods, the equivalent depth method, Eaton method, and effective stress method were established, respectively. A detailed flow chart of the calculation of formation pressure by the equivalent depth method, Eaton method, and effective stress method is shown in Figure 3.

3.1. Equivalent Depth Method Model

The equivalent depth method dictates that if the acoustic time difference between a certain point and a certain point in the normal compaction section of the formation is equal, then the corresponding effective stress between the two points is equal [40]:
σ 1 = P 1 P p 1 σ 2 = P 2 P p 2 σ 1 = σ 2
where σ1 is the effective stress at the normal compaction point (MPa); P1 is the overburden pressure at the normal compaction point; Pp1 is the formation pressure at the normal compaction point; σ2 is the effective stress of the abnormal high-pressure point (MPa); P2 is the overburden pressure at the abnormal high-pressure point (MPa); and Pp2 is the formation pressure at the abnormal high-pressure point (MPa).
As can be seen from the above formula, the formula of the equivalent depth method to calculate pore pressure is
P p 2 = P p 1 + P 2 P 1
where Pp1 is the hydrostatic pressure (Mpa); the overburden pressures P1 and P2 (MPa) can be obtained by density logging.
Well 1# in the Luzhou Block was selected as an example. It is located in the Fuji synclinal structure of the Yanggaosi structure group in the Luzhou Block. According to the collected logging data, the normal compaction section of this well ranges from 0 to 1400 m. To define the normal compaction trend, several shale-dominated intervals were identified based on gamma-ray log responses and lithological descriptions from mud logging. These intervals were further evaluated by plotting porosity (or sonic transit time) versus depth. Intervals affected by overpressure, tectonic deformation, or lithological heterogeneity were excluded. The interval with the best linear correlation (R2 > 0.80) was selected to construct the normal compaction trend line, ensuring that the compaction trend reflected normal burial conditions. The established normal compaction trend line is shown in Figure 4. The expression of the normal compaction trend line is
Δ t = 89.79 e 0.0003 H
According to the normal compaction trend line, the equivalent depth corresponding to the abnormal pressure point in the lower part was calculated. The corresponding overburden pressure was calculated according to the equivalent depth point, and then the formation pressure was calculated according to Equation (2).

3.2. Eaton Method Model

In 1975, Eaton proposed the Eaton method by analyzing the internal relationship between pore pressure and conventional logging in areas such as the Gulf of Mexico [41,42]. It is easy to obtain the data requirements of the Eaton method to predict pore pressure, such as acoustic time, resistivity, etc. Using acoustic time or resistivity data, the relationship between pore pressure changes and longitudinal velocity or resistivity changes is estimated by determining the Eaton index [43]; this approach can also be applied elsewhere [23]. But the prediction of pore pressure based on resistivity depends on many variables, including salinity, temperature, fluid type, saturation, clay type, etc. Changes in resistivity due to changes in the salinity of pore water near the salt body may misrepresent changes in pore pressure [44]. The expression of the Eaton method based on acoustic time data is as follows [45]:
P p = P 0 P 0 P g Δ t n Δ t x
where Pp is formation pressure, MPa; P0 is the overburden pressure, MPa; Pg is the hydrostatic pore pressure gradient, MPa; Δt is the time of actual acoustic wave propagation in the acoustic time, μs/ft; Δtn is the acoustic time under normal compaction conditions, obtained from the normal trend line, μs/ft; and x is an exponential constant.
The following two points should be noted when using the Eaton method to predict pore pressure:
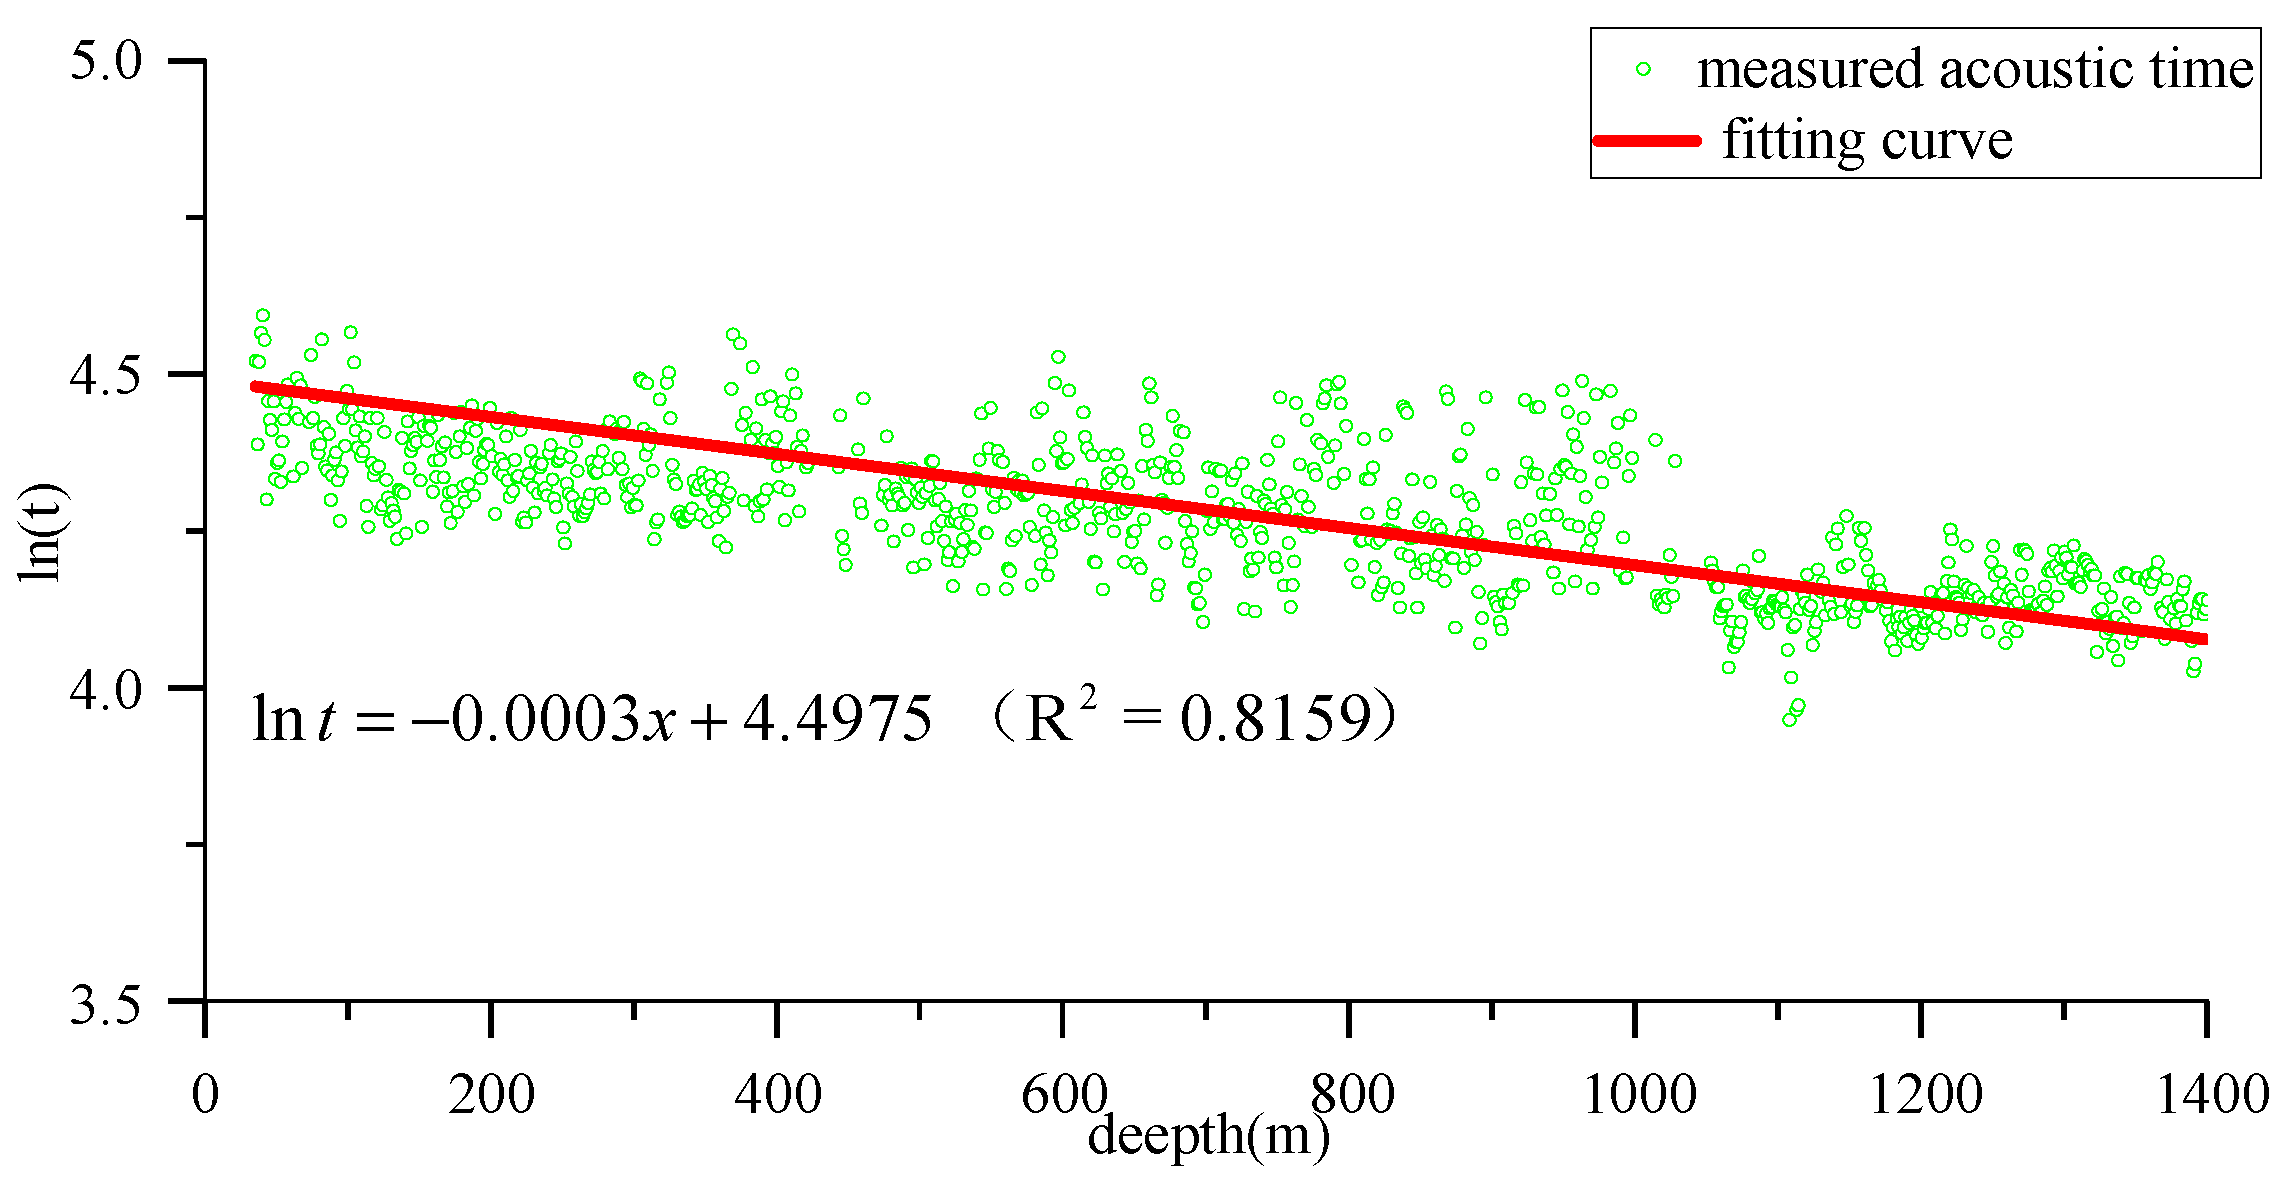
  • Compaction trend line establishment.
Using the Eaton method to predict pore pressure, it is necessary to establish the normal compaction trend line in the study area. To establish the normal compaction trend line, it is necessary to follow the following steps: (1) Select the appropriate formation depth range, usually the interval without oil and gas accumulation and formation anomalies. (2) Draw density logging and acoustic time, and carry out data processing and correction. (3) According to the formation depth, the strata with large trend differences in logging data are divided into several sections, and a certain length of each section is selected for statistical evaluation to establish the compaction trend line.
2.
Determination of Eaton index “x”.
It is found that the Eaton index is different in different regions. For carbonate strata, the Eaton index of different regions is different due to the geological conditions, sedimentary environment, and late geological tectonic movement in the process of sedimentary diagenesis in different regions. For example [46], Azadpour et al. estimated the pore pressure of a carbonate gas reservoir in southern Iran with “x” at 0.5. When Contreas et al. predicted the pore pressure of high-pressure sedimentary basins in western Canada, “x” was 1. Kao et al. estimated pore pressure in the deepwater area of the Gulf of Mexico with a value of “x” of 2.6.
The Eaton index is calculated backwards according to the measured pore pressure, and finally the average value is obtained [47]. The inverse formula is as follows:
x = ln [ P 0 P p / P 0 P g ] ln Δ t n Δ t
According to Equation (5), three wells with measured points in the block are selected, and the Eaton index calculated according to the measured points is shown in Table 1.
Finally, the Eaton index is 1.46. Thus, the Eaton model for predicting the formation pressure of carbonate rocks in the Luzhou Block can be obtained:
P p = P 0 P 0 P g e 0.0003 H + 4.4975 Δ t 1.46

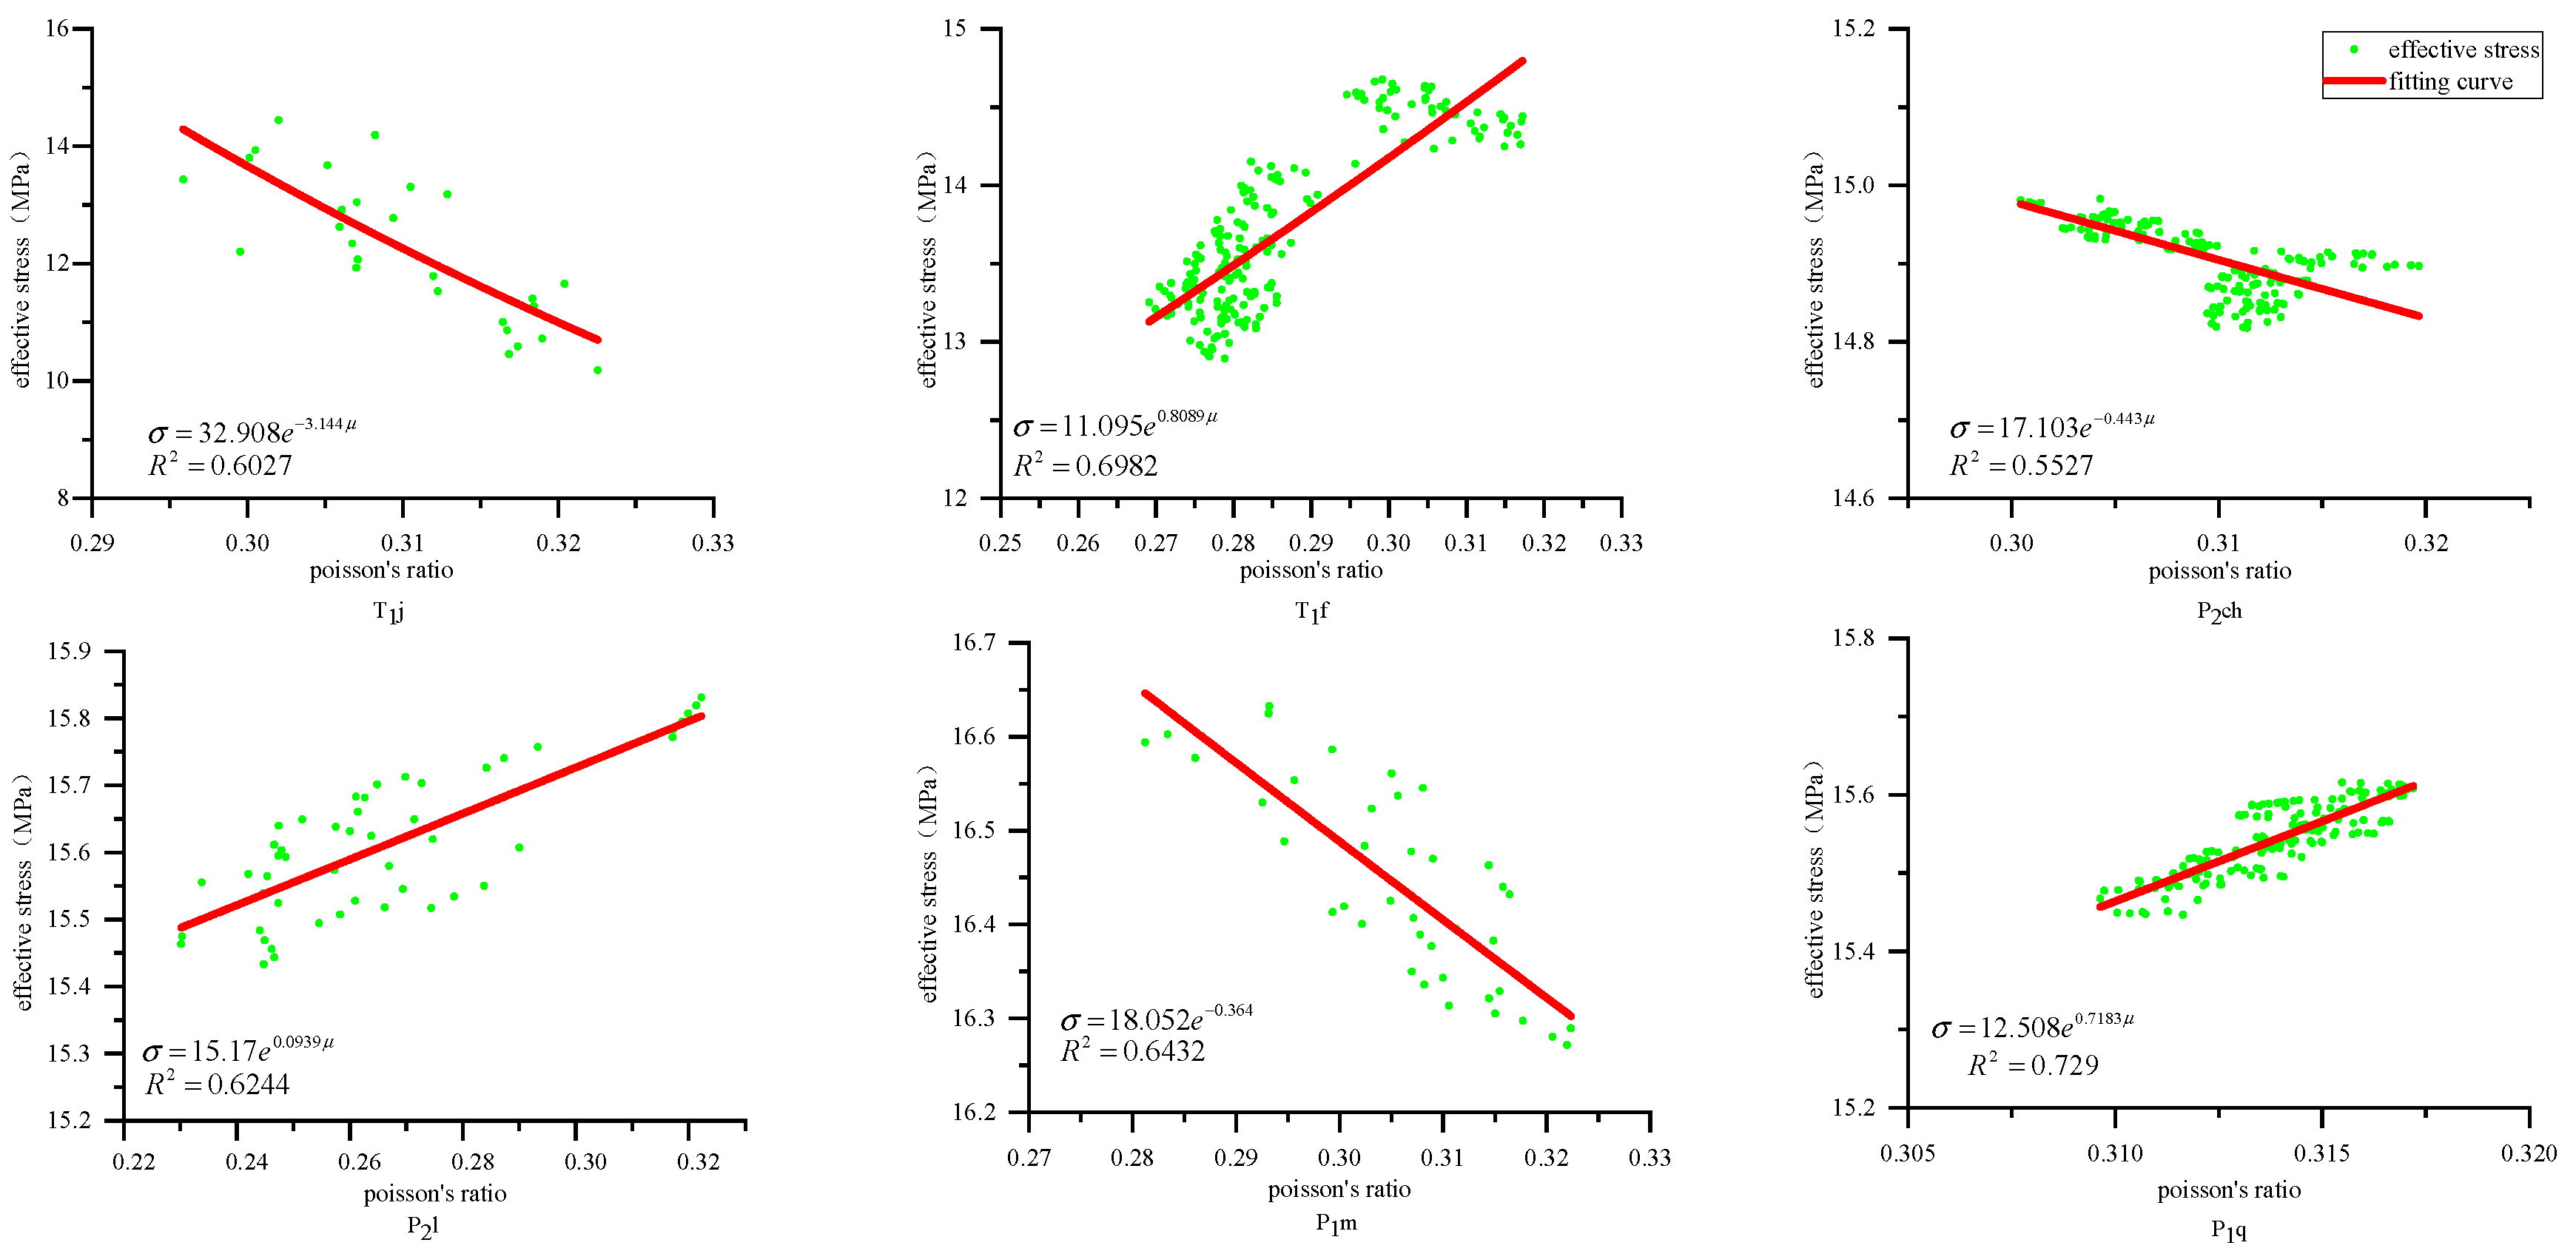
3.3. Effective Stress Method Model

Terzaghi (1923) discussed the mechanical properties of saturated porous media and proposed the concept of effective stress (skeleton stress) [48], which is widely used in the prediction of pore pressure. Baldwin and Baldwin established the relationship between normal compaction curves and effective stress or depth for different sedimentary basins and rock types [49,50]. According to Terzaghi’s effective stress [51], there is an intrinsic quantitative relationship between the effective stress of rocks, the pressure of overlying rocks, and the pore pressure of strata:
σ = P 0 - P p
where σ is the effective stress of rock, MPa; Pp is abnormal formation pore pressure, MPa; and P0 is the overburden pressure, MPa.
The overburden pressure can be calculated from density logging data:
P 0 = 0.00980665 × ( ρ × H 0 + H 0 H ρ b d H )
where H0 is the initial depth of the studied well interval, m; H is the depth of the target zone in the study interval, m; ρ is the mean formation density of the overlying strata, g/cm3; and ρb is the formation density, g/cm3.
The key to the prediction of pore pressure with the effective stress method is the acquisition of effective stress. Based on the calculation of effective stress in carbonate rock formation over many years, many scholars have proposed that there is a relationship between P-wave and S-wave velocity, bulk modulus, Poisson’s ratio, and effective stress [52,53]. In this study, the relationship between effective stress and Poisson’s ratio was mainly established through experimental or field measurement data [54]. Using the least squares method to calculate the parameter values, a model for predicting pore pressure in this block could be obtained.
Poisson’s ratio is necessary when the effective stress method is used to predict pore pressure, and the time of P-waves and S-waves is the basis of determining Poisson’s ratio. The construction or extraction of the S-wave time curve is extremely important work, and its accuracy is directly related to the accuracy of pore pressure prediction.
In this study, the acoustical measurement of the core in the laboratory was used to construct the curve of time of the P-waves and S-waves, and then Poisson’s ratio was obtained. To address the concern regarding potential disturbances during core sampling and laboratory testing, several measures were taken in this study to minimize their impact on wave velocity measurements. First, core samples were carefully handled and stored under pressure-controlled conditions to preserve their in situ structure and reduce desaturation or micro-fracture development. Second, ultrasonic velocity testing was conducted on samples saturated with formation fluid analogs to simulate downhole conditions as closely as possible. Moreover, only intact, unfractured core sections were selected for velocity analysis, and repeated measurements were performed to ensure consistency. While it is acknowledged that some level of disturbance is inevitable during coring and transport, the low standard deviation of repeated wave velocity tests suggests that the impact on the final velocity values is within an acceptable range. Therefore, the calculated Poisson’s ratios and the derived pore pressure values maintain a high degree of reliability.
Figure 5 shows the S- and P-wave velocity fitting relationship. The calculation model between P-waves and S-waves obtained by the experiment is as follows:
y = 1.4762 x + 22.884
When effective stress is used to predict pore pressure, the relationship between effective stress and Poisson’s ratio is established [55]:
σ = a e b μ
The expression of Poisson’s ratio is as follows:
μ = 0.5 × t s / t p 2 1 / t s / t p 2 1
where ts is S-wave velocity, μs/ft, and tp is P-wave velocity, μs/ft.
Poisson’s ratio can be calculated according to the P- and S-wave velocities, and the relationship between effective stress and Poisson’s ratio can be fitted using the final layering position to obtain parameters a and b. The fitting results of parameters of a and b are shown in Figure 6.
Finally, the relationship between effective stress and Poisson’s ratio was fitted according to different layering positions, as shown in Table 2.

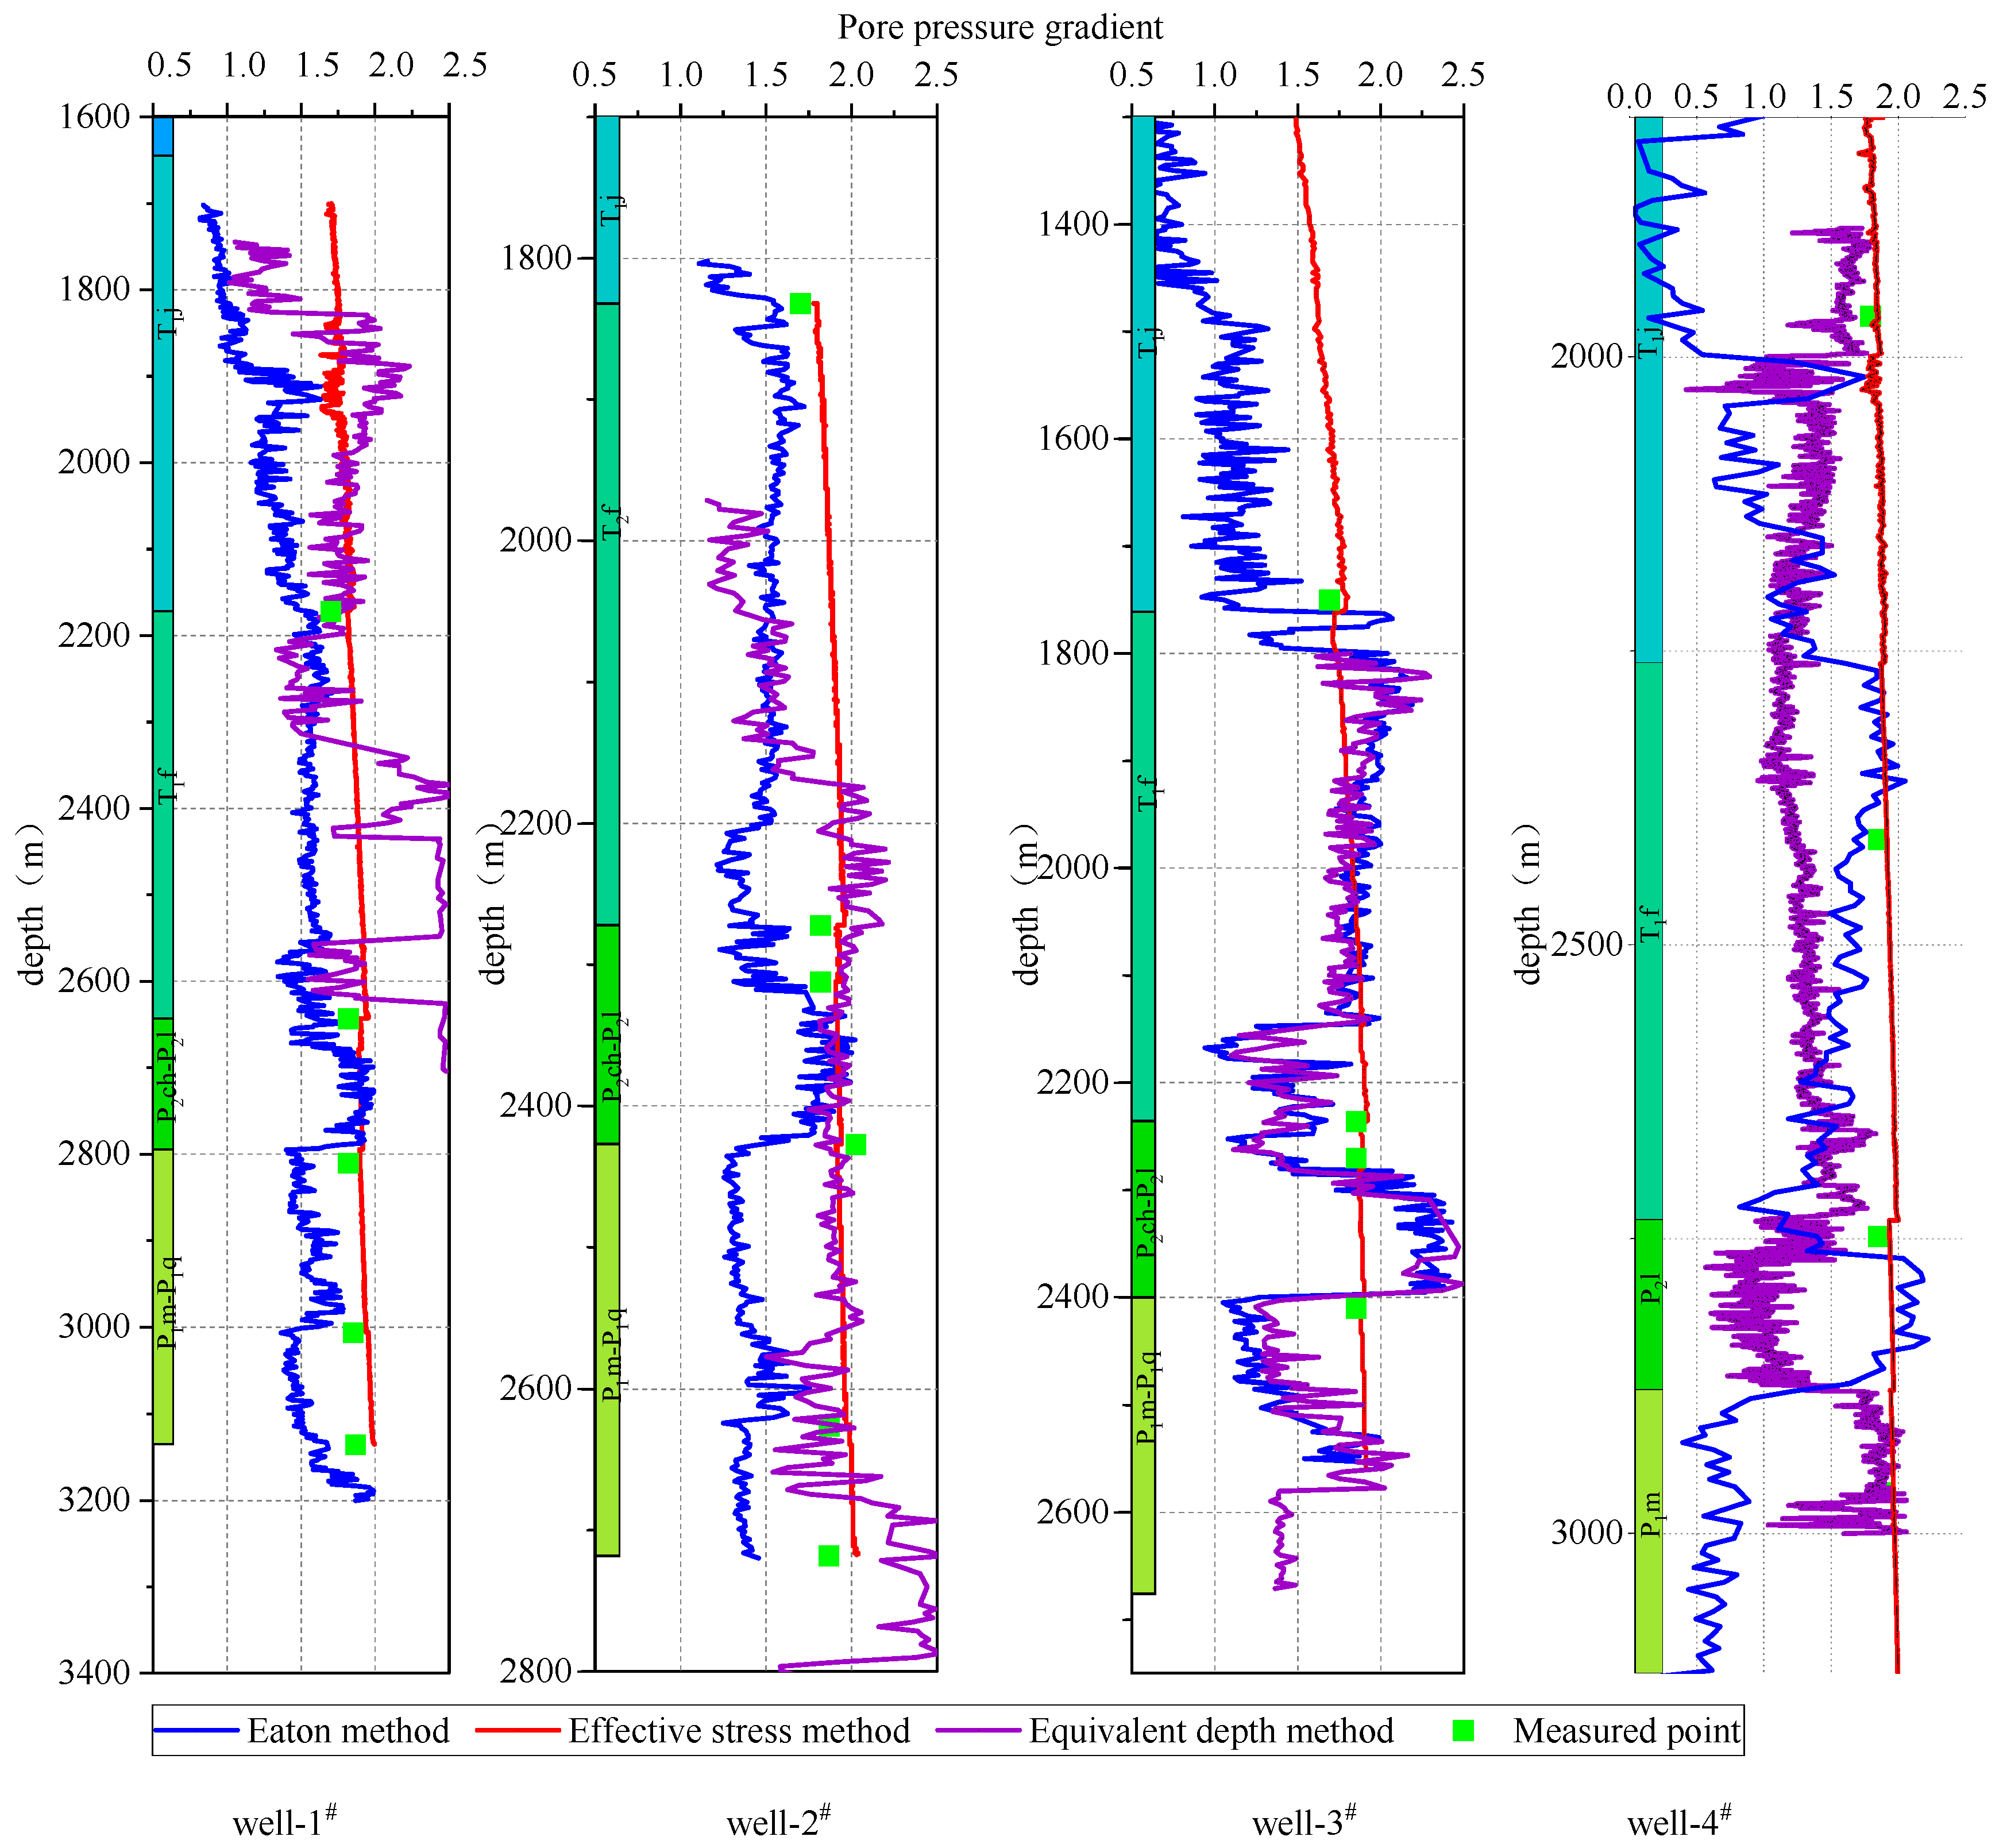
4. Field Application

Based on the above method, three wells of well 1#, well 2#, well 3#, and well 4# were selected, and three wells were drilled successively into T1j, T1f, P2ch, P2l, P1m, and P1q from top to bottom. The carbonate rock bottom depths of well 1#, well 2#, well 3#, and well 4# were 3135 m, 2720 m, 2680 m, and 3000 m, respectively. Among them, when well 3# was drilled into P1q, the predicted pore pressure gradient of the adjacent well was 1.87 g/cm3. When drilling fluid with 2.01 g/cm3 density was drilled to 2400 m, oil and gas flow-up occurred, and the accident was relieved after the drilling fluid density was raised to 2.08 g/cm3. Pore pressure profiles of the above three wells were established, and the results are shown in Figure 7. For carbonate formations in the Luzhou Block, the Eaton method showed a large fluctuation. The longitudinal distribution law of pore pressure was not consistent with the measured point data, and the prediction accuracy was low. The predicted results of the effective stress method were in good agreement with the measured data and could reflect the characteristics of formation pressure distribution in the target block.
The errors between the measured points and the predicted values of the three wells were counted, and the prediction results of pore pressure in the Luzhou Block were compared, as shown in Table 3. As can be seen from Table 3, the pore pressure predicted by the effective stress method was in good agreement with the measured pore pressure, with a maximum error of 8.4% and an average error of 5.3%. The predicted pore pressure of the Eaton method and equivalent depth method had a large error compared with the measured pore pressure. The maximum error of the equivalent depth method was 21.4%, and the average error was 12.5%. The maximum error of the Eaton method was 27.5%, and the average error was 12.2%. Therefore, the accuracy of the effective stress method in predicting carbonate pore pressure was significantly higher than that of the equivalent depth method and Eaton method, and was suitable for application in the study block after the parameters were optimized.
The prediction of pore pressure by the Eaton method and equivalent depth method requires the establishment of normal compaction curves. Carbonate rocks are chemically cemented and have high skeleton strength, which may cause large errors between the predicted results and the actual values. Based on Terzaghi’s effective stress theorem, the effective stress method holds that there is an intrinsic quantitative relationship between pore pressure, overburden pressure, and effective stress. The overlying rock pressure can be calculated by density logging, so the key to predicting pore pressure by this method is to calculate the effective stress. The results show that the rock mechanics parameters are closely related to the effective stress of the rock, and the rock mechanics parameters can be calculated from the P-wave velocity, S-wave velocity, and density logging. The effective stress method is not limited to the lithology and the formation mechanism of abnormal high pressure, and avoids the difficulty of establishing normal compaction trend lines for complex lithology. Instead, its pore pressure prediction is based on the mechanical properties of rock, which has high prediction accuracy.
Although the effective stress method demonstrates significantly improved accuracy compared to the equivalent depth and Eaton methods, a small deviation still exists between the predicted and measured pore pressure values, as shown in Figure 7. This difference can be attributed to several factors. First, there may be inherent uncertainties in the estimation of rock mechanical parameters, such as P-wave and S-wave velocities, especially due to core disturbance or laboratory measurement limitations. Second, the effective stress model relies on empirical fitting relationships that may not fully capture the micro-scale heterogeneity and anisotropy of carbonate formations, especially in deeply buried or fractured zones. Third, the logging and measurement data used as inputs may carry calibration errors or be affected by borehole conditions, such as mud invasion or tool positioning. Despite these limitations, the maximum prediction error remained below 8.4%, indicating the robustness and field applicability of the method. Future improvements could include integrating real-time logging-while-drilling (LWD) data and refining the stress–velocity models through more core calibration experiments under in situ stress conditions.

5. Conclusions

In this study, three pore pressure prediction methods—the equivalent depth method, the Eaton method, and the effective stress method—were applied to the Luzhou Block to evaluate their performance in carbonate formations. The results indicate that both the equivalent depth and Eaton methods exhibit relatively large prediction errors, with maximum errors of 21.4% and 27.5%, and average errors of 12.5% and 12.2%, respectively. In contrast, the effective stress method achieved a significantly lower maximum error of only 4.77%, demonstrating superior prediction accuracy and greater reliability under complex geological conditions. From a rock mechanics perspective, the effective stress method is grounded in Terzaghi’s effective stress principle, indirectly deriving pore pressure by calculating effective stress. Its physical basis and flexibility in incorporating formation-specific mechanical parameters make it more adaptable to variable lithologies, particularly in carbonate reservoirs. However, this study has certain limitations. The validation was conducted on a limited number of wells, which may restrict the generalizability of the conclusions across the entire block. In addition, the model assumes uniform compaction behavior within each stratigraphic unit, which may not fully capture local heterogeneities.
Future work should focus on enhancing the effective stress method through laboratory rock mechanics experiments conducted under in situ reservoir conditions. Establishing robust relationships between effective stress and rock mechanical properties—by integrating static core test data with dynamic geophysical and well logging data—will further improve the reliability and applicability of the model. This would allow for more accurate pore pressure prediction across different stratigraphic intervals and lithologies.

Author Contributions

Conceptualization, W.L. and P.L.; Methodology, Y.Z.; Formal analysis, X.H.; Resources, P.L. and Y.H.; Data curation, Q.W.; Writing—original draft, W.L., Q.W. and Y.Z.; Writing—review & editing, Y.L., J.Z. and Y.H. All authors have read and agreed to the published version of the manuscript.

Funding

This research received no external funding.

Data Availability Statement

The original contributions presented in the study are included in the article, further inquiries can be directed to the corresponding author.

Conflicts of Interest

Author Jinghong Zhou was employed by the company Sichuan Oil and Gas Field Branch of China National Petroleum Corporation. The remaining authors declare that the research was conducted in the absence of any commercial or financial relationships that could be construed as a potential conflict of interest.

Abbreviations

The following abbreviations are used in this manuscript:
AbbreviationFull Term
J2sSha Ximiao Formation
J1lLiang Gaoshan Formation
J1tZi Liujing Formation
T3xLiang Gaoshan Formation
T1jJia Lingjiang Formation
T1fFei Xianguan Formation
P2chChang Xing Formation
P2lLong Tan Formation
P1mMao Kou Formation
P1qQi Xia Formation
P1lLiang shan Formation
S2hShi Niulan Formation
S1sShi Niulan Formation
S1lLong Maxi Formation

References

  1. Polito Carmine, P.; Green Russell, A.; Lee, J. Pore Pressure Generation Models for Sands and Silty Soils Subjected to Cyclic Loading. J. Geotechnol. Geoenviron. Eng. 2008, 134, 1490–1500. [Google Scholar] [CrossRef]
  2. Ba, J.; Min, J.; Zhang, L.; Carcione, J.M. Effects of Stress on Transport Properties in Fractured Porous Rocks. Lithosphere 2024, 2024, lithosphere_2023_103. [Google Scholar] [CrossRef]
  3. Ghorbani, H.; Wood, D.A.; Moghadasi, J.; Choubineh, A.; Abdizadeh, P.; Mohamadian, N. Predicting liquid flow-rate performance through wellhead chokes with genetic and solver optimizers: An oil field case study. J. Pet. Explor. Prod. Technol. 2019, 9, 1355–1373. [Google Scholar] [CrossRef]
  4. Rashidi, S.; Mohamadian, N.; Ghorbani, H.; Wood, D.A.; Shahbazi, K.; Alvar, M.A. Shear modulus prediction of embedded pressurized salt layers and pinpointing zones at risk of casing collapse in oil and gas wells. J. Appl. Geophys. 2020, 183, 104205. [Google Scholar] [CrossRef]
  5. Zhang, G.; Lu, P.; Luo, P.; Sonnenthal, E.; Huang, Y.; Zhu, C. Effects of natural gas acidic components on local porosity generation in a carbonate reservoir: Insights from reactive transport modeling. AAPG Bull. 2019, 103, 2975–3001. [Google Scholar] [CrossRef]
  6. Reynolds, S.J.; Lister, G. Structural aspects of fluid-rock interactions in detachment zones. Geology 1987, 15, 362–366. [Google Scholar] [CrossRef]
  7. Conaway, J.G.; Bristow, Q.; Killeen, P.G. Optimization of gamma-ray logging techniques for uranium. Geophysics 1980, 45, 292–311. [Google Scholar] [CrossRef]
  8. Dahlberg, E.C. Formation Pressure Measurements and Data. In Applied Hydrodynamics in Petroleum Exploration; Dahlberg, E.C., Ed.; Springer: New York, NY, 1995; pp. 15–33. [Google Scholar]
  9. Stunes, S.D. Methods of Pore Pressure Detection from Real-time Drilling Data. Master’s Thesis, Norwegian University of Science and Technology, Ålesund, Norway, 2012. [Google Scholar]
  10. Adali, F.; Dosunmu, A.; Oriji, A. Real Time Optimization Model for Efficient Drilling Operations in the Oil and Gas Industry. Int. J. Sci. Eng. Res. 2020, 8, 38–47. [Google Scholar] [CrossRef]
  11. Kumar, R.; Al-Saeed, M.A.; Al-Kandiri, J.M.; Verma, N.K.; Al-Saqran, F. Seismic based pore pressure prediction in a West Kuwait field. In Proceedings of the 2010 SEG Annual Meeting, Denver, Colorado, 17–22 October 2010; pp. 2289–2293. [Google Scholar]
  12. Mahetaji, M.; Brahma, J. Prediction of Minimum Mud Weight for Prevention of Breakout Using New 3D Failure Criterion to Maintain Wellbore Stability. Rock Mech. Rock Eng. 2024, 57, 2231–2252. [Google Scholar] [CrossRef]
  13. Yao, Q.; Han, D.-H. Effect of Compaction History on Pore Pressure Prediction. In Proceedings of the Beijing 2009 International Geophysical Conference and Exposition, Beijing, China, 24–27 April 2009; Volume 28, pp. 2208–2212. [Google Scholar] [CrossRef]
  14. Atashbari, V.; Tingay, M. Pore Pressure Prediction in a Carbonate Reservoir. In Proceedings of the SPE Oil and Gas India Conference and Exhibition, Mumbai, India, 28–30 March 2012; Volume 1. [Google Scholar] [CrossRef]
  15. Eaton, B.A. Graphical method predicts geopressures worldwide. World Oil 1976, 183, 100–104. [Google Scholar]
  16. Manandhar, S.; Shrestha, U.; Yasufuku, N.; Omine, K.; Kobayashi, T. Safe bearing capacity evaluation of the bridge site along Syafrubesi-Rasuwagadhi road, Central Nepal. Bull. Dep. Geol. 2009, 12, 95–100. [Google Scholar] [CrossRef]
  17. Guo, Z.-H.; Lin, Y.-P. Selection of Normal Compaction Trend Line for Abnormal High Pressure Reservoirs in Fergana Basin. In Proceedings of the 8th International Field Exploration and Development Conference, IFEDC 2019, Chengdu, China, 16–18 October 2019; pp. 2076–2082. [Google Scholar]
  18. Shibo, H.; Wujun, J. Logging evaluation method for pore pressure of shale gas reservoirs-taking fuling area, Sichuan basin as an example. Open Pet. Eng. J. 2015, 8, 350–353. [Google Scholar] [CrossRef]
  19. Qiang, W.; Yaoting, L.; Gang, G.; Zhixian, G.; Zhendong, W.; Jiaqi, L. Research on Formation Pressure Prediction Method for Ultra-Deep Tight Sandstone Based on Collocated Cokriging. Process 2023, 11, 2010. [Google Scholar] [CrossRef]
  20. Kablan, O.A.B.K.; Chen, T. Shale Gas Reservoir Pore Pressure Prediction: A Case Study of the Wufeng–Longmaxi Formations in Sichuan Basin, Southwest China. Energies 2023, 16, 7280. [Google Scholar] [CrossRef]
  21. Hamid, O.; Al-Qahtani, A.; Albahrani, H.; Pamukcu, Y. A novel method for predicting 3D pore pressure in over-pressured carbonates. In Proceedings of the SPE Abu Dhabi International Petroleum Exhibition and Conference 2017, Abu Dhabi, United Arab Emirates, 13–16 November 2017. [Google Scholar]
  22. Shi, H.; Zhou, D.; Lu, D. Application of formation pressure prediction based on effective stress in Bohai BZ1 area. Pet. Geol. Eng. 2014, 28, 113–115. (In Chinese) [Google Scholar] [CrossRef]
  23. Eaton, B.A.; Eaton, T.L. Fracture gradient prediction for the new generation. SPE Repr. Ser. 1999, 49, 108–112. [Google Scholar]
  24. Oloruntobi, O.; Butt, S. The new formation bulk density predictions for siliciclastic rocks. J. Pet. Sci. Eng. 2019, 180, 526–537. [Google Scholar] [CrossRef]
  25. Tingay, M.R.P.; Hillis, R.R.; Swarbrick, R.E.; Morley, C.K.; Damit, A.R. Origin of overpressure and pore-pressure prediction in the Baram province, Brunei. AAPG Bull. 2009, 93, 51–74. [Google Scholar] [CrossRef]
  26. Osarogiagbon, A.U.; Oloruntobi, O.; Khan, F.; Venkatesan, R.; Gillard, P. Combining porosity and resistivity logs for pore pressure prediction. J. Pet. Sci. Eng. 2021, 205, 108819. [Google Scholar] [CrossRef]
  27. Li, H.; Tan, Q.; Deng, J.; Dong, B.; Li, B.; Guo, J.; Zhang, S.; Bai, W. A Comprehensive Prediction Method for Pore Pressure in Abnormally High-Pressure Blocks Based on Machine Learning. Processes 2023, 11, 2603. [Google Scholar] [CrossRef]
  28. Zhang, J. Effective stress, porosity, velocity and abnormal pore pressure prediction accounting for compaction disequilibrium and unloading. Mar. Pet. Geol. 2013, 45, 2–11. [Google Scholar] [CrossRef]
  29. López, J.L.; Rappold, P.M.; Ugueto, G.A.; Wieseneck, J.B.; Vu, C.K. Integrated shared earth model: 3D pore-pressure prediction and uncertainty analysis. Lead. Edge 2004, 23, 52–59. [Google Scholar] [CrossRef]
  30. Liu, L.; Shen, G.; Wang, Z.; Yang, H.; Han, H.; Cheng, Y. Abnormal formation velocities and applications to pore pressure prediction. J. Appl. Geophys. 2018, 153, 1–6. [Google Scholar] [CrossRef]
  31. Cheng, Y. Wellhead Stability during Development Process of Hydrate Reservoir in the Northern South China Sea: Evolution and Mechanism. Processes 2024, 13, 40. [Google Scholar] [CrossRef]
  32. Li, Q.; Li, Q.; Cao, H.; Wu, J.; Wang, F.; Wang, Y. The Crack Propagation Behaviour of CO2 Fracturing Fluid in Unconventional Low Permeability Reservoirs: Factor Analysis and Mechanism Revelation. Processes 2025, 13, 159. [Google Scholar] [CrossRef]
  33. Atashbari, V.; Tingay, M. Pore Pressure Prediction in Carbonate Reservoirs. In Proceedings of the SPE Latin America and Caribbean Petroleum Engineering Conference, Mexico City, Mexico, 16–18 April 2012. [Google Scholar]
  34. Deng, S.; Fan, H.; Liu, Y.; He, Y.; Zhang, S.; Yang, J.; Fu, L. Two innovative pore pressure calculation methods for shallow deep-water formations. J. Appl. Geophys. 2017, 146, 208–213. [Google Scholar] [CrossRef]
  35. Osorio, J.G.; Muzzio, M. Correlation Between Microseismicity and Geomechanics Factors Affecting the Hydraulic Fracturing Performance in Unconventional Reservoirs—A Field Case in Neuquén, Argentina. In Proceedings of the 47th U.S. Rock Mechanics/Geomechanics Symposium, San Francisco, CA, USA, 23–26 June 2013; pp. 1990–2002. [Google Scholar]
  36. Hutomo, P.S.; Rosid, M.S.; Haidar, M.W. Pore Pressure Prediction Using Eaton and Neural Network Method in Carbonate Field “X” Based on Seismic Data. IOP Conf. Ser. Mater. Sci. Eng. 2019, 546, 17–32. [Google Scholar] [CrossRef]
  37. LIU, Z.; Tang, X. On Predicting Formation Pore Pressure Method of Volcanic Rock with Log Data. Well Logging Technol. 2011, 3, 568–571. (In Chinese) [Google Scholar] [CrossRef]
  38. Luo, C.; Li, j.; Li, Z.; Zhang, D.; Tong, K.; Dai, Y.; Hu, X. Structural deformation characteristies and formation processof Luzhou Block in Sichuan Basin, China. J. Chengdu Univ. Technol. (Sci. Technol. Ed. ) 2022, 49, 665–673. (In Chinese) [Google Scholar] [CrossRef]
  39. Fan, C.; Nie, S.; Li, H.; Radwan, A.E.; Pan, Q.; Shi, X.; Li, J.; Liu, Y.; Guo, Y. Quantitative prediction and spatial analysis of structural fractures in deep shale gas reservoirs within complex structural zones: A case study of the Longmaxi Formation in the Luzhou area, southern Sichuan Basin, China. J. Asian Earth Sci. 2024, 263, 106025. [Google Scholar] [CrossRef]
  40. Jing, C. Pressure Predicting Methods Based on Overpressure Genetie Mechanisms and Its Application. Well Logging Technol. 2018, 42, 460–465. (In Chinese) [Google Scholar] [CrossRef]
  41. Eaton, B.A. The Effect of Overburden Stress on Geopressure Prediction from Well Logs. J. Pet. Technol. 1972, 24, 929–934. [Google Scholar] [CrossRef]
  42. Radwan, A.E. A multi-proxy approach to detect the pore pressure and the origin of overpressure in sedimentary basins: An example from the Gulf of Suez rift basin. Front. Earth Sci. 2022, 10, 967201. [Google Scholar] [CrossRef]
  43. Keshavarzi, R.; Jahanbakhshi, R.; Rashidi, M. Predicting Formation Fracture Gradient In Oil And Gas Wells: A Neural Network Approach. In Proceedings of the 45th U.S. Rock Mechanics/Geomechanics Symposium, San Francisco, CA, USA, 26–29 June 2011; p. ARMA–11-114. [Google Scholar]
  44. Rizvi, A.; Saleh, S.T.; Williams, K. Automating Pore-Pressure Prediction in Subsalt Sediments. In Proceedings of the Offshore Technology Conference, Houston, TX, USA, 6–9 May 2013; p. OTC–24159-MS. [Google Scholar]
  45. Xu, Y.; Pang, X.; Hu, T.; Xu, T.; Zheng, X. Seleetion of Formation Pressure Predietion Methods Based on Mudstone interval Transit Time. Spec. Oil Gas Reserv. 2018, 25, 46–50. (In Chinese) [Google Scholar] [CrossRef]
  46. Hossein, M.; Ali, R.M. A nonlinear approach for predicting pore pressure using genetic algorithm in one of the Iranian petroleum carbonate reservoirs. Arab. J. Geosci. 2020, 13, 688. [Google Scholar] [CrossRef]
  47. Xu, Y.; He, B.; Yang, L. Prediction Method of Formation Pore Pressure Driven by the Coupling of Depth Learning and Eaton Method. In Proceedings of the Computational and Experimental Simulations in Engineering, Shenzhen, China, 26–29 May 2023; pp. 89–102. [Google Scholar]
  48. Liang, H.; Fan, H.; Jia, L.; Wang, Y. New method of formation pore pressure detection by interval transit time. Oil Drill. Prod. Technol. 1998, 20, 1–5+110. (In Chinese) [Google Scholar] [CrossRef]
  49. Carcione, J.M.; Gei, D.; Picotti, S.; Qadrouh, A.N.; Alajmi, M.; Ba, J. Rock Acoustics of Diagenesis and Cementation. Pure Appl. Geophys. 2022, 179, 1919–1934. [Google Scholar] [CrossRef]
  50. Pommer, M.; Milliken, K. Pore types and pore-size distributions across thermal maturity, Eagle Ford Formation, southern Texas. AAPG Bull. 2015, 99, 1713–1744. [Google Scholar] [CrossRef]
  51. Deneale, S.; Bishop, N.A.; Buetikofer, L.B.; Sisson, R.; Sasthav, C.; Musa, M.; Wilcox, T.; Stewart, K.; Tingen, W.; Derolph, C.R. Hydropower Geotechnical Foundations: Current Practice and Innovation Opportunities for Low-Head Applications; Oak Ridge National Laboratory: Oak Ridge, TN, USA, 2020.
  52. Wang, Z.; Wang, R.; Shan, X.; Zang, Y.; Zhang, R.; Li, M. Uncertainty analysis of pore pressure prediction in carbonate formation using conventional methods. Zhongguo Shiyou Daxue Xuebao (Ziran Kexue Ban)/J. China Univ. Pet. (Ed. Nat. Sci.) 2014, 38, 96–101. [Google Scholar] [CrossRef]
  53. Cheng, Y.-F.; Shi, X.; Li, L.; Wu, L.-Y.; Mei, W. A novel pore pressure prediction model of carbonate formation with fracture development. Zhongguo Shiyou Daxue Xuebao (Ziran Kexue Ban)/J. China Univ. Pet. (Ed. Nat. Sci.) 2013, 37, 83–87+97. (In Chinese) [Google Scholar] [CrossRef]
  54. Khoshnevis-zadeh, R.; Hajian, A.; Larki, E. Pore Pressure Prediction and Its Relationship with Rock Strength Parameters and Weight on Bit in Carbonate Reservoirs (A Case Study, South Pars Gas Field). Arab. J. Sci. Eng. 2021, 46, 6939–6948. [Google Scholar] [CrossRef]
  55. Xia, H.; You, X.; Lin, Z.; Song, Y. Logging calculation for pore pressure on carbonate rock formation based on effectiveness stress method. Drill. Prod. Technol. 2005, 28, 28–30. (In Chinese) [Google Scholar] [CrossRef]
Figure 1. Geological introduction to Luzhou Block in southern Sichuan [38,39].
Energies 18 02647 g001
Figure 2. Schematic diagram of typical well structure in Luzhou Block.
Energies 18 02647 g002
Figure 3. Calculation process of formation pressure by equivalent depth method, Eaton method, and effective stress method.
Energies 18 02647 g003
Figure 4. Measured acoustic time and normal compaction trend line.
Energies 18 02647 g004
Figure 5. S- and P-wave velocity fitting relationship.
Energies 18 02647 g005
Figure 6. Fitting between effective stress and Poisson’s ratio.
Energies 18 02647 g006
Figure 7. Comparison of pore pressure prediction results.
Energies 18 02647 g007
Table 1. Reverse calculation of Eaton index “x”.
Depth (m)Measured Pore Pressure Pp (MPa)Overburden Pressure
P0 (MPa)
Hydrostatic Column Pressure
Pg (MPa)
Normal Compaction Acoustic Time
tn)
Measured Acoustic Time
t)
Inverse Eaton Index “x
2171.836.2254.9721.9446.8068.881.46
2642.847.1967.2226.7040.6466.091.45
281050.1771.5728.3938.6562.501.46
300654.5576.6530.3736.4460.491.46
313557.5180.0331.6835.0658.881.47
183230.5546.1618.5151.8376.941.45
227240.5657.8422.9645.4273.661.45
231241.2858.8723.3644.8872.691.46
242748.0961.7924.5243.3586.281.45
262447.6266.9426.5140.8768.211.44
271849.8669.4127.4639.7367.071.46
175029.0143.1717.6853.1279.571.45
2235.940.5856.1622.5945.9177.931.45
227041.2057.0322.9445.4476.721.46
241043.7460.5124.3543.5874.201.44
Table 2. The relationship between effective stress and Poisson’s ratio at different layers.
LayerFitting Curve
T1j σ = 32.908 e 3.144 μ
T1f σ = 11.095 e 0.8089 μ
P2ch σ = 17.103 e 0.443 μ
P2l σ = 15.17 e 0.0939 μ
P1m σ = 18.052 e 0.364 μ
P1q σ = 12.508 e 0.7183 μ
Table 3. Error comparison of the three methods.
WellDepth/mMeasured Pore Pressure GradientPrediction of Pore Pressure and Error
Equivalent Depth MethodEaton MethodEffective Stress Method
Predicted ValueError/%Predicted ValueError/%Predicted ValueError/%
(Well 1#)18321.701.9514.61.577.81.85.6
22721.821.649.91.678.11.715.9
23121.821.517.71.5912.61.915.1
24272.022.4521.42.124.61.887.1
26261.872.3123.52.049.11.996.4
27181.871.813.22.1213.22.038.4
(Well 2#)2171.81.701.869.11.5011.61.805.8
2642.81.821.5514.61.716.11.946.6
2794.41.831.725.71.5217.11.914.4
30061.851.5317.11.6311.91.955.3
31351.872.1313.71.699.61.996.4
(Well 3#)2235.91.751.5411.91.589.91.646.5
2281.81.801.5712.91.3027.51.873.7
24001.802.1217.52.1720.81.842.4
25811.801.873.71.4320.71.831.8
(Well 4#)19651.791.6110.00.5469.81.842.8
21401.851.2731.31.689.21.913.2
2474.51.851.3427.51.2830.81.934.3
29651.891.871.00.8952.91.963.7
Disclaimer/Publisher’s Note: The statements, opinions and data contained in all publications are solely those of the individual author(s) and contributor(s) and not of MDPI and/or the editor(s). MDPI and/or the editor(s) disclaim responsibility for any injury to people or property resulting from any ideas, methods, instructions or products referred to in the content.

