1. Introduction
Generating energy from Renewable Energy Sources is an alternative to its production from fossil fuels [
1]. The main advantage of RESs is that they significantly lower the carbon dioxide emissions into the atmosphere [
2]. The emission is not a byproduct of the generation of energy, but it rather occurs during the production and recycling of the components that constitute the entire system [
3,
4]. For many years, the cost of the components for the construction of photovoltaic systems and wind turbines has decreased, reducing the payback period for their construction [
5]. In Poland, Europe, and around the world, photovoltaic systems are becoming more common [
6]. They occur in the form of systems mounted on sloping and flat roofs of buildings, on the ground, and photovoltaic carports [
7]. The latter, in addition to producing energy for vehicles parked under them, also generates shade, which is very much needed during the summer heat. Installing photovoltaic systems is a method to generate cheap electricity for both individual users and manufacturing companies [
8,
9]. An increasing number of people are recognizing and considering the beneficial impact of renewable energy usage on environmental protection when making their purchasing decisions [
10].
The current photovoltaic systems usually consist of monocrystalline photovoltaic panels in single-sided or bifacial form. The latter have an active surface on both sides of the panels and are, therefore, characterized by greater energy production achieved from a unit of panel surface area. The latest bifacial panels achieve 10–20% higher efficiency than single-sided panels by generating energy from both sides [
11]. They use the light reflected from the substrate, which works particularly well on light surfaces or when installed at an angle. Bifacial technology also offers better cell cooling, which increases their efficiency at high temperatures. Although they are more expensive to purchase and install, their higher productivity translates into a better return on investment in the long term [
12]. Scientists and industrial engineers continue to develop innovative photovoltaic panel technologies. A heterojunction (HJT) is a photovoltaic panel technology that combines crystalline silicon with thin-film amorphous silicon, which allows for a remarkably high efficiency of up to 24% and better performance at high temperatures [
13]. TOPCon, or Tunnel Oxide Passivated Contact, is an improved version of PERC cells that uses a thin layer of silicon oxide, which increases the efficiency of the cell, reducing the energy loss and raising efficiency to 22–23% [
14]. Perovskite cells are an innovative solution based on chemical compounds called perovskites, characterized by exceptional light absorption capacity, lightweight, and low production costs, although they still need to be improved in terms of durability and stability [
15]. HJT panels are distinguished by the highest efficiency and resistance to the weather conditions, TOPCon is an attractive compromise between efficiency and cost, while perovskites have the greatest innovation potential and may dominate the market in the future due to the possibility of creating hybrid panels, such as tandem perovskite–silicon modules [
16].
Photovoltaic (PV) systems represent one of the most cost-effective and widely accessible forms of renewable energy. Their implementation typically requires the procurement of photovoltaic panels—available at relatively low cost—and the identification of an unshaded installation site. These panels are connected in series (strings) and interfaced with a photovoltaic inverter, whose primary function is to convert the direct current (DC) generated by the panels into alternating current (AC), either single-phase or three-phase, suitable for integration with the public power grid or the internal electrical infrastructure of residential or institutional buildings. Contemporary inverters often operate as Internet of Things (IoT) devices, capable of transmitting performance and operational data at regular intervals to cloud-based platforms [
17]. This connectivity enables real-time monitoring and data analytics, thereby providing system operators and maintenance personnel with continuous insights into power output, energy production, and the operational status of all critical components within the PV installation [
18].
The acquired data can be displayed at different periods of time and processed to report on archival performance and to make decisions in energy management. They can also be used to predict future performance. Traditional and innovative algorithms, including those based on artificial intelligence (AI), are applied to analyze the performance of the photovoltaic systems [
19]. Linear regression is a classic statistical method for predicting performance based on the input data, such as solar irradiance or temperature. The least squares method is often employed to fit a mathematical model to the historical data of the PV system, minimizing the error between the actual and predicted value. Decision trees analyze operational data and aid in classifying the operating states of the installation, identifying potential problems or irregularities [
20]. Random forest, an ensemble of many decision trees, increases the accuracy of predictions and reduces the risk of overfitting the model [
21]. Neural networks, especially deep learning models, are used to predict the amount of energy production based on large sets of meteorological and operational data [
22]. Support vector machines (SVMs) are useful for classifying the operating states of the PV system and detecting anomalies based on the data patterns [
23]. k-NN (k nearest neighbors) algorithms compare current data with similar historical cases to assess the possible deviations from the norm [
24]. Genetic algorithms are adopted to optimize the operating parameters of the plant by simulating the evolution process, searching for the best solution among many combinations [
25]. Finally, deep learning algorithms such as LSTM (long-term short-term memory) are particularly effective in analyzing time series and predicting changes in energy production in real time [
26].
All photovoltaic systems, however, have one major drawback: they generate power exclusively under conditions of sunlight. This means that power generation is cyclical due to alternating days and nights and seasonality, and its variability is due to the current weather conditions [
27]. Therefore, managing the energy produced by photovoltaic systems is a major challenge. It is best when we can simultaneously monitor the performance of the photovoltaic systems and the power demand of the house or institutional building that is powered by them [
28]. On the power reception side, managers can influence the current power demand of individual electrical receivers and thus adjust the power reception profile to the power profile generated by RESs. Bidirectional electricity meters and smart metering systems enable measurement of energy drawn from the grid and transferred to the power grid.
For over 20 years, photovoltaic systems have been producing energy from the sun in Europe and around the world. They have been present in Poland for 10 years, and for 5 years they have been a very common RES available to institutional and individual users. For anyone involved in the administration of a photovoltaic system and energy management in a building, assessing the correctness of the system’s operation is a major challenge. Despite the very rapid development of analytical methods used in science, administrators have very limited tools to determine the amount of energy produced and consumed. The authors show that data related to the generation of power by a photovoltaic system and its consumption by a university administration building can be easily and effectively processed using an advanced analytical platform and used in energy management. This article presents a step-by-step algorithm with a detailed description. From the moment of obtaining measurement data, through to their visualization, traditional statistical analysis, unsupervised clustering, and the presentation of clustering results in various forms, the authors guide the reader through the complicated process of generating and consuming power. The big advantage of the approach used is its comprehensiveness in data analysis along with localization of causes and effects on both the production and consumption sides of energy. The result of the presented research is the development of a method for very fast assessment of the power generated from the photovoltaic system and its consumption by the administrative building using unsupervised clustering. The authors also constantly point out that monitoring of the generated and consumed power should be a continuous process, taking into account changes in the power signatures on both the production and consumption sides. An obvious lack of innovation is the lack of built-in advanced data analysis methods in applications and platforms for monitoring data from photovoltaic systems. The approach used by the authors can be used in training artificial intelligence algorithms used in managing energy production and consumption. Thanks to expert validation of measurement data processing results (as the authors performed), it is possible to define specific guidelines related to the process of energy production and consumption.
Based on the analysis of the state of science in the selected scientific area, the purpose and scope of further research were determined. The main goal of this article is to determine the signatures of the power generated by the photovoltaic system and consumed by the administration building. As a result of unsupervised clustering, the power generation and consumption space was divided into states [
29]. These were then named based on their nature and their usefulness in managing the power produced and consumed. This article proves that clustering is a very beneficial technique in identifying and locating specific states in time. This leads to their better understanding and quantification. The presented computational algorithm is the basis for determining the correctness of the photovoltaic system selection for the current energy needs of the building. It can be the basis for further analysis related to the prediction of both the power generated by Renewable Energy Sources and the energy consumed by various types of buildings.
In
Section 2 of this article, the research methods and tools used in the research are described. The data flow diagram shows all steps, from obtaining measurement data and individual stages of their processing to visualization of results. The advantages of unsupervised clustering in creating signatures of power generated by the photovoltaic system and consumed by the academic administrative building are also described.
Section 3 of this article presents the research carried out and its results. In the next steps, the authors use traditional statistical methods and unsupervised clustering to categorize the obtained measurement data. In the initial phase, the research is conducted with the division into signatures of generated and consumed power. The last step is to determine the signature of power generated by RESs and the signature of the total power consumed by the university building. The obtained results are discussed in
Section 4.
Section 5 contains conclusions from the conducted scientific research, especially in the area of fulfilling the research goals set at the beginning of this article and their practical use in energy management in modern administrative buildings.
2. Materials and Methods
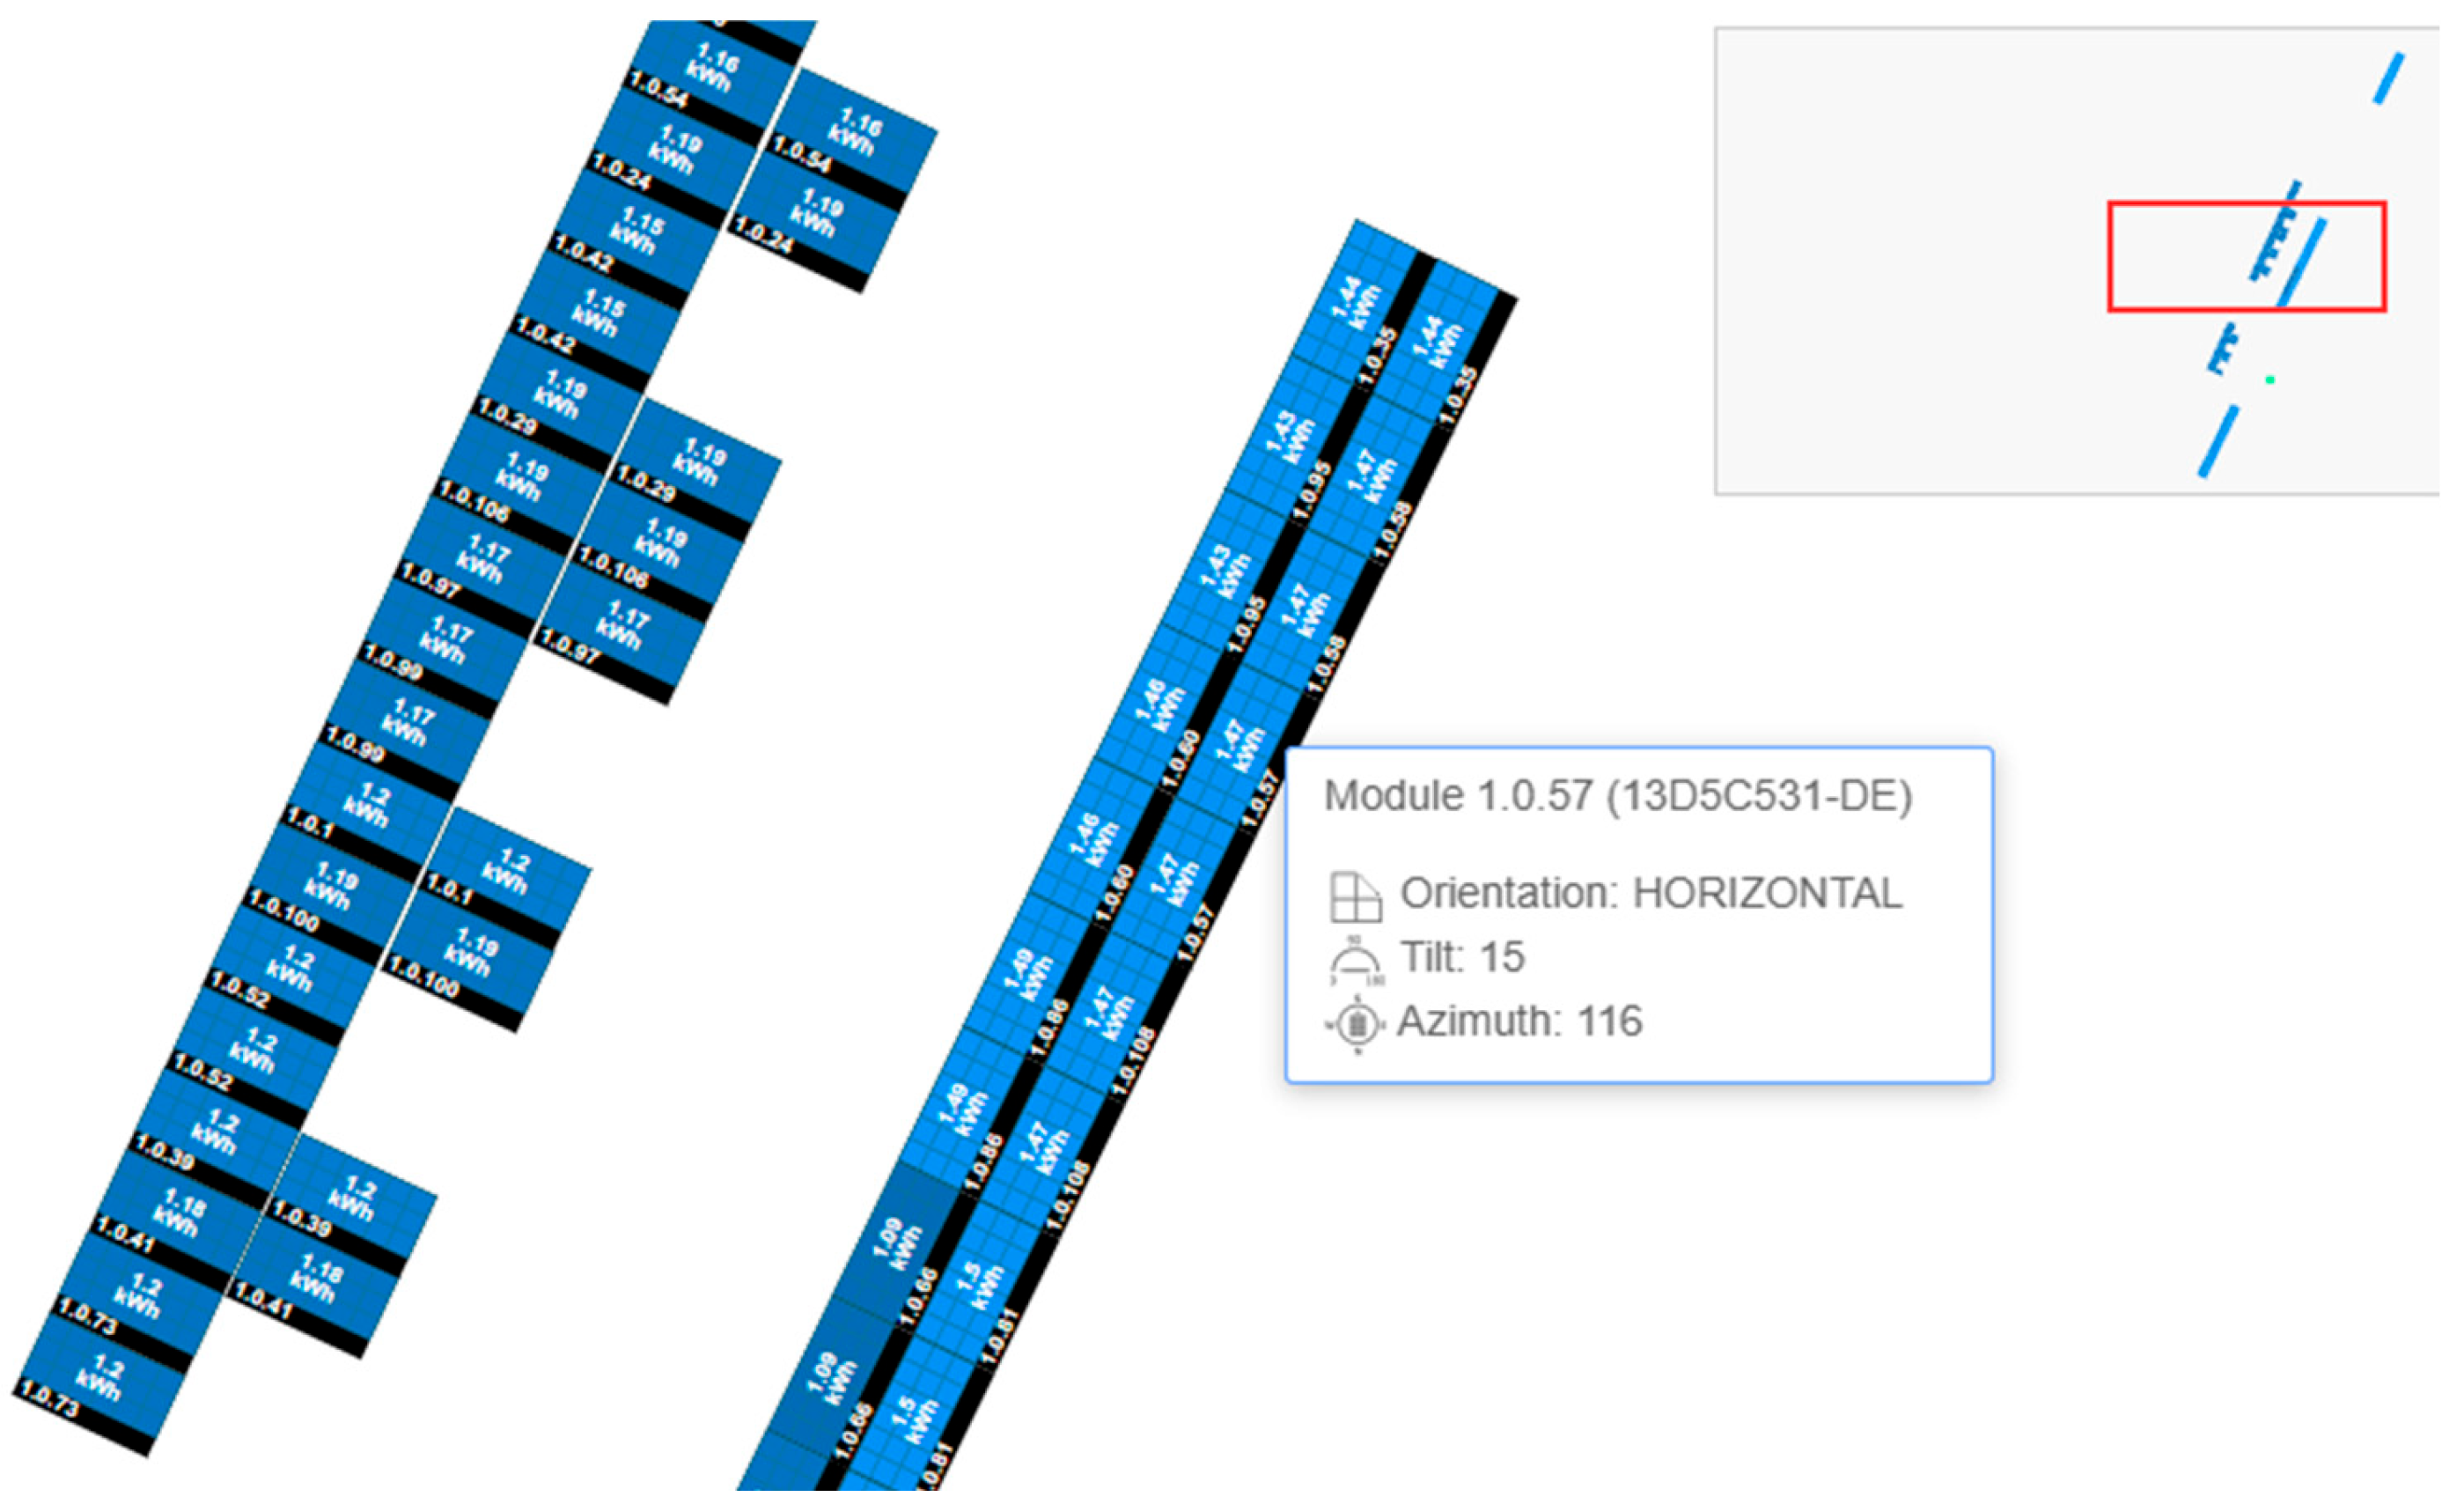
The subject of this study is a photovoltaic system with a peak power of 50 kWp, which has been installed on the roof of WSEI University in Lublin (Poland). The system is new, as it was launched in February 2023. The photovoltaic system consists of 108 monocrystalline panels installed on a flat roof at an angle of 15°. The azimuth of half of the panels is 116° and the other half 206°. The physical layout of the panels in the system is shown in
Figure 1. Every second panel has been equipped with an optimizer. This device measures the performance of an individual or several panels in a string. As a result, it is possible to compare their performance due to the place of installation and individual features related to shading. The optimizer can also turn off the panels that are currently shaded so that they do not negatively affect the performance of the entire system. Optimizers also enable quick diagnostics and localization of faults in the event of damage to the panels. This 50 kWp peak photovoltaic system has produced over 108 MWh of electricity since its launch. This performance confirms the good solar conditions in our region, which have a positive effect on the energy production of photovoltaic systems.
The most important parameters of the analyzed photovoltaic system are presented in
Table 1.
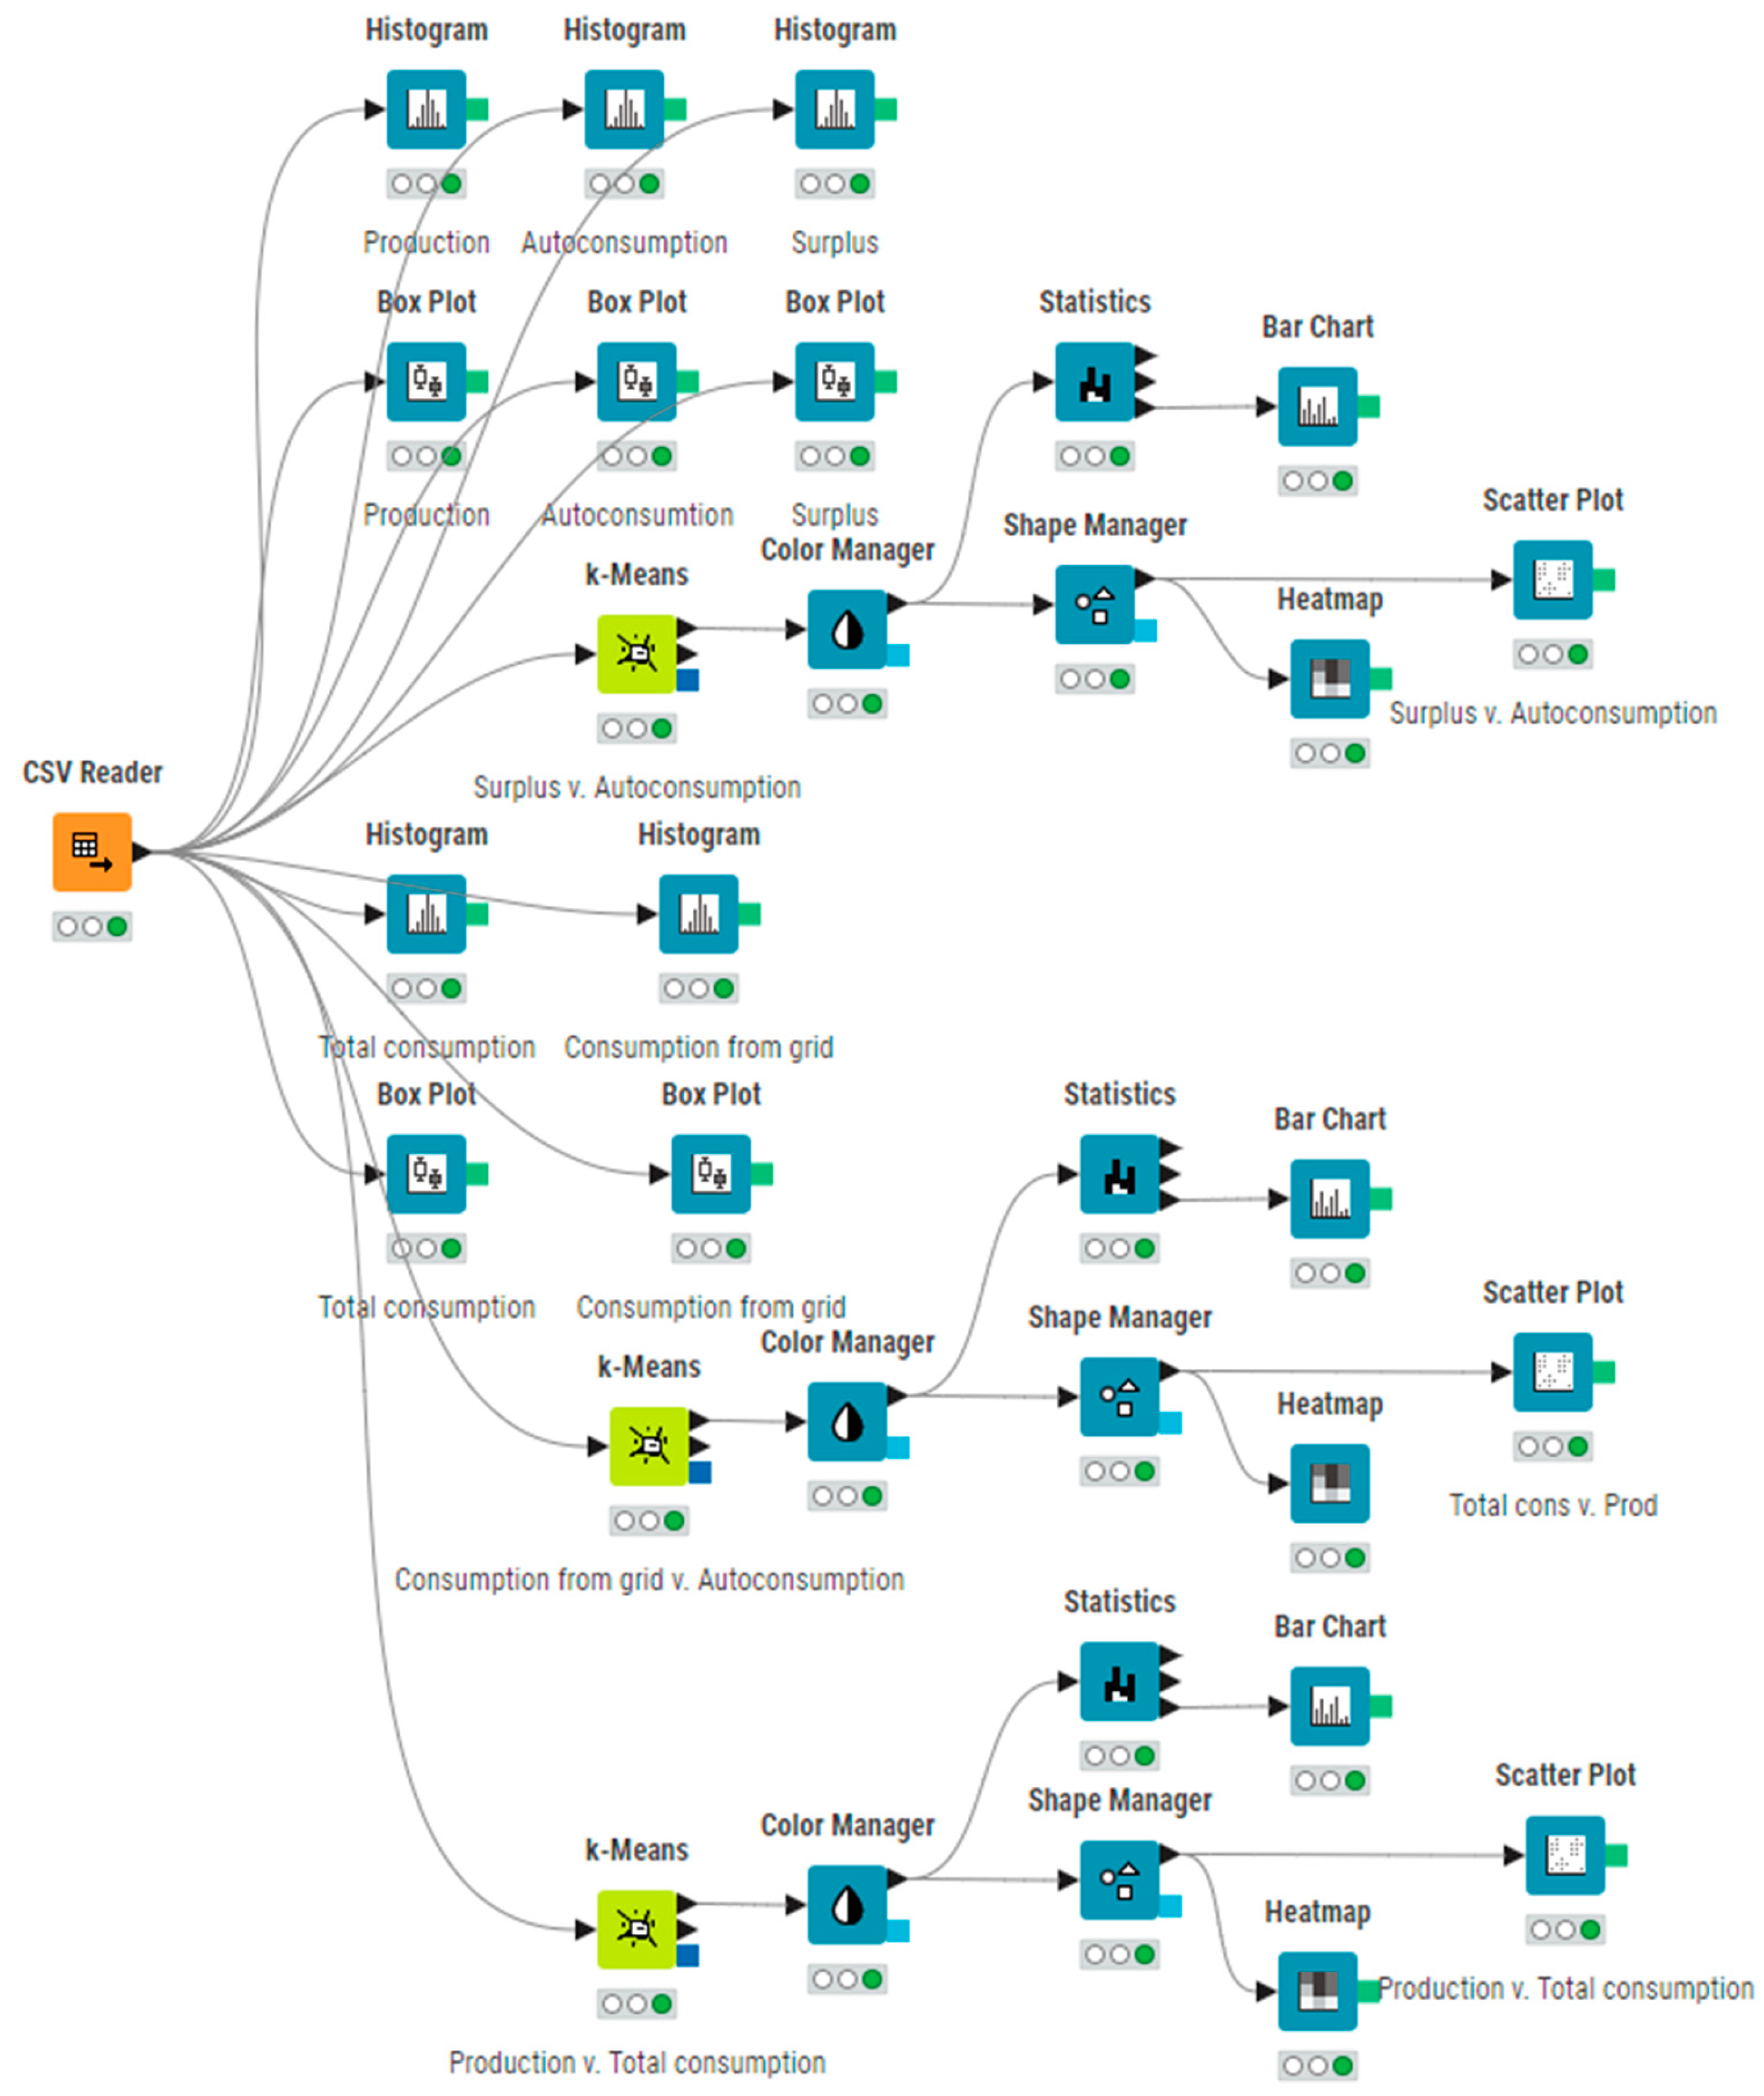
Photovoltaic systems generate large amounts of measurement data, such as voltage, current, power, energy, temperature, and solar radiation. Their analysis allows for monitoring the operation of the installation, detecting anomalies, and optimizing the operation. The KNIME (Konstanz Information Miner) platform is an open-source tool that allows for the creation of advanced workflows without the need for programming, which makes it ideal for processing the PV data [
30]. The process begins with the data import, which is carried out using nodes such as File Reader, Excel Reader, or JSON Reader. KNIME also allows for downloading data from monitoring system APIs or weather sources. In the next step, the data are pre-processed: date and time conversion (String to Date&Time), missing values (Missing Value), column filtering (Column Filter), and name standardization (Column Rename). Frequently, the data from different sources must be combined using the Joiner node.
Then, data aggregation and analysis are performed. Using the GroupBy node, one can calculate the energy production daily, monthly, or yearly. The Math Formula node allows the formulas to be entered to calculate parameters such as the system efficiency (e.g., kWh/kWp). Moving Average is applied to smooth the data and eliminate the noise. The data can then be visualized using nodes such as Line Plot, Bar Chart, or Scatter Plot. This facilitates the demonstration of trends in energy production, comparison with weather data, and quick identification of deviations. For more advanced analysis, KNIME offers machine learning capabilities. Nodes such as Random Forest, XGBoost, or k-means can be used to predict the future energy production, segment data, and detect anomalies. Simple rules can be implemented using Rule Engine [
31].
Finally, the processed data can be saved or sent further, e.g., to a file (CSV Writer or Excel Writer), a database (Database Writer), or a report (Table to PDF). KNIME provides a flexible analytical environment that is ideal for analyzing the data from photovoltaic systems for both diagnostic and predictive purposes. The KNIME analytical platform with its graphical programming language is shown in
Figure 2.
In this article, the authors employed unsupervised clustering to determine the signatures of the power generated by the photovoltaic system and the power consumed by the university building. Clustering, being one of the data analysis methods, is extensively applied in research on photovoltaic (PV) systems [
32,
33]. This technique allows data to be grouped based on their similarity without the need to previously mark or classify the observations [
34,
35]. In the context of PV systems, clustering allows for the identification of installation operation patterns, detection of anomalies, and optimization of diagnostic and operational processes [
36]. One of the main applications of clustering in PV system research is the analysis of the operational data such as voltage, current, output power, or solar radiation intensity [
37]. By grouping the data from different periods, it is possible to distinguish characteristic operating states of the installation, e.g., conditions of full sunlight, partial shading, cloudy days, or emergency states [
38]. Algorithms such as k-means or DBSCAN allow for the recognition of these states without the need to define them in advance [
39].
Another example is the application of clustering in detecting shading and degradation of the PV modules. By analyzing the data from individual strings or modules, it is possible to detect units that deviate from the typical operating profile for a given weather condition [
40]. Clustering can also support predictive monitoring systems, enabling early detection of faults such as damaged cells, bypass diodes, or inverter problems. In research on the optimization of the PV installation performance, clustering can be adopted to classify locations in terms of climatic conditions and energy efficiency. Grouping the data from different weather stations or measurement points provides a better understanding of the impact of atmospheric variables on the system operation, which is particularly significant when designing the hybrid energy sources.
Clustering is also employed in the analysis of historical data to identify long-term trends and seasonal changes in efficiency [
41]. It can also be applied in combination with machine learning methods to create more precise forecasting models for energy production or consumption [
42,
43]. Therefore, unsupervised clustering is a valuable tool supporting the analysis of large data sets generated by photovoltaic systems [
44]. It not only enables increased reliability and efficiency of the installations, but also contributes to the development of intelligent energy management systems and predictive diagnostics in modern energy networks [
45].
Unsupervised clustering is an important tool for exploratory analysis, enabling the identification of natural structures and patterns in data without the need for prior labeling. This method allows for dimensionality reduction and organization of data into coherent groups, which facilitates their better understanding and interpretation. Unsupervised clustering enables the detection of anomalies, segmentation of populations, and grouping of similar objects in the context of previously unknown relationships. This technique finds application in various fields, such as bioinformatics, image analysis, text mining, and marketing. It allows the analysis of large data sets, in which labeling would be expensive, time-consuming, or impossible. The use of algorithms such as k-means, DBSCAN, or hierarchical clustering allows the method to be adapted to the specifics of the data. Unsupervised clustering can act as a preliminary step in complex analytical processes, preparing data for further supervised modeling. This technique is particularly valuable in the context of discovering knowledge from unstructured data. An additional advantage is the ability to detect non-standard relationships between variables without the need to define research hypotheses in advance. Due to its flexibility, unsupervised clustering supports data-driven decision-making under conditions of information uncertainty.
3. Results
This article provides a detailed statistical analysis and clustering of the power generated by a 50 kWp peak photovoltaic system and the power consumed by the WSEI University building. The data related to the power generated and energy produced by the photovoltaic system come from the inverter. This device, being an Internet of Things device, takes measurements and sends a package of measurement and diagnostic data to the cloud platform in periods of time of every 15 min. Measurement data regarding the building’s power consumption come from the smart metering system. This device also allows for measuring the power and, thus, the energy released to the power grid. Measurement data from the smart metering system are transferred to the monitoring platform provided by the inverter manufacturer. LAN-type wired transmission is used to transfer measurement data. The research covers the entire month of March 2025.
In this chapter, the power generated by the photovoltaic system will first be statistically analyzed, considering its use for its own needs (self-consumption) and the release of its surplus to the power grid (surplus). Then, the authors will analyze the total power consumed by the building, taking into account the previously mentioned self-consumption and the power consumed from the power grid. By using unsupervised clustering, it is possible to determine the signatures of the power generated by the photovoltaic system and consumed by the university building.
3.1. Analysis of the Production and Use of Power Generated by the Photovoltaic System
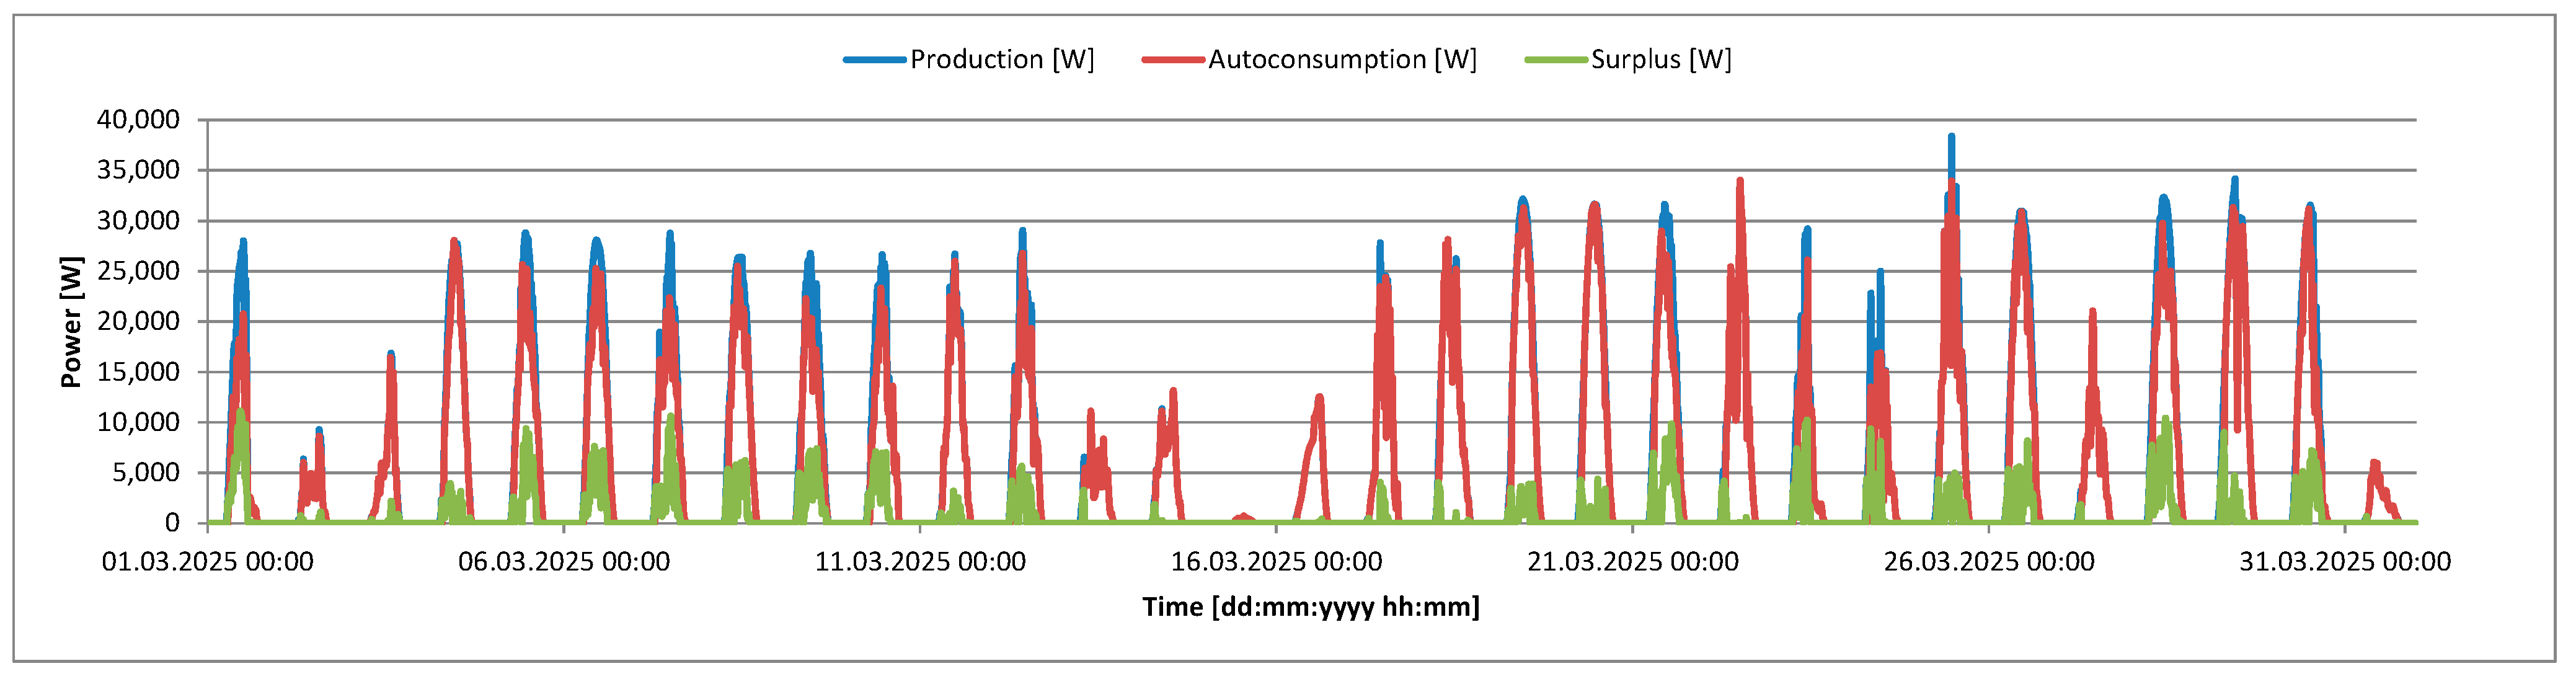
The power production by the photovoltaic system and its use for self-consumption and surplus on individual days in March 2025 are presented in
Figure 3. March is the month with average solar energy production in the Polish climate and geography. Monthly production is usually half of the maximum energy production from May to August. In March 2025, the monthly energy production by the photovoltaic system was 4.4 MWh, of which 3.4 MWh (77%) was used for the university building’s own needs and 1.0 MWh (23%) was fed into the power grid. From the course of the power generated by the photovoltaic system, it can be concluded that March this year was a sunny and cool spring month. Such weather conditions are conducive to the production of large amounts of energy by the photovoltaic systems. The graph clearly shows that only during one day was the energy production close to zero. During five or six days, the generated power and, therefore, the amount of energy produced can be described as small. The remaining days are characterized by large volumes of generated power, which translate into large amounts of daily energy production. On six days in March this year, the daily energy production exceeded 200 kWh. The power time series presented in
Figure 3 also demonstrate that a very large part of the power generated by the photovoltaic system is used immediately to supply the university building’s own needs.
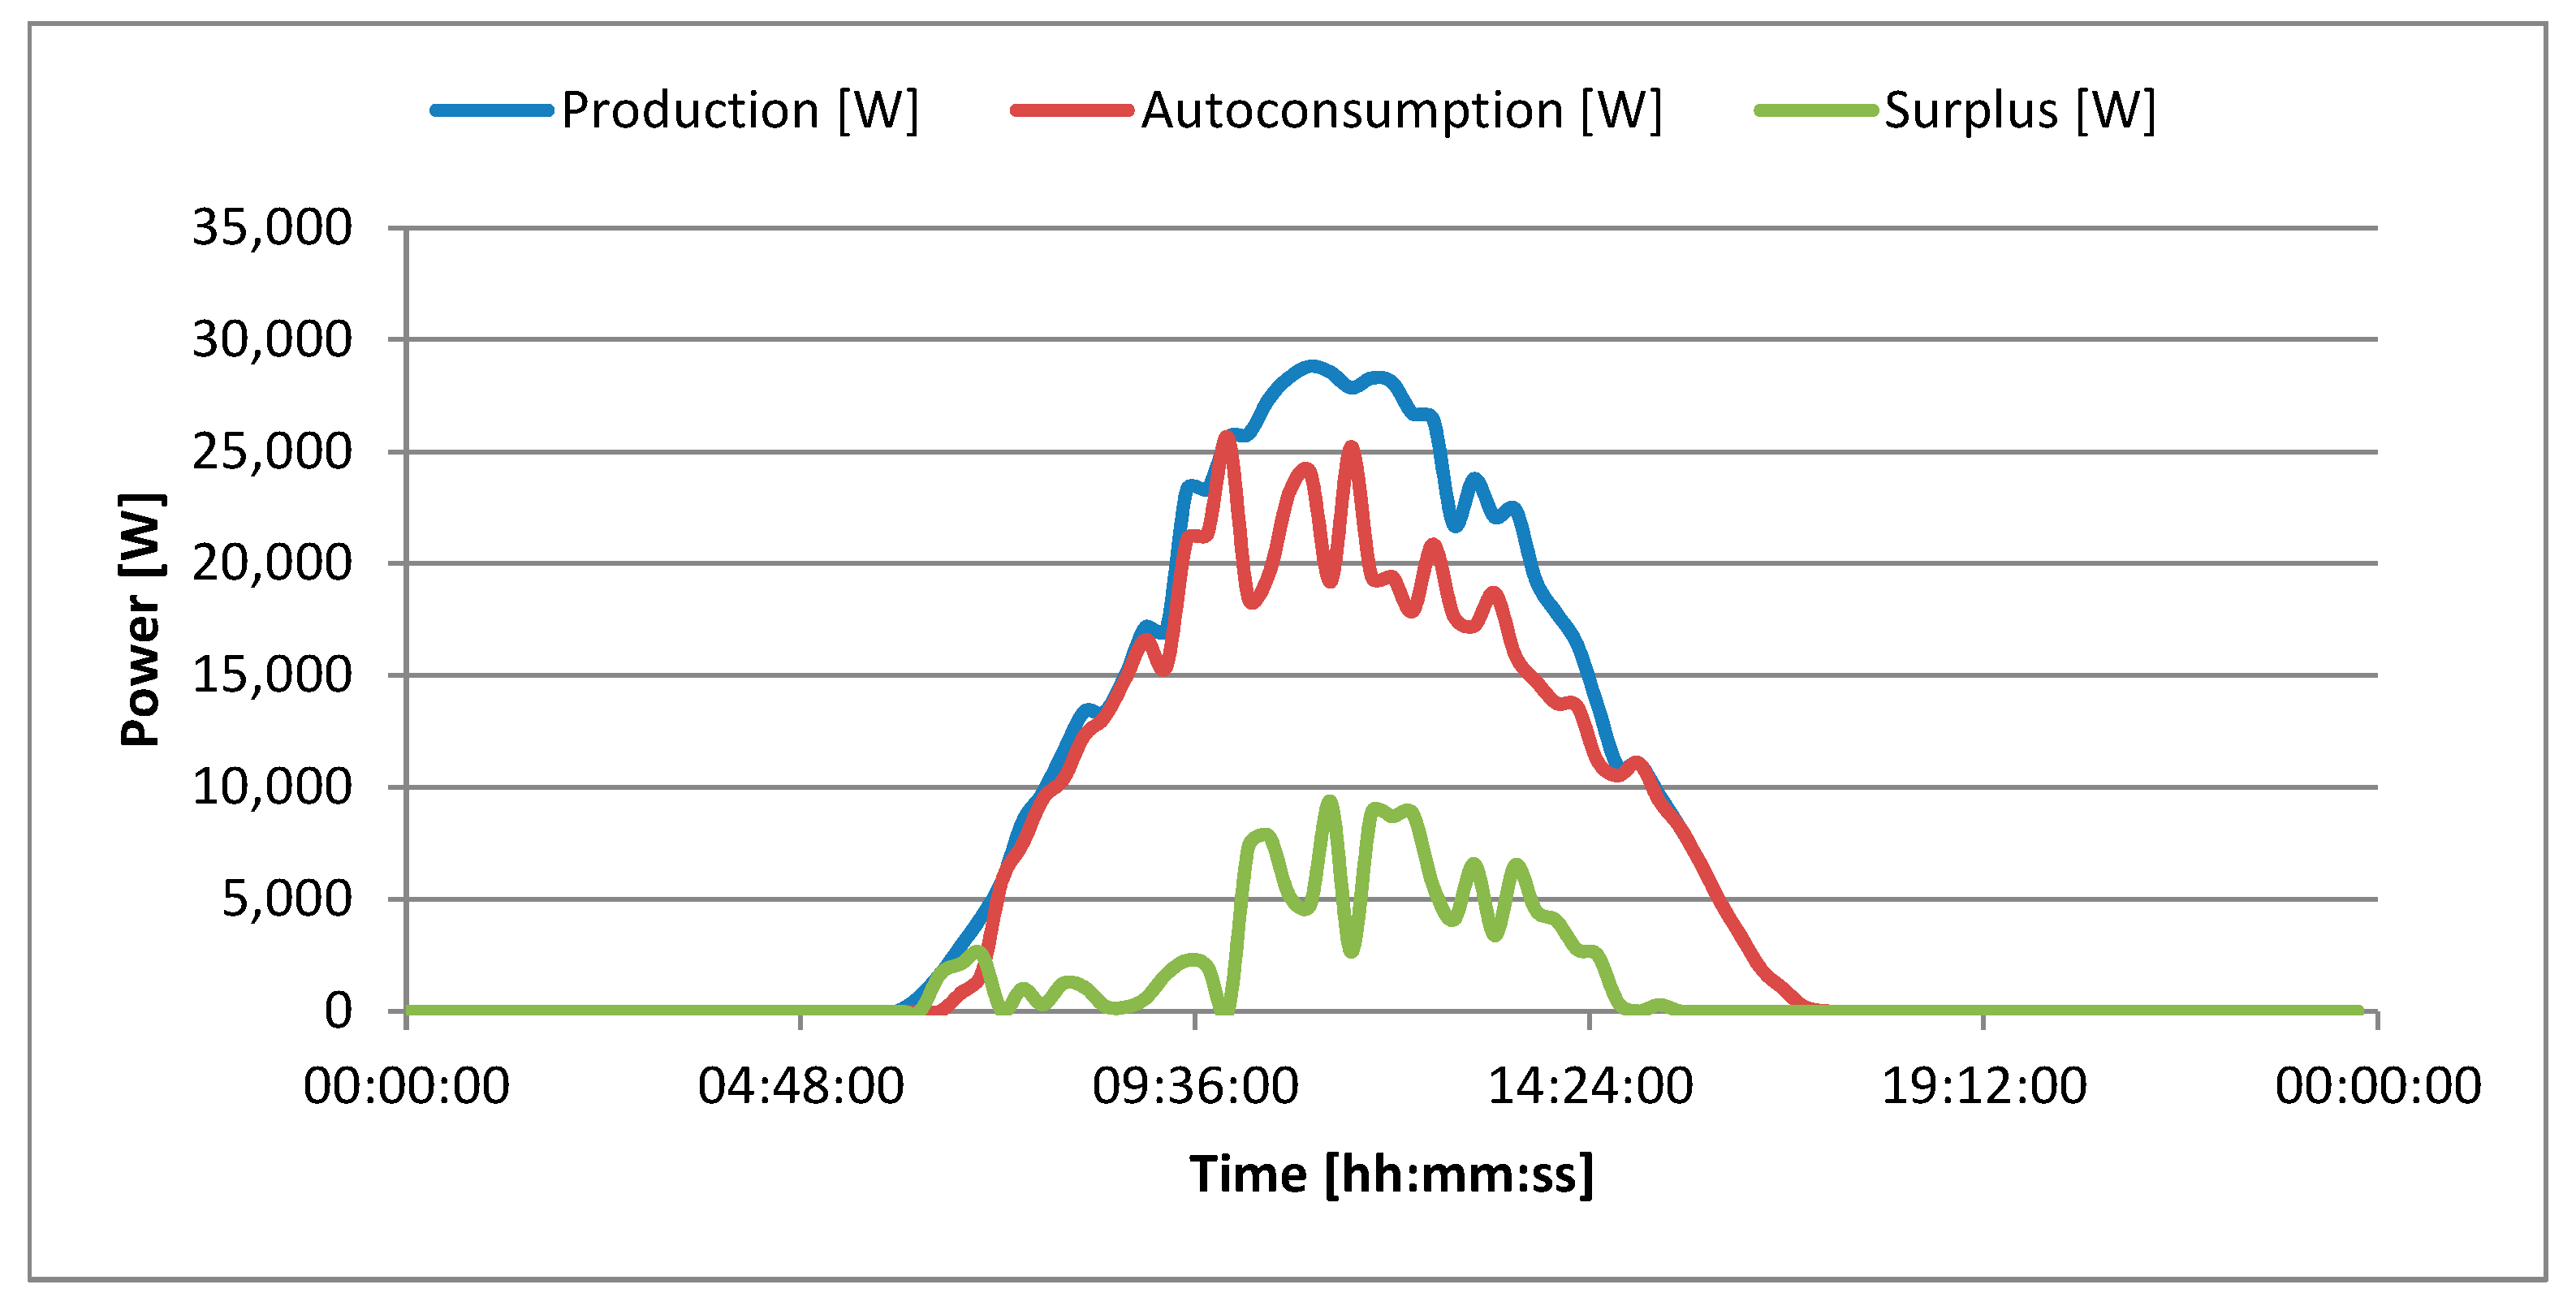
Narrowing the period of the generated power to individual days facilitates the analysis of the power generated by the photovoltaic system and enables the analysis of its division into self-consumption and the excess that is transferred to the power grid. The power production by the photovoltaic system and its use for self-consumption and surplus on 5 March 2025 is presented in
Figure 4. On 5 March 2025, sunrise occurred at approximately 6:00 AM. The entire day was characterized by high sunshine without observable cloud cover. Sunset occurred at approximately 5:30 PM. The maximum power generated by the photovoltaic system was 28.81 kW and occurred from 11:00 AM to 11:15 AM. The power graphs presented in
Figure 4 also provide information on the nature of use of the university building. The building is exploited daily from 6:00 AM to 8:00 PM, every day of the week. At night, the energy in the building is completely cut off, as there are no systems requiring 24 h power maintenance. This is a purely administrative building with lecture halls. The building is not equipped with a global ventilation and air conditioning system. Each room has its own ventilation and air conditioning system, which can be activated by employees and students during working hours and when they are at the university. On the day in question, the power generated by the photovoltaic system exceeded the building’s power demand and the surplus of the generated power was fed into the power grid. The largest power surplus occurred from 10:00 to 14:00. The energy production on that day amounted to 176.22 kWh. Autoconsumption amounting to 129.27 kWh constituted 73% of the energy produced. The surplus given to the grid amounted to 46.96 kWh, which constituted 27% of the energy produced.
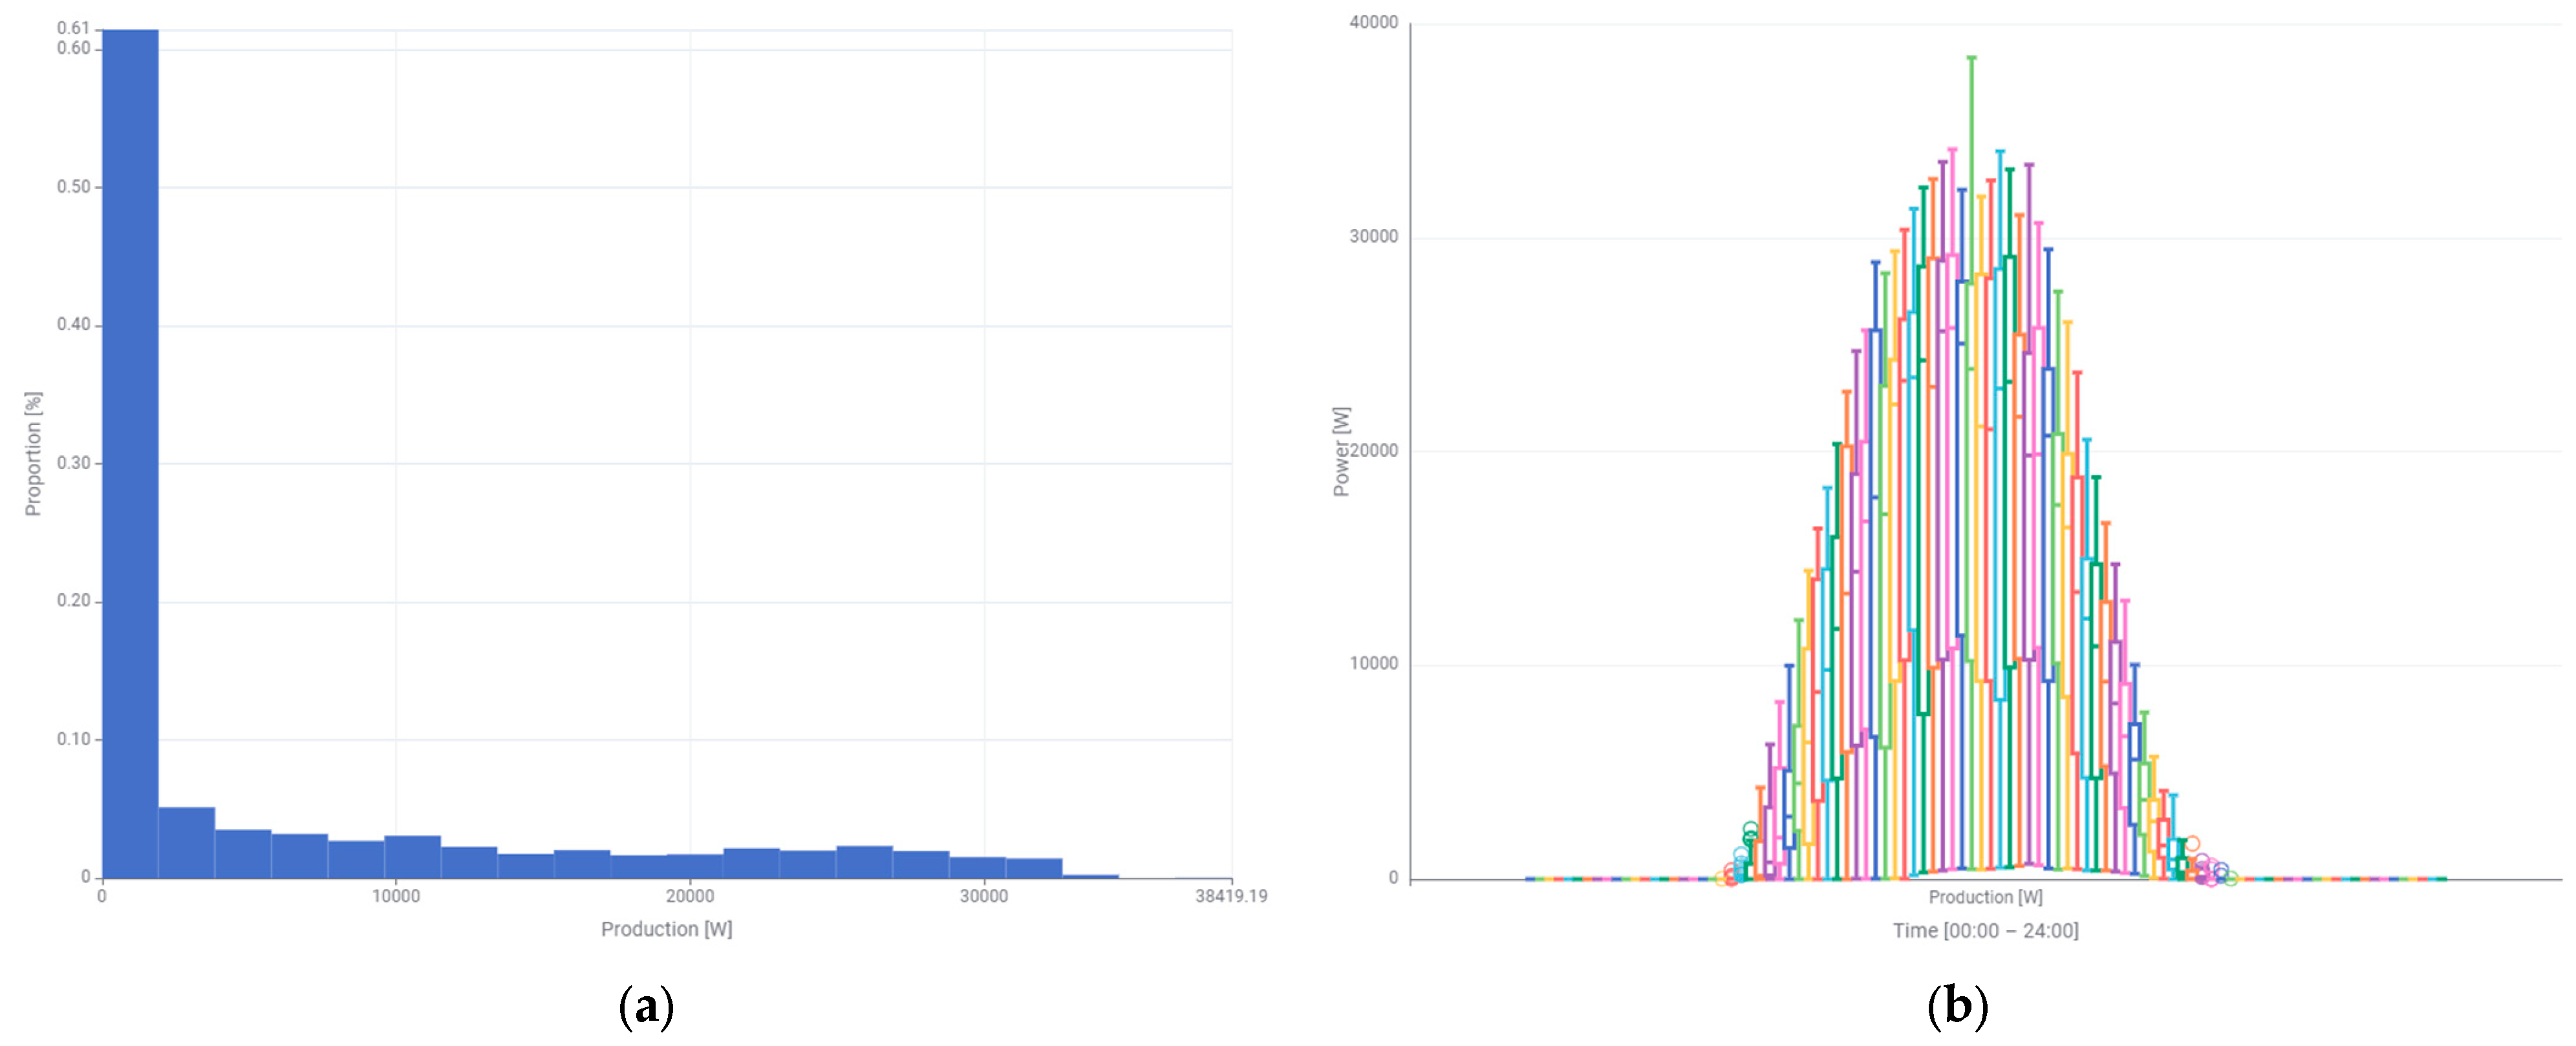
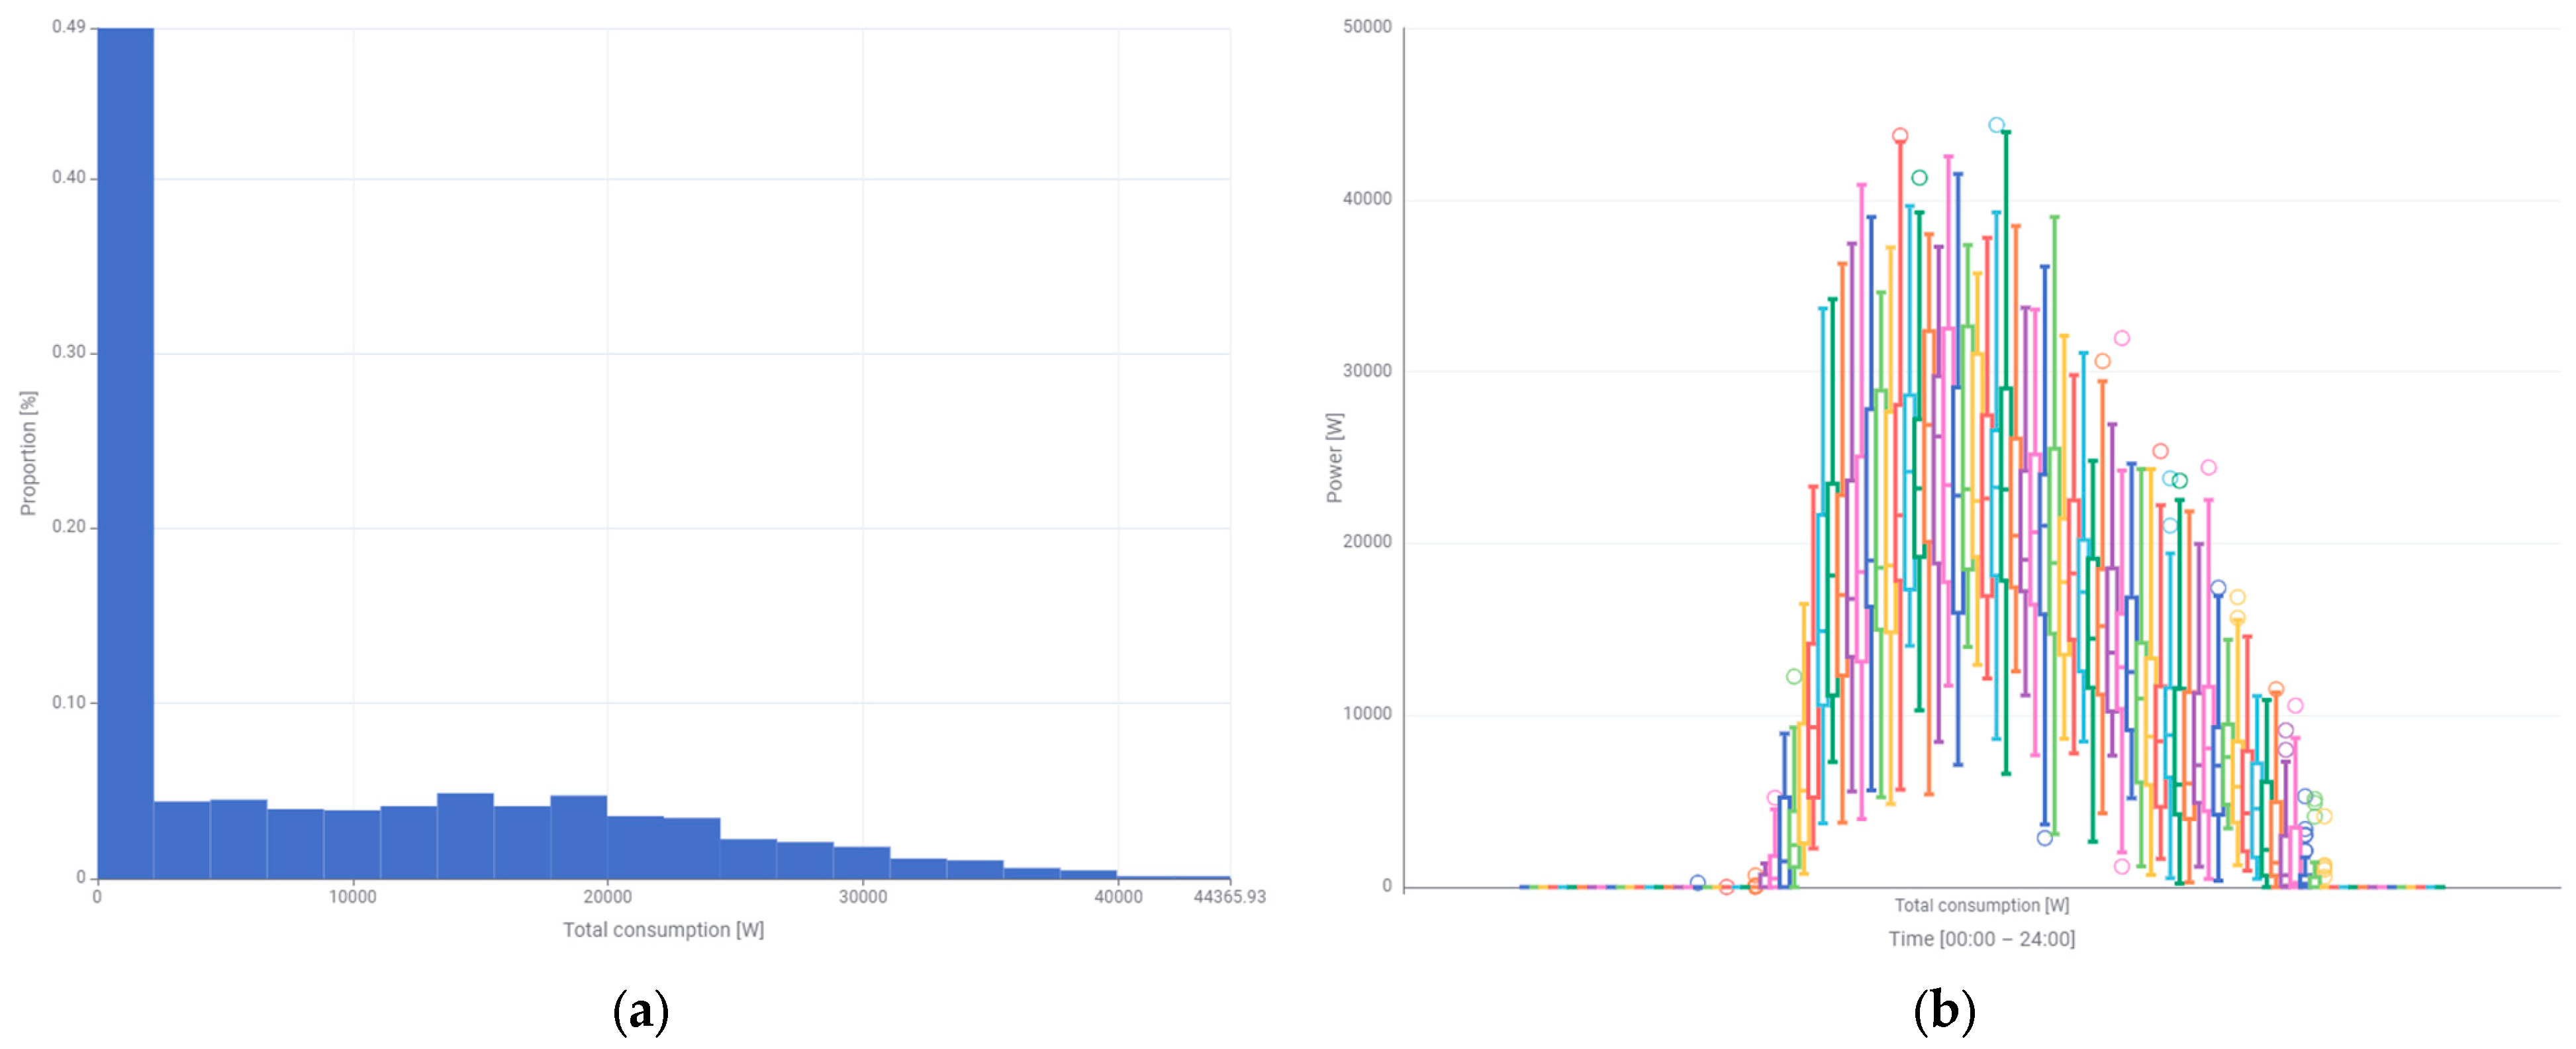
Traditional statistical analysis is a more effective method of assessing energy production than manual graph analysis.
Figure 5a depicts a histogram of the power generated by the photovoltaic system. The largest percentage share corresponds to a power of 0 or close to 0 W. Undoubtedly, this is the result of the photovoltaic system not working at night. The largest value of 61% is also a consequence of the length of the day in this month in the latitude where the photovoltaic system operates. It is noteworthy that the maximum generated power was recorded at 38,419.19 W, as indicated in the histogram. The generated power is distributed more or less evenly in all other ranges, excluding the highest powers. The latter, from a value of approximately 3400 W, have a very small percentage share in the probability density.
The histogram enables a monthly quantitative analysis of individual ranges of the generated power. Additional information regarding the power generated in individual hours daily is provided by the box plot that is shown in
Figure 5b. The values of the generated power result only from the current weather conditions. The shape of the curve of the generated power on sunny days and the maximum power on the box plot do not have any distortions that would indicate the presence of shading. This is because the photovoltaic system is installed on the roof of a four-story building. The box plot shows how the data are scattered, where they are concentrated, and whether there are outliers. The graph depicts a clear asymmetry in the generated power. This applies to the median, which is not in the middle of the box, especially in the higher power ranges. The whiskers are also asymmetric. This time, the whiskers are longer in the lower power range. The width of the box depends significantly on the level of the power generated. The higher the power, the wider the box. Outliers appear outside the whiskers only in the range of very low powers, close to 0 W. Due to the installation of the panels in three directions (south, east, and west), there is no clear maximum in the generated power at noon.
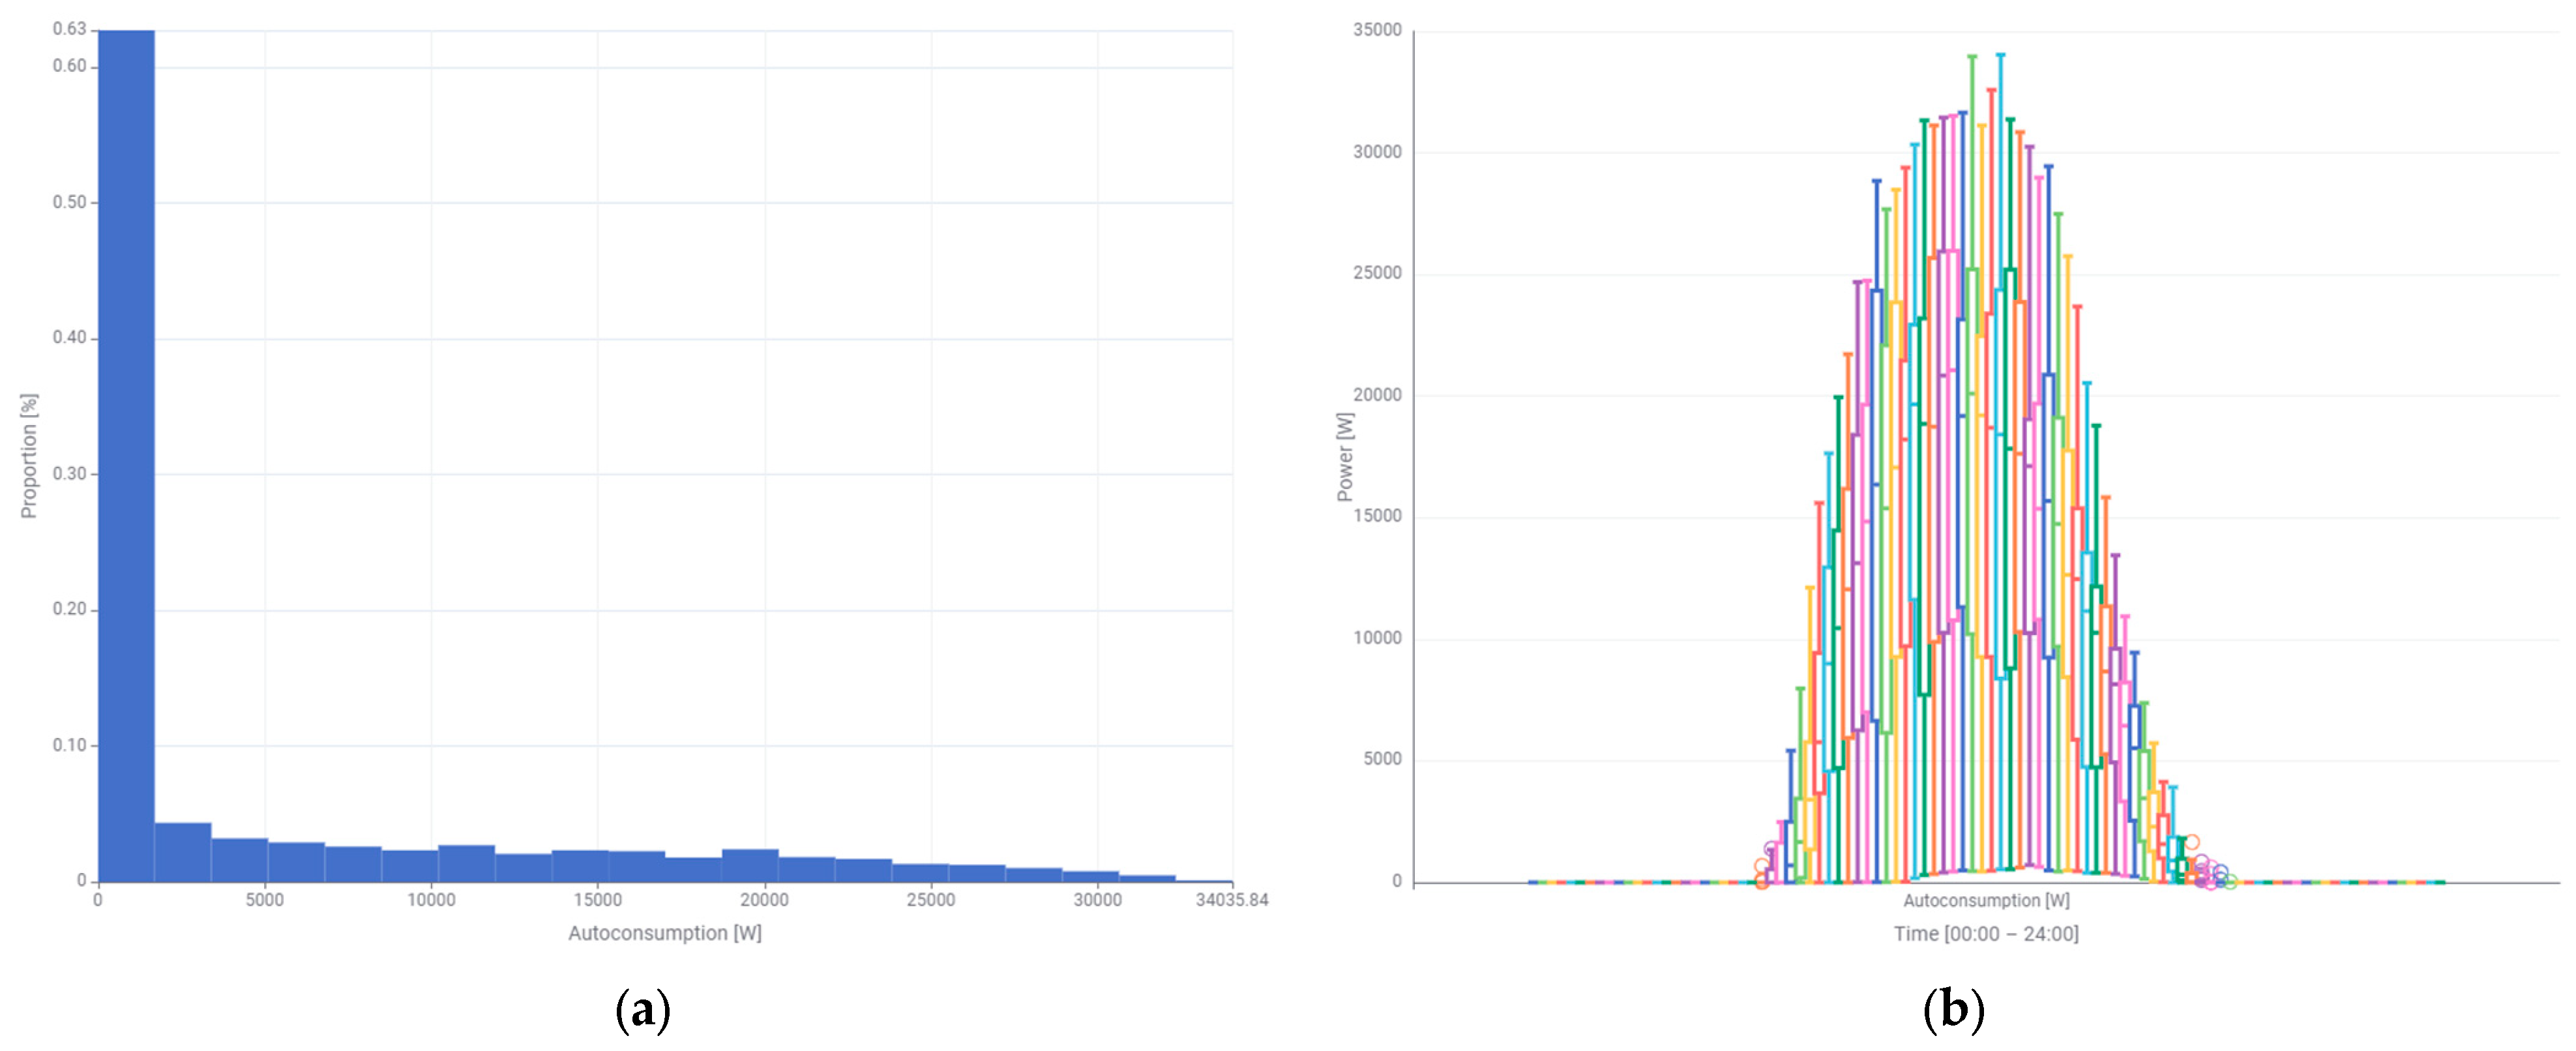
The shape of the self-consumption power curve is very similar to the one of the generated power, both in terms of the similarity of the histogram (
Figure 6a) and the box plot (
Figure 6b). The box plot clearly presents that the self-consumption power starts to grow a little later than the power generated by the photovoltaic system. The first employees show up at work at the university after 6:00 AM. However, most of them start their work at 8:00 AM.
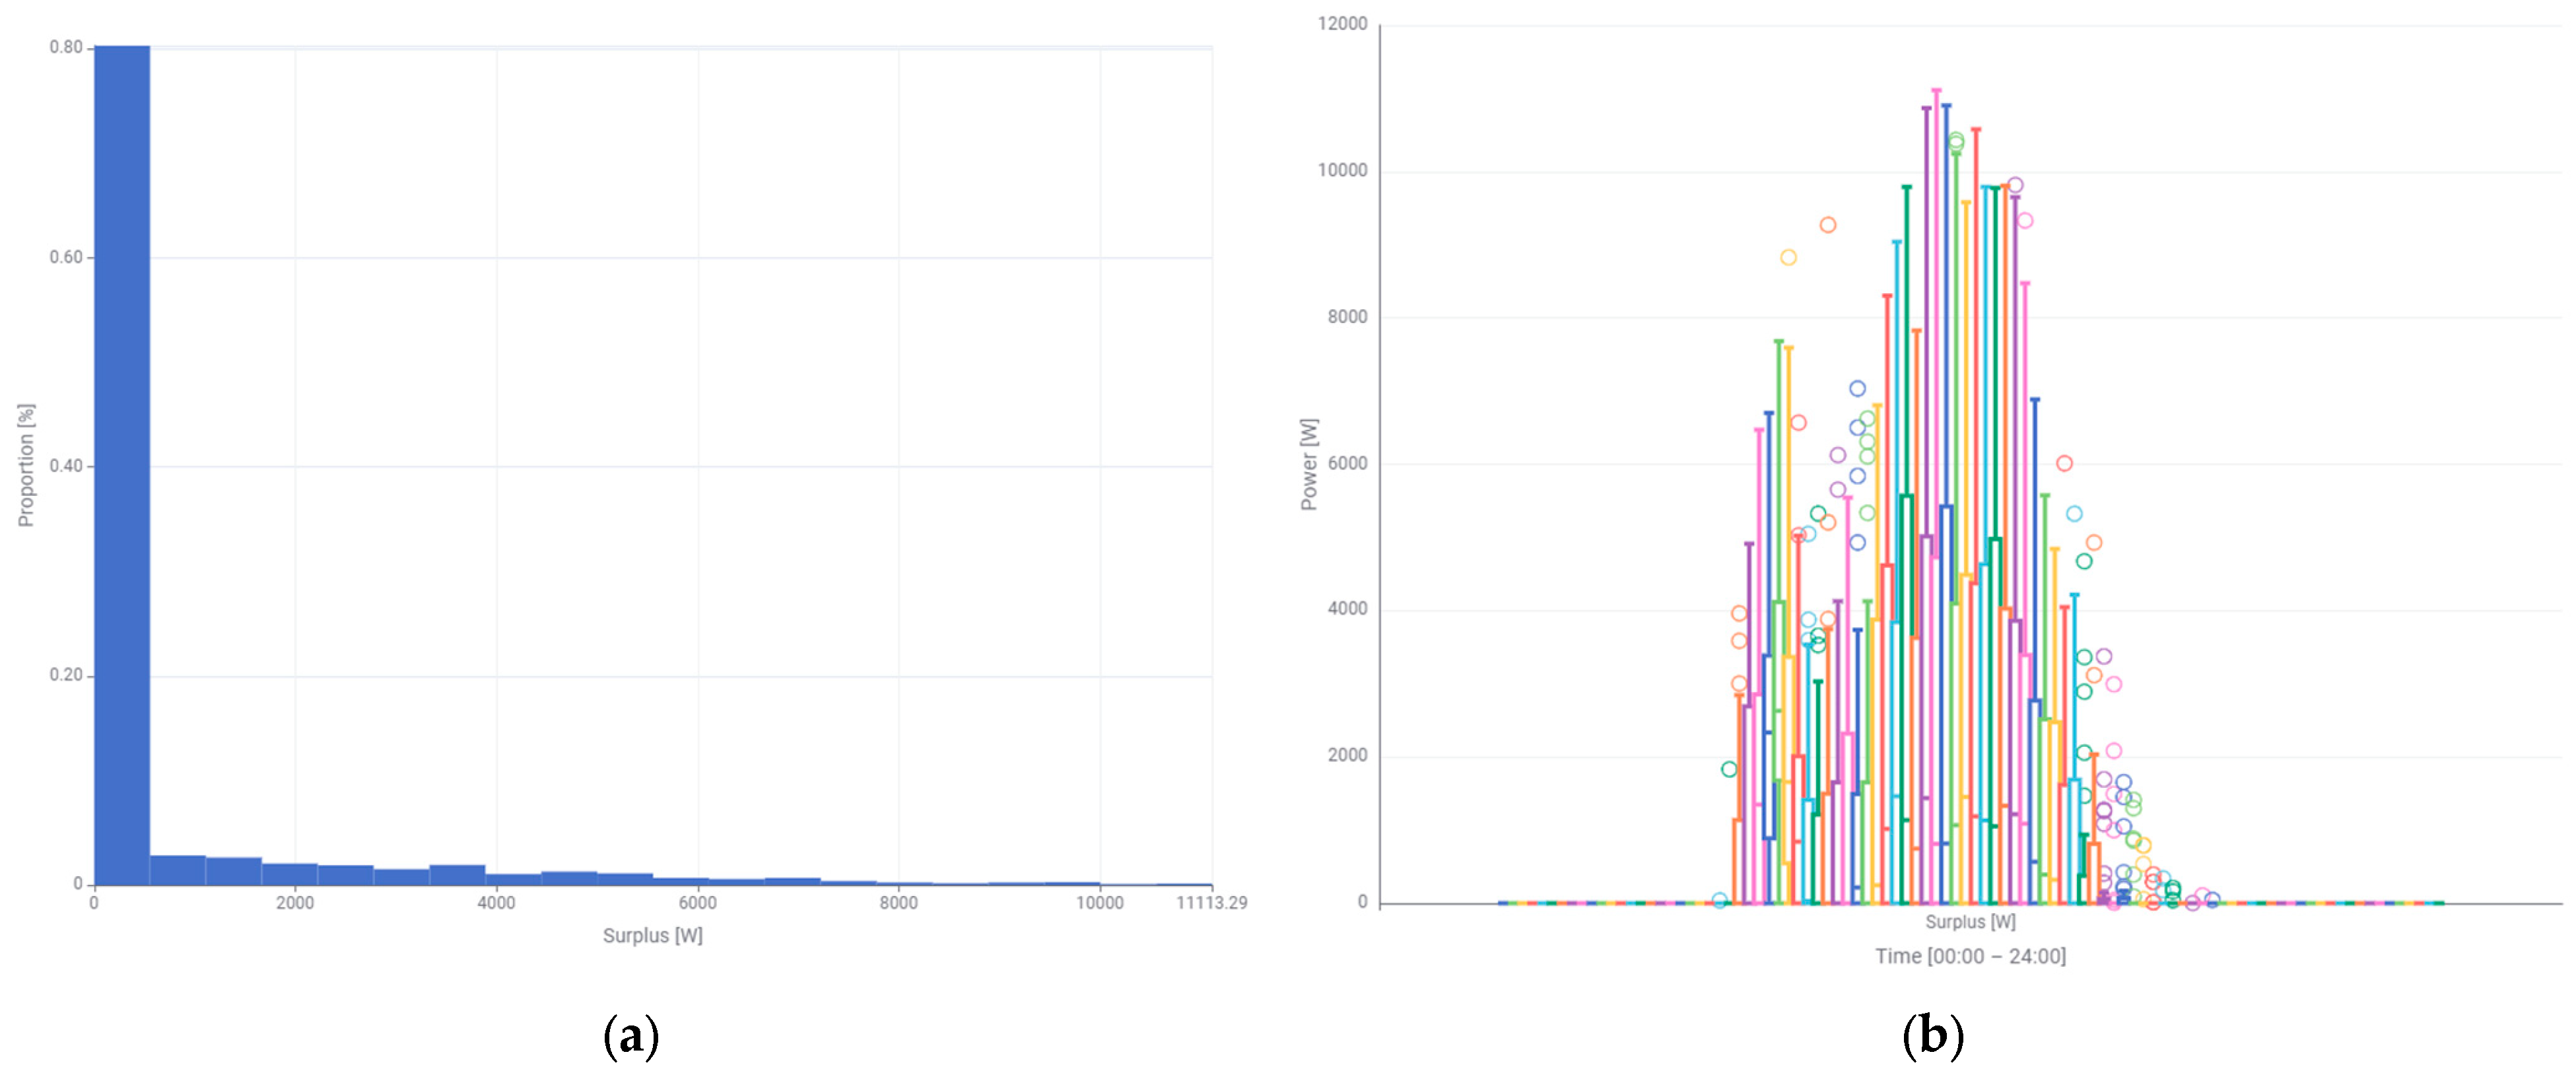
The histogram of surplus power (
Figure 7a) has a clearly different shape than the previously analyzed powers. First, the percentage share of powers close to and equal to 0 W is larger and constitutes 80%. The values of the probability density function decrease with the increasing power. The maximum value of the surplus power is 11,113.29 W and its percentage share is very small. The box plot of the surplus power (
Figure 7b) demonstrates a clear asymmetry in both the shape of the box and the whiskers. Large numbers of outliers are also visible. They occur in almost all time intervals of the day, and especially before sunset.
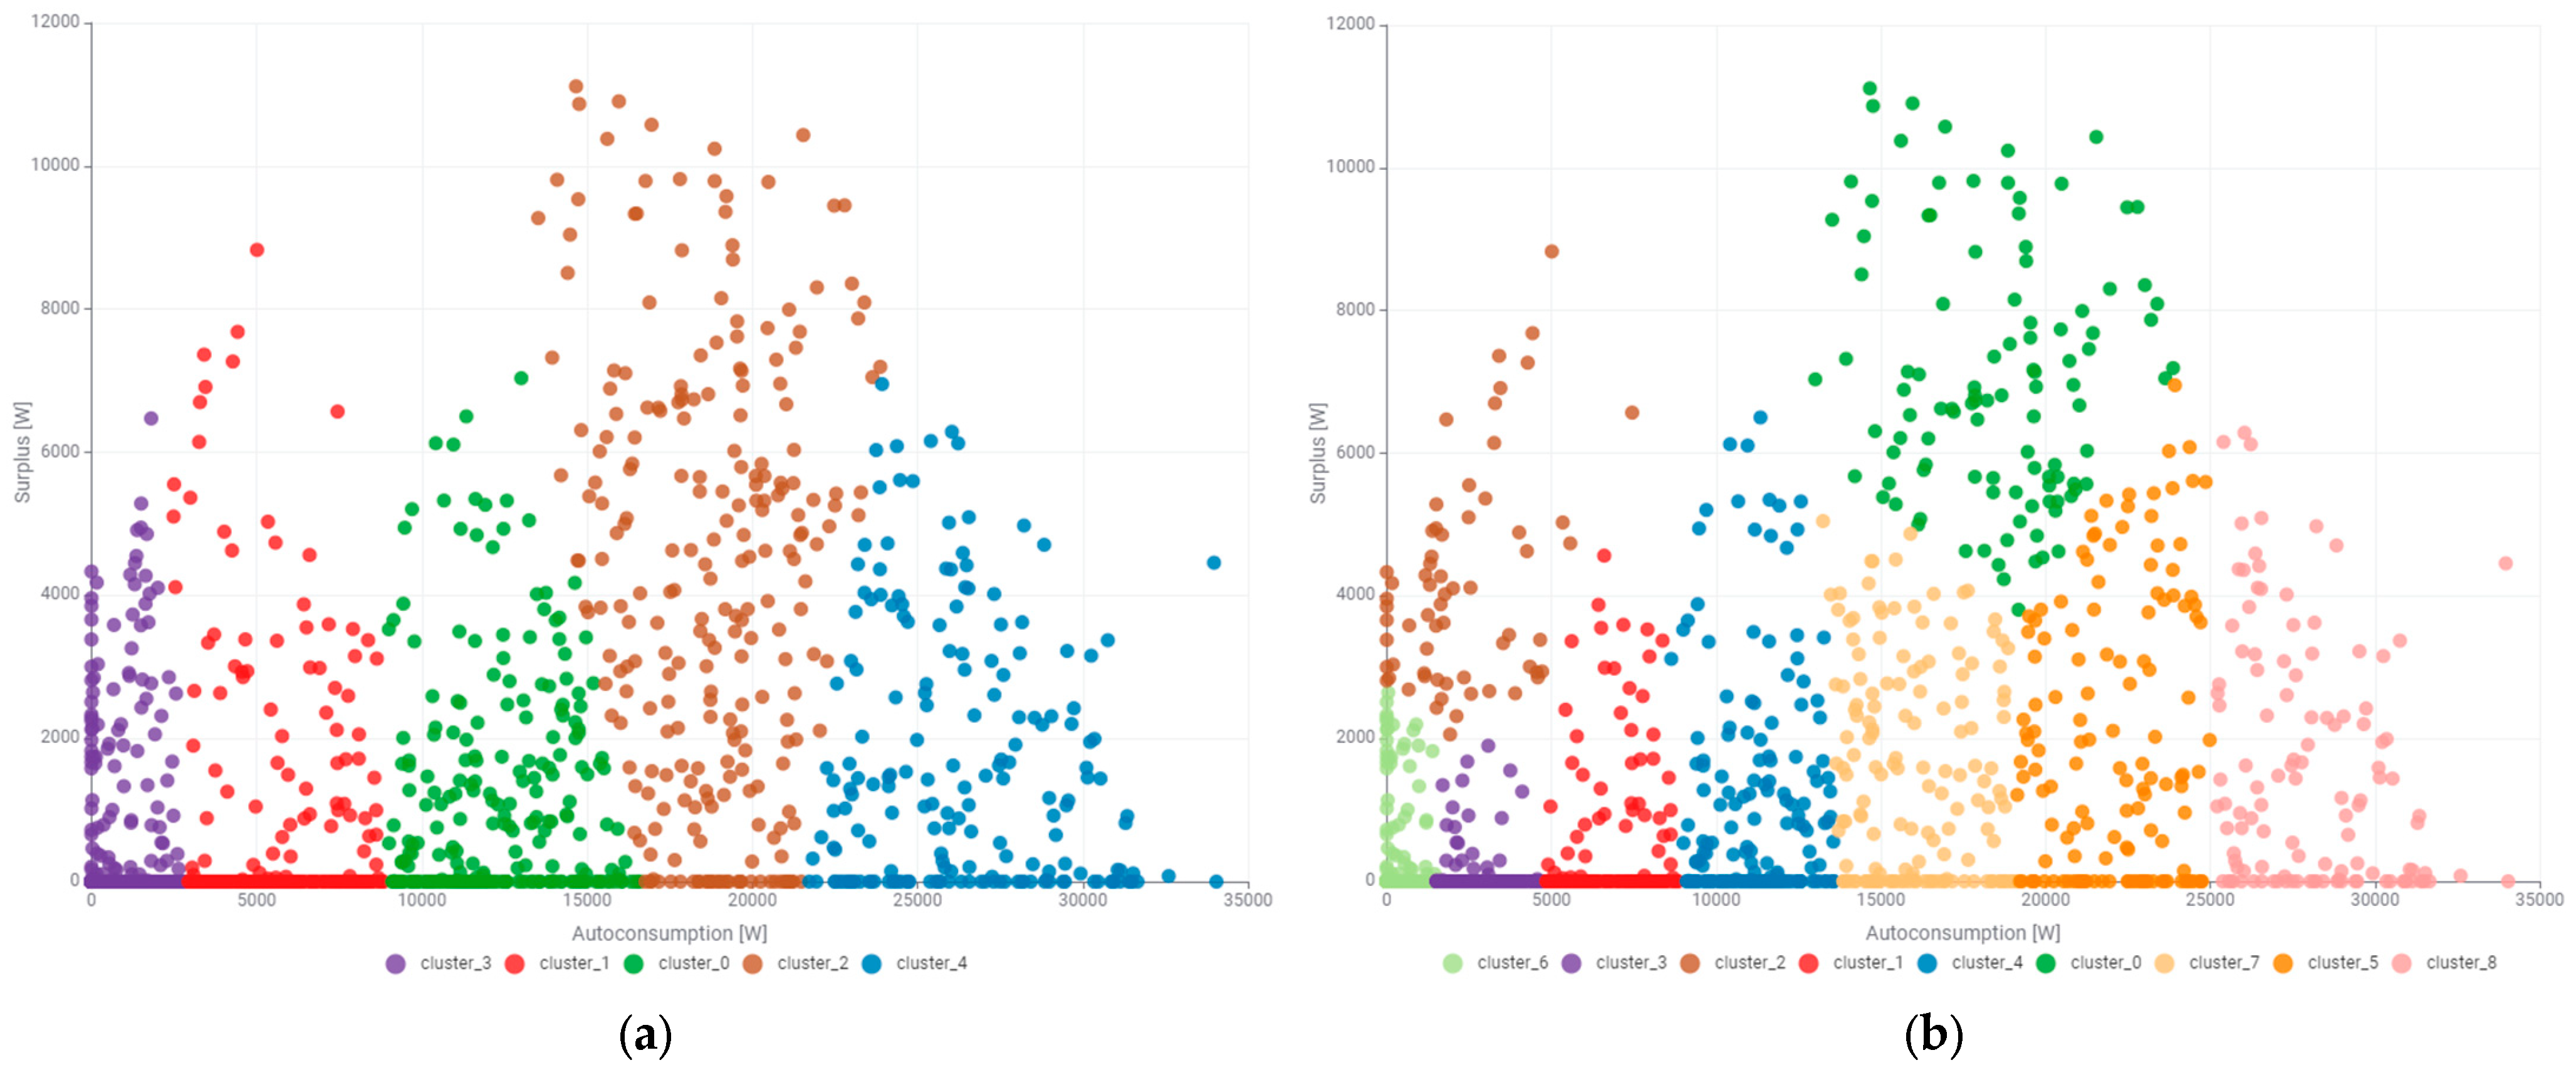
Unsupervised clustering was employed to further investigate the relationships between the self-consumption power and the surplus power that is transferred to the power grid. Determining the number of clusters affects their quality and usefulness for further usage in energy management. Unsupervised clustering adopted by the authors allows hidden structures and patterns to be discovered in the data without the need for labeling. It facilitates segmentation of large data sets. It is also beneficial in preliminary data exploration, supporting further analyses and decision-making. This paper deliberately omitted Silhouette analysis in assessing the quality of clustering. The authors have already addressed this topic in another paper. Determining the signature of the power produced by the photovoltaic system began with the division of the self-consumption power state space and the surplus power transferred to the grid into five clusters. The result of this clustering is presented in
Figure 8a. The graph displays that clustering was performed in relation to self-consumption power with clear, almost vertical boundaries. Cluster analysis showed that the largest surplus power occurs for cluster_2 (brown). However, the size of this cluster raises the authors’ concerns about its usefulness in energy management. It was decided to perform the clustering with a division into nine states, which is shown in
Figure 8b. In relation to the division into five states, the decomposition of the cluster of the largest surplus into three subclusters is visible: cluster_7 (yellow), cluster_5 (orange), and cluster_0 (green). In particular, the selection of cluster_0 (green) may be of great importance in energy management due to the quantification of the larger surpluses of power that can be stored in the energy storage system (ESS). One of the clusters will always correspond to zero or close to zero power. It is worth considering its size and usefulness in energy management. When divided into nine clusters, the cluster of zero and close to zero power is much smaller. The presented expert validation demonstrates that increasing the number of clusters has a positive effect on their potential use in the description of the power produced by the photovoltaic system.
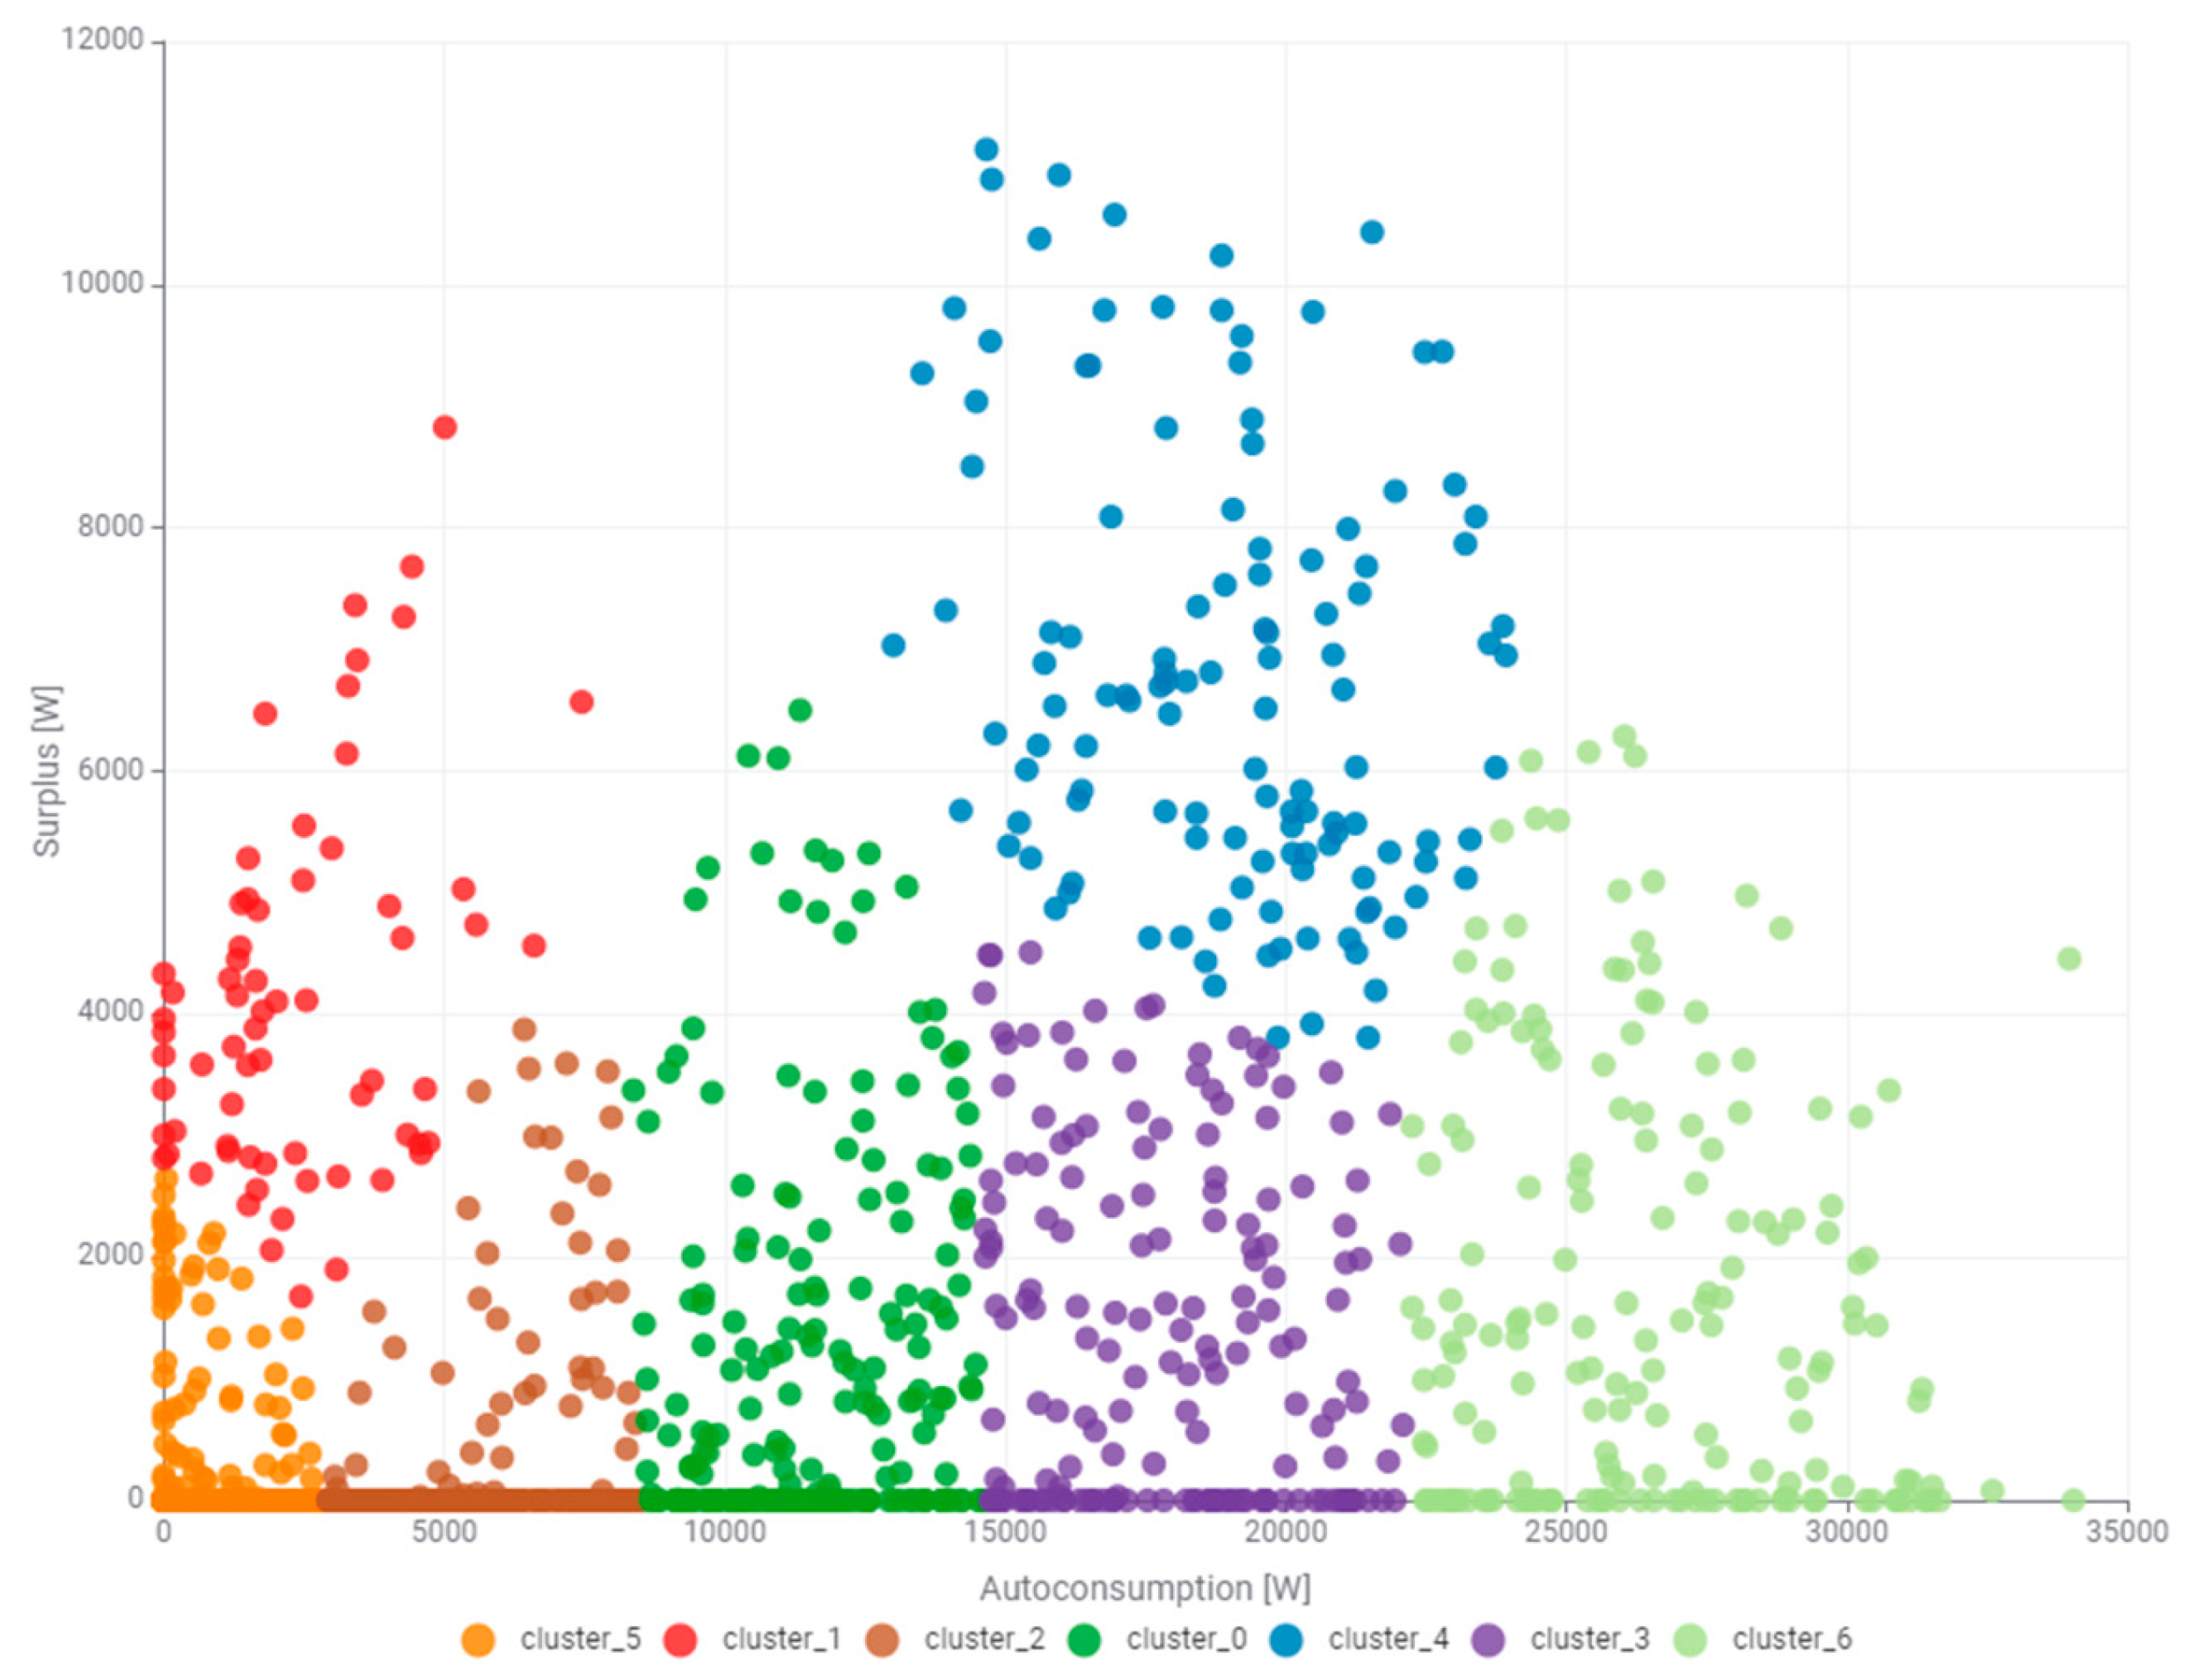
In the next step, a consensus was reached between the number of clusters and their usefulness in energy management. Finally, a division into seven clusters was made, the results of which are shown in
Figure 9. With this number of clusters, a distinct cluster of surplus in a larger power range is still visible, which is cluster_4 (blue). The cluster of zero and near-zero powers, cluster_5 (orange), is small in terms of the range of powers covered both on the side of self-consumption and surplus. Furthermore, it is imperative to distinguish cluster_1 (red). It has been demonstrated that a range of surplus powers, ranging from 2000 to even 9000 W, can occur for a self-consumption power close to zero.
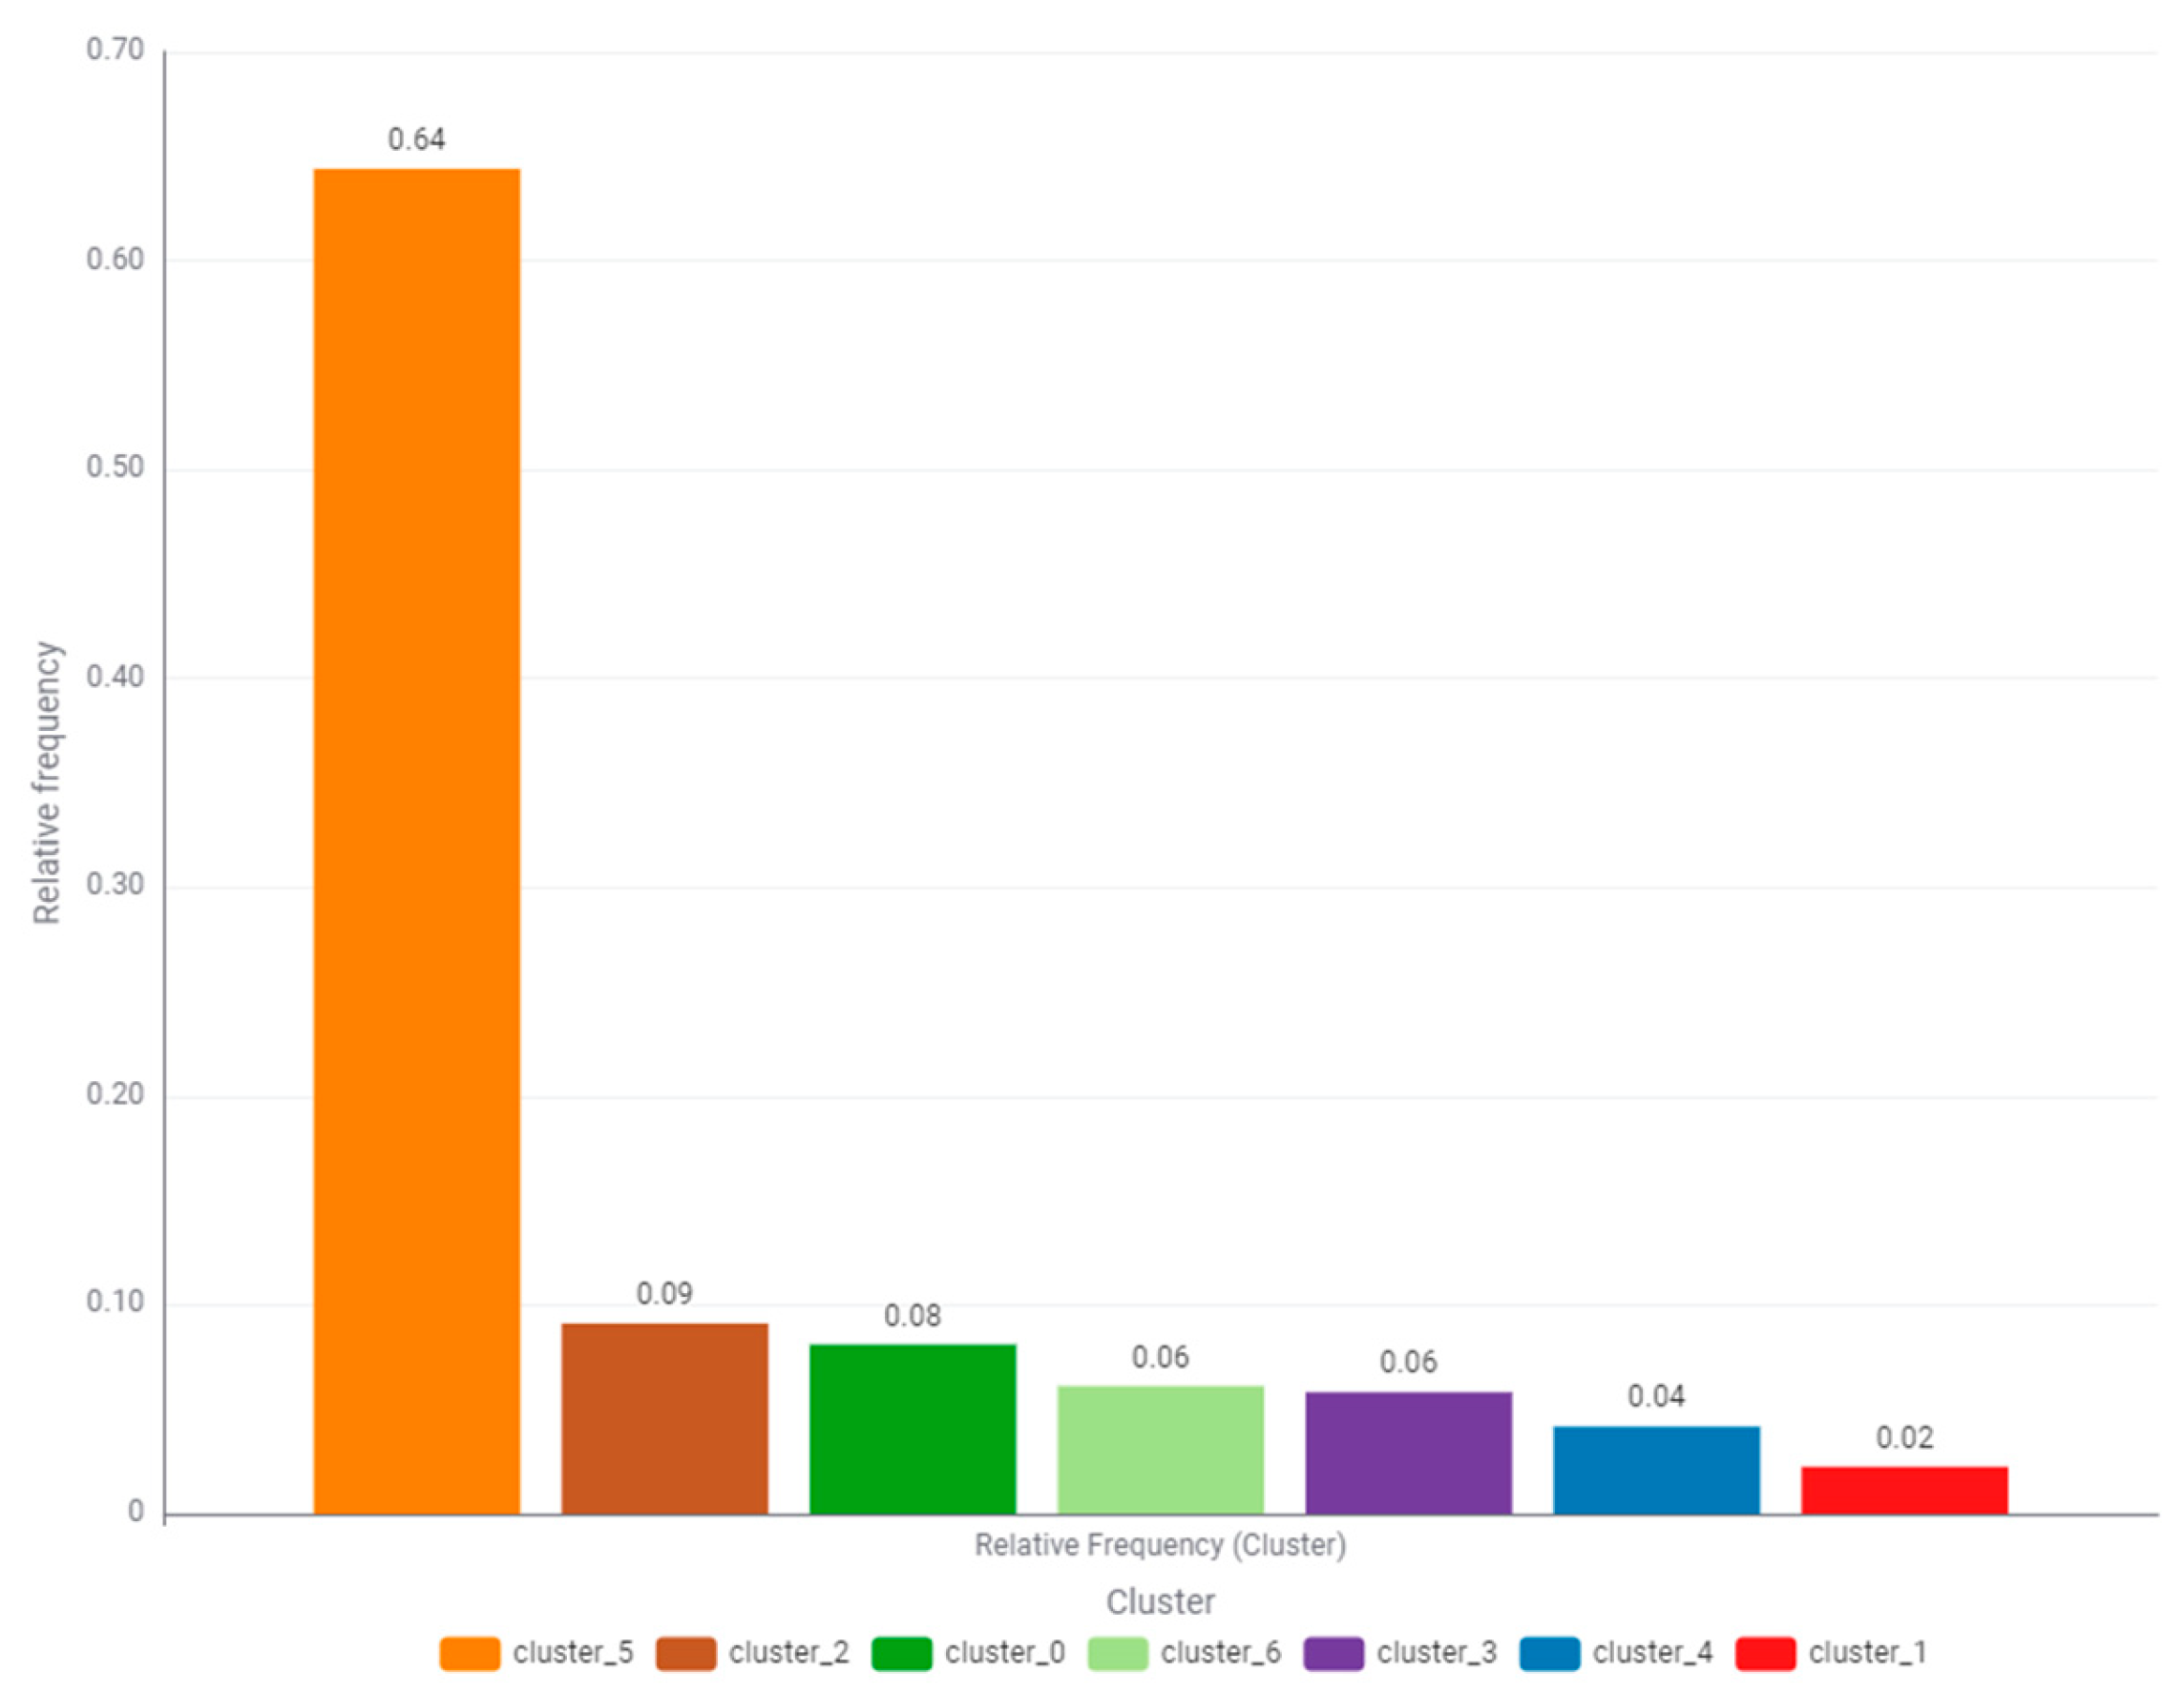
An essential element of clustering is to determine the relative frequency of occurrence of individual states, which is presented by means of a bar graph in
Figure 10. The highest frequency of occurrence is 64% for cluster_5 (orange). The relative frequency of occurrence of cluster_4 (blue), which is of great interest to this research, is 4%. According to the authors, the surplus power transmitted to the power grid is significant and should encourage employees managing the system to consider purchasing an energy storage system.
The subsequent discussion will address the fundamental application of clustering results in the management of produced and consumed power.
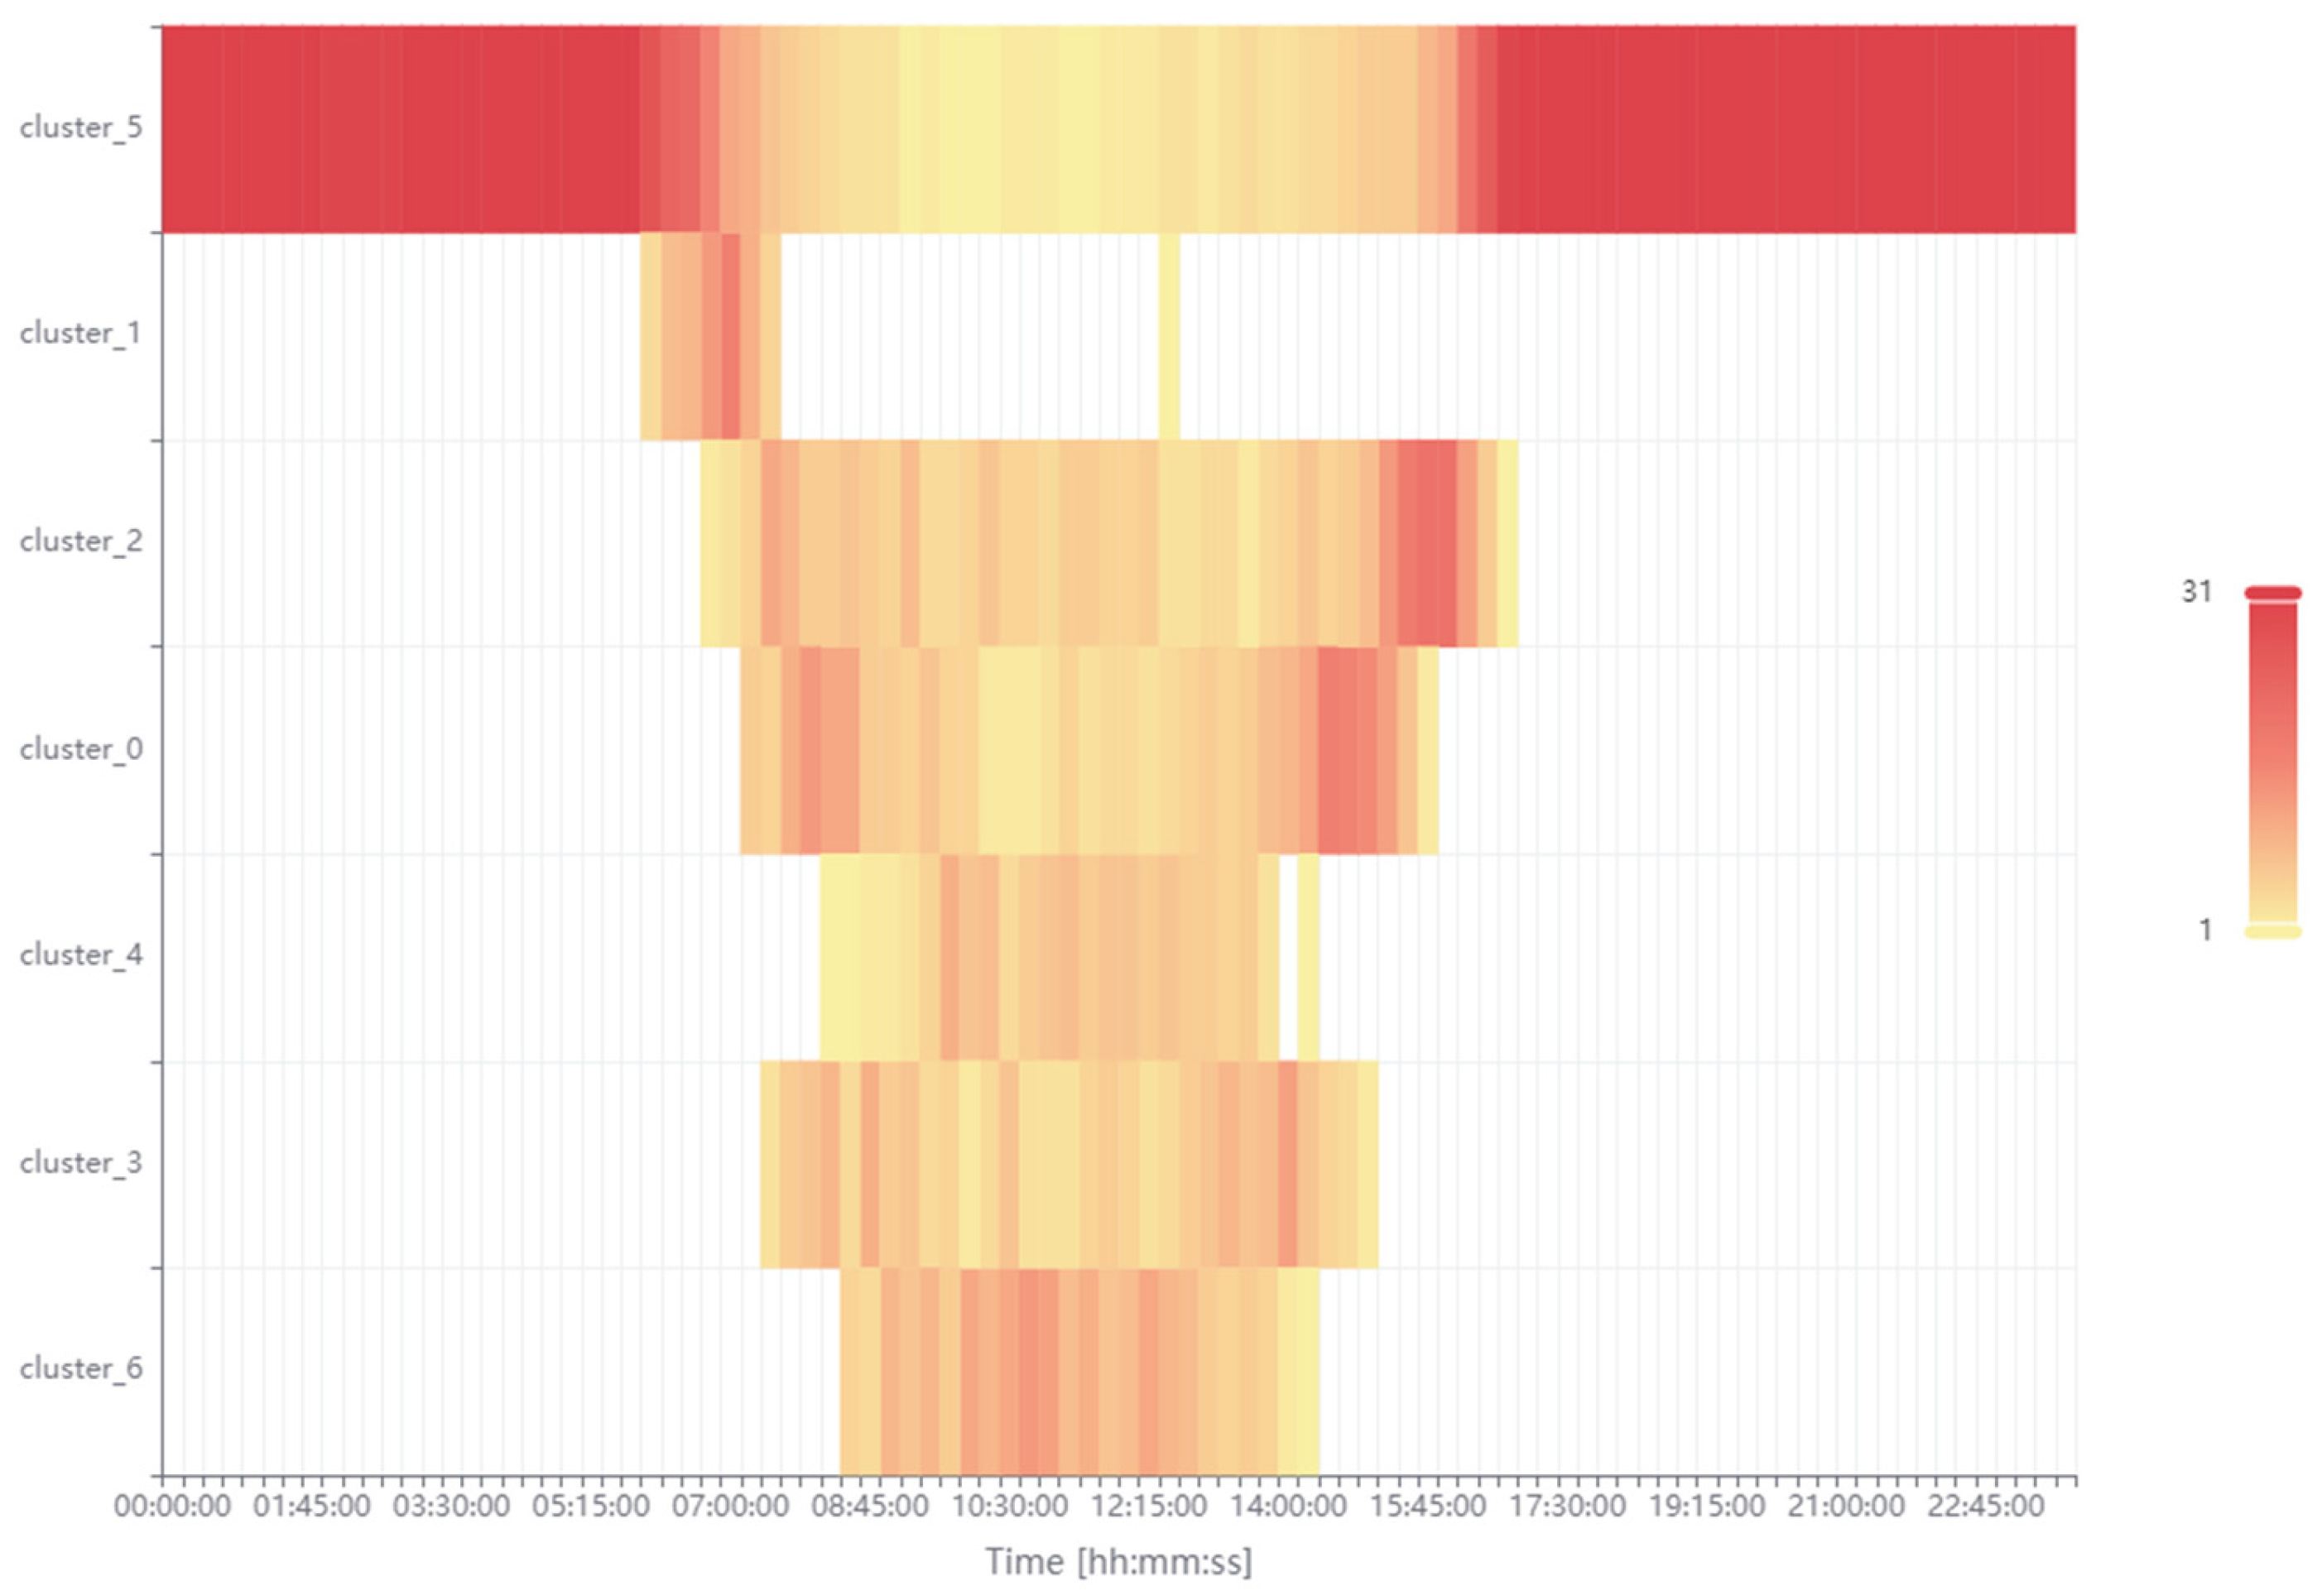
Figure 11 presents the occurrence of seven individual clusters in specific time intervals (15 min) of the day. It is worth recalling that this analysis covers the entire month of March 2025. To initiate the analysis, the occurrence of cluster 5 (orange) must first be examined. Zero and close to zero powers occurring in the spaces of the self-consumption and surplus state appear with a high frequency of occurrence during the night after midnight and in the evening until midnight and with a lower frequency of occurrence during the day. As the legend indicates, the maximum frequency of a given state in a specific time interval is equal to 31, which corresponds to the number of days in the month of March. Cluster_1 (red) occurs with a greater frequency only in the morning, when the photovoltaic system is starting to generate more power, which exceeds the demand for the building’s self-consumption power. At that time, employees have not yet started their work at the university. Cluster_2 (brown) and cluster_0 (green) have an approximate time of occurrence. According to the authors, they should be associated with the symmetry of the building’s power supply by the photovoltaic inverter and the asymmetry of the power reception by the three-phase electrical network in the building. These surpluses can also be effectively stored in the ESS. Cluster_4 (blue) occurs during the day and its highest frequency of development occurs at noon. This means that there is the existence of a large surplus of the produced power in relation to the needs of self-consumption. With the increase in the amount of energy produced in the following months, this surplus may increase. It is important to further consider the amount of surplus power in relation to the amount of self-consumed power, which may also change. Cluster_3 (purple) and cluster_6 (light green) also occur during the day. Cluster_3 (purple), similarly to cluster_0 (green), shows higher frequencies of occurrence in the morning and afternoon. Cluster_6 (light green) indicates the highest surplus power produced at high noon, similarly to cluster_4 (blue). The performed cluster analysis together with expert validation allows for precise time localization and quantitative determination of the power generation states for the needs of building the self-consumption and its surplus power, which will be transferred to the power grid. The authors recommend considering the use of an ESS for storing the surplus power.
3.2. Analysis of Power Consumption from the Photovoltaic System and the Power Grid
The total power consumption, including the power produced by the photovoltaic system and drawn from the power grid, on individual days in March 2025 is presented in
Figure 12. In March 2025, the WSEI University building consumed 5.91 MWh of electricity. As mentioned earlier, 3.4 MWh (58%) of the consumption was covered by the energy produced by the photovoltaic system. The missing energy of 2.51 MWh (42%) was taken from the power grid.
The power curve depicts that on days with low power production by the photovoltaic system, the power drawn from the power grid increases significantly. In the total demand graph, it is not possible to detect the regularities related to a different profile of the building’s power demand on weekdays and weekends. It can be concluded that the building’s daily power demand is quite variable and fluctuates between 100 and 280 kWh. The authors are far from drawing conclusions about the correctness of the selection of the peak power of the photovoltaic system for the profile of the building’s power demand based on the presented data. Their task is to present a method of analyzing measurement data using various available tools.
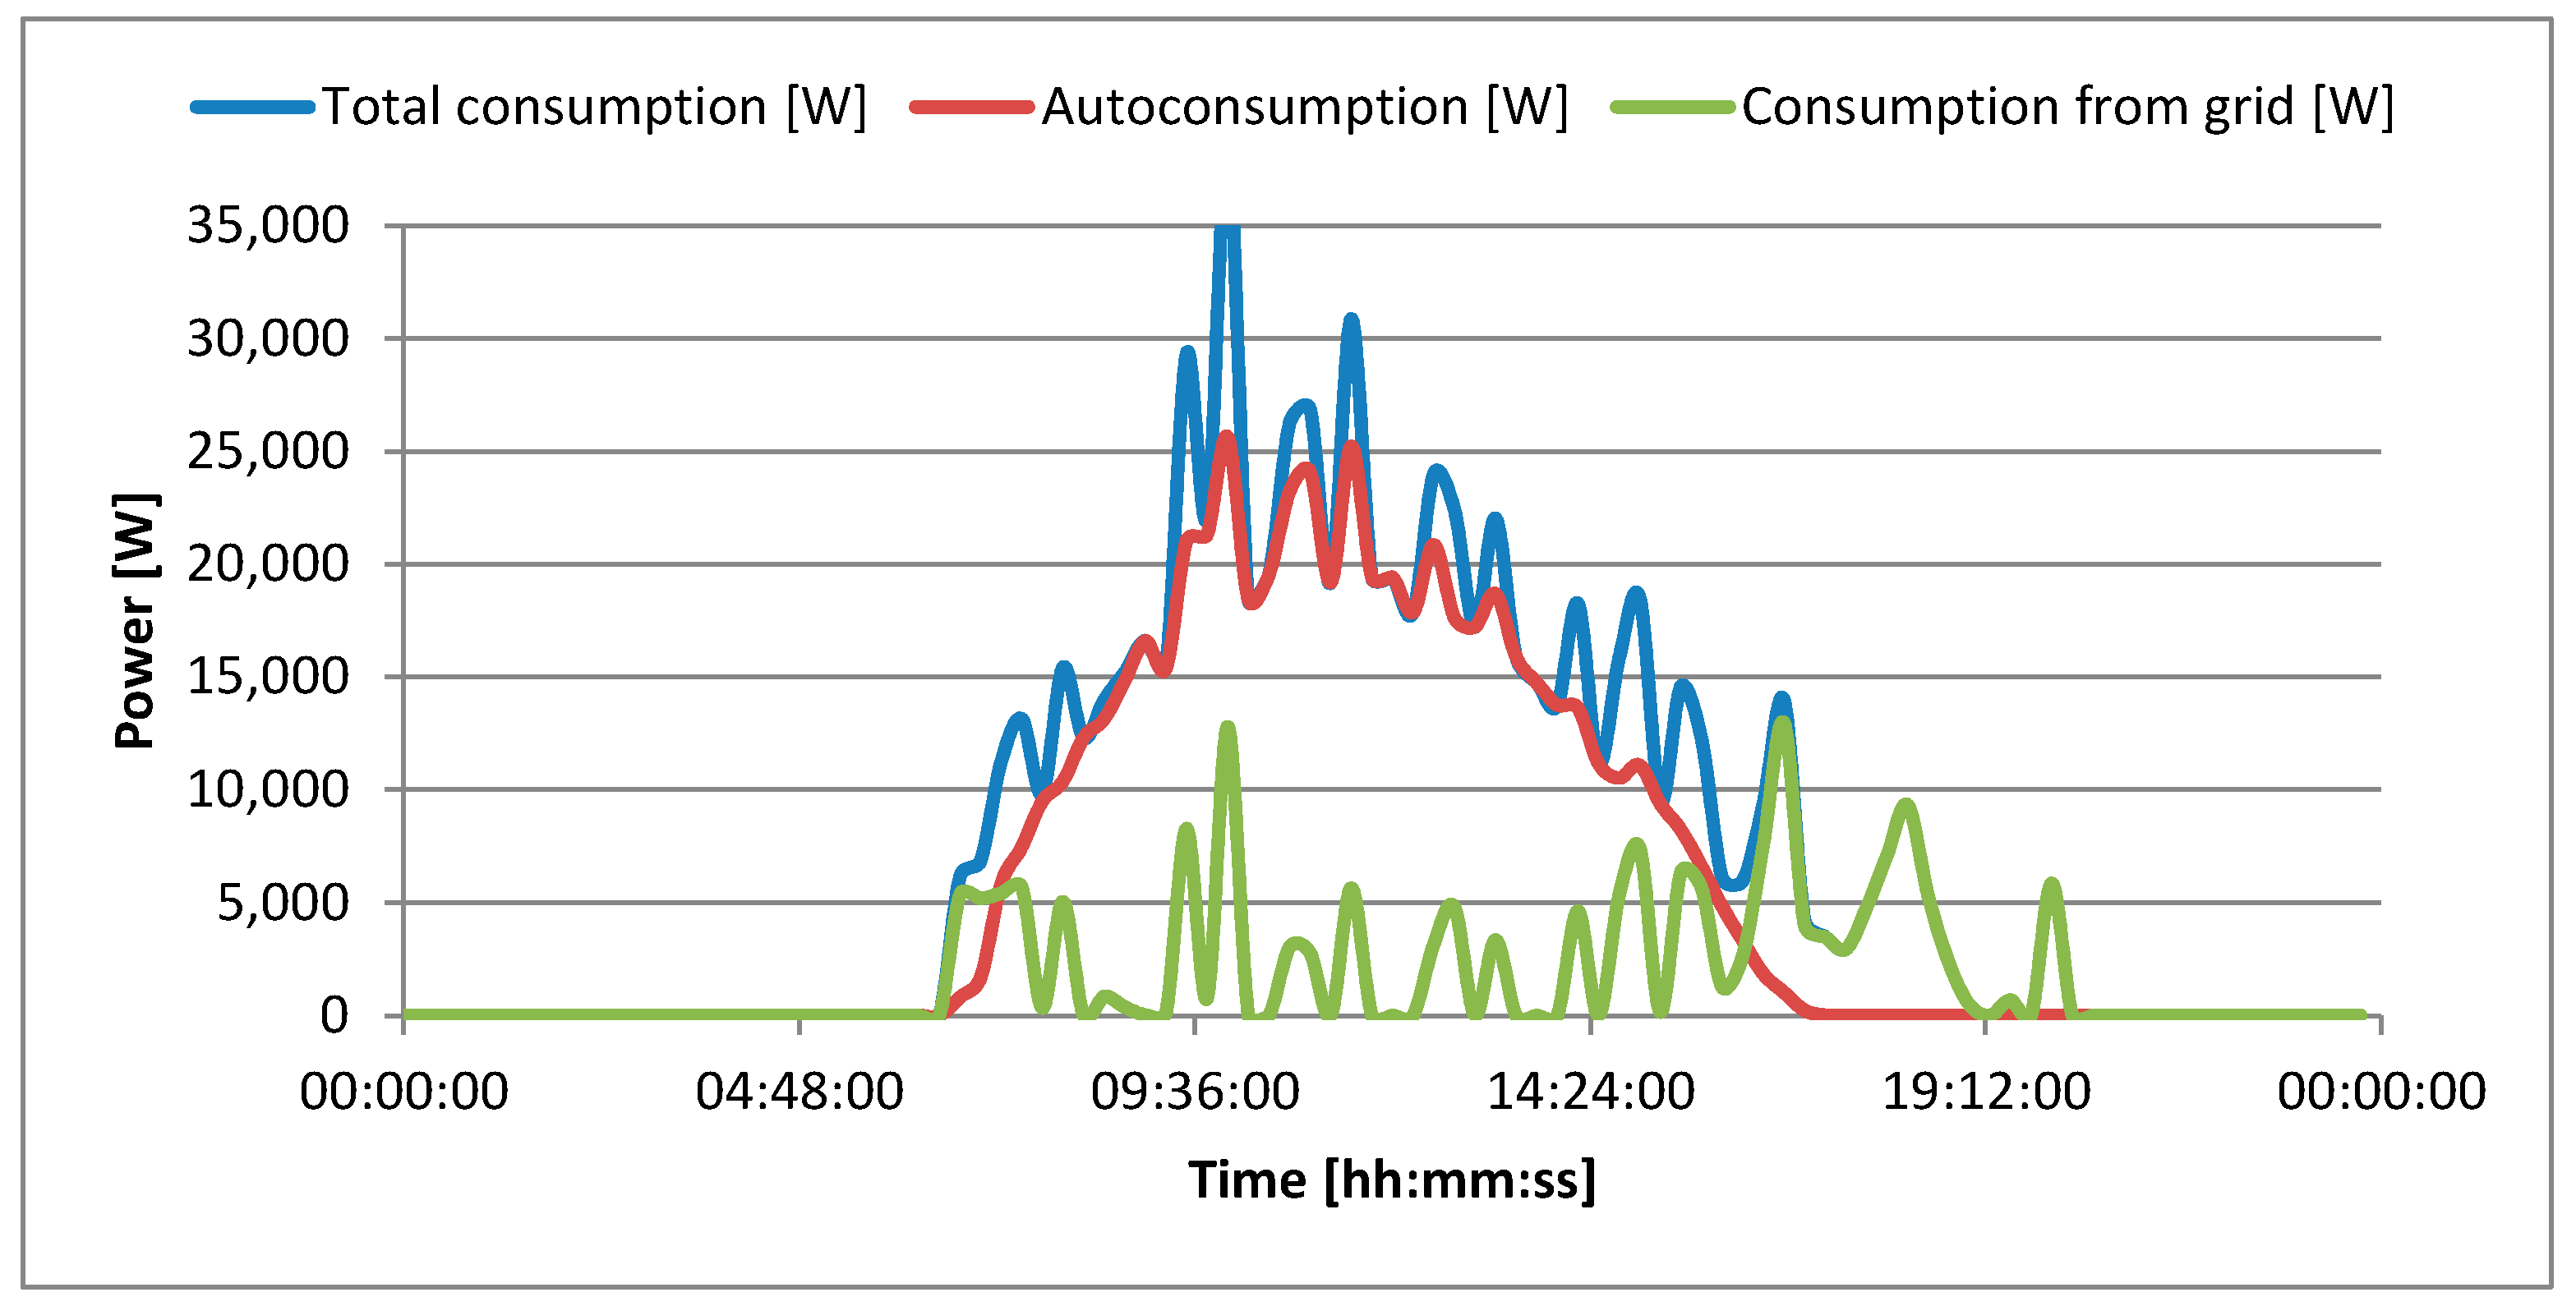
Narrowing the time series of the power studied to one day will again aid in a more detailed analysis. The total power consumption, including the power produced by the photovoltaic system and drawn from the power grid, on 5 March 2025 is presented in
Figure 13. During the whole day, it can be observed that the amount of power generated by the photovoltaic system is not able to cover the total power demand of the building. Small amounts are drawn from the grid during the working hours of the administration, i.e., from 8:00 AM to 04:00 PM. Power from the power grid is also drawn from 04:00 PM to 08:00 PM, when the photovoltaic system does not generate power after sunset. It is worth recalling that we are considering the month of March, in which the length of the day is comparable to the length of the night. In the following months, the length of the day will increase, so the amount of power consumed in the late afternoon will still be able to be covered by self-consumption.
The histogram of the total power consumed (
Figure 14a) has a very similar shape to the histogram of the power produced by the photovoltaic system (
Figure 5a). However, it reaches higher power values, which indicates the need for similar power from the power grid. The box plot is more symmetrical in relation to the shape of the box and the whiskers (
Figure 14b). The width of the box is also small in relation to the width of the whiskers. This indicates a small interquartile range. There are outliers in different power ranges and at different times of day. The presented analyses show that the total power consumed is more stable than the power generated by the photovoltaic system. It is worth emphasizing that these powers are completely independent of each other. They can also differ significantly in individual months of the year. In the following months of the year, the power produced will increase due to the higher position of the sun above the horizon and longer days. The total demand for power of the administrative building may also increase due to the greater demand for power of the ventilation and air conditioning systems. The authors will continue the research in different months of the year.
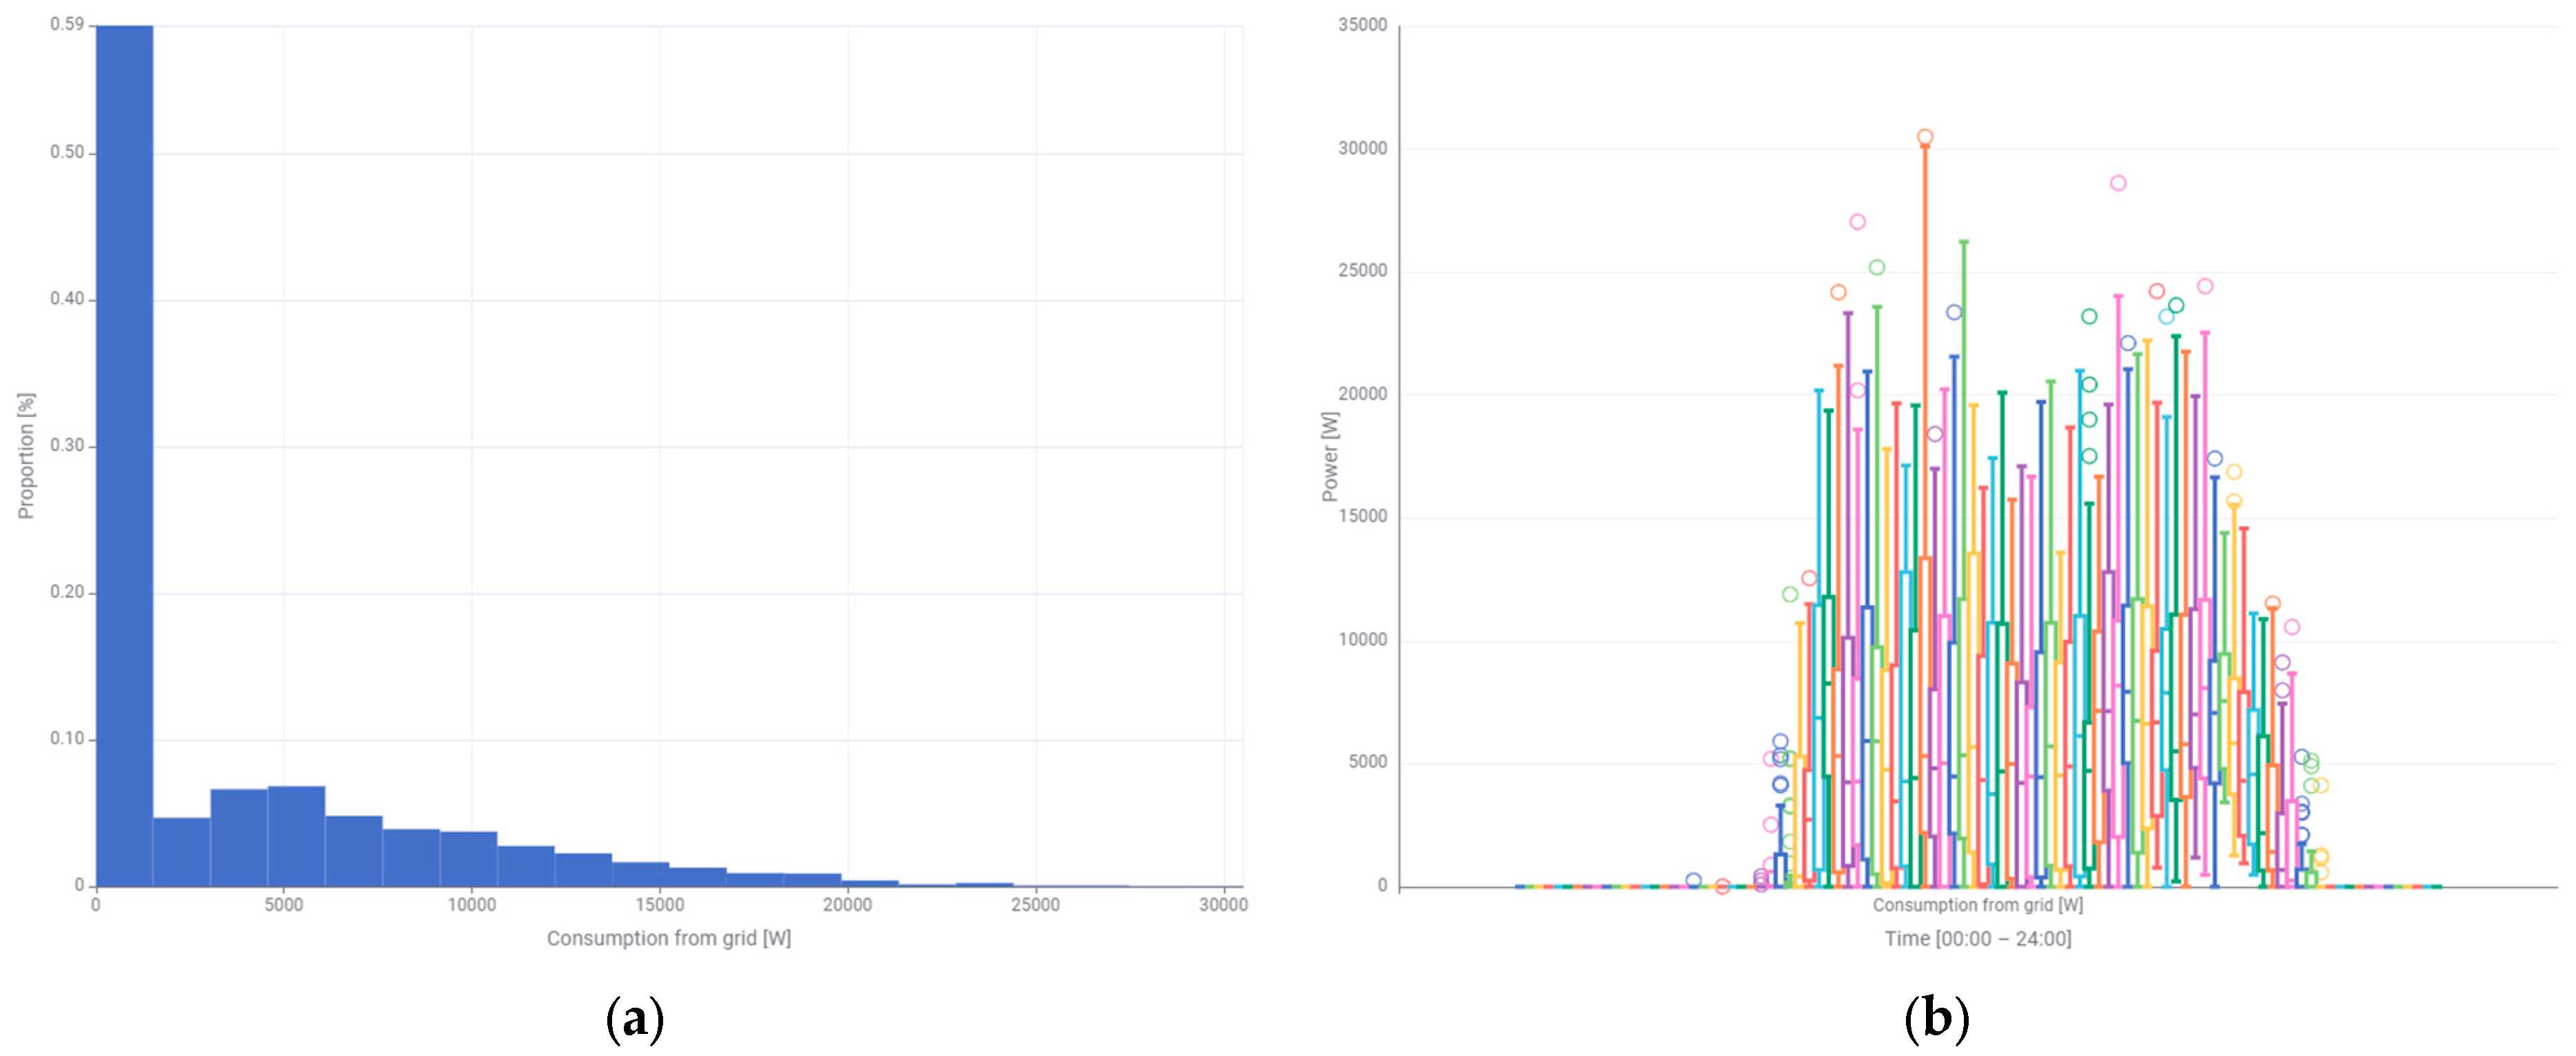
The histogram of power drawn from the grid (
Figure 15a) is similar to the histogram of total consumed power (
Figure 14a), but it has a smaller power range and there is a small percentage of it. The box plot visibly indicates that only in the early morning can the power produced by the photovoltaic system cover the total consumed power (
Figure 15b). The median power drawn from the grid is constant during the operation of the photovoltaic system and is about 5000 W. After sunset, it increases slightly to the level of 7000–8000 W. The box is symmetrical with a small interquartile range. The asymmetry is apparent only in the length of the whiskers of higher powers. Outliers occur rather often, especially in the upper power ranges.
It is important to acknowledge that the power drawn from the grid occurs at the same time as the overproduction power. This is due to the asymmetric loading of the phases in the three-phase power system and the symmetrical power supply of the three phases of the building by the photovoltaic inverter.
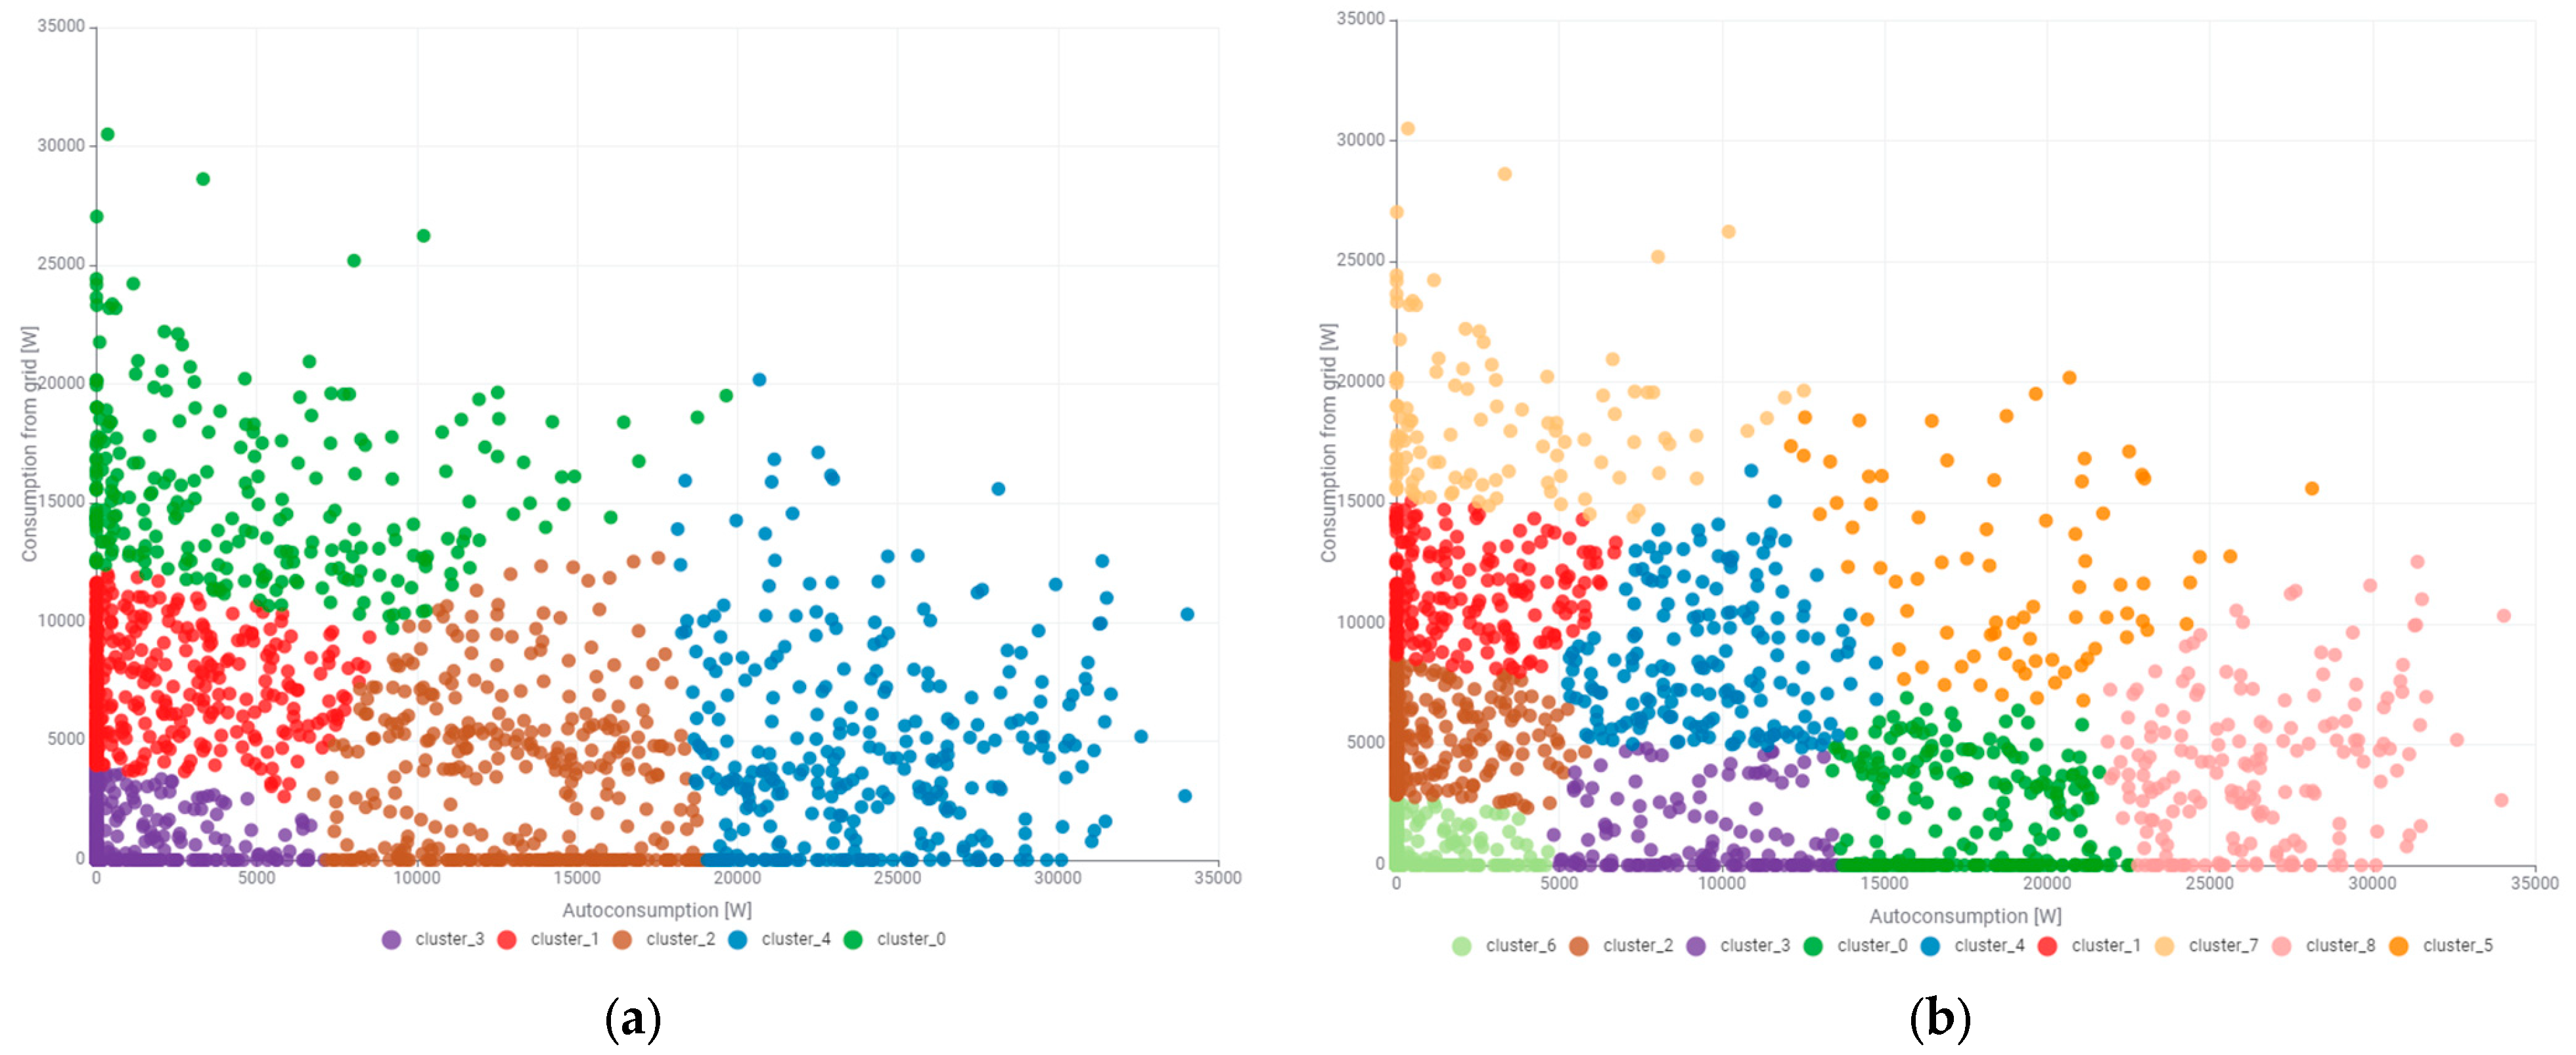
In the case of cluster analysis of the power consumed by the university building, signatures of self-consumption power and power drawn from the network were determined. Both powers make up the total consumed power. Unsupervised clustering was performed with division into five clusters in
Figure 16a, nine clusters in
Figure 16b, and seven clusters in
Figure 17. In this case, the number of clusters was also optimized with respect to their usefulness in the energy management process.
For practical reasons that translate into financial costs, we should be most interested in cluster_0 (green), cluster_4 (blue), cluster_6 (light green), and cluster_1 (red), which are shown in
Figure 17. Cluster_0 (green) defines the states of the building’s power consumption process corresponding to the power consumption from the power grid for low or zero self-consumption power. It is noteworthy that the values of the power drawn from the grid for this cluster range from 12,000 W to over 30,000 W, i.e., it is the power drawn from the grid at zero or low power generated by the photovoltaic system. Especially high values of the power drawn from the grid pose a risk of exceeding the threshold of the power ordered from the power grid. This is associated with high costs for the consumer. Cluster_4 (blue) also includes the states of the power consumption from the power grid falling within the range of the average self-consumption powers. The power drawn from the grid ranges from 7000 to approximately 20,000 W. This cluster should be monitored in the coming months. The person managing the energy in the building should pay special attention to the percentage increase in the power drawn from the grid in relation to the self-consumption power. The increase in the power drawn from the grid in this cluster will be informative of the need to increase the peak power of the photovoltaic system. Cluster_6 (light green) includes the power drawn from the power grid with a value of 0 to 15,000 W, however, falling within the range of the highest self-consumption powers (above 20,000 W). The clustering results prompted the authors to analyze the power of the electricity receivers located in the building. One conclusion is apparent: substantial increases in power demand are attributable to the operation of two passenger elevators in the building. A passenger elevator with a capacity of up to five people, which usually corresponds to a maximum lifting capacity of about 400 kg, is a standard solution used in residential and public buildings. These types of elevators usually have a motor power of 3 to 7 kW, depending on the design, number of stops, and the technology used. In the case of electric elevators, which are currently the most used, the typical power is around 4 to 5.5 kW, with a travel speed of 1 m per second. The power supply for such devices is usually provided by a three-phase installation (400 V), which allows for the smooth and safe operation of the entire system.
For the state space of power drawn from the power grid and the self-consumption power, the relative frequency of individual clusters was also prepared in the form of bar charts presented in
Figure 18. The high frequency of cluster_5 (orange) of 53% should not be associated only with the lack of power drawn from the grid for very small and close to zero self-consumption powers. This cluster also includes the entire night period, when self-consumption and power drawn from the grid are 0 W. This is confirmed by the heatmap graph shown in
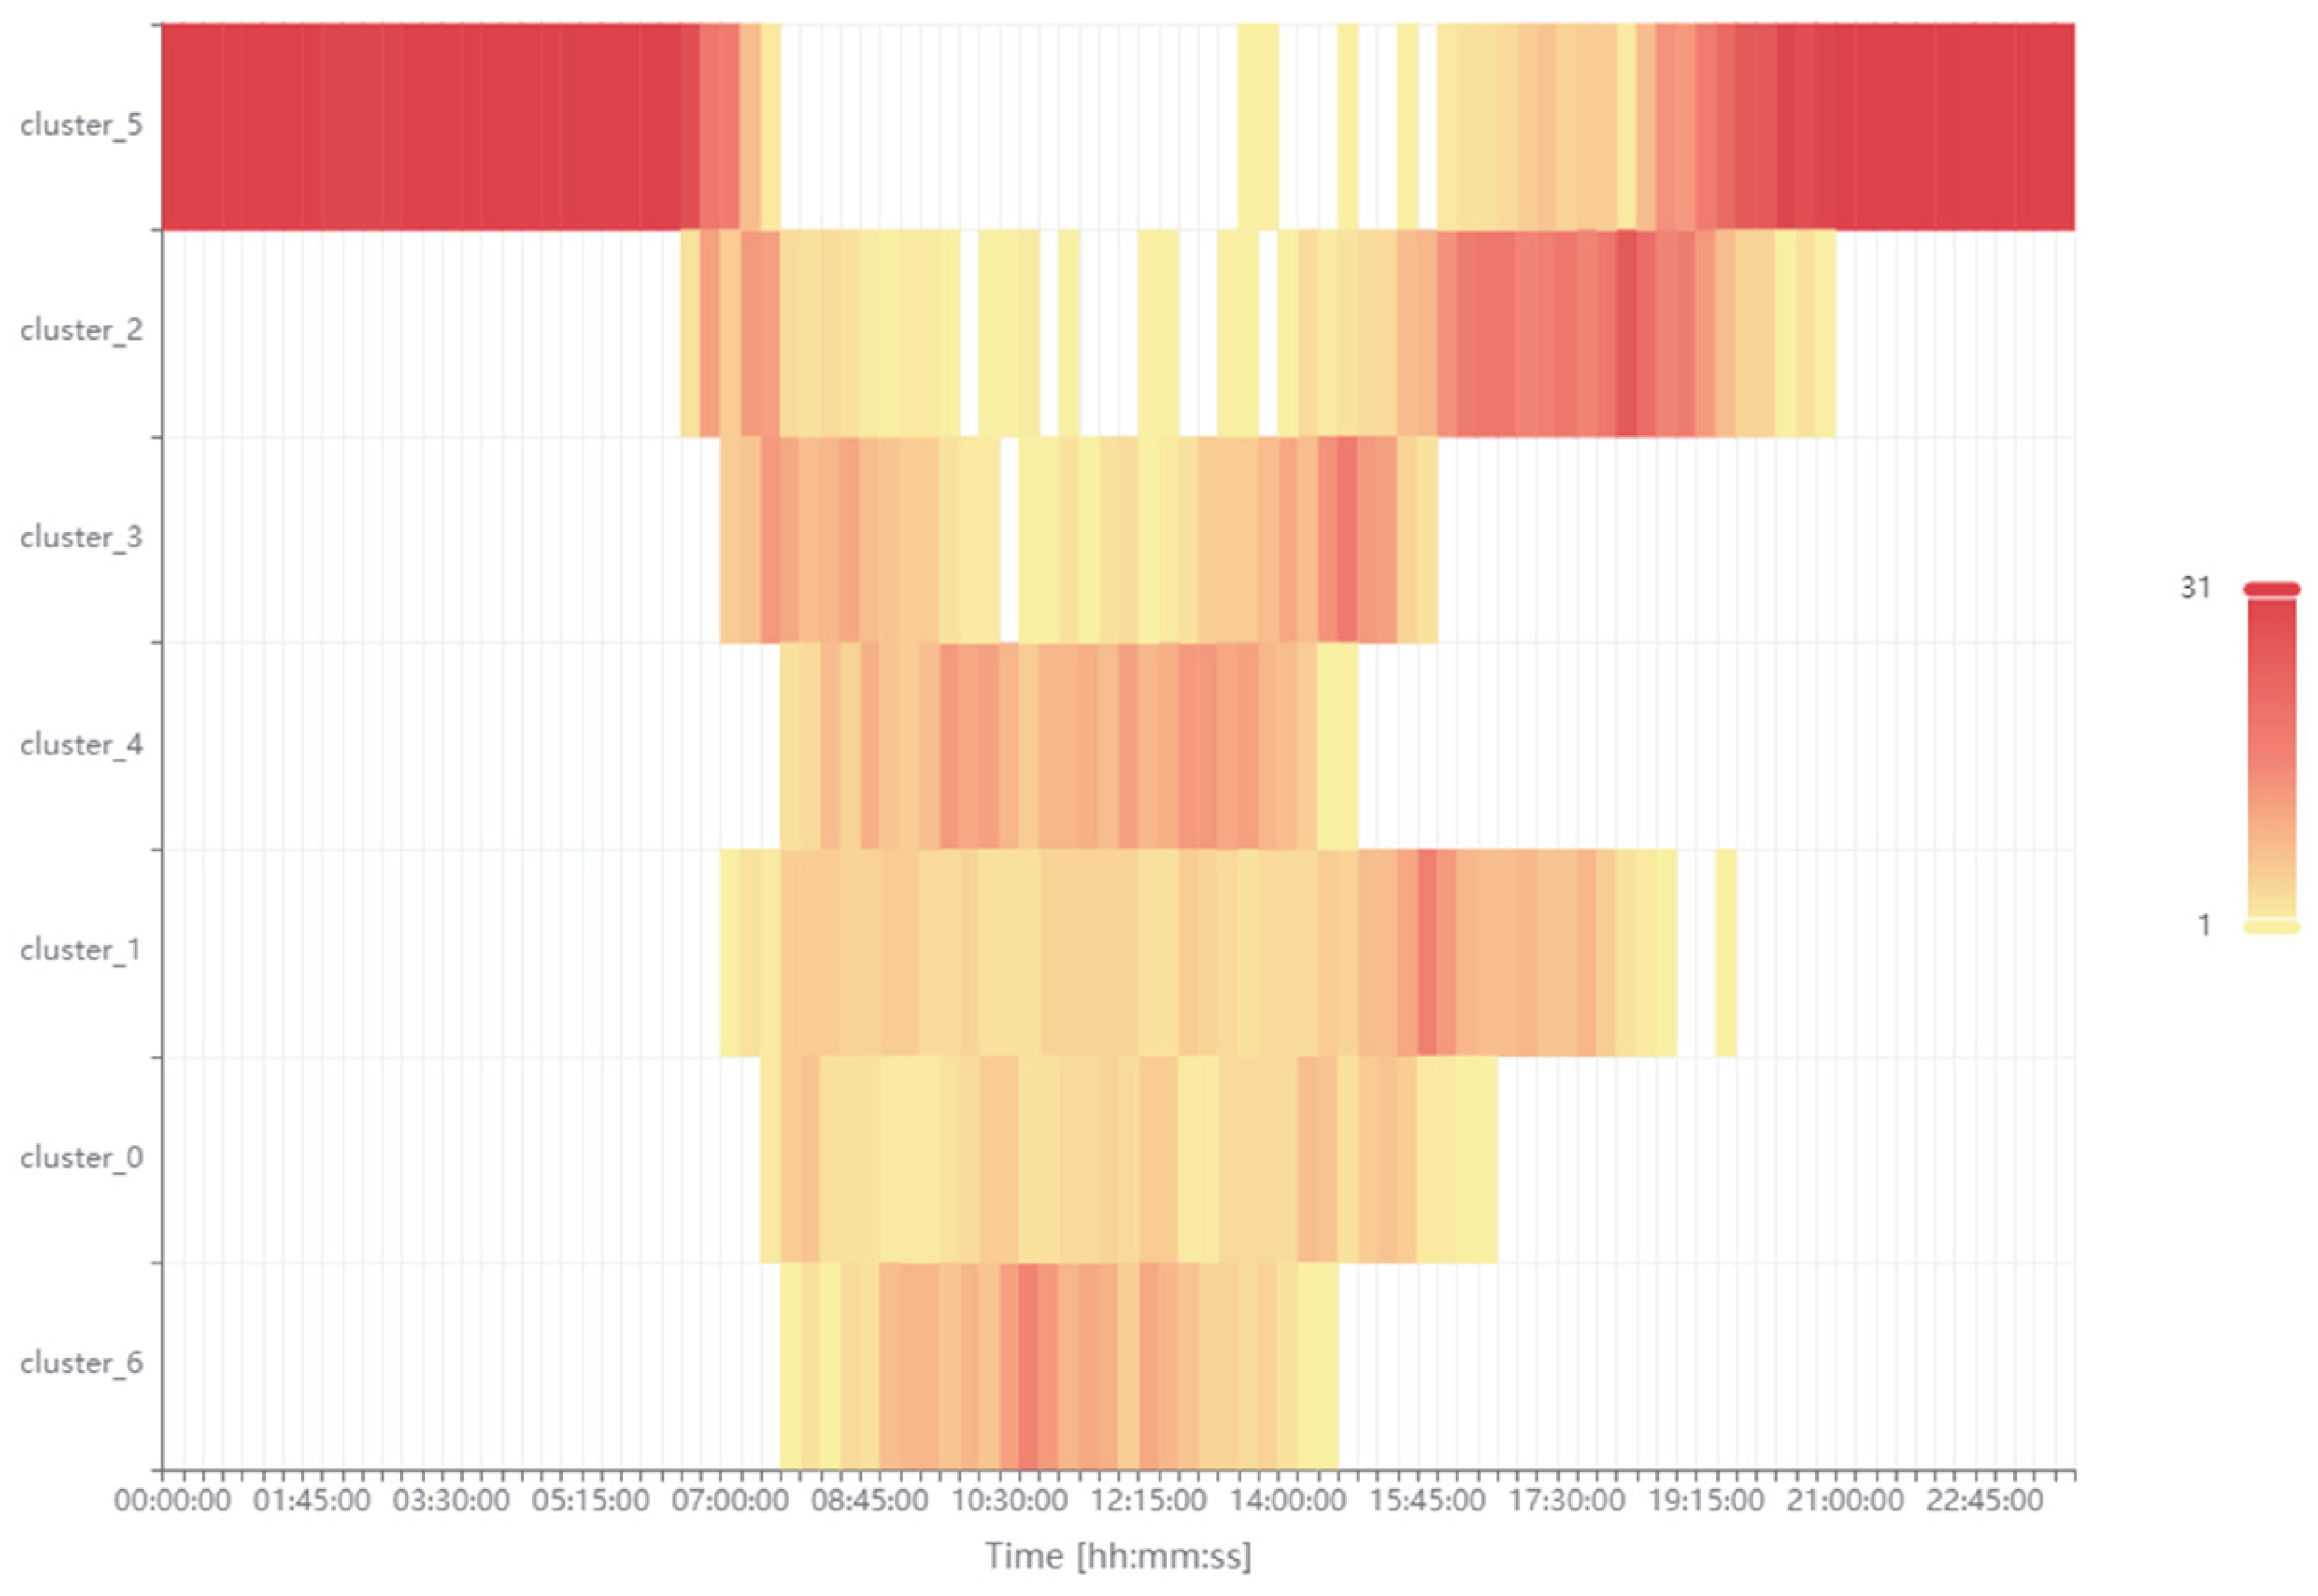
Figure 19.
Cluster_1 (red) corresponds to the power drawn from the power grid ranging from 8000 to 12,000 W, occurring from the morning hours (corresponding to the start of work by most people at the university at about 7:00 AM) until the closing of the building. The highest frequency of this cluster occurs in the evening hours (from 04:00 PM to 08:00 PM) when the power production from the PV system is small or non-existent. Cluster_2 (brown) occurs practically only during the day. The highest frequency of this cluster occurs in the afternoon hours (from 03:00 PM to 04:00 PM) when the power production from the PV system is small and the administrative staff and students are still at the university. Cluster_3 (purple) occurs during the afternoon hours and clearly includes the power drawn from the grid as a supplement to the self-consumption of the power produced by the PV system. The following months characterized by greater energy production may bring a solution to this problem. Cluster_0 (green) occurs almost throughout the entire period of the university opening hours. The use of an energy storage device may reduce these significant amounts of power drawn from the power grid. The situation is similar for cluster_4 (blue) and cluster_6 (light green). If the situation does not improve in the following months, characterized by greater energy production from the photovoltaic system, then it is necessary to consider expanding the currently owned photovoltaic system. The authors would like to emphasize once more the necessity of clustering in the spaces of the state of power drawn from the power grid in relation to the self-consumption power.
3.3. Clustering of the Power Generated by the Photovoltaic System and the Total Power Consumed by the Building
In the case of a perfect match of the photovoltaic system to the energy needs of the building, there should be a linear correlation between the total consumption power and the power produced by the photovoltaic system and it should be equal to 1. In such an ideal scenario, there is no surplus power transmitted to the power grid or power drawn from it at times when the building’s demand is greater than its current production. However, the analyses carried out in the previous chapter have shown that stochastic behavior occurs both in the power produced by the photovoltaic system and in the power drawn by the building. In the analyzed monthly period, the stochasticity of power production by the photovoltaic system is characterized by the cyclicality of the succession of days and nights. The authors also noticed the lack of shading in the presented power time series. There are no other possibilities to interfere with the power generated in the photovoltaic system apart from adding an energy storage system. In this case, the entire surplus power could be stored and fed to the building. This would mean self-consumption of 100% of the generated power. Much greater possibilities of intervention occur on the side of regulating the power demands of the building and the people working in it. As a result of the effective management of electrical receivers in the building, it is possible to shape the profile of the consumed power so that it corresponds to the profile of the power generation by the photovoltaic system. However, such an analysis is not the aim of the project. In this chapter, the authors will present a further cluster analysis of the total power consumed, and the power produced by the photovoltaic system without going into their nature.
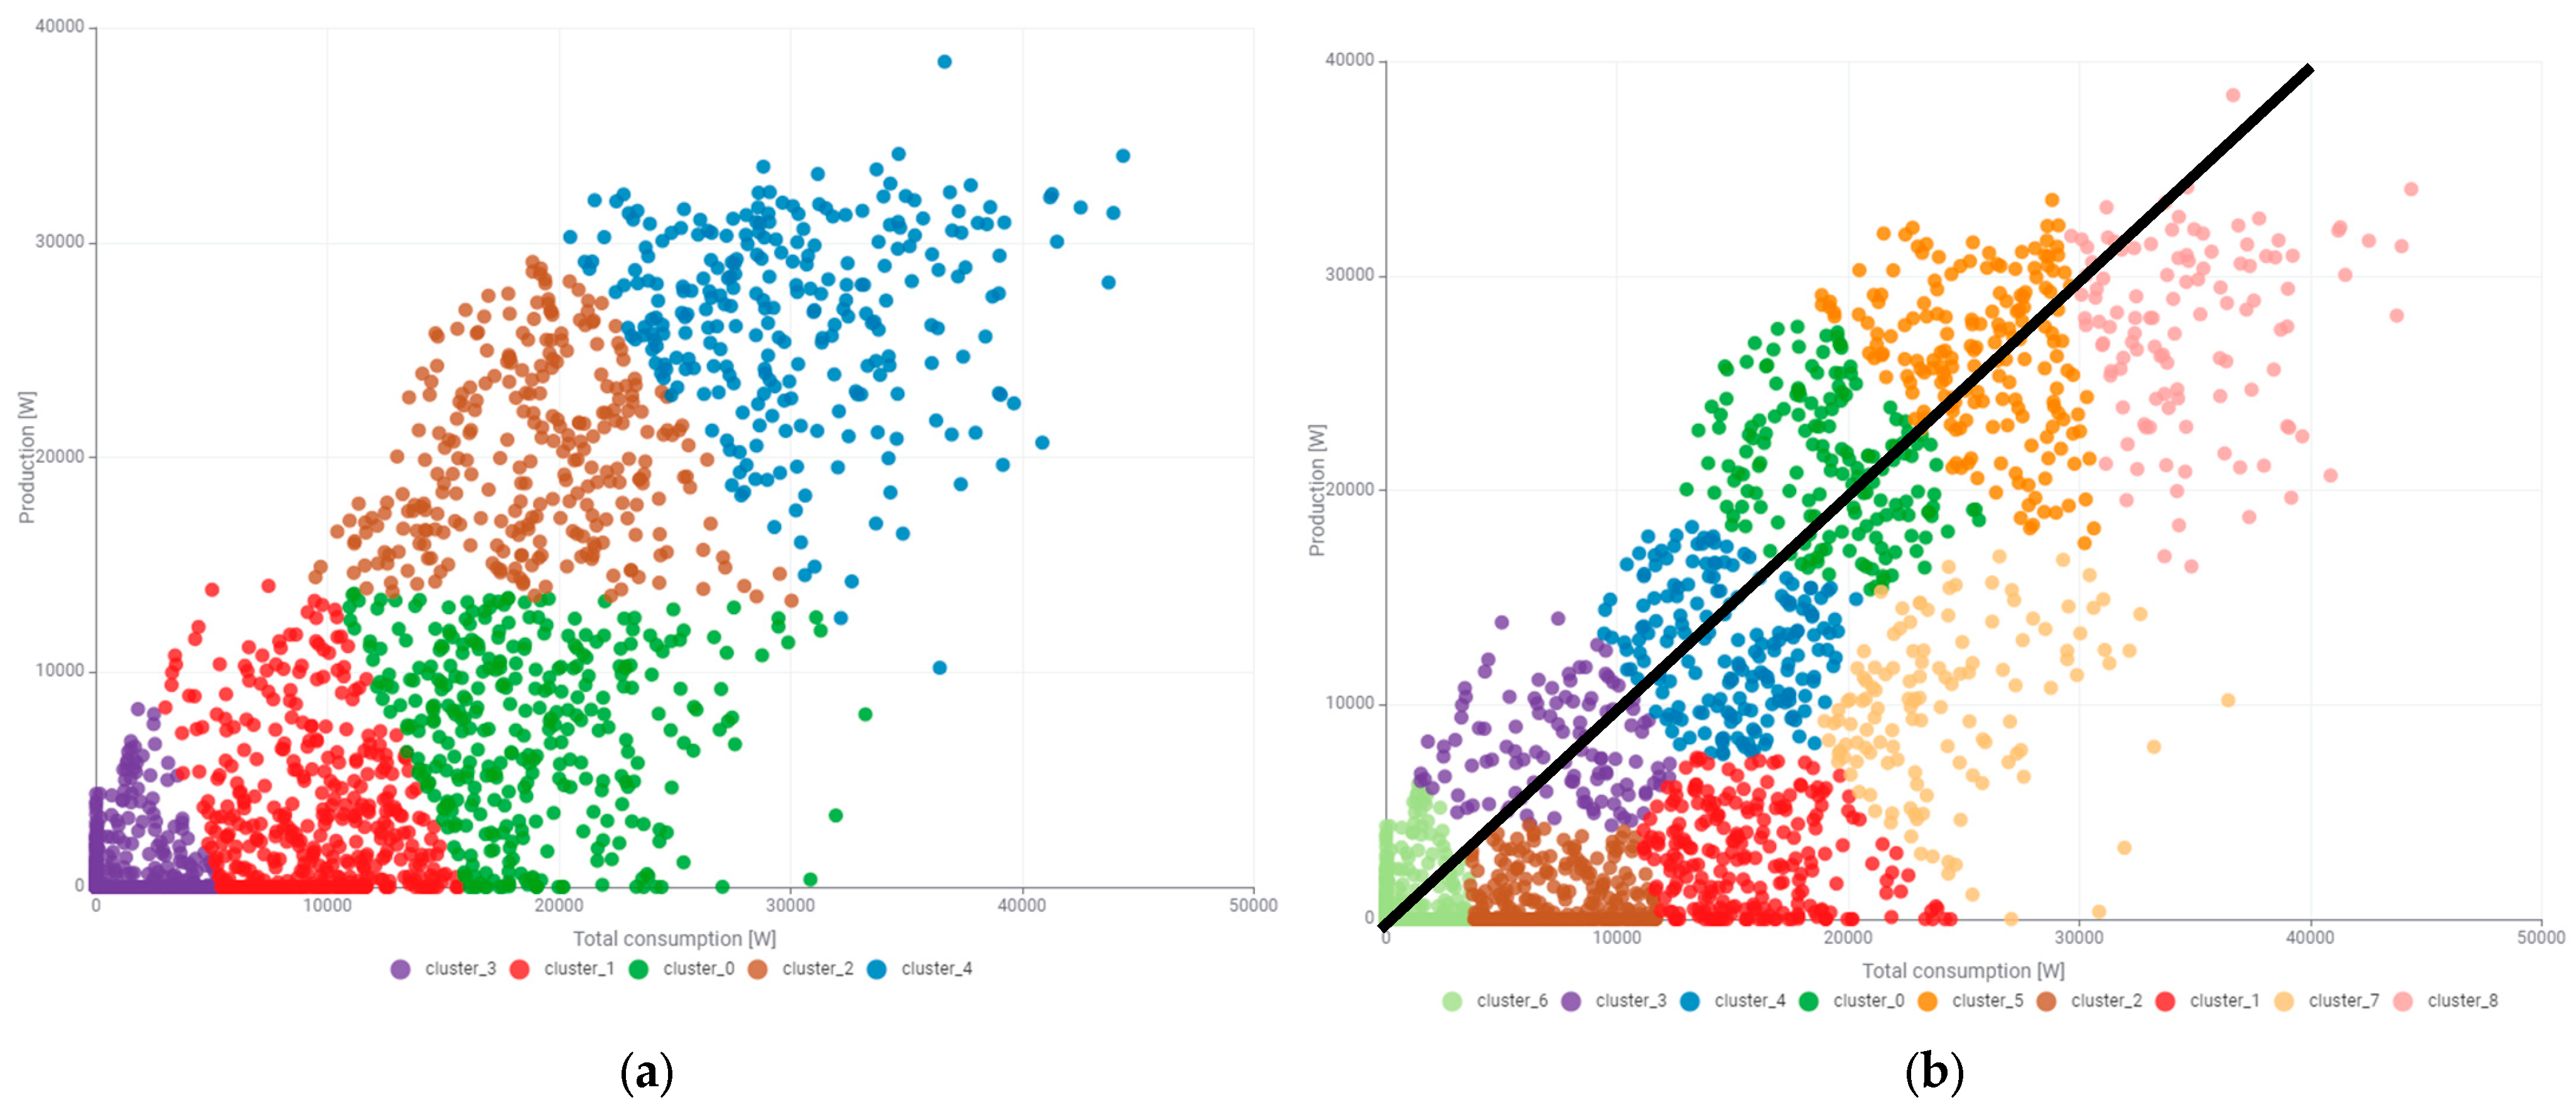
Unsupervised clustering was performed in the two-dimensional state space of total consumed and produced power. First, clustering was performed on five states and then on nine states, which is shown in
Figure 20a and
Figure 20b, respectively.
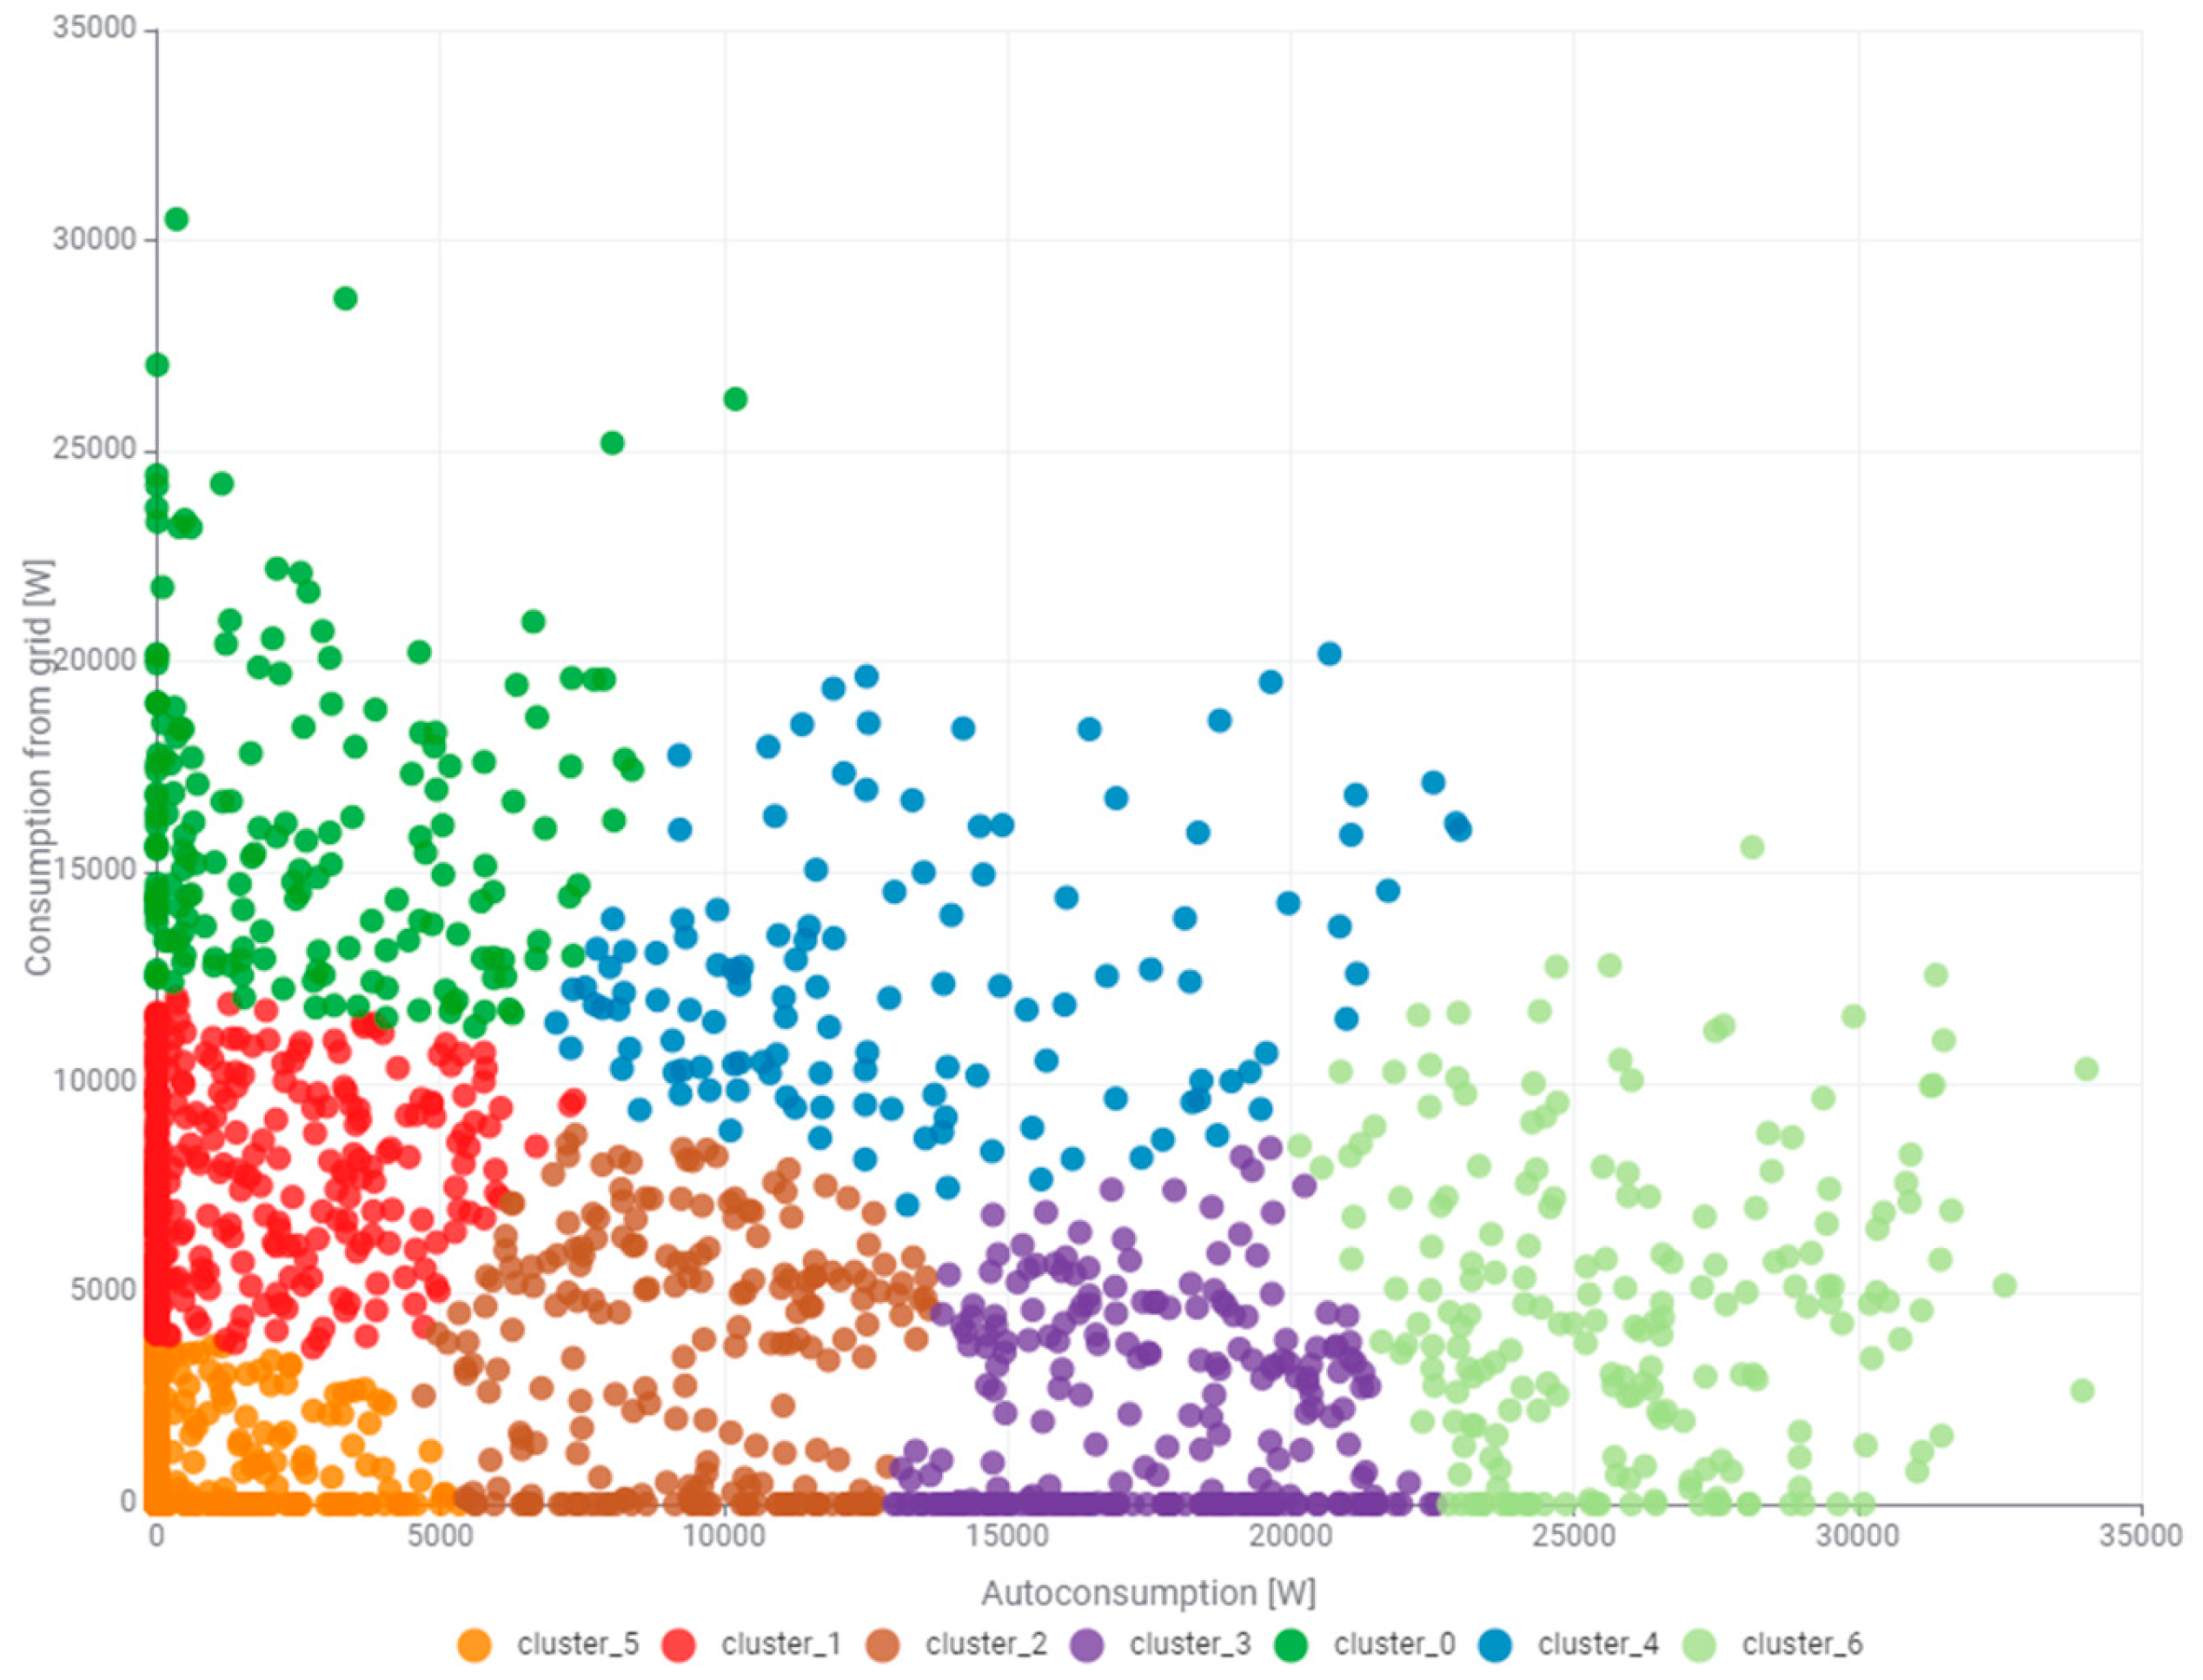
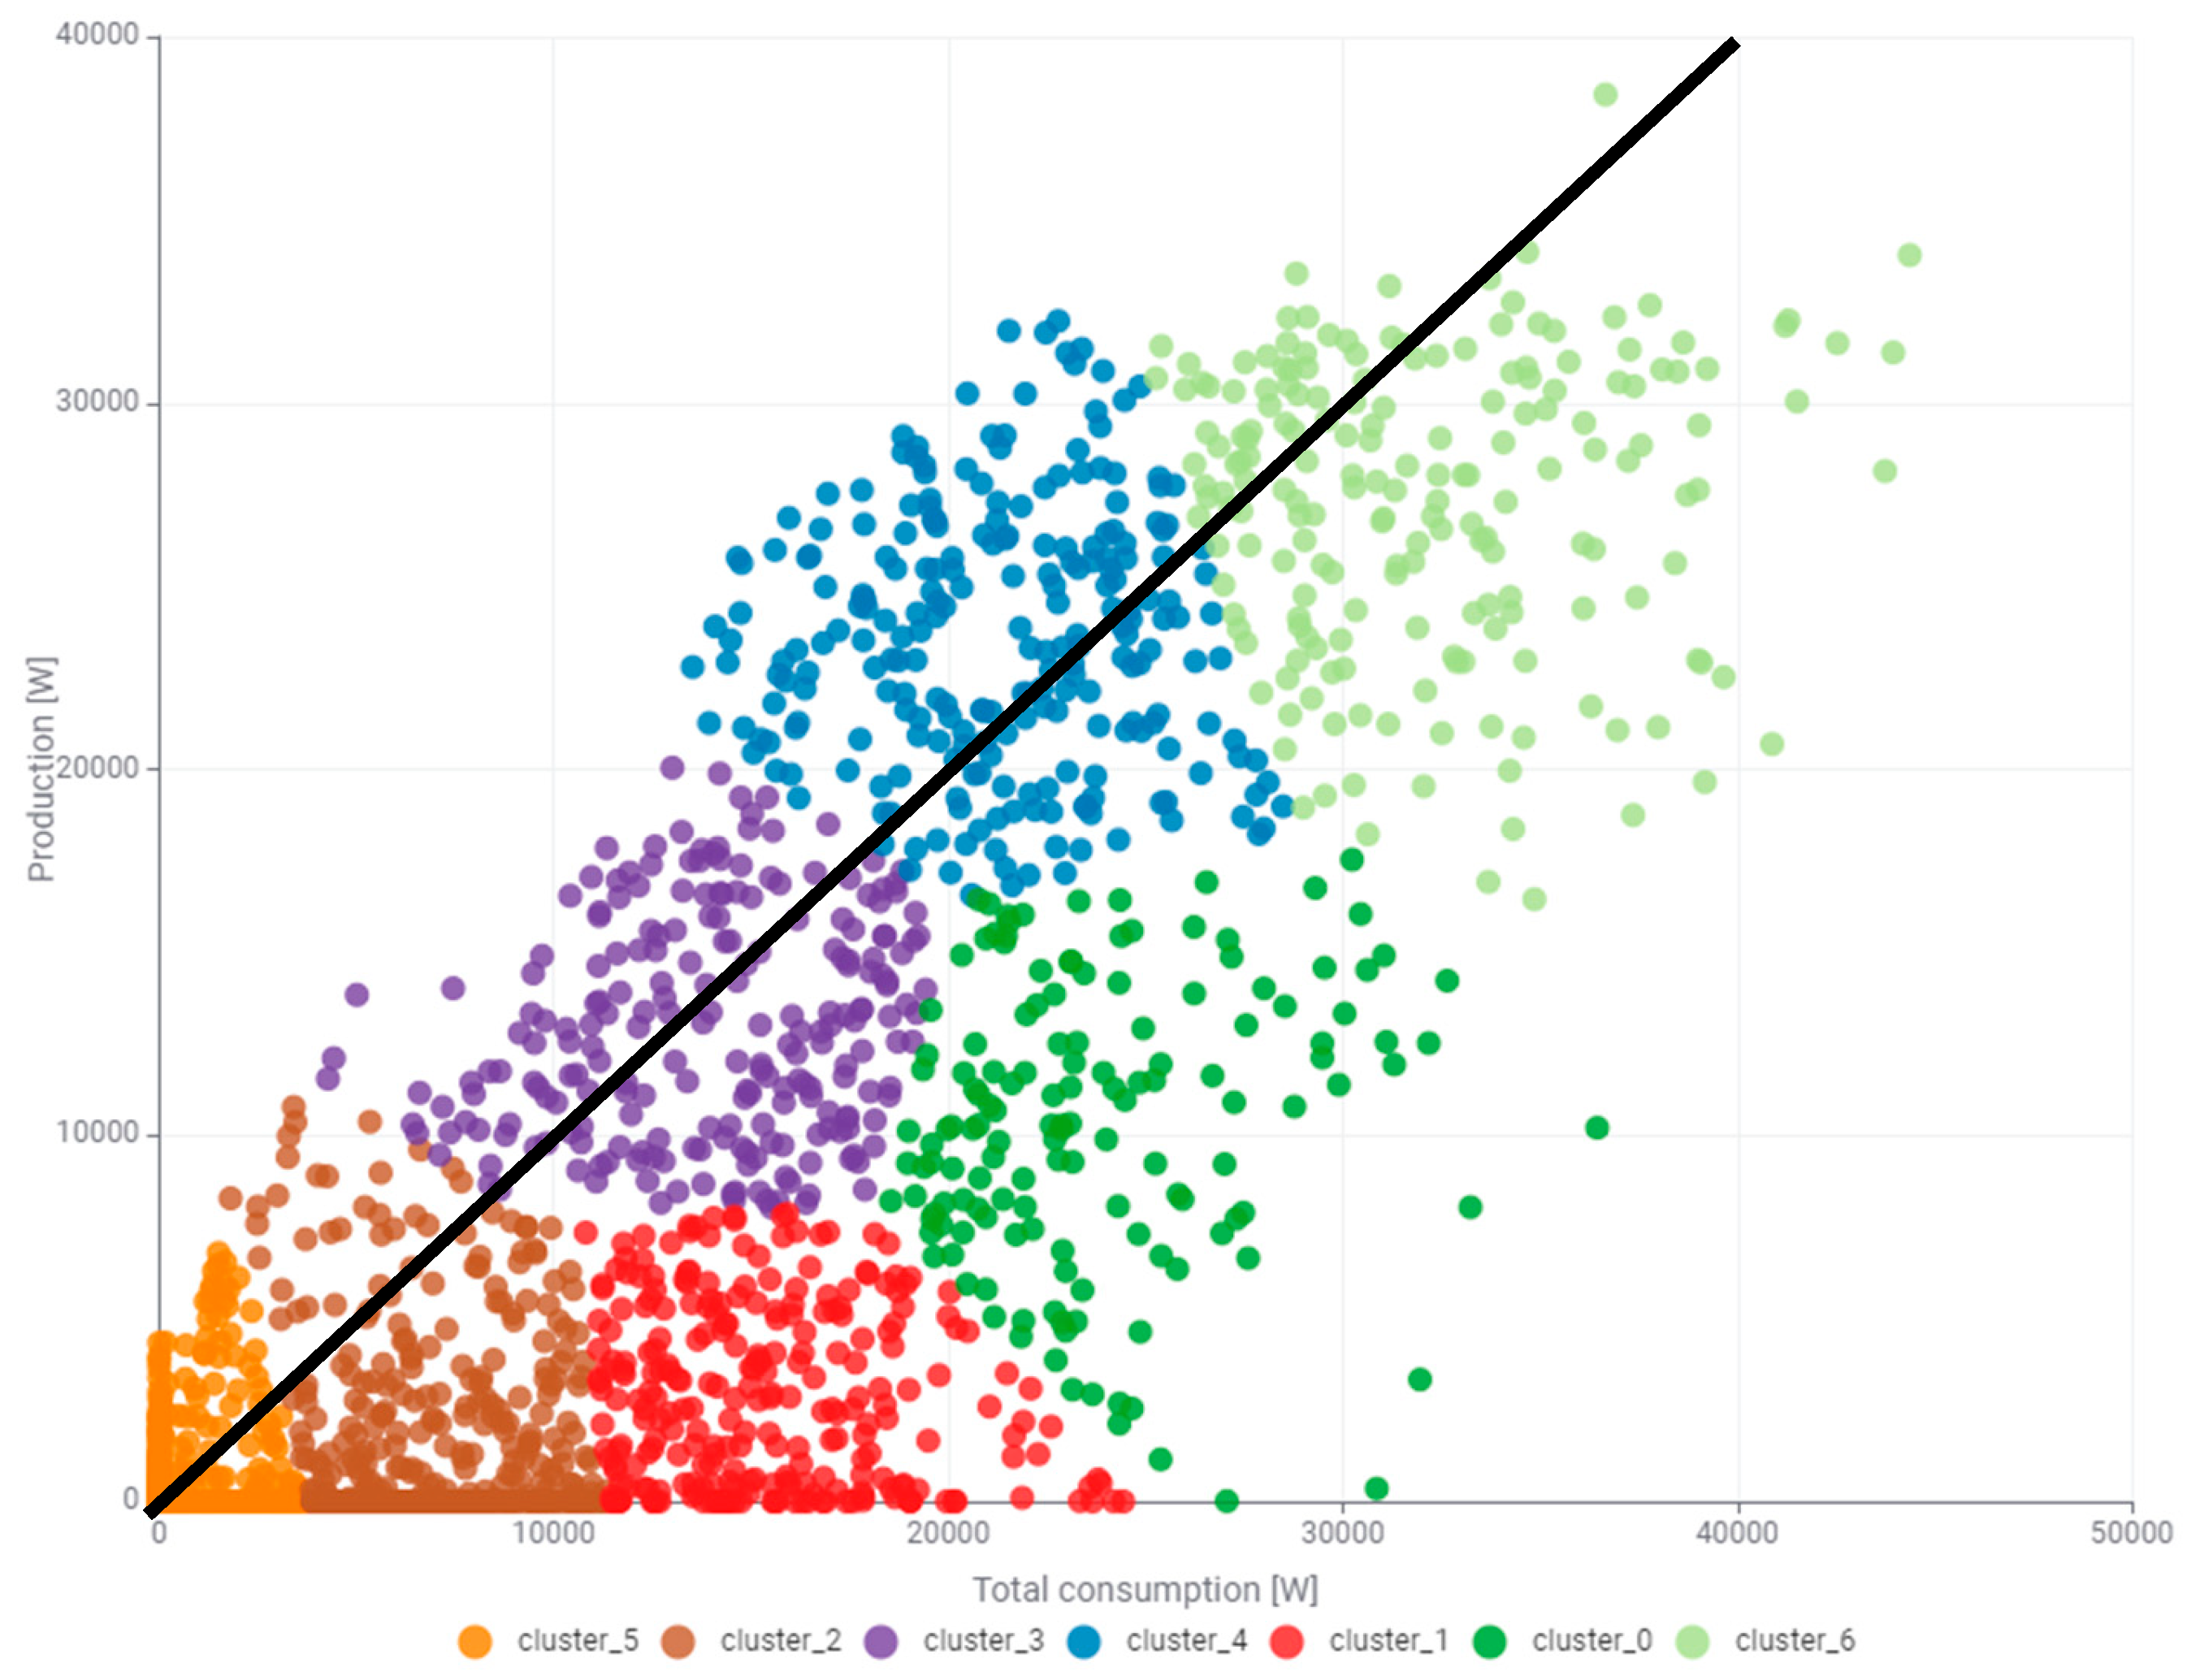
Also, in this case, clustering with division into five clusters turned out to be insufficient, and in the case of nine clusters, excessive. The optimal number of clusters was again set at seven and its results are shown in
Figure 21.
A certain linear relationship with some deviations can be observed between the analyzed generated and consumed powers. However, the authors deliberately did not perform a detailed analysis of the correlation between the analyzed power series. Even without referring to the cluster analysis, it is clearly visible that the demand for building power is greater than the power produced. To facilitate the analysis, the authors introduce an additional line in
Figure 21 corresponding to the ideal linear correlation y = x. All points located on the black line correspond to the coverage of the total power consumed by the power currently produced. All points below the black line correspond to the conditions of a smaller or larger deficiency of power produced from RESs and the need to draw power from the power grid. All points located above the black line mean that the photovoltaic system covers the demand for the total consumed power, including the surplus that was transferred to the power grid. It should be acknowledged and thoroughly examined that some clusters are entirely located under the black line and some are divided by it. The clusters located entirely under the line include only cluster_1 (red) and cluster_0 (green). Cluster_2 (brown) and cluster_6 (light green) are located for the most part below the line. Clusters divided by the line approximately in half include cluster_5 (orange) and cluster_3 (purple). Cluster_4 (blue) is the only one located for the most part on the black line. The black line of perfect correlation is also added to the graph in
Figure 20b. This experience shows that dividing the state space into a larger number of clusters leads to the extraction of a larger number of clusters located completely below and above the line. Nevertheless, the authors will adhere to the division into seven clusters that is considered as optimal.
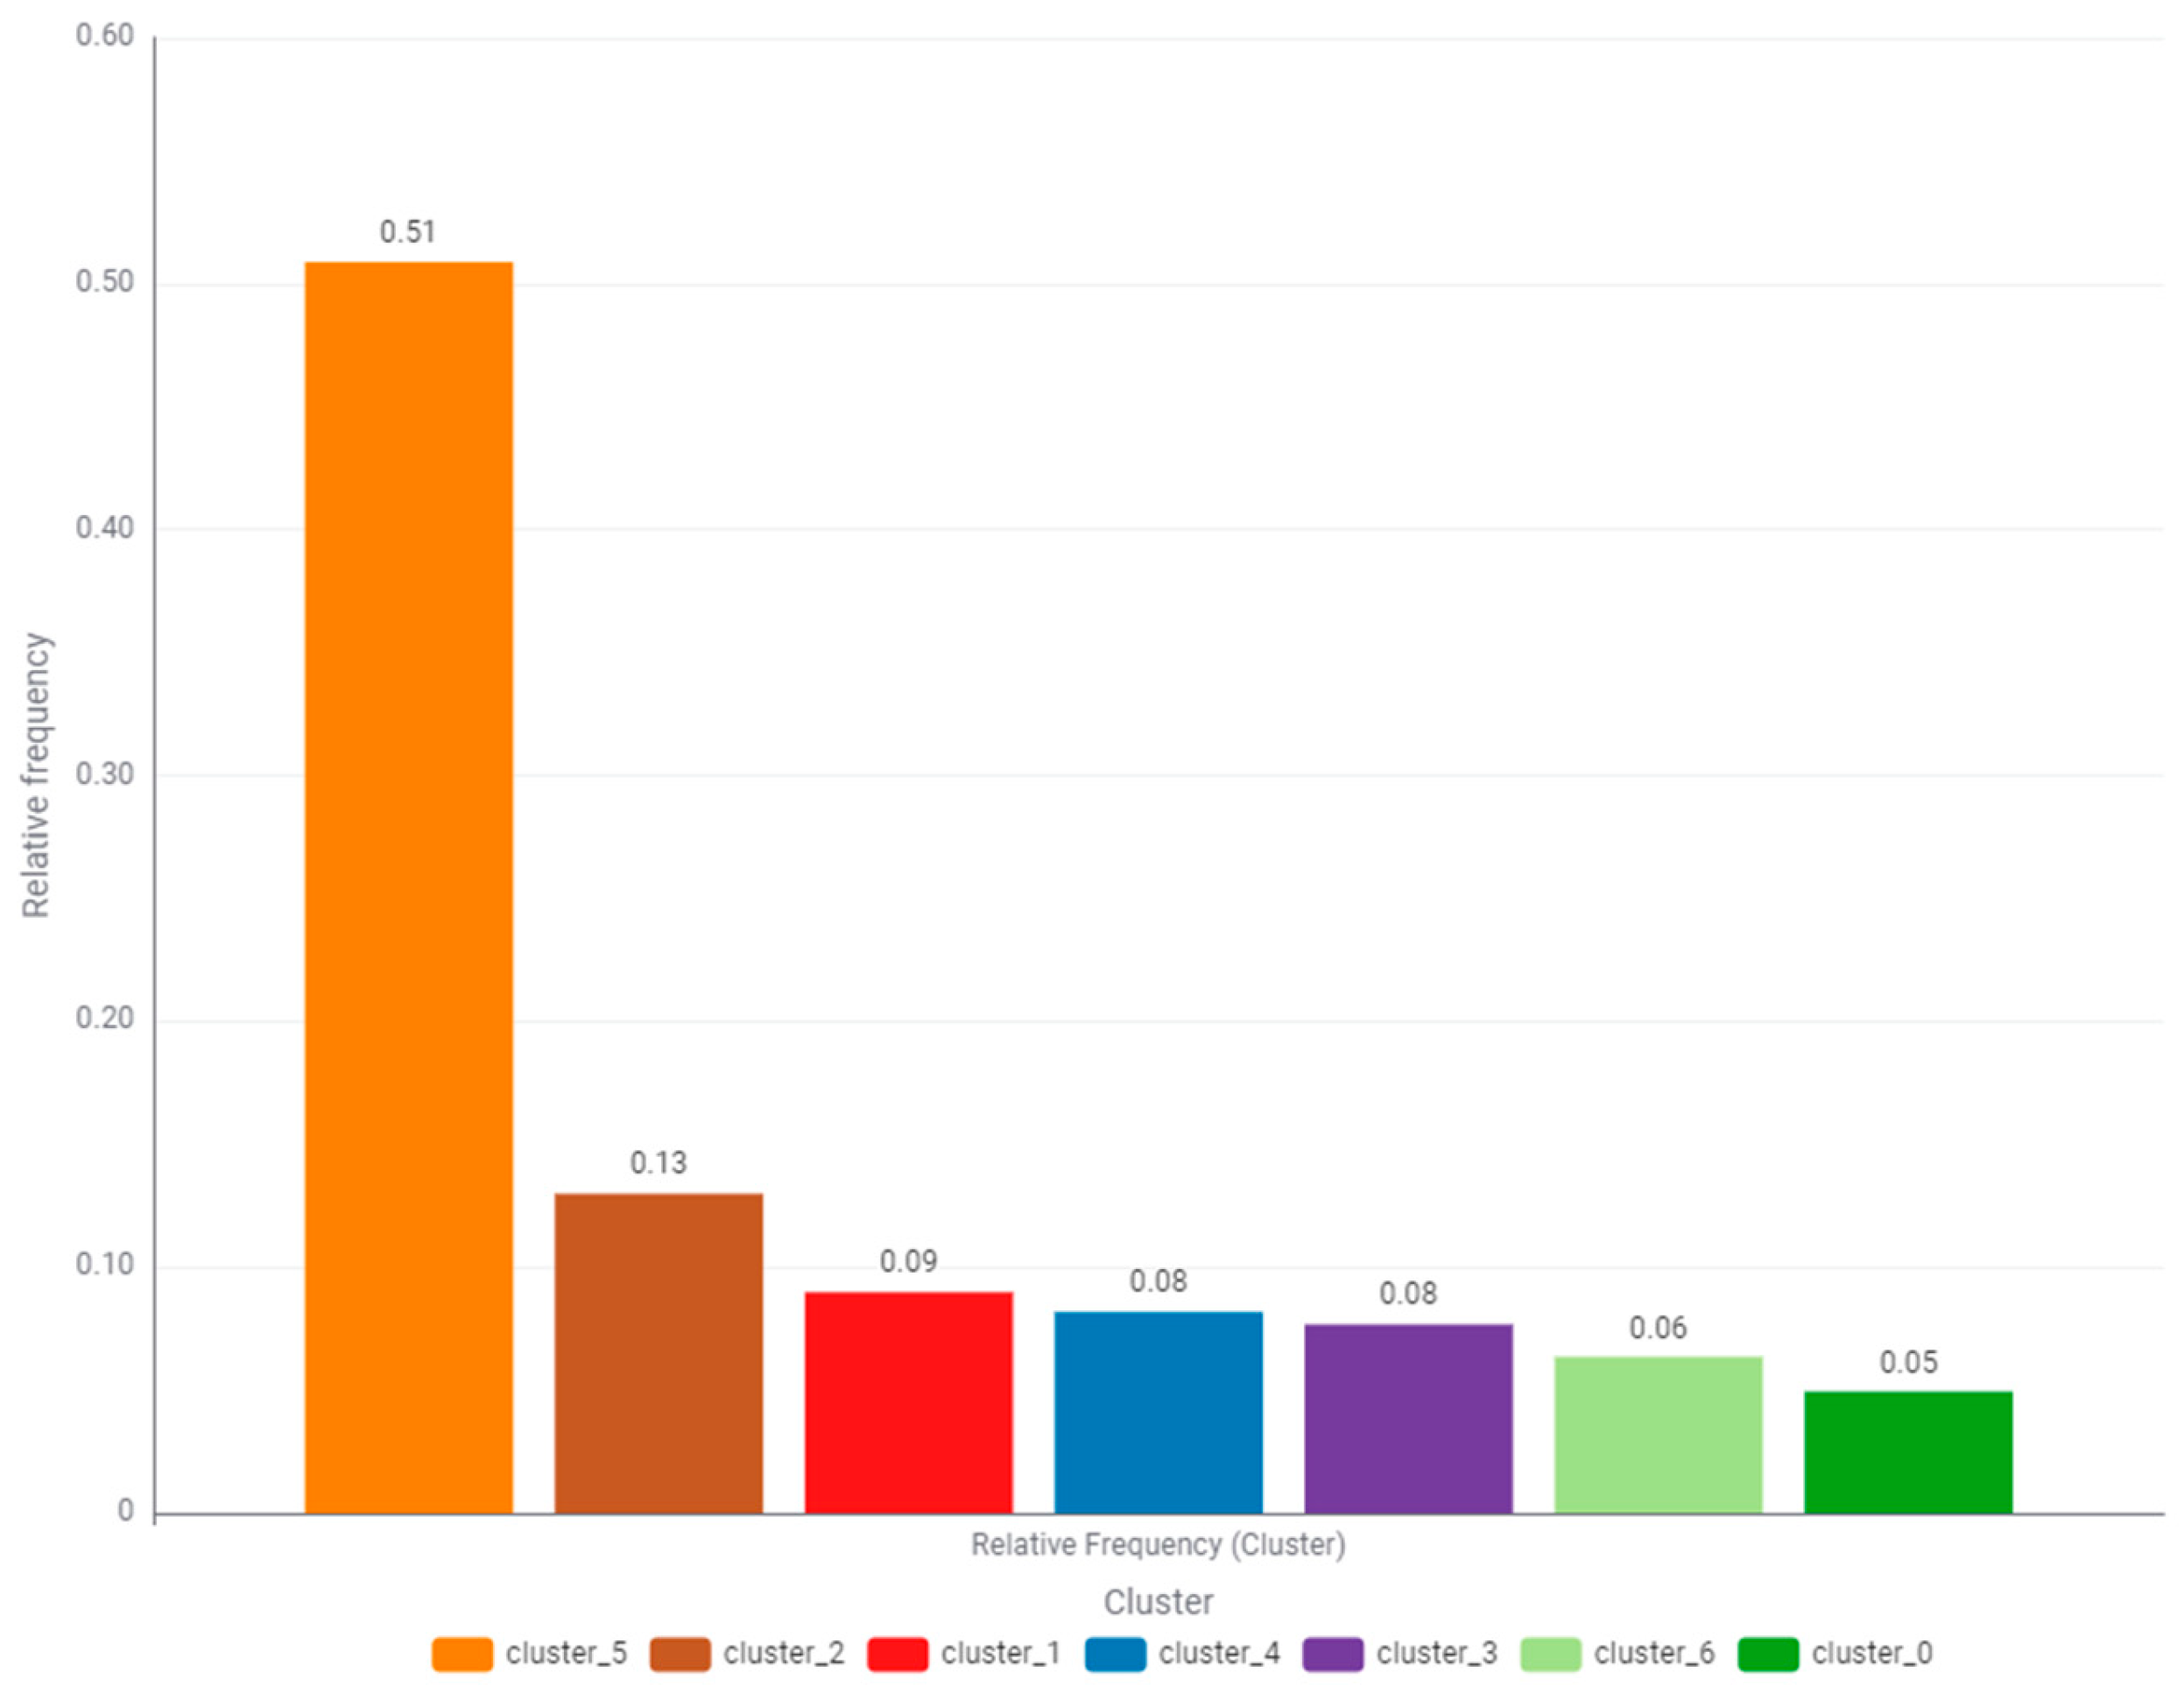
The highest relative frequency of occurrence is characterized by cluster_5 (orange), and it is 51%, which can be seen in the graph in
Figure 22. The cluster boundaries do not exceed 3000 W on the side of total consumed power and 8000 W on the side of produced power. The second most frequent is cluster_2 (brown) and it is 13%. In this cluster, the boundaries are perpendicular to both axes and slightly exceed the values of 10,000 W. The authors posit that both of these clusters can be completely eliminated by using a small energy storage system with an energy capacity of 20 kWh. The third most frequent category is cluster_1 (red), and it is 9%. It is imperative to note that the whole cluster is under the black line. There is also cluster_0 (green) under the black line with a frequency of occurrence of 5%. In the case of these last two clusters, the need to draw less or more power from the power grid is obligatory. Also, cluster_6 (light green) requires substantial amounts of power from the power grid with a frequency of 6%. A significantly larger part of this cluster is located under the black line. Only cluster_3 (purple), cluster_4 (blue), and the aforementioned cluster_2 (brown) are partially responsible for generating surplus power. The amounts of generated surplus power are not able to cover the total power demand of the building in every case.
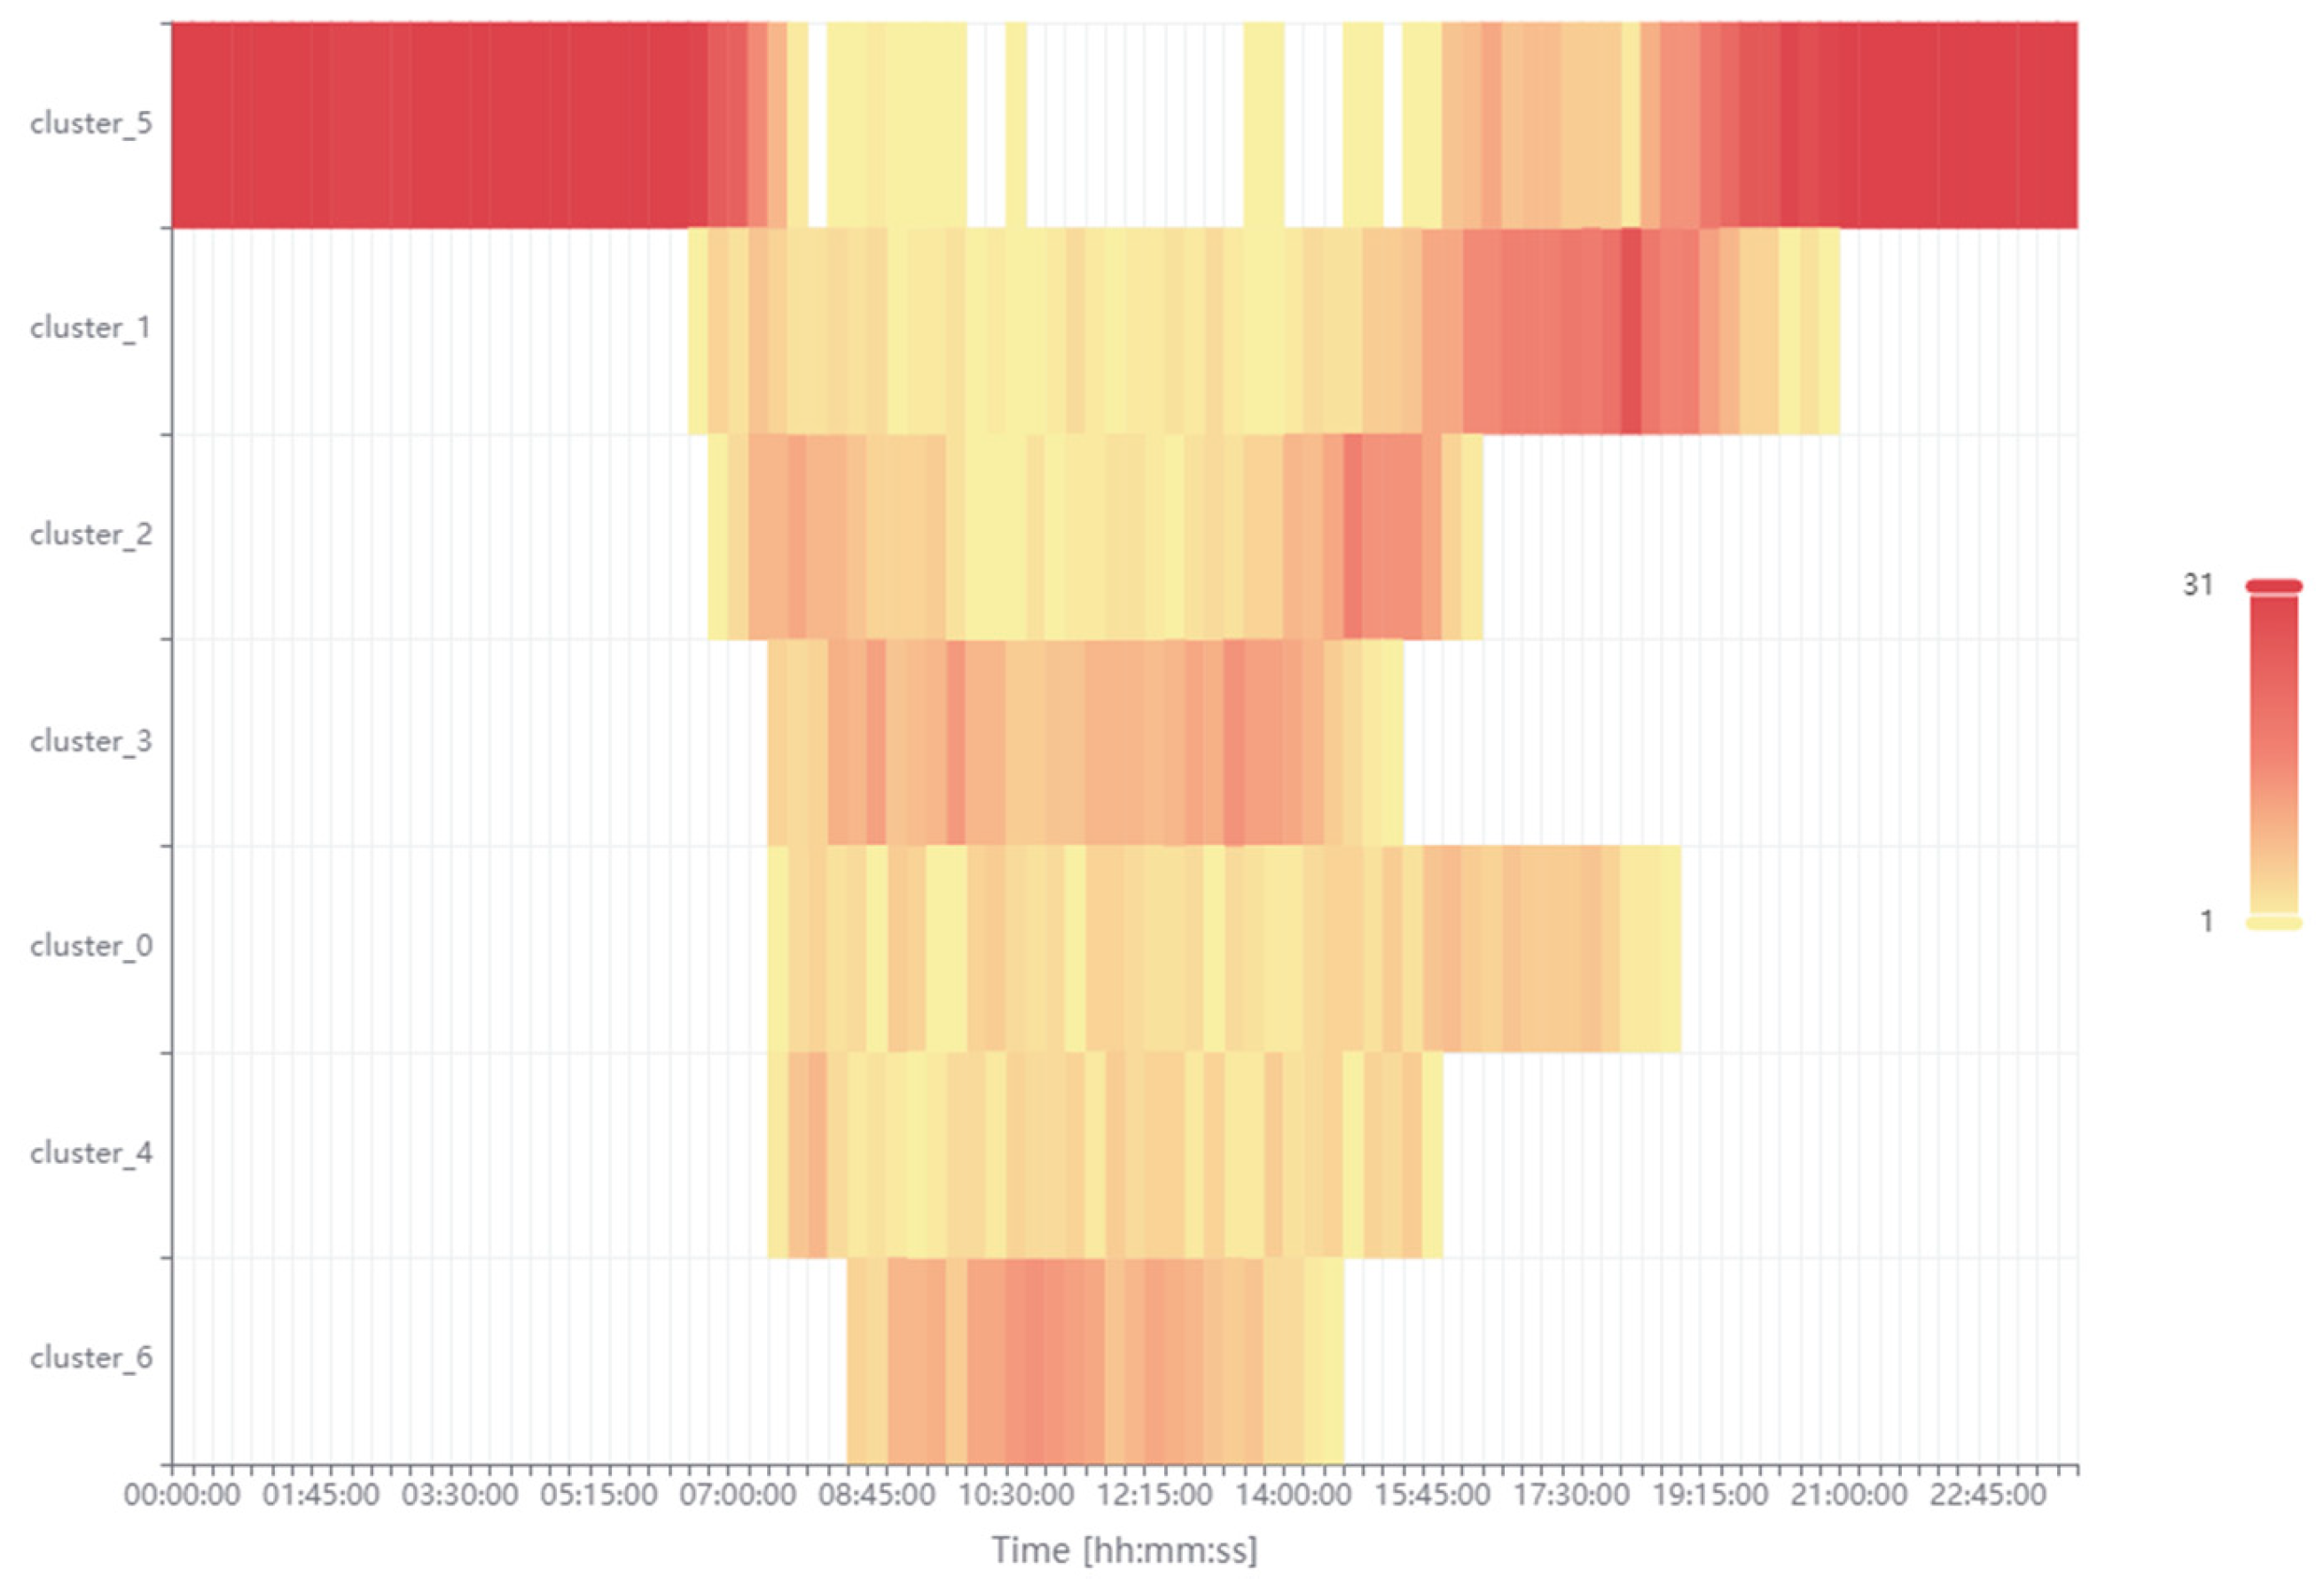
A substantial amount of information regarding the total power demand and the power generated by the photovoltaic system will be provided by displaying the effects of the unsupervised clustering in 15 min time intervals on a daily basis, which are shown in
Figure 23. Cluster_5 (orange) occurs almost exclusively at night and very sporadically during the day. According to the authors, its impact on system balancing is small. Cluster_2 (brown) manifests some features indicative of self-balancing mechanisms. There is a small surplus in the morning hours and a small demand for the power consumption from the power grid in the afternoon and evening hours. However, examining the symmetry of the power distribution in relation to the black line in
Figure 21, cluster_2 (brown) cannot be fully self-balancing. It requires the surplus power generated during the day, which can be provided by cluster_3 (purple) and cluster_4 (blue). In particular, most of the latter lie above the black line. Only cluster_6 (light green) has some self-balancing capacity. The stored surplus power can be released the same day for the needs of cluster_6 (light green) or in the evening for the needs of cluster_2 (brown). Cluster_1 (red) and cluster_0 (green) do not have any self-balancing capabilities. They are responsible for the power consumption from the power grid throughout the day.
The cluster analysis presented in this chapter facilitates a swift assessment of the system’s capacity to self-balance its power generation and consumption. The introduced black line of ideal linear correlation allows the symmetry or asymmetry of the power distribution to be determined on the demand and production side. In the analyzed month of March, in Polish geographical and climatic conditions, the 50 kWp photovoltaic system is not able to cover the power demand of the WSEI University administrative building. Cluster analysis allows for the division of the state space into clusters. Then, it is possible to assess the cluster range and the time of its occurrence daily. This information is of paramount importance in the field of balancing systems powered by RESs. The results of unsupervised clustering revealed the balancing deficiencies in the range of small powers up to 10,000 W. They undoubtedly derive from the asymmetric load of the electrical network phases in the university building and the need for a symmetrical power supply of these phases by a photovoltaic inverter. The authors propose the use of an energy storage system with an energy capacity of up to 20 kWh, which will be able to compensate for these losses. To accumulate the surplus power generated in the medium (from 10,000 to 25,000 W) and large (from 25,000 to 40,000 W) power ranges, an energy storage system with an energy capacity of approximately 100 kWh is required. Then, it can be expected that the entire power produced by the photovoltaic system will be employed for self-consumption. In this article, the authors subjected only one of the spring months—March—to cluster analysis. It is characterized by the amount of the average energy production throughout the year. An identical analysis will be necessary for the sunnier months and those characterized by longer days. Clustering carried out according to the presented algorithm in May (the highest monthly energy production) and in June (the longest day) will allow the symmetry in the distribution of the consumed and produced power to be determined.
4. Discussion
In this section, the obtained research results will be discussed. First, the advantages and disadvantages of the used research method in the form of unsupervised clustering will be presented in relation to other competitive research methods. In the further part of the discussion, the authors will explain how the generated power signatures take into account the geographical context related to the geographical location of the photovoltaic system and the university building using the energy produced by it. This is an important part of the discussion that allows drawing conclusions regarding the universality of the method’s application worldwide. The next part of the discussion is devoted to the possibility of using unsupervised clustering to create RES signatures with different power levels. The last area of discussion is the use of the obtained research results for training artificial intelligence algorithms.
Determining the signatures of power generated and consumed by the photovoltaic system using unsupervised clustering has its advantages and disadvantages compared to other research methods. The Metalog family of probability distributions allows the probability of generating individual levels of power generated and consumed in designated time periods to be calculated [
7]. Clustering does not have this possibility. The signatures of power generated by the photovoltaic system and their presentation in the form of heatmaps allow the identification of time periods characterized by the overproduction of power and periods of its deficit, when power must be drawn from the power grid or energy storage systems. However, clustering does not allow the calculation of the size of the required energy storage [
27]. Analysis of the monthly average hourly power allows the size of the energy storage to be determined. All presented methods allow important information to be obtained about the process of generated and consumed power. They can be used simultaneously or interchangeably, depending on the needs. Markov models can be used in the analysis of energy produced from renewable sources (RESs) in many aspects, such as forecasting, optimization, and reliability analysis. Neural networks are also increasingly used to forecast energy production from photovoltaic installations due to their ability to model complex and nonlinear relationships. Thanks to historical data, such as solar radiation, temperature, and meteorological data, these networks can accurately predict future energy production. Models based on neural networks learn from patterns and can adapt to changing weather conditions. Compared to traditional statistical methods, they offer higher forecast accuracy. However, clustering has a significant advantage over all the methods presented. The clustering used by the authors transforms the problem from numerical variables to categorical variables. Clusters represent categories. Categorical reasoning is necessary for the classification of discrete states. Analytical models are based on continuous variables, the domain of which is numbers. Discrete models represent categorical states of the process. The linguistic interpretation of the model is based on such conceptual categories. Therefore, according to the authors, clustering will play a very important role in the future in the interpretation of the results of processing various measurement data (not only energy data) by artificial intelligence algorithms. Clustering will make it possible to give physical meaning to the obtained results and make it possible to use them in business intelligence.
Geographic context must be considered when analyzing the performance of photovoltaic systems. Geographic context is a broader concept than the geographic location of the photovoltaic system (longitude and latitude). The power signatures generated by the photovoltaic system also include local weather conditions (such as wind speed and cloud cover), which affect the amount of energy produced. The power signatures also include the engineering context related to the construction of the photovoltaic system itself. The tilt angle of the panels, their azimuth, and the location of the installation on the roof, ground, or carport significantly affect the performance of the photovoltaic system. Geographic context also includes the occurrence of shading by nearby buildings, trees, or mountains. The power signatures consumed by residential or administrative buildings also include geographic context. Specific places on earth are inhabited by people at different levels of economic development, which determines the type of electrical receivers they use. The level of access to selected goods in the form of drinking water and electricity defines human behavior related to their saving or wasting. Therefore, determining the signatures of power generated by a photovoltaic system with a peak power of 50 kWp and the signatures of the consumed power of an academic administrative building will have completely different results for locations in a selected place in Poland, Canada, Egypt, and Malaysia [
46]. Determining signatures on both the generated and consumed power side allows for comparison of the obtained results. The frequency of occurrence of individual states (clusters) allows for a quick comparison of the obtained results. Also, the location of individual states of the process in specific daily periods (time of day or night or specific hourly intervals) allows for categorization of the tested power measurements and interpretation of their nature. Unsupervised clustering is therefore a very good research technique for the initial analysis of unknown measurement data and for comparing measurement data from different defined contexts.
The unsupervised clustering method used by the authors is universal and can be applied for various maximum powers generated by RESs, starting from a few kWp and ending with large farms with a capacity of tens of MWp. In previous articles, the authors clustered the power generated by a photovoltaic system with a capacity of 3.45 MWp and a wind turbine with a maximum capacity of 3.45 MW [
29]. Therefore, clustering can be used to determine signatures generated by a mix of different RESs. On the power consumption side, there can also be various types of residential buildings or production systems, for example low-emission hydrogen. Unsupervised clustering allows for determining the desired signatures in two- or multidimensional space. Very often, it allows for the detection of new dependencies and structures in clustered measurement data.
The research conducted by the authors allowed for the categorization of the acquired measurement data. In the expert validation process, these categories were named due to their physical meaning. The results of unsupervised clustering obtained and named in this way can be a valuable source of knowledge for training artificial intelligence algorithms, especially in the context of data preparation and creating labels for supervised tasks. Clustering, which involves grouping data based on their similarity without previous labels, can reveal natural structures and dependencies in the data set. Such groups can then be treated as pseudo-labels, which allows for training classifiers in the absence of human-labeled data. For example, in the analysis of generated and consumed power, clustering allows for the extraction of semantically coherent groups that can be used for the initial training of neural networks. In addition, the obtained clustering results can be used to reduce the dimensionality of data, their selection, and the identification of anomalies, which translates into obtaining more effective and accurate artificial intelligence models. This type of approach is particularly useful in areas where obtaining manually marked data is expensive or time-consuming, such as in medicine, astronomy, or energy. The discussion should be concluded by stating that the research initiated in the area of clustering power generated by the photovoltaic system and consumed by the administrative building will certainly be continued. One of the directions is their practical use in energy management in modern buildings, supporting the work of people involved in it, and the second direction is training artificial intelligence algorithms used in Advance Process Control in the area of energy taking place without human participation.
5. Conclusions
The authors presented a practical algorithm for determining the power signatures generated by the photovoltaic system and consumed by the university’s administrative building using real measurement data. First, the measurement data were examined with the naked eye to review them and perform a preliminary characterization of both the photovoltaic system itself and the building to which it supplies electricity. The authors advocate for statistical and probabilistic analyses; therefore, these methods were applied for a more in-depth analysis of the generated and consumed power.
Next, unsupervised clustering was adopted to determine the power signatures on the side of the power production and consumption. First, unsupervised clustering of the state space of the power generated by the photovoltaic system was performed, divided into self-consumption power and the surplus transferred to the power grid. This allowed for the quantitative determination of the states of the process of generating the power from RESs in individual clusters. This analysis allowed for the quantitative determination of the frequency of occurrence of individual clusters and their location in 15 min time intervals daily. The authors consider the introduction of the analyses of the occurrence of power surpluses in relation to the self-consumption power and not in relation to the power produced by the photovoltaic system to be a great achievement.
Finally, unsupervised clustering of the state space of the total power consumed in relation to the power produced by the photovoltaic system was presented. In the analyzed month of March, in Polish geographical and climatic conditions, a 50 kWp photovoltaic system is not able to cover the power demand of the WSEI University administrative building. The results of unsupervised clustering revealed balancing deficiencies in the range of small powers up to 10,000 W. They result from the asymmetric load of the electrical network phases in the university building and the need for a symmetrical power supply of these phases by the photovoltaic inverter. The authors propose the use of an energy storage system with an energy capacity of up to 20 kWh, which will be able to compensate for these losses. To accumulate surplus power generated in the ranges of medium (from 10,000 to 25,000 W) and large (from 25,000 to 40,000 W) power, an energy storage system with an energy capacity of approximately 100 kWh is required. Then, it can be expected that the entire power produced by the photovoltaic system will be used for self-consumption. In this article, the authors subjected only one of the spring months—March—to cluster analysis. It is characterized by average energy production throughout the year. An identical analysis will be necessary for the sunnier months and those characterized by longer days. The implementation of clustering, in accordance with the previously outlined algorithm, during the months of May and June, when the maximum monthly energy production is achieved and the duration of daylight is at its longest, will facilitate the assessment of the symmetry in the distribution of consumed and produced power.
The research that has been started in the area of clustering power generated by the photovoltaic system and consumed by the administrative building will certainly be continued. One of the directions is their practical use in energy management in modern buildings, supporting the work of people involved in it, and the second direction is training artificial intelligence algorithms used in Advance Process Control in the area of energy taking place without human participation.
In the future, the authors intend to continue the research they have started. Clustering in multidimensional state space with detailed analysis of state and transition diagrams is very promising. The authors also consider how to use clustering to effectively balance energy production systems with RESs and the production of low-emission hydrogen. A major challenge in this area is also determining the size of the energy storage system.


